creating effective global virtual teams: a transactive memory
TRANSCRIPT

CREATING EFFECTIVE GLOBAL VIRTUAL TEAMS: A TRANSACTIVE MEMORY PERSPECTIVE
by
Joy O. Oguntebi
A dissertation submitted in partial fulfillment of the requirements for the degree of
Doctor of Philosophy (Industrial and Operations Engineering)
in The University of Michigan 2009
Doctoral Committee:
Professor Jeffrey K. Liker, Chair Professor Thomas A. Finholt Associate Professor Nadine B. Sarter Associate Professor Lynn P. Wooten
Joy O. Oguntebi
All Rights Reserved.
© 2009

ii
To my parents:
You have instilled persistence and perseverance in me and inspired me to believe that
with the grace of God, “the sky is my limit.”

iii
Acknowledgements
I would like to thankfully acknowledge Dr. Jeffrey K. Liker for his role in guiding
me through the dissertation process and for his consistent support over the years. I am
sincerely grateful to him for his willingness to serve as my dissertation chair. I would
also like to acknowledge Dr. Sebastian K. Fixson for realizing the potential in this
research project and Dr. Nadine B. Sarter for the significant contributions that she
provided in the development of this research. I am grateful for the service of my
dissertation committee members and their guidance in my professional development. I
would like to express my sincere appreciation to the industry representatives, course
participants, and undergraduate researchers who contributed to this study.
My numerous mentors from near and far have been a constant source of advice
and encouragement throughout this process, for which I am thankful. I would also like to
acknowledge my colleagues at the University of Michigan and my friends from all over
who constantly supported me, especially during trying times.
I am sincerely grateful to my family for their endless love, support,
encouragement, and prayers. To my parents, Zacchaeus and Rachel Oguntebi: you have
continuously motivated and inspired me to achieve. Thank you. To Blessing, Tayo,

iv
Grace, and James: I really cannot ask for better siblings. Thank you for being my rocks
and for keeping me grounded.
Finally, I thank my God from whom all blessings flow. I have truly been blessed
throughout this process and looking back, I can say with confidence and certainty that
You were my ultimate Source of strength.

v
Table of Contents
Dedication .......................................................................................................................... ii
Acknowledgements .......................................................................................................... iii
List of Figures .................................................................................................................. vii
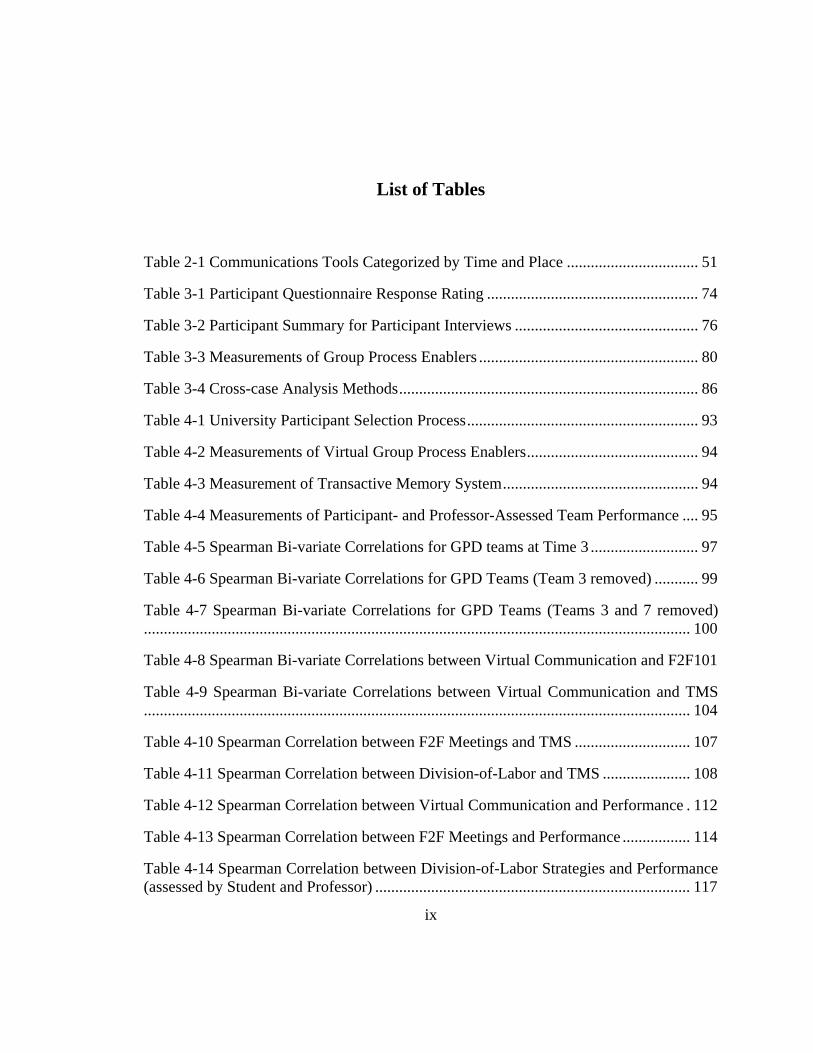
List of Tables .................................................................................................................... ix
List of Appendices ............................................................................................................ xi
Chapter 1 Introduction..................................................................................................... 1
1.1 The Problem: Globalization and the need for Teamwork .................................... 1
1.2 Solution: Transactive Memory System (TMS) .................................................... 3
1.3 Problem Statement and Research Questions ........................................................ 9
1.4 Organization of Document ................................................................................. 14
Chapter 2 Literature Review ......................................................................................... 15
2.1 Transactive Memory – Research Findings ......................................................... 15
2.2 Virtual Environment and Teamwork .................................................................. 31
2.3 Effective Work Teams ....................................................................................... 41
2.4 Enablers of Effective Group Processes in a Virtual Team Context ................... 48
2.5 Conceptual Framework and Summary ............................................................... 62
Chapter 3 Research Methodology ................................................................................. 65
3.1 Research Questions and Revised Research Model ............................................ 66
3.2 Research Approach ............................................................................................ 67
3.3 Setting and Sample ............................................................................................. 68
3.4 Data Collection ................................................................................................... 71

vi
3.5 Measurement ...................................................................................................... 78
3.6 Data Analysis ..................................................................................................... 84
3.7 Limitations and Challenges ................................................................................ 87
3.8 Summary ............................................................................................................ 90
Chapter 4 Comparative Case Studies: Quantitative Analysis ................................... 91
4.1 Problem Statement ............................................................................................. 91
4.2 Results ................................................................................................................ 95
4.3 Discussion and Implications............................................................................. 123
4.4 Summary .......................................................................................................... 127
Chapter 5 Comparative Case Studies: Qualitative Analysis .................................... 128
5.1 Team Performance Evaluation ......................................................................... 128
5.2 Overview of Strategies and Performance for Strong and Weak Teams ........... 130
5.3 Effectiveness of Virtual Group Process Enablers: Strong and Weak Teams .. 135
5.4 TMS Emergence ............................................................................................... 161
5.5 Outlier Cases .................................................................................................... 169
5.6 Discussion and Implications............................................................................. 171
Chapter 6 Virtual Teams in an Industrial Context: Case Examples ....................... 179
6.1 Industry Case Contexts & Description ............................................................. 180
6.2 Company A: Global Product Development Approach and TMS ..................... 184
6.3 Company B: Global Product Development Approach and TMS ..................... 197
6.4 Summary Observations from Global PD Exemplars ....................................... 210
Chapter 7 Conclusion ................................................................................................... 215
7.1 Summary and Implications ............................................................................... 215
7.2 Limitations ....................................................................................................... 223
7.3 Recommendations for Future Research ........................................................... 224
Appendices ..................................................................................................................... 226
References ...................................................................................................................... 258

vii
List of Figures
Figure 1-1: Intersection of Knowledge Management Outcomes and TMS ........................ 5
Figure 1-2: Research Questions ........................................................................................ 13
Figure 2-1 Conceptual Model - Knowledge Management ............................................... 19
Figure 2-2: Knowledge Management and Organizational Learning ................................ 20
Figure 2-3 Virtualness Continuum.................................................................................... 36
Figure 2-4 Effective Group Processes Model ................................................................... 43
Figure 2-5 Conceptual Framework ................................................................................... 63
Figure 3-1 Research Model ............................................................................................... 67
Figure 3-2 Team Ratings for TMS Characteristics ........................................................... 83
Figure 4-1 Research Model ............................................................................................... 92
Figure 4-2 Time 3 Scatter Plot Graph for GPD Teams .................................................... 98
Figure 4-3 Time 3 Scatter Plot Graphs for Communication Effectiveness Enablers ..... 103
Figure 4-4 Scatter Plot Relationships between Virtual Communication and TMS ........ 106
Figure 4-5 Scatter Plot Relationships between F2F Meetings and TMS ........................ 107
Figure 4-6 Scatter Plot Relationships between Division-of-Labor Strategies and TMS 109
Figure 4-7 Scatter Plot Relationships between Virtual Communication and Student-Assessed Performance (at Time 1, 2, 3) ......................................................................... 113
Figure 4-8 Scatter Plot Relationships between Virtual Communication and Professor-Assessed Performance (at Time 1, 2, 3) ......................................................................... 113
Figure 4-9 Scatter Plot Relationships between F2F Meetings and Student-Assessed Performance .................................................................................................................... 115

viii
Figure 4-10 Scatter Plot Relationships between F2F Meetings and Professor-Assessed Performance .................................................................................................................... 116
Figure 4-11 Scatter Plot Relationships between Division-of-Labor Strategies and Student Performance .................................................................................................................... 119
Figure 4-12 Scatter Plot Relationships between Division-of-Labor Strategies and Professor Performance .................................................................................................... 119
Figure 4-13 Scatter Plot Relationships between TMS and Student-Assessed Performance......................................................................................................................................... 122
Figure 4-14 Scatter Plot Relationships between TMS and Professor-Assessed Performance .................................................................................................................... 122
Figure 5-1 Revised Theoretical Model ........................................................................... 177
Figure 6-1 Revised Theoretical Model (same as Figure 5-1) ......................................... 189
Figure 6-2 Revised Theoretical Model (Industry Cases) ................................................ 211
ix
List of Tables
Table 2-1 Communications Tools Categorized by Time and Place ................................. 51
Table 3-1 Participant Questionnaire Response Rating ..................................................... 74
Table 3-2 Participant Summary for Participant Interviews .............................................. 76
Table 3-3 Measurements of Group Process Enablers ....................................................... 80
Table 3-4 Cross-case Analysis Methods ........................................................................... 86
Table 4-1 University Participant Selection Process .......................................................... 93
Table 4-2 Measurements of Virtual Group Process Enablers ........................................... 94
Table 4-3 Measurement of Transactive Memory System ................................................. 94
Table 4-4 Measurements of Participant- and Professor-Assessed Team Performance .... 95
Table 4-5 Spearman Bi-variate Correlations for GPD teams at Time 3 ........................... 97
Table 4-6 Spearman Bi-variate Correlations for GPD Teams (Team 3 removed) ........... 99
Table 4-7 Spearman Bi-variate Correlations for GPD Teams (Teams 3 and 7 removed)......................................................................................................................................... 100
Table 4-8 Spearman Bi-variate Correlations between Virtual Communication and F2F101
Table 4-9 Spearman Bi-variate Correlations between Virtual Communication and TMS......................................................................................................................................... 104
Table 4-10 Spearman Correlation between F2F Meetings and TMS ............................. 107
Table 4-11 Spearman Correlation between Division-of-Labor and TMS ...................... 108
Table 4-12 Spearman Correlation between Virtual Communication and Performance . 112
Table 4-13 Spearman Correlation between F2F Meetings and Performance ................. 114
Table 4-14 Spearman Correlation between Division-of-Labor Strategies and Performance (assessed by Student and Professor) ............................................................................... 117

x
Table 4-15 Spearman Correlation between Division-of-Labor Strategies and Performance......................................................................................................................................... 120
Table 5-1 Team Project Description ............................................................................... 131
Table 5-2 Variations in Task Interdependence Approach .............................................. 151
Table 5-3 Self-reported Team TMS Ratings (5.0 Likert Scale) ..................................... 162
Table 5-4 TMS Emergence for Strong Teams (5.0 Likert Scale) ................................... 165
Table 5-5 TMS Emergence for Weak Teams (5.0 Likert Scale) .................................... 168
Table 5-6 Outlier Teams Project Description ................................................................. 169

xi
List of Appendices
Appendix A: GPD Team & Participant Breakdown ........................................................227
Appendix B: GPD Participant Questionnaire ..................................................................229
Appendix C: GPD Participant Interview Guidelines .......................................................237
Appendix D: GPD Instructor Interview Guidelines .........................................................242
Appendix E: Consent Form .............................................................................................243
Appendix F: GPD Participant Recruitment Letter ...........................................................246
Appendix G: GPD Case Measurement Summary ............................................................247
Appendix H: Spearman Correlation Charts .....................................................................255

1
Chapter 1
Introduction
1.1 The Problem: Globalization and the need for Teamwork
In today’s society, it has become increasingly necessary for companies to make
goods faster, solve problems faster, and provide better and faster service, all with a
particular emphasis on innovation in product and process. While working on addressing
these goals, industries must systematically manage the constant flow of information
within the organization in an ever changing society. We live in the Age of Information,
where we observe the transition in value of efficiently manufacturing widgets or
producing common goods towards efficiently manipulating and transferring information.
The Internet and continuous technological advancements that facilitate the management
and flow of information are impacting workplace collaborations as well as mechanisms
by which organizations are executing their tasks.
Such technological advancements, as well as industry acquisitions and mergers,
are indications that globalization is not just a passing trend; rather it is a reality of the
present and future society that we live in. To remain competitive, organizations must
keep up with such communication advancements and employ strategies that enable them

2
to optimize the expertise and skills that exist within each organization. To this extent, the
utilization of teams as a mechanism for executing organizational work continues to be a
relevant and research-intensive topic.
Research on work groups/teams and team effectiveness gained prominence in the
1980s and 1990s (Cohen & Bailey, 1997; Guzzo & Dickson, 1996; Hackman, 1987;
Hackman, 1990) and continues to remain a significant and relevant focus. As
collaborative tools have evolved, we observe that virtual collaboration, which enables
geographically dispersed members to work together, is increasingly being utilized.
Concurrently, research on work groups and teams has placed emphasis on virtual teaming
and its implications. The societal advancement towards globalization has resulted in
more virtual collaboration, commonly referred to as global virtual teams. Within such
teams, geographically dispersed members that collaborate on a project are spread out
across the world. Susman & Majchrzak (2003) reported that 88% of surveyed companies
(according to an issue of Computerworld) planned on increasing their use of virtual
collaboration tools in the future, which is evidence of the global society that we live in.
What this means is that organizations must develop successful mechanisms for operating
in this new environment in order to remain competitive.
Applebaum & Blatt (1994) conducted a literature review which revealed that the
utilization of work teams or groups lead to improved efficiency and quality within the
organization. A significant added advantage of global virtual teams is that the team
members’ collaborative efforts are likely to result in enhanced creativity, innovative
ideas, and culturally representative solutions (Zakaria, Amelinckx, & David, 2004).

3
Employing global teams within research and development (R&D) extends the creativity
and innovation of global teams beyond the execution and implementation phases and
applies the novel approaches to the idea formation and task development stages. This
practice can be observed in companies such as Microsoft, Toyota, and Intel, which have
developed self-standing research collaboration centers. Practitioners can better
understand how R&D virtual collaborations can best be utilized from practical
experiences and theoretical explorations of virtual R&D teams. In this study, we explore
the roles that group process enablers play in improving virtual team performance. This
study will contribute to the growing literature on virtual team effectiveness from a
knowledge management and organizational learning perspective.
1.2 Solution: Transactive Memory System (TMS)
Specifically within knowledge management, explorations on knowledge transfer
have gained increasing attention as managers and group members are concerned with
increasing the knowledge accessibility that exists within a group. One particular team
phenomenon that addresses the ability of members of a team to identify knowledge
carriers within the team and communicate this knowledge as necessary is the transactive
memory system (TMS). The TMS construct, initially developed by Wegner, Giuliano, &
Hertel (1985), deals with the encoding, storing, retrieving and communication of
knowledge among members within a team. It is a multidisciplinary sub-area of
knowledge management and organizational learning. Peltokorpi (2008) provides a
4
comprehensive review of the TMS literature as observed in interrelated fields and
highlights relevant concepts and theory extensions.
1.2.1 What is a TMS?
Knowledge management (KM) deals with the retention, creation, and transfer of
information. The transactive memory system embodies such knowledge-related activities
– specifically, retention and transfer - within a team setting (Borgatti & Cross, 2003;
Liang, Moreland, & Argote, 1995). Karl-Erik Sveiby (1997) defines knowledge
management as “the art of creating value from intangible assets.” From a practical
perspective, KM entails identifying and utilizing an organization’s intellectual assets as
well as embedding such knowledge in a repository so that it can continuously be accessed
and applied towards problem solving (Das, 2003). An essential component of the TMS
development process involves developing an awareness of individual expertise (Borgatti
& Cross, 2003) and consequently where relevant information should be retained.
Knowledge management involves the continuous creation of new knowledge,
particularly in an evolving area like R&D (Gittelman & Kogut, 2003; Reagans &
McEvily, 2003). TMS can be viewed as a human knowledge management system. As
groups work together, they get to know who knows what. With a healthy TMS, team
members can find out what they need to know whenever they need it by accessing the
knowledge of other team members with specialized knowledge. TMS can be enhanced
by effective technology use (which is especially important for virtual organizations) as
well as formal or informal dissemination of best practices. Nonaka (1991) identified
knowledge management as a source of competitive advantage; thus TMS as a knowledge

5
management mechanism should help organizations perform at a higher level. Argote,
McEvily, and Reagans (2003b) state that the knowledge management outcomes of
knowledge creation, transfer, and retention interact based on individual, group, and
organizational properties, relationships, and knowledge properties. The figure below
depicts how TMS can be viewed in the context of knowledge management.
Figure 1-1: Intersection of Knowledge Management Outcomes and TMS
Wegner was the first to define transactive memory system in dyads in a 1986
paper. Since then researchers have expanded the view of TMS as a group dynamics
mechanism that develops within the team over time (D. Wegner, 1986). At its essence, it
addresses how well the team is able to access the specialized expertise that resides within
each individual and apply such knowledge to the task at hand. This mechanism is the
formation of a group’s shared understanding of “who knows what,” with each team
member having access to every other member’s knowledge structure. A transactive

6
memory system is established when team members use other team members as memory
storage locations (Faraj & Sproull, 2000). Moreover, the TMS is not a static, binary
mechanism; rather, it is dynamic (Brandon & Hollingshead, 2004) and can transform
over time. In relation to this, team members that possess expertise in specific domains
are responsible for filtering new knowledge that enters the team in that particular domain.
The transactive memory system has been observed to improve group performance
although most of these observations are based on face-to-face settings. Industry
globalization raises the question as to how TMS could develop in dispersed
environments, and consequently improve performance in such settings as well. As the
world is becoming ‘flatter,’ it is essential that the effects of the separation caused by
space, time, and other boundaries are considered and addressed. Research has only
begun on this topic. This study intends to expand on the existing research by exploring
some of the enablers that lead to the emergence of transactive memory systems in virtual
environments.
1.2.2 TMS and Organizational Learning
The transactive memory system is a temporal construct that evolves over time.
Members within a team invest in TMS by continuously updating the shared team mental
model, that is, the collective awareness of the expertise that each individual possesses.
This is especially important because this individual expertise changes. However, what is
most important is whether the knowledge necessary to address a problem exists, whether
team members know who to go to for that knowledge when they need it, and how quickly
the team can access this knowledge. Research suggests that the longer a team works

7
together the stronger the TMS becomes (Lewis, 2004). Over time, members learn the
best way to identify and access knowledge that exists within the team. This progressive
development of a TMS is an important component of organizational learning, which
utilizes prior experiences to improve on organizational functionality.
Organizational learning focuses on the use of prior experiences to determine
future actions (Levitt & March, 1988). Specifically, it focuses on the processes, such as
TMS, that organizations use to improve task execution. Organizations are better able to
continuously improve their knowledge management systems as they evaluate prior
outcomes based on their experiences. As the TMS develops over time, the group
processes that the team exhibits also improves team effectiveness, and consequently
organization performance.
Among many possible enablers for group process effectiveness, the following
factors are of particular interest to this study: communication effectiveness, investment in
group cohesion, and strategies for division-of-labor. The literature suggests that these
factors are especially important in exploring performance effectiveness within face-to-
face and virtual teams (Hackman, 1987; S. L. Jarvenpaa, Knoll, & Leidner, 1998;
Maznevski & Chudoba, 2000). These enablers are explored in detail in the literature
review (Chapter 2) and their potential roles as contributors to TMS are discussed.
1.2.3 TMS and Global Virtual Teams
Global virtual teams are comprised of individuals that are internationally
distributed (Maznevski & Chudoba, 2000) and temporarily assembled (S. L. Jarvenpaa et
al., 1998) to collectively execute a complex task. Virtual teams, created due to

8
competition, acquisitions, and overall globalization, have become the primary operating
units for many organizations. While there have been many studies of the effectiveness of
work groups that meet regularly face-to-face we know little about factors that facilitate or
impede virtual teams. It has become essential to explore knowledge management and
organizational learning within such dispersed teams as researchers and practitioners have
found that KM and OL are vital for impacting organizational performance (Argote,
2005). Thus we are interested in understanding how the existing knowledge management
and organizational learning literature can be applied to global teams. We focus on global
virtual teams as a unique type of dispersed team structure. However our global virtual
team analysis can be extrapolated to general dispersed or non-collocated environments.
Global virtual teams are being utilized in varying sectors, and involve tasks that
are highly complex and that utilize individuals with specialized expertise. Specifically,
researchers have expressed the importance of exploring the management and practice of
knowledge work processes in new product development projects executed through virtual
collaborations (Jassawalla & Sashittal, 1998; Mohrman, Finegold, & Mohrman, 2003).
This study explores cases that involve complex new product development projects.
As transactive memory system explorations continue and interest in virtual teams
increases, the literature suggests that ongoing studies should aim to extend the TMS
construct to virtual environments (Griffith & Neale, 2001; Griffith, Sawyer, & Neale,
2003; Yoo & Kanawattanachai, 2001). For instance, Lurey & Raisinghani (2001) found
that formalizing work processes and developing team members’ relations is critical for
virtual team performance. Alavi and Tiwana (2002) suggest that a major role for a

9
knowledge management system in virtual team environments may be the development
and support of transactive memory. Other researchers (Nevo & Wand, 2005) have
suggested that future explorations can look into whether an ‘artificially-created’
transactive memory will lead to the same benefits of improved performance and problem-
solving in virtual teams as it does in non-distributed groups.
Advancements in technology have made it easier to communicate across
geographical boundaries. As such, organizations are applying such technological
progressions to team formations such that the most appropriate individuals, regardless of
location, can be brought together to execute a project. Therefore, this study seeks to
explore how group process enablers and TMS interact to enhance team performance.
1.3 Problem Statement and Research Questions
This study extends the concept of TMS to a virtual setting. Much of the initial
investigation on transactive memory systems was done in a laboratory setting,
specifically among couples (Hollingshead, 1998a; D. Wegner, 1986). Additional studies
also observed TMSs in small groups and laboratories and there are theoretical discussions
of the role in larger organizations (Lewis, 2004; R. L. Moreland, Argote, & Krishnan,
1996). Furthermore, as discussed earlier, researchers have called for future studies to
address how transactive memory concepts can be used to enhance virtual team
performance (Alavi & Tiwana, 2002; Griffith & Neale, 2001; Griffith et al., 2003; Nevo
& Wand, 2005; Yoo & Kanawattanachai, 2001).

10
The extensive literature on effective group processes has identified various
practices that can impact a group’s ability to perform effectively. Based on our
understanding of the literature on teamwork and TMS, we selected a subset of these
practices to explore as potentially playing a role in TMS emergence. Specifically, we
identify three salient virtual group process enablers and observe how TMS relates to
these enablers over time. The enablers we have selected to observe are: communication
effectiveness, investment in group cohesion, and division-of-labor strategies.
Communication Effectiveness
To explore communication effectiveness within global virtual teams, we evaluate
the impact of virtual collaborative tool use and face-to-face interaction. We consider
these as enablers of TMS emergence and improved team performance. Griffith and
Neale (2001) argue that the majority of teams (even global teams) are neither completely
traditional teams that meet solely via face-to-face interactions nor teams that interact only
virtually. Rather most of these teams lie somewhere along a “virtual continuum.”
Several researchers (Chudoba, Wynn, Lu, & Watson-Manheim, 2005; J. N. Cummings &
Cross, 2003) have discussed the importance of information and communication
technologies as mitigating the effect of separation in dispersed groups. In addition to
investigating the role that face-to-face interactions play, we also explore different types
of communication tools that are preferred. Communication effectiveness will depend on
the specific project task and also team collaboration preference based on experience over
the course of the project (team learning).

11
Investment in Group Cohesion
When geographically dispersed individuals are first grouped together and
assigned to a project, they do not know each other and face the challenge of bonding as a
team without any direct contact. Social interaction is a key component of what makes
teams effective. Jarvenpaa and Leidner (1998) discuss the issue of trust in virtual teams
and identify trust as a necessity for effective team performance. Thus, the literature
suggests that global virtual teams must find a way to quickly develop trust (S. L.
Jarvenpaa et al., 1998) and make an effort to engage in social interactions (Krauss &
Fussell, 1990) to mitigate the lack of constant interaction that correlates to the success of
collocated teams. This study explores how global virtual teams invest in cohesiveness
and the impact of such cohesion on TMS emergence and performance effectiveness.
Division-of-Labor Strategies
Virtual teams are becoming increasingly popular because they enable
organizations to assemble the most appropriately skilled individuals to collaborate on
complex problems. One of the key challenges for effective groups is how they divide up
the work based on individual expertise and how well individuals embrace their roles and
responsibilities. TMS starts with the assumption that individuals have unique knowledge
that needs to be effectively harnessed by the group (Lewis, 2003). Within a virtual
environment, it can be more difficult (than within collocated teams) to determine who has
specific expertise and how each person’s unique skills can best be utilized in the group

12
project. It is easy for responsibility to become dispersed so individuals assume others are
handling the task.
Research Questions
This dissertation seeks to investigate how the virtual group process enablers of
communication effectiveness, investment in group cohesion, and division-of-labor
strategies impact the emergence of transactive memory systems. Concurrently, we also
explore how the TMS affects these virtual group process enablers. Based on prior
research assertions that the virtual group process enablers are necessary for team
effectiveness, we also explore the impact that these enablers have on team performance.
The research questions are summarized below and depicted in Figure 1-2:
Research Question #1: What relationship develops between virtual Group
Process Enablers (GPEs) and the emergence of transactive memory systems?
Research Question #2: How do Group Process Enablers (GPEs) impact
overall team performance?
Research Question #3: How does transactive memory system emergence
affect team performance over time within virtual groups?

13
Figure 1-2: Research Questions
Also important is the role that cultural diversity plays in the emergence of transactive
memory systems. While we do not explore culture in the same depth as the virtual group
enablers, it remains an underlying theme that we address which provides opportunities
for future explorations.
Research on global virtual teams will remain highly relevant in years to come;
thus this dissertation will contribute to the literature by extending the impact of TMS to
geographically dispersed teams. Practically speaking, exploring TMS theory in virtual
environments could be valuable in the formation of teams comprised of members that are
not collocated. Understanding how the group process enablers influence TMS emergence
can help organizational leaders determine how best to assemble virtual teams and which
enablers they should emphasize and cultivate.

14
1.4 Organization of Document
This document is organized into five chapters. This chapter (Chapter 1)
introduced the research problem and provided a high level summary of a proposed
solution: understanding the role that virtual group process enablers play in TMS
emergence and team performance. Chapter 2 provides an in-depth literature review
focusing on transactive memory systems (TMSs) and virtual team effectiveness. The
third chapter discusses the research methodology as well as the data collection procedures
and analysis approaches that we utilize exploring the global product development (GPD)
case study. Chapters 4 and 5 address the research questions that are being considered and
present our findings. In Chapter 6, we discuss insights from industry case studies and
augment our findings from the GPD case study. The document culminates with the final
chapter presenting conclusions, limitations, and recommendations for future research.

15
Chapter 2
Literature Review
To better understand the relationship between virtual group process enablers,
transactive memory systems (TMS), and effective team performance, this chapter
explores the current literature on these topics. We begin with the TMS construct - its
origin, properties, and settings in which it has been observed. We then review the virtual
teamwork literature. Next, we explore what constitutes group effectiveness in more
detail as well as virtual group process enablers that affect TMS and group effectiveness.
The chapter concludes with the conceptual framework developed from the literature
review, which serves as the foundation for our research model.
2.1 Transactive Memory – Research Findings
The transactive memory system concept emerged in the mid 1980s as a process
that was thought to facilitate knowledge management and team learning. It has been
discussed throughout as a solution that addresses teamwork effectiveness in a globalized
society. Research on transactive memory systems has received significant attention in
recent years (Hollingshead, 1998a; Lewis, 2003; Liang et al., 1995). A transactive
memory system is an evolving process of understanding who knows what within a team.

16
It also involves continuously improving the process of identifying how to access this
knowledge (R. L. Moreland, 1999; D. M. Wegner, Erber, & Raymond, 1991). Thus, this
phenomenon relies heavily on trust and responsibility and has been observed to improve
team performance and individual satisfaction within the team.
2.1.1 Knowledge Management and Organizational Learning
The TMS theory intersects the overarching themes of knowledge management
(KM) and organizational learning (OL) so we briefly consider the relevant literature on
these topics. The areas of knowledge management and organizational learning (OL) have
continued to receive considerable attention in research and practice, especially in recent
years (Alavi & Tiwana, 2002; Nevo & Wand, 2005). Although both have been found as
essential for advantageous competition and improved performance, isolating the benefits
of such practices to the organization at hand, such that knowledge is not inadvertently
transferred to outside beneficiaries (Argote, 2005) becomes challenging and is an
essential component of the learning process. Huber (1991) summarizes the learning
process as occurring when “the range of potential behaviors is changed through the
processing of information.” Organizational learning focuses more on the processes by
which organizations improve on their tasks and functions based on experiences. A better
understanding of how organizations are able to acquire and utilize knowledge from
experience can aid in the design of better knowledge management systems.

17
Knowledge Management
Researchers have identified knowledge management as addressing the ongoing
acquisition, identification, creation, retention, and transfer of knowledge, including the
processes engaged in facilitating such efforts (Argote, McEvily, & Reagans, 2003b).
Managing knowledge entails applying information to solve a task in a systematic way. In
the context of virtual teams, managing knowledge takes on additional complexities as
individuals that are geographically dispersed must overcome additional challenges to
work collectively to address a problem.
The knowledge management (KM) field is interdisciplinary in nature, involving
areas such as management, psychology, information science, and engineering. One
major reason is that knowledge management is quite organic, involving people, group
dynamics, and social and cultural aspects. Thus, as the world is transitioning towards a
globalized society, we continue to observe the evolution of knowledge management.
Knowledge in itself is information that is actionable. In this Information Age,
intellectual property has become overwhelmingly significant. Thus, there is increasing
interest in how such knowledge can be transferred within organizations and protected
from competitors. Of particular interest is how knowledge can be codified or formalized.
Such knowledge can be identified as ‘explicit’ knowledge and is easier to transfer
(Nadler, Thompson, & Boven, 2003). Tacit knowledge is more difficult to articulate or
encode and is best acquired through direct interaction and experience (Nonaka, 1991).
These varying elements of knowledge have resulted in the following classification of
knowledge management strategies: codification and personalization (Hansen, Nohria, &

18
Tierney, 1999). Codification depends on computers or systemized processes of
structuring information while personalization involves social networks and creates
opportunities for transferring tacit knowledge. Argote (2005) has suggested that
understanding how to balance the tradeoffs between tacit and explicit knowledge
management is essential. In a global society, factors such as personnel rotation and
diversity can also affect how knowledge is managed within a virtual organization.
We begin to develop a conceptual model (Figure 2-1) based on a modification of
the input-process-output model introduced by Hackman (1987). Inputs to the knowledge
management process include the characteristics associated with team members such as
language barriers, culture, and technical/management proficiency (Argote, McEvily, &
Reagans, 2003a; Nonaka, 1991). Another essential input is collaborative tools. Such
tools should not only be accessible, but also relevant and reliable (Dube & Pare, 2001; J.
S. Olson & Olson, 1999). As the procedural interaction of these inputs lead to a
systemized management of knowledge, external mediating factors such as competition
(Chang & Joseph E. Harrington Jr., 2003), environmental turbulence (Sorenson, 2003),
and globalization (Maznevski & Chudoba, 2000) also impact the development of
knowledge managing processes. Knowledge management involves integrating actionable
information (know-how, experience, judgment) by leveraging mechanisms such as
ability, motivation, and opportunity to create value. The literature has identified
outcomes of KM as creation, retention (for reuse), and transfer (Argote, McEvily, &
Reagans, 2003b). The interactions between these outcomes depend on the properties and

19
relationships of the managing unit (individual, group, or organization) as well as the
knowledge properties (Argote, McEvily, & Reagans, 2003b).
Figure 2-1 Conceptual Model - Knowledge Management
Organizational Learning
Organizational learning is the improvement of organizational performance and
outcomes based on experiences at the individual, group, and organizational levels.
Contingency theories suggest the conditions that lead to effective organizational learning.
20
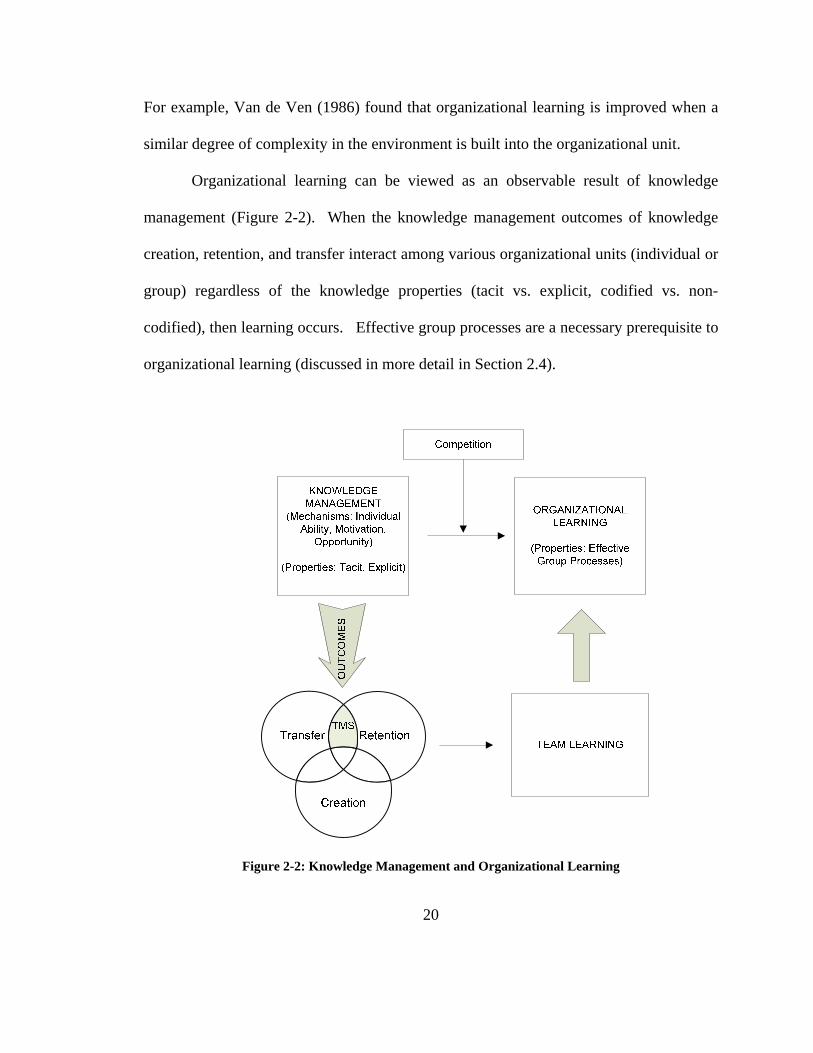
For example, Van de Ven (1986) found that organizational learning is improved when a
similar degree of complexity in the environment is built into the organizational unit.
Organizational learning can be viewed as an observable result of knowledge
management (Figure 2-2). When the knowledge management outcomes of knowledge
creation, retention, and transfer interact among various organizational units (individual or
group) regardless of the knowledge properties (tacit vs. explicit, codified vs. non-
codified), then learning occurs. Effective group processes are a necessary prerequisite to
organizational learning (discussed in more detail in Section 2.4).
Figure 2-2: Knowledge Management and Organizational Learning

21
Argyris (1983) discusses the differences between single-loop and double-loop
learning, where single loop refers to more routine surface changes and double-loop
addresses underlying values and cultural shifts and thus has a longer time frame
associated with it. Since double-loop learning makes a more fundamental shift in the
direction of the organization it can be argued that this is a more important challenge for
organizational learning and involves a higher level of capability.
In addition to learning from within, both from individual and collective
organizational experiences, organizational learning is also affected by external inputs. In
fact, research has indicated that external knowledge has a greater impact on innovation
than internal knowledge (Menon & Pfeffer, 2003). Being able to learn from other
organizations while protecting the organization’s own intellectual property and managing
knowledge adequately is essential for advantageous competition (Argote & Ingram,
2000). One aspect of acquiring knowledge in the organizational learning process is
through corporate intelligence, or searching for information about competitor strategy.
Although the transfer of knowledge is more likely to occur within the organizational
boundary (between individuals and groups of the same working unit), the significance of
organizational intellectual capital in this society leads to a stronger emphasis on exploring
and employing knowledge transfer mechanisms (Baum & Ingram, 1998; Darr, Argote, &
Epple, 1995), particularly across geographical boundaries.

22
Exemplary Knowledge Management and Organizational Learning: Toyota
As the world is becoming flatter organizations must develop ways of competing
advantageously while maintaining the capacity to learn as an organization. A company
like Toyota has gained success as a result of its ability to cultivate teams across
geographical boundaries, bridge cultural divides, and sustain a learning organization (J.
Liker, 2004). Within Toyota, kaizen (continuous improvement) is an integral component
of the Toyota Productive System and employees frequently work within groups to
improve efficiency. “The Toyota Way” (J. Liker, 2004)describes the culture of
continuous improvement as a “pervasive cultural transformation.” Maintaining a
learning organization involves developing a culture that emanates kaizen.
Applebaum & Blatt (1994) also indicate that teams are significant elements in
Japanese lean-production models of work organization such as Toyota. Many
organizations have used teams as a mechanism for executing organizational work, but not
as many organizations have been as successful as Toyota has been in coordinating
individuals within a work group. Liker and Hoseus (2008) write that the work team is
“one of the main mechanisms for transmitting the Toyota culture” and that the
organization and company culture is essentially built around the work group unit. Sole
and Edmondson (2002) have suggested that diverse perspectives / practices and
organizational learning work hand in hand. Within a team setting, individuals are
encouraged to think independently while working collectively. It is through this process
that team learning, and consequently organizational learning occurs. The transactive
memory system (TMS) is an effective team process that enables individuals to utilize the

23
expertise that exists within the team to work effectively together. The next section
discusses the TMS construct in more detail.
2.1.2 Transactive Memory Characteristics
Studies (Liang et al., 1995; R. L. Moreland & Myaskovsky, 2000) have suggested
that there are three measurable characteristics of transactive memory systems. These
characteristics are: specialization, credibility, and coordination. Lewis (2003) developed
a scale measurement of TMS based on these characteristics that is particularly applicable
for field settings. She also describes how the cooperative processes of specialization,
credibility, and coordination form the core of the TMS construct. Individual members
understanding “who knows what” within a team and use this awareness to develop his or
her own individual knowledge of group skills is the essence of TMS development.
Specialization
Specialization ensures that the overlap in information depositories within the team
is minimized. It involves the diversification and distribution of expertise within the
group. Furthermore, because of the presence of the other two characteristics (credibility
and coordination), individual members will have a better understanding of the types of
team-relevant knowledge to specialize in.
Credibility
Credibility provides the confidence needed for members to rely on knowledge
that resides within another team member. It is related to cognitive interdependence

24
which can be described as group members being aware of each other’s area of expertise
and becoming dependent on each other for acquiring, remembering, and generating
knowledge (Hollingshead, 2001). This TMS characteristic is particularly relevant to
virtual teams where members are geographically dispersed and are less able to rely on
physical interactions than more traditional collocated teams. Within global virtual teams,
credibility in another party will entail that the expectant party has the capabilities,
competence, expertise, and resources necessary to meet outcome expectations (Johnson
& Cullen, 2002). In the context of TMS emergence in global virtual teams, we also align
credibility with interpersonal trust within a team. McAllister (1995) defines interpersonal
trust as being “the extent to which a person is confident in and willing to act on the basis
of, the words, actions, and decisions of another” (p.25).
Coordination
The effective orchestration of knowledge use and transfer summarizes the third
TMS characteristic: coordination. This coordinating component of TMS offers an
explanation as to how the learning that takes place on an individual level can extend
beyond the individual to the group level, and potentially to the organizational level,
depending on social networks and project overlaps that occur within an organization.
Coordination enforces the TMS process by utilizing specialization and credibility to
develop a structured mechanism for maintaining and retrieving knowledge within the
group. Individuals within a team use convergent expectations, or the shared expectation
about what others know and what they will learn, to effectively execute their tasks.

25
2.1.3 Transactive Memory Creation and Emergence
Wegner et al. (1991) identify three stages of the creation and maintenance of a
TMS. The stages are defined as directory updating (creating meta-memories about team
member’s knowledge), information allocation (expert members claiming responsibility
for new information that enters into the team), and retrieval coordination (utilizing
organized process to access necessary information). The directory updating stage is the
process where group members learn “who knows what” within the group and where
information is most likely to be stored (Griffith & Neale, 2001). In this stage, members
create directories that have information about the memories or expertise that the other
team members hold (Nevo & Wand, 2005). Such collective group awareness is also
impacted by each member’s perception of the validity of the member-knowledge
association, which can evolve over time.
In the information allocation stage, new knowledge is distributed to the member
best suited for storing this new information (Griffith & Neale, 2001; Reagans, Argote, &
Brooks, 2005). Thus, once a group member is identified as the expert in a task-relevant
area, the member assumes responsibility for any related incoming knowledge. In some
instances, such a member is also expected to continue to develop the individualized
specialization as needed to address the group task. A group decision on expert roles can
emerge through defined responsibilities. This is generally the case for geographically
dispersed teams which are usually primarily assigned for short-term projects (S. L.
Jarvenpaa & Leidner, 1999). The team can also become aware of expertise through

26
natural development - conversations or observations that are more likely to occur in face-
to-face team settings.
The last stage is the retrieval coordination stage, where knowledge needed by a
member is retrieved. The coordination involves the process by which the member
retrieves this knowledge. The member first evaluates his or her internal memory or
expertise to locate information that would address the problem at hand. If the individual
expertise is not sufficient, the collective group directory becomes important in locating
and extracting the required knowledge (Nevo & Wand, 2005). This collective group
directory identifies the most efficient and effective way of solving the problem and is
continuously updated even as complications such as member rotation and knowledge
evolution can impact the directory. After the TMS is created within a team, the team
continues to utilize the three stages of directory updating, information allocation, and
retrieval coordination to maintain the TMS.
2.1.4 Transactive Memory Environments
The transactive memory system is important because it has been observed to
improve performance in several settings. Although most of these observations have
occurred in face-to-face settings, industry globalization raises the question as to how
TMS could develop in dispersed environments, and consequently improve performance
there as well. We review and observe the evolution of transactive memory environments.
Much of the initial investigation on transactive memory systems was done in a
laboratory setting, specifically among couples (Hollingshead, 1998a; D. Wegner, 1986).
Additional studies also observed TMSs in small groups and laboratories (Hollingshead,

27
1998c; Liang et al., 1995; R. L. Moreland, 1999; R. L. Moreland et al., 1996; R. L.
Moreland & Myaskovsky, 2000), and there have been theoretical explorations in larger
organizations (Anand, C. Manz, & et al., 1998; Nevo & Wand, 2005). In all these
studies, it is observed that the development of a transactive memory system influences
team performance.
Couples & Dyads
Initial research on transactive memory focused on couples and dyads
(Hollingshead, 1998a; Hollingshead, 1998b; Hollingshead, 2001; D. Wegner, 1986; D.
M. Wegner et al., 1991). Wegner’s study observed couples and found that couples had a
higher recollection ability when both partners took responsibility for topics that they felt
they were experts in and when each partner had a shared understanding of what both
partners were experts in. Hence this development of a transactive memory system led to
improved recollection. Hollingshead’s recollection study involving psychology students
paired up by areas of expertise also found a higher mean recall of unique, or different,
items when the partners differed in expertise, compared to partners with similar areas of
expertise. This study thus supports the contention that differentiated expertise and
retrieval coordination, both factors of TMS development led to better recollection.
Laboratory & Small Groups
Beyond the initial TMS studies on dyads, a significant number of studies explored
the TMS construct in laboratory and small groups (Hollingshead, 1998c; Lewis, 2004;

28
Liang et al., 1995; R. L. Moreland, 1999; R. L. Moreland et al., 1996; R. L. Moreland &
Myaskovsky, 2000). The studies by Hollingshead (1998b), Moreland (1999), and
Moreland & Myaskovsky (2000) all showed that TMS development through group
training led to better task performance. Hollingshead (1998b) looked at the effects of
task practice on group performance and individual performance. Her studies revealed
that the more individuals practiced as a group, the better they performed as a group, but
practicing as an individual or in a group did not significantly affect individual
performance. The study by Moreland & Myaskovsky (2000) showed that groups that
trained apart could develop a TMS from receiving knowledge of each member’s skills
and perform comparably to groups that were trained together. Austin (2003) showed that
a strong TMS will lead to improvement in group performance as a result of factors such
as the development of higher quality solutions due to the increased utilization of
individual expertise, enhanced external associations due to the positive perception of
group performance, and increased effective communication. Akgun et al. (2005)
conducted one of the few TMS studies in a product development setting where they
found the significance of team stability, member familiarity, and interpersonal trust on
TMS emergence.
Larger Organizations
There have been fewer explorations of transactive memory development in larger
organizations. Theoretical discussions (Anand et al., 1998; Nevo & Wand, 2005) stress
the importance of information technology and the management of tacit knowledge in

29
organizations. In a large group setting, Nevo and Wand propose the use of technology to
create a computer-supported knowledge allocation process, which will also assist in
knowledge retrieval. This proposal was suggested with the functionality of a TMS in
mind and they believe that such a system can overcome the hindrances associated with
the lack of tacit group knowledge, particularly in larger settings. Anand, Manz, and
Glick argue that while information technology can address information management
challenges, it needs to be complemented by organization-level processes such as the
management of soft knowledge. To support their argument, they adapted the initial
transactive memory concept to develop a proposed theoretical organizational memory
model for larger organizations.
2.1.5 Static and Dynamic Properties
Initial TMS studies have focused on identifying what constitutes a TMS in
varying environments and determining whether or not it emerged. Only recently have
studies explored the evolutionary, rather than the static nature, of transactive memory
systems (Brandon & Hollingshead, 2004; Lewis, 2004; Majchrzak et al., 2007). Brandon
and Hollingshead (2004) investigated the idea that a TMS evolves over time and offered
a model that emphasized both linear and cyclical aspects of the development of a TMS in
workgroups. The linear aspect focused on the progression of transactive memory
development from the cognitive interdependence prerequisite to task-expertise-person
unit development and then to a group shared mental model development. The cognitive
interdependence component emphasizes that team members rely on each other to take

30
responsibility for storing information. The task-expertise-person (TEP) unit structure is
the development of a shared understanding of the TEP association, associating a specific
task with an area of expertise and also with a person. The group shared mental model
development occurs as all group members develop similar TEP units and arrange the
units in a similar fashion; these are the external memory directories that teams utilize in
the retrieval coordination stage. The cyclical facet explicates the understanding that each
of the three segments of the linear model is in itself an ongoing iterative dynamic process.
Another study dealing with the development of a TMS over time was conducted
by Lewis (2004). Lewis hypothesized that a transactive memory system forms during the
planning stage of a development cycle and generally matures as a result of
communication. Her practical observation of MBA students working on project teams
showed that teams with a distributed knowledge were better able to develop a TMS than
teams with overlapping expertise. Furthermore, her results revealed that teams that were
able to create a TMS in the earlier stages of the project performed better than teams
which exhibited a TMS in the later stages. This supports the justification of the dynamic
nature of the TMS construct. Earlier developed transactive memory systems have a
larger project duration time to evolve based on how effectively the teams are able to
update the shared directory, allocate information to the appropriate individual, and
coordinate problem-solving tasks.

31
2.2 Virtual Environment and Teamwork
Virtual teams, created due to competition, acquisitions, and overall globalization
have for many companies become the primary operating units needed to achieve a
competitive advantage in the changing environment. Researchers began to explore global
virtual teams in the early to mid 1990s, and studies on global virtual teams must continue
given the evolving technology. Global virtual teams allow organizations to assemble the
most qualified people to address a project or task, regardless of geographical location. It
is necessary to understand the tools, processes, and interactions of global virtual teams as
their utilization increases.
Virtual teams are being utilized in varying sectors, particularly involving tasks
that are highly complex and that utilize individuals with specialized expertise.
Specifically, researchers have expressed the importance of exploring the management
and practice of knowledge work processes in new product development projects executed
through virtual collaborations (Jassawalla & Sashittal, 1998; Mohrman et al., 2003).
Thus our case study features a set of autonomous global product development teams. We
focus on global virtual teams as a unique type of dispersed team structure. However our
global virtual team analysis can be extrapolated to general dispersed or non-collocated
team structures.
2.2.1 Virtual Teams
In recent years, research has extended the transactive memory system construct to
dispersed environments (Alavi & Tiwana, 2002; Griffith & Neale, 2001; Yoo &
Kanawattanachai, 2001). These researchers have suggested that studies should address
32
how transactive memory concepts can be used to enhance virtual team performance.
More recent studies have explored TMS within distributed knowledge workers at the
organizational level (Jackson & Klobas, 2008) and TMS in globally distributed software
teams (Kotlarsky et al., 2007). Given that the TMS has been observed to enhance
performance in teams, this study aims to explore TMS extensions to virtual environments
and understand how TMS affects virtual team processes. In this section, we explore the
literature on virtual collaborations and virtual characteristics.
The utilization of virtual teams within organizations continues to increase as
companies and industries restructure, merge, compete, and globalize. As reported by the
Gartner Group survey (Biggs, 2000), an estimated 60 percent of professional and
management tasks at Global 2000 companies would be done via virtual teams by 2004.
This increase is reflected in academic classrooms as universities are now incorporating
global development courses into the engineering and business curriculum. Martins et al.
(2004) have integrated several virtual team definitions and identified a virtual team as a
team “whose members use technology to varying degrees in working across locational,
temporal, and relational boundaries to accomplish an interdependent task.” Virtual teams
allow for the composition of the best individuals for the task regardless of physical or
organizational location, thus enhancing the quality of decisions (Lipnack & Stamps,
1997).
Like most assembled teams, virtual team members possess specialized knowledge
and expertise, but are usually geographically dispersed. The tasks performed by the team
are typically non-routine and knowledge-intensive (Ramesh & Tiwana, 1999). In teams

33
where electronic communication is the main venue of communication, studies show that
such teams display a higher equity of participation (Siegel, Dubrovsky, Kiesler, &
McGuire, 1986; Straus, 1997). Additional positive implications of virtual teams are
greater adaptability to changes and faster response time.
Within virtual teams, it is especially important to establish a shared understanding
of goals and practices early. Such understanding could develop over time within more
traditional teams that have the advantage of using F2F meetings to strengthen
cohesiveness. However, the limitation stemming from the inability to meet face-to-face
frequently makes early unification within virtual teams a priority. Early understanding of
nuances can aid in the transfer of tacit knowledge within virtual teams. Members must
learn to rely on each other and build (swift) trust from the initial stages of executing the
task. Majchrzak et al. (2000) found that virtual norm-setting and knowledge-sharing is
possible and actually leads to improved innovation in virtual groups than was achieved
with collocated NPD teams.
2.2.2 Virtual Team Collaboration
Virtual teams have evolved from their origins mostly of work at home over and
above a full-time job (Kraut, 1987). Now we observe virtual groups in small businesses
and large, multinational companies conducting elaborate video conference sessions and
developing collaboratories (Finholt & Olson, 1997; Finholt, 2002). As technology
continues to advance and evolve, ongoing research has placed an emphasis on how
virtual teams can best utilize the tools, and researchers have conducted analyses of tools

34
that are best for varying virtual situations (Baker, 2002; J. N. Cummings & Kiesler, 2005;
Hinds & Kiesler, 1995).
Members of virtual teams conduct most of their collaborations through the use of
technical communication and they rely less on face-to-face (F2F) meetings. This enables
virtual team members to be comprised of individuals who are geographically dispersed.
Thus group composition and task design are especially significant in virtual teams.
Virtual teams usually have a shorter lifecycle than face-to-face teams and are generally
assembled and disassembled according to need for temporal activities (G. DeSanctis &
Monge, 1999). As a result, virtual team membership is more fluid because expert
members are added and removed as tasks change.
Technology is certainly an important enabler, but recent studies indicate that
collaborations are more successful when team members attempt to understand the
underlying meanings behind differences in team member interpretations (Susman et al.,
2003). In a study on effectiveness within virtual teams, Lurey and Raisinghani (2001)
found that team member’s relations and processes were the strongest indicators of
performance and team member satisfaction. Kraut, Egido and Galegher (1988) discuss
the importance of informal communication, focusing on communication frequency,
communication quality, and communication cost. An observable catalyst that makes
collocated teams effective in carrying out their tasks is the informal communication and
collaborations that occur as a result of proximity. The challenge is to adopt similar
relational ties within virtual teams. Thus, this implies that more research is needed in
understanding virtual team effectiveness from a relational perspective. This is one reason

35
why we desire to extend the implications of TMS, a relational construct, to virtual
environments. There is an increasing interest in understanding how the communication
tools that enable virtual collaborations can best be utilized to invest in stronger team
cohesions. We discuss virtual team communication effectiveness later on in this chapter.
2.2.3 Global Virtual Teams
The introduction of globalization has introduced a subset of virtual teams known
as Global Virtual Teams (GVTs), which also rely heavily on technology to accomplish
tasks. Global teams have been defined as being internationally distributed (Maznevski &
Chudoba, 2000), culturally diverse, and geographically dispersed (S. L. Jarvenpaa &
Leidner, 1999). While virtual teams focus more on technological tools, the amount of
work done with members geographically dispersed, and the number of locations occupied
by team members, within this subset, GVTs consist of individuals that are geographically
dispersed across the globe. Thus additional complexities abound, such as the ability to
function within various time zones and cultures. Members that are identified as part of a
global team within their respective organizations are responsible for making and
implementing strategic global decisions (Gibson & Cohen, 2003; Maznevski & Chudoba,
2000).
Researchers have identified global teams as a critical mechanism for integrating
information, making decisions, and implementing actions around the world (Canney
Davidson & Ward). Projects that teams engage in are usually highly complex and
dynamic, which supports the reasoning for employing teams; it provides an opportunity
to bring the most relevant skills together. Global teams extend this specialization and

36
also include a diversity of ideas, cultures, and expertise which in turn increases idea
generation, creativity, and innovation. Like most other virtual teams, global virtual teams
tend to be project teams in that they are autonomous or interdependent in task
management and they are typically assembled for ad-hoc purposes (Gibson & Cohen,
2003; Maznevski & Chudoba, 2000). In the global society that exists today,
technological advancements such as video conferencing and video chatting are
facilitating the execution of global team tasks.
2.2.4 Teamwork: Variation in Virtuality
The consciousness of a global society brought about the transition from what has
been traditionally regarded as purely traditional face-to-face (F2F) teams to different
variations of virtual teams. In this section, we look at differences in virtual teams.
Researchers (Griffith & Neale, 2001; Griffith et al., 2003)have observed that most
organizational teams are rarely entirely face-to-face teams or purely virtual teams.
Rather, they lie somewhere in between. They introduce the concept of virtualness, the
idea that all teams lie along a continuum which is highlighted by three distinct categories:
traditional, hybrid, and purely virtual (Figure 2-3).
Purely
virtual teams
Hybrid teams Traditional face-
to-face teams
MORE VIRTUAL LESS VIRTUAL
Figure 2-3 Virtualness Continuum

37
These categories differ based on three aspects: the level of technological support
that the team uses, the percentage of work done with members distributed across time and
space, and the distribution of the physical locations occupied by team members (the level
of member collocation). Chudoba et al. (2005) also propose the idea that virtual teams
vary along aspects such as geography, time zone, organization, national culture, work
practices, and technology, which can all be categorized under three overarching
discontinuities: team distribution, workplace mobility, and variety of work practices.
Pure traditional teams make no use of technological support and do all of their work in
face-to-face environments; this is rare with today’s technological capabilities. Pure
virtual teams encompass the other extreme of the virtualness continuum and never meet
face-to-face, but are a minority of teams that exist in practice. Most organizations today
are likely to form hybrid teams that vary across the three aspects. While there are some
virtual teams that never meet face-to-face (S. L. Jarvenpaa et al., 1998; Lipnack &
Stamps, 1997), most researchers use the term “virtual team” to refer to teams that conduct
a majority of their interactions using technology.
A consulting firm is an example of an organization on the more virtual end of the
spectrum. Teams in consulting firms are typically formed for a specific project and are
usually comprised of team members from various geographical areas based on individual
expertise. On the less virtual end, human resources departments within organizations are
examples of entities with more traditional face-to-face teams. This could be the most
feasible situation for such teams as the frequent exchange of confidential information
makes it necessary for easy physical accessibility among team members.

38
Griffith et al. (2003) have discussed the process of TMS development in more
virtual groups. Griffith & Neale (2001) had proposed that the more team members are
geographically or temporally distributed, the more difficult it will be to develop a
transactive memory system. However, Griffith et al. (2003) contest that, similarly to
larger organizations, technology and organizational systems can support TMS
development and mitigate the hindrances expected. They use Moreland and
Myaskovsky’s (2000) study – which showed that teams informed of member expertise
performed comparably to teams that trained together -- as support for the idea of how
technology can enable creation of TMS even in virtual teams. Griffith & Neale (Griffith
& Neale, 2001) also observed from prior studies that much of the information embodied
in transactive memory systems could be made available by electronic databases. In one
of the few studies on TMS development in virtual teams, Yoo and Kanawattanachai
(2001) found that the development of TMS was one of two variables that explained team
performance; the TMS measurement was a set of three questions using a 5-point Likert
scale that addressed team members’ knowledge of who knows what. The rest of this
section looks more closely at the characteristics by which virtual teams vary in more
detail, the difference between virtual teams and global virtual teams, and the advantages
and limitations of utilizing virtual teams.
2.2.5 Virtual Team Advantages and Challenges
We observe that there are tremendous advantages to utilizing virtual teams.
Guzzo and Dickson (1996) report that virtual groups that use computer-mediated
communication system generate more unique and higher quality solutions than collocated

39
teams that use computer systems. They also found that electronic brainstorming
facilitates creativity better than F2F brainstorming. Zakaria et al., (Zakaria et al., 2004)
agree that virtual teams “create culturally synergistic solutions, enhance creativity and
cohesiveness among team members, promote greater acceptance of new ideas, and
provide a competitive advantage for multinational teams.” With global virtual teams, the
organizational circle of influence becomes larger and there is a broader appeal to a larger
audience since virtual teams impact a wider range of customers and stakeholders. As
mentioned earlier, increased perspective and innovation are valuable outcomes of global
virtual team effectiveness.
Researchers have found that F2F meetings in virtual teams are particularly
advantageous for discussion tasks, conformity, and opinion change agreement (Guzzo &
Dickson, 1996). Lack of frequent F2F meetings in virtual teams and member
involvement in other projects could impact the urgency and emphasis placed on global
projects so global team members need to be adept at efficiently balancing conflicting
priorities. Current trends indicate that we will continue to observe an increase in the use
of virtual teams so organizations must find ways to overcome these limitations.
Researchers found that work practice predictability and sociability mitigated effects of
working in discontinuous environments (Chudoba et al., 2005). Similarly, other activities
that have been successful in traditional work teams will need to be evaluated and
modified for implementation in virtual R&D teams.
Employing virtual teams also has its challenges (G. Olson & Olson, 2000).
Studies have shown that geographically-dispersed teams face more challenges than more

40
localized teams (Dube & Pare, 2001). Such barriers include geographical, time zone,
cultural (more frequently when teams are global), task integration, and even technology
(Chudoba et al., 2005). In addition, although virtual teams are bringing together
individuals with specialized skill sets, studies indicate that distributed tasks still involve
more people (and consequently more time) than tasks performed by collocated teams
(Herbsleb & Mockus, 2003). Some of these challenges can be mediated by instituting a
knowledge-sharing culture for global virtual teams (Zakaria et al., 2004).
With team members being geographically dispersed, it can be tough to gauge and
sustain individual motivation and commitment (Hackman & Oldham, 1980; Hackman,
1987). Furthermore, virtual teams experience a higher occurrence of role overload, role
ambiguity, absenteeism, and social loafing (Devereaux & Johansen, 1994). It can require
more effort and be more time consuming to engage all individuals in virtual teams,
especially global virtual teams. Therefore, more effort has to be placed on overcoming
the miscommunication, misunderstanding, and conflicts that are more likely to arise in
virtual teams (Zakaria et al., 2004).
Virtual teams operate under a different set of constraints and must effectively use
communication tools to develop group processes. In essence, there is a necessity for
communication in virtual teams to become more relationship-based because it can create
a desired intimacy that exists in collocated teams in spite of the geographical dispersion,
as DeSanctis and Monge (1999) observe. Furthermore, they state that electronic
communication can indeed support effective relationships within virtual teams. In
addition to communication tools, trust is another key component of virtual teams. Due to

41
the physical separation that exists within geographically dispersed teams, communication
should be enhanced by a high level of trust. Lipnack and Stamps (2000) observe that
“teams with trust converge more easily, organize their words more quickly, and manage
themselves better” (p. 69). Within virtual teams in particular, Jarvenpaa and Leidner
(1999) introduce the idea of “swift trust,” which we discuss later in this chapter. Swift
trust suggests an instantaneous, collective, but fragile type of trust that exists within the
virtual team. Members are coming together with an understanding of the complex task
ahead of them, made more difficult because of the “virtual barriers,” and are thus willing
to develop an expected reliance on each other in order to execute the task.
2.3 Effective Work Teams
TMS is a group-level phenomenon that has been shown to be associated with
team effectiveness; thus, we also explore the literature on effective work teams.
Researchers have been studying teams and groups for over half a century and the
effectiveness of teams remains an important topic especially as the traditional group
connotation of collocated individuals is evolving to include virtual and global teams.
Applebaum & Blatt (1994) display clear evidence that employing team-based work leads
to improved organizational performance, specifically in quality and efficiency. This
section focuses specifically on work done by Hackman (Guzzo & Dickson, 1996; 1980;
1987; 1990), Guzzo & Dickson (1996), and Cohen & Bailey (1997) on team
effectiveness.

42
In this study, we use the terms “group” and “team” interchangeably for
convenience. Although we recognize that there may be overlapping differences in what
is meant by each term, we agree with Guzzo and Dickson (1996), that the group literature
(e.g. group dynamics, intergroup relations) can be applied to all types of teams within
organizations. Cohen and Bailey (1997) suggest that “team” is more commonly used in
the management literature while “group” is more commonly used in the academic
literature. However, studies over the years have used the terms interchangeably to
address a collection of individuals that collaborate together to achieve an expected goal
or outcome. Guzzo and Dickson (1996) define a work group as follows:
A “work group” is made up of individuals who see themselves and who are seen by
others as a social entity, who are interdependent because of the tasks they perform as
members of a group, who are embedded in one or more larger social systems, and who
perform tasks that affect others.
Teams can differ in structure and purpose and given the increase in organizational
team utilization, it is not uncommon for individuals to belong to more than one team at
any given time. There are teams that are assembled with continuous collaboration in
mind. Cohen and Bailey (1997) refer to these as “work teams.” Organizations also
utilize other teams that are created for more ad hoc purposes. These teams have been
identified as “project teams” (Cohen & Bailey, 1997) and tend to produce one-time
outputs. Global virtual teams usually exhibit project team characteristics since such
teams usually engage in single, complex tasks that are non-repetitive. In addition, project
teams are comprised of individuals who are highly skilled and the situational nature of

43
project teams is well-suited for virtual teams with geographically-dispersed individuals
that are not able to frequently meet face-to-face. Hackman (1990), Guzzo and Dickson
(1996), and Cohen and Bailey (1997) provide a comprehensive overview of various
classifications of effective groups based on task type, organizational hierarchy, and
performance outcome as well as the practices that lead to group effectiveness. Thus, we
develop a model (Figure 2-4) that illustrates the criteria, processes, and outcomes of
group effectiveness.
Figure 2-4 Effective Group Processes Model
2.3.1 Determinants of Effective Groups
Regardless of whether a team is traditional, virtual, or global, researchers have
identified certain common components of effective work teams. We discuss the inputs
that are necessary for a team to be effective. One of the most important inputs that is
commonly identified is group composition as this directly affects the expertise that will
be applied to the team project by the individual members (Hackman, 1987). Group

44
composition takes into consideration the group size, member task expertise and
interpersonal skills, and member diversity or heterogeneity (Hackman, 1987). Research
has found that group heterogeneity is positively related to creativity and decision-making
effectiveness of teams (Guzzo & Dickson, 1996). Randel and Jaussi (2003) also show a
positive relationship between functional heterogeneity and team-level performance,
higher product quality, and member satisfaction. Moreover, while heterogeneity is
important, it is essential that the group is still able to agree on processes, strategies, and
overall team goals; that is, there needs to be an ideal balance between homogeneity and
heterogeneity (Hackman, 1987).
In addition to group composition, task design also plays an important role in a
team’s ability to perform at an optimal level. Supporting a work team structure involves
clearly assigning tasks to individuals such that they are motivated and engaged
throughout the project duration (Hackman & Oldham, 1980; Hackman, 1990). Equally
important is that group members are able to participate in as many aspects of the task
design process as possible. This encourages individual ownership of not just the
individual task component but also of the entire group project (Hackman, 1987).
Deciphering how much control the team will have (autonomy) and the level of
interdependence throughout the duration of the project are also components of task
design (Cohen & Bailey, 1997).
Lastly, after ensuring that the group membership and group task are well
designed, it is critical that the context in which they are executing the task is well suited
for effective performance. This involves creating an ideal support structure for the team

45
to function – materials, tools, training, etc. (Hackman, 1987; Hackman, 1990). In
addition to the material resources (e.g. collaborative tools) required in executing work,
studies also suggest that individuals need a personal motivating factor (beyond the project
outputs) to drive individual effort and performance such as some type of a reward system,
both tangible and intangible. Guzzo and Dickson (1996) discuss understanding
motivation from a collective level as well as from an individual level. Hackman and
Oldham (1980) also suggest ways of designing tasks such that individuals become
motivated.
2.3.2 Internal Processes
The internal processes comprise the “black box” that we are interested in
exploring. The determinants of effective groups (group composition, task design, and
organizational context) serve as inputs into the process box with optimal group processes
as the desired output. After the team is formed and begins to engage in executing the
task, group engagement activities play a prominent role in how effective the team will be.
These activities will depend on the level of control or autonomy that the group has. The
internal processes or “black box” of this dissertation study focuses on the relationship
between transactive memory systems, which was described in detail in the previous
section, and group process enablers, which will be described in more detail in section 2.3.
When Cohen and Bailey (1997) conducted their review on group effectiveness,
they expressed that little work had been done on project teams’ internal processes.
Although several researchers have conducted more research on group processes in recent
years, this study intends to continue the contribution to our understanding on the internal

46
processes that impact team performance, particularly in virtual environments. In the
group effectiveness framework by Cohen and Bailey (1997), they show that the group
psychosocial traits (such as shared mental models and transactive memory systems)
directly influence outcomes and internal/external processes. The team’s ability to
manage knowledge and learn continuously through their ongoing experience will also
impact the effectiveness of the team. Guzzo and Dickson (Guzzo & Dickson, 1996)
discuss the importance of goal alignment from the individual level to the group level as
an important indicator of group effectiveness. Their review study found that there was no
improved performance when both individual and group goals were present as compared
to when only group goals were present.
Numerous enablers for group effectiveness, such as motivation and leadership,
exist in the literature. Researchers have discussed motivation (both group and individual)
and leadership and their relationship to group performance (Guzzo & Dickson, 1996;
Hackman & Oldham, 1980). Groups should pay close attention to individual effort
because “social loafing” or decreased motivation and responsibility can occur, especially
in larger groups. With respect to leadership, Cohen and Bailey (1997) show that groups
in which managers controlled task assignments and procedures performed better than
more autonomous teams. We observed that there were recurring internal processes that
kept emerging in the literature as important activities for achieving group effectiveness,
namely: communication, cohesiveness, and group synergy and coordination. Based on a
literature account of factors that we believe are most likely to affect TMS and what
would be critical for virtual teams, we decided to focus on these recurring processes:

47
communication effectiveness (evaluating both virtual collaborative tools and face-to-face
communication), investment in group cohesion, and strategies for group coordination of
division-of-labor. We will provide the rationale for these factors that affect performance
in Section 2.4.
Cohen and Bailey (1997) believed that both internal and external communication
were key processes that impacted team effectiveness. Guzzo and Dickson (1996) suggest
that an ideal leveraging point that could enhance team effectiveness would be group
social processes such as cohesiveness. Group synergy affects how a group is able to
handle demands, opportunities and decisions that it encounters as it executes the task at
hand (Hackman, 1987). With effective group synergy, the group work outcome can be
greater than the sum of the parts.
2.3.3 Effectiveness Outcomes
How does one determine when a group is performing effectively? Researchers
have established several criteria for assessing desirable group effectiveness. Hackman
(1987) indicates that given the subjectivity of team effectiveness, successful effectiveness
can be evaluated by three criteria. First of all, work group productivity or outcome
should meet or exceed performance standards. Secondly, the satisfaction of team
members based on the group experience should be evident. Lastly, future collaborations
that the team engages in should improve based on social processes and team learning.
Other researchers (Guzzo & Dickson, 1996) also support Hackman’s criteria by
suggesting that effectiveness can be determined by group-produced outputs (such as
customer satisfaction, speed, quantity), the consequences that a group has for its

48
members, as well as the enhancement of a team’s capability to perform effectively in the
future. Cohen and Bailey (1997) extend the effectiveness dimensions of Hackman (1987)
and Guzzo and Dickson (1996) beyond performance effectiveness and member attitudes
to also include behavioral outcomes. Such outcomes consist of safety, turnover, and
absenteeism. Jarman (2005) summarized that virtual team performance dimensions have
been identified as productive output standards, work processes, group experience,
organizational learning and knowledge management of team processes and outcomes.
Figure 2-4 displays our framework that illustrates the effective group processes
relationship. The determinants of effective groups serve as inputs into internal processes
that occur during task execution. Based on our literature findings on team effectiveness,
we have chosen to focus on product quality, team member satisfaction, and team learning
as indicators of effective virtual team performance in our case study of global product
development teams. This can be observed in Figure 2-4 as our group effectiveness
outcomes. The next section goes into more detail on one component of the internal
processes, our virtual group process enablers.
2.4 Enablers of Effective Group Processes in a Virtual Team Context
For several decades, researchers have been exploring the team as an operational
mechanism and are continuing to identify enablers necessary for teamwork effectiveness.
Researchers suggest that there are several factors that determine how well a team
performs. Based on consistent findings from prior research, in this section we discuss
communication effectiveness, investment in group cohesion, and division-of-labor

49
strategies as group process enablers that interact with TMS to impact team performance.
We also explore the direct relationship between these enablers and team performance.
We selected these factors to explore as enablers of group process effectiveness based
primarily on the extensive literature account available on effective work teams and our
knowledge of the transactive memory system.
Lurey and Raisinghani (2001) developed a virtual team effectiveness
questionnaire from a framework that included factors that were thought to directly impact
team effectiveness. The factors are internal group dynamics (including member
relations), external support mechanisms (which include technology tools and
communication patterns), and design processes. The effectiveness outcome measures
were satisfaction and performance. They found that the correlation for the first two
factors – group dynamics and support mechanisms – were significant at the 0.01 level,
while the tools and technology correlation was significant at the 0.05 level.
There is also practical justification from industry for our selection of the enablers
that we explore in our study. In an internal study conducted at Intel, Chudoba et al.
(2005) identified three factors likely to be especially important in virtual teaming:
knowledge networking, social interactivity, and work predictability. These three factors
are in alignment with our exploratory enablers of communication effectiveness,
investment in group cohesion, and division-of-labor strategies.
Of all the possible factors that the group effectiveness literature generally
suggests, the three factors focused on here were selected because they appear to have a
direct relationship to the transactive memory system (TMS) construct which is the focus

50
of this work. TMS emergence is impacted by how individuals within a team
communicate their expertise, the level of trust and dependency that exists within the
team, and the processes (especially in autonomous project teams) that the team uses in
executing their tasks. The rest of this section discusses each of the virtual group process
enablers in more detail.
2.4.1 Communication Effectiveness
The communication effectiveness enabler is comprised of two components:
collaborative technology and face-to-face communication. As will be discussed in the
upcoming section on virtual teams, most virtual teams utilize both communication types
to execute their tasks. We discuss both components in this section.
Collaborative Technology (Computer Supported Cooperative Work)
We address collaborative technology as part of the Computer Supported
Cooperative Work (CSCW) research stream. CSCW was formally established in the mid
1980s and describes a line of research that focuses on exploring how computer and
communication technology tools can be utilized in supporting individuals that work
together (Olson & Olson, 1999). Several researchers (Chudoba et al., 2005; J. N.
Cummings & Cross, 2003) have discussed the importance of information and
communication technologies as mitigating the effect of separation in dispersed groups.
However, various types of communication tools are preferable depending on the project,
members involved, and familiarity with technology. CSCW focuses more on the effect
of the tools and on the design of tools for supporting collaborative work, especially since

51
advancements in technology are increasing the myriad of tools available for virtual
communication. Virtual teams must communicate using technological tools, so the
advancement of such tools has significant implications on the effectiveness of virtual
teams. Concurrently, efficiency tends to decrease in electronic communication settings
(G. DeSanctis & Monge, 1999) so CSCW is important in enabling virtual teams to
collaborate more successfully. The table below displays the main dimensions along
which common CSCW tools are classified: Time and Place.
Olson and Olson (2003) conducted a detailed analysis of the specific types of
collaboration tools that virtual teams utilize, most of which are identified in the table.
Baker (2002) also does an analysis of tools along text, audio, and video dimensions.
Several corporations with geographically dispersed teams now utilize instant messaging
such as IBM Lotus Sametime, or Windows Meeting Space (formerly Microsoft
CSCW COMMUNICATION TOOLS
PLACE
Remote Collocated
TIME
Synchronous (Real-Time)
Video-conference Instant Messaging Audio-conference (Tele-conference)
Face-to-face meetings Group Decision Support Systems (GDSS)
Asynchronous Email Instant Messaging Text Messaging
Post-it notes
Table 2-1 Communications Tools Categorized by Time and Place

52
NetMeeting) for carrying out simple tasks, addressing quick questions, or even engaging
in informal conversations. Mark et al. (1999) conducted a study on how a major
company successfully utilized desktop conferencing to facilitate meetings. In relation to
the tools listed in the table, Kraut and Egido (1988) summarize the types of tools needed
for distributed work teams to be successful: 1) tools that facilitate both planned and
unplanned real-time and delayed interactions, 2) coordination tools that minimize
overhead work, and 3) task-oriented tools that lead to completion and integration of
specific work products.
Olson and Olson (2002) also indicate that the effects of the technology tools on
group work depend on several determinants: group characteristics, task characteristics,
technology, and the group process. In the primary case study discussed in this
dissertation, the group characteristics and task characteristics are essentially controlled
for as it is a classroom project with specific constraints. We focus on the interactions
between technology and the TMS group process. Olson & Olson (2000) discuss the
importance of having common ground within virtual teams in order for remote
collaboration to work (Clark, 1996). In addition, Kraut et al., (1999), found a positive
correlation between using interpersonal relationships for coordination and using networks
for executing tasks.
Collaboratories are a special type of virtual group where the task emphasis is on
geographically distributed research projects (Finholt & Olson, 1997). It is a specialized
organization consisting of geographically dispersed scientists, tools, and data that work
together to facilitate scientific research. Factors that have been found to impact the

53
success of collaboratories include collaboration readiness, technical readiness, individual
technical readiness, infrastructure readiness, and social ergonomics of tools. These
capabilities and impact factors are also relevant in virtual teams that utilize
communication tools. Moreover, there is some uncertainty as to whether technology can
indeed support the level of interactions that are essential for geographically dispersed
teams to execute their tasks (Olson & Olson, 2002). A significant portion of prior
geographically dispersed team studies have focused on virtual team formations and
virtual collaboration comparisons with F2F teams. There is still much to be explored on
the appropriation of communication tools by virtual teams (Huysman et al., 2003),
although DeSanctis & Poole (1994) have developed an adaptive structuration model that
focused on the use of technology in groups. Additional related fields of work to CSCW
and Collaboratories include Computer Supported Collaborative Learning (CSCL)
(Bannon, Niels, & Benedicte, 1988) and Computer-Supported Social Networks (CSSNs)
(Wellman et al., 1996).
Technology and tools that facilitate virtual collaborations have been shown to
improve team performance in prior instances. Researchers report that electronic
communication groups display better brainstorming outcomes (Guzzo & Dickson, 1996).
In their study on the effect of media richness on decision-making on two-person teams,
Dennis and Kinney (1998) also found that team performance is improved when team
members use “richer” media in performing tasks. There can be wide discrepancies in
participants’ technological proficiency (Dube & Pare, 2001), although this appears to be
less of the case with the rapid progression of technological collaborative tools. However,

54
the lack of individual technological proficiency can impede participation and impact
“status” within teams. Thus, we observe that information and communication
technologies are commonly recognized as enablers of virtuality (Chudoba et al., 2005).
Use of Face-to-Face (F2F) meetings
Collaborative technology is instrumental in mitigating the communication divide
that exists in virtual teams. Nevertheless, the literature still places much emphasis on the
importance of face-to-face interactions (Kirkman, Rose, Tesluk, & Gibson, 2004;
Lipnack & Stamps, 1997). The benefits of face-to-face meetings can be observed in the
scores of years of research dedicated to more traditional teams. The next section on
virtual team explicates that virtual teams are defined as such because a majority of the
team work is accomplished while members are geographically dispersed and with the use
of collaboration tools. However, a majority of virtual teams still include F2F meetings
during their task execution.
Face-to-face meetings can serve several purposes. They provide an opportunity
for the team to establish common ground more effectively at the onset of the project.
Maznevski and Chudoba (2000) have emphasized the importance of initial face-to-face
interactions. F2F meetings and targeted grounding activities at the beginning of the
project establish a familiarity that is essential in facilitating tasks throughout the project
duration. F2F meetings enable the development of the shared mental model of team
members and the establishment of a tacit knowledge of ‘who knows what.”
Communicating while geographically dispersed facilitates the transfer of explicit

55
knowledge and it is more challenging to exchange tacit knowledge. As Zack (1993)
notes, F2F meetings are appropriate for “building a shared interpretive context.”
Hackman (1987) emphasizes the importance of allocating time to develop group norms.
He suggests that this can be done either when the group is formed or during a hiatus in
the work when members are ready to reconsider how they operate as a team. F2F
meetings are critical for such tasks.
Grounding at the beginning of the project is essential; however, efforts should be
made for teams to also meet face-to-face during the course of the project. Scheduling and
financial constraints can affect the feasibility and frequency of this execution, but
research indicates that the benefits are worthwhile. From a task perspective, Maznevski
and Chudoba (2000) specify that F2F meetings are valuable for transferring complex
messages and making high-level or direction-changing decisions. From a relational
perspective, F2F meetings also provide opportunities to further deepen the team
cohesion. Specifically, they are considered irreplaceable for building trust and also for
repairing shattered trust (Devereaux & Johansen, 1994). We explore more about team
cohesion as we look at the investment in group cohesion virtual process enabler.
2.4.2 Investment in Group Cohesion
In a study on global virtual teams, Maznevski & Chudoba (2000) found that
managing social interactions or relationships is the greatest challenge faced by team
members; thus, this is an essential enabler for virtual group process and it is a vital
determining factor for developing a transactive memory system. The impact of social
interactions within teams continues to be a key component of what makes teams

56
effective. Krauss and Fussell (1990) have established that social interaction develops the
common grounds for communication and ultimately, the ability of individuals to work
together. Thus the lack of team cohesion could be detrimental to member satisfaction
and overall group advancement. Furthermore, research has indicated virtual team
characteristics such as geographic separation and cultural differences contribute to a lack
of cohesion between workers in a collective situation (Chudoba et al., 2005).
The prior section discussed the importance of F2F meetings in establishing trust.
First of all, virtual teams that are able to meet F2F at the onset of the team project have
difficulty developing trust in a limited amount of time (S. L. Jarvenpaa & Leidner, 1999).
They describe trust as being “based on the expectation that others will behave as
expected.” It is more difficult for a team to sustain trust with geographically dispersed
members. Jarvenpaa and Leidner (1999) introduce the idea of “swift trust” by showing
that trust can exist within teams that utilize electronic networks. Swift trust emulates and
expedites the process of developing member familiarity, and this allows a team to
perform effectively. Swift trust is especially valuable in virtual teams that are unable to
ever meet face-to-face.
How does a virtual team develop cohesion? It is more challenging for larger
groups or groups that are more geographically dispersed to establish a team identity and
collective trust. Trust in a virtual team context is usually more related to the individual’s
ability and integrity (S. L. Jarvenpaa et al., 1998). Research has emphasized the
importance of understanding how trust is first experienced psychologically within the
individual before its interactional evolution can be observed (Jones & George, 1998).
57
Studies have shown that team building activities can help in establishing a team identity
(Chudoba et al., 2005; Hackman, 1987). Such activities can take the form of non-task
interactions like social events and team building practices. Hackman (1987) identified
synergy through group exercises as a means to minimize losses from motivation and to
increase shared commitment.
For autonomous work groups, research shows that cohesiveness increases over
time, while it decreases over time for traditionally-managed teams (Cohen & Bailey,
1997). This also supports research that highlights the importance of trust in self-managed
work teams (Lawler, 1992). Previous studies observe a positive association between
cohesion and team performance (Guzzo & Dickson, 1996). Cohesion has also been
observed to improve decision-making and task participation (Guzzo & Dickson, 1996).
In speaking about virtual environments, Zakaria et al., (2004) conclude that:
“It is more often than not [that it is the] the human component in the virtual environment (and not the information and communication technologies) and the interactive relational bonds that facilitate or hinder the development of a shared knowledge base and organizational learning.”
Thus, trust is an essential quality for developing productive relationships in the
networks and virtual teams of the information age (Lipnack & Stamps, 1997). As we
mentioned in Section 2.1.2, interpersonal trust is an important indicator of team
credibility, one of the essential characteristics of TMS emergence. Trust is especially
important within diverse settings such as global virtual teams due to the reduced
interpersonal similarity and backgrounds (Mayer et al., 1995). Thus we suggest that

58
investing in group cohesion will develop interpersonal trust among team members, which
will enhance credibility within the group.
2.4.3 Division-of-Labor Strategies
Most of the research on virtual work has focused on the people aspect of
implementing global virtual teams, such as cultural assimilations, trust, leadership,
cohesion, as well as the means by which virtual teams function: collaborative technology.
Few studies have explored how these teams use what they learn about each other as well
as the tools to execute the tasks via division of labor decision-making. A key
fundamental idea of the transactive memory system is that each member within the team
possesses an expertise that he or she brings to the team. Within a virtual environment, it
can be more difficult (than in collocated teams) to determine who has what expertise and
how each person’s unique skills can best be utilized in the group project. Thus this
dissertation study will observe the strategies that teams develop to identify specific
expertise needed, who has the expertise, and divide roles and responsibilities as a virtual
group process enabler.
Researchers (Mohrman et al., 2003) have found that the utilization of systematic
processes in decision-making is an essential behavioral determinant for organizational
performance in virtual cross-functional teams. When people are brought together, it is
usual to have varying perspectives about how work should be done (Chudoba et al.,
2005). Therefore, developing a shared understanding will help group members better
identify how to best allocate tasks and will result in encountering less conflicts in the
process. Targeting group work design (rather than group norms regarding productivity)

59
is usually a better way of fostering high collective effort within a team (Hackman, 1987).
Group work design provides a clear map of direction which is essential, especially in
virtual teams.
2.4.4 Implications for CSCW and TMS
Section 2.4.1 introduced the Computer Supported Cooperative Work (CSCW)
stream of research which focuses on collaborative tools that geographically dispersed
individuals utilize to execute project tasks. TMS is characterized by the development and
utilization of a shared awareness of individual expertise within a team. From a global
virtual team perspective, the utilization of virtual tools to develop this shared mental
model as well as to carry out project components becomes significant. Thus we look
more closely at how CSCW relates to the extension of TMS in global virtual teams.
CSCW is a higher-level construct that explores the role of technology in the work
environment. It is concerned with the development and utilization of computer systems
to support cooperative work and we observe much diversity in CSCW definitions and
approaches (McCarthy, 1994). The TMS construct provides a more focused approach to
exploring the relationship between group dynamics process enablers that deal with
technology and team performance. Ackerman (2000) suggests that the CSCW literature
highlights the flexibility of information sharing, roles, and social norms and the
importance of human-computer interactions in addressing this flexibility. CSCW is not
restricted to a specific unit of analysis; however, a deeper understanding of group
dynamics and individual interaction enhances the impact of CSCW (Grudin, 1994). TMS
focuses more on group dynamics and the ability to utilize individual expertise within a

60
team, which in a global virtual setting, is enabled by collaborative tool use. Thus, we
suggest that explorations into TMS emergence in these settings will further contribute to
the CSCW literature.
2.4.5 Underlying Impact of International and Organizational Culture
In global virtual teams that are comprised of individuals from across different
countries, cultural awareness is essential in the team’s ability to effectively execute
project tasks. In this section, we address the role of culture as we explore our research
questions. Research has shown that virtual teams can perform group processes
effectively and comparably to more traditional or collocated teams (Maznevski &
Chudoba, 2000). Limited exposure to varying cultures can be a hindrance while
executing project tasks. Culture will impact how the group enablers interact with TMS
and will also affect group performance. It is essential that there also exists a shared team
understanding about group task that addresses such cultural ideals and what is expected
from a group perspective. For instance communication practices and information
systems use are influenced by culture (Straub, 1994). Zakaria et al., (2004) also specifies
that cultural differences can exist in work emphasis, deadline adherence, project
management style. They explored the role of organizational culture on global virtual
teams especially where multi-organizational teams are formed.
Hofstede (1991) defines culture as “the collective programming of the mind
which distinguishes the members of one group or category of people from another” (p.5).
Maznevski and Chudoba (2000) define culture similarly, as “the set of deep-level values
associated with societal effectiveness, shared by an identifiable group of people.”

61
Hofstede (1984) indicates that culture can differ on several dimensions, including
individualism vs. collectivism, uncertainty avoidance, power distance, and masculinity.
We look more closely at the individualism-collectivism dimension (Hofstede, 1984), as
this is a critical component of the team’s ability to develop a shared mental model.
The individualistic culture focuses on the needs, values, and goals of the
individual, which usually takes precedence over those of the group. Individuals are less
concerned with self-categorizing, less influenced by group membership, have greater
skills in entering and leaving new groups, and generally engage in more open and precise
communication than individuals from collectivist cultures. With the collectivist culture,
the needs, values, and goals of the group take priority over the individual’s. Furthermore,
individual accountability is generally affected by the cultural (individualistic vs.
collectivist) perspective; Hofstede (1984) reports that individualistic-natured people are
more ready to trust than people from collectivist cultures.
Cultural diversity has positive implications. Cohen and Bailey (1997) report that
teams with greater diversity had a more positive evaluation of their effectiveness.
Research also indicates that culturally diverse groups usually offer a high potential for
performance in complex tasks as compared to culturally homogeneous groups, but often
fail to realize the potential (Adler, 1997). However there is a learning curve associated
with working in global virtual teams; we observe that previous cultural exposure is an
important factor influencing communication (Wiseman, Hammer, & Nishida, 1989). The
next section summarizes our resulting conceptual framework.

62
2.5 Conceptual Framework and Summary
Now that we have a better understanding of the virtual environment (Section 2.2),
effective work teams (Section 2.3), and the group process enablers (Section 2.4), we
revisit the framework that we began to develop earlier in this review chapter (Figures 2-1,
2-2, and 2-4). Figure 2-5 provides the resulting conceptual framework. The illustration
includes the overarching themes of knowledge management and organizational learning,
how they are related, and the processes that affect them. The framework also relates this
higher-level scope to the more specific ideas and research questions that we address in
this dissertation.

63
Figure 2-5 Conceptual Framework

64
This chapter has discussed the literature that elucidates our group process enablers
as well as the knowledge management construct of TMS. We also reviewed the prior
research on effective group processes and the virtual environment. A prior study by
Chudoba et al. (2005) found that there was no relationship between the distribution of
members in teams and the team performance, meaning that, distance was not a hindrance
to the performance outcome. Such a study supports justification for our decision to
extend the TMS construct to virtual environments.
In summary, the literature has shown that the development of transactive memory
systems in various (mainly collocated) environments leads to improved team
performance. There are several advantages to virtual teams, as is evidenced by the
increase in their utilization; organizations must find ways to compete globally and
improving technology has allowed for enhanced cross-continental communication. On
the other hand, the essentials for TMS development are more readily present in face-to-
face teams than in virtual teams, due to the increased social interactions of members.
This dissertation will explore the dynamics of how a transactive memory system evolves
in virtual groups and intends to look closely into the enablers that we propose are
influential for TMS development in virtual environments. We use a case study format to
investigate our research questions. The targeted focus of this paper will be on virtual
teams managing technical projects; that is, project-based work that is non-routine and has
minimal work predictability. The next chapter outlines the research methodology and the
case study approaches employed.

65
Chapter 3
Research Methodology
This chapter discusses the research methods used in this dissertation. The
research format for this dissertation study was an exploratory, qualitative approach,
where we interpreted findings from multiple case studies. Researchers have identified
the case study approach as being the most appropriate method for exploring or
discovering a new area (Miles & Huberman, 1994). Specifically, exploratory studies
examine areas where prior research is minimal and where further inquiry is desired.
Furthermore, Orlikowski and Baroudi (1991) have suggested that the case study method
is the best approach for understanding interactions between information technology
related processes and organizational contexts. Research also identifies the goal of the
case studies as providing deep insights into the dynamics of processes and situations
(Orlikowski & Baroudi, 1991). These goals align with the focus of this study.
Specifically we conduct a longitudinal field study with data triangulation (Ven &
Huber, 1990), which allows us to expand our understanding of virtual group effectiveness
based on our data interpretations. In this chapter, we first present the research questions
along with the accompanying research model. Then we discuss the research approach.
Next we provide the setting and population sample for the study before describing the

66
data collection and data analysis processes employed. The section concludes with a
discussion on methodology limitations. Chapter 4 will highlight the quantitative analysis
of our comparative case studies while Chapter 5 will feature qualitative analysis that
provides insights into our observations.
3.1 Research Questions and Revised Research Model
The research model below illustrates that project performance in a virtual team
setting is influenced by both virtual group process enablers (Research Question #2) and
the transactive memory system (Research Question #3), which is characterized by
specialization, credibility, and coordination. In addition, we explore the temporal
relationship that exists between the virtual group process enablers and the transactive
memory system (Research Question #1). Our overall goal is to understand how the group
process enablers and TMS constructs interact and (independently and dependently) lead
to effective group processes.

67
Figure 3-1 Research Model
3.2 Research Approach
The case study method is ideal for observing global virtual teams in depth
because it captures the social context and dynamics of virtual teams in order to explore
how the behaviors facilitate the outcomes (Eisenhardt, 1989; Yin, 2003). A longitudinal
study methodology, which presents a quasi-‘ethnographic’ process for observing how
organizational change occurs over time, is essential for investigating and observing how
the transactive memory construct emerges based on the interaction of virtual group
process enablers and TMS characteristics in virtual teams (Van de Ven & Huber, 1990).
We observed a small number of virtual teams since it can be challenging to perform an
in-depth analysis on a larger number of teams. Because of the scrutiny involved with a
longitudinal study, this research approach emphasizes depth, not breadth. We collected
data at varying instances in time so that the processes and occurrences can be observed

68
temporally. These frequent ‘snapshots’ of the organizational groups will support the
causal relationships formed. Cohen and Bailey (1997) have stated that “more
longitudinal studies need to be done” because they are “often the best way to assess
causality.” A longitudinal analysis of observations in a small selection of teams will
provide a better in-depth understanding of the mechanisms and factors involved in TMS
development in virtual teams.
3.3 Setting and Sample
The primary source of data for this dissertation came from a graduate-level
product development course. The course, called Global Product Development (GPD),
engages participants within organized student teams composed of students from three
different countries who must work virtually between the countries, having two face-to-
face meetings. The course facilitators write in a summary article: “The realization and
acceptance of how globalization has dramatically altered the way engineers work
together inspired the creation of the Global Product Development course.” Ramesh and
Tiwana (1999) observe that most product development projects are moving towards
team-based structures since teams are believed to increase individual commitment and
performance. Thus, the GPD course provides transferrable hands-on experience and
presents a perfect setting to explore. Each GPD team operated similarly to what Guzzo
and Dickson (1996) classify as a task force. The teams were heterogeneous in function,
formed for a temporary amount of time (members disband after project completion), and
provided with a well-bounded project to complete. The teams were also autonomous or

69
self-managing; however, each team had a faculty advisor whose role was to guide the
team.
3.3.1 Setting
Although prior studies have looked at psychology or business classroom settings,
exploring engineering product development teams within a classroom is unusual. This
provides a very practical setting because it allows for controlled observation of group
interaction and performance over a defined project and period of time and enables us to
control for employee turnover or absenteeism. The teams under investigation were
project teams; this means that individuals came together to produce a one-time output
(Cohen & Bailey, 1997). Project tasks are usually high in complexity and involve
minimal routine and repetitive tasks. In summary, we observed virtual teams engaged in
technical-based projects and explore TMS emergence within these teams.
3.3.2 Sample
The institutions involved include: a national research university in South Korea, a
technically competitive university in Germany, and a large mid-western university in the
United States. We will refer to these universities as University X, University Y, and
University Z, respectively. The GPD course is offered once a year each fall and each
institution has a lead instructor or professor that facilitates the course. All three
instructors collaborated together in facilitating the course and this collaborative effort has
been studied and published. Each instructor also served as a point of contact for two or
three teams.

70
The course facilitators assign students to teams. Teams are comprised of two
participants from each country, resulting in six individuals per team. Traditionally, there
are a total of eight teams that participate in the course, and this was the case for the
session that we observed. A table that summarizes the team breakdown by participant,
university, and gender can be found in the Appendix. The teams have three months
(early September to early December) to conceive and develop a prototype of a global
product while addressing all aspects of the product development cycle, including idea
generation, concept development, and market analysis. Teams were responsible for
conducting market research and proposing a plan for large scale manufacturing,
distribution, and financing. The teams had two one-week face-to-face meetings, one at
the beginning of the term to organize the project and one at the end of the term to present
their final design products.
The course met as a global classroom twice a week for 90 minutes per session via
classroom videoconference collaboration. Thus participants from across all teams were
able to interact with each other on a regular basis and frequently used each other to pace
their progress and clarify requirements. The course also maintained a course website
where lecture notes, announcements, and assignment descriptions were made available.
The website had additional communication and storage features that teams could utilize.
Teams were also given the freedom to explore other communication options or develop
their own custom-designed tools that could enhance their project execution.
The project constraints change every year; however each team is responsible for
creating a physical prototype by the end of the term. The design projects are highly

71
knowledge-intensive and involve the development of a complex product, given the
graduate level of the participants. An additional project requirement is that the product
and its plans must be applicable to two regions of the world--with two sets of cultural
requirements that conflict. In the course session that data for this study was collected,
each team was charged with the project task of creating an internet-ready product that
enables a closed-loop economy. The project constraint provided boundaries, but still
allowed each team to be innovative and creative, which was part of the project
evaluation. Studying teams with similar structural characteristics (same constraints,
similar geographical dispersion) is ideal for observing the effectiveness of work teams
(Hackman, 1987). Although the instructors use questionnaires to carefully form balanced
teams based on technical and interpersonal skills, the instructors indicate that doing this
does not always result in successful teams because the instructors “do not gain any
insights on the behavioral aspects of the students as team members that have to interact
with cross-cultural and distributed team members” (Kim, 2006). The teams had
established breakpoints with required deliverables over the course of the term: Project
Proposal, Design Review 1 (DR1), DR2, and DR3. The number of participants, member
dispersion, task constraints, budget, and time allowance for each team were all constant.
3.4 Data Collection
Data collection was facilitated by the fact that we were in close proximity to one
of the participating universities. Students were not rewarded for participating in the
study. However, they were strongly encouraged by the course instructors to participate

72
and time was set aside during the course breakpoints (Design Reviews) for data
collection purposes. At the beginning of the course, we introduced the study to all the
participants during a class session. We explained the purpose of the study and the
requirements as participants, including the importance of consistently completing the
surveys. All participants were assured that information provided would be kept
confidential and would be used solely for the purposes of the study. They were also
assured that their final course grades would be in no way impacted by their honest
participation in the study. We employed a multi-method data collection approach that
utilized both quantitative and qualitative data to obtain insights on global virtual teams.
For this study, each team was a separate unit of analysis and data collection from
each team involved the following data triangulation sources: 1) questionnaires completed
by course participants, 2) interviews with select course participants, 3) interviews with
course facilitators, 4) classroom session observations, and 5) course/team records. The
Appendix includes the participant questionnaire, course participant interview guidelines,
instructor interview guidelines, and the consent form. The exploratory approach of the
study led to our utilization of more open-ended data collection approaches (Miles &
Huberman, 1994). Chapter 4 will go into more detail on how the data collected was
operationalized for quantitative analysis.
3.4.1 Participant Questionnaire
Three separate surveys were administered to all 48 course participants at three
different instances during the course. These natural data collection breakpoints occurred
at the three Design Review (DR) presentations, which was ideal because time was set

73
aside by the instructors for the students to complete the questionnaires. Despite the
convenience of online surveys for virtual teams, a prior attempt (during a pilot study) at
using online surveys led to significantly lower response rates so we opted for physical
administration of the questionnaires. The questionnaire allowed participants to provide
self assessments. It included questions relating to the effective group processes -
communication effectiveness (virtual communication and F2F meetings), investment in
team cohesion, and division-of-labor strategy (Lurey & Raisinghani, 2001). The
questionnaire also included scales that measured TMS characteristics (specialization,
credibility, and coordination) and effective group performance. These questionnaires
focused on the team’s ability to successfully execute project tasks and addressed time
management, design review goal outcomes, and smooth and efficient task execution.
These quantitative evaluations were based on scales developed by Lewis (2003; 2004).
See the TMS Measurement Tool section below for more information on the scale. The
TMS scale (2003) was validated both in the field and within the laboratory and the
performance scale was based on prior studies. Both of these measurement scales use a 5-
point Likert scale (1 = strongly disagree, 2 = disagree, 3 = neutral, 4 = agree, 5 =
strongly agree). The Participant Survey response rate can be found in Table 3-1 below.
In analyzing the survey data, we evaluated variables for data collection instances
that had a 50% minimum response rate; that is, instances where at least three of the six
participants on the team had responded to the surveys. There was no Survey 1 data
available for Team 5 because none of the Team 5 participants were able to complete the
survey. In addition, only two of the participants from Teams 6 and 8 responded to

74
specific Survey 1 questions that focused on the TMS characteristics (Specialization,
Credibility, and Coordination). Therefore, the TMS analysis for Survey 1 does not
include analysis results for Teams 5, 6, and 8. For our data analysis, we used team
averages of the participants who responded. This is discussed in more detail in Chapter
4. Also, we observe that Survey 3 has the best response rate and thus might be viewed as
the most reliable survey.
TEAM Response Percentage
Survey 1 Survey 2 Survey 3
1 100% 100% 100%
2 100% 100% 100%
3 67% 83% 100%
4 83% 100% 100%
5 0% 100% 83%
6 50% 83% 100%
7 67% 67% 100%
8 50% 83% 100%
Table 3-1 Participant Questionnaire Response Rating
TMS Measurement Tool
The previous chapter discussed the breakdown of TMS into three factors:
specialization, credibility, and coordination. Past measures of transactive memory
systems have included self-assessment by members of their areas of expertise, and
memory recall, which was used mainly on dyads. The TMS component of this

75
questionnaire was based on a prior validated TMS measurement scale (Lewis, 2003). We
used a modified version of the TMS scale to fit our study (see Appendix). Alpha
reliabilities for the specialization, credibility, and coordination subscales are 0.79, 0.90,
and 0.68, respectively. The reliability for the entire TMS scale is 0.88, which suggests
that our modified measurement scale is internally consistent.
3.4.2 Select Participant Interviews
Semi-structured interviews were conducted with participants from each team from
the American university, called University Z (two of the six members). These
participants can be considered key informants for the team since they allow for a subset
of individuals to provide information on organizational or team processes based on their
positions (Bagozzi et al., 1991). We were confident in using these individuals as key
informants since they were close to the main course instructors and tended to play
stronger leadership roles. Four rounds of interviews were conducted with the same
participants, with each interview session occurring shortly after a project deadline (initial
Project Proposal and three Design Reviews). The interview guide was comprised of a
series of open-ended guiding questions that covered a variety of discussion topics (see
Table 3-2), focusing on the role of the effective group process enablers. Table 3-2 also
shows participation level for each team in each interview session. The interviews were
tape recorded and transcribed and usually lasted about 15-20 minutes for each participant
in each of the sessions.

76
Table 3-2 Participant Summary for Participant Interviews
3.4.3 Course Instructor Questionnaires
Information on each team was acquired primarily through course participant self-
reports, with the exception of instructor assessments of performance. Although they
interacted closely with the teams as facilitators, they could simultaneously provide an
“external” perspective of the team’s progress. Therefore, we also administered a
questionnaire that focused on the participants’ performance to the instructors. Similarly
to the students’ assessments of their performance, these questionnaires addressed the
team’s ability to successfully execute project tasks. The professors were asked to
evaluate teams based on amount of rework, time management, design review goal
outcomes, and smooth and efficient task execution. The questionnaires were
administered at the same time that the course participants’ questionnaires were also
administered: during the three design reviews. The performance effectiveness
INTERVIEW SESSION
TARGET CATEGORY (DISCUSSION TOPICS)
TEAM PARTICIPATION DETAIL
Session 1: Post Project Proposal
Team Introduction, Project Proposal, Upcoming F2F
• 2 participants: Teams 1, 5 • 1 participant: Team 2, 3, 8 • 0 participants: 4, 6, 7
Session 2: Post DR1 Team Cohesion, F2F Experience, DR1, Next Steps
• 2 participants: Teams 2, 3, 4, 5, 6, 7, 8
• 1 participant: Team 1 Session 3: Post DR2 Team Cohesion, DR2,
Upcoming F2F • 2 participants: Teams 1-7 • 0 participants: Team 8
Session 4: Post DR3 Team Cohesion, DR3, F2F Experience, Reflections
• 2 participants: Teams 3, 4, 5 • 1 participant: Team 2, 6, 7, 8 • 0 participants: Team 1
77
measurement scale uses a 5-point scale (1 = worst, 5 = best). The questionnaire can be
found in the Appendix.
The facilitator from the Asian University did not complete the surveys and the
facilitator from the European University partially completed two of the three surveys.
Both of these instructors stated that they could not provide any more insights based on
their knowledge of the teams. The third facilitator from the U.S. University completed
all three surveys. I also had an opportunity to conduct a follow-up open-ended interview
with the course instructor of the U.S. University after the course was done. We felt
comfortable using information from the instructor of the U.S. University because he had
in-depth knowledge of all teams involved. Furthermore, based on the participant
interviews, it was determined that most of the teams sought out this instructor’s advice
and guidance during the course of the project for clarity and reduced ambiguity. This
practice contributed to his knowledge of all teams and justified the other instructors’
claims of not being knowledgeable enough to provide additional information.
3.4.4 Classroom Session Observations
The global product development class met concurrently as a group twice a week
using video-conferencing technology. Because of the time zone differences, the
concurrent class session held at 8am at University Z, at 2pm at University Y, and at 10pm
at University X. During each session, the course facilitators as well as guest lecturers
addressed different topics of the product development cycle that related to the present
stage that the teams were going through. We attended these class sessions had the
opportunity to interact with the course participants and instructor from University Z. We

78
were also able to observe participation and engagement from all team members and
recorded occurrences, impressions, and key observations.
3.4.5 Course/Team Records
The instructors allowed us to receive access to the course website and also
provided material that was distributed to participants such as lecture plans, project
description, and Design Review guidelines. Furthermore the course faculty had written a
paper on the collaboration specifics involved in teaching the course that was also
provided to us. We also repeatedly requested that participants send us copies of any
communication exchanges that occurred: instant messenger chat sessions, email
exchanges, etc. Thus, we received two email conversations from Team 6 and one chat
session from Teams 1 and 8.
The teams also had weekly 30 minute video-conference sessions. Unfortunately,
restrictions prevented me from recording and analyzing these sessions. As mentioned
earlier, the teams also met face-to-face twice during the term for week-long meetings.
During Design Review 1 (DR1), all participants gathered together at University X and at
DR3, all participants assembled at University Y for the final presentation. Funding
limitations also prevented me from physically observing the two F2F meetings.
3.5 Measurement
Our unit of analysis was the team. Since we had collected our data at the
individual level, we needed to aggregate the individual data to the team level. The

79
following sections details how this was accomplished for all the constructs that we
measured.
Group Process Enablers
Chapter 3 discusses the data collection measures employed in the primary GPD
case study explored in this dissertation. Table 3-3 summarizes the measurements for the
group process enablers: Virtual Communication, F2F Meetings, Cohesion Investment,
and Division-of-Labor Strategies. Explanations of each variable measured can be found
in the literature review chapter (Chapter 2). We used a variety of data collection methods
(last column) to determine how we defined each variable. Based on the definition of each
variable, we used the data collected to assign a corresponding rating to each team (see
Category column) to facilitate our qualitative analysis. Strauss and Corbin (1998)
suggest that a rating system can be used to facilitate comparisons. Our ratings address
both variation in scores and variation in member rating. A team’s variable was rated as
High if the team exhibited high levels of the variable measurement and/or if there was a
general agreement across all team members that reflected a positive demonstration of the
variable (we discuss the aggregation of individual ratings into a team rating in the next
section). The Medium rating was assigned when members’ ratings reflected a medium
consensus rating or when there was lack of agreement in variable demonstration. For
instance, if a team of six members had the following rating outputs (on a scale of 1-10):
10, 2, 9, 3, 9, 4, then the team was assigned a Medium rating for that particular variable.
A team was assigned a Low rating when the individual ratings collectively reflected

80
minimal demonstration of the variable. When team ratings were questionable, we
reviewed the qualitative data available to assist in categorizing the variable. We also
relied on the impressions of the researcher who had in-depth knowledge and familiarity
with each team, an approach supported by Miles and Huberman (1994, p. 189). Lastly,
we were able to verify these classifications with the faculty advisor from University Z
who also had in-depth knowledge of each team.
Variable Definition / Measurement
Categories Method
Collaborative Technology (Virtual Communication)
Team preference for collaboration tools (determined by Likert scale), team tool consensus, communication frequency
Ratings: Low = 1, Medium = 2, High = 3
Self-report surveys, participant interview, instructor surveys/interview
Face-to-Face Meetings
Team use of F2F meetings: reliance on F2F meetings, conflict resolution, brainstorming
Ratings: Low = 1, Medium = 2, High = 3
Self-report surveys, participant interview, instructor surveys/interview
Investment in Group Cohesion
Team camaraderie, trust-building, decision-making
Ratings: Low = 1, Medium = 2, High = 3
Self-report surveys, participant interview, instructor surveys/interview
Division of Labor Strategies
Task interdependence, task/role allocation, project management, time management
Ratings: Low = 1, Medium = 2, High = 3
Self-report surveys, participant interview, instructor surveys/interview
Table 3-3 Measurements of Group Process Enablers
Transactive Memory System
We provided an in-depth explanation on how the TMS construct is measured in
Section 3.4.1. The TMS scale that we used was based on the scale measurement created

81
by Lewis (2003). Thus our data collection resulted in separate TMS characteristics
(Specialization, Credibility, and Coordination) ratings for each individual on each team.
Lewis (2003) provides both conceptual and statistical justifications for aggregating the
individual ratings to the team level. We decided to aggregate scores is instances where
there was an ideal representation of the team (at least three members) that provided data.
We then explored whether we could aggregate the individual ratings of the TMS
characteristics (specialization, credibility, and coordination) into a single consolidated
TMS value. Conceptually, the fundamental definition of TMS suggests that the three
characteristics interact with each other to impact TMS emergence. Michinov and
Michinov (2009) have explored the relationship between these three characteristics of
TMS and team performance in student groups. Higher individual ratings and team
ratings for all three characteristics suggest a strong TMS presence and vice versa. We
also created visual representations (scatter plots) of the teams’ ratings for the TMS
characteristics to observe any pattern coordination among the characteristics (see Figure
3-2). The charts indicate that the relationships among the TMS characteristics -
specialization, credibility, and coordination - are complimentary for most of the teams.
Specifically, we observe that the relationship patterns among the characteristics
strengthened over the course of the project, from Survey 1 to Survey 3. Our goal is to
identify any similar patterns/correlations among the three TMS characteristics that would
justify aggregating the scores into a single TMS score for each team. After comparing
the three individual characteristics with each other, we observe that there is a positive
correlation between the individual characteristics which supports our decision to

82
aggregate them into one TMS rating instead of three. As was done with the individual-
level to team-level aggregation, we calculated team averages of all the three
characteristics and used this as the single TMS score for each team.

83
Figure 3-2 Team Ratings for TMS Characteristics
Effective Group Performance
We had two separate evaluations for effective group performance: the instructors’
assessment of the students’ performances and the participants’ self-assessment of their
own performances. More detail on the instructor surveys can be found in Section 3.4.
Because we were using performance information from one instructor, we were able to
average the ratings from the performance effectiveness questions to arrive at one
performance rating for each team for each of the surveys. Similarly to the TMS
construct, the participants’ effective group performance evaluation utilized prior survey
questions on performance from Lewis (2004) that addressed product and process
performance. These performance questions were administered during each of the
surveys, and individual ratings were also averaged similarly to the TMS ratings. In the
discussion section, we address implications for variations in both performance
84
perspectives. The measurement summary tables for all eight teams that were observed in
the GPD study can be found in the Appendix.
3.6 Data Analysis
Due to the novel nature of the study, we employ an interpretive approach in
exploring the dissertation research questions. It is an exploratory study based on a small
number of cases, with the goal of an exploratory study being the development of ideas for
further study (Yin, 2003). We do not test any hypothesis; rather, we are investigating
relationships. We utilized a thematic and analytic manipulation approach to conduct a
comparative analysis among all the cases as well as explore relationships (Miles &
Huberman, 1994; Yin, 2003). We consider the interplay between quantitative and
qualitative methods in addressing our research questions (Strauss & Corbin, 1998).
Chapter 4 goes into more detail on the quantitative analysis and Chapter 5 presents our
qualitative analysis.
All of the data collected as described in Section 3.4 were recorded and
transcribed. Each team had a collection of longitudinal questionnaires and interviews, as
well as observations and conversation files (where available). Following Strauss and
Corbin’s (1998) suggestion for an interpretive analysis, we conducted a microanalysis of
all the teams or cases. That is, we performed a detailed examination and review of all the
data for each case to discover categories. Miles and Huberman (1994) suggest the use of
data displays to organize the information visually. Thus, we organized all cases side by

85
side for all of the data collection instances and methods. Yin (2003) refers to this as
cross-case synthesizing, which is ideal for studying multiple cases.
Next we used coding to conduct theoretical comparisons (Strauss & Corbin,
1998). Analyzing qualitative data with coding involves continuous comparative analysis.
Because of the smaller number of multiple cases, we opted not to use qualitative analysis
software and we manually conducted the coding. We conducted line-by-line analysis,
paragraph/sentence, and entire document coding on the data. Since we were investigating
relationships between effective group processes, TMS, and performance (as indicated by
our research questions), we coded for occurrences of each variable in these constructs.
Specifically, we used the thematic coding approach where we evaluated the multiple
cases (or teams) based on pre-determined themes (Flick, 2002).
The coding procedure involved the following iterative steps: open coding and
axial coding (Strauss & Corbin, 1998). We continuously broke apart and extracted the
data and then reorganized the data into predetermined categories as well as emerging
categories. We found all instances of categorical themes from the information collected.
We then found common constructs that were supported by the findings. Then all the data
was laid out and observed for patterns and occurrences of similarities and differences
related to the common constructs. This iterative process, which was done for all cases,
continued based on developing concepts (Yin, 2003).
To help facilitate and organize this process, we used word tables, matrices,
frameworks, and conceptual diagrams as suggested by Miles and Huberman (1994) to

86
conduct the cross-case analysis and illustrate relationships and concepts. Table 3-3
illustrates the various analyses that we conducted in presenting our coding summaries.
Analysis Method Description Word Table We recorded detailed occurrences of each category variable
for each team. We used a uniform framework to display the information from individual cases (Yin, 2003).
Time-Oriented Display
We summarized the information in the Word Tables by creating a chronological evaluation of the group process enablers for each case (Miles & Huberman, 1994).
Case-Ordered Display We further summarized the Time-Oriented Display into higher-level categories of High, Medium, and Low outcomes for the group process enablers (Miles & Huberman, 1994).
Thematic Conceptual Matrix
We identified occurrences of thematic categories for the virtual group process enablers (Miles & Huberman, 1994).
Table 3-4 Cross-case Analysis Methods
We drew conclusions by comparing similar displays for each team. This enabled
us to develop naturalistic generalizations, group the cases into subsets, and evaluate
temporal occurrences and causal relationships (Miles & Huberman, 1994; Yin, 2003).
By conducting a thematic analysis that enabled us to focus on a few key issues or
categories, we were able to better understand the complexity of the cases (Creswell,
2007).
For the questionnaire data, we computed team-level scores for the group process
enablers, TMS, and performance scales. The TMS and performance constructs were
evaluated using Likert scales, which facilitated their operationalization. Specifics about
the construct measurement approaches, including the quantification of the group process
enablers are discussed in Chapter 4, which details the quantitative analysis of the

87
comparative cases. The quantitative analysis is not testing any hypotheses; rather, it is
numerically and graphically illustrating our observations from our cross-case analysis.
3.7 Limitations and Challenges
In conducting a qualitative study, the validity of the study must be addressed.
Research has identified the following criteria as being essential for a trustworthy
qualitative study: credibility, dependability, and transferability (Bradley, 1993). To
address the credibility component, we discuss the source of our data. We utilize a well-
established course that has been offered for several years. The initial execution obstacles
have been addressed and modifications to improve the course occur each year based on
feedback from students, the instructors’ experiences, funding resources, and
technological advancements. Hackman (1987) offers justification for the use of
laboratory research. He explains that laboratory research can lead to powerful
conceptualizations, including organizational phenomena, when it is appropriately
conceived and executed.
To address the concern of biased data, although we collect data at the individual
level, our unit of analysis is the team so data for each team was aggregated from the
individual level. Chapter 4 discusses this in more detail. Thus information on each team
came from multiple participants and perspectives, including the instructor’s as well as our
observations. Furthermore, at the conclusion of the course, we reviewed our data with
the lead instructor from University Z, who was familiar with all teams and could identify
discrepancies or extraneous data.

88
The variation in our data collection methods ensures the dependability of this
study. The data triangulation enhanced the design validity of data and analysis. The
interviews utilized an active listening method, where responses were repeated to ascertain
understanding. This increased the interview data quality. In addition, we transcribed
verbatim accounts of electronically recorded data to minimize actual data variation
(Strauss & Corbin, 1998). Also, previously validated survey tools served as a reference
for our data collection.
Transferability, or external validity, analyzes how strongly the causal
relationships can be generalized to various populations of persons, settings, and times
(Cook & Campbell, 1979). The situation being observed (laboratory virtual teams) is
quite specific and unique. However, our findings from our analyses can be generalized to
organizational teams. Researchers state that multiple case studies and cross-case analyses
enhance generalizability and deepen understanding and explanation (Miles & Huberman,
1994).
As discussed earlier, the GPD teams are geographically dispersed and assembled
solely for project execution, similarly to industry virtual project teams. Thus they must
utilize virtual communication tools to overcome communication limitations and physical
separation. Just as industry virtual team members are concurrently engaged in several
other projects, GPD participants are also involved in other courses (and sometimes
industry work as well), many of which also involve group work, given the strong
engineering focus. Thus, participants must be able to balance the GPD course with other

89
obligations, similarly to industry team members balancing tasks within both collocated
and dispersed teams.
Generalizing laboratory studies to an organizational context means that variables
such as group task, experimenter-subject relationships, reward-system properties, and the
demand characteristics of the setting where the research takes place should be controlled
for (Hackman, 1987). Our study sample is ideal because it meets these criteria. All eight
cases had equal task constraints and course expectations and although autonomous, they
reported to an authority figure. Furthermore, we maintained a similar relationship across
all cases. This minimized the impact that these variables had on the phenomena that we
were studying and allowed us to focus on the research questions (Hackman, 1987). Both
organizational teams and our case study teams have motivation incentives, such as job
security/tangible performance acknowledgement and course grade and global virtual
team experience, respectively.
The GPD course is a graduate-level course; thus participants are experienced and
some even have part- or full-time industry work experience. Thus, the GPD tasks are
highly complex and generalizable to industry-type tasks being performed in an
increasingly globalized innovative society. A previous GPD participant recalls of his
classroom experience:
As a part time student and full time manager of Fire Prevention and Protection for General Motors Global Security, I can vouch for the impact this type of course will have by educating students and giving us real world experience in being a part of a global team.

90
Acquiring 100% involvement from course participants was a challenge. Virtually
all of the participants involved in the course were also taking other courses and had other
obligations, which affected the amount of time that they were available for interviews.
Also since none of the participants were receiving any reimbursements for participating
in this research, there was no tangible motivating factor that encouraged them to
participate. Participation improved over the course of the project but declined again at
the end of the project, due in large part to the mounting end-term pressure from the GPD
course as well as other courses. Many participants were also completing their studies and
were concurrently exploring career opportunities. Our data triangulation strategy was
useful in this situation because we were able to utilize different sources to evaluate each
case, whenever data was missing.
3.8 Summary
In summary, this study employed an interpretive case-study approach to explore
the dissertation research questions. We utilized an established global product
development course to investigate the relational interaction between virtual group process
enablers, TMS, and effective group performance. The next chapters discuss our
quantitative and qualitative analyses of the comparative case studies.

91
Chapter 4
Comparative Case Studies: Quantitative Analysis
4.1 Problem Statement
This chapter focuses on the quantitative data across work groups and time.
Globalization in today’s society has resulted in an increase in the utilization of both
virtual and global virtual teams in the execution of organizational work. With a very
small sample size the quantitative analysis cannot be viewed as more than suggestive.
The focus is on bi-variate associations and we make no claim of proving causality.
Specifically, we investigate how the TMS construct is related to virtual group process
enablers (Research Question #1), how the virtual group process enablers are related with
team performance (Research Question #2), and also how the TMS construct relates to
team performance (Research Question #3). See Figure 4-1 for our research model and
research questions.

92
VIRTUAL GROUP PROCESS ENABLERS
COMMUNICATION EFFECTIVENESS
Collaborative technologyFace-to-face meetings
INVESTMENT IN GROUP COHESION
DIVISION OF LABOR STRATEGIES
TRANSACTIVE MEMORY SYSTEM
SPECIALIZATION
CREDIBILITY
COORDINATION
? EFFECTIVE GROUP PERFORMANCE
Research Question #1
Research Question #2
Research Question #3
Figure 4-1 Research Model
4.1.1 Class Project Background
As detailed in Chapter 3, we had the opportunity to utilize a global product
development (GPD) course as the sample focus for this dissertation. Information on
virtual group processes, TMS characteristics, and performance was collected from
participants in the collaborative GPD graduate engineering course that involved three
educational institutions dispersed across the globe (University X, University Y, and
University Z). The course had 48 total participants, 16 from each institution. Table 4-1
lists the approaches employed by the different universities in selecting course
participants. The course was offered within the mechanical or electrical engineering
department at each university. Although many of the participants that enrolled in the
course came from these engineering backgrounds, many others had other areas of
academic expertise, such as business, art, or other engineering fields. The course
facilitators (one main facilitator from each institution) worked collectively to assemble
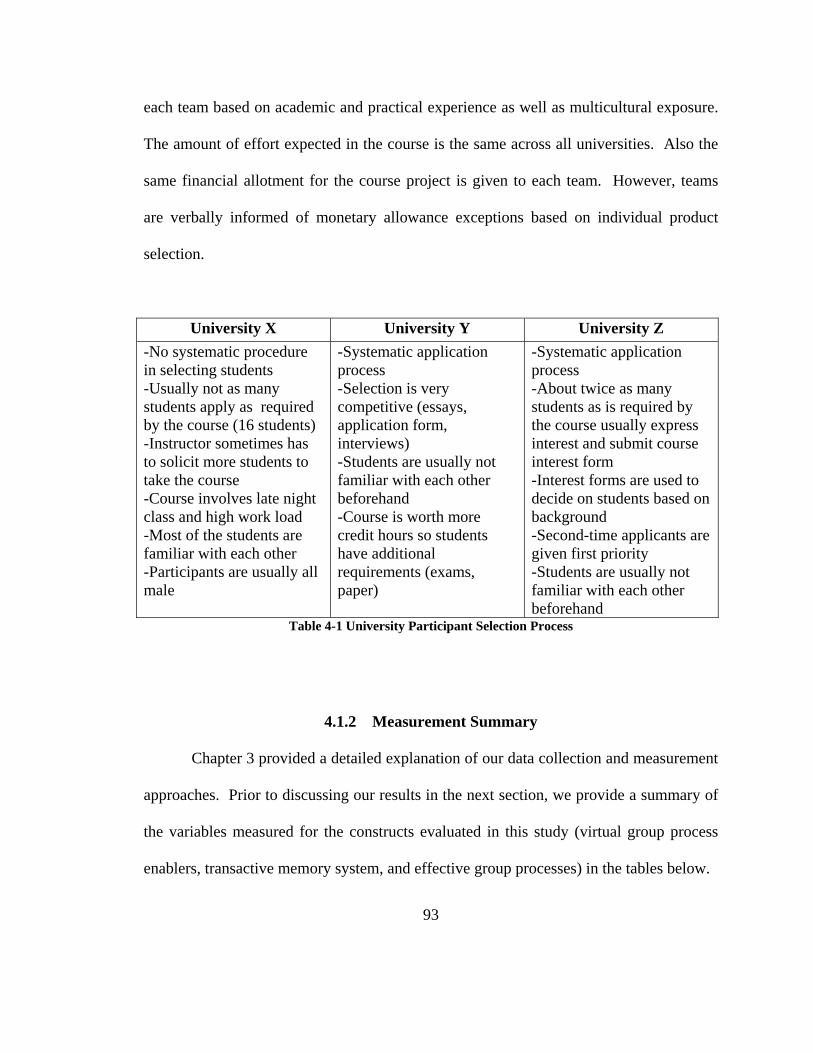
93
each team based on academic and practical experience as well as multicultural exposure.
The amount of effort expected in the course is the same across all universities. Also the
same financial allotment for the course project is given to each team. However, teams
are verbally informed of monetary allowance exceptions based on individual product
selection.
University X University Y University Z -No systematic procedure in selecting students -Usually not as many students apply as required by the course (16 students) -Instructor sometimes has to solicit more students to take the course -Course involves late night class and high work load -Most of the students are familiar with each other -Participants are usually all male
-Systematic application process -Selection is very competitive (essays, application form, interviews) -Students are usually not familiar with each other beforehand -Course is worth more credit hours so students have additional requirements (exams, paper)
-Systematic application process -About twice as many students as is required by the course usually express interest and submit course interest form -Interest forms are used to decide on students based on background -Second-time applicants are given first priority -Students are usually not familiar with each other beforehand
Table 4-1 University Participant Selection Process
4.1.2 Measurement Summary
Chapter 3 provided a detailed explanation of our data collection and measurement
approaches. Prior to discussing our results in the next section, we provide a summary of
the variables measured for the constructs evaluated in this study (virtual group process
enablers, transactive memory system, and effective group processes) in the tables below.

94
Variable Definition / Measurement
Categories Method
Collaborative Technology (Virtual Communication)
Team preference for collaboration tools (determined by Likert scale), communication frequency
Ratings: Low = 1, Medium = 2, High = 3
Self-report surveys, participant interview, instructor surveys/interview
Face-to-Face Meetings
Team use of F2F meetings: reliance on F2F meetings, conflict resolution, brainstorming
Ratings: Low = 1, Medium = 2, High = 3
Self-report surveys, participant interview, instructor surveys/interview
Investment in Group Cohesion
Team building effort, trust-building, decision-making
Ratings: Low = 1, Medium = 2, High = 3
Self-report surveys, participant interview, instructor surveys/interview
Division of Labor Strategies
Task interdependence, task/role allocation, project management, time management
Ratings: Low = 1, Medium = 2, High = 3
Self-report surveys, participant interview, instructor surveys/interview
Table 4-2 Measurements of Virtual Group Process Enablers
Construct Definition / Measurement
Categories Method
Transactive Memory System (TMS)
Team awareness and utilization of individual expertise characterized and measured by Specialization, Credibility, Coordination
Ratings: Likert Scale: 1 (Lowest) to 5 (Highest)
Self-report surveys, participant interviews focusing on TMS characteristics
Table 4-3 Measurement of Transactive Memory System
Variable Definition / Measurement
Categories Method
Self-Assessment of Student Performance
Team’s ability to execute project tasks measured by minimal rework, time management, design review goal outcomes, smooth and efficient task execution
Ratings: Likert Scale: 1 (Lowest) to 5 (Highest)
Self-report surveys, participant interview
Professor Assessment of Student Performance
Ratings: Likert Scale: 1 (Lowest) to 5 (Highest)
Instructor surveys/interview

95
Table 4-4 Measurements of Participant- and Professor-Assessed Team Performance
4.2 Results
4.2.1 Relationships between Enablers, TMS, and Team Performance
Chapter 3 describes how the variables were measured. Each team was evaluated
at three instances during the semester. (We conducted four waves of participant
interviews but the first set of interviews (Project Proposal) served as a pilot run and was
not included in the analysis.) However, since we were looking at static bi-variate
associations, three waves times the number of variables investigated was simply too
many to consider with only eight teams. Thus we decided to collapse the analysis to a
single time point. We considered averaging our data for the entire course or using Time
3 data. We suspected, and looking at scatter plots confirmed, that the relationships would
be weaker early in the semester. As the semester started, the groups were finding their
way and we reasoned that the crystallized TMS and group process enabler strength at
Time 3 would be mature. Thus they would have the biggest impact on the team’s
outcome at this time. Time 3 is the current state of the TMS at the last stages of
completion of the project. Furthermore, the team’s deliverable at this time point is what
is ultimately used in evaluating how well the team was able to perform (in terms of the
professor’s overall evaluation and the final team grade); earlier semester performances
have little impact on the team’s final evaluation. In considering whether or not we should
average the scores over the course of the semester, we looked at the amount of variation

96
in the average TMS scores and found very little variation in the average scores among
seven of the eight teams. There was greater variation by Time 2 so we focused much of
the analysis on Time 3 data. However we still consider the entire course duration (and
not only Time 3) in our analysis.
Since the measures were ordinal and the sample size was small, we used the Time
3 data to run Spearman (non-parametric) correlations between the enablers, TMS, and
performance evaluations. Table 4-5 highlights our results. Significant correlations (2-
tailed) at the 0.01 level are indicated by **. Significant correlations (2-tailed) at the 0.05
level are indicated by *. We also created scatter plot graphs illustrating the relationships
between virtual group process enablers, TMS, and team performance. All Spearman
correlation tables are available in the Appendix.

97
Virtual Group Process Enabler
TMS Student-Assessed Performance
Professor-Assessed Performance
Virtual Communication
0.497 0.722* 0.765*
Face-to-Face Meetings
0.409 0.761* 0.693
Cohesion Investment
0.073 0.026 0.568
Division of Labor
0.191 0.570 0.765*
Performance Student-Assessed Performance
0.685 N/A N/A
Professor-Assessed Performance
-0.128 N/A N/A
Table 4-5 Spearman Bi-variate Correlations for GPD teams at Time 3
To our surprise, despite the small sample size of eight there were a number of
significant correlations, notably between Virtual Communication and performance and
between Face-to-Face meetings and performance. However, none of the virtual group
process enablers were significantly related to TMS (Research Question #1) as shown by
the correlations highlighted in yellow. It is not surprising that with a sample size of eight
we would find an inconsistent pattern of correlations. To investigate this further we
created scatter plot graphs depicting the relationships between virtual group process
enablers and TMS. In looking at the graphs, we made the following observations: 1) the
correlation between the Virtual Communication enabler (or collaborative technology use)
and TMS is the only reasonably observable correlation (0.435), and 2) in the Virtual

98
Communication-TMS scatter plot (Figure 4-2), the teams can be observed to be clustered
into sub-categories that we identify as: Weak (Teams 1 and 6), Medium (Team 2), Strong
(Teams 4, 5, and 6), and Outliers (Teams 3 and 7). See Figure 4-2 for an illustration of
this.
Figure 4-2 Time 3 Scatter Plot Graph for GPD Teams
Outliers are particularly problematic with such a small sample. When we remove
the two “outliers,” the correlations are stronger and there is clearer differentiation
between the better-performing teams and the weaker-performing teams. Team 3 is the
biggest outlier in this and many other scatter plot graphs of variables. When we looked
more carefully at Team 3 we find that the members rated themselves highly for all
enablers. We also found that they self-rated their performance as the best in the course
and they received the worst grade by the instructor. There was clearly some type of bias
WEAK
STRONG
MEDIUM
OUTLIERS

99
among this group, or perhaps they were not taking the study seriously and simply inflated
all of their ratings of themselves. Consequently, we removed Team 3 from subsequent
quantitative analysis (see Table 4-6).
Virtual Group Process Enabler
TMS Student-Assessed Performance
Professor-Assessed Performance
Virtual Communication
0.674 0.953** 0.839*
Face-to-Face Meetings
0.441 0.874* 0.874*
Cohesion Investment
0.216 0.156 0.525
Division of Labor
0.236 0.701 0.895**
Performance Student-Assessed Performance
0.523 N/A N/A
Professor-Assessed Performance
0.211 N/A N/A
Table 4-6 Spearman Bi-variate Correlations for GPD Teams (Team 3 removed)
After removing Team 3 from consideration, we observe a slight increase in the
correlations between the virtual group process enablers and TMS (highlighted in yellow),
but little difference in the correlations between TMS and performance evaluations
(highlighted in green). There were slight increases in the correlations between the virtual
group process enablers and performance, with face-to-face meetings and professor
assessment now statistically significant. When we looked again at the scatter plots, we
noted that, in addition to Team 3, Team 7 consistently stands out as deviating from the

100
regression pattern. Thus we ran the Spearman correlations without both Outliers (Teams
3 and 7) and Table 4-7 shows the results.
Virtual Group Process Enabler
TMS Student Performance
Professor Performance
Virtual Communication
0.877* 0.939** 0.892*
Face-to-Face Meetings
0.792 0.891* 0.891*
Cohesion Investment
0.376 0.063 0.391
Division of Labor
0.642 0.751 0.892*
Performance Student Performance
0.735 N/A N/A
Professor Performance
0.574 N/A N/A
Table 4-7 Spearman Bi-variate Correlations for GPD Teams (Teams 3 and 7 removed)
We observe an improvement in most of the correlations, with some of the
improvements being significant. For instance, the correlation between the
communication effectiveness enablers (Virtual Communication and F2F Meeting) and
TMS improved considerably (highlighted in yellow). In looking at the linear regression
for these relationships, we also observe an improvement in the regression between
Virtual Communication and TMS (from 0.655 to 0.867) and between F2F meetings and
TMS (from 0.273 to 0.636). Thus we omit Teams 3 and 7 as we proceed with our cross-
case analysis. In addition to observing stronger correlations after we removed the
Outliers, all virtual group enablers except Cohesion Investment remained enablers of

101
interest. As can be seen from Table 4-7, there was a consistent pattern of significance
correlations between the other enablers (Virtual Communication, Face-to-Face Meetings,
and Division-of-Labor Strategies) and TMS as well as between these enablers and
performance; correlations between Cohesion Investment and TMS as well as between
Cohesion Investment and performance remained weak. After removing the Outliers, we
also observe a clear delineation between the stronger-performing teams (Teams 4, 5, and
8) and the weaker-performing teams (Teams 1, 2, and 6). We discuss more about the
classification of these teams in Chapter 5.
4.2.2 Communication Effectiveness
After removing Teams 3 and 7 from consideration, we also observed a notable
change in the relationship between the two communication effectiveness enablers, Virtual
Communication and F2F Meetings, as the semester progressed. Table 4-8 shows this
correlation at Time 1 and Time 3 (there was no F2F meeting during Time 2). These
figures suggest a progressive change in the roles of these communication effectiveness
enablers.
Time 1 Time 2 Time 3
-0.707 N/A (No F2F meeting) 0.949**
Table 4-8 Spearman Bi-variate Correlations between Virtual Communication and F2F
One case that exemplified this is Team 1. This team had minimal collaborative
technology use prior to the first F2F meeting. They relied heavily on the first F2F
meeting, which occurred three weeks into the course, to determine specific roles and

102
make significant progress on the project. Prior to this meeting, the team had not
accomplished much compared to other teams, and they were aware of this. To their
benefit, this approach of heavily relying on the first F2F meeting worked in their favor,
and Team 1 had the best DR1 performance of all the teams. We surmise that the team
members were able to effectively utilize the first F2F meeting to overcome their lack of
initial virtual communication. Consequently, we speculate that this led to a false sense of
security and continuous minimal investment in their collaborative technology use over
the course of the project. After the second Design Review, our data indicates that Team 1
was still one of the stronger-performing teams, and the team members indicated that they
tried to use the success of Design Review 1 as a catalyst in moving forward. However
we observed only a slight improvement in virtual communication practices, compared to
pre-DR1 communication practices, as member absenteeism during meetings became a
recurring incident.
Prior to the second and final F2F meeting, the members appeared to approach the
last project phase (Design Review 3) with a similar mentality as they did with the first
F2F meeting. The outcome is that the team was unable to utilize the second F2F meeting
to address the gaps in the team’s virtual communication practices that appeared to have
been prevalent during the course. The team’s inability to transition from a “substitution-
like” relationship between the communication effectiveness enablers to a
“complimentary” one ultimately impacted its performance. In summary, we observed a
transition of Team 1 from the best-performing team at DR1 to one of the worst-
performing teams at the conclusion of the project. At Time 1 when the communication
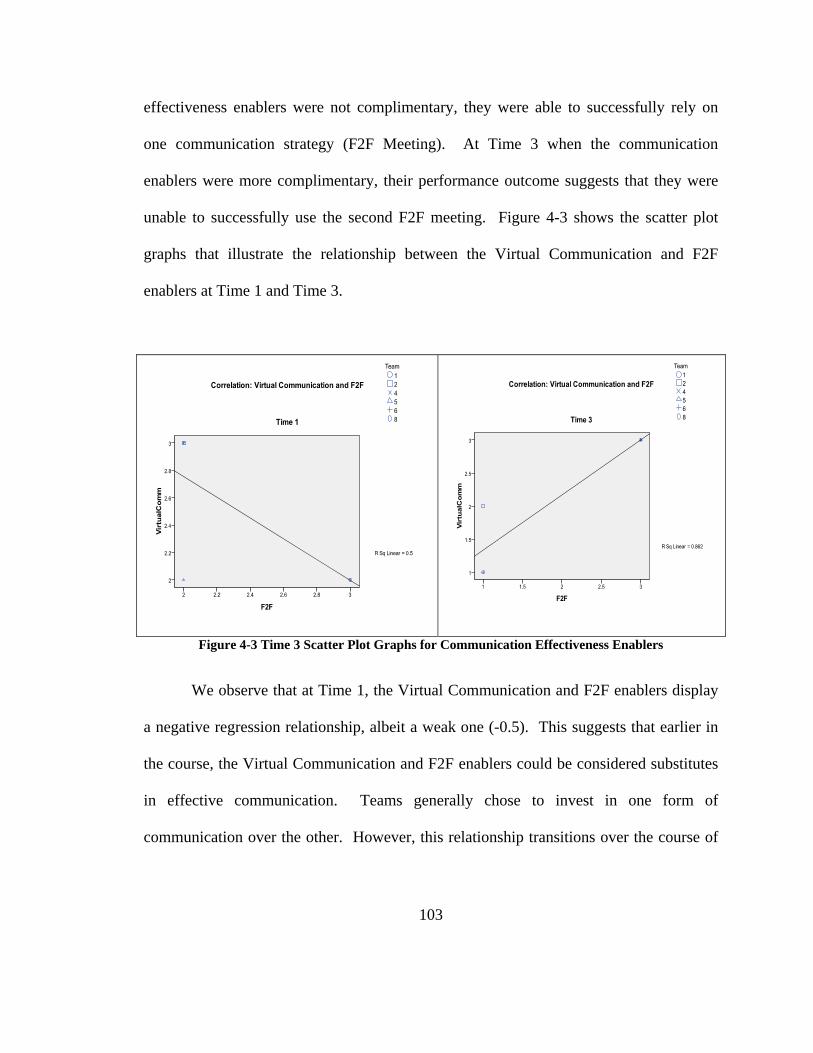
103
effectiveness enablers were not complimentary, they were able to successfully rely on
one communication strategy (F2F Meeting). At Time 3 when the communication
enablers were more complimentary, their performance outcome suggests that they were
unable to successfully use the second F2F meeting. Figure 4-3 shows the scatter plot
graphs that illustrate the relationship between the Virtual Communication and F2F
enablers at Time 1 and Time 3.
Figure 4-3 Time 3 Scatter Plot Graphs for Communication Effectiveness Enablers
We observe that at Time 1, the Virtual Communication and F2F enablers display
a negative regression relationship, albeit a weak one (-0.5). This suggests that earlier in
the course, the Virtual Communication and F2F enablers could be considered substitutes
in effective communication. Teams generally chose to invest in one form of
communication over the other. However, this relationship transitions over the course of

104
the project to become more of a complimentary relationship by Time 3, as is evidenced
from the strong positive linear regression correlation (0.862).
4.2.3 Longitudinal Analysis of Virtual Group Process Enablers and TMS
We have observed the interaction between the communication effectiveness
enablers over the duration of the project. Now, we explore Research Question #1: the
relationship between the virtual group process enablers and TMS. Based on the
correlation analysis discussed in Section 4.2.1, this section focuses on three of the
enablers: Virtual Communication, F2F Meeting, and Division-of-Labor Strategies.
Virtual Communication and TMS
As discussed earlier, the Spearman correlations indicated a strong relationship
between Virtual Communication and TMS at Time 3. Thus, we now examine the
relationship between Virtual Communication and TMS over the entire duration of the
course. Table 4-9 displays the correlation between Virtual Communication and TMS
over the semester. We observe a significant improvement over the course of the project
in the relationship between Virtual Communication and TMS emergence. As teams
increased their coordination of collaborative tools, their awareness and utilization of
“who knows what” within the team improved.
Table 4-9 Spearman Bi-variate Correlations between Virtual Communication and TMS
Time 1 Time 2 Time 3
-0.866 0.257 0.877*

105
We also observe a similar pattern in the scatter plot graphs for the relationship
between Virtual Communication and TMS (see Figure 4-4). TMS data is unavailable for
3 of the 6 teams (Teams 5, 6, and 8) at Time 1. Based on the remaining teams (Teams 1,
2, and 4), we observe a negative regression correlation (-0.75) between Virtual
Communication and TMS. This supports the assertion that at Time 1, the teams relied
more heavily on the F2F meetings (than Virtual Communication) to develop a TMS. At
Time 2, we observe that the correlation between Virtual Communication and TMS now
reflects a weak positive regression (0.375). Given that there was no F2F meeting during
Time 2, the teams had to rely on virtual communication to continue to execute their
project, utilize each other’s expertise, and develop a TMS. At Time 3, the Virtual
Communication-TMS relationship now reflects a strong positive correlation (regression =
0.867), as is also evidenced by the significant Spearman correlation (Table 4-9) between
the two.

106
Figure 4-4 Scatter Plot Relationships between Virtual Communication and TMS

107
Face-to-Face Meetings and TMS
We now consider the relationship between F2F Meetings and TMS over the
course of the project. Table 4-10 displays the correlation between F2F Meetings and
TMS over the duration of the course. We observe a similar relationship at Time 1 and
Time 3. This suggests the importance of F2F meetings, regardless of time of occurrence,
in developing a transactive memory system. The scatter plot graphs in Figure 4-5 also
illustrate the strong relationship between TMS and both F2F Meetings.
Table 4-10 Spearman Correlation between F2F Meetings and TMS
Figure 4-5 Scatter Plot Relationships between F2F Meetings and TMS
Time 1 Time 2 Time 3
0.866 N/A (No F2F meeting) 0.792

108
Division-of-Labor Strategies and TMS
We had seen a significant relationship between the teams’ strategies for dividing
labor and TMS at Time 3. In this section we look at this relationship over the course of
the semester. Table 4-11 displays the Spearman correlation between the Division-of-
Labor enabler and TMS and Figure 4-6 shows the association between the two via scatter
plot graphs.
Time 1 Time 2 Time 3
1.000** 0.429 0.642
Table 4-11 Spearman Correlation between Division-of-Labor and TMS
At the onset of the course, during the stage of defining the project, we observe
that there is a very strong correlation between the teams’ approach to task division and
TMS emergence. At Time 1, teams have just completed DR1 and have just delegated
their tasks for DR2. Our data indicates that they used their current knowledge of “who
knows what” (TMS) to delegate these tasks. Therefore, teams who were aware of
individual specialization were able to utilize this knowledge in assigning project tasks.

109
Figure 4-6 Scatter Plot Relationships between Division-of-Labor Strategies and TMS

110
At Time 2, we observe that the relationship between awareness/utilization of task
specialization and delegation of tasks has grown weaker. This occurs after the teams'
second design review and after they have had an opportunity to evaluate individual
performance. Most of the teams discovered that individual expertise and motivation did
not adequately align with project task assignments. However, one of the stronger-
performing teams (Team 5) determined the product that they would design based largely
on the team members’ expertise and backgrounds, which enabled them to divide the tasks
effectively throughout the course of the project.
As the project concludes, the relationship between the Division-of-Labor tasks
and TMS improves slightly. However, at this late stage, project-related tasks have
already been assigned so it is challenging to reassign tasks. One of the better-performing
teams (Team 4) improved in their relationship between division-of-labor and TMS from
Time 2 to Time 3. The team was able to do this primarily because one of the members, a
newly-minted team leader, was able to effectively allocate Design Review 2 rework tasks
based on task-related individual expertise.
4.2.4 Longitudinal Analysis of Virtual Group Process Enablers and Performance
In this section, we seek to investigate how our three enablers of interest (Virtual
Communication, Face-to-Face Meetings, and Division-of-Labor Strategies) relate to the
teams’ performance (Research Question #2). Team performance for each team was
evaluated by both the team members and the course instructor for University Z, as
detailed in Chapter 3.

111
Virtual Communication and Team Performance
We observe in Table 4-12 and also in Figures 4-7 and 4-8, that there is an increase
in the correlation between Virtual Communication and team performance (as assessed by
both the participants and the professor) over the course of the project. The correlations
suggest that our speculation about the limited team use of collaborative technology early
in the course remains consistent. For instance, in evaluating the Time 1 data available
(Teams 1, 2, 4), we observe a negative correlation between Virtual Communication and
student-assessed team performance. As described in Section 4.2.2, Team 1 had the best
team performance after Design Review 1 despite their indicated limited use of virtual
communication. Teams 2 and 4 were successful in utilizing virtual communication tools
to collaborate prior to the first F2F Meeting. However, based on the communication
effectiveness enabler relationship at Time 1, we speculate that their mediocre utilization
of the first F2F Meeting is associated with their comparatively mediocre performance
outcome after Design Review 1. The professor ratings of student performance indicate a
mediocre initial relationship between virtual tool use and team performance. However,
the professor expressed that his evaluation was based on his limited awareness of the
teams’ virtual communication practices.
At Time 2, the relationship between the professor’s evaluation of team
performance and the students’ evaluation of Virtual Communication becomes stronger
(and significant) and remains about the same for Time 3. In the student-assessed
performance ratings, we observe significant increases in the correlation between Virtual
Communication and team performance as the course progresses. By the end of the

112
course, the students’ evaluations of their performances after Design Review 3 indicate
significant relationships between virtual tool use and team performance.
Time 1 Time 2 Time 3
Student-Assessed Performance -0.866 0.257 0.939**
Professor-Assessed Performance 0.495 0.857* 0.892*
Table 4-12 Spearman Correlation between Virtual Communication and Performance

113
Figure 4-7 Scatter Plot Relationships between Virtual Communication and Student-Assessed Performance (at Time 1, 2, 3)
Figure 4-8 Scatter Plot Relationships between Virtual Communication and Professor-Assessed Performance (at Time 1, 2, 3)

114
Face-to-Face Meetings and Team Performance
With regard to the relationship between F2F Meetings and team performance, we
first evaluate the student-assessed team performance (see Table 4-13 and Figure 4-9).
We observe a strong correlation at Time 1 between the utilization of the first F2F
Meeting and the participants’ evaluation of their performance. This correlation remains
about the same during the second F2F meeting, based on the students’ assessment. These
outcomes suggest the value that students place on F2F meetings, regardless of when the
meetings occur.
In looking at the relationship between the utilization of F2F meetings and student
performance as evaluated by the professor (Table 4-13 and Figure 4-10), we observe a
different pattern. At Time 1, our data indicates that there is no correlation between the
professor’s evaluation of the students’ DR1 performance and the teams’ utilization of the
first F2F meeting. By Time 3 however, we observe that there is a significant correlation
between the teams’ utilization of the second F2F meeting and the professor’s assessment
of the teams’ DR3 performance outcome.
Time 1 Time 2 Time 3
Student-Assessed Performance
0.866 N/A (No F2F meeting)
0.891*
Professor-Assessed Performance
0.000 0.891*
Table 4-13 Spearman Correlation between F2F Meetings and Performance

115
Based on Design Review 1 feedback from the professors, several of the teams
needed to backtrack after their DR1 deliverable. This need for rework could explain the
lack of correlation between the teams’ utilization of F2F Meetings and the professor-
evaluated student team performance. In our discussions with the professor, he indicated
that most of the teams did not adequately utilize the first F2F meeting to work on the
project as the faculty advisors had expected. He also expressed that a general lack of
understanding about DR1 expectations could be related to the teams’ DR1 outcomes.
Furthermore, there could have been a non-statistical relationship between the initial F2F
Meeting and the teams’ DR1 performance. For instance, data from our surveys and
interviews show that a majority of the teams valued the importance of the first F2F
meeting in building team morale and establishing a social network and camaraderie with
team members.
Figure 4-9 Scatter Plot Relationships between F2F Meetings and Student-Assessed Performance

116
Figure 4-10 Scatter Plot Relationships between F2F Meetings and Professor-Assessed Performance
Division-of-Labor Strategies and Team Performance
For the relationship between the Division-of-Labor Strategies enabler and student
performance (as assessed by both the students and the professor), we observe a similar
pattern to the relationship between Division-of-Labor Strategies and TMS (Section
4.2.3). At the beginning of the project, we observe a correlation between the teams’
approaches to dividing labor prior to DR1 and the teams’ evaluation of their DR1
performances at Time 1 (see Table 4-14). However, Table 4-15 also shows that no
correlation exists between the teams’ approaches to dividing labor and the teams’
professor-assessed DR1 performance. In our interviews with the participants, most of the
teams indicated that the initial phases of the project focused more on collaborative
activities, such as brainstorming, team building, and skill identification. Therefore,
although the teams were able to identify skills for task allocation earlier in the project, the
teams still worked in a collective and collaborative manner on their DR1 deliverables.

117
Time 1 Time 2 Time 3
Student-Assessed Performance
0.500 -0.429 0.751
Professor-Assessed Performance
-0.313 0.429 0.892*
Table 4-14 Spearman Correlation between Division-of-Labor Strategies and Performance (assessed
by Student and Professor)
At Time 2, we now find that there is a correlation between the professor-assessed
team performance and the teams’ division-of-labor strategies. On the contrary, there no
longer exists a correlation between the student-assessed team performance and their task
allocation strategies. We find this occurrence interesting. In our discussions with course
participants after DR2, some of the participants agreed that their pre-DR2 approaches to
allocating tasks actually seemed to have an opposing effect on their DR2 performance
outcome. For instance, some teams did not have a formal task delegation process that
utilized the individual expertise information that they had acquired; rather members were
encouraged to volunteer for project tasks based on skill and interest, and in many cases,
this resulted in inadequate task-person-expertise alignments, given the teams’ project
selection.
By the end of the course (Time 3), we observe a correlation between the
participants’ self-assessments of team performance and the teams’ strategies for
distributing tasks. We also observe a significant correlation between the professor’s
assessments of the teams’ performance and the team’s approach to distributing tasks.

118
After Design Review 2, some of the teams had realized that a more formalized approach
to executing the project was necessary. For instance, Teams 4 and 8 utilized a project
manager to determine relevant individual expertise and task assignment.

119
Figure 4-11 Scatter Plot Relationships between Division-of-Labor Strategies and Student Performance
Figure 4-12 Scatter Plot Relationships between Division-of-Labor Strategies and Professor Performance

120
4.2.5 Longitudinal analysis of TMS and performance
We now investigate our last research question (#3): the relationship between the
development of a TMS and team performance. As discussed in Chapter 2, several prior
studies have demonstrated that the emergence of a transactive memory system leads to
improved performance. Therefore, we also wanted to observe the relationship between
these two constructs. TMS emergence is assessed by each team, as detailed in Chapter 3.
Our performance evaluations are based on assessments from the course participants and
the instructor from University Z.
Time 1 Time 2 Time 3
Student-Assessed Performance
0.500 0.632 0.735
Professor-Assessed Performance
-1.000 0.529 0.574
Table 4-15 Spearman Correlation between Division-of-Labor Strategies and Performance
Table 4-15 and Figures 4-13 and 4-14 indicate that there is an observable
correlation between TMS and the student-assessed team performance throughout the
semester. This is also the case for the correlation between the professor-assessed team
performance and TMS at Time 2 and Time 3. However, we observe a strong negative
relationship between TMS and the professor-assessed team performance at Time 1. This
suggests that there is no statistical association between TMS emergence and the
professor-assessed team performance; however, TMS data is available for only Teams 1,

121
2, and 4 at Time 1. At Time 2 and Time 3, the professor’s performance ratings reflected
similar positive correlations between TMS and team performance, which is consistent
with prior findings.
In observations discussed earlier in this chapter, over the course of the project, the
teams gradually developed a better understanding of “who knows what” among their
team members, and we suggest that this TMS crystallized by Time 3. The progression
can be observed in the relationship between TMS and the student-assessed team
performance. After Time 1, the scatter plot graphs indicate that the relationship between
the two became slightly weaker (Figure 4-13) than at Time 1. By the end of the course,
we observe a strong positive relationship between TMS and the student-assessed team
performance, which also supports prior findings of the effectiveness of a “mature” TMS.

122
Figure 4-13 Scatter Plot Relationships between TMS and Student-Assessed Performance
Figure 4-14 Scatter Plot Relationships between TMS and Professor-Assessed Performance

123
4.3 Discussion and Implications
Prior TMS studies indicate that the emergence of a transactive memory system
improves team performance. Our dissertation study developed three research questions
to determine how the TMS construct can be extended to global virtual environments,
where there has been little prior research. Our longitudinal case study design and
exploratory approach enabled us to investigate the relationships between virtual group
process enablers, TMS, and effective team performance. We now discuss our findings
for each research question.
We should note that the sample size in this study was small and the purpose was
primarily to compare across groups to look for patterns in the data and then explain these
patterns using qualitative case histories (presented in Chapter 5). We do not mean to
imply that we have “proven” that statistical relationships exist or proven any definitive
cause and effect relationships.
The first research question explored the relationship between the virtual group
process enablers and TMS. Our analysis determined that the Virtual Communication,
F2F Meetings, and Division-of-Labor strategies enablers had the strongest relationship to
TMS. Our results support our suggestion of an initial “substitution-like” relationship
between Virtual Communication and F2F meetings. Teams 2 and 4 initially placed more
emphasis on Virtual Communication than F2F, and for Team 1, the reverse was the case.
Knowing that a F2F meeting was approaching influenced the teams’ approach to
collaborative technology use. By the end of the course, we see that teams who invested

124
in both Virtual Communication and effective F2F use were more likely to develop a
strong TMS.
The Division-of-Labor/TMS relationship over the course of the semester suggests
that the Division-of-Labor virtual enabler was initially strongly related to the team’s
TMS, or individual expertise awareness within the team. Our interpretation is that the
team’s awareness of the expertise within the team was particularly important early in
group formation when the groups were deciding who should do what. After Design
Review 1, we find that the awareness and utilization of member expertise was not closely
related to Division-of-Labor strategies for most of the teams. We believe this reflects a
crystallization of the division-of-labor for good teams, and bad teams were less likely to
reassign work based on understanding of TMS. While most teams utilized a top-down
approach in selecting their project, Team 5 employed a bottom-up product-selection
strategy. The team first learned about each member’s expertise and how it could be
utilized in the project and then used this knowledge in selecting a prototype design.
Thus, tasks were easily allocated to individual team members and the team reported a
high TMS at Time 2. Teams 4 and 8 used team leaders in delegating tasks, which
resulted in high TMS ratings by the end of the course. The results indicate that utilizing
virtual collaboration and F2F meetings as complimentary enablers from the project’s
inception and developing clear task delineations from the project’s inception enhance the
development of a TMS.
The second research question investigates the relationship between the virtual
group enablers and effective group performance. In looking at the students’ evaluation of
125
their own performance, we see an indication that collaborative tool use was initially not
associated with their performance. This suggests that in the early stages of team
formation and project definition, over-reliance on virtual communication tools can
actually be harmful. This initial negative relationship then turned strongly positive over
the course of the project. The effective use of F2F meetings was consistently positively
related to the students’ evaluation of performance over the semester. Although it can be
financially challenging, F2F meetings in virtual teams are necessary and important for
effective performance, but cannot be the only enabler utilized, as indicated by Team 1’s
approach. We observed an association between a heavy reliance on F2F meetings by
Team 1 and its weak project finish. The participants’ evaluation of the relationship
between the Division-of-Labor enabler and performance was cyclical – positive,
negative, then back to positive - which supports our discussion in the previous paragraph
of the initial poor utilization of individual expertise.
The professor’s evaluation of team performance indicates weak relationships
with the communication effectiveness enablers (Virtual Communication and F2F
meetings) initially, with the Virtual Communication enabler becoming significantly
stronger during Time 2. At Time 3, the relationship between the Virtual Communication
enabler and professor-assessed performance becomes slightly weaker than at Time 2;
however, it is now comparable to the F2F enabler during Time 3. This general pattern of
the professor’s performance relationships is similar to the relationship between the
participants’ evaluation of the communication effectiveness enablers (Virtual
Communication and F2F Meetings) and performance. The relationship between

126
professor-assessed performance and Division-of-Labor Strategies is rather inconclusive
for the first two design reviews. At Time 3, both the professor and the participants’
evaluations of team performance indicate that there is a statistical association between
strategies for dividing labor and team performance. These results also buttress the
importance of F2F meetings, especially from the students’ perspective. Early use of
virtual communication had no relationship or even a negative relationship with team
performance. Moreover, we observed a statistical association between virtual
communication use and team performance in the later stages of the project.
Finally, we discuss the third research question which investigates the relationship
between TMS and performance. Performance, as evaluated by the participants, is
consistently shown to be related to TMS, as prior research has observed. This
relationship is at its strongest at Time 3, which supports the dynamic nature of TMS. In
the professor’s evaluation of team performance, we observe that the relationship between
TMS and team performance declines after Time 2.
We started the analysis results focusing on the use of Time 3 data. The analysis
of correlations over time shows the strongest and most consistent patterns of correlations
at Time 3 indicating evidence of crystallization of our constructs. Also, based on the
participants’ own assessments of performance, F2F meetings were much more important
in the early stages of the semester compared to virtual tools. This is consistent with
Lewis’ (2004) implication that early F2F meetings are important for the progressive
development of a TMS. However, we find that both communication effectiveness
enablers are important for team performance. This study found that after initial F2F

127
meetings, virtual collaboration can be used to continue to develop the TMS. Although
prior studies also implied that TMS creation in virtual teams might be challenging, we
found that Communication Effectiveness (Virtual Communication and F2F Meetings)
and Division-of-Labor strategies can enable TMS development within geographically
dispersed teams.
4.4 Summary
This chapter provided a quantitative evaluation of the relationship between virtual
group enablers, TMS, and effective performance. In this chapter, we observed that
Virtual Communication, F2F meetings, and Division-of-Labor strategies were essential
for TMS emergence and team performance. The study also supports prior research which
affirms the positive impact of TMS on performance. The next chapter provides a
qualitative exploration of these relationships.

128
Chapter 5
Comparative Case Studies: Qualitative Analysis
Our research questions explore the relationship between virtual group process
enablers, TMS, and effective group performance. We investigated two-way associations
between all three constructs quantitatively in the previous chapter and provided an overall
analysis of these big-picture trends. This chapter delves deeper into the details of the
team dynamics and emergence of TMS through in-depth case studies. The approach is a
comparative analysis of the three stronger-performing teams and the three weaker-
performing teams. First, we discuss how performance is evaluated. Then we explore
virtual group process enablers and TMS from both ends of the performance spectrum.
Finally we conclude with a discussion of the Outlier teams that were not included in the
analysis.
5.1 Team Performance Evaluation
In the previous chapter, we discussed the characteristics of effective team
performance. Both the professor and the course participants evaluated the team’s ability
to execute project tasks based on several criteria, categorized as either project or process

129
outcomes. The project outcome evaluations focused on the performance related to the
deliverable itself. The course had outlined expectations for each of three design reviews
and the quality of the deliverable for the design review was the primary indicator of a
team’s performance at that instance. In addition to the deliverable, a team’s performance
was also evaluated on the amount of rework required after each design review. In
addition, the teams were evaluated on the quality of their process. For instance, because
of the course’s tight schedule, the ability to manage time effectively was taken into
consideration. Process quality was also evaluated by smooth and efficient task execution.
In Section 4.2.1, we discuss how we identified the stronger-performing teams
(Teams 4, 5, and 8) and the weaker-performing teams (Teams, 1, 2, and 6). We used two
criteria: the absolute level of performance and the association with group enablers/TMS.
In observing Time 3 data for all teams, these teams consistently came out on the high end
of performance and also followed the linear trend of a strong association between the
virtual group enablers and performance as well as between TMS and performance. That
is they were in the upper-right quadrant. On the contrary, the weaker-performing teams
were low on the performance scales and also in the lower left-hand quadrant fitting the
linear trend. Both the professor’s evaluations of team performance and the students’
evaluations of their respective team performance also supported our selection of the
stronger- and weaker-performing teams. The professor rated Teams 4, 5, and 8 as the
best-performing teams and Teams 1, 2, and 6 were evaluated as part of the weak-
performing group of teams. The student self-ratings of performance (see Appendix)
illustrate the same categorization of stronger- and weaker-performing teams. The

130
remaining two teams (Teams 3 and 7) were classified as Outliers because they were far
off the trend line between the enablers, TMS and performance. We discuss the Outliers
in Section 5.5. In the next section, we provide some background information on each of
the successful and unsuccessful teams.
5.2 Overview of Strategies and Performance for Strong and Weak Teams
We now provide an overview on the stronger-performing teams (Teams 4, 5, and
8) and the weaker-performing teams (Teams 1, 2, and 6) in more depth. We discuss their
strategies and progressive performance over the course of the semester. For many of
these teams, the evaluation activities (design reviews) served as turning points in the
teams’ approaches to executing the project. We also discuss the grades that the teams
earned. Given that it is an intense and time-consuming graduate-level course, the
professors mentioned that they usually do not give out a grade of B or below, except in
rare circumstances. Therefore, both the stronger- and weaker-performing teams received
fairly high grades. The stronger-performing teams receiving either an A or A+ and the
weaker-performing teams received A- in the course. Table 5-1 shows a description of the
final project deliverable that the stronger- and weaker-performing teams executed. The
stronger-performing teams were successful in working closely with their faculty advisors
to scope their projects.

131
Category Team Project Description
Strong Teams
Communicate Wooden refrigerator console
Strong Finish Window with a device attached to the window that opens and closes the window based on simulated weather data; also calculates the amount of energy saved
Camaraderie Foldable shopping cart that can be placed in vehicle trunk upon shopping completion
Weak Teams
Weak Finish Can crusher with four sensors: aluminum can, empty can, can count, full bin
Confusion Community refrigerator cabinet with different compartments that locks and unlocks based on card swiped
Detached Recycling sorter that sorts waste based on material or other desired category
Table 5-1 Team Project Description
5.2.1 Strong Teams
We identify Team 4 as Team Communicate due to their strong and consistent
communication practices throughout the semester. From the onset of the project, Team
Communicate established both synchronous and asynchronous means of communication
based on the accessibility that all team members had to different communication tools.
Social interactions were somewhat fragmented at the beginning of the course as the first
F2F Meeting was used primarily to brainstorm and determine individual expertise.
However, consistent communication and the utilization of a project leader to facilitate
task delegation improved team effectiveness. Team Communication’s investment in
establishing a solid communication practice was instrumental in overcoming the fact that
two of the team members were unable to attend the first F2F Meeting and one member
132
was unable to attend the second F2F Meeting. Team Communicate received a grade of A
in the course.
Team 5 took a different path towards their successful finish. We refer to Team 5
as Team Strong Finish, based on the challenges that the team had to overcome from their
initial poor start. Team Strong Finish began the course as the worst performing team
after the first design review evaluation. They initially had poor communication practices
due to scheduling conflicts and the time zone differences. Furthermore, the team’s first
F2F meeting was unsuccessful in many respects: group members were unable to jell and
bond as a team and poor team collaboration resulted in the poorly evaluated design
review. However, they remained persistent about receiving continuous feedback from
the professors and they focused on using the expertise that each individual member
contributed to the team to improve on their performance. Project tasks were divided
based on the collocated pairs and several internal task deliverables were assigned to
deadlines within the team. Ultimately, Team Strong Finish concluded the course as the
best performing team with a grade of A+.
The last of our stronger-performing teams is Team 8, which we identify as Team
Camaraderie. Throughout the semester, this team maintained a high level of non-task
interaction. Thus they were comfortable communicating virtually; their social
interactions occurred frequently and separately from group task meetings. The team
created a systemized schedule at the beginning of the course to aid in managing the
project. Furthermore, Team Camaraderie believed that the expertise distribution within
the team was more homogeneous than heterogeneous so they were challenged to find

133
appropriate tasks for each individual. They decided to employ a project manager to help
facilitate task assignment. Through their strong team cohesion and successful use of both
F2F Meetings, Team Camaraderie received an A at the conclusion of the course.
5.2.2 Weak Teams
Although Team 1 was the best performing team after the first design review, they
were unable to sustain this performance for the rest of the project. Thus, we refer to
Team 1 as Team Weak Finish. Before the first F2F Meeting, Team Weak Finish did not
invest in many performance enabling activities. They reported that communication tool
accessibility impacted their ability to interact early on and they were relying on the first
F2F Meeting to make significant progress on the project. Fortunately for Team Weak
Finish, they were able to successfully utilize the first F2F Meeting. Their motivation
coming into the meeting was high, especially due to their inability to really communicate
and accomplish much work beforehand. Team members took the initiative in
volunteering for specific tasks based on interest and there was a committed approach to
accomplishing these tasks. After the first F2F Meeting, Team Weak Finish was initially
mildly successful in continuing activities that would sustain the team’s initial design
performance. The team was unable to conduct effective decision-making via virtual
communication, especially with frequent absenteeism from virtual collaboration
meetings. Team Weak Finish had a similar approach to the second F2F Meeting as they
did with the first F2F Meeting, in that they were hoping to make up for lost time.
Therefore, they were not too concerned after they realized that they were behind schedule
134
prior to the second F2F Meeting. Unfortunately, unlike the first F2F meeting, Team
Weak Finish was unable to effectively utilize the second F2F Meeting to accomplish task
requirements and the team members ended up giving themselves the worst performance
evaluation of all the student team self-evaluations. They received an A- in the course.
We identify Team 2 as Team Confusion because the team was unable to develop a
clear structure and approach to executing their project throughout the semester. For the
most part, they were able to communicate virtually over the course of the semester, and
initially utilized the Google Spreadsheets tool to coordinate tasks. The team was affected
by several shortcomings. There was no formal information exchange of individual skill;
although Team Confusion developed an awareness of skill through interactions, there was
no clarity on person-task assignments. Therefore, there was a lack of validation of task
completion. The team interacted well socially but the camaraderie did not usually carry
over to task-related work. The lack of specified assignments and task completion
validation resulted in individual responsibility and decision-making. Team members
reported being confused as to the direction and goals of the team. Overall the lack of
structure and defined roles and responsibilities led to Team Confusion receiving one of
the lower grades (A-) in the course.
While Team Camaraderie (Team 8) exhibited the strongest cohesive unit, Team 6
was unable to jell as a team throughout the project. Thus we refer to Team 6 as Team
Detached. Team Detached began the course with very effective virtual collaboration –
using several tools to communicate frequently. However, at the first F2F Meeting, the
team indicated that there was not much social development due to outside obligations and

135
the Team Detached ended up bonding with members from other teams. Furthermore,
they expressed difficulty in selecting a project due to their homogeneous skill
background: all members were either mechanical or electrical engineers. After the first
F2F Meeting, absenteeism from collaboration meetings became frequent and the lack of
checks-and-balances within the team propagated such actions. Team Detached did not
invest in social interactions as a team; as a result the team developed cliques within the
team which resulted in more team dissension and ineffective decision-making. The
Asian University participants were never really able to get plugged in and thus were not
as engaged throughout the project execution. Team Detached ended up receiving the
lowest performance evaluation from the professor as well as a grade of A- in the course.
5.3 Effectiveness of Virtual Group Process Enablers: Strong and Weak Teams
We now present an analysis of how the strong- and weak-performing teams
utilized the virtual group enablers in completing their projects. First we investigate the
communication effectiveness enablers, focusing on the interplay between virtual and
face-to-face communication as well as the use of collaborative tools. Then we discuss
how the teams’ investment in cohesive activities affected their performance outcomes.
Lastly we also explore the teams’ strategies for delegating tasks and the role that such
strategies played in the teams’ outcomes.

136
5.3.1 Virtual and Face-to-Face Communication
The GPD teams utilized a variety of communication tools to collaborate during
the course, such as email, instant messaging, and video conferencing. The faculty
advisors organized weekly 30 minute video conference sessions that each team could
utilize. Usually, the assigned faculty advisor to a team would sit in during the team’s
video conference session to observe the team’s progress and answer any questions that
the team might have. The course administrators also maintained a general course website
where information and announcements were posted, and teams could also manage their
projects on this course website. Teams were encouraged to utilize any virtual tool(s) that
they felt would help them execute their projects effectively. By far the most common
tools across all teams were email, instant messaging, and video conferencing. We read in
the discussion below that it was the approach to collaborative tool use that set these
stronger-performing teams apart from the weaker-performing teams. Furthermore, the
stronger-performing teams were able to better adjust to the cultural diversity that existed
within their teams.
Strong Teams
Of all of our case study teams, Team Communicate was the most consistent in
utilizing the virtual communication enabler effectively throughout the semester, hence its
name. Team members unfailingly attended their video conference sessions each week
and they expressed that the video conference sessions and other forms of frequent virtual
communication were instrumental in the initial development of the team goals. Based on
137
the effectiveness of the video conference sessions, the team sought to utilize other similar
channels and found that the Yahoo online conferencing was also effective. Team
Communicate prioritized the team accessibility of their preferred tools and relied on
frequent communication to carry out their project. However, they had to overcome the
quiet nature of their Asian teammates. A U.S. participant remarks about his initial
observation:
I think one problem that the [Asian University teammates] had was communicating with us and sometimes they don't understand what's going on because we are talking too quickly or they just are quiet in general. But, I think sometimes they didn't have their opinions heard.
Team Communicate did not appear to have made much task-related progress
during the first F2F Meeting. The members spent what was, according to the professors,
an inordinate amount of time brainstorming and discussing, and did not have enough time
to reach a conclusion and develop the deliverable for Design Review 1 at the end of the
F2F Meeting. Furthermore, two of the team members were unable to attend the first F2F
Meeting, but they maintained communication with the remaining team members and still
made significant contributions to the project. Team Communication developed a more
structured approach during the second F2F Meeting and their collective task execution
led to overall team success. Recall that Team Communicate faced the challenge of
having to complete the project at the second F2F Meeting with a key member absent.
Due to their consistent and established communication practices, they were able to
readjust tasks and used video conferencing and other tools to interact with each other
138
during the second F2F Meeting. The geographically dispersed participant from the U.S.
University was also able to participate in the final presentation via video conferencing.
Similarly to Team Communicate, Team Camaraderie established strong
communication practices from the onset of the course, which set the tone for the
semester. Although Team Camaraderie established collaborative tool use early on, they
initially spent more of their virtual communication time on non-task discussions as the
team appeared to focus on team cohesion from the beginning and throughout the
semester. A course website was one of Team Camaraderie’s preferred collaboration tools
because participants found that storing files and documents on the website was useful in
enabling members to access the most updated files. Furthermore, the website facilitated
better project-management, especially with larger files. In addition, the discussion
feature on the website allowed them to access files while holding discussions.
Some teams had expressed that although their members attended the video
conference sessions, some participants within the team were more introverted and rarely
participated in the video conference discussions without prodding from other members.
Team Camaraderie participants indicated that they were very comfortable communicating
via video conferencing, which was probably aided by their continuous and deliberate
efforts to establish a cohesive unit. The team also used instant messaging effectively;
they conducted both task-related and social discussions using instant messaging. A
member stated that “we were very social as a team. I don’t know if that was common.
We did most of our social activities together and I was very happy with that.” As the
project developed, Team Camaraderie used a team leader to assist the team in facilitating

139
their virtual meetings so that they were more task-effective. The F2F meetings also
enhanced the team’s virtual communication practices. Team Camaraderie relied heavily
on the first F2F Meeting as a catalyst for carrying out the project requirements.
Participants from the U.S. University expressed that the first F2F meeting exposed the
capability of all team members. A participant elaborates, “after having that experience,
we are able to work more efficiently certainly I think mainly because we are more
comfortable with each other and more comfortable saying our opinions than we had been
prior.” The Asian University members who were slow to open up during the first F2F
meeting were more extroverted during the second F2F meeting. The familiarity that
Team Camaraderie established over the course of the semester facilitated the team’s
progress during the second F2F meeting.
Recall that Team Strong Finish displayed the most dramatic transition of all team
outcomes. This team started out as the worst performing team after Design Review 1 and
finished the course as the best performing team, according to professor evaluations. How
did the virtual communication enabler of Team Strong Finish improve over the course of
the semester? Not surprisingly, we observe that in the early stages of the course, the team
exhibited weak utilization of virtual collaborative tools.
Team Strong Finish admitted that scheduling conflicts made virtual
communication initially challenging. Participants expressed that they had to overcome
the challenge of determining synchronous communication opportunities for all team
members. They were able to do this by establishing standing electronic conferences
using Skype. These standing meetings were scheduled to occur immediately following

140
the weekly video conference sessions, which all members attended dutifully. According
to participants, these Skype sessions lasted anywhere from three to five hours. Since a
faculty advisor also attended the video conference sessions, the Team Strong Finish was
able to utilize the advisor’s feedback from the video conference session in their Skype
meeting that followed. The team’s approach to the video conference meetings also
changed over the course of the semester. At the beginning of the course, a participant
stated that “much of our video conferencing time has just been spent re-elaborating.”
However, the utilization of meeting agendas for the video conference meetings as well as
the effectiveness of the Skype meetings that followed led to better efficiency of the video
conference meetings.
The team’s F2F meeting interactions mirrored the progress that occurred within
the team throughout the semester. The first F2F meeting was unsuccessful. Although
members expressed that the F2F interaction allowed them to become more open, a
member noted that “people were voicing their opinions a lot more so we had more
conflict which slowed the project process down.” The team was unable to reach a
consensus and make significant progress and their Design Review outcome at Time 1
reflected this. Thus, the first F2F Meeting was geared more towards conflict resolution
and less on establishing a project foundation. A member notes:

141
On the first or second day [of the F2F meeting], we really challenged each other’s ideas and really took it to each other and once we decided on an idea, we set to it and really worked together. So, I think it brought us closer as a team because we knew what each person was thinking about and each person voiced their opinion. It actually requires a lot of maturity from a team to be able to talk freely and talk openly and by that I mean step on each other’s toes, discuss everything, and then move forward without thinking of what happened before and this team actually displayed that.
Given the outcome of the first F2F meeting, Team Strong Finish resolved to go
into the second F2F meeting with as much work already accomplished as possible. They
were very successful in this regard and this approach was instrumental in overcoming the
delayed luggage obstacle that the team encountered. Team Strong Finish did not interact
with other teams as much as other teams were doing; they kept more to themselves and
were determined to carry out the project as they had meticulously planned.
Weak Teams
We observe that in contrast to Team Strong Finish, Team Weak Finish was unable
to sustain its initial stellar performance from the beginning of the course. However, in
exploring the communication practices of Team Weak Finish, we find that the team
appeared to rely primarily on the F2F Meetings, and not virtual communication, to
accomplish their tasks. The U.S. participants commented, “Project-wise, [during the
F2F] I think we did really well, like we did everything that we wanted to accomplish.
The rework we had was very minor and the goal of getting to know the team members
was achieved.” The team’s communication frequency and task efforts prior to the first
F2F meeting and in between the two F2F meetings remained minimal, only slightly
142
intensifying prior to the second Design Review. Team Weak Finish was able to use the
first F2F Meeting effectively to coordinate tasks and collaborate on the first Design
Review deliverable. Although they had minimal use of collaborative tools use prior to
the first F2F Meeting, they went into the first F2F Meeting very determined to establish a
strong foundation for the project. They were successfully able to do this based on the
positive Design Review outcome.
After the first F2F Meeting, Team Weak Finish tried to maintain the momentum
from the team’s success, but virtual collaboration continued to be a challenge for the
team. They were able to utilize some virtual communication tools but not effectively.
There was a “lack of virtual communication and [lack of] frequency of communication,”
a participant noted. Participants expressed that internet accessibility and the time
difference limited the impact of email use. Instant messaging was used more frequently
between local participants for clarification purposes. Members were consistently absent
from video conference sessions, which resulted in additional time spent on relaying
information. The team’s virtual communication prior to Design Review 3 was
inconsistent and ambiguous; thus, the team planned to make significant advancements
during the second F2F Meeting to complete the project. Unfortunately, Team Weak
Finish was unable to do this due to the large volume of work that they allocated to the
second F2F Meeting. The planning they did in the initial meeting worked well but the
task had now shifted to actually designing the product and the workload was too much
for one meeting session.

143
Team Confusion, which began the course with innovative and successful virtual
communication, saw their virtual communication frequency decline over the course of the
semester. The team reported that use of a relatively novel tool known as Google
Spreadsheets was particularly useful in initial decision-making and securing inputs from
all team members. “We can have an on-line discourse,” a member noted, “and be able to
have a real-time chat with each other.” Team Confusion expressed an initial preference
for this tool because all participants were able to use it effectively. However, as the team
progressed through the different project phases, the Google Documents tool became less
relevant, and the team was unable to sufficiently transition to using more adequate
collaborative tools. Team Confusion expressed that the video conferencing tool was not
ideal because the team did not properly prepare for these meetings and the team’s goals
and agendas were not addressed during these video conference meetings, resulting in a
lack of structure and task responsibility. He notes, “I think we don’t use the time
effectively because we only have 35 minutes. Generally the first 10 minutes is hello,
hello, hello. Um, but I think one thing that we don’t do very well is send agendas so the
goals for the meetings are very unclear sometimes.” The team found emails to be useful
for high-level discussions of plans, but not for more immediate team coordination.
Overall, although Team Confusion communicated frequently via virtual tools,
they were not effective in clarifying project aims and managing the project.
Unfortunately the team’s use of the face-to-face meetings did not overcome their virtual
communication limitations. The team spent much of the first F2F Meeting brainstorming
and had to overcome a lack of focus from the European University members. During the

144
second F2F Meeting, the U.S. University members expressed that the rest of the
teammates did not come prepared: “Basically, no one else did their job except for us.”
There was miscommunication and misunderstanding about what was expected prior to
the meeting, and the same members from the U.S. University felt that the responsibility
of all of the Design Review deliverables (presentation, paper, and prototype) at Time 3
fell on their shoulders.
Similarly to Team Confusion, Team Detached also began the course with
successful virtual communication. Team members expressed that video conferencing and
frequent virtual communication were instrumental in the initial development of team
goals. Recall that Team Detached was unable to jell as a team even as the semester
progressed; thus the team experienced a decline in communication frequency after an
initial strong effort in using collaborative tools. In terms of collaborative tools, Team
Detached indicated an initial preference for the phone, but time zone differences and
scheduling made it increasingly difficult to continue to use the telephone as a consistent
means of communicating.
Although the team indicated a preference for other communication tools such as
email, instant messaging, and video conferencing, we observe that the team was unable to
successfully use these tools to establish project clarity among all team members. A
member explains:

145
One of the things that we’ve realized is that the Skype calls don’t work with talking with the [Asian University participants] because it is too fast for them…they just can’t keep up with the conversation. So as a whole mode of communication, it is not great. So we have moved a lot more towards the chatting and emails, specifically, but the transmission is often what is very slow.
Furthermore, this team suffered from frequent video conference member
absenteeism from as the semester progressed, which contributed to project ambiguity.
Members of the Asian University also expressed lack of clarity in communication and
team expectations. Members generally found that visual communication (e.g., flowcharts
and pictures) was more effective than written communication. In terms of their F2F
meetings, we observe further evidence of a decline in the cohesive effort of Team
Detached between the first and second meeting. Team Detached expressed that although
they had done much preparatory work prior to the first F2F Meeting, they had a
significant amount of rework to do due to miscommunication and a member from the
U.S. University expressed that the team “really did not accomplish what we had set out to
do.” Team Detached had reported that their homogeneous skill background resulted in
them having limited team expertise that was required for the project. They indicated that
this contributed to their inability to execute the project task as they had planned going
into the second F2F meeting. As a result, Team Detached had to employ outside sources
to aid in the completion of their project.
5.3.2 Investment in Team Cohesion
As discussed in Chapter 2, prior studies have emphasized the importance of
cohesion, even within a global virtual team, for developing trust, decision-making, and

146
resolving conflict. Although our quantitative analysis does not suggest a statistical
association between team cohesion and TMS or between team cohesion and team
performance in our case studies, our qualitative analysis indicates that team cohesion was
particularly relevant in enabling the other virtual group factors.
Strong Teams
Team Communicate was successful in identifying different member personalities
earlier in the project. This aided in determining communication styles and conflict
resolution approaches, which were both utilized in making the working relationship less
formal. As the project progressed, the team indicated a slight decline in team trust and
social interaction; however, this improved by the second F2F meeting. Team
Communicate initially devoted some of their discussions to non-task topics; however, as
the project intensified, their discussions remained centered on the project. Participants
indicated that they were all initially timid, but by the end of the first F2F meeting,
members were willing to be more vocal and accept tasks. Members also expressed that
the Asian University participants remained somewhat isolated from the team (by choice)
throughout the semester and they observed that this appeared to be the case across all
teams. The second F2F meeting did not allow for much social interaction because of the
hectic schedule; however, Team Communicate felt that they had established a strong
collaboration within the team that enabled them to complete the project in spite of a
participant’s inability to attend the second F2F meeting.

147
The poor initial performance of Team Strong Finish was characterized by
minimal social interactions and overall group disconnect. They indicated that the
undesirable outcome after Design Review 1 fueled their motivation to succeed in the
class. Thus as the course progressed, they devoted less time to socialization and more
time to receiving consistent feedback and maintaining a strong project focus. A
participant stated: “We didn’t really focus on social things. We had to focus on the task.”
Another U.S. University participant concurred: “There was not much social interaction. I
know other team members from the European University better than I know my own
teammates from the same university.” At the second F2F meeting, they were met with
the challenge of overcoming an extended luggage delay, which severely hampered their
execution plans. However, the team was united in their desire to complete their project
as planned; thus, this enabled them to successfully collaborate to overcome this obstacle.
A team member summarized his team’s approach: “Trust and cohesion depends on the
team. Given the time and constraints that we had, we trusted each other enough, which
allowed us to complete the project despite so many problems.” Another added, “We
talked about our lives but I wouldn't say it specifically benefitted the group.” With Team
Strong Finish, the collective team desire to perform well overcame the lack of a strong
cohesive unit.
Out of all the GPD teams, Team Camaraderie was observed to be the team that
focused the most on social interactions and networking, outside of the project-related
interactions. From the project’s onset, we observe that much communication occurred
beyond task-related work within this team. For instance, the team allocated five to ten

148
minutes following most team meetings to update each other on each other’s lives. Some
team members also expressed that they invested time in communicating individually with
other members of the team. This enabled team members to develop a stronger sense of
awareness and understanding about each teammate. A participant notes: “Throughout the
semester, even before the second F2F Meeting in Germany, our cohesion was already
good.” Another participant acknowledged that “our Asian teammates were slow to open
up but this might not be the case around their classmates.” Thus members report that
team execution was facilitated by a shared group understanding that enabled members to
adjust whenever individual views did not align.
Weak Teams
We now explore the weaker-performing teams’ approach to team cohesion over
the course of the semester. Members from Team Weak Finish reported that they were
waiting until the first F2F Meeting to “get a feel for everyone.” The team acknowledged
that there was discontent from the European University participants due to their ideas not
being selected during the first F2F meeting, which they did not attend. Thus, these
members were unable to participate in the team’s initial decision-making activities, which
contributed to minimal initial social interaction within Team Weak Finish. Perhaps this
also affected the desire of the European University participants to engage with their team
members over the course of the semester. Recall that Team Weak Finish had the best
Design Review 1 performance outcome of all teams. After the success of the first F2F

149
Meeting, the team attempted to establish bonding exercises at the onset of every virtual
meeting. Unfortunately, we observe that Team Weak Finish experienced reduced virtual
communication and member absenteeism during meetings from Time 2 to Time 3. We
conclude that this impacted the effectiveness of their social interaction efforts. By the
project’s end, members indicated that they tended to associate socially with their closest
subset of members.
Team Confusion indicated early successful social interactions which enabled
them to identify communication preferences. The team agreed that all members
interacted well socially; however such camaraderie did not necessarily transition to task-
related work, as was seen from the lack of task-clarity and structure within the team.
Participants cited that the introverted personalities of teammates were difficult to
overcome and impacted project execution. A team member complained that “one of my
[Asian University] members never really came out,” which made it challenging to engage
him. Although participants expressed that the non-task activities led to a better
understanding of how the individuals operated, the lack of effective team project
management did not enable Team Confusion to utilize individual expertise.
Team Detached was the extreme opposite of Team Camaraderie when it came to
social networking within the team. Team members expressed that although the first F2F
meeting was an ideal atmosphere for social development, more interaction actually
occurred across to other teams than within their own team. As the semester progressed,
individuals within the team were never really able to jell as a team, which resulted in lack
of cohesion in decision-making. Similarly to Team Weak Finish, we also observe that

150
some members of Team Detached were repeatedly absent during video conference
meetings. A U.S. University participant reports:
The Korean team members don’t even show up and I don’t really know why. This happens a lot. We have had issues with that…there was no communication to us about why at all. I mean to be honest it is kind of set aside because it happens all the time now. The Koreans students are not always understood. A lot of the times because of the difficulty in communication, they are left out a lot of the key decisions.
Team Detached also had subsets of groups within the team that were more comfortable
with each other. As a result, we observed a lack of resolution with team conflicts. This
isolation also transferred to project execution where some participants indicated that they
did not feel engaged throughout the project.
5.3.3 Division-of-Labor Strategies
Now we discuss the teams’ approaches to task assignment and execution.
Hackman (1987) has suggested that improving the design of a group’s work can foster
high collective effort. James Thompson (1967) described task interdependence within
organizations as the extent to which individual departments interact and rely on each
other to accomplish tasks. He defines three types of interdependence: pooled, sequential,
and reciprocal, which vary in level of work flow and communication from minimal
(pooled) to complex (reciprocal). We apply his task interdependence analysis to our
comparison case analysis. Table 5-2 illustrates the task interdependence approaches that
the teams employed during the course of the semester.
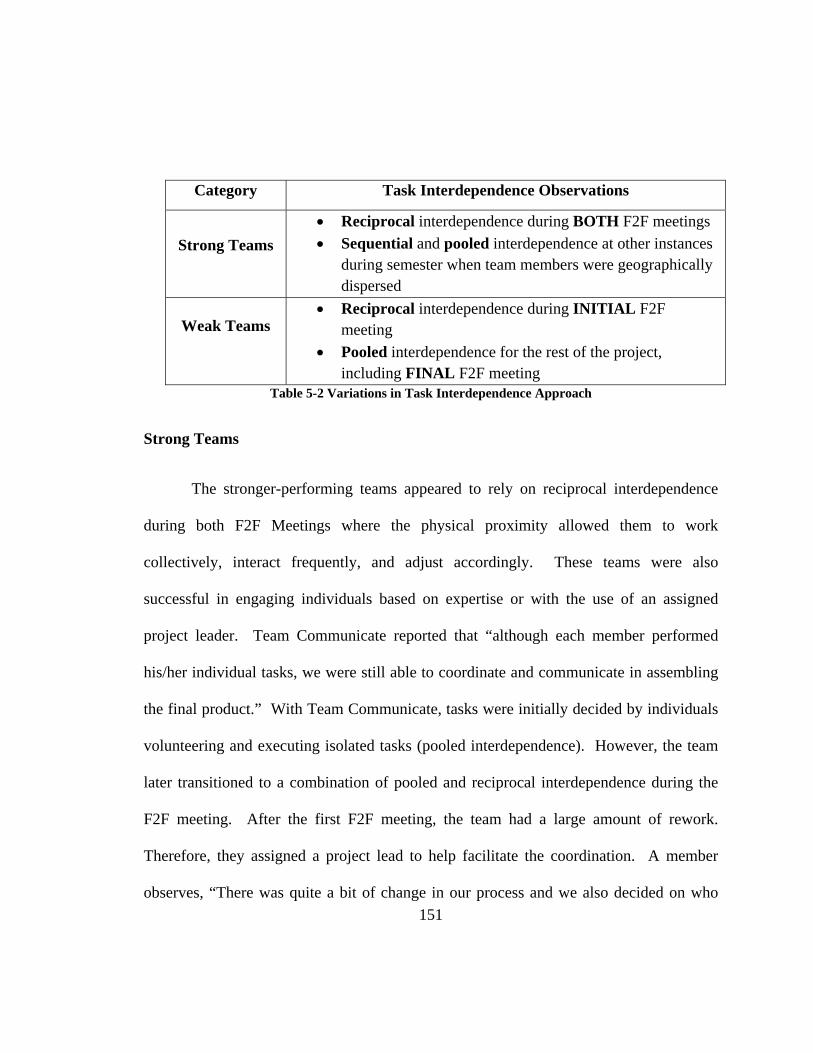
151
Table 5-2 Variations in Task Interdependence Approach
Strong Teams
The stronger-performing teams appeared to rely on reciprocal interdependence
during both F2F Meetings where the physical proximity allowed them to work
collectively, interact frequently, and adjust accordingly. These teams were also
successful in engaging individuals based on expertise or with the use of an assigned
project leader. Team Communicate reported that “although each member performed
his/her individual tasks, we were still able to coordinate and communicate in assembling
the final product.” With Team Communicate, tasks were initially decided by individuals
volunteering and executing isolated tasks (pooled interdependence). However, the team
later transitioned to a combination of pooled and reciprocal interdependence during the
F2F meeting. After the first F2F meeting, the team had a large amount of rework.
Therefore, they assigned a project lead to help facilitate the coordination. A member
observes, “There was quite a bit of change in our process and we also decided on who
Category Task Interdependence Observations
Strong Teams • Reciprocal interdependence during BOTH F2F meetings • Sequential and pooled interdependence at other instances
during semester when team members were geographically dispersed
Weak Teams • Reciprocal interdependence during INITIAL F2F
meeting • Pooled interdependence for the rest of the project,
including FINAL F2F meeting

152
was going to be project lead and all that, so we kind of had to get use to that as well as
making all the changes.” Design Review 2 (DR2) project work was allocated based on
member skill and location and the structure emulated more of a sequential
interdependence approach. The team performed well after DR2 and had a lot of
momentum going into the final Design Review. During the second F2F, the team
operated using primarily reciprocal interdependence and the utilization of individual
expertise resulted in a favorable outcome.
Team Strong Finish was unique in that the members used a bottom-up approach
to select the project. That is, they first determined the skills of each member and then
they selected a project that required the expertise of all team members. A U.S.
participant explains:
What I realized then was that we need to figure out each other skill sets, so that we could effectively choose a project that would allow us to create a prototype because that’s the main aim… one of the biggest aims of the project. So, we started off this process where each person emailed out their strengths… their top strengths with software packages that they know and what best… how best they contribute to the team. So, we knew each other’s skill set before we chose a project in which all members would be able to contribute...we divided all our tasks based on skill set. So, the people working together were working together based on their skill sets. So there were two guys, one from the European University one from the Asian University working on the prototype. There were two others working on the posters, one from the Asian University, one from the European University and one from the U.S. University, three of them were working on posters and presentations and while I was typing at the report.
Prior project management experience, standardization, and individual interest in
developing the necessary task expertise guided the group’s task distribution strategies. A
participant stated: “A lot of work went into incorporating DR1 feedback into DR2
because we were one of the worse teams; we were unable to communicate our ideas

153
clearly.” As the project progressed, Team Strong Finish decided to divide tasks based on
collocated pairs where consistent communication and physical assembly of the product
became essential. At this stage, the team began to implement a reciprocal
interdependence structure where the pairs interacted frequently. The team’s
aggressiveness in adhering to internal deadlines facilitated precise project execution and
reciprocal interdependence during the second F2F meeting. “We were extremely,
extremely organized,” a member stated, “we were satisfied with what each person had
done so we didn’t need to change anything.”
When it came to dividing tasks, Team Camaraderie took a more voluntary
approach. One participant noted that “there was not a good way of breaking up the tasks.
We did it on a voluntary basis.” During the first F2F meeting, the team employed a
pooled interdependence approach in selecting the project and utilized systemized
scheduling to execute tasks. Team Camaraderie expressed that all of their individual
members appeared to have similar skills so they were challenged to find appropriate tasks
for each individual. Therefore they used a project manager to assist in facilitating task
assignment. This project manager elaborates on the team’s task assignment process:

154
Well, we really didn’t have a formal process of determining who was best. We, we started out doing most of our assignments as a group and just kind of… we left it up to volunteering you know. If we needed to do some kind of delegation, then we’d try and get different people to volunteer for different things. Over the course of the project, we still haven’t formally decided who is best at what. We decided a couple weeks back that I would play the role of project manager and so since making that decision, I have been making that decision I have been paying close attention to what people seem to be good at and what people seem to not be so good at. And so personally, I have a good idea of what people seem to be most capable of.
Although Team Camaraderie utilized a pooled interdependence approach during
the project selection phase, the team worked collaboratively in a reciprocal manner for
the remainder of the project. In support of the interactive work flow and communication
task approach, Team 8 indicated that, “it’s been a group effort to make sure we’re
addressing every task.”
Weak Teams
In the weaker-performing teams, we observe a tendency to employ a combination
of reciprocal and pooled interdependence structures; however, as the project progressed,
these teams opted to primarily utilize a pooled interdependence approach. A pooled
interdependence structure indicates that there is low communication and that individual
tasks do not often interact with one other. Team Weak Finish utilized a combination of
pooled and reciprocal interdependence in the project selection phase. Members worked
independently prior to the first F2F meeting and then they worked collaboratively during
the F2F meeting. Members were also excited to discover additional individual expertise
during the F2F meeting. After the first F2F meeting, Team Weak Finish continued to

155
allow individuals to take the initiative on project tasks based on interest, as was done
prior to the first F2F meeting. A participant noted, “Our task approach was laissez faire.
If it interests you, do it.” This pooled interdependence approach also led to task
negligence and continued on to the second F2F meeting where Team Weak Finish was
unable to successfully collaborate to complete the project.
Recall that Team Confusion utilized the Google Spreadsheets tool during the idea
generation and concept definition/market analysis stages. This tool enabled reciprocal
interdependence because the team communicated constantly and individual outputs were
constantly being updated by other team members. We observe that Team Confusion had
no formal exchange of skills so individuals subsequently took on responsibility and
decision-making as the project progressed, thus moving more towards a pooled
interdependence structure. This individual autonomous approach led to reduced
communication as the semester progressed. A Team Confusion member expressed that
his Asian University teammates “appeared to be hiding the fact that they could not
execute their part of the project.” This participant concludes that this “resulted in our
poor prototype outcome.” Unlike the stronger-performing teams, task assignment was a
challenge for these weaker-performing teams, and lack of project checks-and-balances
impacted their task execution approach.
Similarly to Team Confusion, Team Detached also displayed a lack of structure in
dividing tasks. The team experienced difficulty in the idea generation phase due to lack
of team communication. The members utilized a combination of pooled and reciprocal
interdependence at the first F2F meeting. However a participant noted that the team

156
“discovered that collective work was the most inefficient way to accomplish tasks.” Thus
the team divided their tasks into individualized components. Another member afterwards
expressed that “the individualized tasks made it more difficult for the group to understand
each other” throughout the semester. The team had varying and conflicting approaches to
project management, but the lack of consistent communication and project facilitator
resulted in more of a pooled interdependence approach and minimal participant
engagement for the rest of the semester. Furthermore, the team expressed a challenge in
selecting a project that suited the homogeneous skill base among members:
Part of the problem for us is that almost all of us have a very similar background in mechanical and design, but we don’t really have you know…projects are involved in a whole lot more not just mechanical and design component of the design and we really only have like one other person that has skills outside of that main set. So we have a ton of the mechanical and design component/portion, but when it comes to any of the business side of things, we don’t have anybody that has specific skill sets in that…it’s not great.
5.3.4 Discussion
What do we observe about the interaction between virtual group process enablers
and team performance as we compare the stronger- and weaker-performing teams? First,
we determine that there is no significant variation in tool preference between the Strong
and Weak Teams. All the teams expressed a preference for synchronous collaboration
tools (video conference, instant messaging) as a necessity for making significant progress
on their work. Although they also used asynchronous tools (e.g. email), they expressed
that the lag time in communication responses was not desirable for the 13-week project

157
that required constant attention. We did observe a difference however, between the
stronger-performing and weaker-performing teams in their approaches to tool use, which
could be affected by other factors or virtual group enablers. The stronger-performing
team communicated frequently and established standing meetings. Team Strong Finish
also expressed that the similar technical backgrounds also facilitated the team’s
communication, despite the cultural diversity within the team. A U.S. participant
observed that “It's actually much easier to communicate using math or like electrical
engineering and mechanical engineering simply because that's something that everyone
understands, as opposed to English which is not something that everyone would
understand as easily.”
The professors’ feedback from Design Review 1 (DR1) was that many of the
teams failed to adequately utilize the first F2F meeting to arrive at the expected project
deliverables. The stronger-performing teams were successful in turning this performance
around and utilizing the second F2F meeting to accomplish their tasks. The frequency in
communication with the weaker-performing teams was observably less, particularly in
the later stages of the project. Although they did communicate, they were unable to
establish project clarity as the project progressed. It is also worth noting after conversing
with the participants that the tool preference indicated by some individuals could have
reflected communication that occurred within a subset of the entire team.
We also observe differing approaches to team socialization and group work. Both
Team Confusion and Team Strong Finish expressed that their social interactions did not
carry over to their work. However, while Team Strong Finish was able to remain focused

158
on executing the project, Team Confusion experienced motivation and task confirmation
challenges. A Team Confusion U.S. participant complained, “I felt like the Germans
really didn’t care about the project more so, they wanted to go and have a good time.”
Overall, our data indicates that the teams’ social interactions enhanced the role that the
other virtual group process enablers played. Our qualitative data suggests that the first
F2F meeting played a prominent role in determining the social networking practices that
each team engaged in over the duration of the project. However, as the quantitative
analysis suggested, team cohesion played a more secondary relationship to team success.
Team cohesion developed trust within stronger-performing teams like Team
Camaraderie, which also improved their collaboration efforts. A lack of team cohesion
resulted in individualistic approaches and ongoing team conflicts within Team Detached.
Virtually all of the teams reported that individual personalities within the team impacted
team cohesion development. For instance several of the teams expressed the challenge of
working with more introverted individuals (mostly from the Asian university) who were
less comfortable interacting socially with their teammates. Based on discussions with the
participants across all teams, this was likely a characteristic of the Asian culture.
Furthermore, since most of the Asian University participants knew each other, those pairs
on each team tended to associate closely with each other, and not as much with team
members from the other universities.
Clearly defined and structured tasks were characteristics of the division-of-labor
strategies in stronger-performing teams. These teams utilized a reciprocal
interdependence approach during F2F meetings and Teams Communicate and

159
Camaraderie also employed a project manager to assist in facilitating tasks. Members on
the weaker-performing teams were more independent in executing their tasks, especially
towards the conclusion of the project where we observe a utilization of a pooled
interdependence approach. We also observe an association between the teams’
investment in group cohesion and the teams’ task interdependence approach. The
stronger-performing teams, enabled by the reciprocal interdependence strategy
(maximum work flow and communication) that they employed, were better able to utilize
the team cohesion that developed within their teams.
In the weaker-performing teams, we observe a connection between a pooled
interdependence task approach (at the end of the project) and the inability to overcome
individual personality differences. The formation of cohesive subsets of teams in Team
Weak Finish and Team Detached did not support the establishment of a common ground
among all team members. In exploring the association between these virtual group
enablers and team performance, we find that the enablers also played a significant role in
the teams that were able to develop of a transactive memory system. We discuss this in
the following section.
Despite the challenges that the teams’ cultural diversity presented, all teams still
expressed appreciation for the unique opportunity to interact and collaborate on a global
scale. Overall, the teams were in agreement about the differences in each culture’s
approach to project management and task execution. The U.S. University participants
were thought to be more creative and free-thinking. They kept the big picture in mind
and often saw themselves as mediators within their teams. The European University

160
participants were seen as process-focused, unwavering, and not outside-the-box thinkers.
Their approach to task execution was methodological and regimented and they desired to
be involved in all aspects of the project. Teammates were in agreement about the
reserved nature of the Asian University participants. They were seen as less likely to take
initiative but were also observed to be perfectionists when it came to task execution.
Overall, we observe that the student participants from the U.S. and Germany Universities
exemplified more of an individualistic culture, which is characterized by more open and
precise communication. The observed perspective of the Asian University students
aligned more with the collectivist culture where the group’s values and goals take
precedence over the individual’s. A Team Strong Finish participant noted:
A combination of the different abilities and engineering skill sets really allows us to create something really cool and something really different. But, I think that's the biggest thing I am taking away from this class is the way engineers think and the way you can combine those different thinking patterns to actually do something really cool.
Another GPD participant from Team Communicate commented: “we have been
doing this product design projects here. But getting an international exposure, getting to
know how other country people work, and how then professionally how they deal is quite
different…it's good to know.”
In addition to observing cultural diversity at the team level, we also acknowledge
that cultural diversity at the individual level could have also been influential in process
enabler interaction, TMS emergence, and team performance. For instance, we observe
that individual motivation could have played a significant role in the team’s ability to
successfully execute the project. In Chapter 2, we presented literature findings that

161
indicated that individual motivation and commitment can affect absenteeism and social
loafing.
5.4 TMS Emergence
A transactive memory system incorporates the shared awareness of who knows
what within a team with the team’s ability to utilize the individualized expertise in
executing a team goal. As we have reported, prior studies have shown that the
emergence of a TMS leads to improved team performance. Thus in this section, we
investigate how the TMS developed within our teams of interest, how TMS interacted
with our virtual group enablers, and how TMS enabled performance within the Strong
and Weak Teams.
5.4.1 Strong and Weak Team Comparison
Table 5-3 displays the self-reported team TMS ratings at each data collection
point for the stronger- and weaker-performing teams. We observe a general association
between TMS strength and the team category (strong or weak), particularly at Time 3,
when we believed the TMS had crystallized. We now explore in more detail the temporal
progression of the individual TMS characteristics (Specialization, Credibility, and
Coordination) for the Strong and Weak teams.
Category Team Time 1 Time 2 Time 3
Strong Teams
Communicate 3.7 3.5 4.0
Strong Finish N/A 3.9 3.7

162
Camaraderie N/A 3.8 3.9
Weak Teams
Weak Finish 3.8 3.9 3.2
Confusion 3.6 3.7 3.7
Detached N/A 3.2 3.3 Table 5-3 Self-reported Team TMS Ratings (5.0 Likert Scale)
Strong Teams
Table 5-4 provides the progression of TMS characteristics for the stronger-
performing teams. We observe that Team Communicate was able to identify individual
expertise earlier in the project and the initial focus on conflict resolution, communication
style, and member personality identification enabled them to establish a high level of
trust which they were generally able to maintain throughout the semester. The team’s
initial approach to organizing their tasks was unproductive. A member discusses the
team’s progress as the beginning of the course: “Some days, I was satisfied but like I said
there were some days that we didn’t get a lot done and looking back if we would have
had an agenda in the beginning, it would have helped out a lot.” Although the team’s
coordination strategies started out somewhat fragmented, the team reported a significant
improvement in their coordination efforts, especially towards the end of the project even
when a participant was unable to attend the second F2F meeting.
During the first F2F meeting, Team Communicate expressed that individual skills
surfaced and members began to be aware of unique specialization within the team. A
member notes,

163
I think we worked a lot better together during the [second F2F] experience than in the [first F2F] experience because we realized what people were good at and everybody pretty much knew what their tasks were, so they could work on it instead of waiting around trying to figure out what they should be doing.
The team had initially used a voluntary approach to execute tasks. However, they
later decided to elect a project manager to help delegate tasks to the appropriate team
member. Doing this improved their coordination as a team because the team leader
could ascertain that all necessary tasks were accounted for. Team Communicate
established strong social interactions throughout the semester which enhanced their
credibility evaluations.
According to our data, credibility alone was not always an ideal indicator of a
strong-performing team. Recall that Team Strong Finish did not make significant
investments in team cohesion. Moreover, it is interesting to note that although the
credibility rating of Team Strong Finish declined from Time 2 to Time 3, the team still
received the highest team grade in the course (A+). The coordination of Team Strong
Finish was evident; the team relied on meticulous planning and consistent feedback from
the professor. A Team Strong Finish participant states: “We don't compete with other
teams; we make sure the professors are satisfied.” Although they used their individual
expertise adequately, we detected a collective fear of failure that seemed to prevent them
from bonding with or relying on teammates. The team’s decision to develop the project
based on member specialization was an interesting bottom-up approach and seemed to be
the essence of this team's optimal performance in the midst of obstacles and in
overcoming the lack of extreme social interactions. Another member states that as the
semester progressed, “task specialization/expertise was realized and expertise in task

164
areas grew; people crossed over to help where needed.” Although Team Strong Finish
did not have a defined team leader like Team Communicate or Team Camaraderie, they
expressed that they were able to rely on the project management expertise within the
team. A member observed that:
Three of us have learned about project management in the past, and we’re sort of managing and leading the group…these three people have taken on an additional responsibility. So it really helps the other shift, as opposed to just one person doing all the leading and all the managing, we really have a team.
Within Team Camaraderie, team unity appeared to be their main focus and they
made collective decision-making a top priority. We observe this by the frequent
communication that members engaged in. We also see this in the high credibility ratings
in Table 5-4. Although the team communicated frequently, there was not much initial
exchange of individual specialization. It was not until later on in the semester that Team
Camaraderie discovered the homogeneity in their individual expertise. Thus, similarly to
Team Communicate, Team Camaraderie also employed a team leader who enabled them
to coordinate task-expertise assignments more effectively. The project leader discusses
the team’s decision to elect a project leader to improve on their coordination:
Having to start from the beginning really, really showed what we were good at and what we weren’t and the main thing that we weren’t good at is organization, mainly I think we hadn’t assigned anyone as project manager at that point…had we been more organized, I think we could have done more.
Although the team started the semester with high credibility, but low specialization and
team coordination, we can conclude that this team was able to develop a strong TMS by
the end of the course. Team members became aware of individual expertise and the team
was able to utilize this successfully in executing their project.

165
Team TMS Characteristic Time 1 Time 2 Time 3
Communicate
Specialization 3.9 3.7 4.1
Credibility 3.8 3.8 4.0
Coordination 3.3 3.0 3.8
Strong Finish
Specialization N/A 4.2 4.1
Credibility N/A 4.0 3.5
Coordination N/A 3.4 3.5
Camaraderie
Specialization N/A 3.8 3.9
Credibility N/A 3.9 4.2
Coordination N/A 3.6 3.7 Table 5-4 TMS Emergence for Strong Teams (5.0 Likert Scale)
Weak Teams
Table 5-5 shows the TMS self-reported ratings of the weaker-performing teams.
We observe that the self-rated TMS of Team Weak Finish declined drastically from Time
1 to Time 3 when the TMS was thought to have crystallized. By the end of the semester,
they indicated that their ability to trust each other to perform assigned tasks declined as is
evidenced from their credibility ratings. In addition, although Team Weak Finish
collaborated effectively during the first F2F meeting, they were unable to use their
individual specialized skills to coordinate their task execution and overcome the
geographical dispersion as the semester progressed. Team morale could have also
impacted the team’s efforts. One of the participants who saw himself as the group
leader/motivator mentioned that he had a “pessimistic outlook” going into the second F2F
meeting. He explains,

166
Team America has come to a consensus that we don’t care if our project looks pretty or not. I mean aesthetically pleasing, yeah, that’ll be great, but given the manufacturing capabilities that we have, we’re not expecting anything. And I think from my experience doing design projects, it’s really more an understanding of what can be done than what you think is realistic so I’m going in there with a lax attitude - so as long as it works, we’re fine. We don’t have to make it look like the real thing. If it looks like the real thing, then that’s great. What is the marginal benefit of it?
Overall, this team had a laissez faire approach to the project; they did not fully
commit to collectively utilizing their expertise to execute the project as a team. We can
conclude that Team Weak Finish was unable to develop an effective TMS at the
conclusion of the project.
At Time 3, Team Confusion had the highest TMS self-rating of all the weaker-
performing teams (Table 5-5). Moreover, our qualitative data indicates that the team was
unable to develop and utilize a TMS. A U.S. participant noted:
Our European counterparts were supposed to get the wood and cut it so that it would be ready to go. They bought the wood like 2 or 3 days before we got there and when we got there they hadn't even drawn up where to cut. We had to basically spend the first half of the first day [of the second F2F meeting] doing what they were supposed to do before we got there. And our Asian teammates bought the wrong kind of card scanning system. Basically, it wasn't going to work and they knew this before we left and they didn't tell us until we got there. So it really hurt our prototype.
Although the team established an awareness of individual specialization, there
was evidence of a lack of team structure and coordination that would have enabled the
team to effectively utilize their individual expertise. Recall also that Team Confusion
interacted well socially; however, their social interactions did not extend to task-related
work and the credibility level of the team declined, especially after participants from the
European and Asian Universities came unprepared to the second F2F meeting. Overall,

167
ineffective communication as the course progressed led to a decline in credibility and
task coordination, thus resulting in a weak TMS.
TMS self-ratings for Team Detached were comparatively low for both Time 2 and
Time 3 (there is no available data for Time 1). Throughout the course of the semester,
Team Detached expressed difficulty in jelling as a team and attributed this to the subsets
of cohesive units that developed within the team. We observe that this was associated
with the level of credibility that existed within the team. The team reported that there
was no unique specialization among the team members. However, we observed low
levels of communication effectiveness which leads us to question the team’s awareness of
each member’s expertise. Team Detached ultimately selected an unchallenging project
by the professors’ standards. In addition, the team was unable to effectively resolve team
conflicts. These occurrences are evidence of a lack of structure in task division and an
overall inability to coordinate tasks effectively. We can conclude that Team Detached
was unable to develop a successful TMS.
Team TMS Characteristic Time 1 Time 2 Time 3
Weak Finish
Specialization 3.7 4.1 3.6
Credibility 3.9 3.7 3.1
Coordination 3.9 3.8 3.0
Confusion
Specialization 3.6 3.8 4.0
Credibility 3.7 3.9 3.5
Coordination 3.4 3.3 3.7
Detached Specialization N/A 3.6 3.3

168
Credibility N/A 3.3 3.4
Coordination N/A 2.8 3.1 Table 5-5 TMS Emergence for Weak Teams (5.0 Likert Scale)
5.4.2 Discussion
We observed that the stronger-performing teams were able to successfully
develop a transactive memory system, an awareness of individual expertise, and they
were able to utilize this expertise in accomplishing their tasks. Teams Communicate and
Camaraderie used a combination of individual volunteering based on expertise and a
project leader to facilitate task delegations. Although Team Strong Finish got off to a
slow start, they had several members with project management experience and they were
able to effectively allocate the project’s components to the appropriate team members.
Unfortunately, the weaker-performing teams were unable to develop a transactive
memory system at the conclusion of the semester. Lack of task structure and
coordination were associated with the inability of the Weak Teams to execute the project.
We observed that Team Weak Finish and Team Detached formed sub-units or mini-teams
that interacted socially and communicated more frequently. However reduced
communication and ongoing conflict among members of the entire team impacted the
ability of these teams to collaborate effectively. Team Confusion’s perception of the
TMS that developed within their team did not align with the low performance outcome
and the team’s inability to allocate tasks efficiently. Lack of team trust was also evident
in all of the weaker-performing teams and we observe that the absence of such “swift

169
trust” reflected on the teams’ communication practices, individual motivation, and overall
team project management.
5.5 Outlier Cases
Recall that Chapter 4 provided a quantitative analysis on the “outlier”
classification of the remaining two teams that were not part of our extensive comparative
analysis (Teams 3 and 7). As a result, they were not explored in the same depth as the
strong and weak teams. In this section, we discuss more about these “outliers.” The
American University professor supported our classification and justification of these
teams as outliers. He agreed that they consistently rated themselves higher than the
professor’s assessment, and their lack of consistent communication with their faculty
advisor led to them operating with a false sense of high achievement. As we explain
below, a team’s project selection is also a contributing factor to team outcome. Teams 3
and 7 were two of the weaker-performing teams in the course. Like the Weak Teams in
our comparative analysis, they also received a grade of A- in the course.
Category Team Project Description
Outlier Teams
3 Solar power plant module with protective shield based on weather prediction
7 Automated package receiver that can move on two axes
Table 5-6 Outlier Teams Project Description

170
Team 3 selected a daunting project by course standards (Table 5-6), but was
unable to successfully develop a TMS or utilize the virtual group enablers to execute the
project effectively. A Team 3 participant from the U.S University agreed that their
project was indeed “too ambitious.” Similarly to Team Weak Finish, their initial virtual
communication was minimal and they depended on the first F2F meeting to develop
group dynamics. As the semester progressed their virtual communication remained
fragmented. This as well as member absenteeism from video conference meetings led to
non-consensus decisions within the team. The team interacted socially during the first
F2F meeting; however their investment in group cohesion remained minimal for the
duration of the semester. Overall Team 3 was very similar to Team Weak Finish in their
approach to executing the project. They relied heavily on the F2F meetings and used a
pooled interdependence task approach to accomplish their tasks. Ultimately, Team 3
believed that their project selection affected their team effectiveness and overall team
performance.
For both Team 3 and Team 7, it is possible that their project choices could have
been reflected in the participants’ self-assessments of their performances. For most of the
semester, Team 7 lacked clarity on project specifics. This uncertainty and lack of
expertise commitment led to their inability to develop a structured approach towards
executing their project. The team bonded well during the first F2F meeting; however, the
continued high level of team camaraderie created a too-relaxed atmosphere as is
evidenced by the lackadaisical approach employed by a subset of team members.
Similarly to some of the other weaker-performing teams, Team 7 tolerated member

171
absenteeism in team meetings. We also observe that their strategies for division-of-labor
were especially ineffective. There was hardly any unity in their deliverable expectations
and there was a lack of member responsibility and initiative in expanding on individual
expertise to effectively perform individual tasks. Also, at the beginning of the course,
there was no initial exchange of individual specialized expertise and thus, this was not
considered in task allocation, which led to task-person-expertise misalignments.
As we explore the impact of the virtual group process enablers on these teams, we
observe similarities to the weaker-performing teams. They were unable to effectively
utilize these enablers, particularly towards the conclusion of the project. However, their
performance and TMS self-ratings indicated that they rated themselves higher than their
project outputs indicated.
5.6 Discussion and Implications
This chapter has provided a qualitative analysis of the relationship between the
virtual group enablers, TMS, and team performance. Our analysis focused on a
comparison of six teams: three that were classified as the stronger-performing teams and
three that were the weaker-performing teams. In this section, we discuss the key lessons
that we learned in our qualitative analysis. These observations include the role of group
cohesion investment, the influence of cultural diversity, the interaction of the
communication effectiveness enablers, and the crystallization of TMS. We then conclude
with our modified theoretical model that incorporates our observations.

172
5.6.1 Lessons Learned
Lesson #1: Influence of Cultural Diversity
Chapter 4 discussed the participant selection process for each university. As was
noted, virtually all of the participants at the Asian University were familiar with each
other. We acknowledge that Asian individuals are typically more reserved and generally
seek to avoid conflict. As we noted earlier, the Asian University participants were more
introverted that their teammates. We speculate that this familiarity with each other along
with the language barriers that these participants encountered resulted in their being
somewhat more isolated from the rest of their team members. The participants at the U.S.
University and to an extent at the European University were culturally heterogeneous, in
that the participants’ ethnic origins were generally not “based” in the home country of
their institutions. Furthermore, multilingual ability and international exposure were part
of the criteria that these two universities used in selecting course participants so we can
assume that they were accustomed to interacting with individuals from various
backgrounds.
Overall, there was a consensus among all the teams about the need to adjust to
differences in expectations, interpretations, and procedural approaches among team
participants. For instance many of the teams expressed the challenge of having to extract
opinions and inputs from their Asian University participants, especially when there was
disagreement among team members. They stated that many of the participants from this
institution were very quiet and reserved in nature. The first F2F meeting was invaluable,

173
according to all teams, in interacting socially, understanding personalities, and in
establishing common ground. Team Communicate and Team Detached expressed that
unifying the different product design and project management perspectives among team
members were daunting tasks that were enabled by the first F2F meeting. However,
many teams mentioned that there were other cultural-related attributes of the team
members that they needed to explore beyond the first F2F Meeting and throughout the
rest of the semester.
Fundamentally, the commonality of engineering proved to be a unifying factor
within teams. Once the GPD teams were able to establish familiarity (with the aid of the
first F2F meeting and video conferences), they observed similarities in thinking patterns
among team members and were able to draw out innovative ideas from their more
reserved participants. Team Strong Finish was successful in establishing effective
communication among all participants as the semester progressed. A participant stated
that as engineers, they had the “ability to still communicate technically despite language
barriers.” Also, Team Detached and Team 7 noted that the academic training of the
Asian University was very similar to that of the U.S. University, which enabled them to
understand perspectives better. Generally, the GPD participants expressed appreciation
for the opportunity to interact with individuals from varying cultures in spite of the
challenging class project and the cultural unawareness that they encountered. At the
conclusion of the project, a Strong Finish member observed that:

174
Culture helped with being more in tune with each other and now I’ve learned that culture is one of the most important things to know about when you’re trying to work with somebody. You have to know where they come from, how they act, how they live in order to truly understand them and then be able to communicate well with them.
As we alluded to earlier in this chapter, cultural diversity at the individual level
could also have been relevant to team effectiveness. For instance, we observe that the
course interest and participant selection process at each institution could be associated
with participant enthusiasm and course motivation. In addition to differences in
individual motivation, variations in individual personalities could also be associated with
team effectiveness as previous studies have explored relationships between individual
personalities and interpersonal interaction.
We also observed that the functional background and previous working
experience of participants were beneficial to teams that were able to utilize relevant
skills. In our globalized society, this often meant that such individuals had prior
experience interacting with other individuals from diverse cultures which they were able
to employ within their teams. This was particularly useful for autonomous teams
working on short-term projects. Overall, we observe that there are several factors at the
individual level that can impact the ability of individuals to interact with each other in a
team setting.

175
Lesson #2: Supporting role of Group Cohesion Investment
We did not observe a strong association between investment in group cohesion
and TMS and between investment in group cohesion and performance in our quantitative
analysis (Chapter 4). Moreover, as the figure illustrates, our qualitative data suggests that
the other group process enablers (communication effectiveness and division-of-labor
strategies) played a mediating role between group cohesion investment and TMS
emergence as well as effective team performance. We also suggest that cultural diversity
plays a significant role in the interaction between team cohesion and the remaining
virtual group process enablers. In relation to the role of cultural diversity, we found that
the formation of mini-cohesive networks in weaker-performing teams was associated
with member absenteeism and a lack of consensus in decision-making.
Lesson #3: Balanced Complimentary Use of Communication Effectiveness Enablers
We now proceed to the virtual group enabler portion of our model. Our
qualitative evaluation of the communication effectiveness enablers supported our
quantitative investigations from Chapter 4. We observe that teams tended to prefer either
Virtual Communication or F2F Meetings initially to carry out their project work.
However, towards the end of the semester, the more successful teams were able to
effectively balance both communication approaches. The weaker-performing teams that
relied too heavily on the initial F2F meeting to accomplish tasks were unable to do the
same with the second F2F meeting. With regard to tool preference, we find that the type
176
of tool preferred did not appear to be as indicative of the performance outcome as was the
teams’ approaches to using the tools.
Lesson #4: TMS Crystallization
Our theory of a crystallized TMS at Time 3 was reinforced by our qualitative
analysis. We observed that some of the weaker-performing teams appeared to have
developed a TMS in the earlier stages of the project, but were unable to sustain it, which
impacted their project performances. As Figure 5-1 illustrates, the crystallization of TMS
is enabled by the ongoing interaction with the group process enablers. Conversely, the
project’s conclusion (Time 3) was the instance at which the stronger-performing teams
had developed their strongest TMS. Our qualitative data and quantitative data suggests
conflicting reports of TMS emergence within Team Confusion in that the quantitative
data indicates that TMS emergence improved over the duration of the course while the
qualitative data suggests otherwise. This indicates that there could have been
inconsistency in the self-reported TMS data provided by the team. Also, we find it
interesting to note that the teams that had to overcome difficult challenges at the second
F2F meeting (Team Communicate and Team Strong Finish) were two of the stronger-
performing teams. Did they rely on their established TMS able to help them work
through these unexpected difficulties? Future studies could address how TMS emergence
and maintenance can be utilized to overcome team crisis.

177
5.6.2 Revised Theoretical Model
The data triangulation in our data collection provided the opportunity to gather
large amounts of information about each team. This allowed for a longitudinal
comparison analysis of the GPD teams. One outcome of our quantitative analysis was
the classification of teams into Strong Teams, Weak Teams, and Outliers.
Figure 5-1 Revised Theoretical Model
Figure 5-1 summarizes our modified theory of the relationships between the
group process enablers, TMS, and group performance based on our observations. Lesson
#1 discusses the influence of cultural diversity which can be observed in the figure as
influencing the interaction between investment in group cohesion and the other virtual
group process enablers. Lesson #2 observed that the investment in group cohesion
enabler played a supporting role in enhancing the other group process enablers. Lesson
#3 illustrated the success of better-performing teams in their ability to balance the use of
virtual tools and F2F meetings. Finally the figure displays our observation of the

178
crystallization of TMS over the duration of the course. The next chapter explores our
construct relationships in industry settings.

179
Chapter 6
Virtual Teams in an Industrial Context: Case Examples
The analyses in the previous chapters focused on cases from a global product
development course. It was a very detailed, longitudinal study of student groups working
on a course project. Are there any parallels to global product development in the real
world? In this chapter, we explore the relationships between virtual group process
enablers, TMS, and performance within two real-world multinational and virtual R&D
teams in exemplar companies. We relate the implications from our industry cases
exploration to our analysis from the global product development course setting. The
investigation in this chapter provides the opportunity to connect our exploratory findings
with real-world occurrences, which will strengthen the practical implications of the
study’s findings.

180
6.1 Industry Case Contexts & Description
6.1.1 Company A: Multinational Fortune 500 Industrial Company
Company A, is a fast-growing diversified company that is based in the U.S. The
company is known for their superior business processes that emphasize continuous
improvement and customer satisfaction. Their strategy is to acquire smaller constituent
companies in different niche markets and grow them to be top performers in their
respective industries, rather than sell them back to make a profit. Company A has used
strong lean processes to perform at a high level for most of the 20 years that they have
existed. Since its inception, Company A has had three CEOs who have continuously
trained their successors to maintain a consistent vision for the company. The company
aims to excel in terms of the value they bring to their customers and stockholders.
Company A has grown organically so it depends on positive cash flow, which
means that the company seeks to create cash within all of their industries. Thus far, they
have consistently earned more cash than they have spent in operating expenses. They are
constantly looking to organically expand via new product development endeavors. The
company boasts of excellent production systems as well as being highly focused in their
operations.
We had the opportunity to interview the Corporate Director of Global Product
Development (GPD) within Company A. During this interview, we were able to gather
insights about how the company utilizes virtual teams in their product development
activities. Section 6.2 discusses this in more detail. Specifically, we focus on the day-to-
day operations of these virtual teams and investigate how our virtual process enablers and

181
the emergence of a transactive memory system enable this company to remain innovative
and successful.
Company A, like GE, is a conglomerate of operating companies, and each
operating company is in a different niche market. Their total annual revenues classify
them as a medium-sized company. The GPD director states: “We position ourselves to
be the leader; establishing leadership positions within the niche markets means ranking in
the top three within the specific industries.” Going after niche markets within different
sectors is a unique industry model; however the strength of Company A lies in its
business system as it has been very successful in using this approach. Company A is
involved in a myriad of industries such as medical, instrumentation, industrial, and
tooling. At this time, they have 41 independently operating companies.
The global product development division of the company involves highly skilled
individuals from across the globe that work in teams to execute their tasks. The
company’s diversification is multinational. At this time, 50 percent of the business
comes from the United States and 50 percent comes from outside the United States. Of
this international 50 percent, 35-40 percent comes from Europe and 10-15 percent comes
from Asia, primarily from China and India. Their goal is to eventually become a global
enterprise, with the following anticipated diversification breakdown: 30 percent in the
United States, 30 percent in Europe, and 30 percent in other countries.

182
6.1.2 Company B: Global Automotive Research and Development Center
Company B is a major Japanese automobile company that has consistently
performed at a high level. It is observed to be a model company for lean. Similarly to
Company A, Company B has also prioritized having a deep understanding of what the
customer values. They focus their key processes to meet those needs while minimizing
waste. They have stayed ahead of the competition in their research and development
activities and continue to manufacture innovative products. In this chapter, we
specifically focus on advanced engineering developments within Company B that are
executed by global virtual teams within one of the company’s technical R&D centers.
We interviewed a principal scientist at one of the North-American technical
research and development centers of Company B. We wanted to understand how he, as a
lead researcher, was able to develop and utilize global virtual teams in satisfying the
demands of the company’s international customer base. Within the R&D center,
engineers develop teams comprised of research scientists from educational institutions
and skilled workers from Japan, where the company is based. This technical center was
recently developed and is the product of a consolidated effort to establish a research
center in North America. Based on the research themes going on in North America,
Company B felt that it would be advantageous to partner with universities in North
America and also to have a research staff that is based in North America.
Most of the activities of the R&D center would be classified as routine product
development—developing and launching the next generation of vehicle X. This study
focused on advanced engineering of new ideas which has a more academic component.
183
The R&D center uses need-based teams to carry out advanced development projects.
Each team has a lead researcher, who is responsible for building the team with
individuals from educational institutions as well as Japan. In our discussion with the lead
researcher at Company B, he discusses his experiences on his most recent global project.
The R&D technical center discussed in this chapter is close to a large Midwestern
university in the United States. The team that he assembled was comprised of one or two
additional research investigators and a testing engineer from this university, and also one
to three advanced development engineers that are based in Japan. Another university in
the Southern part of the United States also contributed research investigators to the
project. The total number of individuals involved in the project at any given time
fluctuated depending on the project state and team member turnover. Both sides (North
America and Japan) engaged management in observing the team’s progress. The team
spent the first year refining the project. At the time of the interview, the project was in its
third year and was nearing completion. Within the R&D center, performance is
evaluated by how well technology is transferred. The lead researcher speaks of his team:
We’ve got a dependent relationship where we’re doing the research, we’re getting the feedback from our customer and it’s an ongoing iterative cycle, of “Is this research in the right direction or not in the right direction? Can we utilize this research? Can we transfer this technology to them adequately?” So you know, we’re going out and finding technology but we also have to distill it for the customer, it’s kind of a request-to-customer relationship and for me, the customer is my counterpart in Japan.
This particular project was one of a collection of projects that each team member
worked on concurrently; however, for core members, this was their main project while

184
peripheral members assisted on an ad-hoc basis. This project’s timeline was calculated
based on the specific research that the team was conducting; moreover, the technological
scope and problem originality of the project also play a role in defining the project’s
duration. The research projects are generally small, but nonetheless uncertain, so a
timeline is maintained to provide clients with an anticipated date of technology arrival.
6.2 Company A: Global Product Development Approach and TMS
In this section, we go into more detail on Company A, the multinational Fortune
500 Corporation that focuses on differentiation in various niche markets. We discuss the
challenges that this company faces in global product development and how the company
successfully manages it. We also present evidence of use of the group process enablers
and TMS. We conclude by considering the role that cultural diversity plays in the GPD
team’s success.
6.2.1 The Challenges of Global Product Development
One of the main challenges of Company A is creating value. Global product
development is a highly complex and focused process and in its GPD endeavors,
Company A consistently aims to stay ahead of the competition. Like other trendsetting
companies, Company A shares their previously-established best practices; however they
maintain exclusivity and privacy in their current activities.
The GPD director also identifies the challenges in the complexities of his role as
the primary individual responsible for global product development in a large number of

185
innovation-driven constituents. As a leader, he must affirm ownership of the entire
organization and exude passion for implementing the organization’s vision. The director
of GPD has two major roles. First, he sets the direction for the global product
development efforts that take place within Company A. He scrutinizes the plans of
collaborative teams and oversees the execution of these plans. In addition to providing
guidance and direction, the GPD director is also responsible for facilitating relationships
between the international entities. In this chapter, we focus on the relationship between
Company A and an R&D center in India, one of their most successful established
partnerships. He makes sure interactions are running smoothly and that the company is
meeting key performance indicators. He adds:
When we see some issues, we really act on those issues quickly, whether issues come from India or from here, we make sure they’re addressed. We really don’t like to deal with issues when it’s too late. You want the first sign of symptoms; you want to address it. But again I’m a facilitator, not a manager. I’m not managing relationships, I’m only facilitating.
Implementing preventive measures remains an ongoing challenge, which they
have been addressing with their lean efforts. How are they executed? Company A
emphasizes continuous dialogue among all parties. Individuals within teams are
constantly in communication about project progress so that they can develop systems to
facilitate problem-prevention and trouble-shooting. They utilize each other’s expertise in
creating these systems and awareness of each other’s skills enables them to address these
problems more efficiently. Thus they are utilizing a transactive memory system in their
problem-solving strategies.

186
6.2.2 How This Company Organizes and Leads PD
In their product development operations, Company A focuses on two
components: organizational learning and exploration of global opportunities. Recall that
Chapter 2 provides a review of the organization learning literature and that our model
(Figure 2-2) identifies team learning, and consequently organizational learning, as an
output of TMS emergence. Similarly, within Company A we observe that organizational
learning is a means of sharing and reflects not just intra-team learning but also inter-team
learning. That is, organization learning involves the different niche organizations
learning from each others’ successes and minimizing their failures. The exploration of
global opportunities through organic growth is another important aspect of the company’s
product development, given its niche-driven focus. Company A aims to consistently
increase its growth and development of new products each year.
Organizational learning involves the consensual exploitation of successes used in
relationships. According to the GPD director, “An organization builds itself on those
experiences of success and failure: success means you do more of those, failure means
you find a way to improve and not do it again. You use someone else’s learning
perspectives.” We confirmed that intra-team learning occurs among the members on the
GPD teams. We also observe that Company A encourages inter-team learning. During
semi-annual face-to-face meetings, team leaders of the GPD teams from all of the
company’s constituents meet to share each other’s experiences, successes and failures,
and coordination and resolution strategies. They also exchange each other’s strengths
and technologies for future interaction and utilization. Given that innovation is an

187
important component of Company A, these team leaders are encouraged to network with
each other and develop ideas. As a result, “these 41 vertical [divisions] that never share
or talk now have started sharing because we have started developing some needs to
share,” the director states. Generally, such activities enable the organization to employ
best practices and improve from within.
Exploration of Global Opportunity
Company A explores global opportunities through global collaborations. One of
the implications of a developing TMS is that it involves the ongoing investment of all
parties involved to improve team, and consequently organizational, processes. We
observed that Company A transitioned from collaborating with other countries on an ad-
hoc project basis to establishing international partnerships. When they utilized an ad-hoc
collaboration format, although the technical employees were highly capable and did the
work that was required of them, they were not vested in it and they essentially provided
no additional value. When Company A began exploring how and with whom they could
develop global collaborations, they found that India possessed a large number of well-
trained intelligent engineers that could share knowledge very quickly because they are
Internet-based. Next, they began exploring how each of the 41 companies could work
with India since each company on its own did not have the critical mass to manage an
outside relationship, according to the director. Also the 41 constituents of Company A
are separate independently-operating companies with nothing in common aside from

188
reporting directly to Company A. Therefore, there would be complexities associated with
one international collaboration moving from one constituent to another.
When they began working in India, the initial business model was unsuccessful
because of the mismanagement of their cohorts in India. However, through the process,
Company A learned that they needed to work to develop long-lasting partnerships. They
acknowledge that the partnership does not develop instantaneously, but rather it takes
years. As the GPD director purports:
[The partnership] will take time, but we’ve got to have that clear vision from Day 1. In the long term, we want to be compatible. We want to have long term relationships; not for one year, but for at least five years or more. Today we have four suppliers in India that we can say are partners. There are a hundred or more engineers working for us. We’re just one company, but because they are working for [Company A], we get all of them – so we get the best of both worlds. [Essentially, the engineers in India are available to all 41 separate operating constituents of Company A]. What made it work and what made it not work? What made it work is that they were treated as a team. Basically, they were adding value.
6.2.3 Evidence of Group Process Enablers
Recall that Company A has a significant international component (50%). We
focus on the partnership with India, where the GPD director has been mostly involved.
However the other locations are also data-centered and also operate on a similar basis.
We now discuss how the global product development teams that are managed by the
director demonstrate the effectiveness of our virtual group process enablers:
communication effectiveness, investment in cohesion, and strategies for division-of-
labor. We relate the implications from our observations to the modified theoretical model
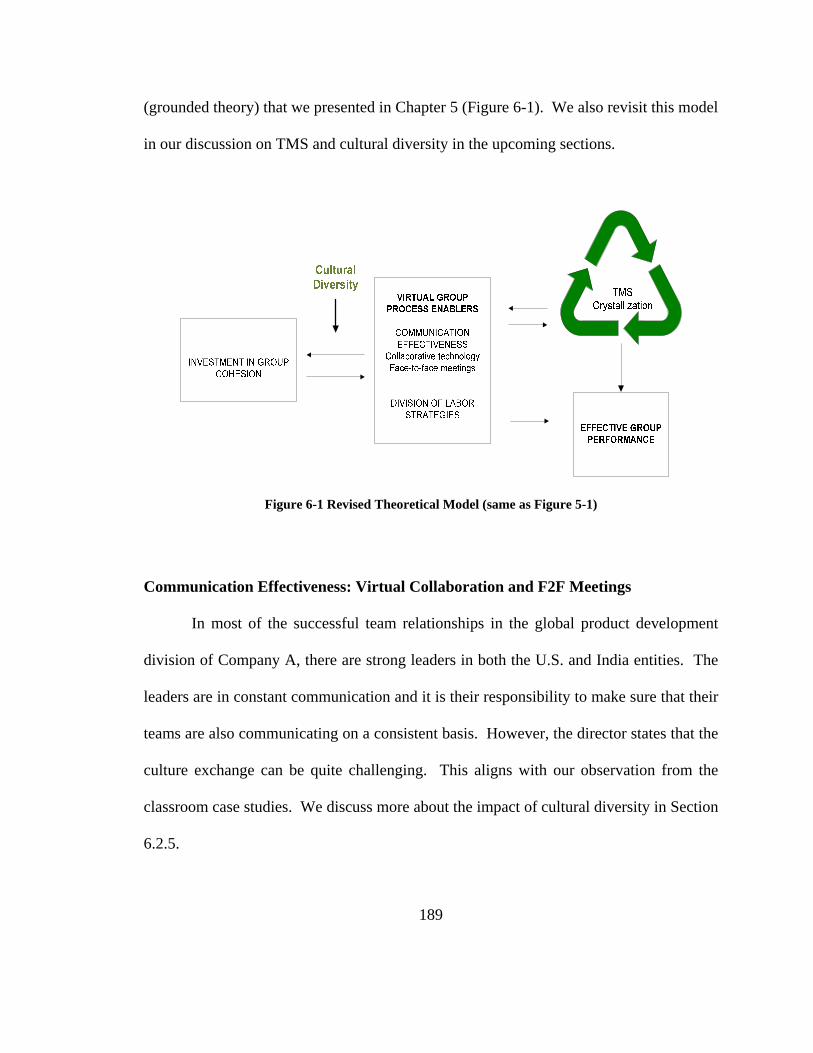
189
(grounded theory) that we presented in Chapter 5 (Figure 6-1). We also revisit this model
in our discussion on TMS and cultural diversity in the upcoming sections.
Figure 6-1 Revised Theoretical Model (same as Figure 5-1)
Communication Effectiveness: Virtual Collaboration and F2F Meetings
In most of the successful team relationships in the global product development
division of Company A, there are strong leaders in both the U.S. and India entities. The
leaders are in constant communication and it is their responsibility to make sure that their
teams are also communicating on a consistent basis. However, the director states that the
culture exchange can be quite challenging. This aligns with our observation from the
classroom case studies. We discuss more about the impact of cultural diversity in Section
6.2.5.

190
In terms of communication tools, team members are more likely to use a tool once
they see the value of it. The important aspect regarding technical communication in
Company A is that the team leaders at each location strive to conduct daily meetings via
telephone or video conference. Doing this keeps all members abreast of project status as
well as the specialized skills necessary to conduct different phases of their projects.
Considering the time difference (there is a 10 hour difference between the two partnering
countries), they must make a compromise in finding a feasible time to meet. They have
found that meeting infrequently can be disastrous to team performance. Some members
use tools such as instant messaging for informal communication, but the teams must still
make an effort to meet frequently to align their processes. What is critical to facilitating
effective virtual communication in Company A is that the global team has strong
leadership and that there is an aligned mentality of being part of one team. This equality
mindset drives the virtual communication that occurs within the team.
The face-to-face aspect of the company’s GPD operations is very critical.
Because of the cultural differences, there is a need for physical communication to occur
frequently. The leaders from each geographical location as well as a significant number
from the team usually meet face-to-face approximately twice a year. The teams use these
F2F meetings to invest more in team cohesion and promote the team’s aligned vision and
equality mindset that is necessary for long-term partnerships. We speculate that a
significant amount of technical work also occurs during these F2F meetings. From a
TMS standpoint, these meetings assist the team in better-understanding how they can best
use each other to achieve the teams’ goals. Thus, as our model (Figure 6-1) suggests, we

191
acknowledge that there exists an association between the global teams’ communication
effectiveness and their investment in team cohesion. Furthermore, communication
effectiveness is essential for TMS emergence and team performance.
Division-of Labor-Strategies
The team’s strategy for division-of-labor depends on the needs of the individual
operating company that the team is a part of. Some of the operating constituents view
their India counterparts as an extension of the team. They observe the strengths in both
locations and take a reciprocal interdependence approach to their tasks, where the team
interaction and communication level is high. Although some of the work is done in
different physical locations, the team works on projects jointly. Such teams have strong
project alignment in both the U.S. and India, and the process works extremely effectively.
The other operating constituents provide their India counterparts with turnkey projects for
them to execute. However, these turnkey projects must still be well-managed to make
sure that the process and product outcomes satisfy expectations.
In our discussion with the GPD director, we do not get a clear sense of the teams’
specific approaches to developing their task division processes, nor are we aware of the
unique skills and contributions that the India team members demonstrate. We are aware
of the high skill level that the engineers from India provide to the partnership as well as
the significant role of the team leaders on the teams. For instance, our conversation with
the director revealed that the team leaders were responsible for facilitating task division
and member involvement within the team. Thus, we speculate that the contributions

192
from the individual members within a team and the successful collaboration among the
members enable the team to develop a TMS and perform effectively (Figure 6-1). We
also speculate that there is an association between the strong group dynamics and the
team’s ability to successfully execute delegated tasks (Figure 6-1).
Investment in Team Cohesion
Company A considers team cohesion a requirement because they believe that this
is how company culture is built. “It’s an absolute must from day one. As much as we
want to learn about them, they need to learn about us. If you recognize the cultural
differences, you can address it. If you don’t recognize the cultural differences, it can
cause a lot of problems.” affirms the director. The leadership of Company A strongly
believes in virtual collaboration; they have also visited India several times in support of
their commitment to a long-term partnership. When employees from the U.S. first visit
India, they go through a two-hour presentation that focuses on the differences in basic
cultural values, which helps in facilitating their interaction with their India counterparts.
Company A invests in group dynamics right from the onset of a project. They
realize that mistakes will inevitably be made when geographically dispersed individuals
collaborate on new projects. However, they strive for clarity in shared expectations and
results and they are critically aware of the time differences. The director has expressed
that developing solid relationships take at least one year. He further discusses the
importance of building relationships:

193
You’ve got to learn to walk before you run. Starting new relationships, you’ve got to allow one year. In the first year, you’re not going to gain – it’s a wash. They need to plan for one year of a learning curve. Not “yes, yes, yes.” Americans have a tendency to want to be nice, they need to be blunt. “No, this is what I expected. This is not what I expected.” This can be done in a nice way. So it takes about a year to get over all this.
Question: Was there any formal mechanism to get everyone on some type of same page?
Response: Everything [Company A] does is in a standard operating procedure. People probably don’t read them. But after about a year, that learning curve is over. If you are really sincere about a real relationship, it is about a year. It just matters how much you commit. There needs to be more of the external team activities, more of the planning from leaders. They’ll help you.
Figure 6-1 is a suitable representation of the interaction between the investment in
group cohesion and the group process enablers. We observe that similarly to our
classroom GPD teams, the GPD teams in Company A found that the investment in
building strong team dynamics was essential for developing effective communication and
strategies for division-of-labor. The next section discusses the impact of cultural
diversity in the team’s project activities.
6.2.4 Management of Cultural Diversity in Global Product Development
After conducting our analysis of the GPD classroom teams, our modified model
(Figure 6-1) indicates that cultural diversity impacts the relationship between investment
in group cohesion and the other group process enablers (communication effectiveness
and division-of-labor strategies). This also implies that cultural diversity will indirectly
impact the strength of the TMS that the group develops as well as the group’s
performance.

194
We have discussed the strong emphasis that Company A places on relationship
building. Building a good relationship meant that the company needed to first find the
right international partner who has expertise and who can add value. However, they have
recognized that the cultural differences are considerable. We observe that cultural
diversity plays a large role in communication differences. The GPD director provides an
example:
In the U.S., when you say “I’ll do it” it means you’ll do it. “I’ll do it on the 17th” means I’ll do it on the 17th. In India, when you say “I’ll do it” it means “I’ll try my best” with no commitments. So when the time comes, they can say “I did everything I could.” These types of differences can cause a lot of problems in communication…We must understand them as they are. Let them understand us as we are. So then we can communicate effectively.
In Company A, the Indian participants do not favor one-to-one communication,
but prefer vertical communication. On the contrary, the American members prefer direct,
horizontal communication. Thus the team leaders have to collaborate in facilitating
effective communication within their teams.
Building the physical interaction with their international partners is critical and is
an ongoing process for Company A. Today, about 10% or 60 of the 550 engineers
working for Company A are within the company. The frequent communication and F2F
meetings that occur between the U.S. and India helps absorb the effects of cultural
diversity within teams as they build team cohesion. Concurrently, stronger team
dynamics enable more effective communication.

195
The impact of cultural diversity is also reflected in the association between group
cohesion and division-of-labor. As the social interactions of the team become stronger,
the team leaders are better able to consider cultural differences in assigning roles and
responsibilities within the virtual team. For Company A, understanding the diverse
cultures that represent the global partnership is the underlying theme in the company’s
global product development operations.
6.2.5 Evidence of TMS Emergence
We now discuss the emergence of transactive memory systems (TMS) in
Company A. Recall that a TMS is characterized by specialization, credibility, and
coordination. In our discussion with the GPD director, he suggests that the order in
which TMS characteristics develop in his GPD teams are: coordination, credibility, and
specialization.
Within Company A, coordination is essential in exploring complex issues
collaboratively, and according to the director, coordination is more basic than credibility
and trust. In the GPD virtual teams, the leaders from India and the U.S. are constantly
coordinating processes within their teams to overcome challenges that result from
cultural differences and from being geographically dispersed. The GPD virtual team
leaders have been successful in instilling this collaborative mindset throughout the whole
team.
The development of effective coordination processes have been observed to build
credibility or trust within the virtual teams of Company A. As the director stated earlier,
establishing solid credibility in Company A takes about a year. He expands on this, “All

196
the members have to have an understanding of each other before they can explore the
strength of each other. And that takes time. Once that happens, then they automatically
will move to specialization.”
From an organizational standpoint, the director notes that most of what was
started in Company A was not based on specialization. Company A already had
expertise in their work and they were looking for resources to supplement, not
compliment their work. Today, some of the operating constituents that are part of
Company A need specific skills. Sometimes these constituents can supply the necessary
skills to execute their tasks themselves; however, Company A is not large enough to
supply all of the necessary expertise needed for all of their projects. Therefore, the
additional skilled resources in India are of tremendous value to them.
Even though they do not need people to cover entire technical specialties,
Company A stresses the importance of utilizing all types of unique expertise; that is, the
company strives to employ “non-technical” suggestions/approaches from its global
collaborators. The director explains, “Each person has a unique strength to offer – the
challenge is figuring out how to capture this strength and make it work for the company.
Such strengths are not necessarily technical.” The goal of this is to enhance innovative
thinking, which is a major thrust of global product development with Company A as the
company is developing processes to capture the innovative thought. Employees in the
U.S. and India are being encouraged by the company to develop new innovation ideas as
a team.

197
For Company A, developing a TMS requires the development of a sharing
system: after focusing on coordination, trust and specialization usually follow.
Geographically dispersed individuals realize that the common team goal is more
important than individual goals and they seek out each other’s expertise to achieve this
common goal. We observe that TMS crystallization occurs over time given the time it
takes to develop a relationship between international partners. We now investigate how
the model applies in Company B.
6.3 Company B: Global Product Development Approach and TMS
Company B is an established global leader in the automotive industry. They are
well known for their lean practices in manufacturing and product development. Many
companies benchmark the practices of Company B. Unlike Company A, they have
grown organically, not through acquisition. They have for decades worked to build a
strong internal culture of continuous improvement and spread that to their suppliers and
partners. They very carefully select all of their partners with compatibility with the
company philosophy and culture. Company B is headquartered in Japan and has R&D
affiliates in the U.S., Thailand, and Europe. This case is about advanced R&D activities
that they are leading out of the American center and are being done in collaboration with
universities.

198
6.3.1 The Challenges of Global Product Development
We discuss the challenges faced by the technical research and development center
of this company. The lead researcher emphasized that a main challenge of the global
team was establishing organizational equity between the U.S. and Japanese entities. For
distributed virtual teams, this means that one location does not outrank another location;
rather all parties make significant contributions at all levels of the team, which is an
important aspect of TMS. Both parties have a vested interest in the final product so no
subordinate or superior should exist within the team. Organizational equity is especially
important for sensitive projects involving technology transfer, similarly to what the GPD
R&D team was working on. The lead researcher at Company B elaborates on this:
One thing that works with my Japanese counterparts is making sure that there is some organizational equality. You have to have [this] in a distributed team. You may have someone on a distributed team that outranks you but it shouldn’t be that one geographical location outranks the other. In particular in research, if you want some type of seamless technology transfer, you’ve got to push for that organizational equality. Our thoughts are: “You know we understand that you are our customer but we both have a vested interest in making this project successful and transferring this technology and making our whole company successful.
Another ongoing challenge that Company B faces is making sure that the team’s
vision is aligned among all members. This means that members of the team understand
the vision the same way at the same time. In directing his team, the lead researcher has
discovered that developing this collective vision together as a team is essential.
Alternatively, the team’s vision can be shared with all members at the same time in a
consistent way to the point where people understand it and interpret it the same way.

199
“The collective vision is important. If everyone has a different vision of the goal then
you guys are not going anywhere,” asserts the lead researcher.
A challenge of working in a global product development team is “trying to
understand the needs of people in advance development and trying to go out and find
concepts that are out there or come up with our own ideas.” Upon joining Company B,
the lead researcher was assigned a project that the company was trying to execute so he
assumed the task of building a research lab from the ground up. The team was able to
collectively define the scope of the project and determine their target of focus. After this,
they partnered with a university that already had a research infrastructure in place to
augment their efforts.
In discussing the main project that he is facilitating, the lead researcher highlights
the long and uncertain nature of the project as a factor that impacts the consistency
necessary for execution. This uncertainty affects project funding which depends on the
progressive results of the project. In addition, although the team members executing the
project have remained consistent, the team’s management has been affected due to
rotations, which has also been a challenge for team members.
6.3.2 How This Company Organizes and Leads PD
For Company B, establishing solid leadership is a foundational piece of what
makes them so successful. The technical center within Company B has observed that
having the right level of management support has enabled the team to operate
autonomously. Team members self-sort in terms of role identification and member
expertise. Furthermore, since global team members are usually involved in multiple

200
projects, there are several overlapping networks on each global project that can be
utilized on this particular technology transfer project. Another successful approach of the
team is that they place a high emphasis on being able to meet their performance targets.
The performance metric that the team uses focuses on the success of information transfer
to their colleagues such that the technology is understandable and useful.
The team is funded by the advanced development division of Company B in
Japan. As the project has progressed, funding for the overall project has grown and
evolved. Continued funding is a good indicator of the project’s performance and the
team’s progress.
6.3.3 Evidence of Group Process Enablers
We revisit our modified theoretical model (Figure 6-1) which we refer to in our
discussion of group process enablers in the GPD team within Company B.
Communication Effectiveness: Virtual Collaboration and F2F Meetings
The virtual teams in the R&D technical center in Company B use a wide variety
of virtual tools to collaborate. In addition to email and teleconferencing, many teams
have found video conferencing to be essential. The visual cues provide confirmation
about whether all members are in agreement, which is especially vital for technology
transfer projects. One challenge that teams face is video conference accessibility. The
video conference is a scarce resource in the R&D center because many teams value this
tool and the “golden time,” when all parties are able to participate given the time
differences, is very small. Therefore, team members frequently have to make availability
201
sacrifices. The lead researcher suggests that equipping all individual desktops with
webcams will help alleviate this problem and hopes that Company B is able to move in
that direction. The team tries to communicate via video conference once every two
months, but this depends on accessibility. The team also utilizes a file exchange
mechanism to transfer files.
Regarding teleconferences, the lead researcher mentions that it is used more
frequently between the two research institutions in North America. The institutions
communicate weekly via teleconference without experiencing any challenges relating to
the non-visual nature of the teleconference. Furthermore, more F2F meetings occur
between the universities, which alleviate the strain of the teleconference meetings.
Teleconferences are rarely used with the Japan counterparts because they are not
particularly convenient.
The GPD team within Company B has found face-to-face meetings to be the most
effective form of interaction, given that they are working on highly complex projects.
With the local North American universities, it is less of a financial strain to meet F2F
frequently. In establishing project milestones, the team tries to have all parties meet F2F
as much as possible. However, cross-continental travel to Japan can be financially
straining and time consuming given the members’ other project demands, so the team
combines reviews and milestones into what are usually intense F2F meetings. These F2F
meetings are also used as training opportunities, where the university researchers conduct
workshops on the technology being utilized in the project to raise the technology level of

202
other members. The F2F meetings occur about two or three times per year. The lead
researcher discusses the significance of F2F meetings:
For successful knowledge transfer it is essential that everyone sit across from one another and discuss the technical point and [no one] leaves the room until everyone agrees. Just the opportunity to be able to have everyone draw on the same white board or the same piece of paper is essential. I think that the ability to take a piece of paper and start explaining a technical concept is its own true real time. In February for a project view, I took the graduate student that was working with us to directly explain it and all three entities are sitting in the same room talking about a point and no one leaves until everyone understands, it’s very nice. This is where the F2F part of it comes in. It’d be great to do [F2F] as much as possible but it is very expensive.
Since domestic traveling is easier and more affordable, representatives from the
Midwestern R&D (hub) center go to the other university once every month or two in
addition to their weekly teleconferences. At least one member of the hub center goes to
Japan for a F2F between 2-3 times per year. The team found the first F2F meeting
particularly critical for aligning the team members’ vision, establishing commitment, and
delegating tasks, hence the importance of early F2F meetings. The lead researcher
observes that “The first F2F meeting was a giant stride. They saw that I was a member of
this company, I was here to do this project, and I was committed to it. That first F2F was
essential at the start.”
Company B values the development of solid relationships between individuals in
the facilitation of effective communication, especially where technology transfer is
involved. This supports our classroom case study observations as we see from the
association between investment in team cohesion and communication effectiveness in our

203
modified research model. They stress the importance of having open and clear lines of
communication so that there is no ambiguity or vagueness. To enable this, the lead
researcher enforces the distribution of regular progress report updates to all parties
involved. They have found that task clarity can affect both F2F and video conference
meeting frequency.
Division-of-Labor Strategies
The lead researcher could not go into specific details on task assignments due to
the confidential nature of the team’s work. However he noted that project roles and
responsibilities within the team are identified in the early stages of the project. This is
important due to the nature of the project. Therefore early F2F meetings are especially
valuable for identifying task assignments early on, which are also facilitated by the social
interactions that the team engages in. The modified model in Figure 6-1 highlights the
association between team cohesion and division-of-labor structuring. At every step the
team makes it a point to identify where time is best spent and who should be doing what.
The lead researcher admits that there was some initial vagueness in clarifying
expectations from each entity.
The team started out with two core members. The lead researcher saw the need to
create a lab when his parallel projects came into play. He has since recruited some
additional highly-skilled members, but has remained involved since he had seen the
project from the start. Regarding the evolution of team involvement:

204
That actually happens a lot in [Company B], seldom does someone say, “You have 100 people, do this.” It’s more, “We have a new project coming on the horizon, why not these first few people get it started and then we’ll add more as needed.” It is need-based; it really is need-based. We grew as our needs grew, at every step we would assess who should be doing what. That is a challenge because if you are the person who has been doing everything, at a certain point you need to decide, “What are you best at doing?” Even if you are the best-qualified person to do all the tasks, you can’t do them all. You have to decide where your time is best spent and how new people can ramp up and perform adequately as well.
As more people joined the team, the team underwent an evolution of roles, based on
project needs and changing skill availability. As the research project progressed, the
team determined that the Japanese component needed the appropriate receiving team on
their end to advance the technology to the next step. Therefore, they got the potential
candidates that would be doing the design, development, and further engineering engaged
on their end. It was important to have the appropriate receiving infrastructure there and
the Japanese counterparts were able to put their own foresight into it.
Investment in Team Cohesion
Company B places a strong emphasis on relationship-building since there is a
long-term partnership established between Japan and North America. The company’s
continuous efforts to develop group dynamics have lead to clearer expectations and
stronger credibility among team members. The team expressed that having a F2F
meeting at the start of the project was essential. They extended this F2F meeting beyond
task-related purposes and seized the opportunity to develop personal relationships and

205
familiarity with each other so that all members could develop an understanding of the
individuals that they were working with. Nevertheless, the team has still needed to
overcome misaligned expectations, which has impacted credibility within the team,
particularly between the U.S. and Japanese entities. The lead researcher has found that
placing himself in the other party’s shoes, clarifying expectations, and exercising
humility have been effective approaches that he has used in facilitating a smoother
working relationship.
The Midwestern R&D technical center serves as the hub in the virtual team. Most
of the information for the relationship of the group flows through the hub center. The
Japan counterparts would not contact the members at the Southern university without
going through the hub center and vice versa so essentially the hub manages the team’s
international relationships. During project reviews, members from the Southern
university have gone with hub members to Japan for meetings. Similarly, Japanese
representatives have also accompanied hub center representatives to the Southern
university. The hub center also has regular meetings with each party exclusively as well.
The lead researcher, who is located in the hub center, usually participates in the 2-
3 annual F2F meetings that take place in Japan. During these meetings, he makes an
effort to stay nearby and have meals with his team. Similarly when the Japanese
counterparts visit the team in the U.S., he makes himself available in the evenings so that
they can interact socially. He expresses that doing this enables the team to get a real
sense of each other.

206
It’s really important because it’s one thing to blab about technical items all day long. It’s another thing to get a real feel for the person. “Do they understand what you’re doing for them? Do they understand what is going on? What’s going on in your organization that might prevent you from answering their emails?” They might be thinking “Why haven’t they been able to get in touch with me? Is this something I should expect from this person?” It gives us insight into each other’s organizations. With our counterparts in [the South], it’s a bit easier b/c I’ve been in a U.S. university and I kind of understand their perspective. My manager is Japanese and I’ll take him there so that he can understand their perspective, the goals of a university and our goal with our counterpart in Japan is completely different. They want to graduate their students and we want to disseminate technology to our advanced technology groups so that they can start doing their product development on it. So that’s sort of the relationship we have.
Similarly to Company A, Company B also places a high value in establishing
ongoing social networking among members of the global R&D team. We observe that
the investment in understanding the perspectives of all parties involved enables the team
to function more effectively. Thus our analysis of Company B also relates to our
modified model from the classroom case studies, which suggests that investment in team
cohesion influences effective communication and labor division. We now observe the
impact of cultural diversity in Company B.
6.3.4 Management of Cultural Diversity in Global Product Development
This chapter has provided vignettes that illustrate the varying cultural perspectives
within GPD teams. For Company B, the lead researcher expressed that the diversity in
his team’s cultural backgrounds has played a role in his leadership mindset. He
mentioned that one of the hardest aspects was initially dealing with the U.S./Japan
relationship. He observed that both the U.S. and Japanese parties initially tended to
approach the project with varying expectations about how the other party should think

207
and what is expected of the other party. The lead researcher has advocated that his team
should always try to put themselves in the other party’s shoes.
We observed that the cultural differences of our focus team of Company B
appeared to play a role in the initial development of team member credibility and
coordination. The team has since established a better system that enforces clarity of
expectations between parties. Also, the emphasis that the team places on organizational
equity – equality among all parties involved – has contributed to a smooth and
collaborative working relationship.
The team found that developing a cohesive relationship also established a comfort
level among team members. The lead researcher expressed that generating a comfort
level within teams such that members can freely say “I don’t understand” can go a long
way in executing project tasks. The team is comprised of diverse highly-skilled
individuals working on a very complex project. He admits that it can be challenging,
particularly with teammates from different cultures, to express a lack of knowledge or
lack of understanding without feeling that a bad perception has been generated. He
encourages team members to maintain a comfort level so that members are encouraged to
ask for help as needed. Therefore we also observe that cultural diversity also plays a role
in the interaction between team coordination and execution and team cohesion
investment and developing trust is a key enabler.

208
6.3.5 Evidence of TMS Emergence
In this section, we related the management approach of the GPD team in
Company B to characteristics of an effective TMS to develop and utilize a shared
awareness of who-knows-what within their team. We have observed that from the onset
in a project, the team was diligent about determining individual specialization and using
this expertise to allocate tasks. Individual expertise is particularly valued within
Company B. Since team membership is constantly evolving based on project needs and
task-expertise-person fit, it is critical that the team is constantly aware of the
specialization that exists within the team. Knowing the team’s expertise capability
enabled the lead researcher to make adjustments as necessary: “I knew that we needed a
specialist who knew certain simulation skills so we went and sought that person out and
then since we had a lab I knew we should have a test engineer or a research engineer who
should be involved with apparatus creation and measurement.”
As we discussed earlier, projects are driven by available funding in Company B.
Thus, in addition to making sure that the team is adequately skillfully-equipped, the lead
researcher and his team also establish coordination practices characterized by project
clarity and consistent communication. Since the project funding is dependent on project
progress, the team must illustrate that they are able to execute their tasks efficiently and
effectively.
The lead researcher has observed that credibility among team members is
necessary for any progress to be made on their project. We have discussed the emphasis
that Company B places on F2F meetings, particularly in the earlier stages of the project

209
when perceptions are still being formed. He provides an example of just how difficult
building credibility can be in overcoming the cultural differences within global virtual
teams:
You can be recognized in your field as a specialist. For instance, my colleagues in Japan know that I have a Ph.D. I think in the American culture, we have the benefit-of-the-doubt type of system, where you give someone the opportunity to prove you wrong, but what’s different with my Japanese colleagues is that they’re waiting for me to prove myself right. I start out with zero credibility and go from there. I mean I think they take [my degree] into account in terms of “they’re qualified to work on this project,” but in terms of expectations as output, they want to see their problems solved before they establish a level of credibility. I have the necessary skills to fill a position but it is unknown as to how well I’ll perform the tasks of the position. We tend to say, “Well this person has done this and this and this, give them the benefit of the doubt, they might be slow to ramp up.” I think there’s a cognition that the person will be slow to ramp up from my Japanese colleagues, but for their expectations in terms of the credibility of how well the person will do, they wait until it’s demonstrated. It’s a very interesting phenomenon – you have to build up the trust. I’m in tune with it now so I know that when we start out, I have to establish my level of credibility and once that’s established we can move forward.
Thus we observe that in spite of the ongoing team member additions and changes,
there is evidence of the TMS characteristics (specialization, credibility, and coordination)
within the lead researcher’s project team. Specifically, gradual TMS crystallization is
observed based on our observations of the extensive project duration. Furthermore, we
observe that the team makes successful use of the virtual group process enablers –
communication effectiveness and strategies for division-of-labor – in developing the
TMS characteristics and in performing effectively.

210
6.4 Summary Observations from Global PD Exemplars
The case examples discussed in this chapter are individual global product
development teams within exemplar companies. These cases are by no means indicative
of all global teams within these companies. Rather they present a glimpse of successful
global product development.
The goal of this chapter was to relate the implications from our industry cases
exploration to our analysis from the global product development course setting. We
observe similarities in the infrastructure of the product development teams in Company A
and Company B. Both teams emphasized the significance of having a strong team leader
to direct the “local” team, facilitate communication, and serve as a point of contact to the
team and to senior management. Recall that in our classroom case studies, two of the
successful teams (Team Communicate and Team Camaraderie) also self-selected a team
leader to assist in facilitating project execution. The other successful team, Team Strong
Finish, relied on the project management expertise in several of their members to execute
the project. As we read in this chapter, our industry case analysis strongly supports the
significance of team leaders within global virtual R&D teams. Therefore, we modify our
research design model (Figure 6-2) to include the impact of team leadership in the
interaction between the team’s utilization of the virtual group process enablers and TMS
crystallization as well as the interaction between group process enablers and group
performance. We observed that in both industry cases, the team leader was essential in
developing and directing the team as well as serving as a point of continuity. The team
leader facilitated the awareness and utilization of individual expertise and was also
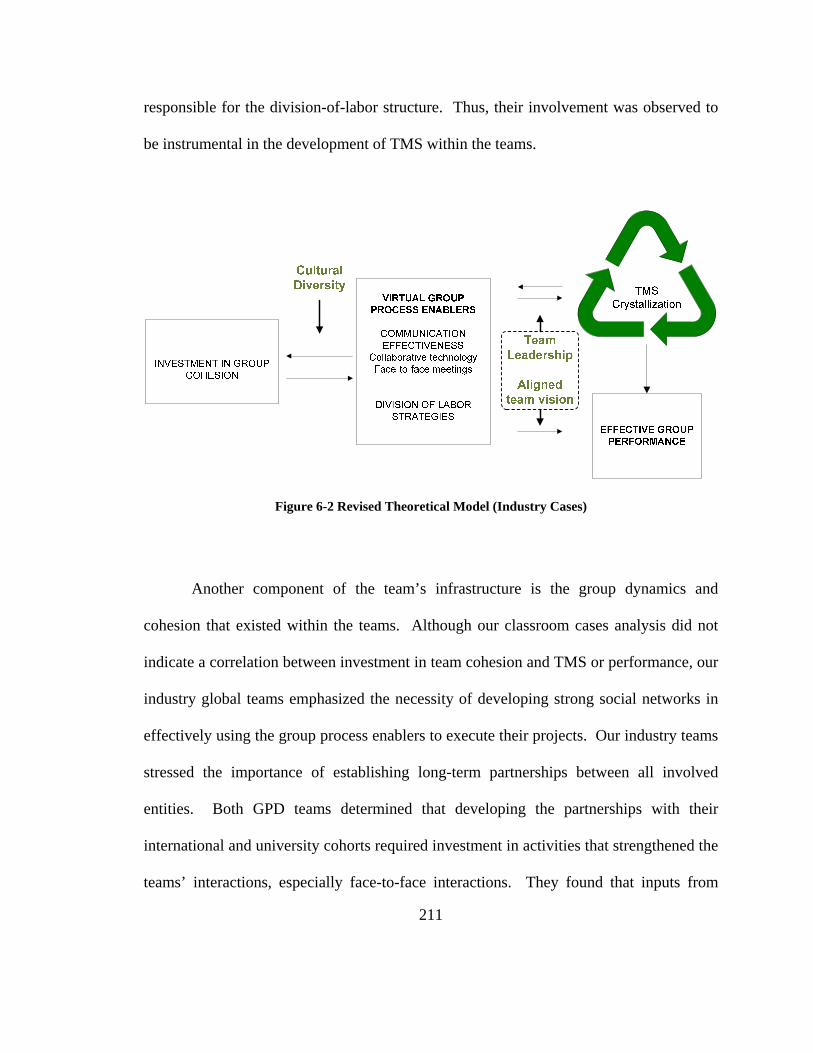
211
responsible for the division-of-labor structure. Thus, their involvement was observed to
be instrumental in the development of TMS within the teams.
Figure 6-2 Revised Theoretical Model (Industry Cases)
Another component of the team’s infrastructure is the group dynamics and
cohesion that existed within the teams. Although our classroom cases analysis did not
indicate a correlation between investment in team cohesion and TMS or performance, our
industry global teams emphasized the necessity of developing strong social networks in
effectively using the group process enablers to execute their projects. Our industry teams
stressed the importance of establishing long-term partnerships between all involved
entities. Both GPD teams determined that developing the partnerships with their
international and university cohorts required investment in activities that strengthened the
teams’ interactions, especially face-to-face interactions. They found that inputs from

212
each party are more likely to create value when all members play an equal role and
contribute equally, which Company B identified as the cultivation of organizational
equity. Company A also found that organizational equity and team member familiarity
enhances innovation within the company. Overall, GPD teams in both Company A and
Company B agree that investing in group cohesion kept the teams’ unifying goals and
vision in focus. Thus, similarly to the impact of team leadership, we also suggest that the
alignment of the team goals and vision influences the interaction between virtual group
process enablers and TMS as well as the interaction between virtual group process
enablers and group performance. Moreover, additional studies should be conducted to
strengthen these observations.
In reference to the teams’ composition, we also explored the role that cultural
diversity played in the teams’ operations. The GPD teams from both Company A and B
admitted that communication clarity was essential in establishing and maintaining
effective working relationships within teams with culturally diverse team members.
Similarly to the student teams that we investigated, we also observed that the impact of
cultural diversity in our industry teams influenced the relationship between group
cohesion and the utilization of the virtual group process enablers. Unlike the student-
teams however, we observe that each of our exemplar companies have a clearly
identifiable company culture that permeates throughout the organization. This culture is
embodied by the employees, regardless of location, and this enhances the ability of
geographically dispersed individuals to stay motivated, maintain an aligned vision, and
collaborate effectively within a team.

213
In addition to the team infrastructure, the teams’ communication effectiveness,
specifically the utilization of F2F meetings was a contributing factor to the teams’
success. The F2F meetings are essential for overcoming cultural differences and for
establishing common ground within the teams, which Company A emphasized. Also
importantly as Company B expressed, the F2F meeting is the ideal venue where the team
can visualize technical discussions and work collaboratively more effectively. Both
Company A and Company B expressed that the timing of the F2F meetings was thought
to also play a role in the teams’ ability to develop a TMS and perform effectively. F2F
meetings that are held earlier during the project provide the opportunity to align the
team’s vision and direction and develop the task execution and division structure.
The virtual R&D teams utilized differing approaches in their task delegation
strategies. Task structuring in Company A GPD teams differed based on the needs of the
individual constituent. In Company B, the GPD team leaders continuously evaluate the
task-person-expertise fit due to changing members and roles within the team, and make
changes accordingly. We observe a difference in the division of labor strategies of our
classroom case studies and the industry GPD teams. While most of our classroom teams
utilized a volunteer approach to divide the project components among themselves, the
team leaders were more involved in delegating tasks within the industry virtual R&D
teams.
We observe from our industry cases that TMS development and crystallization
takes a significant amount of time, due to the long-term partnerships that the companies
have developed with their international cohorts and domestic universities. The GPD

214
teams from Company A and Company B were both able to use specialized expertise
within the teams to coordinate and build credibility while executing the projects. Both
virtual teams had highly-skilled individuals that were engaged in complex projects.
Company A takes a broader approach to TMS by placing additional emphasis on the non-
technical skills and the unique way of thinking that each party brings to the team. While
the GPD teams in Company A initiates TMS development with coordination strategies,
the focus on the GPD team in Company B is initially on specialization, due to the nature
of their project as advanced R&D with a less tangible output. Nevertheless, both teams
exhibit all three characteristics of TMS and both teams use them to perform their tasks.
In summary, Company A and Company B are two highly successful organizations
that face the challenges of creating value and maintaining equally valuable partnerships.
We have observed how supportive management and team leadership has contributed to
their effective product development on a global scale. The virtual GPD teams are able to
invest in team cohesion and utilize the virtual group process enablers to develop
crystallized transactive memory systems and perform successfully. As the lead
researcher from Company B notes:
These kinds of distributed teams can thrive given the way technology is moving…I think as long as you’ve got an organization that is supportive of developing that kind of infrastructure, you make it easy for people to work with one another…I see no reason why a distributed team shouldn’t perform as well as a collocated team.

215
Chapter 7
Conclusion
7.1 Summary and Implications
The development of a strong transactive memory system (TMS) has been
observed to improve team performance; however this observation has been made in
primarily collocated settings. Less attention has been directed to its emergence and
effectiveness in virtual teams. This dissertation addressed this important issue by
exploring the effectiveness of global product development teams through a transactive
memory perspective. We examined global groups at work through an intensive study of
cross-national student teams and case studies of two exemplar companies that work
across boundaries. Based on our understanding of the teamwork literature and TMS, we
identified three salient virtual group process enablers and sought to investigate their roles
in transactive memory system emergence within these teams. These enablers are:
communication effectiveness, investment in group cohesion, and strategies for division-
of-labor. Our research study was categorized into three research questions. The key
findings are summarized below.

216
Research Question #1: What relationship develops between virtual Group Process
Enablers (GPEs) and the emergence of transactive memory systems?
Our correlation analysis of the student-team study showed a weak correlation
between the cohesion investment enabler and TMS. Thus we focus on the
communication effectiveness and division-of-labor strategy enablers. For the
communication effectiveness enabler, we evaluated both virtual collaboration and the
utilization of face-to-face (F2F) meetings. In the case of virtual collaboration, we
observed a significant improvement over time in the relationship between virtual
communication and TMS emergence. For the F2F meetings conducted at the beginning
and at the end of the project, we observe that the relationship to TMS remains constantly
strong, which suggests the significance of F2F meetings for developing a strong TMS.
The relationship between the division-of-labor enabler started out very strong.
Over time this relationship between awareness/utilization of task specialization and
delegation of tasks grows weaker as the teams begin to execute tasks and re-evaluate the
task-person-expertise fit based on initial outcomes. This relationship only slightly
improves as the project concludes. Successful teams identified the strengths and unique
knowledge of individual team members and then developed effective TMS to tap into
that knowledge base.
Research Question #2: How do Group Process Enablers (GPEs) impact overall team
performance?
217
In examining this research question, we again focus on the communication
effectiveness and division-of-labor strategy enablers. Student team performance was
evaluated by both the students and the course professor. Similarly to the relationship
between virtual collaboration and TMS, we also observe an improvement over time in the
relationship between virtual collaboration and the student and professor assessments of
team performance. The teams’ acknowledged the significance of consistent virtual
communication that engages all team members.
In the relationship between the utilization of F2F meetings and team performance,
we observe different patterns in the student and professor evaluations. The correlation
between the students’ evaluation of their use of F2F meetings and the evaluation of their
performance remains strong for both of the F2F meetings, but the relationship is a bit
weaker and less consistent than for virtual communication. Through the qualitative
studies, it became clear that the most successful teams were capitalizing on the strengths
of both F2F meetings and virtual communication and finding the right symbiotic balance
between these communication methods.
In the relationship between the division-of-labor strategies enabler and student-
evaluated team performance, we observe a similar pattern to the relationship between the
division-of-labor strategies enabler and TMS. The relationship starts out fairly strong,
before becoming weaker as the course progressed, and then eventually improving again
at the conclusion of the course. It seems particularly important to establish a good
division of labor early in the development of the team and then this evolves over time as
individuals learn more about each other and can reassess task assignments accordingly.

218
Research Question #3: How does transactive memory system emergence affect team
performance over time within virtual groups?
This last question explores the relationship between TMS and team performance,
which prior research studies have confirmed. In the relationship between TMS and
student-assessed performance, we observe a growing correlation as the course progresses,
as observed in prior studies. Unlike the TMS and student-assessed performance
relationship, the relationship between TMS and professor-assessed performance begins
with a strong negative correlation. However, we observe that it improves during the
course of the project and the project concludes with an observable relationship between
the two. Our qualitative analysis in Chapter 5 illustrated that the stronger-performing
teams were able to successfully develop and utilize a TMS to accomplish their tasks. The
weaker-performing teams were unable to develop a crystallized TMS by the conclusion
of the semester.
We also found that the virtual group enablers, communication effectiveness in
particular, have the strongest association with TMS emergence. We suspect that the
relationships between communication effectiveness, both virtual and F2F, and TMS are a
two-way process. Effective communication leads to an applied understanding of
individual expertise.
Exemplar Case Studies

219
We examined virtual R&D teams within two successful companies for evidence
of our group process enablers and TMS emergence. We identify Company A as a
multinational Fortune 500 company and Company B as a global automotive research and
development center. Both of these companies support the necessity of all three virtual
group enablers for effective global team performance. GPD teams within these
companies engage in frequent communication through virtual collaborative tools and F2F
meetings. Constant communication is essential, especially within such industries that
employ highly-skilled individuals that collaborate across boundaries. Company B
discussed the importance of video conferencing which, in addition to being cost-
effective, is especially valuable in engaging all members and affirming understanding.
F2F meetings were also a necessity; however, the teams suggested that the timing of the
F2F meetings were also important. For instance, F2F meetings that occur earlier in the
project enable the teams to establish milestones early, develop cultural awareness, and
align the teams’ goals.
Although our student-team analysis did not indicate a correlation between
investment in team cohesion and TMS or performance, our industry global teams
emphasized the necessity of developing strong social networks in accomplishing their
tasks. The long-term partnerships that the companies have established with their
international counterparts require familiarity between all entities. The case study team in
Company A believed that a team’s culture is built on team cohesion and invests in group
dynamics from the project’s inception. The case study team in Company B realized that

220
social interactions were essential for understanding differing perspectives and
establishing a comfort level that facilitates effective task execution.
The GPD teams utilized differing approaches in their task delegation strategies.
The teams in Company A employed different strategies that depended on the individual
constituent’s operating needs. However the individuals working on global product
development projects are all very skilled and are utilized in the most effective way that
adds value to the company and upholds the company’s vision. In Company B, the GPD
team places a strong emphasis on task-person-expertise fit because the members and roles
are consistently changing within a team as the project progresses.
Implications
One key observation that we made in our intensive study of the student-teams and
our exploration of the industry case teams was the role of team cohesion. Prior studies
have found that building cohesion is necessary for virtual team effectiveness. In our
student-team study, our analysis suggests that there is a weak association between
investing in team cohesion and team performance. It is worth noting that these project
teams were assembled for ad-hoc projects that lasted 14 weeks. Furthermore, participants
were also engaged in other classes, leaving many participants to question whether the
need to interact socially was worth the additional time sacrifice. Some teams utilized
“swift trust” to develop group dynamics. Others (mostly weaker-performing teams) did
not make considerable investments in team cohesion. Our industry cases emphasized the
significance of their long-term partnerships and that the social networking that occurred
221
between international members was instrumental in sustaining these partnerships. Our
qualitative analysis on the student teams (Chapter 5) also did illustrate the necessity of
investing in team cohesion. We observed that in our student-team study, there appeared
to be an association between the investment in team cohesion and the other enablers.
We also observe the significance of F2F meetings in our student-team and
industry case studies. This implies that although these teams operate virtually, there is
still a necessity for in-person interactions, especially when working globally. Our
industry studies show the importance of establishing an early understanding of member
personalities which can aid in the transfer of tacit knowledge even within virtual teams.
However once member familiarity and expertise are established early on, it is essential
that effective communication continues to sustain team effectiveness. In our student-
team study, the weaker-performing teams were able to utilize their first F2F meeting well
and were successful in working collaboratively; however, they were unable to sustain this
high level of performance due to detached virtual collaboration as the project progressed.
The more successful teams were able to effectively balance both communication
approaches (virtual tools and F2F meetings) as the semester progressed which led to a
better performance outcome.
Since this was an exploratory study, we also suggest theoretical implications that
emerge from our findings. This dissertation investigated relationships between group
process enablers, TMS and team performance and we were able to make some interesting
observations as indicated in our revised theoretical models. Specifically, we identified
the following observations from our classroom and industry case studies: the supportive
222
role of group cohesion, the complimentary relationship between virtual tool use and F2F
meetings, the gradual crystallization of TMS, and the influence of cultural diversity, team
leadership, and aligned team vision on TMS emergence and team performance.
However, our current observations are based only on an in-depth exploration of eight
global virtual classroom teams and a broader analysis of two industry global team
settings. Future empirical research that tests the relationships observed as well as the
evolution of our theoretical model would contribute to the study' findings. For instance,
experimental studies featuring industry project teams would help address some external
validity concerns and clarify the boundary conditions of our observations. Additional
research can also determine where relevant team mechanisms such as boundary spanning
and benchmarking fit on the model.
This study’s contribution to research and practice results in a better understanding
of global virtual teams by extending the TMS construct to a virtual environment. We
consider knowledge management and organizational learning from a global virtual team
standpoint. We also investigate how teams can overcome cultural diversity obstacles to
accomplish their goals. Culturally diverse global team members are better able to relate
to each other when they focus on communicating effectively, utilizing F2F meetings
adequately, and investing in team cohesion. Finally, determining collaborative tools that
all members have access to and establishing communication practices that all members
adhere to are essential for effective communication in a virtual environment.

223
7.2 Limitations
The student teams that we observed worked on product development projects that
had a specified duration of 3.5 months. Our industry cases suggest that global product
development team projects within industry usually last for a considerably longer time
frame than our student-team case studies did. The duration for GPD projects in Company
A and Company B varied from one to three years. Thus, in these industry studies, there
is more incentive to develop team cohesion, rather than utilize “swift” trust. However
Hackman (1987) argues that the artificiality belief of “laboratory” research is misplaced.
He suggests that “when appropriately conceived and executed, laboratory research can
generate powerful tests of conceptual propositions” (318). Furthermore, as we
highlighted in Chapter 3, the GPD course was a graduate-level engineering course that
involved highly-complex tasks. Several of the participants had prior industry work
experience and claimed that the experience that they gained from the course would be
invaluable in their industrial careers. Nonetheless, in-depth investigations into industry
virtual teams would make significant contributions to the extension of TMS to global
teams.
The comparably low survey completion rate for Teams 5, 6, and 8 at Time 1 is
another limiting factor. As a result, we were unable to include these teams in our TMS
analysis at Time 1. Although we are making no causality claims in our analysis, our
sample size is fairly small and the smaller the data, the greater the impact to the
significance of the study. We do conduct a qualitative analysis in Chapter 5 to explore
the teams in more depth beyond their quantitative assessments. However, we
224
acknowledge that a larger data set for quantitative analyzing would enrich our
observations.
7.3 Recommendations for Future Research
Given that this is a relatively novel study, more research that extends TMS
implications to virtual environments would increase our knowledge on how teams learn
and utilize knowledge in a global context. Additional explorations in global teams that
use a larger and more diverse sample of teams would contribute to the growing literature
on global team effectiveness. Also interesting would be to investigate how virtual teams
deal with crisis, based on the experiences of two of our stronger-performing student
teams. We also observed the formation of subunits or dyads within teams and recognize
that forming subunits by itself can either be a problem or could be a strategy. It would be
interesting to investigate if subunits, when structured right, can impact virtual
performance. It would be useful to explore the relationships between virtual group
enablers as well as other factors such as task complexity; that is, the types of projects that
teams undertake could be significant. TMS development could be affected differently by
tasks that have a physical component (e.g. prototype or product) or a more knowledge-
independent task (e.g. creating a software program).
In this dissertation, we have investigated team processes from the group
perspective so varying the level of analysis to comprehend team effectiveness and
performance is another extension that can be explored. Understanding how the

225
individuals that make up a team are motivated and how they create, retain, use, and
transfer knowledge could deepen our understanding of team processes. In investigating
the individual component, it would be interesting to explore the role of team leaders or
emergent leaders and effective leadership within global virtual teams. Our student-team
and industry case studies illustrated the importance of the individuals in leadership
positions within the team, particularly with regard to bridging relationships across
geographical separations and serving as a liaison to the collocated subset of the larger
virtual team.
On a larger scope, it would be interesting to examine other domain settings, such
as the healthcare sector, where researchers and practitioners can better understand how
best to organize effective collaborative dispersed teams. Various types of corporations
are increasingly using dispersed teams as a mechanism for accomplishing organizational
work. Given the interdisciplinary nature of this research, team dynamics explorations
and implications for group and organizational performance within complex and highly
volatile domains can be conducted. With the increasing utilization of global
organizational operations, future research in virtual teamwork remains fertile.

226
Appendices

227
Appendix A: GPD Team & Participant Breakdown
Team Participant
ID University Gender 1 1 University Z Female 1 2 University Z Male 1 17 University Y Female 1 25 University Y Male 1 33 University X Male 1 41 University X Male 2 3 University Z Female 2 4 University Z Male 2 18 University Y Female 2 26 University Y Male 2 34 University X Male 2 42 University X Male 3 5 University Z Male 3 6 University Z Male 3 19 University Y Female 3 27 University Y Male 3 35 University X Male 3 43 University X Male 4 7 University Z Female 4 8 University Z Male 4 20 University Y Female 4 28 University Y Male 4 36 University X Male 4 44 University X Male

228
Team Participant
ID University Gender 5 9 University Z Male 5 10 University Z Male 5 21 University Y Female 5 29 University Y Male 5 37 University X Male 5 45 University X Male 6 11 University Z Male 6 12 University Z Female 6 22 University Y Female 6 30 University Y Male 6 38 University X Male 6 46 University X Male 7 13 University Z Male 7 14 University Z Male 7 23 University Y Male 7 31 University Y Female 7 39 University X Male 7 47 University X Male 8 15 University Z Male 8 16 University Z Male 8 24 University Y Male 8 32 University Y Female 8 40 University X Male 8 48 University X Male

229
Appendix B: GPD Participant Questionnaire
Team Number: ___________________________
Directions: The purpose of this survey is to continue to collect some information from you as you are in the final stages of completing your team project. Please follow the instructions as listed and answer the questions to the best of your ability. In completing this survey, please think of your experiences within your team up to this point. Please refrain from discussing any questions or responses with your teammates while completing the survey. Honest self reporting is an important element of the study. Thanks again for your participation!
Again, please be reminded that your participation in this survey is not mandatory although it will be sincerely appreciated! Your participation does not in any way affect your course outcome or course evaluations and the survey responses will be seen by only those conducting the study, and at this point, identities will be masked.
This survey should take about 15 - 20 minutes to complete. Thanks for your participation!

230
1. Communication
1.1 Since you’ve been working on your project all semester, please indicate in the chart below how useful you have found the following communication technologies for GPD-related activities. In the last column, please check the THREE most useful communication tools that you have used in collaborating with your other team members in the Global Product Development course this semester:
1.2 Please explain why these THREE tools were useful.
________________________________________________________________________________________________________________________________________________________________________________________________________________________________________________
Have not used
Not Valuable
Neutral Valuable Very Valuable
Check 3 most useful
Email groups
Instant Messaging (e.g. AIM, Skype, MSN/Yahoo)
Telephone/Mobile phone/Teleconferencing
SMS Text Messaging (e.g. text messages sent via cell phones)
Course Project Site
Video Conferencing
Other:

231
1.3 Please circle the best option to each of the following statements based on your experiences within your team.
In the week leading up to this Design Review, how frequently did your team communicate utilizingtechnological tools?
Once/Twice per week
Several times/wee
k Daily Few
times/daySeveral
times/day
Since the last DR, how frequently did your teamcommunicate utilizing technological tools?
Once/Twice per week
Several times/wee
k Daily Few
times/daySeveral
times/day
2. Member Distribution
2.1 For your GPD project, how often did you have to work what YOU would consider unusual hours (e.g. 4am) to communicate across time zones with distant team members?
Never
Seldom (one or two times so far)
Some (several times so far)
Often (weekly)
Frequently (more than once a week)
2.2 How much of your current team project work tasks to date was done in direct collaboration (e.g. exchange ideas and work back and forth on that portion/task of the project) with at least TWO other group members? (Total of at least three team members engaged.) Please include other tasks - in the chart below - that your team has engaged in so far that is not already listed in the chart.

232
3. External Team Activities
Since the last DR, what percent of group interactions (video conference, instant messenger, etc.) with at least TWO other team members would you say is spent discussing non-project related activities?
0 – 10% 10 – 20% 20 – 30% 30 – 40% Other: _____________
Task None Minimal Some (about 50%)
Most All N/A
Market Analysis
Product Engineering
In-class presentation
Written Report
Other:
______________

233
4. Division-of-Labor
4.1 Please circle the best option to each of the following statements based on your experiences up to this point within your team.
Your team has divided the project deliverables into specifiedtask and roles.
Strongly
Agree Agree Neutral Disagree Strongly
Disagree
There is an identified person(s) who is responsible forspecific project tasks.
Strongly
Agree Agree Neutral Disagree Strongly
Disagree
4.2 What was your team’s basis of allocating project tasks for this DR? Please select all that apply.
Prior experience (industrial, academic)
Individual team member volunteering for a task
The task that the team member worked on for DR2
Assigned by team leader within group
Other, specify: _________________________________
4.3 On average, when did your team decide to allocate tasks for this DR?
At DR2
One week after DR2
Two weeks after DR2
Last week
Other: _______________________
Not Applicable (N/A)

234
5. Team Performance
Please select the best option to each of the following statements based on your experiences up to this point within your team.
Strongly Agree Agree Neutral Disagree Strongly
Disagree
Our team has not needed to backtrack and startover often.
Our team managed time effectively.
Our team met important deadlines on time.
Our team did a good job of meeting its goals.
We accomplish our tasks smoothly andefficiently.

235
6. Task Processes
Please select the best option to each of the following statements based on your experiences up to this point within your team.
Strongly Agree Agree Neutral Disagree Strongly
Disagree
Specialization
Each team member has specialized knowledge of someaspect of our project.
I have knowledge about an aspect of the project that no otherteam member has.
Different team members are responsible for expertise indifferent areas.
The specialized knowledge of several different teammembers is needed to complete the project deliverables.
I know which team members have expertise in specific areas.
Group members often seek out each other for necessaryinformation to complete a task.
The other team members seek my area of expertise.
When new information enters the group, there is a collectiveunderstanding of who is responsible for the information.
Credibility
I am comfortable accepting procedural suggestions fromother team members.
I trust that other members’ knowledge about the project iscredible.
I am confident relying on the information that other teammembers bring to the discussion.
When other members give information, I do not feel the needto double-check it for myself.
I have faith in other members’ “expertise.”
Coordination
Our team works together in a well-coordinated fashion.
Our team has very few misunderstandings about what to do.

236
There is minimal confusion about how we would accomplishour tasks.
7. Free-response Question
Please provide additional comments that you have about working within your team so far and/or additional information regarding your familiarity with your team members.
Thank you very much for your input and cooperation in completing this survey!

237
Appendix C: GPD Participant Interview Guidelines
Round 1 Experiences so far
1. On a scale of 1-5, on average how well would you say you trust your team members?
2. How well have you been able to coordinate your tasks and deliverables among
each other? 3. In your conversations (MSN, Phone, teleconferences), how often does your
team discuss non-project issues. Please could you give specific examples? 4. Can you describe your experience so far in working on this global team?
5. Cultural impact – can you describe some cultural-related experiences that you
have observed? Proposal Deadline
6. How did your team work collectively to meet this deadline? 7. When would you say that your team completed the project description?
8. What communication mechanism was used most frequently? 9. In the past few weeks leading up to the proposal how have you been able to
decipher the skills and talents of your team members? Moving Forward
10. What are you hoping to accomplish going into South Korea next week? 11. Are you comfortable with where your team is right now and where you hope
to be?
12. Is there anything else that you would like to add at this time?

238
Round2 General
1. On a scale of 1-5, on average how well would you say you trust your team members?
2. In your conversations (MSN, Phone, teleconferences), how often does your
team discuss non-project issues. Please could you give specific examples? DR1/South Korea Experience
3. DR1 occurred at the end of the first week and you had a concept presentation
at the beginning of the week. How did your team work collectively after you arrived in South Korea to be ready for both the final presentation and the concept presentation?
4. Describe your working experience while you were in South Korea. How did
your team attack each day? How well did your team coordinate your tasks and deliverables amongst each other?
5. Describe your teams’ interactions as a whole now that you had a chance to
meet all your team members face-to-face. How well did your team interact socially?
6. During your time in South Korea, were any unique skills of your team
members made more apparent. Please explain how this occurred.
7. Research has shown that there can be a cultural impact when working in dispersed environments – can you describe any expected and unexpected cultural-related surprises that you observed/experienced while in South Korea? Particularly based on the knowledge you had going to South Korea.
8. Were you satisfied with your South Korea experience/objectives (getting to
know team members, accomplishing project work, etc.)? Moving Forward
9. The general feedback from DR1 is that the teams have to take a couple of steps backwards before moving forward. How is your team progressing from DR1?
239
10. Are you comfortable with where your team is right now and where you hope to be?
11. What is/was your strategy in working towards DR2?
12. Is there anything else that you would like to add at this time?
Round 3 General On a scale of 1 to 10 with 10 being best and 1 being worst, please address the following statements (elaborate where necessary):
1. On average, how well would you say you trust your team members?
2. What is your team's level of synergy beyond project work? How do team members interact at a social level?
3. How well has your team handled the member dispersion (time zone
differences, locational differences.)?
4. How well has your team efficiently divided your labor among yourselves?
5. How would you rate the quality of your team's DR2 deliverables (paper, presentation, design concept, actual prototype)?
6. Given that the teams were purposefully assembled by the professors, how well
is your team using your individual skills and coordinating together?
7. At the end of DR2, what overall level (using scale from 1 - 10) would you say your team was performing at?
DR2
8. Being that DR2 builds upon DR1, how were you able to use the feedback from DR1 in preparing for DR2? How much work was involved in incorporating feedback?
9. DR2 focused on the engineering details of your chosen system. Did you work
on this portion collectively as a team or was a majority of it allocated to certain team members?
240
10. Part of the DR1 overall feedback was that the video conferencing had not been used as much as expected before DR1. Please discuss, specifically, your video conference use since DR1. Frequency, effectiveness, impact?
11. Can you share what your planned final deliverable is – the physical prototype?
Moving Forward
12. You leave for Germany in about two weeks, how does your team plan to use these next 2 weeks?
13. Has your team begun to discuss the final exhibition week and what will be
accomplished then?
14. Do you have any final thoughts going into the last few weeks of the course? Round 4 General On a scale of 1 to 10 with 10 being best and 1 being worst, please address the following statements (think of your experiences throughout the course, including DR3):
1. How well would you say you trust your team members (please mention outliers)?
2. What is your team's level of synergy beyond project work? How do team members interact at a social level?
3. How well did your team handle the member dispersion (time zone differences,
locational differences)?
4. How well did your team efficiently divide your labor among yourselves?
5. Overall, how well did your team use your individual skills in coordinating together?
6. How would you rate the quality of your team's DR3 deliverables (paper,
presentation, prototype)?
7. At the end of DR3, what overall level (using scale from 1 - 10) would you say your team was performing at?
DR3/Germany Experience

241
8. Describe how your team worked through the few weeks leading up to DR3.
Was your team as prepared heading to Germany as you had hoped to be? What was the mood and the communication like within your team in the weeks/days leading up to Germany?
9. Describe how your team coordinated and worked together during the week in
Germany? How did your team tackle each day while in Germany? Was your team rushed in completing the deliverables and were they completed in time?
10. Can you discuss your team’s task assignment procedures? Would you say
tasks were assigned to the appropriate people? Did your team need to redistribute assignments and if so, did this affect the outcome/deliverables?
[Discovery of additional team member skill sets]
11. Describe the external, social activities that occurred as a team while in Germany. Did the time you spent together in this capacity impact your effectiveness? If so, how?
12. How well did your final prototype work? Were there any unforeseen challenges that your team had to overcome in putting it together and if so, how did you overcome them?
Reflections
13. Aside from assembling the prototype, would you say it is possible for your GPD team to interact at a level whereby face-to-face meetings would not have been necessary?
14. Could anything be done differently (within your team or by course instructors)
to impact the trust and team cohesion within the team?
15. What will you take away from your experience? Can you share your overall perception of the course focusing on working on a global team regarding communication, division-of-labor, cultural expectations / preconceptions (given that you had a chance to visit 2 different countries)?
16. Final thoughts?
[Would you take the course again?]

242
Appendix D: GPD Instructor Interview Guidelines
Based on your knowledge of each team after this design review, please describe each team according to the following performance evaluation questions. (Feel free to write N/A on a particular question if you do not know enough about a team to rate it on that question.) On a scale of 1 to 5 (with 5 being best and 1 being worst):
Evaluation Questions: Team
1 Team
2 Team
3 Team
4 Team
5 Team
6 Team
7 Team
8 How well did this team communicate using different communication tools? (This question is addressing how efficiently this team communicates, not the number of tools used.) What was this team's level of synergy beyond project work? How did team members interact at a social level? How well did this team handle the member dispersion (time zone differences, etc.)? How well did this team efficiently divide the labor among themselves? Given that the teams were purposefully assembled, how well is this team using team members' individual skills and coordinating together? How well would you say the team members on this team trust each other? How would you rate the quality of this team's DR3 deliverables (paper, presentation, design concept, actual prototype)? At the end of DR3, what overall level (using scale from 1 - 10) did this team perform at? This team did a good job of meeting its goals. This team managed time effectively. This team met important deadlines on time.

243
Appendix E: Consent Form
CONSENT FORM
An Exploration of Knowledge Management Processes in Dispersed Environments
Investigator: Joy Oguntebi, Ph.D. Candidate, University of Michigan, Industrial & Operations Engineering; Phone: 734-764-6335 Faculty Advisor: Jeffrey Liker, Ph.D., University of Michigan, Industrial & Operations Engineering
General Information
I understand that I am being asked to voluntarily participate in a project that will study how information is learned, retained and transferred within a team. This exploration seeks to understand how knowledge management processes are established and maintained within a team setting and will investigate these processes’ impact on team performance. Such processes have previously been observed in collocated environments, but the observation in dispersed environments of these processes is minimal. Significant objectives of this study include the generation of insights based on project observations to assist in the formation and utilization of virtual teams that manage technical projects.
Participation will include completing periodical questionnaires and/or participating in taped interviews with the PI. The surveys are expected to take 15-20 minutes and the interviews are expected to take 10-15 minutes. The questions will address situations and instances that are relevant to the study topic. In addition, some electronic mail communication could also occur. The PI will also make observations by attending class sessions to observe and take notes of project announcements, design review updates, and relevant lectures. None of the procedures are experimental and no additional participation activities are foreseen at this time.
Participating in this study poses no risks and discomfort. There is minimal risk involved in this study, in that the probability and magnitude of harm anticipated are not greater than those ordinarily encountered in daily life. The only involvement includes participating in a taped interview and/or completing a survey, both of which I am free to cease at any time.
All interview and survey questions are not personally intrusive and are meant to address the progression of the team regarding the project. Should I at any time feel any discomfort or unease in participating, I am free to cease the session and am not subject to any obligations.
244
There are no costs or financial obligations that participants involved in this study will endure. There is no personal, monetary benefit associated with this study. Findings from this study will ultimately be used to analyze team dynamics and processes in varying dispersed environments and observations will be made available to project managers/course instructors upon request. Participation in the study will in no way affect the participants’ evaluations or performance outcomes. I understand that it is my decision to choose to participate or not participate and my decision will have no impact on my course grade. I will not be identified in any reports on this study. Individual responses to both surveys and interviews will be kept confidential and will not be shared with any professors, classmates, or other colleagues. Records will be kept confidential to the extent provided by federal, state, and local law. However, the Institutional Review Board or university and government officials responsible for monitoring this study may inspect these records. If significant new knowledge is obtained during the course of this research which may relate to my willingness to continue participation, I will be informed of this knowledge.
My participation in this project is voluntary. Even after I sign the informed consent document, I may decide to leave the study at any time without penalty or loss of benefits to which I may otherwise be entitled. I may skip or refuse to answer any interview or survey question that makes me feel uncomfortable. One copy of this document will be kept together with the research records of this study at the University of Michigan. As a participant, I will be given a copy to keep if I request it.
I have read [or been informed] of the information given above. Project personnel have offered to answer any questions I may have concerning the study. I hereby consent to participate in the study.
__________________ __________________ _________________ Printed Name Consenting signature Date Audio recording will be utilized in this study, where necessary (for informal interviews) to assist the PI in capturing all necessary information. Upon completion of all data collection, analysis, and conclusions, the recordings will be archived and kept for future studies. Every effort will be taken to protect the identity of the participants in the study. Please sign below if you are willing to have this interview recorded (audio). You may still participate in this study if you are not willing to have the interview recorded.
______________________ ___________________ Signature Date

245
If you have any questions or wish to withdraw from the study, contact Joy Oguntebi, [email protected], Tel: (734) 764-6335. For any questions regarding the study’s approval or research subject’s rights, please contact: the Institutional Review Board, 540 E. Liberty Street, Suite 202, Ann Arbor, MI 48104-2210, (734) 936-0933, email: [email protected].

246
Appendix F: GPD Participant Recruitment Letter
Dear GPD Class, My name is Joy Oguntebi and I am a Doctoral Candidate in the Industrial & Operations Engineering Department at the University of Michigan. I intend to observe the GPD course as part of my dissertation study. My research interests include knowledge management and team dynamics as it affects team performance, particularly in dispersed environments. As you can see, the GPD course provides an ideal environment to observe for my research. I approached the Michigan GPD professor about observing the course a while back. After consulting with the professors from the other universities, they were all gracious enough to allow me to observe the course. Now I am approaching you the students who are taking the course to seek your assistance in providing data. The data collection will involve surveys administered over the course of the project as well as informal personal interviews. I will also make observations by attending class sessions to observe and take notes of project announcements, design review updates, and relevant lectures. I would greatly value your participation and sincere evaluations. Your responses will contribute to the study in that we will be able to determine which processes are best suited for dispersed teams. Please don’t hesitate to contact me if you have any questions or would like to receive information on the data collected. Thank you for your cooperation. Best regards, Joy Oguntebi -- Joy Oguntebi, Ph.D. Candidate University of Michigan Industrial and Operations Engineering 1205 Beal Ave Ann Arbor, MI 48109-2117 Email: [email protected] Phone: 734-764-6335

247
Appendix G: GPD Case Measurement Summary
TEAM 1
CONSTRUCTS VARIABLES SEPT (Int 1) OCT (Int 2 & Surv 1)
NOV (Int 3 & Surv 2)
DEC (Int 4 & Surv 3)
VIRTUAL GROUP PROCESS ENABLERS
Virtual Communication Tools (CSCW)
LOW MED MED LOW
Use of (physical) face-to-face
(F2F) meetings
N/A (No F2F meeting in Sept) HIGH N/A (No F2F
meeting in Nov) LOW
Investment in Group Cohesion LOW MED MED HIGH
Division of Labor Strategies LOW HIGH MED MED
TMS EMERGENCE & MAINTENANCE (5.0 Likert scale – Lewis 2003) ID: Insufficient Data
Specialization N/A 3.7 4.1 3.6
Credibility N/A 3.9 3.7 3.1
Coordination N/A 3.9 3.8 3.0
PERFORMANCE (5.0 Likert scale)
Participant N/A 3.8 4.0 3.1
Professor N/A 3.6 4.0 3.7

248
TEAM 2
CONSTRUCTS VARIABLES SEPT (Int 1) OCT (Int 2 & Surv 1)
NOV (Int 3 & Surv 2)
DEC (Int 4 & Surv 3)
VIRTUAL GROUP PROCESS ENABLERS
Virtual Communication Tools (CSCW)
HIGH HIGH HIGH MED
Use of (physical) face-to-face
(F2F) meetings
N/A (No F2F meeting in Sept) MED N/A (No F2F
meeting in Nov) LOW
Investment in Group Cohesion MED MED MED MED
Division of Labor
Strategies MED LOW LOW LOW
TMS EMERGENCE & MAINTENANCE (5.0 Likert scale – Lewis 2003) ID: Insufficient Data
Specialization N/A 3.6 3.8 4.0
Credibility N/A 3.7 3.9 3.5
Coordination N/A 3.4 3.3 3.7
PERFORMANCE (5.0 Likert scale) Participant N/A 3.2 4.0 3.6
Professor N/A 3.9 4.1 3.7

249
TEAM 3
CONSTRUCTS VARIABLES SEPT (Int 1) OCT (Int 2 & Surv 1)
NOV (Int 3 & Surv 2)
DEC (Int 4 & Surv 3)
VIRTUAL GROUP PROCESS ENABLERS
Virtual Communication Tools (CSCW)
LOW MED LOW MED
Use of (physical) face-to-face
(F2F) meetings
N/A (No F2F meeting in Sept) HIGH N/A (No F2F
meeting in Nov) MED
Investment in Group Cohesion LOW MED MED MED
Division of Labor Strategies MED HIGH LOW MED
TMS EMERGENCE & MAINTENANCE (5.0 Likert scale – Lewis 2003) ID: Insufficient Data
Specialization N/A 4.0 4.0 4.4
Credibility N/A 4.0 3.6 4.2
Coordination N/A 3.9 2.4 4.0
PERFORMANCE (5.0 Likert scale) Participant N/A 4.3 3.1 4.4
Professor N/A 3.6 3.0 3.3

250
TEAM 4
CONSTRUCTS VARIABLES SEPT (Int 1) OCT (Int 2 & Surv 1)
NOV (Int 3 & Surv 2)
DEC (Int 4 & Surv 3)
VIRTUAL GROUP PROCESS ENABLERS
Virtual Communication Tools (CSCW)
N/A HIGH HIGH HIGH
Use of (physical) face-to-face
(F2F) meetings
N/A (No F2F meeting in Sept) MED N/A (No F2F
meeting in Nov) HIGH
Investment in Group Cohesion N/A MED MED HIGH
Division of Labor Strategies N/A MED MED HIGH
TMS EMERGENCE & MAINTENANCE (5.0 Likert scale – Lewis 2003) ID: Insufficient Data
Specialization N/A 3.9 3.7 4.1
Credibility N/A 3.8 3.8 4.0
Coordination N/A 3.3 3.0 3.8
PERFORMANCE (5.0 Likert scale) Participant N/A 3.1 3.4 4.0
Professor N/A 3.8 4.1 3.9

251
TEAM 5
CONSTRUCTS VARIABLES SEPT (Int 1) OCT (Int 2 & Surv 1)
NOV (Int 3 & Surv 2)
DEC (Int 4 & Surv 3)
VIRTUAL GROUP PROCESS ENABLERS
Virtual Communication Tools (CSCW)
HIGH MED HIGH HIGH
Use of (physical) face-to-face
(F2F) meetings
N/A (No F2F meeting in Sept) MED N/A (No F2F
meeting in Nov) HIGH
Investment in Group Cohesion LOW MED LOW MED
Division of Labor Strategies MED MED HIGH HIGH
TMS EMERGENCE & MAINTENANCE (5.0 Likert scale – Lewis 2003) ID: Insufficient Data
Specialization N/A ID 4.2 4.1
Credibility N/A ID 4.0 3.5
Coordination N/A ID 3.4 3.5
PERFORMANCE (5.0 Likert scale) Participant N/A ID 3.5 4.2
Professor N/A 2.9 4.3 4.4

252
TEAM 6
CONSTRUCTS VARIABLES SEPT (Int 1) OCT (Int 2 & Surv 1)
NOV (Int 3 & Surv 2)
DEC (Int 4 & Surv 3)
VIRTUAL GROUP PROCESS ENABLERS
Virtual Communication Tools (CSCW)
N/A HIGH LOW LOW
Use of (physical) face-to-face (F2F)
meetings
N/A (No F2F meeting in Sept) MED
N/A (No F2F meeting in
Nov) LOW
Investment in Group
Cohesion N/A MED LOW LOW
Division of Labor
Strategies N/A MED MED LOW
TMS EMERGENCE & MAINTENANCE (5.0 Likert scale – Lewis 2003) ID: Insufficient Data
Specialization N/A ID 3.6 3.3
Credibility N/A ID 3.3 3.4
Coordination N/A ID 2.8 3.1
PERFORMANCE (5.0 Likert scale) Participant N/A ID 3.2 3.2
Professor N/A 3.0 3.2 3.3

253
TEAM 7
CONSTRUCTS VARIABLES SEPT (Int 1) OCT (Int 2 & Surv 1)
NOV (Int 3 & Surv 2)
DEC (Int 4 & Surv 3)
VIRTUAL GROUP PROCESS ENABLERS
Virtual Communication Tools (CSCW)
N/A HIGH LOW MED
Use of (physical) face-to-face
(F2F) meetings
N/A (No F2F meeting in Sept) HIGH N/A (No F2F
meeting in Nov) LOW
Investment in Group Cohesion N/A HIGH MED MED
Division of Labor Strategies N/A MED LOW LOW
TMS EMERGENCE & MAINTENANCE (5.0 Likert scale – Lewis 2003) ID: Insufficient Data
Specialization N/A 3.8 3.6 4.2
Credibility N/A 4.3 4.2 4.1
Coordination N/A 4.2 3.0 3.6
PERFORMANCE (5.0 Likert scale) Participant N/A 4.2 2.7 3.4
Professor N/A 3.6 3.6 3.4

254
TEAM 8
CONSTRUCTS VARIABLES SEPT (Int 1) OCT (Int 2 & Surv 1)
NOV (Int 3 & Surv 2)
DEC (Int 4 & Surv 3)
VIRTUAL GROUP PROCESS ENABLERS
Virtual Communication Tools (CSCW)
HIGH MED HIGH HIGH
Use of (physical) face-to-face
(F2F) meetings
N/A (No F2F meeting in Sept) HIGH N/A (No F2F
meeting in Nov) HIGH
Investment in Group Cohesion HIGH HIGH MED HIGH
Division of Labor Strategies MED MED MED HIGH
TMS EMERGENCE & MAINTENANCE (5.0 Likert scale – Lewis 2003) ID: Insufficient Data
Specialization N/A 3.1 3.8 3.9
Credibility N/A ID 3.9 4.2
Coordination N/A ID 3.6 3.7
PERFORMANCE (5.0 Likert scale)
Participant N/A ID 3.6 4.0
Professor N/A 3.6 4.2 4.3

255
Appendix H: Spearman Correlation Charts
Time 3: Correlation among Enablers, TMS, and Student and Professor Performance Outcomes

256
Time 3: Correlation among Enablers, TMS, and Student/Professor Performance Outcomes (Team 3 removed)

257
Time 3: Correlation among Enablers, TMS, and Student/Professor Performance Outcomes (Teams 3 and 7 removed)

258
References

259
References
Ackerman, M. (2000). The intellectual challenge of CSCW: The gap between social requirements and technical feasibility. Human-Computer Interaction, 15(2), 179-203.
Adler, N. J. (1997). International dimensions of organizational behavior. Cincinnati, OH: South-Western College Publishing.
Akgun, A., J. Byrne, & et al. (2005). Knowledge networks in new product development projects: A transactive memory perspective. Information & Management, 42(8), 1105-1120.
Alavi, M., & Tiwana, A. (2002). Knowledge integration in virtual teams: The potential role of KMS. Journal of the American Society for Information Science and Technology, 53(12), 1029-1037.
Anand, V., C. Manz, & et al. (1998). An organizational memory approach to information management. Academy of Management Review, 23(4), 796-809.
Applebaum E., & Blatt R. (1994). The New American Workplace. Ithaca, NY: ILR.
Argote, L. (2005). Reflections on two views of managing learning and knowledge in organizations. Journal of Management Inquiry, 14(1), 43-48.
Argote, L., & Ingram, P. (2000). Knowledge transfer: A basis for competitive advantage in firms. Organizational Behavior and Human Decision Processes, 82(1), 150-169.
Argote, L., McEvily, B., & Reagans, R. (2003a). Introduction to the special issue on managing knowledge in organizations: Creating, retaining, and transferring knowledge. Management Science, 49(4), Special Issue on Managing Knowledge in Organizations: Creating, Retaining, and Transferring Knowledge, v-viii.
Argote, L., McEvily, B., & Reagans, R. (2003b). Managing knowledge in organizations: An integrative framework and review of emerging themes. Management Science, 49(4), Special Issue on Managing Knowledge in Organizations: Creating, Retaining, and Transferring Knowledge, 571-582.
Argyris, C. (1983). Action science and intervention. Journal of Applied Behavioral Science, 19(2), 115-140.

260
Austin, J. R. (2003). Transactive memory in organizational groups: The effects of content, consensus, specialization, and accuracy on group performance. Journal of Applied Psychology, 88(5), 866-878.
Baker, G. (2002). The effects of synchronous collaborative technologies on decision making: A study of virtual teams. Information Resources Management Journal, 15(4), 79-93.
Bannon, L., Niels, B. & Benedicte, D. (1988). Computer support for cooperative work: An appraisal and critique. Eurinfo '88, first European conference on information technology for organisational systems, Athens, 16-20 May, 1988.
Baum, J. A. C. & Ingram, P. (1998). Survival-enhancing learning in the manhattan hotel industry, 1898-1980. Management Science, 44(7), 996-1016.
Biggs, M. (2000). Enterprise toolbox: Assessing risks today will have corporate leaders well prepared for the future of work. InfoWorld, 22(39), 100-101.
Borgatti, S. P. & Cross, R. (2003). A relational view of information seeking and learning in social networks. Management Science, 49(4), Special Issue on Managing Knowledge in Organizations: Creating, Retaining, and Transferring Knowledge, 432-445.
Bradley, J. (1993). Methodological issues and practices in qualitative research. The Library Quarterly, 63(4), 431-449.
Brandon, D. P. & Hollingshead, A. B. (2004). Transactive memory systems in organizations: Matching tasks, expertise, and people. Organization Science, 15(6), 633.
Canney Davidson, S., & Ward, K. Leading international teams. Berkshire, England: McGraw-Hill International.
Chang, M. & Joseph E. Harrington Jr. (2003). Multimarket competition, consumer search, and the organizational structure of multiunit firms. Management Science, 49(4), Special Issue on Managing Knowledge in Organizations: Creating, Retaining, and Transferring Knowledge, 541-552.
Chudoba, K. M., Wynn, E., Lu, M., & Watson-Manheim, B. (2005). How virtual are we? Measuring virtuality and understanding its impact in a global organization. Information Systems Journal, 15(4), 279-306.
Clark, H. H. (1996). Using language. Cambridge University Press.

261
Cohen, S. G. & Bailey, D. E. (1997). What makes teams work: Group effectiveness research from the shop floor to the executive suite. Journal of Management, 23(3), 239-290.
Cook, T. C. & Campbell, D. T. (1979). Quasi-experimentation: Design and analysis issues for field settings. Chicago: Rand McNally.
Creswell, J. (2007). Research design: Qualitative, quantitative, and mixed methods approaches (Second ed.). Thousand Oaks: SAGE Publications.
Cummings, J. N. & Kiesler, S. (2005). Collaborative research across disciplinary and organizational boundaries. Social Studies of Science, 35(5), 703.
Cummings, J. N. & Cross, R. (2003). Structural properties of work groups and their consequences for performance. Social Networks, 25(3), 197-210.
Darr, E. D., Argote, L., & Epple, D. (1995). The acquisition, transfer, and depreciation of knowledge in service organizations: Productivity in franchises. Management Science, 41(11), Focused Issue on Service Management), 1750-1762.
Das, A. (2003). Knowledge and productivity in technical support work. Management Science, 49(4), Special Issue on Managing Knowledge in Organizations: Creating, Retaining, and Transferring Knowledge, 416-431.
Dennis, A. R. & Kinney, S. T. (1998). Testing media richness theory in the new media: The effects of cues, feedback, and task equivocality. Information Systems Research, 9, 256.
DeSanctis, G. & Poole, M. S. (1994). Capturing the complexity in advanced technology use: Adaptive structuration theory. Organization Science, 5(2), 121-147.
DeSanctis, G. & Monge, P. (1999). Introduction to the special issue: Communication processes for virtual organizations. Organization Science, 10(6), Special Issue: Communication Processes for Virtual Organizations), 693-703.
Devereaux, M. & Johansen, R. (1994). Global work: Bridging distance, culture, and time. San Francisco: Jossey-Bass.
Dube, L. & Pare, G. (2001). Global virtual teams. Communications of the ACM, 44, 71-73.
Eisenhardt, K. (1989). Building theories from case study research. Academy of Management Review, 14(4), 532-550.

262
Faraj, S. & Sproull, L. (2000). Coordinating expertise in software development teams. Management Science, 46(12), 1554.
Finholt, T. A. (2002). Collaboratories. Annual Review of Information Science and Technology, 36(1), 73.
Finholt, T. A. & Olson, G. M. (1997). A new organizational form for scientific collaboration. Psychological Science, 8(1), 28.
Flick, U. (2002). Qualitative research-state of the art. Social Science Information, 41(1), 5.
Gibson, C. & Cohen, S. (2003). Virtual teams that work creating conditions for virtual team effectiveness. San Francisco, CA: Jossey-Bass.
Gittelman, M., & Kogut, B. (2003). Does good science lead to valuable knowledge? biotechnology firms and the evolutionary logic of citation patterns. Management Science, 49(4), Special Issue on Managing Knowledge in Organizations: Creating, Retaining, and Transferring Knowledge), 366-382.
Griffith, T. L. & Neale, M. A. (2001). Information processing in traditional, hybrid, and virtual teams: From nascent knowledge to transactive memory. In B. M. Staw, & R. I. Sutton (Eds.), Research in Organizational Behavior, (pp. 379--421). Stamford, CT: JAI Press.
Griffith, T. L., Sawyer, J. E., & Neale, M. A. (2003). Virtualness and knowledge in teams: Managing the love triangle of organizations, individuals, and information technology. MIS Quarterly, 27(2), 265-287.
Grudin, J. (1994). Computer-wupported cooperative work: History and focus. Computer, 27(5), 19-26.
Guzzo, R. A. & Dickson, M. W. (1996). Teams in organizations: Recent research on performance and effectiveness. Annual Review of Psychology, 47, 307-338.
Hackman, J. R. (1987). The design of work teams. In J. W. Lorsch (Ed.), Handbook of Organizational Behavior, (pp. 315-342). Englewood Cliffs, NJ: Prentice-Hall.
Hackman, J. R. (1990). Groups that work (and those that don't). San Francisco: Jossey-Bass.
Hackman, J. R. & Oldham, G. R. (1980). Work redesign. United States: Addison-Wesley Publishing Co.

263
Hansen, M., Nohria, N., & Tierney, T. (1999), What's your strategy for managing knowledge? Harvard Business Review, 77(2), 106-16.
Herbsleb, J. D. & Mockus, A. (2003). An empirical study of speed and communication in globally distributed software development. IEEE Transactions on Software Engineering, 29(6), 481.
Hinds, P., & Kiesler, S. (1995). Communication across boundaries: Work, structure, and use of communication technologies in a large organization. Organization Science, 6(4), 373-393.
Hofstede, G. (1984). Culture's consequences: International differences in work-related values. Beverly Hills, CA: Sage Publications.
Hofstede, G. (1991). Cultures and organizations. New York: McGraw-Hill.
Hollingshead, A. B. (1998a). Communication, learning, and retrieval in transactive memory systems, Journal of Experimental Social Psychology, 34(5), 423-442.
Hollingshead, A. B. (1998b). Group and individual training: The impact of practice on performance. Small Group Research, 29(2), 254-280.
Hollingshead, A. B. (1998c). Retrieval processes in transactive memory systems. Journal of Personality and Social Psychology, 74(3), 659-671.
Hollingshead, A. B. (2001). Cognitive interdependence and convergent expectations in transactive memory. Journal of Personality and Social Psychology, 81(6), 1080-1089.
Huber, G. P. (1991). Organizational learning: The contributing processes and the literatures. Organization Science, 2(1, Special Issue: Organizational Learning: Papers in Honor of (and by) James G. March), 88-115.
Huysman, M., Steinfield, C., Jang, C., David, K., in 't Veld, M. H., Poot, J., et al. (2003). Virtual teams and the appropriation of communication technology: Exploring the concept of media stickiness. Computer Supported Cooperative Work, 12(4), 411.
Jackson, P. & Klobas, K. (2008). Transactive memory systems in organizations: Implications for knowledge directories. Decision Support Systems, 44(2), 409-424.
Jarman, R. (2005). When success Isn’t Everything–Case studies of two virtual teams. Group Decision and Negotiation, 14(4), 333.

264
Jarvenpaa, S. L., Knoll, K., & Leidner, D. E. (1998). Is anybody out there? antecedents of trust in global virtual teams. Journal of Management Information Systems, 14(4), 29-29-64.
Jarvenpaa, S. L. & Leidner, D. E. (1999). Communication and trust in global virtual teams. Organization Science, 10(6), Special Issue: Communication Processes for Virtual Organizations), 791-815.
Jassawalla, A. R. & Sashittal, H. C. (1998). An examination of collaboration in high-technology new product development processes. Journal of Product Innovation Management, 15(3), 237-254.
Johnson, J. L. & Cullen, J. B. (2002). Trust in cross-cultural relationships. In M. J. Cannon, & K. L. Newman (Eds.), The Blackwell Handbook of Cross-cultural Management. Malden, MA: Blackwell Publishing.
Jones, G. & George, J. (1998). The experience and evolution of trust: Implications for cooperation and teamwork. Academy of Management Review, 23(3), 531-546.
Kim, J. e. a. (2006). A global collaboration to teach global product development: Faculty perspectives.
Kirkman, B., Rose, B., Tesluk, P., & Gibson, C. (2004). The impact of team empowerment on virtual team performance: The moderating role of face-to-face interaction. Academy of Management Journal, 47, 175.
Kotlarsky, J., I. Oshri, et al. (2007). Globally distributed component-based software development: an exploratory study of knowledge management and work division. Journal of Information Technology, 22(2), 161-174.
Krauss, R. & Fussell, S. (1990). Mutual knowledge and communicative effectiveness. In J. Galegher, R. Kraut & C. Egido (Eds.), Intellectual teamwork: Social and technological foundations of cooperative work (pp. 111-146). Hillsdale, NJ: Lawrence Erlbaum.
Kraut, R., Egido, C., & Galegher, J. (1988). Patterns of contact and communication in scientific research collaboration. Proceedings of the 1988 ACM conference on computer-supported cooperative work (pp. 1-12). New York, USA: ACM.
Kraut, R., Steinfield, C., Chan, A. P., Butler, B., & Hoag, A. (1999). Coordination and virtualization: The role of electronic networks and personal relationships. Organization Science, 10(6), Special Issue: Communication Processes for Virtual Organizations), 722-740.

265
Lawler, E. (1992). The ultimate advantage: Creating the high-involvement organization. San Francisco: Jossey-Bass.
Levitt, B. & March, J. G. (1988). Organizational learning. In W. R. Scott, & J. F. Short (Eds.), Annual review of sociology (pp. 319-340). Palo Alto, CA: Annual Reviews.
Lewis, K. (2003). Measuring transactive memory systems in the field: Scale development and validation. The Journal of Applied Psychology, 88(4), 587.
Lewis, K. (2004). Knowledge and performance in knowledge-worker teams: A longitudinal study of transactive memory systems. Management Science, 50(11), 1519.
Liang, D. W., Moreland, R. L., & Argote, L. (1995). Group versus individual training and group performance: The mediating role of transactive memory. Personality and Social Psychology Bulletin, 21, 384-393.
Liker, J. & Hoseus, M. (2008). Toyota culture. New York: McGraw-Hill.
Liker, J. (2004). The Toyota Way: 14 management principles from the world's greatest manufacturer. McGraw-Hill.
Lipnack, J. & Stamps, J. (1997). Virtual teams: Reaching across space, time, and organizations with technology
Lipnack, J. & Stamps, J. (2000). People working across boundaries with technology (Second ed.). New York: John Wiley & Sons.
Lurey, J. S, & Raisinghani, M. S. (2001). An empirical study of best practices in virtual teams. Information & Management, 38(8), 523-544.
Majchrzak, A., Rice, R. E., Malhotra, A., King, N., & Ba, S. (2000). Technology adaptation: The case of a computer-supported inter-organizational virtual team. MIS Quarterly, 569.
Majchrzak, A., Jarvenpaa, S., & Hollingshead, A. (2007). Coordinating expertise among emergent groups responding to disasters. Organization Science, 18(1), 147-161.
Mark, G., Grudin, J., & Poltrock, S. E. (1999). Meeting at the desktop: An empirical study of virtually collocated teams. Proceedings of the ECSCW 99 conference on computer supported cooperative work. Dordrecht, The Netherlands: Kluwer.

266
Martins, L. L., Gilson, L. L., & Maynard, M. T. (2004). Virtual teams: What do we know and where do we go from here? Journal of Management, 30(6), 805-835.
Mayer, R., James, D., & Schoorman, D. (1995). An integrative model of organizational trust. Academy of Management Review, 20(3), 709-734.
Maznevski, M. L., & Chudoba, K. M. (2000). Bridging space over time: Global virtual team dynamics and effectiveness. Organization Science, 11(5), 473-492.
McAllister, D. (1995). Affect- and cognition-based trust as foundations for interpersonal cooperation in organizations. Academy of Management Journal, 38(1), 24-59.
McCarthy, J. (1994). The State-of-the-art of CSCW: CSCW Systems, cooperative work and organization. Journal of Information Technology 9, 73-83.
Menon, T., & Pfeffer, J. (2003). Valuing internal vs. external knowledge: Explaining the preference for outsiders. Management Science, 49(4), Special Issue on Managing Knowledge in Organizations: Creating, Retaining, and Transferring Knowledge), 497-513.
Michinov, N. & Michinov E. (2009). Investigating the relationship between transactive memory and performance in collaborative learning. Learning and Instruction, 19(1), 43-54.
Miles, M. & Huberman, M. (1994). Qualitative data analysis. Thousand Oaks: Sage.
Mohrman, S. A., Finegold, D., & Mohrman, A. M. (2003). An empirical model of the organization knowledge system in new product development firms. Journal of Engineering and Technology Management, 20(1-2), 7-38.
Moreland, R. L. (1999). Transactive memory: Learning who knows what in work groups and organizations. In L. Thompson, D. Messick & J. Levine (Eds.), Shared cognition in organizations: The management of knowledge. (pp. 3-31). Mahwah, NJ: Erlbaum.
Moreland, R. L., Argote, L., & Krishnan, R. (1996). Socially shared cognition at work: Transactive memory and group performance. In J. L. Nye, & A. M. Brower (Eds.), What's social about social cognition? research on socially shared cognition in small groups. (pp. 57-84) Sage Publications.
Moreland, R. L. & Myaskovsky, L. (2000). Exploring the performance benefits of group training: Transactive memory or improved communication? Organizational Behavior and Human Decision Processes, 82(1), 117-133.

267
Nadler, J., Thompson, L., & Boven, L. V. (2003). Learning negotiation skills: Four models of knowledge creation and transfer. Management Science, 49(4), Special Issue on Managing Knowledge in Organizations: Creating, Retaining, and Transferring Knowledge), 529-540.
Nevo, D. & Wand, Y. (2005). Organizational memory information systems: A transactive memory approach. Decision Support Systems, 39(4), 549.
Nonaka, I. (1991). The knowledge-creating compan. Harvard Business Review, 69(6), 96--104.
Olson, G. M. & Olson, J. S. (2002). Groupware and computer-supported cooperative work. The human-computer interaction handbook: Fundamentals, evolving technologies and emerging applications. (pp. 583-595). Hillsdale, NJ.: L. Erlbaum Associates Inc.
Olson, J. S. & Olson, G. M. (1999). Computer-supported cooperative work. In F. Durso (Ed.), Handbook of applied cognition. (pp. 409-422). New York: Wiley.
Olson, G. M. & Olson, J. S. (2003). Human-computer interaction: Psychological aspects of the human use of computing. Annual Review of Psychology, 54(1), 491.
Olson, G. & Olson, J. (2000). Distance matters. Human-Computer Interaction, 15(2), 139.
Orlikowski, W. J., & Baroudi, J. J. (1991). Studying information technology in organizations: Research approaches and assumptions. Information Systems Research, 2(1), 1.
Peltokorpi, V. (2008). Transactive memory systems. Review of General Psychology, 12(4), 378-394.
Ramesh, B., & Tiwana, A. (1999). Supporting collaborative process knowledge management in new product development teams. Decision Support Systems, 27(1-2), 213-235.
Randel, A. E., & Jaussi, K. S. (2003). Functional background identity, diversity, and individual performance in cross-functional teams. The Academy of Management Journal, 46(6), 763-774.
Reagans, R., Argote, L., & Brooks, D. (2005). Individual experience and experience working together: Predicting learning rates from knowing who knows what and knowing how to work together. Management Science, 51(6), 869-881.

268
Reagans, R., & McEvily, B. (2003). Network structure and knowledge transfer: The effects of cohesion and range. Administrative Science Quarterly, 48(2), 240-267.
Siegel, J., Dubrovsky, V., Kiesler, S., & McGuire, T. W. (1986). Group processes in computer-mediated communication. Organizational Behavior and Human Decision Processes, 37(2), 157-187.
Sole, D., & Edmondson, A. (2002). Situated knowledge and learning in dispersed teams. British Journal of Management, 13(S17)
Sorenson, O. (2003). Interdependence and adaptability: Organizational learning and the long-term effect of integration. Management Science, 49(4), Special Issue on Managing Knowledge in Organizations: Creating, Retaining, and Transferring Knowledge), 446-463.
Straub, D. W. (1994). The effect of culture on IT diffusion: E-mail and FAX in japan and the US. Information Systems Research, 5(1), 23.
Straus, S. (1997). Technology, group process, and group outcomes: Testing the connections in computer-mediated and face-to-face groups. Human-Computer Interaction, 12(3), 227.
Strauss, A., & Corbin, J. (1998). Basics of qualitative research: Techniques and procedures for developing grounded theory (Second ed.). Thousand Oaks: SAGE Publications.
Susman, G. I., Gray, B. L., Perry, J., & Blair, C. E. (2003). Recognition and reconciliation of differences in interpretation of misalignments when collaborative technologies are introduced into new product development teams. Journal of Engineering and Technology Management, 20(1-2), 141-159.
Sveiby, K. (1997). The new organizational wealth. Williston, VT: Berrett-Koehler.
Van de Ven, A. H. (1986). Central problems in the management of innovation. Management Science, 32(5), Organization Design), 590-607.
Van de Ven, A. & Huber, G. P. (1990). Longitudinal field research methods for studying processes of organizational change. Organization Science, 1(3), Special Issue: Longitudinal Field Research Methods for Studying Processes of Organizational Change), 213-219.

269
Wegner, D. (1986). Transactive memory: A contemporary analysis of the group mind. In Mullen, B. & Goethals, G. R. (Ed.), Theories of group behavior (pp. 185-208). New York: Springer-Verlag.
Wegner, D.M., Giuliano, T., Hertel, P. (1985). Cognitive interdependence in close relationships. In W. J. Ickes (Ed.), Compatible and incompatible relationships (pp. 253-276). New York: Springer-Verlag.
Wegner, D. M., Erber, R., & Raymond, P. (1991). Transactive memory in close relationships. Journal of Personality and Social Psychology, 61(6), 923-929.
Wellman, B., Salaff, J., Dimitrova, D., Garton, L., Gulia, M., & Haythornthwaite, C. (1996). Computer networks as social networks: Collaborative work, telework, and virtual community. Annual Review of Sociology, 22(1), 213.
Wiseman, R., Hammer, M. & Nishida, H. (1989). Predictors of intercultural communication competence. International Journal of Intercultural Relations, 13(3), 349.
Yin, R. K. (2003). Case study research: Design and methods (Third ed.). Thousand Oaks, California: Sage Publications, Inc.
Yoo, Y., & Kanawattanachai, P. (2001). Developments of transactive memory systems and collective mind in virtual teams. International Journal of Organizational Analysis, 9(2), 187-208.
Zack, M. H. (1993). Interactivity and communication mode choice in ongoing management groups. Information Systems Research, 4(3), 207-239.
Zakaria, N., Amelinckx, A. & David, W. (2004). Working together apart? Building a knowledge-sharing culture for global virtual teams. Creativity and Innovation Management, 13(1), 15-29.