creating a data driven culture for change: what questions can your data ask or help you answer? mark...
TRANSCRIPT
Creating a Data Driven Culture for Change: What Questions Can
Your Data Ask or Help You Answer?
Mark Reynolds, Ed.D. ODMHSAS
Jay Ford, Ph.D. NIATx

Creating a Data Driven Culture for Change: What Questions Can Your Data Ask or Help You Answer?
Test Question
• If you could track only three measures, one each from:• Clinical• Process • Financial
• What would they be?

Some is not a number, soon is not a time.
-- Don Berwick, MD

What is a performance indicator?
• A performance indicator or key performance indicator (KPI) is a measure of performance. Such measures are commonly used to help an organization define and evaluate how successful it is, typically in terms of making progress towards its long-term organizational goals. KPIs can be specified by answering the question, "What is really important to different stakeholders?“
http://en.wikipedia.org/wiki/Performance_indicator
Who uses data?
• Decision Makers– State (e.g., SSA or Legislature)– Funding Agency(e.g., State or Managed Care)– Provider (e.g., Executive Director, Board)
• Consumers– Clients– Employers– Employees

Data is important to the ….
• … state because they need to show that treatment is working
• … legislative body because they want to be sure that citizens are receiving a quality services for their investment
• … managed care companies who are interested in quality care
Data is important to the ….
• … executive director who needs to effectively and efficiently run the treatment agencies
• … consumers who need to get into treatment now and want to receive quality care
• … employees who need to understand that their efforts are beneficial to the agency and clients
• … employers seeking quality care for their employees

What are measures?
• Performance measurement is the process whereby an organization establishes the parameters within which programs, investments, and acquisitions are reaching the desired results

Types of Performance Measures
• Mission Measures: support the agency mission.
• Outcome measures: voice of the customer or patient.
• Process measures: voice of the workings of the system
• Balancing Measures: looks at the system from different directions/dimensions to determine if a change in one part of the organization impacting other process.

Mission Measure
• What do we want to accomplish?
• How does it support the agency mission?
http://marsrovers.nasa.gov/gallery/press/spirit/20040104a.html

Outcome Measure
• How is the system performing?
• What are the results?
http://marsrovers.nasa.gov/gallery/all/2/f/2044/2F307824767EFFB1E5P1110L0M1.HTML

Process Measures
• Are the parts/steps in the system performing as planned?
• How will we know a change is an improvement?
http://marsrovers.nasa.gov/gallery/press/opportunity/20091002a.html
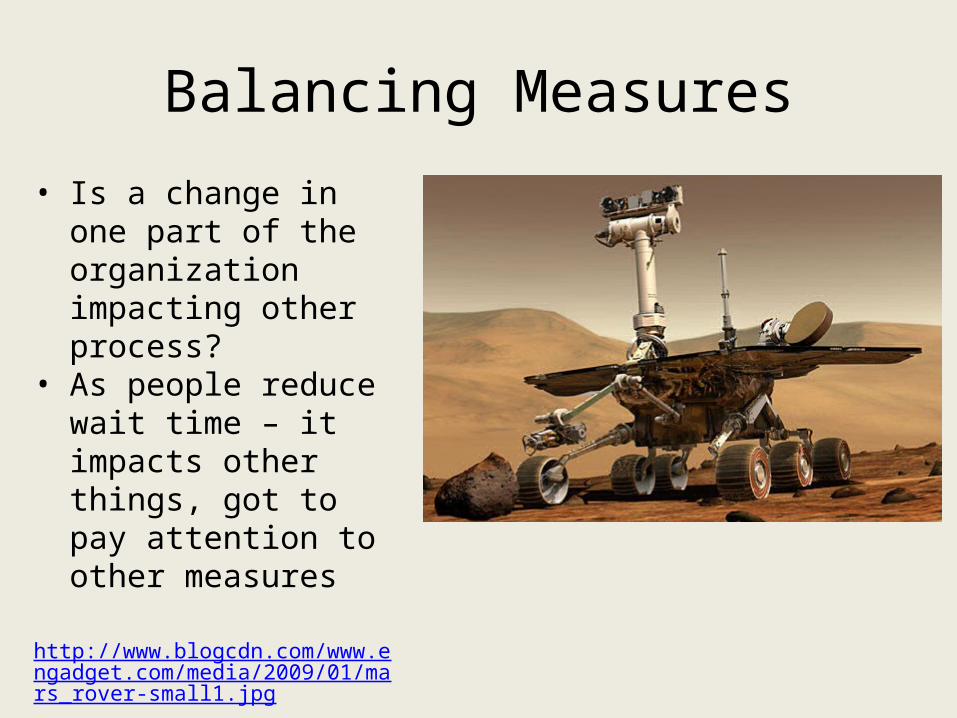
Balancing Measures
• Is a change in one part of the organization impacting other process?
• As people reduce wait time – it impacts other things, got to pay attention to other measures
http://www.blogcdn.com/www.engadget.com/media/2009/01/mars_rover-small1.jpg

Mission Critical Measures
• Outside national influences– National Outcome Measures– Joint Commission or CARF
• Payer driven– State established via pay for
performance– Managed Care specific
• Individual agency level– Financial– Process Oriented
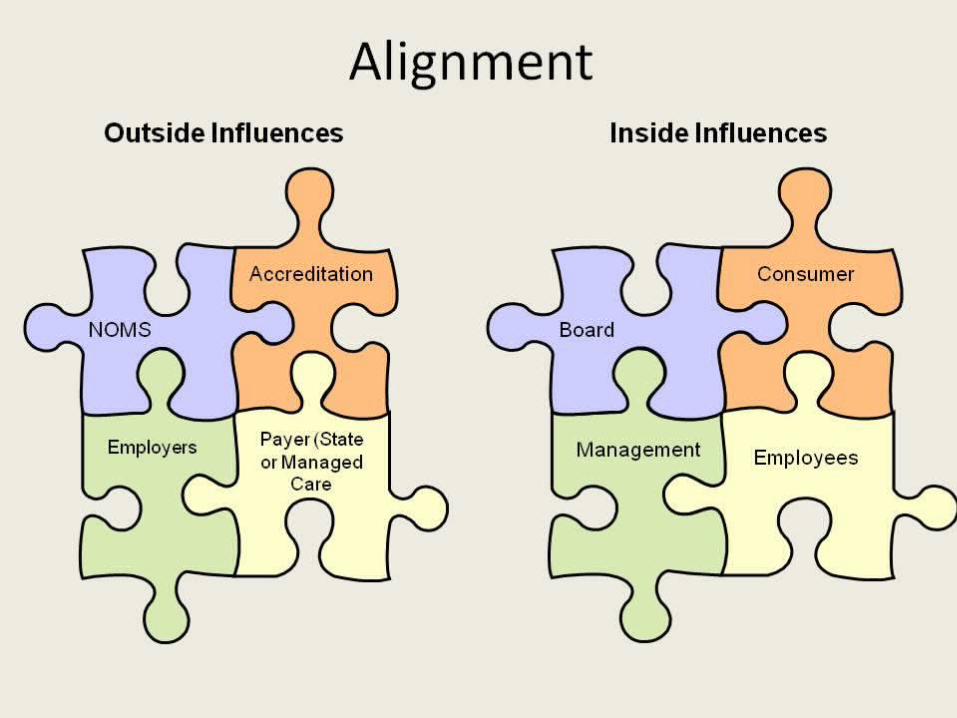
Alignment

Challenge is to bring it all together to create a cohesive picture within
your organization
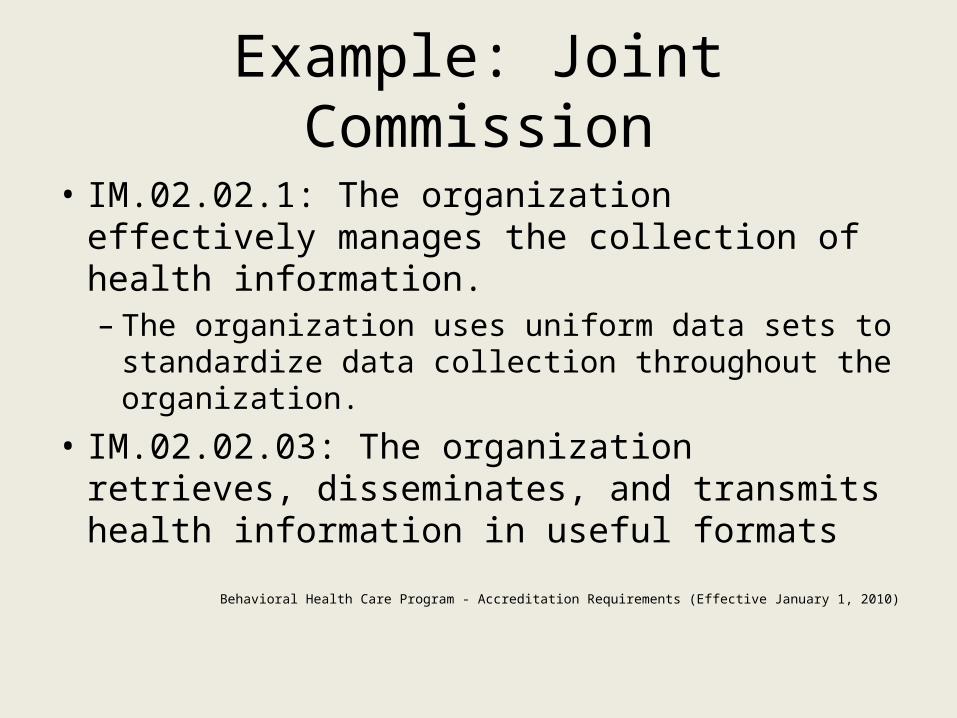
Example: Joint Commission
• IM.02.02.1: The organization effectively manages the collection of health information.– The organization uses uniform data sets to
standardize data collection throughout the organization.
• IM.02.02.03: The organization retrieves, disseminates, and transmits health information in useful formats
Behavioral Health Care Program - Accreditation Requirements (Effective January 1, 2010)

Example: Joint Commission on Performance Improvement
• PI.01.01.01: The organization collects data to monitor its performance
• PI.02.01.01: The organization compiles and analyzes data.
• PI.03.01.01: The organization improves performance.
Behavioral Health Care Program - Accreditation Requirements (Effective January 1, 2010)

Outcome Measures
• Patient level measure• Outcome domains are
driven by NOMS– Substance use– Employment– Criminal Justice
• Select the right measure within the domain
• Try to focus on one not many measures

Example Outcome Measure
• Missed Opportunities– Number of assessment no-shows– Cancelled appointments– No-shows for individual appointments– No-shows for group appointments– …
• If ____ was the measure, what question does it ask? What question could it help answer?

Process Measures
• Match the measure to the mission• Select an effective measure(s)• Leverage performance management
guidelines
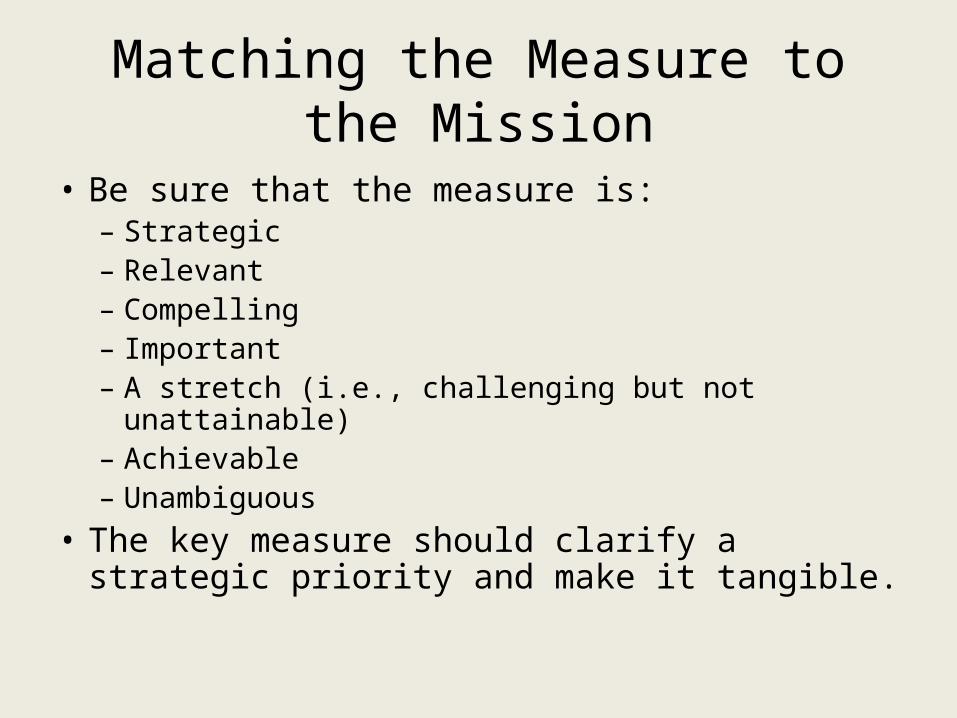
Matching the Measure to the Mission
• Be sure that the measure is: – Strategic – Relevant – Compelling – Important – A stretch (i.e., challenging but not unattainable) – Achievable – Unambiguous
• The key measure should clarify a strategic priority and make it tangible.

Selecting Effective Measures
• Don’t track too many process measures (vs. outcome measures)
• Plot data over time – one chart one message
• Seek usefulness not perfection
• Sample some, not measure all
• Integrate measurement into daily routine
• Use qualitative and quantitative data

Performance Management Guidelines
• Focus on process improvement
• Involve employees
• Be realistic and reportable
• Look to the future not the past
• Understand the impact of change
• Optimize performance
• Supported by management
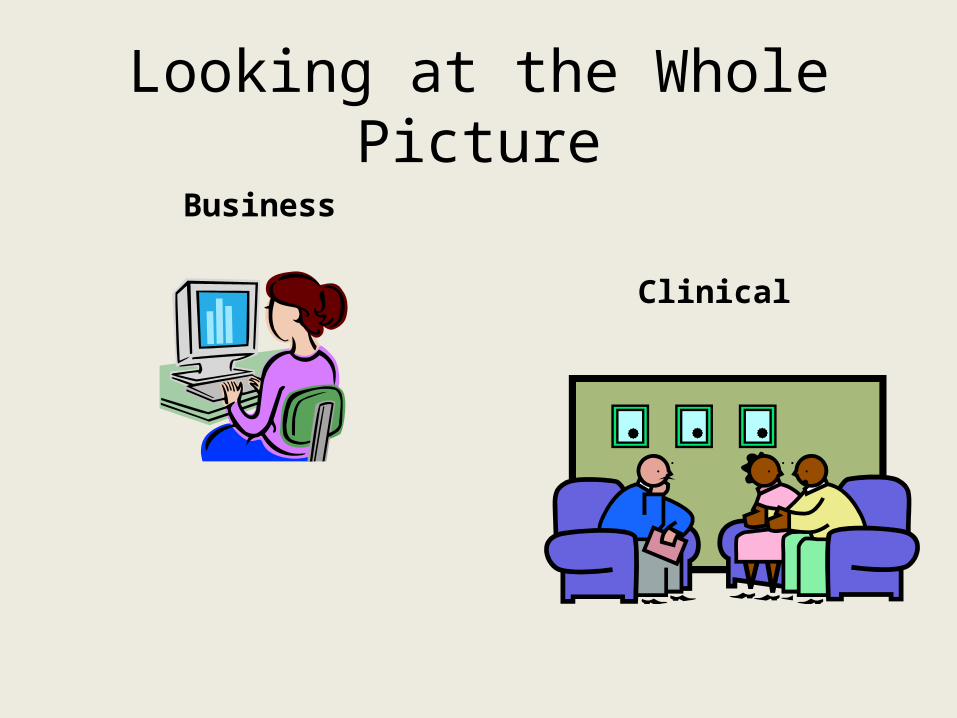
Looking at the Whole Picture
Business
Clinical

Types of Process Measures

Questions to Consider
• How do we measure staff productivity?• How long does it take clients to get into
treatment?• Are clients entering treatment within 48 hours? If
not, why?• How many individuals discharged from Detox
are receiving at least one service at the next level of care?
• How long does it take to close a record?

Questions to Consider (part 2)
• How long does it take to collect revenues?
• For how many days could the doors stay open without sufficient cash flow?
• What does the agency financial picture look like in the future?

Example Process Measures• Business Process Measures
– Days between 1st contact and assessment– Days between assessment and 1st treatment– Successful transition across levels of care
• Clinical Measures– Engagement or Retention– No-show or cancellation rates
• Client Measures– Satisfaction– Family engagement

Example Process Measures (cont)• Financial Measures
– Cost per unit of service– Payer mix– Net days in account receivable– Days cash on hand
• Productivity Measures– Average caseload size– Average group size– Staff turnover
Using Data to Make Decisions• Identify problem areas (e.g., wait lists, billing)• Examine impact on client or staff outcomes• Identify gaps in service• Provide a strategic direction for change• Evaluate the impact of change on the agency• Determine if the change is cost-effective• Drive curiosity/questions about the change• Comparisons to statewide data
Using Data to Make Decisions
• Share the results with the community
• Secure new grants and contracts
• Define and understand the problem
• Use data in staff recruitment and hiring
• Monitor and report program effectiveness
• Examine geographic dispersion of clients
• Create routine, simple reports to monitor progress
Creating a Data Driven Culture
• Agency leadership valuing data
• Provide resources, staff training on data collection and use
• Share change results and data across the agency
• Prior success in making data-driven decisions
Creating a Data Driven Culture
• Absence of a data-based decision making culture
• Lack of expertise and other resources,
• Treatment system complexity, and
• Staff resistance.

How to make measurement an exciting organizational learning experience?
• Senior management communicates improvement as an exciting challenge for the organization.
• Measurement initiatives for improvement are clearly separated from measurements needed for accreditation or other external purposes.
• Improvement teams set attainable goals and get constant visual feedback.

State Roles
• Tie to client outcomes (e.g., NOMs)
• Provide consistent feedback to providers
• Consider using GIS systems– Identify service deficiencies– Examine market share and – Search for shifting utilization patterns
Potential Tools
• Use forecasting to predict the future
• Map out your data using Geographic Information Systems
• Rely on key indicator reports– Dashboard– Balanced Scorecard
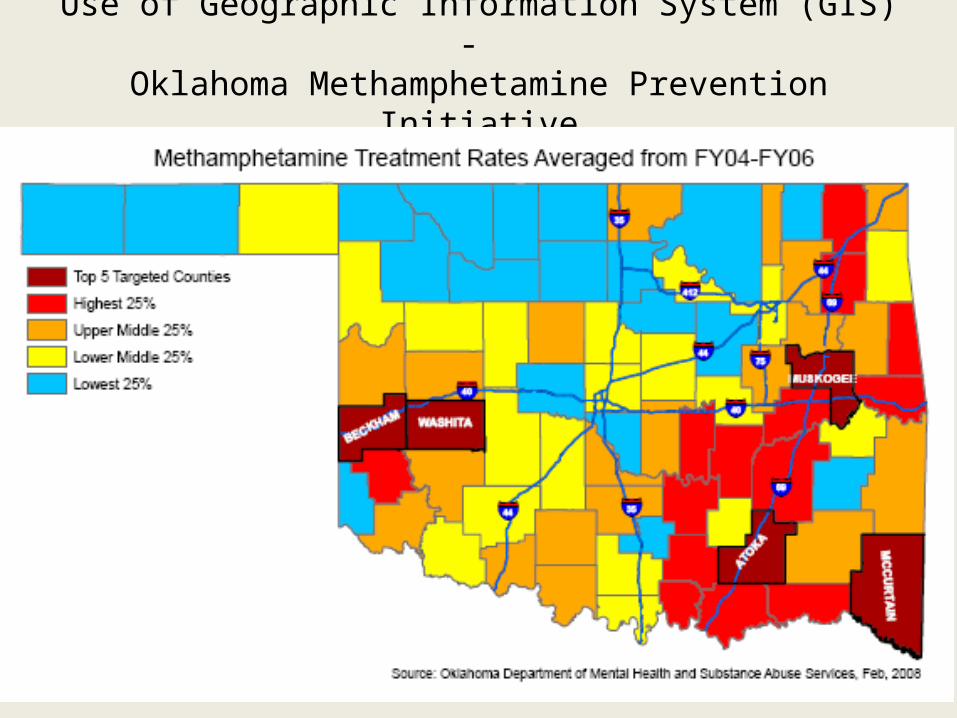
Use of Geographic Information System (GIS) - Oklahoma Methamphetamine Prevention Initiative
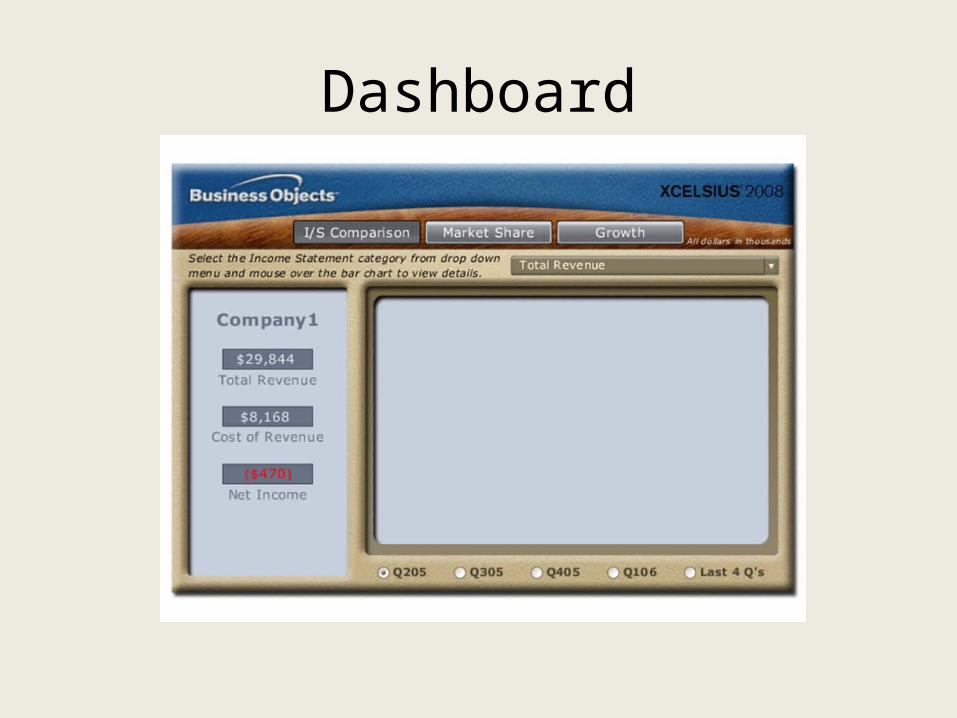
Dashboard
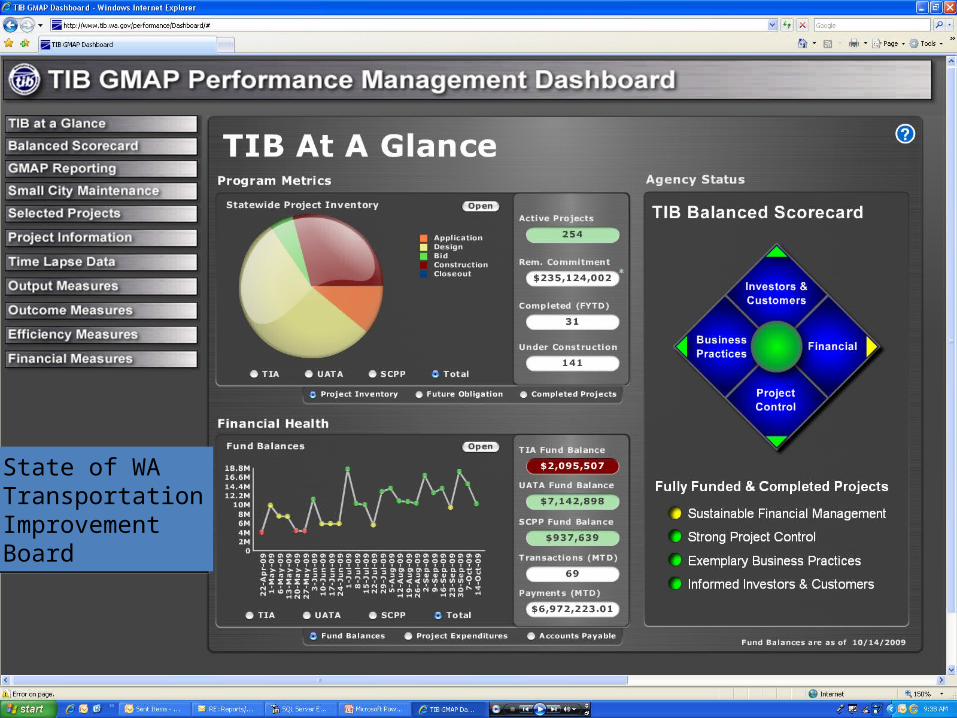
State of Washington Transportation Improvement Board
State of WATransportationImprovementBoard
State of WATransportationImprovementBoard
Comparative Feedback
• Understand the whole picture
• Select a few key outcome measures
• Use of reports to guide questions
• Benchmarks vs. Targets
• Focus on the comparison (internal vs. external)
Comparative Feedback• Measurement Comparisons
– Performance vs. Outcomes– Business Process vs. Treatment
Performance/Outcomes Importance of comparisons
• Types of Feedback Reports– Data Quality– Performance Reports– Pay for Performance
Comparative Feedback• Organizational Performance versus
– a target (internal) or – a benchmark (external)
• Types of comparisons– Internal comparisons over time– External performance comparisons to other
similar organizations– External performance comparisons to other
agencies within a state

Reports
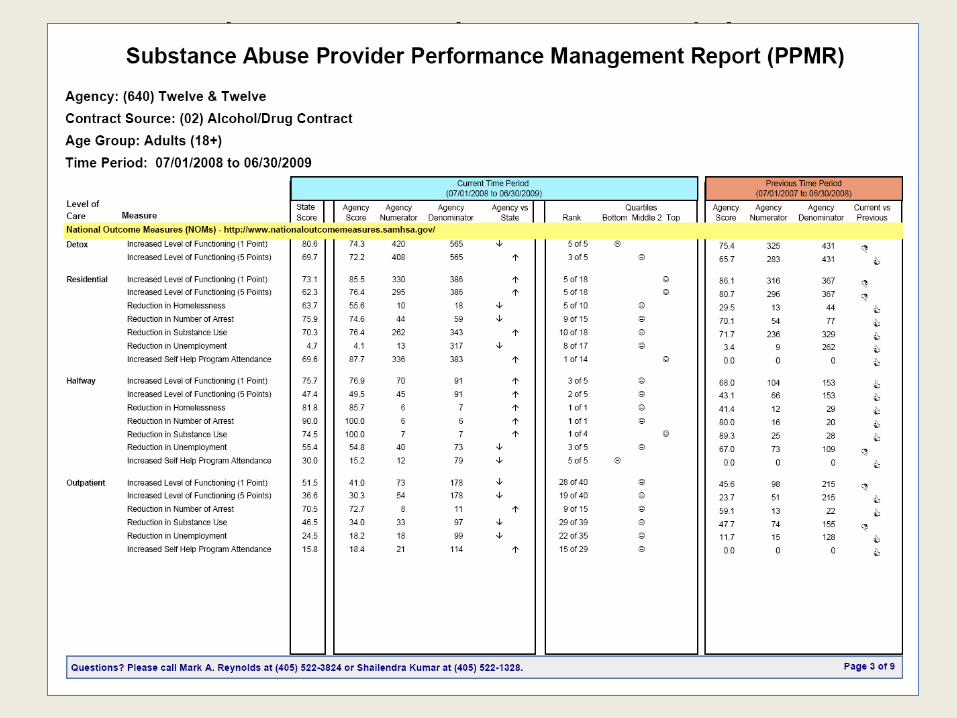
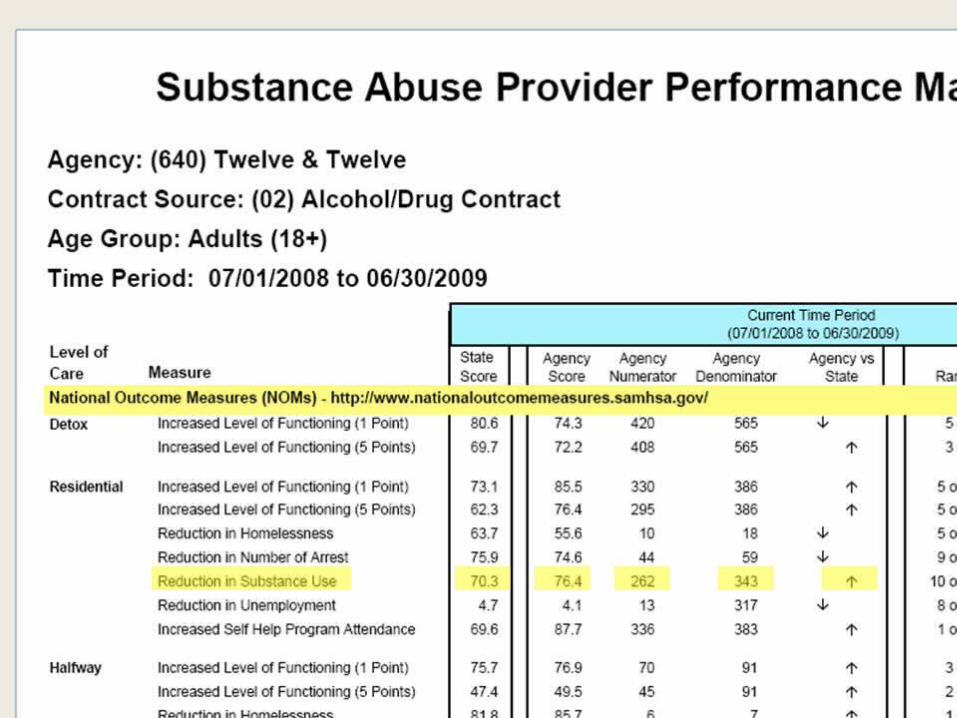
Substance Abuse Provider Management Report (PPMR) pg 3 of 9

PPMR 2

PPMR 3
PPMR 4

PPMR 5

PPMR 6

Substance Use - Trend line

Substance Use - Pie Chart
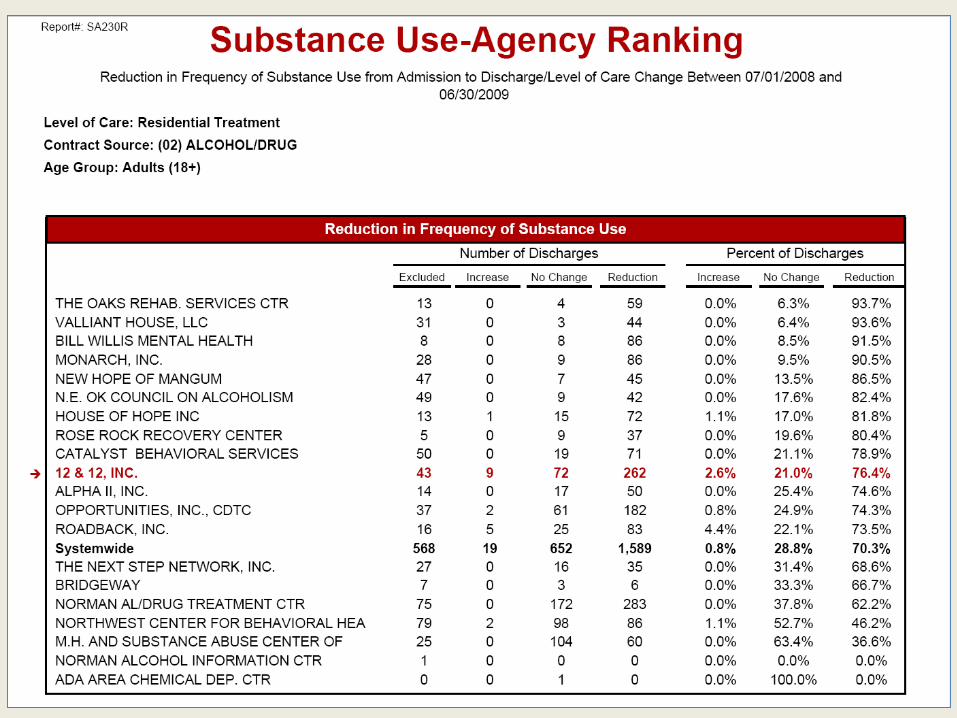
Substance Use – Agency Ranking

Substance Use – Drill Down Report

Substance Use - Demographics

Substance Use - Demographics

Substance Use - Demographics
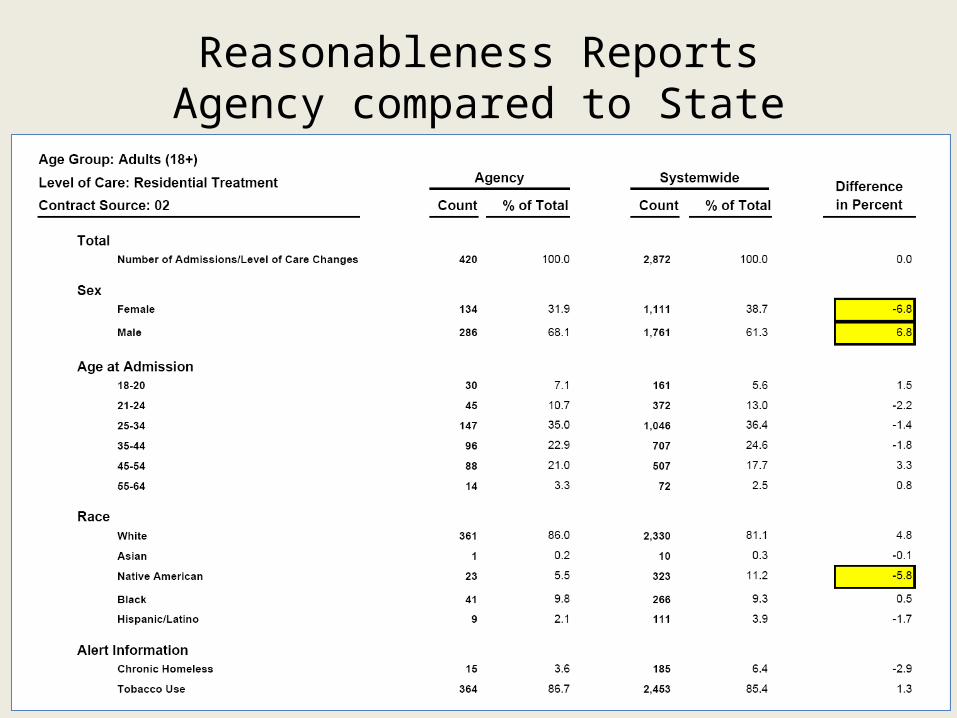
Reasonableness ReportsAgency compared to State
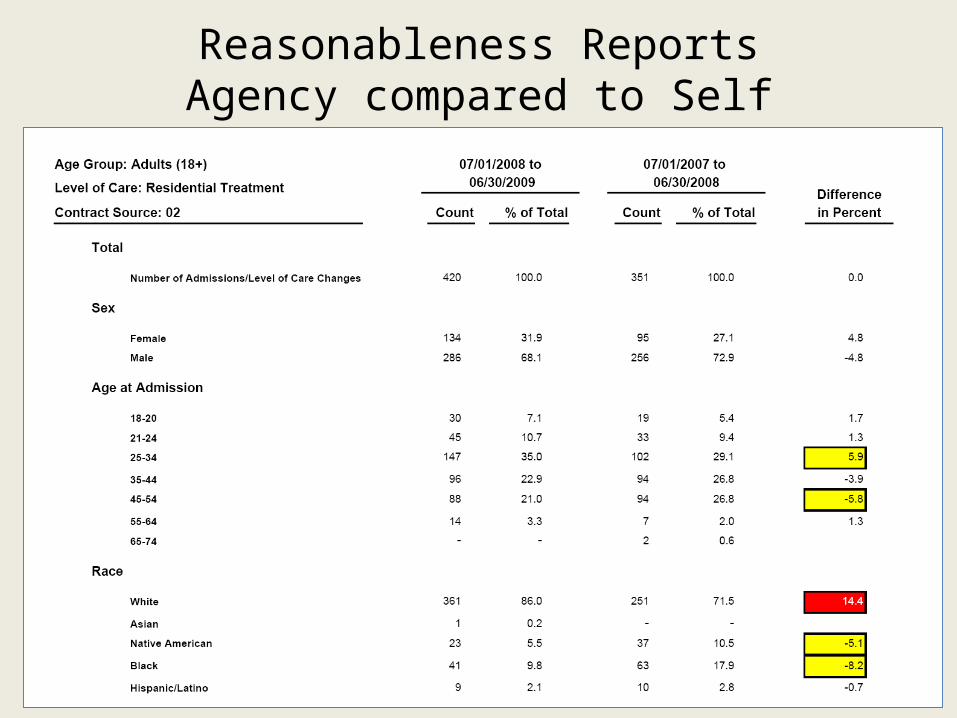
Reasonableness ReportsAgency compared to Self

Lessons Learned for Creating a Process Improvement
Performance Management System

PIPM Hierarchy of Needs
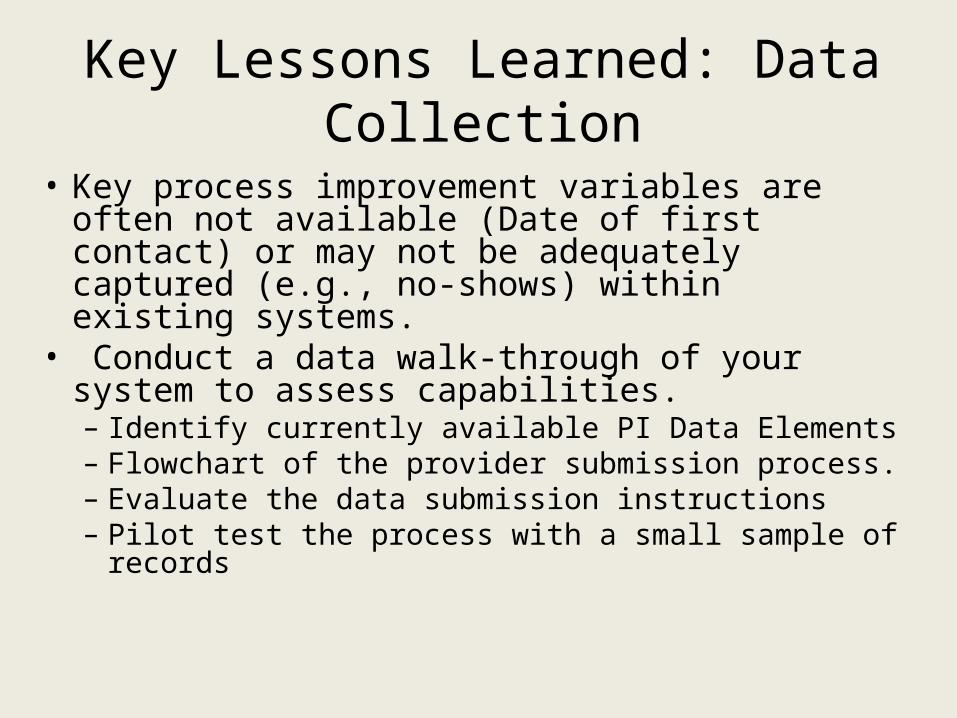
Key Lessons Learned: Data Collection
• Key process improvement variables are often not available (Date of first contact) or may not be adequately captured (e.g., no-shows) within existing systems.
• Conduct a data walk-through of your system to assess capabilities.– Identify currently available PI Data Elements– Flowchart of the provider submission process.– Evaluate the data submission instructions– Pilot test the process with a small sample of
records

Data Walk-through Questions
• Could the data easily be pulled from the state system?
• What barriers were encountered?• How complete and accurate was the data?• Were there significant missing gaps in the
data?• Did you notice any errors in the data?• Write-up and share the lessons learned with
key stakeholders.

Key Lessons Learned: Data Quality
• Establish a process for verifying and checking data accuracy.
• Failure to verify data entry for accuracy will limit the validity of management feedback reports .
• Approaches toward ensuring data integrity include – Automatic linkages (e.g., Washington)– Built-in quality checks (e.g., Ohio and Maine)– Feedback mechanisms (e.g., New York, South
Carolina and Oklahoma) and – Ongoing training and technical assistance

Examples of Ongoing Training and Technical Assistance
• Oklahoma created a Data Integrity Review Team (DIRT) to provide on site review and technical assistance on all data issues for any provider.
• Maine created a change team to monitor data and performance of the contracted agencies and developed FAQs.
• New York developed a series of data entry and report analysis training modules for the STAR-QI system.
• Ohio offers technical assistance and follow-up through site visits, telephone calls, or conferences.
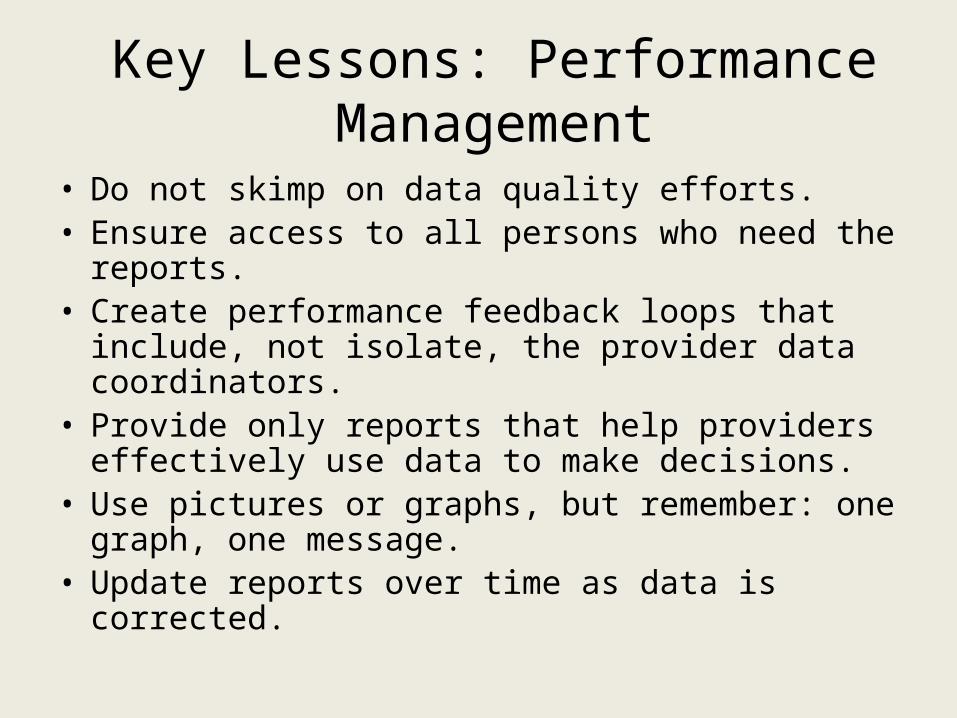
Key Lessons: Performance Management
• Do not skimp on data quality efforts.• Ensure access to all persons who need the
reports. • Create performance feedback loops that include,
not isolate, the provider data coordinators.• Provide only reports that help providers effectively
use data to make decisions. • Use pictures or graphs, but remember: one graph,
one message.• Update reports over time as data is corrected.
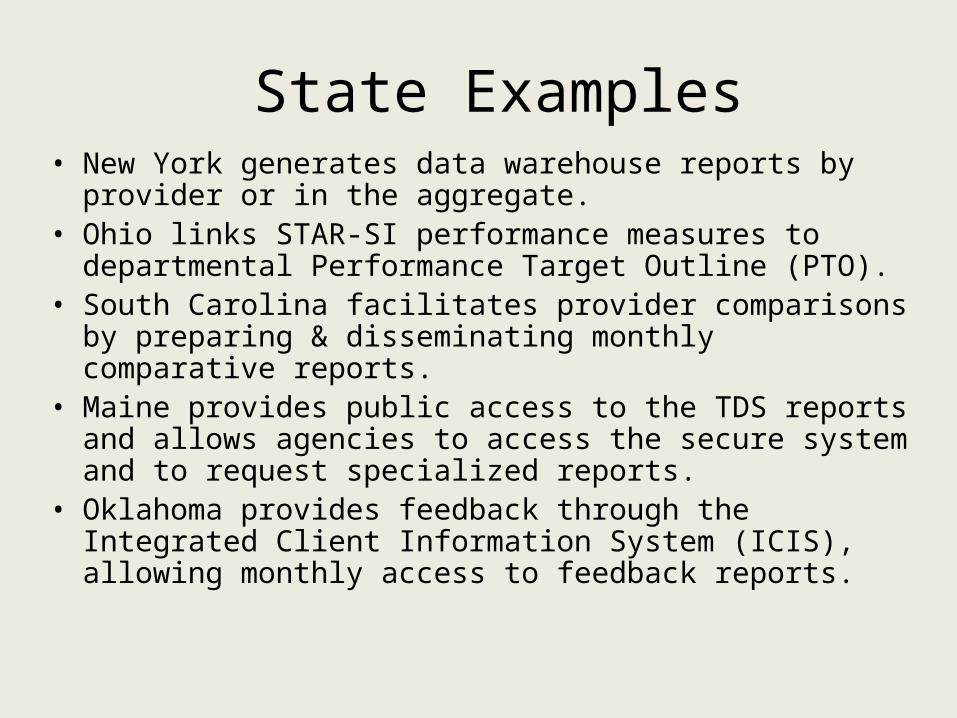
State Examples• New York generates data warehouse reports by provider or
in the aggregate.• Ohio links STAR-SI performance measures to
departmental Performance Target Outline (PTO).• South Carolina facilitates provider comparisons by
preparing & disseminating monthly comparative reports.• Maine provides public access to the TDS reports and
allows agencies to access the secure system and to request specialized reports.
• Oklahoma provides feedback through the Integrated Client Information System (ICIS), allowing monthly access to feedback reports.

Key Lessons: Pay for Performance
• Building the system
• Pilot testing
• Offering the right type of incentive
• Overcoming potential obstacles
• Implementing strategies for long-term success and sustainability

If you could track only three measures, one each from
clinical, process and financial performance measure, what
would they be?

Some Suggested ReadingsWisdom JP, Ford JH, Hayes RA, Hoffman K, Edmundson E, McCarty D. (2006). Addiction Treatment Agencies' Use of Data: A Qualitative Assessment. Journal of Behavioral Health Services and Research 33(4): 394-407
McCellan, A.T., Chalk, M, & Bartlett, J (2007). Outcomes, performance and quality – What’s the difference? Journal of Substance Abuse Treatment 32(4): 331-340.
Garnick, D.W., Horgan, C.M., Lee, M.T., Panas, L., Ritter, G.A., Davis, S., Leeper, T., Moore, R., & Reynolds, M. (2007). Are Washington Circle performance measures associated with decreased criminal activity following treatment? Journal of Substance Abuse Treatment. 33(4): 341-352.

For further information, please visit:
• http://www.niatx.net
• http://www.odmhsas.org/eda/statisticsother.htm
• Contact Information– Jay Ford, PhD– [email protected]– 608-262-4748
• Mark Reynolds– [email protected]