crd iv – crr / basel iii monitoring exercise – results based on
TRANSCRIPT

CRD IV – CRR / BASEL III MONITORING EXERCISE – RESULTS BASED ON DATA AS OF 31 DECEMBER 2015
13 SEPTEMBER 2016

BASEL III MONITORING EXERCISE – RESULTS BASED ON DATA AS OF 31 DECEMBER 2015
2
Contents
List of figures 3
List of tables 4
Abbreviations 5
Executive summary 6
1. General remarks 9
Sample of participating banks 9 1.1
Methodology 11 1.2
Interpretation of results 11 1.3
Data quality 12 1.4
2. Overall impact on regulatory capital ratios and estimated capital shortfall 13
Capital ratios 13 2.1
Capital shortfall 19 2.2
Impact of phase-in arrangements 23 2.3
Composition of capital 24 2.4
Composition of RWA 25 2.5
Composition of the leverage ratio exposure measure 26 2.6
3. Liquidity 29
LCR 29 3.1
NSFR 37 3.2

BASEL III MONITORING EXERCISE – RESULTS BASED ON DATA AS OF 31 DECEMBER 2015
3
List of figures
Figure 1: Distribution of CET1, Tier 1 and total capital ratios per bank group 16
Figure 2: Evolution of CET1 ratios over time 17
Figure 3: Evolution of CET1 capital versus RWA over time (for Group 1 banks) 18
Figure 4: Evolution of leverage ratio by bank group over time (in %) 19
Figure 5: Evolution of capital shortfall by type of capital under full implementation over time 21
Figure 6: Evolution of capital structure over time 24
Figure 7: Evolution of the composition of RWA by risk category over time 25
Figure 8: Composition of the leverage ratio exposure measure by asset category (in %) 27
Figure 9: Relation of RWA to exposure 28
Figure 10: Distribution of LCR by bank group 31
Figure 11: Evolution of LCR by bank group (in %) 33
Figure 12: Evolution of liquid assets over time 34
Figure 13: Evolution of liquid assets over time (relative to total assets) 34
Figure 14: LCR shortfall over time 35
Figure 15: Distribution of LCRs: Group 1 banks 35
Figure 16: Distribution of LCRs: Group 2 banks 36
Figure 17: Distribution of NSFR by bank group 37
Figure 18: Evolution of NSFR by bank group (in %) 39
Figure 19: NSFR shortfall over time 40
Figure 20: Distribution of NSFRs: Group 1 banks 41
Figure 21: Distribution of NSFRs: Group 2 banks 41
BASEL III MONITORING EXERCISE – RESULTS BASED ON DATA AS OF 31 DECEMBER 2015
4
List of tables
Table 1: Overall results assuming full implementation of Basel III as of 31 December 2015 7
Table 2: Number of banks included in this monitoring exercise 9
Table 3: Comparison of risk-based capital ratios and leverage ratio under alternative states of implementation (in %) 14
Table 4: Capital shortfall by bank group, including capital conservations buffer and G-SII/O-SII buffer where applicable (in billion EUR) 20
Table 5: Degree of binding power of risk-based versus leverage ratio Tier 1 capital requirements on banks 22
Table 6: Relative percentage change in capital by type and RWA (in %) 23
Table 7: LCR and LCR shortfall for different minimum ratios according to Article 460(2) of the CRR 32
Table 8: NSFR and NSFR shortfall in stable funding 38

BASEL III MONITORING EXERCISE – RESULTS BASED ON DATA AS OF 31 DECEMBER 2015
5
Abbreviations
ASF Available stable funding
BCBS Basel Committee on Banking Supervision
CET1 Common Equity Tier 1
CRD Capital Requirements Directive
CRR Capital Requirements Regulation
CVA Credit value adjustment
EBA European Banking Authority
FSB Financial Stability Board
G-SIIs Global systemically important institutions
HQLA High-quality liquid assets
LCR Liquidity coverage ratio
LR Leverage ratio
NSFR Net stable funding ratio
O-SIIs Other systemically important institutions
RSF Required stable funding
RWA Risk-weighted assets

BASEL III MONITORING EXERCISE – RESULTS BASED ON DATA AS OF 31 DECEMBER 2015
6
Executive summary
Since the finalisation of the new global banking regulatory framework (‘Basel III’) in
December 2010,1 its impact has been monitored semi-annually by the BCBS at the global level and
by the EBA at the European level, using data provided by banks on a voluntary and confidential
basis. The respective set of regulatory requirements in the EU comprises the CRD IV and the CRR
(hereafter, CRD IV – CRR), which applied as of 1 January 2014.2 It is noteworthy that the current
implementation of the CRD IV – CRR differs from the full implementation of the CRD IV – CRR due
to a set of transitional arrangements.
Three parts of this report (on risk-based and non-risk-based capital ratios, and LCR) assess
compliance with the current EU definitions,3 while one part (on NSFR), in the absence of a
finalised EU definition, monitors compliance with the current Basel III standards.
This report is the 10th publication of the monitoring exercise and summarises the results at the
EU level using data as of 31 December 2015.4 The sample of the 227 banks that are included in
this exercise comprises 45 Group 1 banks and 182 Group 2 banks.5 EU Member States’ coverage
of their respective banking system was notably high for Group 1 banks, reaching 100% coverage
for many jurisdictions (aggregate coverage in terms of CRD IV – CRR RWA: 94.5%), while for
Group 2 banks it was lower with more variation across jurisdictions (aggregate coverage: 36.6%).
Further, for the first time, the analysis focuses on the joint sample of G-SIIs and O-SIIs. The sample
of O-SIIs contains banks from both Group 1 and Group 2 samples that have been characterised as
O-SIIs by the national competent authorities (see footnote 12).
1 BCBS, Basel III: A global framework for more resilient banks and banking systems, December 2010 and revised June
2011; BCBS, Basel III: International framework for liquidity risk measurement, standards and monitoring, December 2010. 2 REGULATION (EU) No 575/2013 OF THE EUROPEAN PARLIAMENT AND OF THE COUNCIL of 26 June 2013 on prudential
requirements for credit institutions and investment firms and amending Regulation (EU) No 648/2012; DIRECTIVE 2013/36/EU OF THE EUROPEAN PARLIAMENT AND OF THE COUNCIL of 26 June 2013 on access to the activity of credit institutions and the prudential supervision of credit institutions and investment firms, amending Directive 2002/87/EC and repealing Directives 2006/48/EC and 2006/49/EC. 3 The EU definition of leverage ratio (non-risk-based capital ratio) has not become an EU binding requirement yet. On
3 August 2016, the EBA published a report on the impact assessment and calibration of the leverage ratio, recommending the introduction of an LR minimum requirement in the EU to mitigate the risk of excessive leverage (see https://www.eba.europa.eu/-/eba-recommends-introducing-the-leverage-ratio-in-the-eu for further details). The report will inform the work of the European Commission on potential legislative proposals on LR. 4 Previous reports are available on the EBA website (http://www.eba.europa.eu/risk-analysis-and-data/quantitative-
impact-study/basel-iii-monitoring-exercise). 5 Group 1 banks are banks with Tier 1 capital in excess of EUR 3 billion and that are internationally active. All other
banks are categorised as Group 2 banks. This report has classified Group 2 banks into sub-samples: large, which have Tier 1 capital in excess of EUR 3 billion; medium-sized, with Tier 1 capital below or equal to EUR 3 billion and above EUR 1.5 billion; and small, which have Tier 1 capital below or equal to EUR 1.5 billion. Among the Group 2 banks, there are 28 banks that have a Tier 1 capital in excess of EUR 3 billion but that are not internationally active.

BASEL III MONITORING EXERCISE – RESULTS BASED ON DATA AS OF 31 DECEMBER 2015
7
Table 1: Overall results assuming full implementation of Basel III as of 31 December 20156
Capital ratios Liquidity ratios
CET1 Tier 1 Total LR LCR NSFR
Group 1 12.4 13.1 15.9 4.7 126.8 105.5
Group 2 13.6 13.9 15.5 5.6 169.3 112.7
- Large 13.5 13.8 15.5 5.7 171.4 110.4
- Medium 14.2 14.4 16.1 5.9 183.7 117.4
- Small 13.6 13.8 15.2 5.0 150.6 115.9
Total 12.7 13.3 15.8 4.9 133.7 107.0
- G-SIIs/O-SIIs 12.6 13.3 15.9 4.7 129.9 106.3
Source: EBA QIS data (December 2015)
Capital requirements and shortfalls
Overall, the results show a further improvement in European banks’ capital positions. Assuming
full implementation of the CRD IV – CRR (i.e. without taking into account transitional
arrangements), the risk-based capital ratios for Group 1 and Group 2 banks stand at 12.4% and
13.6% for CET1 ratio, 13.1% and 13.9% for Tier 1 ratio and 15.9% and 15.5% for total capital ratio
respectively (Table 1). The average leverage ratios for the same sample of banks reach 4.7%
(Group 1) and 5.6% (Group 2). On average, European banks largely fulfil the future regulatory
capital requirements, while only a very small number of banks exhibit potential capital shortfalls.
Those shortfall amounts constitute only a very minor fraction of the amounts observed at the
beginning of the monitoring period (mid-2011), and the difference between current and full
implementation capital ratios has been shrinking continuously. This monitoring exercise considers
the leverage ratio as defined in EU legislation for the purpose of the capital analysis. Conceptually,
the (non-risk-based) leverage ratio has been developed to serve as a backstop against unduly low
risk-adjusted capital levels and to prevent the excessive build-up of leverage, both over the
financial cycle and across credit institutions. The analysis contained in this report indicates that
the leverage ratio is indeed a regulatory constraint for a significant proportion of institutions in
the sample. On average, Group 1 banks are more constrained by the leverage ratio requirement
than Group 2 banks.
6 The number of banks per section may differ.

BASEL III MONITORING EXERCISE – RESULTS BASED ON DATA AS OF 31 DECEMBER 2015
8
Liquidity requirements and shortfalls
For the second time, the monitoring exercise presents the results of the LCR analysis according to
the European Commission (the Commission) Delegated Regulation (EU) No 2015/61 (hereafter,
LCR DA), which specifies the general requirement set out in Article 412(1) of the CRR.7 As defined
in Article 38 of this Delegated Regulation and in accordance with Article 460(2) of the CRR, the
minimum requirement has been set at 60% from 1 October 2015 and will gradually increase to
100% in January 2018 (i.e. the EU regulation requires a minimum of 100% one year before the
Basel standard). The NSFR is anticipated to be introduced on 1 January 2018 with a minimum
requirement of 100%. Since the NSFR has not yet been finalised at the EU level, the calculations in
this report are based on the revised Basel III NSFR framework, published in October 2014.8
With regard to the LCR, the average ratio for data as of the end of December 2015 is 126.8% and
169.3% for Group 1 and Group 2 banks respectively. In the total sample, 91% of the banks show
an LCR of above 100%, while 98% of the banks have an LCR of above the 70% minimum
requirement of January 2016. The overall shortfall in relation to the 100% threshold is
EUR 10.8 billion. There has been an increase in banks’ LCR over time, which can be attributed to
structural adjustments (both an increase in HQLA and a decrease of net outflows), as well as to
the recalibration of the LCR framework as published in January 2013. The change in the previous
period is also driven by the first application of the Commission Delegated Regulation, whereas the
Basel III LCR framework has been used for reference dates prior to that—i.e. until
December 2014. With respect to the NSFR, Group 1 and Group 2 banks show an average ratio of
105.5% and 112.7% respectively, with an overall shortfall in stable funding of EUR 240 billion.
About 79% of participating banks already meet the minimum NSFR requirement of 100%.9
Compared with previous periods, there is a continuous increase in banks’ NSFRs, which is mainly
driven by the increasing amount of ASF for both groups.
7 http://eur-lex.europa.eu/legal-content/EN/TXT/?uri=OJ:L:2015:011:TOC.
8 http://www.bis.org/bcbs/publ/d295.pdf.
9 Please note that, throughout the report, the NSFR analysis refers to the Basel III standard.

BASEL III MONITORING EXERCISE – RESULTS BASED ON DATA AS OF 31 DECEMBER 2015
9
1. General remarks
Sample of participating banks 1.1
Table 2: Number of banks included in this monitoring exercise
Group 1 Group 2 Of which: G-SIIs/
O-SIIs Total
Large Medium Small
Austria 2 6 1 1 4 4 8
Belgium 2 8 — 2 6 6 10
Denmark 1 12 2 2 8 5 13
France 5 2 1 — 1 6 7
Germany 8 74 8 7 59 12 82
Greece 4 — — — — 4 4
Hungary 1 2 — — 2 2 3
Ireland 3 5 — 3 2 2 8
Italy 2 21 6 8 7 3 23
Latvia — 2 — — 2 2 2
Luxembourg — 3 — 2 1 2 3
Malta — 3 — — 3 2 3
Netherlands 3 10 1 2 7 5 13
Norway 1 8 — 1 7 2 9
Poland — 5 1 — 4 — 5
Portugal 2 3 — 1 2 4 5
Spain 2 9 7 2 — 6 11
Sweden 4 4 — 1 3 4 8
United Kingdom 5 5 1 3 1 6 10
Total 45 182 28 35 119 77 227
Source: EBA QIS data (December 2015)
Table 2 shows the participation by jurisdiction and bank group. This report includes an analysis of
data submitted by 227 banks of 18 EU Member States and a country from the EEA. This sample
consists of 45 Group 1 banks from 15 countries and 182 Group 2 banks from 18 countries.10 Group
10
For one Member State (Greece) all participating banks are classified as Group 1 according to their size and activity.

BASEL III MONITORING EXERCISE – RESULTS BASED ON DATA AS OF 31 DECEMBER 2015
10
1 banks in this report are defined as the banks with Tier 1 capital in excess of EUR 3 billion that
are internationally active. All other banks are classified as Group 2. Coverage of the banking
sector is high, reaching 100% of Group 1 banks in many countries (aggregate coverage in terms of
CRD IV – CRR RWA: 94.5%). Coverage of Group 2 banks is lower and varies across countries
(aggregate coverage: 36.6%).
For the purposes of a more differentiated analysis, the joint sample of G-SIIs11 and O-SIIs has been
analysed separately from the total sample. To analyse the driving forces behind aggregate
Group 2 results in more detail, this report has classified Group 2 banks into three sub-samples:
large, which have Tier 1 capital in excess of EUR 3 billion; medium-sized, with Tier 1 capital below
or equal to EUR 3 billion and above EUR 1.5 billion; and small, which have Tier 1 capital below or
equal to EUR 1.5 billion. In total, 28 large, 35 medium-sized and 119 small Group 2 banks are
included in the current analysis. Pursuant to Article 131(3) of Directive 2013/36/EU, the
identification of O-SIIs started in 2015. Authorities can set higher loss absorbency requirements
for those institutions, in addition to the obligatory CET1 capital buffer of up to 2%. The additional
measures for O-SIIs aim to reduce market distortions triggered by their possible negative
externalities. For the analysis as of December 2015,12 77 banks are jointly recognised to be
monitored as O-SIIs and G-SIIs.13 Not all banks provided data relating to all sought parts of the
reporting template of this monitoring exercise. Accordingly, a certain number of banks are
excluded from individual sections of this monitoring analysis due to the provision of incomplete
data. In each section, comparisons with previous periods are based on a consistent sample of
banks—i.e. including only those banks that have consistently been reporting the relevant data for
all sought reference dates, so as to allow for reference-date-to-reference-date comparisons and
time series analyses within each section. Similarly, the analyses relating to the interactions
between and combined effects of various regulatory ratios have been based on consistent
samples of banks to facilitate such an analytical approach.
11
See also BCBS: Global systemically important banks—updated assessment methodology and the higher loss absorbency requirement (2013), EBA: Final draft RTS on the methodology for the identification of global systemically important institutions (2014) and FSB: 2015 update of list of G-SIBs (Nov 2015); the term ´G-SIB´ in BIS and FSB documentation corresponds to ´G-SII´ in EBA documentation. 12
The first list of O-SIIs references as of April 2016 is available at: http://www.eba.europa.eu/-/eba-discloses-first-list-of-o-siis-in-the--1. 13
The sub-category of O-SIIs also includes banks that have been nominated as G-SIIs.

BASEL III MONITORING EXERCISE – RESULTS BASED ON DATA AS OF 31 DECEMBER 2015
11
Methodology 1.2
‘Composite bank’ weighting scheme
Average amounts in this analysis have been calculated by creating a composite bank at the
relevant sample level—i.e. the relevant sample averages are implicitly weighted. For example, the
average CET1 capital ratio is the sum of all banks’ CET1 capital included in the relevant sample
divided by the sum of all banks’ RWA included in the relevant sample. Similarly, the average Tier 1
leverage ratio is the sum of all banks’ Tier 1 capital included in the relevant sample divided by the
sum of all banks’ leverage ratio exposure measure included in the relevant sample. By choosing
this weighting scheme, methodologically the results of this analysis can implicitly be considered as
more representative of the European banking sector as a whole than unweighted averages.
Box plots illustrating the distribution of results
To present more detailed results while at the same time ensuring data confidentiality, some
charts show box plots that give an indication of the distribution of the results among the
participating banks. Those box plots are defined as follows:
Thick red line Respective minimum requirement
Dashed lines Respective minimum requirement plus the capital conservation buffer (capital)
Thin red line Median value (50% of the observations are below this value, 50% are above this value)
‘x’ Mean (weighted average)
Blue box
25th and 75th percentile values. A percentile is the value of a variable below which a certain percentage of observations fall. For example, the 25th percentile is the value below which 25% of the observations are found.
Black vertical lines (‘whiskers’) The upper end point represents the 95th percentile value; the lower end point represents the 5th percentile value
Interpretation of results 1.3
This quantitative impact study aims to monitor the convergence of the EU banks with the
regulatory requirements under the assumption of full implementation of CRD IV – CRR/Basel III.
The full implementation of the CRD IV – CRR package does not consider the transitional
arrangements relating to the phase-in of deductions and to the grandfathering of capital
instruments.14 This implies that the CRD IV – CRR capital amounts shown in this report assume
that all common equity deductions are fully phased in, and all non-qualifying capital instruments
are fully phased out. As such, these amounts underestimate the amount of regulatory capital held 14
For details on the transitional arrangements, see in particular Part Ten of the CRR and, in addition, paragraphs 94 and 95 of the Basel III framework (Basel III—A global regulatory framework for more resilient banks and banking systems).
BASEL III MONITORING EXERCISE – RESULTS BASED ON DATA AS OF 31 DECEMBER 2015
12
by banks as they do not recognise the gradual phase-in of common equity deductions and the
non-qualifying instruments that are actually phased out over multiple-year time horizons.
For the calculation of results referred to as ‘current rules’, the report uses figures based on the
current CRD IV – CRR framework—i.e. on the current state of implementation, being mindful of
the fact that this framework is changing over time. This means that, for the current reference
date (December 2015), the figures under the current rules refer to the state of implementation of
the CRD IV – CRR framework as of December 2015. Therefore, the difference between the fully
phased-in results and the results under the current rules in the risk-sensitive capital ratio and
RWA analysis is solely due to the remaining transitional arrangements from December 2015 until
the full implementation date.
The treatment of deductions and non-qualifying capital instruments under the assumption of full
implementation of the CRD IV – CRR similarly affects the figures reported in the leverage ratio
analysis. The potential underestimation of Tier 1 capital is becoming less of an issue as the
implementation date for the leverage ratio approaches. In other words, in 2015, the capital
amounts, based on the CRD IV – CRR capital requirements in place on the reference date, include
the amount of non-qualifying capital instruments at that point in time.
It is important to note that this monitoring exercise is based on the assumption of a static balance
sheet—i.e. capital elements are only included should they fulfil the eligibility criteria on the
reference date. Planned, but not implemented, bank measures to increase capital or decrease
RWA are not taken into account. This allows the identification of effective changes in banks’
capital rather than relying on anticipated changes based on underlying behavioural and modelling
assumptions. As a consequence, these monitoring results are different from industry estimates, as
the latter usually include assumptions on banks’ future profitability, planned capital and/or
management actions to mitigate the impact of the CRD IV – CRR framework.
Data quality 1.4
The banks included in this monitoring exercise submitted comprehensive and detailed non-public,
confidential data on a best-effort voluntary basis. Supervisors have been working closely with
banks to ensure the high quality, completeness and consistency of data with the reporting
instructions. For each of the analyses below, banks are included in the sample only if they have
provided data of sufficient quality to conduct the analysis in question.
For the risk-based capital ratio and RWA analyses, data from supervisory reporting systems have
been used wherever possible to reduce recourse to banks. In the liquidity part of this monitoring
exercise, some banks may have reported their liquidity risk positions based on slightly different
interpretations of the Commission Delegated Regulation (EU) No 2015/61. However, data quality
has improved significantly since the beginning of the monitoring exercise.

BASEL III MONITORING EXERCISE – RESULTS BASED ON DATA AS OF 31 DECEMBER 2015
13
2. Overall impact on regulatory capital ratios and estimated capital shortfall
Capital ratios 2.1
One of the main objectives of the CRD IV – CRR/Basel III framework is to increase the resilience of
the banking sector by strengthening both the quantity and quality of regulatory capital. For this
purpose, the framework sets higher quantitative minimum requirements and stricter rules for the
definition of capital and for the calculation of RWA. The regulatory capital requirements consist of
risk-based (capital ratios in relation to RWA) and non-risk-based (leverage ratio) measures.
The risk-based ratios refer to the capital definitions of CET1, Tier 1 and total capital, decreasing in
their degree of loss absorbency, in relation to RWA. At the date of full implementation, the
CRD IV – CRR/Basel III standard requires a regulatory CET1 ratio of 7% (minimum plus 2.5%
conservation buffer), a Tier 1 ratio of 8.5% (incl. the CET1 conservation buffer) and a total capital
ratio of 10.5% (incl. the CET1 conservation buffer). Figures related to capital shortfalls also reflect
the bank-specific CET1 G-SII/O-SII buffer. For time series analysis, the evolution of the capital
shortfall is calculated by using the most recent G-SII/O-SII surcharges throughout the whole time
series. For G-SIIs, the maximum between the G-SII buffer and the O-SII buffer is taken into
account. Additional capital requirements depending on macro-prudential considerations
(systemic risk and countercyclical buffers), or based on supervisory judgement (Pillar II add-ons),
are not included in the below analysis.
The non-risk-based capital requirement—the leverage ratio—is defined in terms of Tier 1 capital
in relation to a comprehensive (on- and off-balance-sheet) exposure measure. The CRD IV –
CRR/Basel III standard is preliminarily set at the 3% minimum requirement. This monitoring
exercise considers the leverage ratio as defined in EU legislation for the purpose of capital
analysis.
As this exercise envisages full implementation of CRD IV – CRR (without accounting for any
transitional arrangements), in most parts it compares banks’ actual capital ratios with the capital
ratios that banks would have exhibited had the set of rules of the CRD IV package been fully
implemented at the reference date. The results shown under ‘current rules’ are based on the
state of regulatory implementation at the reference date. In this context, it is important to
elaborate on the implications of full implementation of the CRD IV package on the monitoring
results. These amounts may underestimate the amount of capital actually held by banks, as they
do not take account of any non-qualifying instruments needing to be phased out and deductions
to common equity needing to be phased in during the transitional period.

BASEL III MONITORING EXERCISE – RESULTS BASED ON DATA AS OF 31 DECEMBER 2015
14
Table 3 shows the difference between banks’ risk-based capital ratios and leverage ratios,
calculated according to the current rules as of 31 December 2015, and the levels that would result
if the CRD IV – CRR requirements were already fully implemented.
For Group 1 banks, this full implementation would result in a reduction of the CET1 ratio from
13.2% under the current rules (i.e. taking into account the transitional arrangements applying in
2015) to 12.4%, while the average Tier 1 and total capital ratios would decline under the full
implementation regime from 14.3% to 13.1% and from 17.1% to 15.9% respectively. Regarding
the leverage ratio, assuming the implementation is as defined in EU legislation at reference date,
the average leverage ratio of Group 1 banks stands at 5.1%. Under full implementation of the
CRD IV – CRR, the leverage ratio would decrease to 4.7%. Overall, the difference between Group 1
banks’ capital ratios under the current state and full implementation lies between 80 basis points
(bps) and 120 bps for the risk-sensitive measures, and around 40 bps according to the leverage
ratio.
Under full implementation of the risk-sensitive capital requirements for banks, the CET1 ratio of
Group 2 banks would, on average, drop from 14.1% to 13.6%, the Tier 1 ratio from 14.4% to
13.9% and the total capital ratio from 16.3% to 15.5%. The leverage ratio of Group 2 banks would
drop from the current 5.8% to 5.6% under full implementation. Large Group 2 banks exhibit the
greatest difference between current state and full implementation for the CET1 and Tier 1 capital
requirements; however, for the total capital ratio, the small Group 2 banks show the biggest
change.
Comparing Group 1 and Group 2 banks, the distance from current to full-implementation
regulatory capital requirements and leverage ratio appears smaller for Group 2 banks, which also
show higher capitalisation in terms of CET1 and Tier 1 (with reference to RWA) and in terms of
leverage ratio.
The joint G-SIIs/O-SIIs15 sample shows very similar results for capital requirements (in relation to
RWA and leverage ratio) to the Group 1 banks sample.
Table 3: Comparison of risk-based capital ratios and leverage ratio under alternative states of implementation (in %)
Number
of banks
CET1 Tier 1 Leverage ratio Total capital
Current Full Current Full Current Full Current Full
Group 1 40 13.2 12.4 14.3 13.1 5.1 4.7 17.1 15.9
Group 2 139 14.1 13.6 14.4 13.9 5.8 5.6 16.3 15.5
- Large 25 14.1 13.5 14.4 13.8 5.9 5.7 16.2 15.5
- Medium 27 14.3 14.2 14.8 14.4 6.0 5.9 16.6 16.1
15
It is noteworthy in this context that G-SIIs/O-SIIs are subject to additional capital requirements based on their systemic importance.

BASEL III MONITORING EXERCISE – RESULTS BASED ON DATA AS OF 31 DECEMBER 2015
15
Number
of banks
CET1 Tier 1 Leverage ratio Total capital
Current Full Current Full Current Full Current Full
- Small 87 13.7 13.6 14.0 13.8 5.1 5.0 16.0 15.2
Total 179 13.4 12.7 14.3 13.3 5.2 4.9 16.9 15.8
- G-SIIs/
O-SIIs 63 13.4 12.6 14.4 13.3 5.1 4.7 17.0 15.9
Source: EBA QIS data (December 2015)
Figure 1 presents basic descriptive statistics16 on risk-sensitive capital ratios and the leverage ratio
for Group 1 and Group 2 banks. It shows that, for the large majority (approximated by the 95th
percentile) of banks—both in Group 1 and Group 2—capital ratios are above the current
regulatory minimum requirements with respect to risk-sensitive measures and the leverage ratio.
This result holds for risk-sensitive capital ratio measures, even when the capital conservation
buffer is included. The median and average values of current CET1 and Tier 1 ratios, as well as the
leverage ratio, are generally higher for Group 2 than for Group 1 banks. The results indicate a
larger dispersion of extreme values (approximated by the 5th and 95th percentiles) for Group 2
banks’ capital ratios than for Group 1 banks’ capital ratios, while also being less concentrated
(approximated by the interquartile range) around the mean and median values of the
distribution.
16
For the methodology underlying the development of these box plots, please refer to section 1.2 of this report.

BASEL III MONITORING EXERCISE – RESULTS BASED ON DATA AS OF 31 DECEMBER 2015
16
Figure 1: Distribution of CET1, Tier 1 and total capital ratios per bank group
Source: EBA QIS data (December 2015)
Figure 2 shows the trend in the current and full implementation CET1 ratio for the period of
June 2011–December 2015 for the consistent sample—i.e. the banks that have consistently
submitted data for all reference dates. The CET1 ratio, according to the then applicable level of
implementation for Group 1 banks, increased from just over 10% to around 12.5% during the
period of mid-2011–end-2013. After a temporary decrease to 11.7% in June 2014, in
December 2015 it exceeded its previous level to close at 13%. The reduction observed in
June 2014 can be explained by the introduction of the CRD IV – CRR in January 2014, which, for
the first time, is reflected in the monitoring exercise for reporting date June 2014. Nevertheless,
the CET1 ratio for Group 1 banks under full implementation of the CRD IV – CRR package
increased constantly over the observation period, with an overall CET1 increase since June 2011
of around 600 bps.
Group 1 Group 2 Group 1 Group 2 Group 1 Group 2 Group 1 Group 2 0%
5%
10%
15%
20%
25%
CET1 Tier 1 Totalcapital
Leverageratio

BASEL III MONITORING EXERCISE – RESULTS BASED ON DATA AS OF 31 DECEMBER 2015
17
Similarly, for Group 2 banks, the average CET1 capital ratios in accordance with fully implemented
European regulatory requirements have increased steadily since June 2011 (by around 660 bps).
In December 2015, the full implementation CET1 capital ratio of Group 2 banks was slightly above
13%, while the respective current rules ratio is around 13.8%. As expected, the difference
between CET1 ratios under current state and full implementation is markedly decreasing over the
observation period for both groups of banks.
Figure 2: Evolution of CET1 ratios over time
Source: EBA QIS data (December 2015)
The historical upward trend in the CET1 ratio under full implementation of the CRD IV – CRR for
Group 1 banks is mainly explained by the increase in CET1 capital (by almost 60%) and to a less
extent by the decrease in RWA (by nearly 20% as shown in Figure 3). This trend has been
observed relatively continuously since June 2011, however, with decreasing growth of the CET1
capital and stronger decline in the RWA in the last observation period.
The increase in full implementation CET 1 capital over the observation period indicates that banks
already try to meet market expectations well in advance of the legislative date for the full
implementation of the CRD IV – CRR / Basel III framework.17
17
The trend of improving capital positions of European banks is consistent with findings to EBA’s reports on transparency and risks and vulnerabilities of the European banking sector (EBA: 2015 EU-wide transparency exercise (Nov 2015) and EBA: Risk Assessment of the European banking system (December 2015)).
0
2
4
6
8
10
12
14
Capital ra
tio (
%)
Group 1
Jun
11
Dec
11
Jun
12
Dec
12
Jun
13
Dec
13
Jun
14
Dec
14
Jun
15
Dec
15
0
2
4
6
8
10
12
14
Capital ra
tio (
%)
Group 2
Jun
11
Dec
11
Jun
12
Dec
12
Jun
13
Dec
13
Jun
14
Dec
14
Jun
15
Dec
15
Full Current

BASEL III MONITORING EXERCISE – RESULTS BASED ON DATA AS OF 31 DECEMBER 2015
18
Figure 3: Evolution of CET1 capital versus RWA over time (for Group 1 banks)
Source: EBA QIS data (December 2015)
The increase in the level of capital is also generally reflected in the leverage ratio. Taking a
consistent sample of banks, between June 2013 and December 2013 there was a significant
increase in banks’ leverage ratios (see Figure 4), which can be partially attributed to the
recalibration of the leverage ratio exposure in January 2014, with the first application being as of
reporting date December 2013. However, it has to be noted that the data reflect the respective
calculation methodology at each reference date. The increase also continued for the period of
December 2013–December 2015 for both groups of banks. Overall, while up to mid-2013 Group 1
and Group 2 banks, on average, showed leverage ratios very close to the target ratio (3%), since
then they have increased their capital beyond the minimum requirement. Over the observation
period, Group 2 banks have exhibited consistently higher average leverage ratios than Group 1
banks.
Jun 11 Dec 11 Jun 12 Dec 12 Jun 13 Dec 13 Jun 14 Dec 14 Jun 15 Dec 15 40%
60%
80%
100%
120%
140%
160%
CET1
Risk-w eighted assets

BASEL III MONITORING EXERCISE – RESULTS BASED ON DATA AS OF 31 DECEMBER 2015
19
Figure 4: Evolution of leverage ratio by bank group over time (in %)
Source: EBA QIS data (December 2015)
Capital shortfall 2.2
Table 4 provides estimates of the additional amount of capital that Group 1 and Group 2 banks
would need in order to meet the target risk-sensitive capital ratios (including G-SII/O-SII buffer)
and the leverage ratio under the CRD IV package. These estimates assume fully phased-in target
requirements and deductions. In this analysis, the capital shortfall is calculated as the difference
between capital requirements and eligible capital held at the bank level, and represents the
capital needs assuming that capital requirements had to be met to achieve successively higher-
quality capital layers.18
For Group 1 banks, the CET1 capital shortfall is zero when compared with the minimum
requirement of 4.5% (not shown in the table) and with the target level of 7%19—i.e. the minimum
requirement plus the capital conservation buffer. The total shortfall of Tier 1 capital to meet both
the risk-based capital ratio and the leverage ratio is EUR 0.2 billion for Group 1 banks. The total
capital shortfall necessary to fulfil the risk-based requirements (7% CET1, 8.5% Tier 1 and 10.5%
total capital) and the leverage ratio requirement (3% Tier 1 capital) is EUR 1.2 billion for Group 1
banks. For Group 1 banks, shortfalls arise from the risk-based capital requirements rather than
from the requirements based on the leverage ratio.
18
Note that the total Tier 1 capital shortfall for a bank represents the maximum of the Tier 1 capital shortfall for risk-based Tier 1 capital ratio and the Tier 1 shortfall for the leverage ratio. 19
The calculation method applied in this report may overstate the actual shortfall for those banks affected by the 10% and 15% threshold deductions because the decline in deductions due to higher thresholds is not taken into account.
Jun 11 Dec 11 Jun 12 Dec 12 Jun 13 Dec 13 Jun 14 Dec 14 Jun 15 Dec 150%
1%
2%
3%
4%
5%
6%
2.5% 2.6% 2.7% 2.8% 2.8%
3.6%3.8%
4.0%4.2%
4.5%
3.1% 3.1%3.3%
3.1% 3.1%
4.0%
4.4% 4.4%
4.9% 5.0%
Group 1 Group 2

BASEL III MONITORING EXERCISE – RESULTS BASED ON DATA AS OF 31 DECEMBER 2015
20
Group 2 banks have a CET1 shortfall of EUR 0.4 billion at 7% level, and the aggregate shortfall can
be attributed to medium- and small-sized banks in the Group 2 sample. Group 2 banks would
need EUR 3.4 billion to meet the target Tier 1 capital requirements (risk-based and based on
leverage ratio), while they would need EUR 4.1 billion to comply with full implementation total
capital requirements.
The joint G-SIIs/O-SIIs sample exhibits zero capital shortfalls at the 7% CET1 level—something that
aligns with the results for Group 1 banks. They require EUR 0.7 billion to meet the Tier 1 (risk-
based and leverage ratio) requirements and EUR 1.9 billion to comply with full implementation
total capital requirement.
Table 4: Capital shortfall by bank group, including capital conservations buffer and G-SII/O-SII buffer where applicable (in billion EUR)
Number of banks
CET1
Tier 1 Total capital
Risk-based ratio
LR To meet
both
To meet all risk-based ratios
To meet all risk-based ratios and LR
Group 1 40 — 0.2 — 0.2 1.2 1.2
Group 2 139 0.4 1.2 2.2 3.4 1.9 4.1
- Large 25 — — 0.3 0.3 — 0.3
- Medium 27 0.3 0.9 — 0.9 1.4 1.4
- Small 87 0.1 0.3 1.9 2.2 0.5 2.4
Total 179 0.4 1.4 2.2 3.5 3.1 5.3
- G-SIIs/O-SIIs 63 — 0.2 0.5 0.7 1.4 1.9
Source: EBA QIS data (December 2015)
The very significant reduction in capital shortfalls (compared to full implementation) can be
analysed in more detail, as shown in Figure 5. Whereas, at the beginning of the observation
period (June 2011), banks (Group 1 and Group 2) lacked more than EUR 500 billion of total
capital—half of which was CET1—shortfalls as of end-2015 represent only a very minor fraction of
that amount. For Group 1 banks, nearly an 85% reduction in (CET1) capital shortfalls occurred in
the period of mid-2013–mid-2014 alone.20
20
Although the trend holds for most banks during that period, the decline is significantly influenced by one large bank.

BASEL III MONITORING EXERCISE – RESULTS BASED ON DATA AS OF 31 DECEMBER 2015
21
Figure 5: Evolution of capital shortfall by type of capital under full implementation over time
Source: EBA QIS data (December 2015)
Table 5 presents a particular aspect of the interaction between the leverage ratio and the risk-
based Tier 1 capital ratio requirements.21 More concretely, it analyses which of the capital
ratios—risk-based or leverage ratio—represents the stricter requirement for banks. The leverage
ratio, rather than the risk-sensitive Tier 1 capital ratio, is said to be a constraint for a bank if this
bank requires more capital to meet the leverage ratio requirement than to meet the risk-sensitive
Tier 1 capital requirement. Mathematically, it is deemed to be a constraint when 3% of the
leverage ratio exposure measure exceeds the required Tier 1 capital ratio multiplied the bank’s
RWA.
In December 2015, all Group 1 banks were compliant with the 3% minimum Tier 1 LR
requirement, while only nine Group 2 banks were non-compliant—seven of which are small
institutions. The capital shortfall is limited to EUR 2.2 billion, which is all contributed to Group 2
banks. Overall, however, the analysis indicates that, for the majority of banks, the leverage ratio is
a constraint beyond the risk-based capital requirements. On average, Group 1 banks (75%) are
more frequently constrained by the leverage ratio requirement than Group 2 banks (56.8%; 68.0%
for large ones). This remarkable constraint power of the leverage ratio holds even when the
capital conservation buffer (additional CET1 2.5%) and G-SII/O-SII buffer are taken into account.
While actual capital shortfall amounts are rather low, even under the more conservative scenario
of the risk-based Tier 1 requirements (8.5%, incl. conservation buffer), capital requirements are
constrained by the leverage ratio for 42.5% of Group 1 banks and 28.1% of Group 2 banks.
21
Please note that a common sample of banks that participated in the risk-based and leverage ratio parts of this exercise has been used to carry out the interaction analysis as shown in Table 5.
0
50
100
150
200
250
300
350
400
450
500
Capital short
fall
(in E
UR
bn)
Group 1
Jun
11
Dec
11
Jun
12
Dec
12
Jun
13
Dec
13
Jun
14
Dec
14
Jun
15
Dec
15
0
5
10
15
20
25
30
35
40
45
50
55
Capital short
fall
(in E
UR
bn)
Group 2
Jun
11
Dec
11
Jun
12
Dec
12
Jun
13
Dec
13
Jun
14
Dec
14
Jun
15
Dec
15
CET1 Additional Tier 1 Add. Tier 1 for LR Tier 2

BASEL III MONITORING EXERCISE – RESULTS BASED ON DATA AS OF 31 DECEMBER 2015
22
Table 5: Degree of binding power of risk-based versus leverage ratio Tier 1 capital requirements on banks
Tier 1 leverage ratio minimum requirement
Tier 1 risk-based minimum requirement
Tier 1 risk-based minimum requirement plus
conservation buffer and G-SII/O-SII buffer where
applicable
Nu
mb
er o
f LR
no
n-
com
plia
nt
ban
ks
Pro
po
rtio
n o
f LR
no
n-
com
plia
nt
ban
ks (
%)
LR c
apit
al s
ho
rtfa
ll
Pro
po
rtio
n o
f b
anks
con
stra
ined
by
LR (
%)
Pro
po
rtio
n o
f LR
no
n-
com
plia
nt
ban
ks
mee
tin
g ri
sk-b
ased
rat
io
(%)
LR c
apit
al s
ho
rtfa
ll22
Pro
po
rtio
n o
f b
anks
co
nst
rain
ed b
y LR
(%
)
Pro
po
rtio
n o
f LR
no
n-
com
plia
nt
ban
ks
mee
tin
g ri
sk-b
ased
rat
io
(%)
LR C
apit
al s
ho
rtfa
ll23
Group 1 — — — 75.0 — — 42.5 — —
Group 2 9 6.5 2.2 56.8 6.5 2.2 28.1 6.5 2.2
- Large 2 8.0 0.3 68.0 8.0 0.3 32.0 8.0 0.3
- Medium — — — 59.3 — — 33.3 — —
- Small 7 8.0 1.9 52.9 8.0 1.9 25.3 8.0 1.9
Total 9 5.0 2.2 60.9 5.0 2.2 31.3 5.0 2.2
- G-SIIs/ O-SIIs
3 4.8 0.5 74.6 4.8 0.5 42.9 4.8 0.5
Source: EBA QIS data (December 2015)
22
LR capital shortfall assuming that banks had already raised enough capital to fulfil the risk-based ratios. 23
See above.

BASEL III MONITORING EXERCISE – RESULTS BASED ON DATA AS OF 31 DECEMBER 2015
23
Impact of phase-in arrangements 2.3
At the current implementation stage of CRD IV – CRR, banks are still subject to transitional
arrangements (phase-in of deductions and capital buffers and phase-out of capital elements). It is
therefore reasonable to expect a decrease in the level of capital for both Group 1 and Group 2
banks under full implementation, mainly due to the reduction of eligible capital elements.
The aggregate CET1 capital of Group 1 banks shows a decrease of 4.7%, while Tier 1 and total
capital decrease by 8.8% and 9.4% respectively (Table 6). For Group 2 banks, the relative
percentage changes in CET1, Tier 1 and total capital are 3.0%, 3.2% and 4.1% respectively. These
figures suggest that Group 1 banks are more constrained regarding capital than Group 2 banks,
which exhibit a considerably lower decrease in CET1, Tier 1 and total capital.
Table 6: Relative percentage change in capital by type and RWA (in %)
Number
of banks24
CET1 Tier 1 Total
capital RWA
Group 1 45 -4.7 -8.8 -9.4 -0.1
Group 2 168 -3.0 -3.2 -4.1 0.6
- Large 28 -3.5 -3.2 -3.8 0.9
- Medium 33 -2.1 -3.7 -4.1 0.1
- Small 107 -1.8 -2.4 -5.2 -0.0
Total 213 -4.4 -7.7 -8.4 0.0
- G-SIIs/O-SIIs 71 -4.6 -8.2 -8.9 0.0
Source: EBA QIS data (December 2015)
24
Several banks have submitted data on capital and RWA, but have not reported data on the EU leverage ratio exposure measure. As Table 6 only refers to data on capital and RWA, the number of banks included is higher than in other tables in this chapter.

BASEL III MONITORING EXERCISE – RESULTS BASED ON DATA AS OF 31 DECEMBER 2015
24
Composition of capital 2.4
Figure 6 shows the composition of total capital for Group 1 and Group 2 banks under the
assumption of full implementation. Time series analysis based on a consistent sample shows that
the share of CET1 capital under full implementation has been decreasing on average for most
Group 1 banks since June 2012. In contrast, the average share for Group 2 banks has been
increasing on average since June 2011. However, for Group 1 banks, this is due to the increased
accumulation of additional Tier 1 (which has more than doubled since June 2011) and Tier 2
capital compared to the accumulation of CET1 capital. As of December 2015, Group 1 banks’
figures indicate that the share of fully implemented CET1 to total capital is about 77%. Additional
Tier 1 and Tier 2 capital amount to about 5% and 18% of the total capital of Group 1 banks
respectively. Group 2 banks hold a slightly higher share of CET1 capital, compared to Group 1
banks, under the assumption of full implementation of CRD IV – CRR. As of December 2015, this
share amounts to approximately 84% of total capital, while the shares of additional Tier 1 capital
(3%) and Tier 2 capital (13%) are correspondingly lower.
Figure 6: Evolution of capital structure over time
Source: EBA QIS data (December 2015)
0%
10%
20%
30%
40%
50%
60%
70%
80%
90%
100%
Capital str
uctu
re u
nder
full
imple
menta
tion
Group 1
Jun
11
Dec
11
Jun
12
Dec
12
Jun
13
Dec
13
Jun
14
Dec
14
Jun
15
Dec
15
0%
10%
20%
30%
40%
50%
60%
70%
80%
90%
100%
Capital str
uctu
re u
nder
full
imple
menta
tion
Group 2
Jun
11
Dec
11
Jun
12
Dec
12
Jun
13
Dec
13
Jun
14
Dec
14
Jun
15
Dec
15
CET1 Additional Tier 1 Tier 2

BASEL III MONITORING EXERCISE – RESULTS BASED ON DATA AS OF 31 DECEMBER 2015
25
Composition of RWA 2.5
After having analysed the different types of regulatory capital—i.e. the numerator of capital
ratios—this sub-section deals with the RWA—i.e. the denominator of risk-sensitive capital ratios.
Figure 7 shows under the fully phased-in CRD IV package that credit risk is the major component
of RWA for both Group 1 and Group 2 banks. The share of credit risk in RWA is more than 80% for
Group 1 banks and above 85% for Group 2 banks. After a drop in June 2012, the share of credit
risk has increased again almost to the previous levels for both groups of banks.
The operational risk exhibits the second-highest share in the RWA for both groups of banks
(around 10%). The share of RWA for the market risk category is roughly twice as high for Group 1
banks as for Group 2 banks. The declining share of RWA for CVA over time suggests that the new
regulatory framework has had a direct impact on bank behaviour. Figure 7 also indicates that the
introduction of the CVA capital charge resulted in portfolio adjustments and the cutting down of
CVA positions, which contributed to the reduction in total RWA.25
Figure 7: Evolution of the composition of RWA by risk category over time
Source: EBA QIS data (December 2015)
25
The order and scales of magnitude for different risk categories observed in this monitoring exercise are very consistent with results of previous transparency exercises and supervisory disclosures for the European banking sector. See also the EBA’s aggregate statistics on the European banking sector, available at: http://www.eba.europa.eu/supervisory-convergence/supervisory-disclosure/aggregate-statistical-data.
0%
10%
20%
30%
40%
50%
60%
70%
80%
90%
100%
Com
positio
n o
f R
WA
under
full
imple
menta
tion
Group 1
Jun
11
Dec
11
Jun
12
Dec
12
Jun
13
Dec
13
Jun
14
Dec
14
Jun
15
Dec
15
0%
10%
20%
30%
40%
50%
60%
70%
80%
90%
100%
Com
positio
n o
f R
WA
under
full
imple
menta
tion
Group 2
Jun
11
Dec
11
Jun
12
Dec
12
Jun
13
Dec
13
Jun
14
Dec
14
Jun
15
Dec
15
Credit Risk CVA Market Risk OpRisk Other RWA

BASEL III MONITORING EXERCISE – RESULTS BASED ON DATA AS OF 31 DECEMBER 2015
26
Composition of the leverage ratio exposure measure 2.6
This sub-section looks at the exposure measure as defined for the purpose as the denominator of
the leverage ratio. Figure 8 shows the composition of the leverage ratio exposure measure by
asset category. For both groups of banks, ‘other on-balance-sheet items’ are the main component
of exposures. For Group 2, whose exposures are characterised by a more traditional bank
business model, the ‘other on-balance-sheet items’ represent 91% of the leverage ratio exposure
measure, while for Group 1 banks the exposures relating to derivatives, securities financing
transactions and off-balance-sheet items represent around one quarter of their exposures. Note
that the calculation of derivatives exposure is currently under review by the BCBS. According to
footnote 5 of the Basel III LR framework, alternative approaches to the Current Exposure Method
(CEM) are taken into account. The standardised approach for measuring counterparty credit risk,
which will replace the CEM in the risk-based framework in January 2017, is under review for the
purpose of the leverage ratio and is expected to have more impact on Group 1 than Group 2
banks.26 Also, the EBA27 is in the process of monitoring in order to assess whether the design and
calibration of a minimum Tier 1 leverage ratio of 3% are appropriate for different types of
business models over a full credit cycle.
26
The final calibration of the leverage ratio is envisaged to be completed by 2017. Regarding those envisaged reviews, see also page 7 of the Basel III leverage ratio framework: http://www.bis.org/publ/bcbs270.pdf. 27
See also European Commission: Call for Advice to the EBA for the purposes of the Net Stable Funding Requirements and the Leverage Ratio (2015).

BASEL III MONITORING EXERCISE – RESULTS BASED ON DATA AS OF 31 DECEMBER 2015
27
Figure 8: Composition of the leverage ratio exposure measure by asset category (in %)
Source: EBA QIS data (December 2015)
The development and implementation of a leverage ratio is not intended to reduce any of the
positive prudential effects of the risk-based capital requirements.28 Therefore, the interaction
between the leverage ratio and risk-based capital ratios is being monitored.
Figure 9 illustrates the development of the relationship between fully phased-in RWA and the
leverage ratio exposure measure by bank group. If the quotient is below the dotted blue line (for
Group 1 banks) or the yellow line (for Group 2 banks),29 this implies that the leverage ratio, rather
than the risk-based Tier 1 capital ratio of 8.5% (minimum requirement plus capital conservation
buffer), would be, on average, a constraint. If the quotient is above the dotted line, this implies
that the risk-based Tier 1 capital ratio rather than the leverage ratio would, on average, be a
constraint. This quotient mostly decreased for the period of June 2011–June 2013, which was
caused by a decrease in RWA coupled with an increase in exposure (in the sense that, on average,
banks preferred to follow a de-risking rather than a de-leveraging strategy). In December 2013,
compared to June 2013, an increase of 430 bps for Group 1 and 240 bps for Group 2 was
observed. This change was caused by a decrease in the leverage ratio exposure measure, partially
driven by the recalibration of the exposure definition. For the current reference date
(December 2015), the ratio of RWA over the leverage ratio exposure measure has increased by 28
For an argument about the benefits of the leverage ratio as a capital backstop over the financial cycle and across banks using internal models, see also BCBS: The regulatory framework—Balancing risk-sensitivity, simplicity and comparability (Working Paper July 2013) and BIS: The Leverage Ratio over the Cycle (Working Paper No 471, Nov 2014). 29
Calculated as the quotient between the leverage ratio requirement (3%) and the risk-based Tier 1 capital ratio requirement (8.5%, plus G-SII/O-SII buffer where applicable).
6%< 1%
7%
8%
78%
Group 1
1%< 1%2%
5%
91%
Group 2
Other derivatives
Credit derivatives
Securities financing transactions
Other off-balance-sheet items
Other on-balance-sheet items

BASEL III MONITORING EXERCISE – RESULTS BASED ON DATA AS OF 31 DECEMBER 2015
28
80 bps for Group 1 banks and decreased by 110 bps for Group 2 banks compared to the previous
reference date. The figures indicate that, on average, banks are more constrained by the risk-
based Tier 1 ratio than by the leverage ratio requirement, which is particularly true for Group 2
banks. This result is in line with the findings under Table 5, which indicates that (i) leverage ratio is
a constraint more for Group 1 banks than Group 2 banks and (ii) a higher share of Group 1 banks
is constrained by leverage ratio rather than risk-based capital, and this ratio falls as the calculation
accounts for capital buffers and the G-SII/O-SII buffer.30
Figure 9: Relation of RWA to exposure
Source: EBA QIS data (December 2015)
30
Also note that there are methodological differences between Table 5 and Figure 9. First, Table 5 is based on a cross-sectional sample, while Figure 9 is based on a time series sample. Secondly, the former investigates the share of banks, and the latter presents weighted averages that are subject to offsetting effects across banks.
Jun 11 Dec 11 Jun 12 Dec 12 Jun 13 Dec 13 Jun 14 Dec 14 Jun 15 Dec 15 0%
5%
10%
15%
20%
25%
30%
35%
40%
45%
50%
55%
38.0% 37.7%
35.1%
32.4%30.6%
34.9%33.9% 33.5% 33.5% 34.3%
43.4% 43.1%41.2%
40.5%39.2%
41.6%39.8%
39.0% 39.7%38.6%
Group 1 Group 2

BASEL III MONITORING EXERCISE – RESULTS BASED ON DATA AS OF 31 DECEMBER 2015
29
3. Liquidity
LCR 3.1
Another minimum standard in the CRD IV package is the 30-day LCR provision, which is intended
to promote short-term resilience to potential liquidity disruptions. The LCR requires banks to have
a sufficient level of HQLA to withstand a stressful funding scenario of 30 days. The LCR defines the
minimum stock of unencumbered HQLA that must be available to cover the net outflow expected
to occur in a severe stress scenario.
At EU level, with the adoption of the Commission Delegated Regulation (EU) No 2015/61 on the
LCR in October 2014, the EU LCR framework introduced several features that differ from the
Basel III LCR framework. Broadly, with respect to the Basel III framework, the EU LCR DA:
HQLA
modifies the requirements for instruments already captured as HQLA under Basel III—e.g.
preferential treatment of assets representing claims on or guaranteed by the central
government, the central bank, regional governments, local authorities or PSEs of a
Member State—and upgrades the liquidity quality of extremely high-quality covered
bonds;
increases the range of instruments that are not captured under Basel III—e.g.
promotional banks’ assets, covered bonds of certain credit quality, certain restricted-use
committed liquidity facilities with the ECB, certain asset-backed securities, shares and
units in collective investment undertakings (CIUs), and sight deposits that the credit
institution holds with the central institution within an institutional protection scheme;
amends the composition of the liquidity buffer by adding a new cap on liquid assets—i.e.
a minimum of 30% of the overall liquidity buffer has to be held in Level 1 assets, excluding
extremely high-quality covered bonds;
Outflows
amends, within the calculation of outflows, the run-off rates of the outstanding balances
of various categories or types of liabilities and off-balance-sheet commitments—e.g.
more granular categorisation of the less stable retail deposits and respective run-off rates
of 10%-20%; and

BASEL III MONITORING EXERCISE – RESULTS BASED ON DATA AS OF 31 DECEMBER 2015
30
Inflows
provides, subject to prior supervisory approval, partial or full exemption for certain
institutions in the application of a 75% cap on inflows in the calculation of net cash
outflows.
Furthermore, as defined in Article 38 of the EU LCR DA and in accordance with Article 460(2) of
the CRR, the minimum requirement has been set at 60% from 1 October 2015 and will gradually
increase to 100% by January 2018—i.e. the EU regulation requires a minimum of 100% one year
before the Basel standard.31 This report presents EU-specific LCR analysis based on the framework
of the EU LCR DA.
LCR and shortfall in liquid assets
Figure 10 provides an overview of the distribution of the LCR by bank group. As of
December 2015, Group 1 banks exhibit a weighted average LCR of 126.8%, while Group 2 banks’
LCR is 169.3%. All Group 1 banks already meet the 70% requirement of January 2016, and the vast
majority of these banks already meet the 100% requirement—i.e. 32 out of 35 banks. Regarding
Group 2 banks, three banks fail to meet the 70% minimum requirement, while the number of
non-compliant banks at the 100% requirement is 13, or approximately 10% of the Group 2
sample.
Figure 10 also indicates greater variation in the level of LCR among Group 2 banks with respect to
Group 1 banks. The values of LCR varies among Group 1 banks from 81.8% (minimum) to 267.5%
(maximum), while among Group 2 banks this range is from 35.3% (minimum) to 5098.1%
(maximum).
31
See the EBA’s LCR Impact Assessment Reports (2016) to be published under Article 509(1) of the CRR for a detailed analysis of the comparison between LCR frameworks under the EU LCR DA and Basel III.

BASEL III MONITORING EXERCISE – RESULTS BASED ON DATA AS OF 31 DECEMBER 2015
31
Figure 10: Distribution of LCR by bank group
Source: EBA QIS data (December 2015)
Table 7 illustrates the LCR and the LCR shortfall for different minimum ratios as defined in
Article 38 of the Commission Delegated Regulation. The total LCR shortfall with regard to a
minimum ratio of 100% is EUR 10.8 billion, of which EUR 7.6 billion corresponds to Group 1 and
EUR 3.2 billion to Group 2 banks. The total shortfall represents 8.8% of the total HQLA
(EUR 123 billion) of all non-compliant banks and 1.1% of total assets (EUR 974 billion) of all non-
compliant banks. As of 31 December 2015, three Group 2 banks, of which one has also been
classified as an O-SII, present a positive shortfall at the 70% minimum requirement. In order to
comply with the minimum requirement of 80% in January 2017, the same three banks need an
additional amount of EUR 1.5 billion in liquid assets.
The shortfall considered here is the gross value—i.e. the sum of the differences between the net
outflows and the stock of HQLA for all banks with an LCR that falls below the minimum threshold
of 70%, 80% or 100%. In other words, the calculation of shortfall does not account for the
offsetting effect of the surplus arising from those banks that already meet and exceed the
minimum requirement. Therefore, the reported shortfall amount represents a conservative proxy
of institutions’ actual shortfall, as it does not include any assumptions on the reallocation of
liquidity between individual banks or within the system as such.
Group 1 Group 2 0%
50%
100%
150%
200%
250%
300%
350%
400%
LC
R

BASEL III MONITORING EXERCISE – RESULTS BASED ON DATA AS OF 31 DECEMBER 2015
32
Table 7: LCR and LCR shortfall for different minimum ratios according to Article 460(2) of the CRR
Number of
banks LCR
LCR shortfall (in billion EUR) at a minimum of:
70% (2016)
80% (2017)
100% (2018)
Group 1 35 126.8 — — 7.6
Group 2 136 169.3 1.1 1.5 3.2
- Large 24 171.4 — — 0.4
- Medium 26 183.7 0.9 1.2 1.9
- Small 86 150.6 0.2 0.3 0.9
Total 171 133.7 1.1 1.5 10.8
- G-SIIs/O-SIIs 59 129.9 0.2 0.3 8.4
Source: EBA QIS data (December 2015)
Evolution of the LCR over time
When analysing the evolution of the LCR over time, it should be noted that figures for periods
before June 2015 are based on Basel III definitions—i.e. apart from structural changes, part of the
change can also be attributed to differences between Basel III and the Commission Delegated
Regulation.32 Some changes in the LCR between June and December 2012 are also driven by the
recalibration of the Basel III LCR framework, published in January 2013. Nevertheless, banks have,
on average, put significant effort into increasing their LCRs both by increasing their liquidity buffer
and by decreasing their net cash outflows. Since June 2011, Group 1 and Group 2 banks have, on
average, increased their LCRs by approximately 61.5 (Group 1) and 86.9 (Group 2) percentage
points (Figure 11).
For Group 1 banks, on average, the main driver for the increase in the level of LCR over time is the
increase in HQLA. In all instances, Group 1 banks increased their liquid asset buffers and reduced
their net cash outflows at the same time, or the increase in the level of net cash outflows in HQLA
buffers exceeded the increase in the level of net cash outflows—hence, the overall LCR increased.
32
See the EBA’s LCR IA Reports (2016) to be published under Article 509(1) of the CRR for a detailed quantitative analysis on the differences between EU LCR DA and the Basel III framework.

BASEL III MONITORING EXERCISE – RESULTS BASED ON DATA AS OF 31 DECEMBER 2015
33
Figure 11: Evolution of LCR by bank group (in %)
Source: EBA QIS data (December 2015)
During the period of June 2011–December 2012, both Group 1 and Group 2 banks increased
mostly cash and central bank reserves to comply with the LCR regulation, and, from June 2013–
June 2015, securities were the major drivers for compliance (Figure 12 and Figure 13). In the last
reporting date, for Group 1 banks, ‘Level 1 assets—Cash and Central Banks (CB) reserves’ are the
major drivers of the increase in LCR and, for Group 2 banks, this is ‘Level 1 assets—Securities’,
which include sovereign bonds.33
33
See the EBA’s LCR IA Reports (2016) to be published under Article 509(1) of the CRR for a detailed analysis on the composition of the HQLA buffer.
Jun 11 Dec 11 Jun 12 Dec 12 Jun 13 Dec 13 Jun 14 Dec 14 Jun 15 Dec 15 0%
20%
40%
60%
80%
100%
120%
140%
160%
180%
LC
R
65% 66%
80%
109%104%
112%118%
126%121%
127%
77%
105%
136%
147%
159%
169% 169%
156%161%
164%
Group 1 Group 2

BASEL III MONITORING EXERCISE – RESULTS BASED ON DATA AS OF 31 DECEMBER 2015
34
Figure 12: Evolution of liquid assets over time
Source: EBA QIS data (December 2015)
Figure 13: Evolution of liquid assets over time (relative to total assets)
Source: EBA QIS data (December 2015)
0
500
1000
1500
2000
2500
Liq
uid
assets
(in
EU
R b
n)
Group 1
Jun
11
Dec
11
Jun
12
Dec
12
Jun
13
Dec
13
Jun
14
Dec
14
Jun
15
Dec
15
0
50
100
150
200
250
300
Liq
uid
assets
(in
EU
R b
n)
Group 2
Jun
11
Dec
11
Jun
12
Dec
12
Jun
13
Dec
13
Jun
14
Dec
14
Jun
15
Dec
15
Level 1 assets — Cash and CB reserves Level 1 assets — Securities Level 2A assets Level 2B assets
0%
2%
4%
6%
8%
10%
12%
14%
Liq
uid
assets
(re
lative t
o t
ota
l assets
)
Group 1
Jun
11
Dec
11
Jun
12
Dec
12
Jun
13
Dec
13
Jun
14
Dec
14
Jun
15
Dec
15
0%
2%
4%
6%
8%
10%
12%
14%
Liq
uid
assets
(re
lative t
o t
ota
l assets
)
Group 2
Jun
11
Dec
11
Jun
12
Dec
12
Jun
13
Dec
13
Jun
14
Dec
14
Jun
15
Dec
15
Level 1 assets — Cash and CB reserves Level 1 assets — Securities Level 2A assets Level 2B assets
BASEL III MONITORING EXERCISE – RESULTS BASED ON DATA AS OF 31 DECEMBER 2015
35
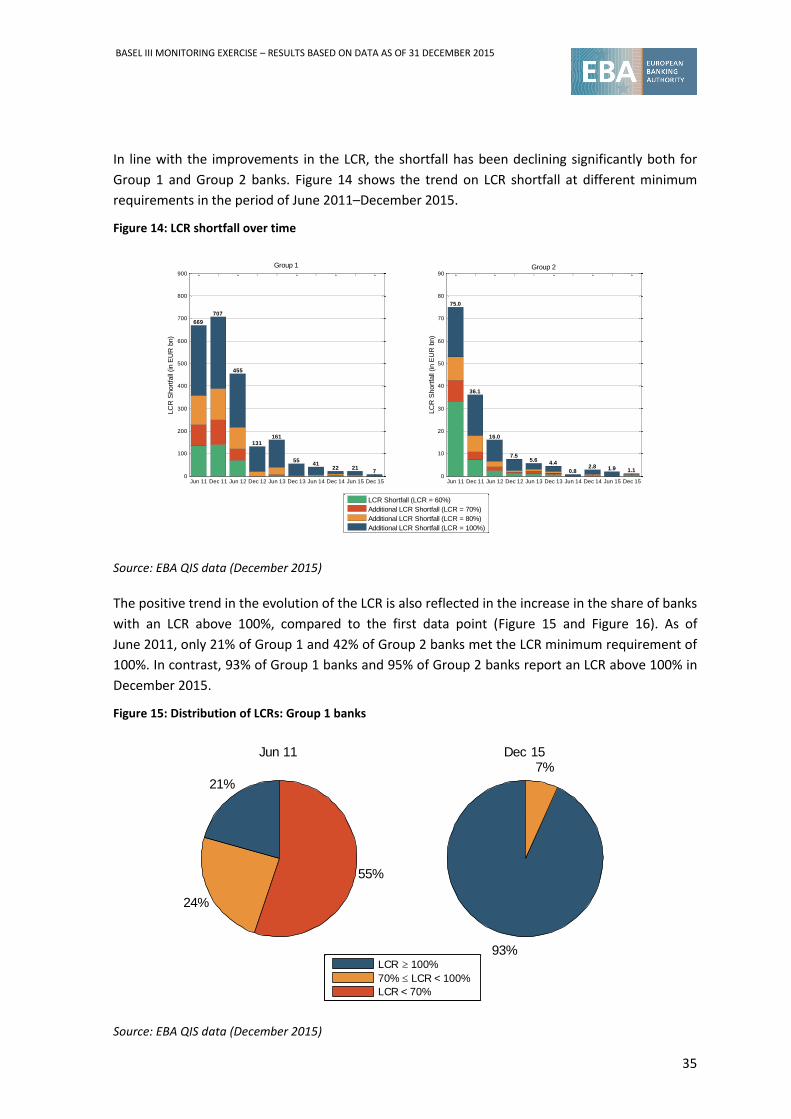
In line with the improvements in the LCR, the shortfall has been declining significantly both for
Group 1 and Group 2 banks. Figure 14 shows the trend on LCR shortfall at different minimum
requirements in the period of June 2011–December 2015.
Figure 14: LCR shortfall over time
Source: EBA QIS data (December 2015)
The positive trend in the evolution of the LCR is also reflected in the increase in the share of banks
with an LCR above 100%, compared to the first data point (Figure 15 and Figure 16). As of
June 2011, only 21% of Group 1 and 42% of Group 2 banks met the LCR minimum requirement of
100%. In contrast, 93% of Group 1 banks and 95% of Group 2 banks report an LCR above 100% in
December 2015.
Figure 15: Distribution of LCRs: Group 1 banks
Source: EBA QIS data (December 2015)
Jun 11 Dec 11 Jun 12 Dec 12 Jun 13 Dec 13 Jun 14 Dec 14 Jun 15 Dec 150
100
200
300
400
500
600
700
800
900
LC
R S
hort
fall
(in E
UR
bn)
Group 1
669
707
455
131161
5541
22 217
Jun 11 Dec 11 Jun 12 Dec 12 Jun 13 Dec 13 Jun 14 Dec 14 Jun 15 Dec 150
10
20
30
40
50
60
70
80
90
LC
R S
hort
fall
(in E
UR
bn)
Group 2
75.0
36.1
16.0
7.55.6
4.4
0.82.8 1.9 1.1
LCR Shortfall (LCR = 60%)
Additional LCR Shortfall (LCR = 70%)
Additional LCR Shortfall (LCR = 80%)
Additional LCR Shortfall (LCR = 100%)
21%
24%
55%
Jun 11
93%
7%Dec 15
LCR 100%
70% LCR < 100%
LCR < 70%

BASEL III MONITORING EXERCISE – RESULTS BASED ON DATA AS OF 31 DECEMBER 2015
36
Figure 16: Distribution of LCRs: Group 2 banks
Source: EBA QIS data (December 2015)
42%
13%
45%
Jun 11
95%
3%3%Dec 15
LCR 100%
70% LCR < 100%
LCR < 70%
BASEL III MONITORING EXERCISE – RESULTS BASED ON DATA AS OF 31 DECEMBER 2015
37
NSFR 3.2
The second liquidity standard is the NSFR—a longer-term structural ratio that addresses liquidity
mismatches and provides incentives for banks to use stable sources to fund their activities. The
NSFR is defined as the amount of ASF relative to the amount of RSF. This ratio should be equal to
or higher than 100%. The ASF is defined as the portion of capital and liabilities expected to be
reliable over the time horizon considered by the NSFR, which extends to one year. The amount of
RSF is a function of liquidity characteristics and residual maturities of the various assets held by
that institution, as well as those of its off-balance-sheet exposures. At the EU level, the NSFR has
not been finalised yet. In accordance with Article 510(3) of the CRR, the Commission is expected
to submit a legislative proposal to the European Parliament and the European Council by
31 December 2016 on how to ensure that institutions use stable sources of funding. Therefore,
the following results are based on the final Basel III NSFR framework as published in October
2014.
NSFR and shortfall in stable funding
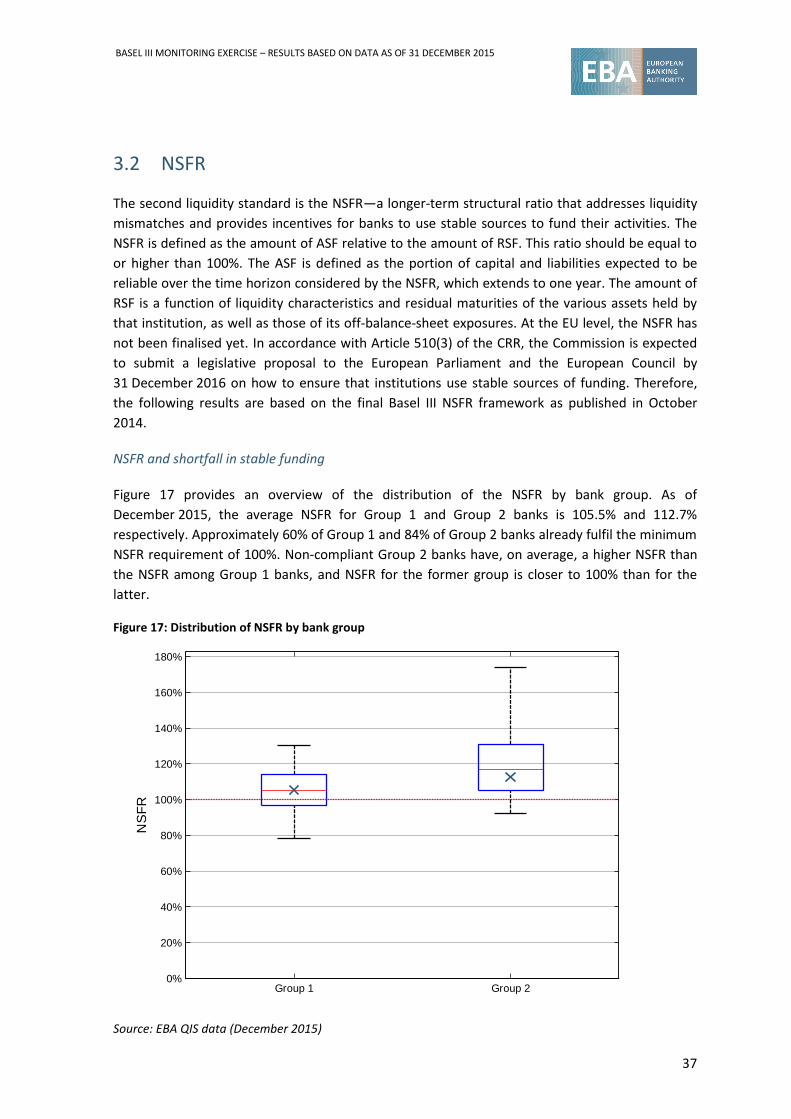
Figure 17 provides an overview of the distribution of the NSFR by bank group. As of
December 2015, the average NSFR for Group 1 and Group 2 banks is 105.5% and 112.7%
respectively. Approximately 60% of Group 1 and 84% of Group 2 banks already fulfil the minimum
NSFR requirement of 100%. Non-compliant Group 2 banks have, on average, a higher NSFR than
the NSFR among Group 1 banks, and NSFR for the former group is closer to 100% than for the
latter.
Figure 17: Distribution of NSFR by bank group
Source: EBA QIS data (December 2015)
Group 1 Group 2 0%
20%
40%
60%
80%
100%
120%
140%
160%
180%
NS
FR

BASEL III MONITORING EXERCISE – RESULTS BASED ON DATA AS OF 31 DECEMBER 2015
38
The range of the NSFR across banks is smaller than that of the LCR in the overall sample. This somewhat reflects the differences in the nature and design of the two ratios—i.e. the short-term nature of the LCR and the long-term nature of the NSFR, and respectively the parameters included in their calculations. Furthermore, like for the LCR, the range of the NSFR is larger among Group 2 banks than Group 1 banks.
Overall, banks in the sample are in need of an additional stable funding of EUR 240.1 billion as of
December 2015 (Table 8). The need for stable funding is 5.3% of total weighted ASF
(EUR 4.5 trillion) and 2.6% of total assets (EUR 9.3 trillion) of all non-compliant banks participating
in the NSFR-related part of this exercise. The need for stable funding is estimated by aggregating
only the positive differences between RSF and ASF (RSF minus ASF)—i.e. the deficit in the stable
funding of banks whose NSFR is below the 100% requirement—and does not account for any
surplus of stable funding observed in banks with an NFSR above the 100% requirement. Banks
that are below the 100% minimum requirement are still able to take a number of measures
between now and 2018 to meet the NSFR standard (e.g. lengthening their funding term or
decreasing maturity mismatches in their balance sheet).
It should also be noted that the shortfalls in the LCR and the NSFR are not necessarily additive, as
decreasing the shortfall in one standard may result in a similar decrease in the shortfall of the
other, depending on the steps taken to decrease the shortfall.34
Table 8: NSFR and NSFR shortfall in stable funding35
Number of
banks NSFR NSFR shortfall
Group 1 43 105.5 206.1
Group 2 146 112.7 33.9
- Large 24 110.4 22.3
- Medium 30 117.4 4.1
- Small 92 115.9 7.5
Total 189 107.0 240.1
- G-SIIs/O-SIIs 68 106.3 225.9
Source: EBA QIS data (December 2015)
34
For example, if a bank receives long-term (e.g. between six months and one year) stable funding (e.g. nine-month stable term deposits) and invests this in Level 1 HQLA, it increases: (i) its LCR position, since the liquidity buffer increases with no impact on the outflows; and (ii) its NSFR position. The NSFR position increases because an increase in the numerator dominates the increase in the denominator. The increase in the NSFR is due to 95% and 5% weights allocated to long-term stable funding and Level 1 liquid assets respectively. 35
The results shown in Table 8 differ from the results of Figure 18 and Figure 19 of this section because of different samples used for the analysis. The comparison with previous periods (Figure 18/Figure 19) is based on a consistent sample of banks, i.e. including only those banks which have consistently been reporting the relevant data for all sought reference dates,

BASEL III MONITORING EXERCISE – RESULTS BASED ON DATA AS OF 31 DECEMBER 2015
39
Evolution of the NSFR over time
Figure 18 illustrates the development of the NSFR over time using a consistent sample of banks.
The findings show that the average NSFR for Group 1 and Group 2 banks increased by 18.5
percentage points and 21.0 percentage points respectively. The significant increase in banks’
NSFRs in December 2013 may also be driven by the revisions made by the BCBS, which were
considered for the first time in December 2013. The NSFR figures in December 2014 remained
almost the same for both Group 1 and Group 2 banks.
The driver of the increasing trend is mostly an increase in ASF rather than a decrease in RSF. For
Group 1, on average, any increase between two reporting dates stems from the fact that an
increase in ASF is greater than an increase in RSF (except in one instance in June 2013, where the
increase in overall NSFR was due to the larger decrease in RSF that dominated the decrease in
ASF). Such a pattern is less evident for Group 2 banks.
Figure 18: Evolution of NSFR by bank group (in %)
Source: EBA QIS data (December 2015)
The overall positive trend is also reflected in the reduction of the shortfall of stable funding
needed to meet the 100% ratio requirement, which (compared to June 2011) has decreased by
89.3% for Group 1 banks and by 97.6% for Group 2 banks.
Jun 11 Dec 11 Jun 12 Dec 12 Jun 13 Dec 13 Jun 14 Dec 14 Jun 15 Dec 15 0%
20%
40%
60%
80%
100%
120%
NS
FR
88%92% 93%
95% 96%
102% 103% 103% 104%106%
93%
98%102% 101%
103%
111% 111% 110% 111%114%
Group 1 Group 2

BASEL III MONITORING EXERCISE – RESULTS BASED ON DATA AS OF 31 DECEMBER 2015
40
Figure 19: NSFR shortfall over time
Source: EBA QIS data (December 2015)
The NSFR is less volatile than the LCR and cannot be adjusted easily in a short period of time. This
is mainly due to the long-term nature of the parameters included in the calculation of the NSFR.
Therefore, a special focus will be placed on those banks with a ratio below 85%.36 As shown in
Figure 20 and Figure 21, the share of banks with an NSFR below this threshold has decreased
significantly since the beginning of this exercise, with only 3% of Group 1 banks and none of the
Group 2 banks reporting an NSFR below 85% as of December 2015.
36
Please note that the arbitrary threshold of 85% is based on the distribution of the NSFR in previous monitoring exercises and does not relate to any provision in the CRR.
Jun 11 Dec 11 Jun 12 Dec 12 Jun 13 Dec 13 Jun 14 Dec 14 Jun 15 Dec 150
500
1000
1500
NS
FR
short
fall
(in E
UR
bn)
Group 1
1330
975
903
685
571
368
260300
267
142
Jun 11 Dec 11 Jun 12 Dec 12 Jun 13 Dec 13 Jun 14 Dec 14 Jun 15 Dec 150
50
100
150
200
250
NS
FR
short
fall
(in E
UR
bn)
Group 2
206
142
83
95
65
26 2838
19
5

BASEL III MONITORING EXERCISE – RESULTS BASED ON DATA AS OF 31 DECEMBER 2015
41
Figure 20: Distribution of NSFRs: Group 1 banks
Source: EBA QIS data (December 2015)
Figure 21: Distribution of NSFRs: Group 2 banks
Source: EBA QIS data (December 2015)
15%
50%
35%
Jun 11
65%
32%
3%Dec 15
NSFR 100%
85% NSFR < 100%
NSFR < 85%
47%
34%
19%
Jun 11
89%
11%
Dec 15
NSFR 100%
85% NSFR < 100%
NSFR < 85%

BASEL III MONITORING EXERCISE – RESULTS BASED ON DATA AS OF 31 DECEMBER 2015
42
EUROPEAN BANKING AUTHORITY
Floor 46 One Canada Square, London, E14 5AA
Tel. +44 (0)207 382 1776
Fax: +44 (0)207 382 1771
E-mail: [email protected]
http://www.eba.europa.eu