crashing durations - homework a project is described by the activities a to f in the table below....
TRANSCRIPT

Crashing Durations - Homework
A project is described by the activities A to F in the table below. Also given are the predecessor activities, times required and costs for a normal and a crash program for each activity.
a) Draw the network diagram and carry out the analysis using the normal times and costs.b) Find the time-cost trade-off points that are possible. What is the minimum time in which the program can be completed and what is the cost of this program.
Activity Predecessors Normal Duration
Cost $
Crash Duration
Cost $
A - 8 100 6 200
B - 4 150 2 350
C A 2 50 1 90
D A 10 100 5 400
E B 5 100 1 200
F C, E 3 80 1 100

Project Control
We have learnt how to utilize CPM to develop the project plan.
Now is the time to make the project happen.
The development of a project plan completes the first phase of the planning cycle and the project manager is prepared to use the baseline plan as an outline for the efficient project management and control.
The baseline plan should be seen as the document (or number of documents) that indicates the path the project should follow.

Necessity of project control
If the project is going off the planned path, appropriate form of corrective action must be applied.
It is crucial for effective project control that performance is measured while there is still time to take corrective actions.
It is clear that at initial stages of the project the manager has a high level of influence on the project direction and the cost of changes at this stage of the project is relatively small.
And of course, the level of influence is reducing over the time and the cost of changes rises substantially.

Necessity of project control
Level of influence vs. cost of relevant changes in time
Conclusion: changes made at the beginning of a project are easier and cheaper, but it also implies that the feedback on the project’s status must be timely and accurate.

Project Control
The problem of over optimistic reporting
Real projects are large and complex and therefore the process of reporting moves from a subjective assessment to much more structured approach. And here the project manager should be aware of the over reporting trap.
If the progress is over reported and not corrected in the early stages of the project the problem will be much bigger in the final stages of the project when the reporting catches up with itself.
Moreover, there is no time to make appropriate corrections at the final stages of the project!

Project Control
The actual progress was lower than planned one from the very beginning of the project, but over optimistic reporting is clearly visible there.

Project Control
At later stages of the project it was impossible to equalize the reported and actual project and therefore there is almost no progress during last two periods of time.

Project Control
If the manager finds out that something is wrong at this stage of the project, it is too late to correct it and manager is helpless to bring the project in on time.

Project Control
The frequency of the reporting should reflect the needs of the project. Reporting cycle should allow the manager to have sufficient time to implement corrective actions in order to bring the project back on course.
Short reporting periods are useful when there is a high level of change and uncertainty in the project. On the other hand, if there is a little change we can allow longer reporting periods.
For example, during the critical stages of the project the reporting cycle may be reduced to daily or even hourly reports. Under normal conditions the reporting cycle could be weekly or even monthly.
Project Control
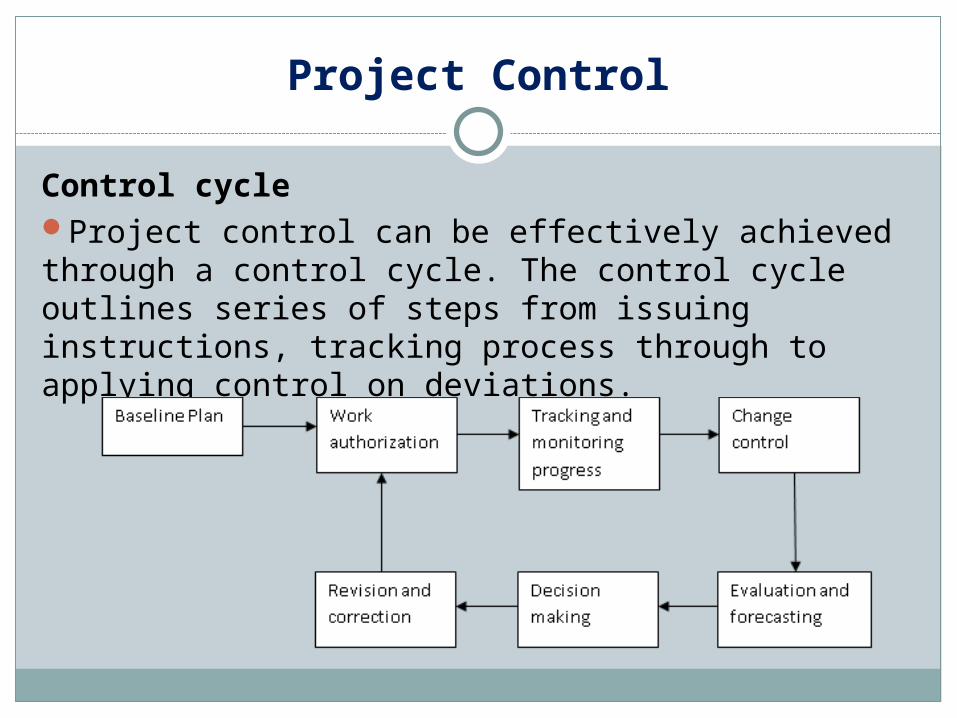
Control cycleProject control can be effectively achieved through a control cycle. The control cycle outlines series of steps from issuing instructions, tracking process through to applying control on deviations.

Project Control
Control cycle
The baseline plan – portfolio of documents that indicate how the project objectives will be achieved. These documents were produced during the planning phase of the project.Work authorization – communication and dissemination of information and instructions to the responsible parties.

Project Control
Control cycle
Tracking and monitoring progress – records the current status of the project.Change control – ensures that all changes to the scope of work are approved by the designated people before being incorporated in the baseline plan.

Project Control
Control cycle
Evaluation and forecasting – quantification of the project’s present position within the CPM model and extrapolation of current trends. What-if analysis could be also used here in order to simulate some areas of uncertainty or possible troubles.

Project Control
Control cycle
Decision making – when all pieces of information are gathered we should decide on an appropriate course of action.Revision and correction – based on the decision that was made within the previous step the corrective action should be incorporated and the baseline must be revised (there might be some interdependencies).

Project Control
Control cycleThe control cycle is now complete and the loop has been closed. The next iteration is conducted to coincide with reporting frequency.

Project Control
Barchart utilization
The original barchart shows the planned timing of activities.
As the project progresses some activities may not perform as planned and they may under-perform as well as over-perform which means that original barchart will not reflect the actual timing of the activities any more.
Therefore, the revised barchart is required to reflect the present situation and to highlight the points where control needs to be applied.

Project Control
There are several possible formats of revised barchart:1.Original bar with revised bar underneath.
2.Original open bar with progress measured along the same axis.
3.Progress is measured up to time-now and extrapolated.

Project Control
Let’s suppose the project (part of it) that is depicted below:

Project Control
We can use the barchart to control and monitor work progress:

Project Control
Assuming that it is the end of 15th day of our project (vertical line), we can see that:Activity A started and finished on time (as scheduled)
Activity B started with one day delay and finished one day later than expected
Activity C went without any problem (started on time, finished on time)

Project Control
Assuming that it is the end of 15th day of our project (vertical line), we can see that:Activity D started on time and the expectation is that it will finish one day earlier
Activity E started 3 days later and it is likely to finish 3 days later
It is going to postpone the start of activity F that has to wait for E to be completed

Project Control
Another useful tool is a progress trend barchart that enables managers to judge easily the direction and trend of particular activities at a glance.

Project Control
There are many ways how to utilize the outputs of CPM in project management and its control.
It looks very easy and straightforward to employ them.
Despite of various useful and easy to use control techniques, the reality is full of difficulties, obstacles, surprises and quite often things get simply out of control.
Case study: Denver International Airport

Denver International Airport1
How to convert a $1.2 billion project into $5.0 billion project? It is easy. Just build a new airport in Denver.
The decision to replace Denver’s Stapleton Airport with Denver International Airport (DIA) was made by well-intentioned city officials.
The city of Denver would need a new airport eventually, and it seemed like right time to bild an airport that would satisfy Denver’s needs for at least 50-60 years. DIA could become the benchmark for other airports to follow.
[1] Kerzner, H.: Project Management (6th Edition). John Wiley & Sons, New York, 1998.

Denver International Airport
A summary of critical events:
1985 – The decision to build DIA is made by city Mayor and County officials. Project estimate $1.2 billion.
1986 – Feasibility study shows that as many as 50% of passengers would change planes at DIA. The airport has to handle it smoothly.
May, 1989 – Denver voters pass an airport referendum. Project estimate $1.7 billion.
March, 1993 – The first delay was announced and the opening day was postponed from October, 1993 to December, 1993. Project estimate $2.7 billion.

Denver International Airport
A summary of critical events:
October, 1993 – Opening day is to be delayed to March, 1994. The problems were the fire and security systems in addition to the inoperable baggage handling system. Project estimate $3.1 billion.
December, 1993 – The airport is ready to open, but without an operational baggage handling system. Another delay is announced.
February, 1994 – Opening day is to be delayed to May 15, 1994 because of baggage handling system.
May, 1994 – Airport misses the fourth deadline.

Denver International Airport
A summary of critical events:
August, 1994 – DIA finances a backup baggage handling system. Opening day is delayed indefinitely. Project estimate $4.0 billion plus.
December, 1994 – Denver announces that DIA was built on top of an old Native-American burial ground. An agreement is reached to lift the curse.
February, 1995 – The airport has been finally opened. However, several problems were still apparent (baggage handling system, problems with concourse trains, problems with cars rental – the nearest petrol station is 15 miles away etc).

Denver International Airport
There are many jokes about DIA:When you fly to Denver make a stop in Chicago to pick up your luggage.
Delay In Action, Delayed Indefinitely Again, Denver’s Imaginary Airport,
Do It Again, Delighted If Activated, Definitely Incapable of Activation,
Disaster In America, Deserted Inactive Airport, Dollars In Abyss, …
Summary: Project management is easy in theory but we have to fight hard when managing real project!