cpoe reducing i nappropriate transfusions (crit) collaborative
DESCRIPTION
CPOE Reducing I nappropriate Transfusions (CRIT) Collaborative. - PowerPoint PPT PresentationTRANSCRIPT

CPOE Reducing Inappropriate Transfusions (CRIT) Collaborative
“The most cost effective opportunity to improve patient outcomes in the next quarter century will likely come, not from discovering new therapies but from discovering how to effectively deliver
therapies that are known to be effective”Sean Berenholtz 2003
Collaborative Goals
• Provide a venue for for multiple institutions to share experiences and projects surrounding blood utilization.
• Test the hypothesis that CPOE tethered to CDS can improve and hasten the adoption of evidence based guidelines across multiple institutions.
• Set the framework for future collaborations using effective decision support tools.
Introduction of Collaborative Participants
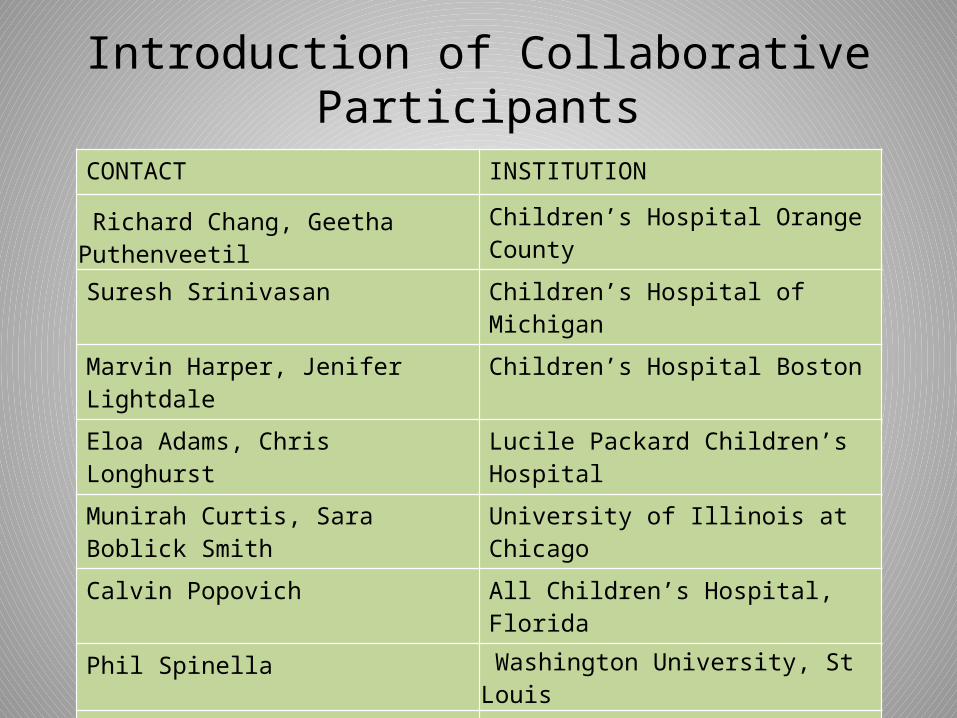
CONTACT INSTITUTION
Richard Chang, Geetha PuthenveetilChildren’s Hospital Orange County
Suresh Srinivasan Children’s Hospital of Michigan
Marvin Harper, Jenifer Lightdale Children’s Hospital Boston
Eloa Adams, Chris Longhurst Lucile Packard Children’s Hospital
Munirah Curtis, Sara Boblick Smith University of Illinois at Chicago
Calvin Popovich All Children’s Hospital, Florida
Phil Spinella Washington University, St Louis
Rod Tarrago, Judy Zeir Children’s Hospital Minnesota
David Rich Nationwide Children’s Hospital
David Kaelber Metrohealth, Case Western
Marissa Tucci CHU Sainte-Justine Research Center
Introduction of Collaborative Participants
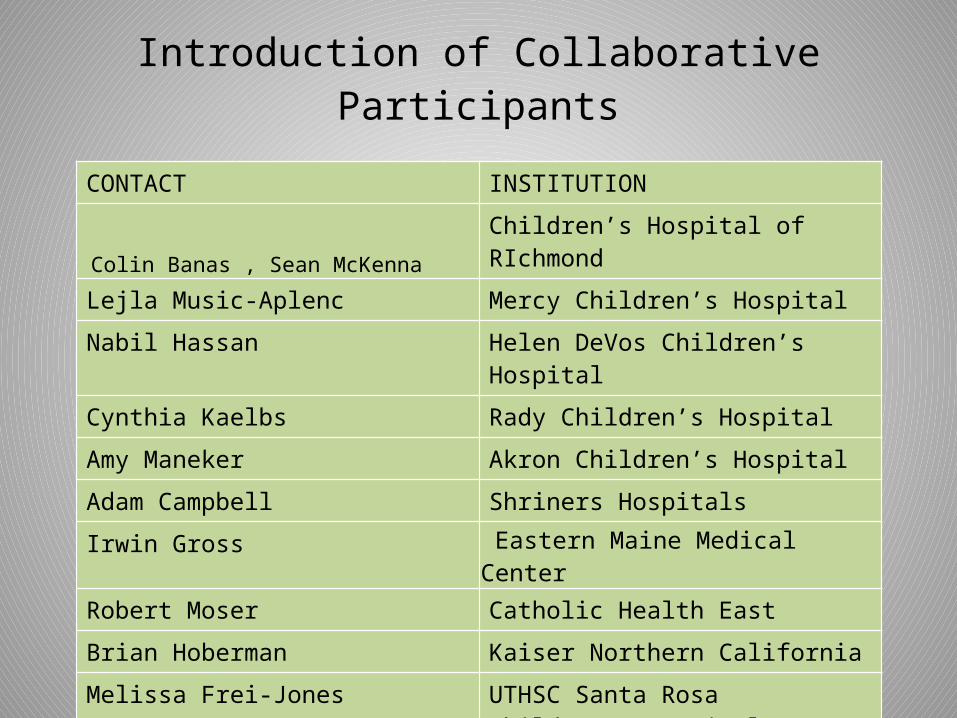
CONTACT INSTITUTION
Colin Banas , Sean McKenna Children’s Hospital of RIchmond
Lejla Music-Aplenc Mercy Children’s Hospital
Nabil Hassan Helen DeVos Children’s Hospital
Cynthia Kaelbs Rady Children’s Hospital
Amy Maneker Akron Children’s Hospital
Adam Campbell Shriners Hospitals
Irwin Gross Eastern Maine Medical Center
Robert Moser Catholic Health East
Brian Hoberman Kaiser Northern California
Melissa Frei-Jones UTHSC Santa Rosa Children’s Hospital
Meeting Agenda
• Introductions.• Group Email.
• Discuss institutional progress on the CRIT project, and gathering baseline data.

Evidence based algorithm
Adams Pediatrics 2011
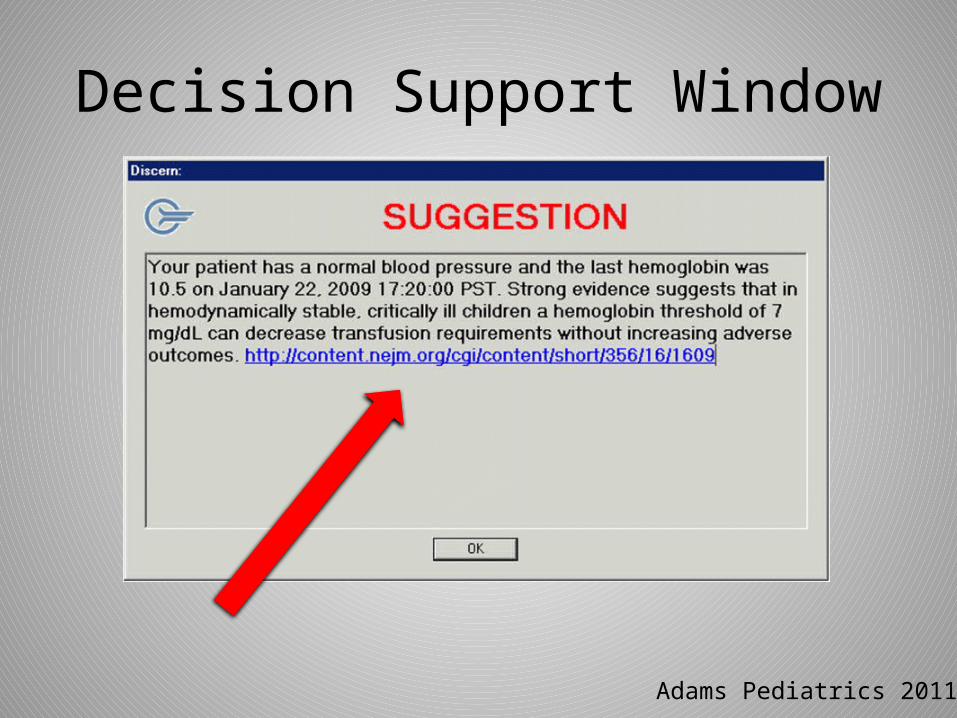
Decision Support Window
Adams Pediatrics 2011
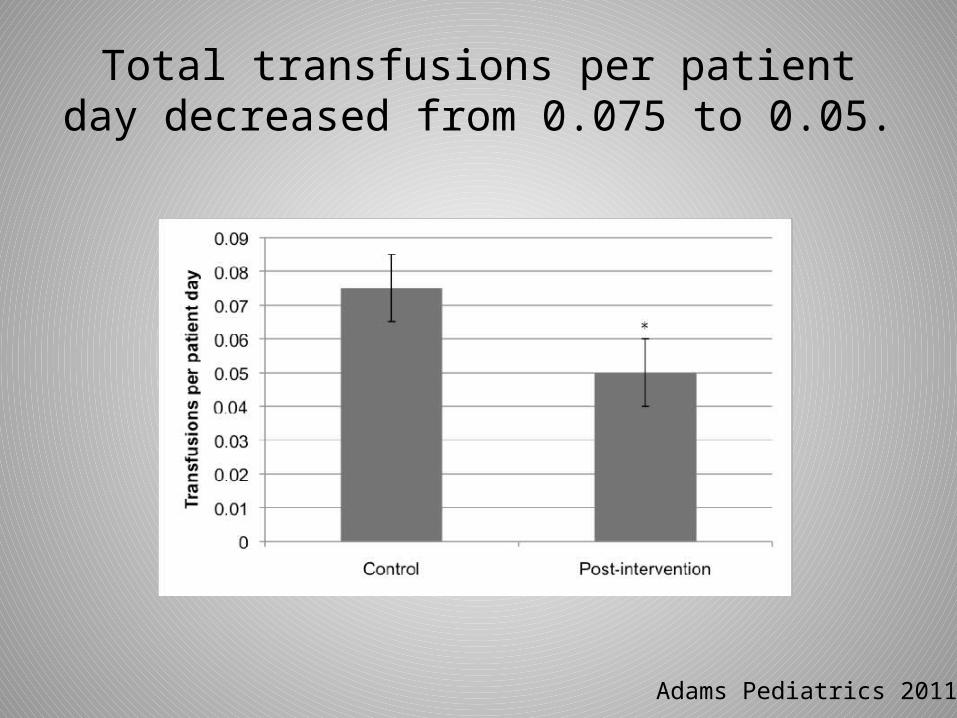
Total transfusions per patient day decreased from 0.075 to 0.05.
Adams Pediatrics 2011
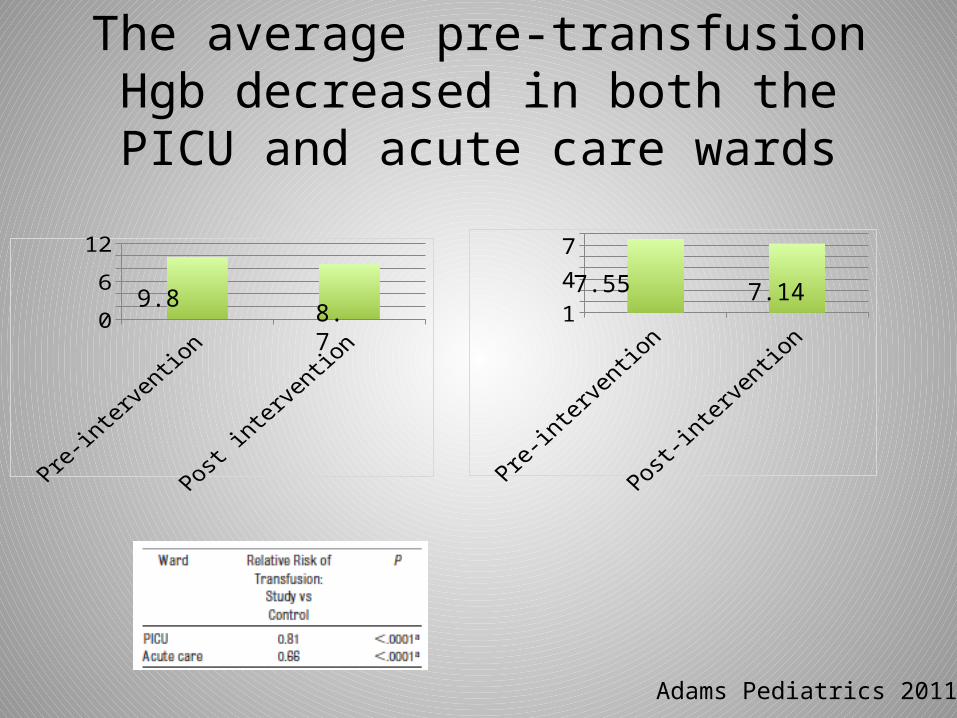
The average pre-transfusion Hgb decreased in both the PICU and acute care
wards
Pre-interve
ntion
Post-interve
ntion1357
Pre-intervention Post intervention02468
1012
9.88.7
7.55 7.14
Adams Pediatrics 2011
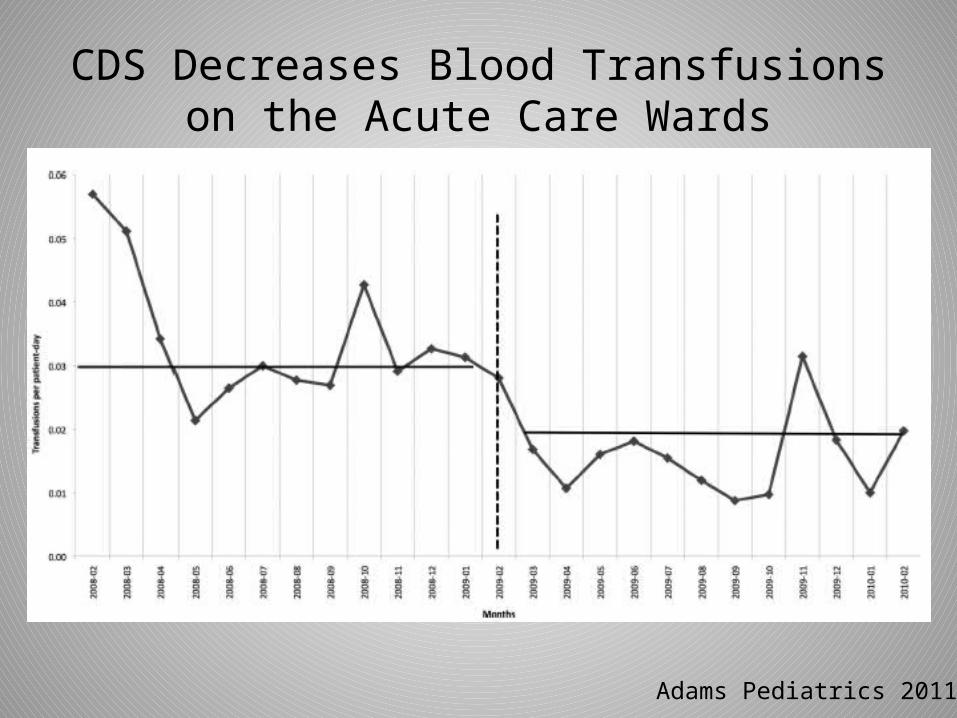
CDS Decreases Blood Transfusions on the Acute Care Wards
Adams Pediatrics 2011
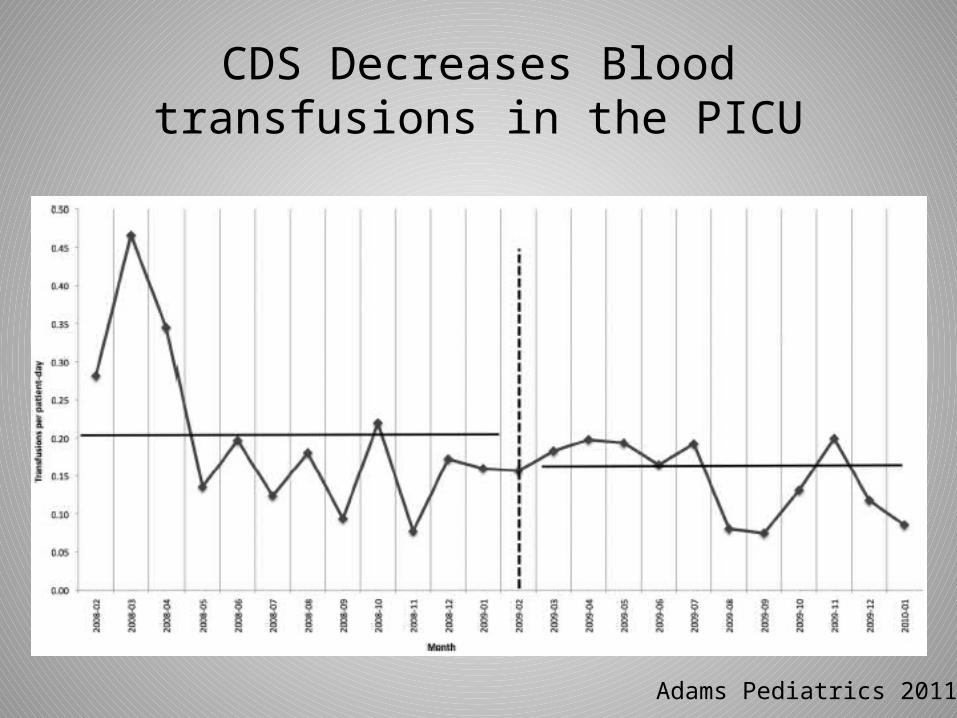
CDS Decreases Blood transfusions in the PICU
Adams Pediatrics 2011
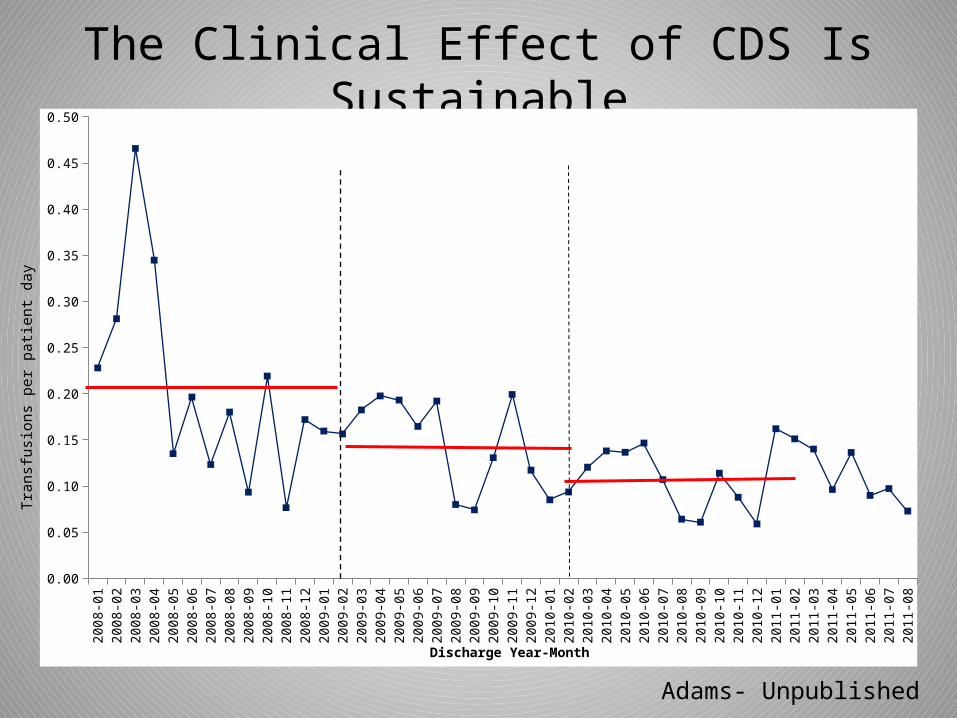
The Clinical Effect of CDS Is Sustainable20
08-0
1
2008
-02
2008
-03
2008
-04
2008
-05
2008
-06
2008
-07
2008
-08
2008
-09
2008
-10
2008
-11
2008
-12
2009
-01
2009
-02
2009
-03
2009
-04
2009
-05
2009
-06
2009
-07
2009
-08
2009
-09
2009
-10
2009
-11
2009
-12
2010
-01
2010
-02
2010
-03
2010
-04
2010
-05
2010
-06
2010
-07
2010
-08
2010
-09
2010
-10
2010
-11
2010
-12
2011
-01
2011
-02
2011
-03
2011
-04
2011
-05
2011
-06
2011
-07
2011
-08
0.00
0.05
0.10
0.15
0.20
0.25
0.30
0.35
0.40
0.45
0.50
Discharge Year-Month
Tran
sfus
ions
per
pati
ent d
ay
Adams- Unpublished
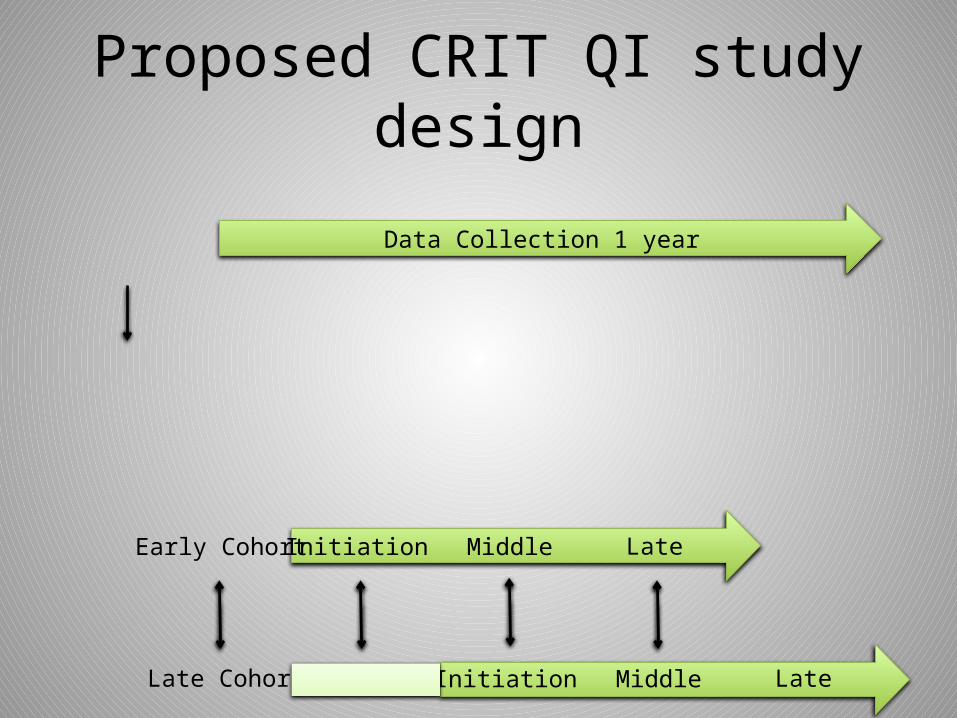
Data Collection 1 year
Proposed CRIT QI study design
Initiation Middle Late
Initiation Middle Late
Early Cohort
Late Cohort
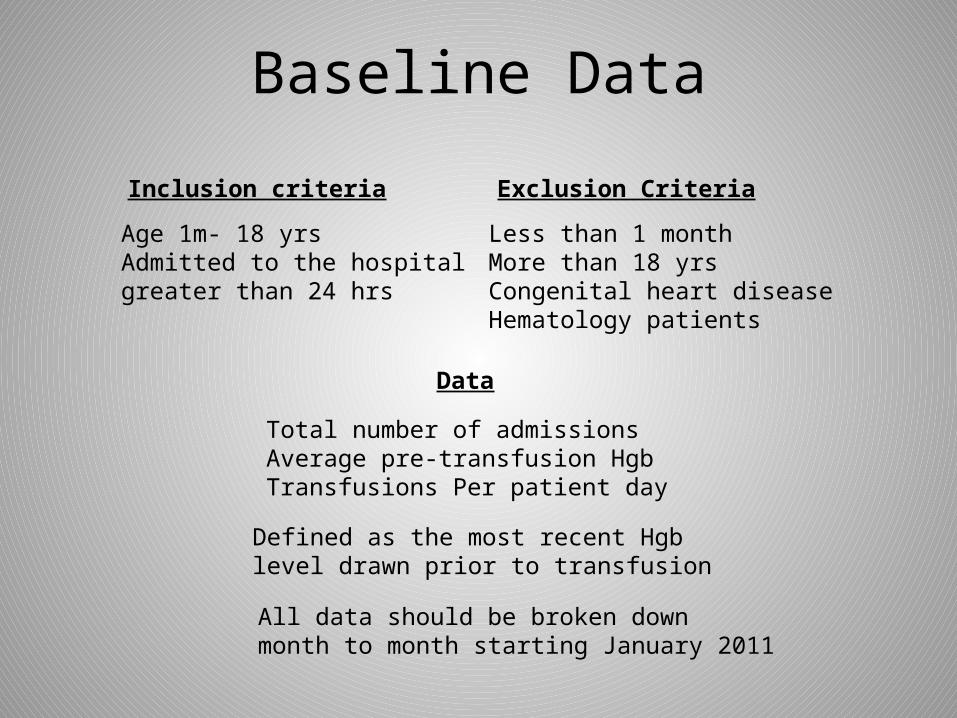
Baseline Data
Inclusion criteria
Age 1m- 18 yrsAdmitted to the hospitalgreater than 24 hrs
Exclusion Criteria
Less than 1 monthMore than 18 yrsCongenital heart diseaseHematology patients
Data
Total number of admissionsAverage pre-transfusion HgbTransfusions Per patient day
Defined as the most recent Hgblevel drawn prior to transfusion
All data should be broken down month to month starting January 2011
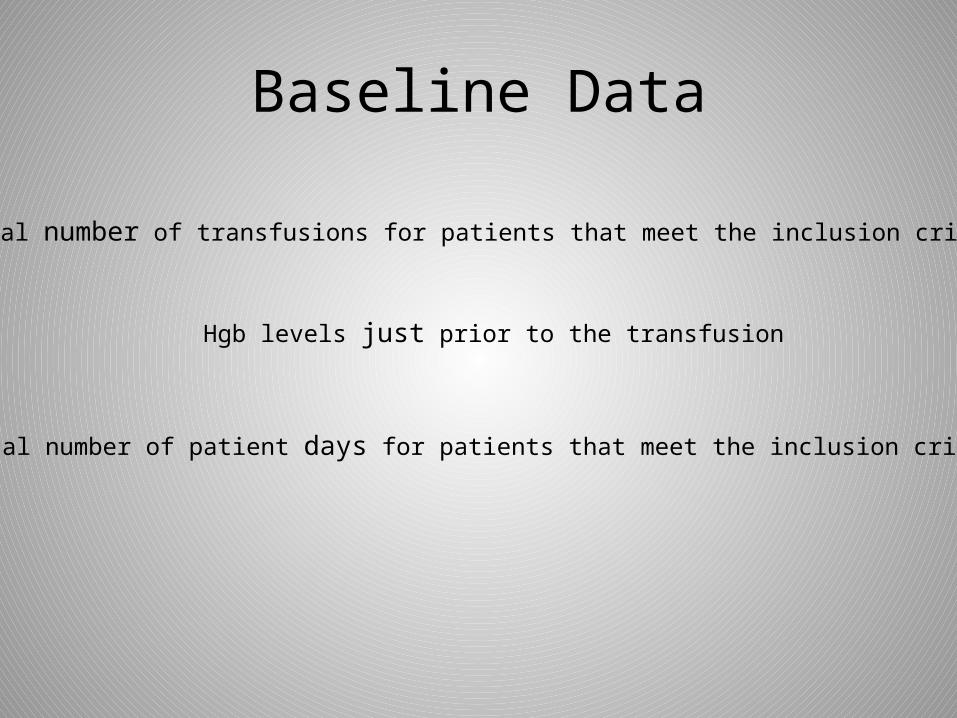
Baseline Data
Total number of transfusions for patients that meet the inclusion criteria
Hgb levels just prior to the transfusion
Total number of patient days for patients that meet the inclusion criteria
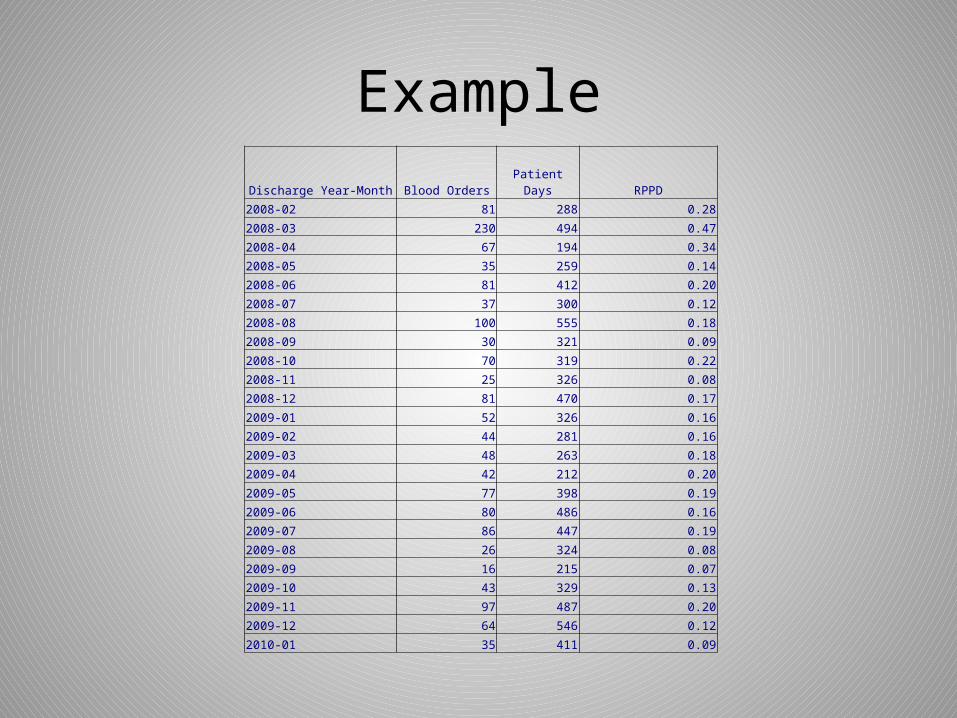
ExampleDischarge Year-Month Blood Orders Patient Days RPPD
2008-02 81 288 0.28
2008-03 230 494 0.47
2008-04 67 194 0.34
2008-05 35 259 0.14
2008-06 81 412 0.20
2008-07 37 300 0.12
2008-08 100 555 0.18
2008-09 30 321 0.09
2008-10 70 319 0.22
2008-11 25 326 0.08
2008-12 81 470 0.17
2009-01 52 326 0.16
2009-02 44 281 0.16
2009-03 48 263 0.18
2009-04 42 212 0.20
2009-05 77 398 0.19
2009-06 80 486 0.16
2009-07 86 447 0.19
2009-08 26 324 0.08
2009-09 16 215 0.07
2009-10 43 329 0.13
2009-11 97 487 0.20
2009-12 64 546 0.12
2010-01 35 411 0.09
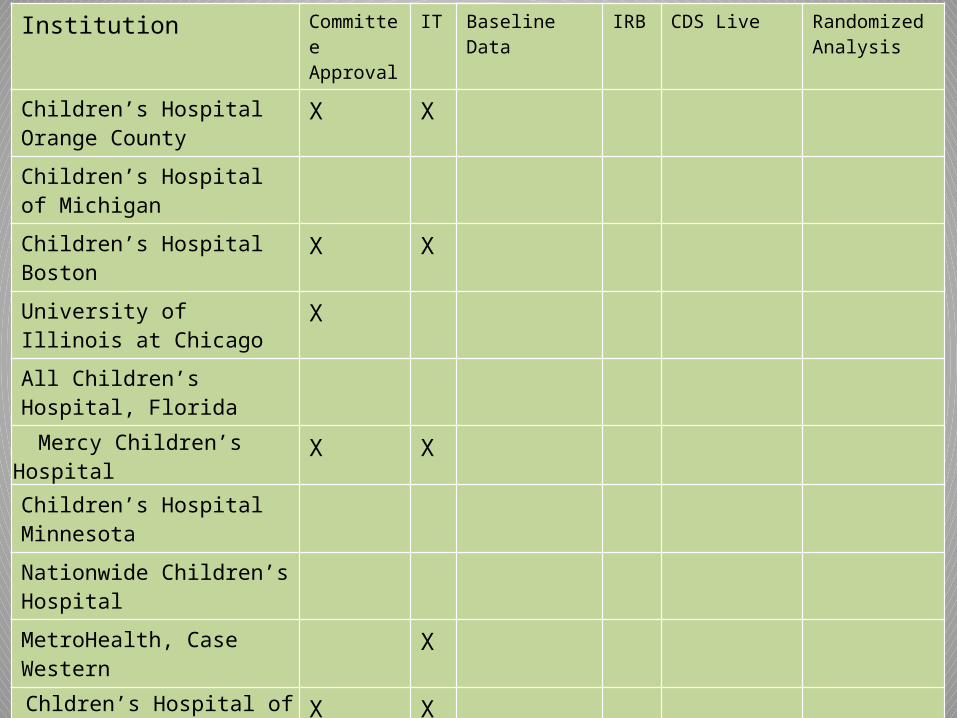
Institution CommitteeApproval
IT Baseline Data
IRB CDS Live RandomizedAnalysis
Children’s Hospital Orange County
X X
Children’s Hospital of Michigan
Children’s Hospital Boston X XUniversity of Illinois at Chicago XAll Children’s Hospital, Florida
Mercy Children’s Hospital X XChildren’s Hospital Minnesota
Nationwide Children’s Hospital
MetroHealth, Case Western X
Chldren’s Hospital of Richmond X X
Rady Children’s Hospital
Helen DeVos Children’s Hospital
Akron Children’s Hospital
Eastern Maine Medical Center X
Shriners Hospitals UTHSC Santa Rosa Children’s Hospital
X

Next meeting
Monday Tuesday May 29th 9:00 AM
Spread the word!