cpa australia asia -pacific small business survey 2020-
TRANSCRIPT
CPA AUSTRALIA ASIA -PACIFIC SMALL BUSINESS SURVEY 2020-2021 CPA AUSTRALIA’S 12TH ANNUAL REPORT ON SMALL BUSINESS ISSUES AND SENTIMENT ACROSS ELEVEN ECONOMIES IN THE ASIA-PACIFIC

2 | CPA AUSTRALIA ASIA-PACIFIC SMALL BUSINESS SURVEY 2020-21
ISBN: 978-0-6487514-0-3 Legal Notice © 2021 CPA Australia Ltd (ABN 64 008 392 452). All rights reserved. The reproduction, adaptation, display, communication or sale of this CPA Australia Asia-Pacific Small Business Survey 2020-21 (‘the Materials’) is strictly prohibited unless expressly permitted under Division 3 of the Copyright Act 1968 (Cth). For permission to reproduce any part of the Materials, please contact the CPA Australia Legal Business Unit – [email protected]. These Materials have been created for academic purposes only and are not intended to constitute legal or professional advice. CPA Australia does not warrant or make representations as to the accuracy, completeness, suitability or fitness for purpose of the Materials and accepts no liability or responsibility for any acts or omissions made in reliance of the Materials. Where any law prohibits the exclusion of such liability, CPA Australia limits its liability to the resupply of the information.
3 | CPA AUSTRALIA ASIA-PACIFIC SMALL BUSINESS SURVEY 2020-21
CONTENTS CONTENTS ............................................................................................................................................. 3
OVERVIEW ............................................................................................................................................ 5
EXECUTIVE SUMMARY ........................................................................................................................... 6
MAJOR FINDINGS ................................................................................................................................ 10
MAJOR FINDING 1 – 2020 WAS A TOUGH YEAR FOR MANY SMALL BUSINESSES ................................... 10
MAJOR FINDING 2 – MANY SMALL BUSINESSES ARE EXPECTING TO REBOUND IN 2021 ........................ 13
MAJOR FINDING 3 – DRIVERS OF SMALL BUSINESS GROWTH ............................................................... 15
MAJOR FINDING 4 – THERE ARE LARGE DIFFERENCES BETWEEN SMALL BUSINESSES IN ASIA, AND AUSTRALIA AND NEW ZEALAND .......................................................................................................... 18
MAJOR FINDING 5 – SMALL BUSINESSES WITH YOUNGER RESPONDENTS ARE MUCH MORE LIKELY TO BE GROWING ........................................................................................................................................... 20
SURVEY RESULTS ................................................................................................................................. 22
WHAT DO HIGH-GROWTH SMALL BUSINESSES DO DIFFERENTLY? ........................................................ 22
SEVEN LESSONS FROM HIGH-GROWTH SMALL BUSINESSES ................................................................. 27
COVID-19 IMPACT ON SMALL BUSINESS ............................................................................................... 28
SMALL BUSINESS AND TECHNOLOGY ................................................................................................... 37
The impact of technology on small business profitability ..................................................................... 37
Social media ........................................................................................................................................ 39
Selling online ....................................................................................................................................... 41
New payment technologies ................................................................................................................. 44
Cybersecurity ...................................................................................................................................... 46
SMALL BUSINESS CONDITIONS IN 2020 ................................................................................................ 48
SMALL BUSINESS AND INNOVATION .................................................................................................... 57
SMALL BUSINESS EXPECTATIONS FOR 2021 .......................................................................................... 60
ACCESS TO FINANCE ............................................................................................................................ 68
SOURCES OF ADVICE ............................................................................................................................ 78
MARKET SUMMARIES .......................................................................................................................... 81
Australia market summary .................................................................................................................. 81
Mainland China market summary ........................................................................................................ 87
Hong Kong market summary ............................................................................................................... 95
India market summary ...................................................................................................................... 100
Indonesia market summary ............................................................................................................... 108
Malaysia market summary ................................................................................................................ 113

4 | CPA AUSTRALIA ASIA-PACIFIC SMALL BUSINESS SURVEY 2020-21
New Zealand market summary .......................................................................................................... 118
Philippines market summary ............................................................................................................. 124
Singapore market summary ............................................................................................................... 129
Taiwan market summary ................................................................................................................... 134
Vietnam market summary ................................................................................................................. 139
ABOUT THE SURVEY .......................................................................................................................... 144

5 | CPA AUSTRALIA ASIA-PACIFIC SMALL BUSINESS SURVEY 2020-21
OVERVIEW CPA Australia Asia-Pacific Small Business Survey is the 12th in a series of annual surveys conducted by CPA Australia. This edition of the survey measures: • small business conditions in 2020 • small business confidence in 2021 • the impact of COVID-19 on small business • the drivers of small business growth • technology uptake • innovation • access to finance.
The data presented in this report is compared across the 11 markets included in the survey and over time. In total, 4227 small businesses completed the survey, including: • 507 from Australia • 779 from Mainland China^ • 306 from Hong Kong^ • 512 from India • 301 from Indonesia • 302 from Malaysia • 300 from New Zealand • 300 from the Philippines • 307 from Singapore • 303 from Taiwan^ • 310 from Vietnam.
^ For this survey, the results for Mainland China exclude Hong Kong and Taiwan, which are shown separately. The online survey was conducted with a random sample of small business owners/managers from 9 November 2020 to 10 December 2020. The sample was obtained through panel providers. To qualify for the survey, participants were required to be an owner, a senior manager (defined as a Director, Principal, CEO, Managing Director, CFO or a Senior Manager) or a qualified accountant of a business with less than 20 employees. Care was taken to ensure that the survey sample for each market broadly represents the industry profile for that market.

6 | CPA AUSTRALIA ASIA-PACIFIC SMALL BUSINESS SURVEY 2020-21
EXECUTIVE SUMMARY 2020 was a tough year for small business due to the pandemic CPA Australia’s 12th annual Asia-Pacific Small Business Survey1 found that while 2020 was a tough year for many of the region’s small businesses, there are signs of confidence returning in 2021. A survey record low of 46.2 per cent of small businesses grew during 2020, down from 65.8 per cent in 2019. Further reflecting the challenging environment, 31.3 per cent of businesses shrank last year, more than double the 14.5 per cent that shrank in 2019. Unsurprisingly, the major cause of this difficult environment was COVID-19. 57.1 per cent of businesses experienced a major negative impact as a result of the pandemic last year. The next most common barrier to growth was a ‘poor overall economic environment’, at 26.1 per cent. The poor growth results for last year are reflected in higher job losses in the sector. 14.7 per cent of small businesses reduced employee numbers in 2020, compared with 6.7 per cent in 2019. The job losses were however lower than expected. This is because many governments in the region introduced wage subsidy schemes, like Australia’s JobKeeper, Singapore Jobs Support Scheme and Hong Kong’s Employment Support Scheme. 2020 saw every market surveyed register their lowest recorded percentage of small businesses that grew. Hong Kong and Australian small businesses were again the least likely to grow, taking out the bottom two positions for the last three years. At the other end of the scale, small businesses in India, Vietnam, Philippines and Indonesia were the most likely to grow in 2020. Last year’s challenging business conditions are further illustrated by the percentage of small businesses that required external funds for survival. 41.0 per cent needed external finance for survival, up from 27.5 per cent in 2019. This result is the highest on record for this survey. On a positive note, it appears the pandemic has led to an increase in technology adoption and digitalisation by small businesses. In 2020, 57.9 per cent of businesses received more than 10 per cent of revenue from online sales, up from 51.0 per cent in 2019. Small business confidence returning in 2021 The survey shows small business confidence beginning to return. 60.8 per cent expect to grow this year, which is noticeably higher than the 46.2 per cent that grew last year. This growing optimism is flowing through to expected job creation by small businesses. 36.1 per cent of the region’s small businesses expect to add employees this year. However, for most businesses it won’t be an immediate return to their post COVID-19 level. Only 14.5 per cent have already returned to their pre-pandemic levels, while 58.4 per cent expect to return to their pre-pandemic levels over the next two years. Optimism is most apparent in India, where a significant 86.7 per cent of small businesses expect to grow this year, up solidly from 2020. This includes 54.7 per cent of businesses that believe they will grow strongly in 2021. Hong Kong’s small businesses remain the least optimistic, where only 21.2 per cent expect to grow and 49.0 per cent expect to shrink or shut down this year.
1 The survey was of 4227 businesses with less than 20 employees from Australia, Mainland China, Hong Kong, India, Indonesia, Malaysia, New Zealand, the Philippines, Singapore, Taiwan and Vietnam. For the purpose of this survey, the results for Hong Kong and Taiwan are shown separately from Mainland China. The survey was conducted online from 9 November to 10 December 2020.
7 | CPA AUSTRALIA ASIA-PACIFIC SMALL BUSINESS SURVEY 2020-21
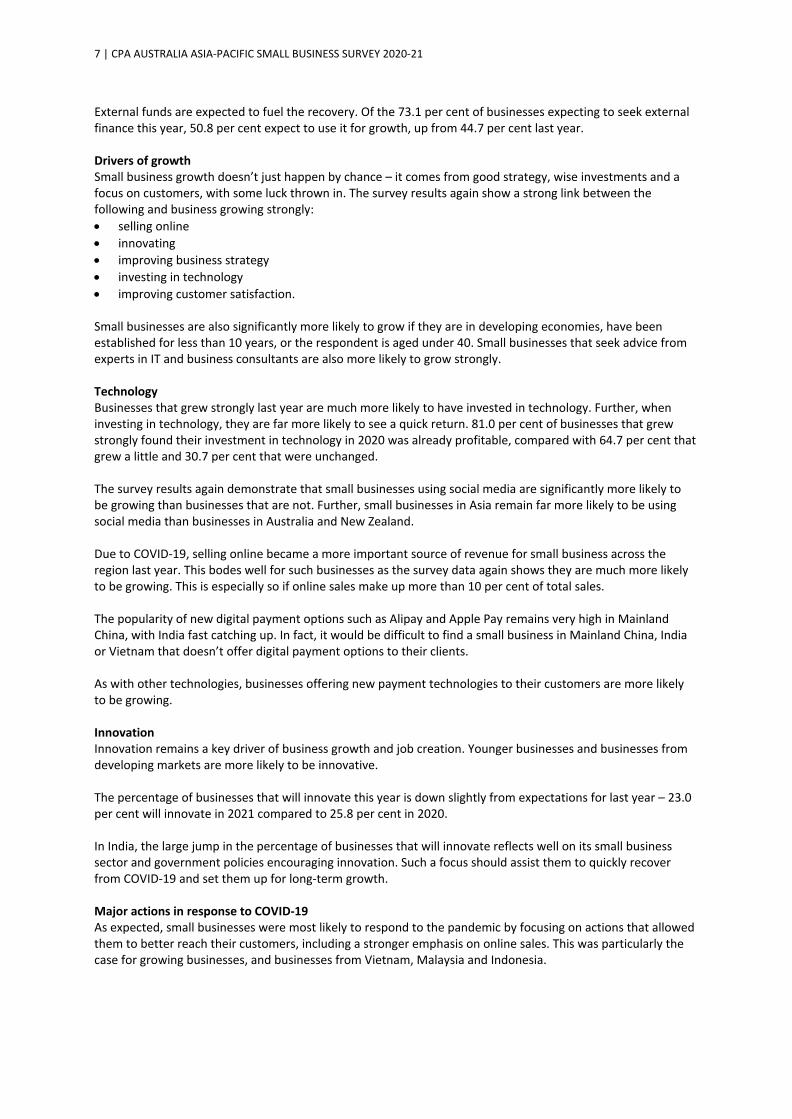
External funds are expected to fuel the recovery. Of the 73.1 per cent of businesses expecting to seek external finance this year, 50.8 per cent expect to use it for growth, up from 44.7 per cent last year. Drivers of growth Small business growth doesn’t just happen by chance – it comes from good strategy, wise investments and a focus on customers, with some luck thrown in. The survey results again show a strong link between the following and business growing strongly: • selling online • innovating • improving business strategy • investing in technology • improving customer satisfaction. Small businesses are also significantly more likely to grow if they are in developing economies, have been established for less than 10 years, or the respondent is aged under 40. Small businesses that seek advice from experts in IT and business consultants are also more likely to grow strongly. Technology Businesses that grew strongly last year are much more likely to have invested in technology. Further, when investing in technology, they are far more likely to see a quick return. 81.0 per cent of businesses that grew strongly found their investment in technology in 2020 was already profitable, compared with 64.7 per cent that grew a little and 30.7 per cent that were unchanged. The survey results again demonstrate that small businesses using social media are significantly more likely to be growing than businesses that are not. Further, small businesses in Asia remain far more likely to be using social media than businesses in Australia and New Zealand. Due to COVID-19, selling online became a more important source of revenue for small business across the region last year. This bodes well for such businesses as the survey data again shows they are much more likely to be growing. This is especially so if online sales make up more than 10 per cent of total sales. The popularity of new digital payment options such as Alipay and Apple Pay remains very high in Mainland China, with India fast catching up. In fact, it would be difficult to find a small business in Mainland China, India or Vietnam that doesn’t offer digital payment options to their clients. As with other technologies, businesses offering new payment technologies to their customers are more likely to be growing. Innovation Innovation remains a key driver of business growth and job creation. Younger businesses and businesses from developing markets are more likely to be innovative. The percentage of businesses that will innovate this year is down slightly from expectations for last year – 23.0 per cent will innovate in 2021 compared to 25.8 per cent in 2020. In India, the large jump in the percentage of businesses that will innovate reflects well on its small business sector and government policies encouraging innovation. Such a focus should assist them to quickly recover from COVID-19 and set them up for long-term growth. Major actions in response to COVID-19 As expected, small businesses were most likely to respond to the pandemic by focusing on actions that allowed them to better reach their customers, including a stronger emphasis on online sales. This was particularly the case for growing businesses, and businesses from Vietnam, Malaysia and Indonesia.

8 | CPA AUSTRALIA ASIA-PACIFIC SMALL BUSINESS SURVEY 2020-21
The crisis also prompted a reduction in capital expenditure, although not necessarily in technology. Many businesses had to make unplanned investments in technology to reach customers and support working from home. Many businesses also turned to government for support as a result of the pandemic. Such support was essential for the continued operation of many small businesses across the region. It appears government support helped maintain cash flow at a workable level for many businesses as the percentage that cut costs and employee numbers was lower than expected given the extent of the crisis. Access to finance During a difficult 2020, the number of businesses that required external finance increased. 57.6 per cent of small businesses required external finance last year, up from 52.2 per cent in 2019. This was the highest percentage of businesses requiring external finance since 2017. Funding business survival was an important reason for this increase in demand. Despite the challenges, businesses found it slightly easier to access finance last year than in 2019. This is attributed to greater government intervention, including loan guarantees, which encouraged banks to lend to the sector, plus grants and other government support. Reflecting the increasing role of government during the pandemic, the importance of government grants as the main source of external finance jumped. This was particularly so for New Zealand, where 51.5 per cent nominated grants as their major source of finance last year, up from 7.0 per cent in 2019. Not surprisingly, the high growth markets of Vietnam, Mainland China, Indonesia and India are the most likely to expect to access external funds this year. Growth is the most popular reason for expecting to seek that finance, however business survival remains important, except in Vietnam. Sources of advice Among businesses that sought advice last year, family and friends was the most popular source of that advice. Businesses that reported growing strongly in 2020 were significantly more likely to have sought advice from external experts – including business / management consultants, IT consultants and business or industry association – than businesses that didn’t grow. Many businesses that didn’t seek advice struggled to grow. 25.1 per cent of businesses that didn’t grow failed to seek external advice, compared with 8.3 per cent that did grow. In addition, only 6.5 per cent of businesses that didn’t seek advice increased their employee numbers last year, well below the survey average of 24.8 per cent. While governments became an increasingly important source of finance last year, only a small percentage (12.1 per cent) of businesses turned to them for advice. Businesses were more likely to turn to all other potential sources of advice, except for lawyers. Influence of age on small business performance Respondents aged under 40 are significantly more likely to state their business is: • growing • creating jobs • focusing on key drivers of business growth, including innovation • leveraging technology. For example, older respondents were more likely to have not invested in technology last year. 36.5 per cent of respondents aged 50 and over didn’t invest in technology, compared with 11.6 per cent of respondents under 40. When younger respondents do invest in technology, they are much more likely to make investments with a quicker return.
9 | CPA AUSTRALIA ASIA-PACIFIC SMALL BUSINESS SURVEY 2020-21
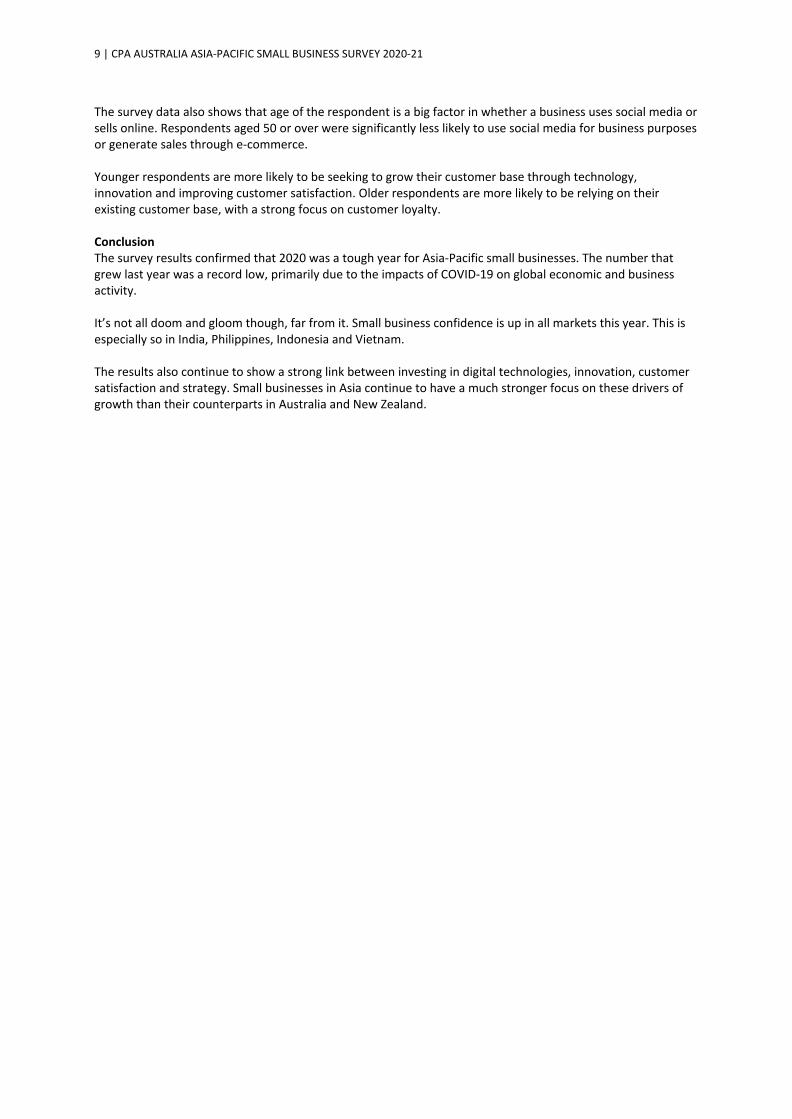
The survey data also shows that age of the respondent is a big factor in whether a business uses social media or sells online. Respondents aged 50 or over were significantly less likely to use social media for business purposes or generate sales through e-commerce. Younger respondents are more likely to be seeking to grow their customer base through technology, innovation and improving customer satisfaction. Older respondents are more likely to be relying on their existing customer base, with a strong focus on customer loyalty. Conclusion The survey results confirmed that 2020 was a tough year for Asia-Pacific small businesses. The number that grew last year was a record low, primarily due to the impacts of COVID-19 on global economic and business activity. It’s not all doom and gloom though, far from it. Small business confidence is up in all markets this year. This is especially so in India, Philippines, Indonesia and Vietnam. The results also continue to show a strong link between investing in digital technologies, innovation, customer satisfaction and strategy. Small businesses in Asia continue to have a much stronger focus on these drivers of growth than their counterparts in Australia and New Zealand.
10 | CPA AUSTRALIA ASIA-PACIFIC SMALL BUSINESS SURVEY 2020-21
MAJOR FINDINGS MAJOR FINDING 1 – 2020 WAS A TOUGH YEAR FOR MANY SMALL BUSINESSES The percentage of small businesses that grew in 2020 was significantly lower than 2019 2020 was a difficult year for the region’s small businesses. This was due primarily to the impacts COVID-19 had on global economic and business activity. A survey record low of 46.2 per cent of small businesses grew in 2020, down from 65.8 per cent in 2019. Further reflecting the challenging environment, 31.3 per cent of businesses shrank in 2020, more than double the 14.5 per cent that shrank in 2019. Every market surveyed registered their lowest recorded percentage of small businesses that grew. The percentage of businesses that grew in 2020 compared with 2019 fell the most in Vietnam, Indonesia and Mainland China. Although, this is due to a relatively high comparison base in 2019 when most small businesses in those markets grew. Hong Kong and Australian small businesses were again the least likely to grow. This reflects prolonged underperformance, which was exacerbated by COVID-19. These markets have taken out the bottom two positions for the past three years. Small businesses in India, Vietnam, Philippines and Indonesia were the most likely to grow in 2020. However, all four markets registered a significant increase of small businesses that shrank compared to 2019. The weaker results are largely mirrored in higher job losses by the sector last year. 14.7 per cent of small businesses reduced employee numbers in 2020, compared with 6.7 per cent in 2019. For employees of Hong Kong small businesses, 2020 was a particularly challenging year as small businesses in that market were the most likely to cut their headcount. These results are, however, better than what could have been if many governments hadn’t introduced wage subsidy schemes last year, such as JobKeeper in Australia. Last year’s challenging business conditions are further illustrated by the percentage of businesses that required external funds for survival. In 2020, 41.0 per cent of small businesses needed external finance for survival, up from 27.5 per cent in 2019. This result is also the highest on record for this survey. On the flipside, 44.7 per cent businesses required funds for growth, down from 54.0 per cent in 2019. All markets identified COVID-19 as their biggest challenge in 2020. This was especially the case in Vietnam, despite the success this nation had in managing the pandemic last year. A possible explanation is that COVID-19 had a harder impact on businesses in economies with a higher reliance on international trade, such as Vietnam. On a positive note, it appears the pandemic has led to an increase in technology adoption and digitalisation by small businesses. In 2020, 57.9 per cent of businesses received more than 10 per cent of revenue from online sales, up from 51.0 per cent in 2019. The year-on-year percentage point increase is the largest on record. In addition, the percentage of small businesses that received more than 10 per cent of sales through digital / online / mobile payment options increased from 60.1 per cent in 2019 to 64.2 per cent.

11 | CPA AUSTRALIA ASIA-PACIFIC SMALL BUSINESS SURVEY 2020-21
These are positive trends as the survey results continue to show that businesses earning revenue from online sales are more likely to grow than businesses that don’t. Such an increase in digitalisation should hasten the recovery of those businesses. Small businesses that grew in the previous 12 months – a comparison over time and by market
Small businesses that grew compared with shrank in 2020 – by market
Survey average
10%
20%
30%
40%
50%
60%
70%
80%
90%
100%
2014 2015 2016 2017 2018 2019 2020
Average Malaysia Australia Mainland China
Hong Kong India Indonesia New Zealand
Philippines Singapore Taiwan Vietnam
-60%
-40%
-20%
0%
20%
40%
60%
80%
Surveyaverage
Australia MainlandChina
Hong Kong India Indonesia Malaysia NewZealand
Philippines Singapore Taiwan Vietnam
Shrank a little Shrank a lot Grew a little Grew strongly

12 | CPA AUSTRALIA ASIA-PACIFIC SMALL BUSINESS SURVEY 2020-21
COVID-19 had a major negative on my business in 2020 – by market
57.1%
81.3%
68.1%
66.9%
60.0%
58.3%
57.8%
54.7%
52.6%
50.0%
49.6%
44.9%
Survey average
Vietnam
Indonesia
Malaysia
New Zealand
Philippines
Australia
Singapore
Hong Kong
India
Mainland China
Taiwan

13 | CPA AUSTRALIA ASIA-PACIFIC SMALL BUSINESS SURVEY 2020-21
MAJOR FINDING 2 – MANY SMALL BUSINESSES ARE EXPECTING TO REBOUND IN 2021 Following a difficult 2020, small businesses in the Asia-Pacific region are expecting to rebound in 2021 The survey findings show small business confidence picking up in 2021 across all surveyed markets. These green shoots of optimism are however somewhat dependent on the effective rollout of COVID-19 vaccines and easing of social distancing measures. Optimism about a rebound is reflected in the percentage of small businesses that expect to grow in 2021. 60.8 per cent expect to grow this year, which is noticeably higher than the 46.2 per cent that grew last year. Likewise, 63.6 per cent expect their revenue to grow this year, up from the 48.1 per cent in 2020. This growing positivity is flowing through to jobs. 36.1 per cent of the region’s small businesses expect to add employees this year, up from 24.8 per cent last year. Optimism is most apparent in India, where 86.7 per cent of small businesses expect to grow this year, up 21.5 percentage points from 2020. This result includes 54.7 per cent of businesses that believe they will grow strongly in 2021, by far the highest result of the markets surveyed. At the other end of the scale, Hong Kong’s small businesses are still feeling the adverse impacts of two years of tough economic conditions. Only 21.2 per cent expect to grow this year, which is however up from the 16.3 per cent that grew in 2020. Of concern, 58.4 per cent of Hong Kong’s businesses expect to shrink this year. These results are reflected in the low confidence the sector has in the local economy – 65.4 per cent expect the Hong Kong economy to shrink this year. Reflecting overall increasing growth expectations, anticipated demand for external finance is higher this year. 73.1 per cent of businesses expect to access finance this year compared to 57.6 per cent that accessed such finance in 2020. Of the businesses expecting to seek external finance, 50.8 per cent expect to use it for business growth, up from 44.7 per cent last year. The higher percentage of small businesses anticipating needing external funding is indicative of growing confidence, and such funding should help to drive growth. Small business expectations for 2021 compared with actual result for 2020 – survey average
Actual result for 2020 Expectations for 2021
Small businesses that expect to grow 46.2% 60.8%
Small businesses that expect to shrink or close 31.3% 17.1% Small businesses that expect to increase their employee numbers 24.8% 36.1%
Small businesses that expect to require external funds 57.6% 73.1%
Of those small businesses that expect to require external funds, the percentage that expect to use such funds for growth 44.7% 50.8%
Of those small businesses that expect to require external funds, the percentage that expect to use those funds for survival 41.0% 40.6%

14 | CPA AUSTRALIA ASIA-PACIFIC SMALL BUSINESS SURVEY 2020-21
Small business growth – experience in 2020 and expectations for 2021 – by market
0%
10%
20%
30%
40%
50%
60%
70%
80%
90%
100%
2020 2021 2020 2021 2020 2021 2020 2021 2020 2021 2020 2021 2020 2021 2020 2021 2020 2021 2020 2021 2020 2021 2020 2021
SurveyAverage
Australia MainlandChina
Hong Kong India Indonesia Malaysia NewZealand
Philippines Singapore Taiwan Vietnam
Grow a little Grow strongly
15 | CPA AUSTRALIA ASIA-PACIFIC SMALL BUSINESS SURVEY 2020-21
MAJOR FINDING 3 – DRIVERS OF SMALL BUSINESS GROWTH There is a significant link between undertaking certain activities and strong business growth Small businesses that grew strongly in 2020 and expect to grow strongly in 2021 are significantly more likely to be selling online, innovating, exporting, improving business strategy, improving customer satisfaction and seeking advice from experts. Small businesses operating in developing economies, businesses that have been established for less than 10 years, and where the respondent is aged under 40, were also significantly more likely to grow strongly last year or expect to grow strongly this year. In response to COVID-19, small businesses that grew strongly last year were more likely to have begun or increased their focus on online sales, increased their investment in technology and made substantial changes to their product or the service they sell. Seeking advice is also important for businesses that grew strongly. Such businesses were more likely to have sought advice from an IT consultant/specialist and a business/management consultant than businesses that didn’t grow. Businesses that grew strongly in 2020 or expect to grow strongly in 2021 are also more concerned about the possibility of cyberattacks. They are therefore more likely to have reviewed their cybersecurity measures in the past six months.

16 | CPA AUSTRALIA ASIA-PACIFIC SMALL BUSINESS SURVEY 2020-21
Businesses that grew strongly in 2020 are much more likely to have found the following
Percentage that grew
strongly in 2020
Percentage where the business was
unchanged or shrank in 2020
Their investment in technology in 2020 was already profitable 81.0% 30.4%
Earned 10 per cent or more of their revenue from online sales 76.2% 48.0%
Received 10 per cent or more of their sales through new payment technologies such as Alipay, Apple Pay and WeChat Pay
76.6% 56.8%
Improved customer satisfaction was one of the most positive influences on their business
37.4% 12.7%
Good staff was one of the most positive influences on their business 32.4% 17.5%
Improved business strategy was one of the most positive influences on their business
33.5% 12.7%
Introducing a new product or service was one of the most positive influences on their business
29.5% 11.5%
Technology was one of the most positive influences on their business 32.2% 13.6%
Found accessing external finance was easy or very easy 50.8% 30.3%
Repaying debts was easy or very easy 49.8% 26.0%
Business used social media to learn about the behaviours of customers and potential customers
44.3% 24.1%
Business reviewed its cybersecurity protections in the past six months 51.5% 35.5%
Sought advice from an IT consultant/specialist 36.4% 14.8%
Sought advice from a business/management consultant 33.7% 15.2%
In response to COVID-19, began or increased their focus on online sales 32.8% 18.2%
In response to COVID-19, increased their investment in technology 30.8% 12.0%
In response to COVID-19, made substantial changes to the product or services they sell
28.9% 12.5%

17 | CPA AUSTRALIA ASIA-PACIFIC SMALL BUSINESS SURVEY 2020-21
Businesses that expect to grow strongly in 2021 are much more likely to expect the following
Expect to grow strongly in 2021
Expect to remain unchanged or shrink in
2021
They will innovate through the introduction of a product, process or service totally new to their local market or the world in 2021 58.9% 6.8%
Expect revenue from overseas sales to grow strongly in 2021 48.6% 3.7%
Believe a cyberattack on their business is very likely in 2021 43.7% 4.9%
Business will require external finance in 2021 50.8% 17.0%
If seeking finance, the business expects easy to very easy access to finance 40.8% 18.2%
Expect it will be easy or very easy to pay their debts in 2021 44.1% 22.3%

18 | CPA AUSTRALIA ASIA-PACIFIC SMALL BUSINESS SURVEY 2020-21
MAJOR FINDING 4 – THERE ARE LARGE DIFFERENCES BETWEEN SMALL BUSINESSES IN ASIA, AND AUSTRALIA AND NEW ZEALAND Small businesses from Asia are much more likely to be undertaking activities associated with growth Small businesses in Asia continue to be more likely than businesses in Australia and New Zealand to undertake activities that the survey results found are closely associated with growth. This is highly likely to be contributing towards the stronger growth of Asia’s small business sector. The investment that many small businesses in Asia are making in innovation, new payment technologies, social media and improving customer satisfaction should also support their long-term growth prospects. Further, the stronger growth of small businesses in Asia is leading to them to have much higher demand for external finance. This is despite access to finance being more difficult in Asia. The recent weak performance of Hong Kong’s small business sector is not necessarily an indicator of issues with their capability and capacity. Hong Kong’s small businesses are much more likely to be using digital technologies and exporting than their Australian and New Zealand peers. However, Hong Kong businesses, like small businesses in Australian and New Zealand would benefit from a stronger focus on innovation, customer satisfaction and business strategy. A significant difference between small businesses in Asia, and Australia and New Zealand is their respective age profiles. Small businesses in Asia have typically been established for less time and are run by someone who is younger. The survey results show that these businesses are much more likely to be undertaking activities associated with growth, including leveraging technologies, innovating, and creating jobs. A policy challenge for Australia and New Zealand is, therefore, how to attract younger people to start their own business or buy an existing business.
19 | CPA AUSTRALIA ASIA-PACIFIC SMALL BUSINESS SURVEY 2020-21
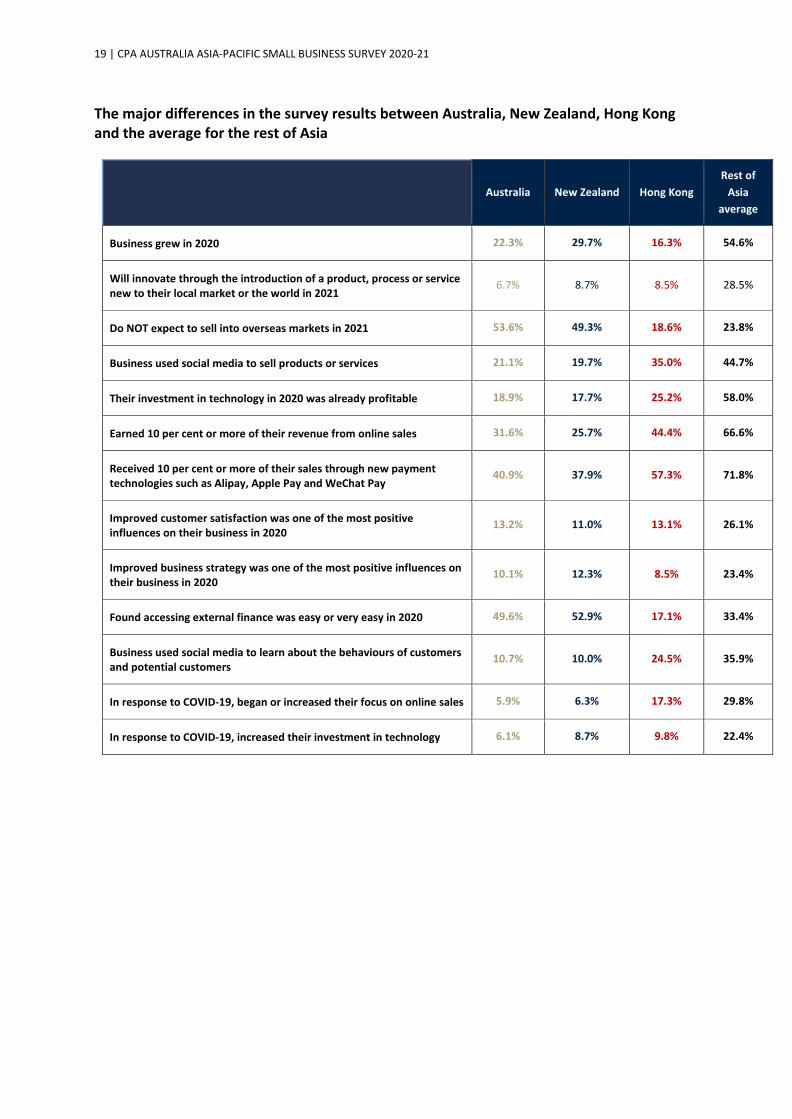
The major differences in the survey results between Australia, New Zealand, Hong Kong and the average for the rest of Asia
Australia New Zealand Hong Kong Rest of
Asia average
Business grew in 2020 22.3% 29.7% 16.3% 54.6%
Will innovate through the introduction of a product, process or service new to their local market or the world in 2021
6.7% 8.7% 8.5% 28.5%
Do NOT expect to sell into overseas markets in 2021 53.6% 49.3% 18.6% 23.8%
Business used social media to sell products or services 21.1% 19.7% 35.0% 44.7%
Their investment in technology in 2020 was already profitable 18.9% 17.7% 25.2% 58.0%
Earned 10 per cent or more of their revenue from online sales 31.6% 25.7% 44.4% 66.6%
Received 10 per cent or more of their sales through new payment technologies such as Alipay, Apple Pay and WeChat Pay
40.9% 37.9% 57.3% 71.8%
Improved customer satisfaction was one of the most positive influences on their business in 2020
13.2% 11.0% 13.1% 26.1%
Improved business strategy was one of the most positive influences on their business in 2020
10.1% 12.3% 8.5% 23.4%
Found accessing external finance was easy or very easy in 2020 49.6% 52.9% 17.1% 33.4%
Business used social media to learn about the behaviours of customers and potential customers
10.7% 10.0% 24.5% 35.9%
In response to COVID-19, began or increased their focus on online sales 5.9% 6.3% 17.3% 29.8%
In response to COVID-19, increased their investment in technology 6.1% 8.7% 9.8% 22.4%
20 | CPA AUSTRALIA ASIA-PACIFIC SMALL BUSINESS SURVEY 2020-21
MAJOR FINDING 5 – SMALL BUSINESSES WITH YOUNGER RESPONDENTS ARE MUCH MORE LIKELY TO BE GROWING There are significant differences in activities undertaken by small businesses by age Respondents aged under 40 are significantly more likely to state their business is growing, creating jobs and focusing on key drivers of business growth including innovation, and leveraging technology. Younger respondents were also more likely to have invested in technology in 2020 that has already improved their profitability. These respondents are more likely to have invested in artificial intelligence and mobile applications (apps). Older respondents were more likely to invest in computer equipment. Due to their typically stronger focus on technology, younger respondents are much more likely to expect a cyberattack in 2021, and therefore more likely to have reviewed their cybersecurity in the past six months. Younger respondents were also more likely to have begun or increased their focus on online sales last year in response to COVID-19. Older respondents were more likely to have not made any major businesses changes in response to COVID-19, even where the pandemic had a negative impact on their business. Younger respondents are seeking to grow their customer base through technology, innovation and improving customer satisfaction. Older respondents are more likely to be relying on their existing customer base, with a strong focus on customer loyalty. Given younger respondents are more likely to be in businesses that are growing, it is not surprising that they were much more likely to have needed external finance in 2020. While there is little difference in ease or difficulty in accessing finance by age, younger respondents were more likely to source those funds from an investor.

21 | CPA AUSTRALIA ASIA-PACIFIC SMALL BUSINESS SURVEY 2020-21
Key differences in survey results between respondents aged under 40 and those aged 50 and over
Percentage of
respondents under 40
Percentage of respondents 50 or
over
Reported their business grew in 2020 59.9% 21.1%
Expect business to grow in 2021 71.9% 39.6%
Increased employee numbers in 2020 38.0% 6.3%
Expect to increase employee numbers in 2021 48.6% 13.2%
Will introduce a new product, service or process unique to their market or the world in 2021
30.9% 7.5%
Expect revenue from overseas markets to grow in 2021 50.5% 23.3%
Business used social media to sell products or services 44.2% 24.6%
Business used social media to promote itself to potential customers 50.5% 35.6%
Improving business strategy was one of the most positive influences on their business in 2020
22.7% 12.1%
Improving customer satisfaction was one of the most positive influences on their business in 2020
25.4% 16.5%
Customer loyalty was one of the most positive influence on their business in 2020 32.5% 34.6%
More than 10 per cent of revenue comes from online sales 67.9% 35.1%
More than 10 per cent of sales is received through digital online payment platforms, such as Alipay, Apple Pay and WeChat Pay
63.4% 40.1%
Due to COVID-19, began or increased their focus on online sales 28.7% 12.8%
COVID-19 did not cause me to make major changes to my business 7.9% 25.8%
Consider it likely that their business will experience cyberattack(s) in 2021 45.3% 24.1%
Business reviewed its cybersecurity protections in the past six months 47.7% 34.3%
Investment in technology in 2020 has already increased the business’s profitability
60.1% 22.8%
The technology most heavily invested in in 2020 was computer equipment 14.8% 26.4%
Required external finance in 2020 63.4% 38.6%
Business growth was a main reason for requiring external finance in 2020 49.8% 29.5%
50 per cent or more of sales are received in cash 54.4% 27.9%
Has 10 to 19 employees 42.1% 17.8%
22 | CPA AUSTRALIA ASIA-PACIFIC SMALL BUSINESS SURVEY 2020-21
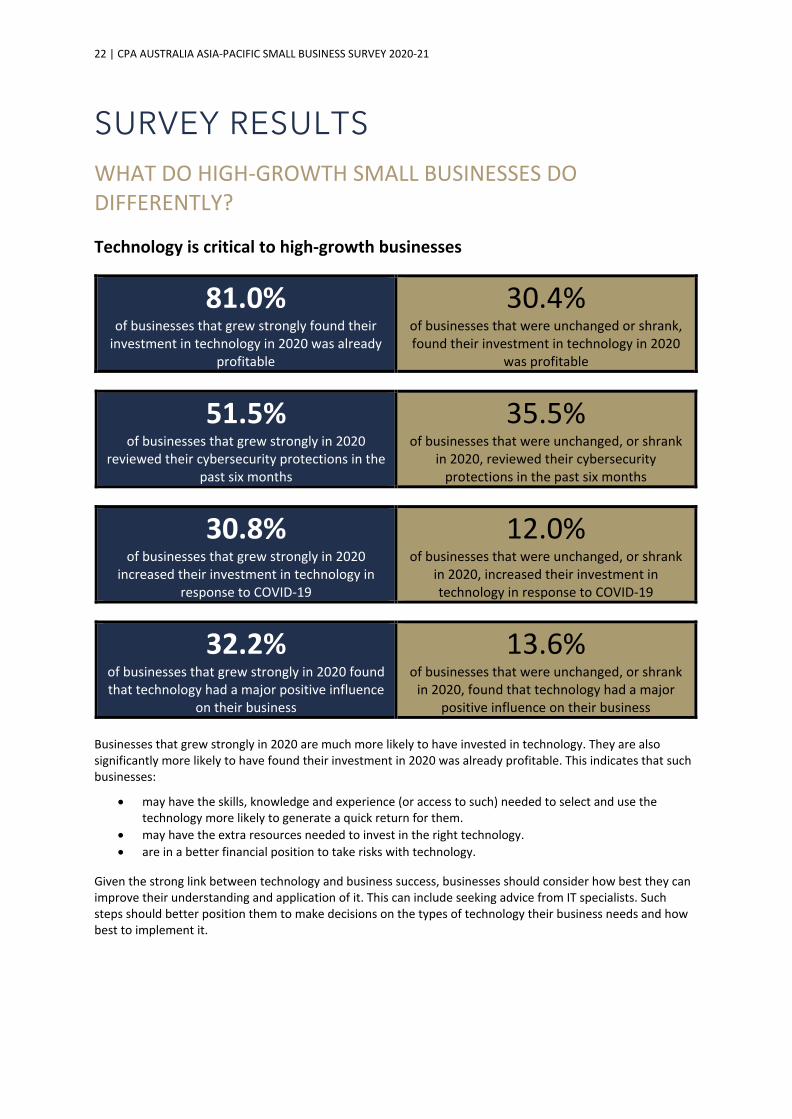
SURVEY RESULTS WHAT DO HIGH-GROWTH SMALL BUSINESSES DO DIFFERENTLY? Technology is critical to high-growth businesses
81.0% of businesses that grew strongly found their
investment in technology in 2020 was already profitable
30.4% of businesses that were unchanged or shrank, found their investment in technology in 2020
was profitable
51.5% of businesses that grew strongly in 2020
reviewed their cybersecurity protections in the past six months
35.5% of businesses that were unchanged, or shrank
in 2020, reviewed their cybersecurity protections in the past six months
30.8% of businesses that grew strongly in 2020
increased their investment in technology in response to COVID-19
12.0% of businesses that were unchanged, or shrank
in 2020, increased their investment in technology in response to COVID-19
32.2% of businesses that grew strongly in 2020 found that technology had a major positive influence
on their business
13.6% of businesses that were unchanged, or shrank
in 2020, found that technology had a major positive influence on their business
Businesses that grew strongly in 2020 are much more likely to have invested in technology. They are also significantly more likely to have found their investment in 2020 was already profitable. This indicates that such businesses:
• may have the skills, knowledge and experience (or access to such) needed to select and use the technology more likely to generate a quick return for them.
• may have the extra resources needed to invest in the right technology. • are in a better financial position to take risks with technology.
Given the strong link between technology and business success, businesses should consider how best they can improve their understanding and application of it. This can include seeking advice from IT specialists. Such steps should better position them to make decisions on the types of technology their business needs and how best to implement it.

23 | CPA AUSTRALIA ASIA-PACIFIC SMALL BUSINESS SURVEY 2020-21
Increasing their focus on cybersecurity may also assist some small businesses to overcome possible concerns they have with investing in new technology.
Selling online is an important part of high-growth businesses
76.2% of businesses that grew strongly in 2020 earned
11 per cent or more of their revenue from online sales
48.0% of businesses that were unchanged, or shrank
in 2020 earned 11 per cent or more of their revenue from online sales
76.6% of businesses that grew strongly in 2020
received 11 per cent or more of their sales through new payment technology
56.8% of businesses that were unchanged, or shrank in 2020 received 11 per cent or more of their
sales through new payment technology
42.7% of businesses that grew strongly in 2020 used
social media to sell products or services
34.1% of businesses that were unchanged, or shrank in 2020 used social media to sell products or
services
32.8% of businesses that grew strongly in 2020 began
or increased their focus on online sales in response to COVID-19
18.2% of businesses that were unchanged, or shrank
in 2020, began or increased their focus on online sales in response to COVID-19
Businesses that grew strongly in 2020 were significantly more likely to have earned more than 10 per cent of their revenue from online sales. Businesses seeking to grow should consider investing more in developing their online sales presence, including social media. Part of this focus should include making it easier for customers to purchase online through new payment technologies such as PayPal, Alipay and Afterpay. It is somewhat disappointing that COVID-19 didn’t encourage more small businesses to increase their focus on online sales. While there was an increase, the results were lower than anticipated, especially in Australia and New Zealand.

24 | CPA AUSTRALIA ASIA-PACIFIC SMALL BUSINESS SURVEY 2020-21
Used social media for business purposes
46.2% of businesses that grew strongly used social
media to communicate with existing customers
38.2% of businesses that were unchanged, or shrank,
used social media to communicate with existing customers
52.1% of businesses that grew strongly used social
media to promote their business to potential customers
40.7% of businesses that were unchanged, or shrank, used social media to promote their business to
potential customers
44.3% of businesses that grew strongly used social
media to learn about the behaviours of customers and potential customers
24.1% of businesses that were unchanged, or shrank,
used social media to learn about the behaviours of customers and potential
customers As in previous years, there is a solid link between using social media and strong business growth. Businesses that grew strongly are more likely to use social media in a variety of ways, including selling, having two-way communication with existing and potential customers, and learning more about their customers. There is therefore value in small businesses increasing their social media presence, including using it as another channel to sell to customers and gathering customer data and feedback. Such data is important to better understand their customers and therefore improving customer satisfaction.
Focused on improving customer satisfaction and business strategy
37.4% of businesses that grew strongly in 2020 found that improving customer satisfaction had one
of the most positive influences on their business
14.9% of businesses that were unchanged, or shrank
in 2020 found that improving customer satisfaction was one of the most positive
influences on their business
33.5% of businesses that grew strongly in 2020 found that improved business strategy had one of the
most positive impacts on their business
12.7% of businesses that were unchanged, or shrank
in 2020, found that improved business strategy had one of the most positive impacts on their
business
Businesses that grew strongly in 2020 were much more likely to be focused on customers satisfaction and business strategy than businesses that didn’t grow.

25 | CPA AUSTRALIA ASIA-PACIFIC SMALL BUSINESS SURVEY 2020-21
Maintaining customer loyalty was not a distinguishing feature of growing businesses. While businesses that grew strongly found that customer loyalty was important, it was also important for those that didn’t grow. Focusing on customers satisfaction and business strategy are essential for high-growth businesses. Therefore, spending more time learning about customers and potential customers, and developing and implementing a business strategy, is important to business success. This may require investing in technology that helps with learning more about their customers, and seeking professional advice on the design and execution of business plans. Innovate through a new product or service
58.9% of businesses that expect to grow strongly in 2021 will introduce a new product, service or
process new to their market or the world
7.0% of businesses that expect to not to change or shrink in 2021, will introduce a new product, service or process new to their market or the
world
29.5% of businesses that grew strongly in 2020 found that introducing a new product or service was
one of the most positive influences on their business
11.5% of businesses that were unchanged, or
shrank in 2020, found that introducing a new product or service was one of the most
positive influences on their business
28.9% of businesses that grew strongly in 2020 made substantial changes to the products or services
they sell in response to COVID-19
12.5% of businesses that were unchanged, or
shrank in 2020, made substantial changes to the products or services they sell in response
to COVID-19 The survey results show there is a strong link between innovation through introducing a new product, process or service and business growth. Spending more resources and time learning about customers, technological developments and industry trends and translating that through to new products and services is important to business success. This result may also indicate that businesses that are growing strongly may have the extra resources needed to invest in innovation, and therefore be positioned to take risks that are associated with innovation. This culture of innovation is setting such businesses up for long-term success.

26 | CPA AUSTRALIA ASIA-PACIFIC SMALL BUSINESS SURVEY 2020-21
Seeking to grow in new markets
48.6% of businesses that expect to grow strongly in 2021 expect strong growth in their overseas
sales
3.9% of businesses that expect to not to change or shrink in 2021, expect strong growth in their
overseas sales
28.9% of businesses that grew strongly in 2020 found that entering new markets was one of the most
positive influences on their business
10.1% of businesses that were unchanged, or shrank in 2020, found that entering new markets was
one of the most positive influences on their business
Businesses that are growing their exports are much more likely to grow overall. As with previous survey results, businesses that expect to grow strongly in 2021 are significantly more likely to expect their overseas sales will grow strongly. Businesses that grew strongly in 2020 were also much more likely to report that entering new markets was one of the most positive influences on their business last year. Businesses that are growing strongly may have the extra resources needed to enter new markets and adapt their products or services to those markets. They may also be better positioned to take risks associated with exporting. Diversifying income streams and exposing a business to new competitive pressures and ideas from different markets remains important for long-term business success.

27 | CPA AUSTRALIA ASIA-PACIFIC SMALL BUSINESS SURVEY 2020-21
SEVEN LESSONS FROM HIGH-GROWTH SMALL BUSINESSES
Develop your capability to identify and implement the right technologies for your business
Invest in learning more about your customers and potential customers
Invest in researching and implementing new or improved products, processes or services
Test whether there is demand for your products or services in new markets
Increase your social media presence and expand the ways you use social media
Expand your e-commerce presence and use new payment technologies to make it easier for customers to pay online
Focus on improving your business strategy and its implementation

28 | CPA AUSTRALIA ASIA-PACIFIC SMALL BUSINESS SURVEY 2020-21
COVID-19 IMPACT ON SMALL BUSINESS
Impact on growth Actual growth in 2020 compared to expected growth – by market
20.2% of businesses stated that COVID-19 had a major
positive influence on their business in 2020
57.1% of businesses stated that COVID-19 had a major
detrimental impact on their business in 2020 Unsurprisingly, the survey results show that COVID-19 had a major negative impact on small business in all markets in 2020. The pandemic led to less businesses growing last year compared with 2019, and the percentage of businesses that did grow failed to meet expectations in all markets.
0%
10%
20%
30%
40%
50%
60%
70%
80%
90%
100%
Expe
cted
Actu
al
Expe
cted
Actu
al
Expe
cted
Actu
al
Expe
cted
Actu
al
Expe
cted
Actu
al
Expe
cted
Actu
al
Expe
cted
Actu
al
Expe
cted
Actu
al
Expe
cted
Actu
al
Expe
cted
Actu
al
Expe
cted
Actu
al
Expe
cted
Actu
al
SurveyAverage
Australia MainlandChina
Hong Kong India Indonesia Malaysia NewZealand
Philippines Singapore Taiwan Vietnam
Grow a little Grow strongly

29 | CPA AUSTRALIA ASIA-PACIFIC SMALL BUSINESS SURVEY 2020-21
Businesses that found COVID-19 had a major negative impact on their business in 2020 were more likely to: • be from Vietnam. This is interesting given the pandemic only had a minor impact on the country last year. • be from the ‘Rental, hiring and real estate’ and the ‘Accommodation and food services’ sectors. This is not
surprising given social distancing, travel restrictions and lockdowns. • have been operating for ten years or less. While far more businesses reported that COVID-19 had a major negative impact on their business, a small percentage of businesses found that it had a major positive influence on their business. Businesses in the ‘health care and social assistance’ industry, and businesses from Taiwan and India were the most likely to report it had a positive impact. Impact on small business jobs creation Actual increase in employee numbers in 2020 compared to expected increase
0%
10%
20%
30%
40%
50%
60%
70%
80%
Expe
cted
Actu
al
Expe
cted
Actu
al
Expe
cted
Actu
al
Expe
cted
Actu
al
Expe
cted
Actu
al
Expe
cted
Actu
al
Expe
cted
Actu
al
Expe
cted
Actu
al
Expe
cted
Actu
al
Expe
cted
Actu
al
Expe
cted
Actu
al
Expe
cted
Actu
al
SurveyAverage
Australia MainlandChina
Hong Kong India Indonesia Malaysia NewZealand
Philippines Singapore Taiwan Vietnam
30 | CPA AUSTRALIA ASIA-PACIFIC SMALL BUSINESS SURVEY 2020-21
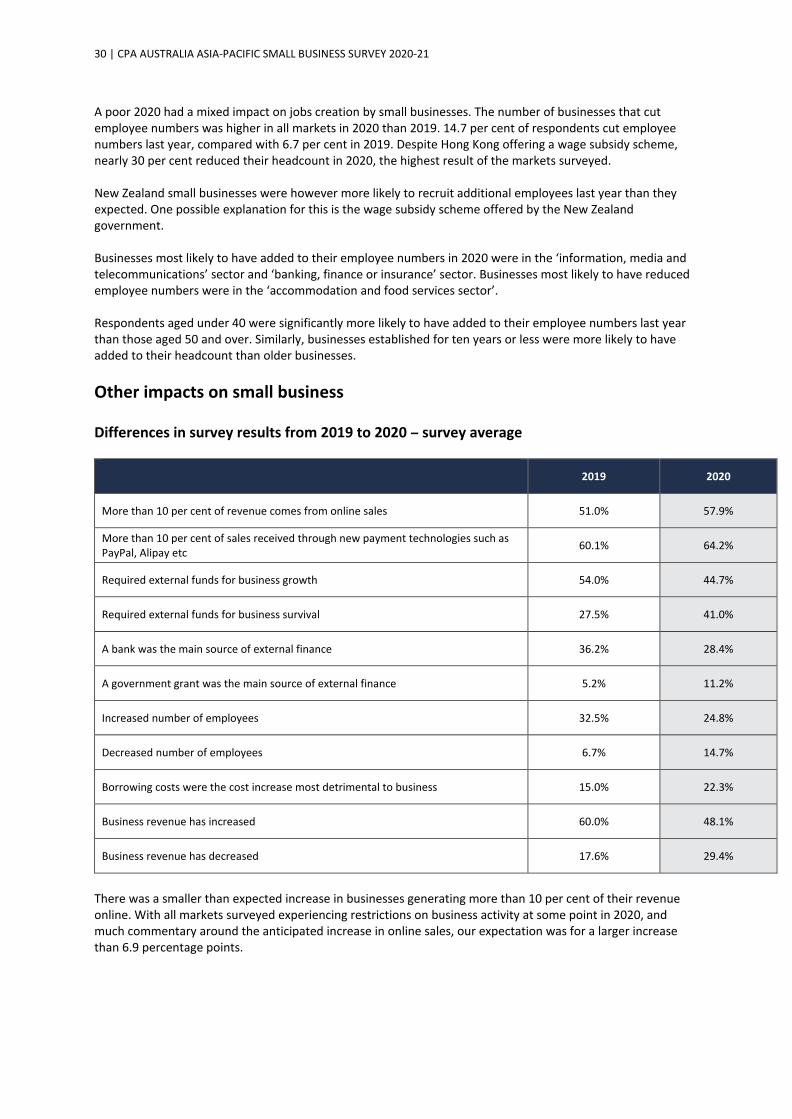
A poor 2020 had a mixed impact on jobs creation by small businesses. The number of businesses that cut employee numbers was higher in all markets in 2020 than 2019. 14.7 per cent of respondents cut employee numbers last year, compared with 6.7 per cent in 2019. Despite Hong Kong offering a wage subsidy scheme, nearly 30 per cent reduced their headcount in 2020, the highest result of the markets surveyed. New Zealand small businesses were however more likely to recruit additional employees last year than they expected. One possible explanation for this is the wage subsidy scheme offered by the New Zealand government. Businesses most likely to have added to their employee numbers in 2020 were in the ‘information, media and telecommunications’ sector and ‘banking, finance or insurance’ sector. Businesses most likely to have reduced employee numbers were in the ‘accommodation and food services sector’. Respondents aged under 40 were significantly more likely to have added to their employee numbers last year than those aged 50 and over. Similarly, businesses established for ten years or less were more likely to have added to their headcount than older businesses. Other impacts on small business Differences in survey results from 2019 to 2020 – survey average
2019 2020
More than 10 per cent of revenue comes from online sales 51.0% 57.9%
More than 10 per cent of sales received through new payment technologies such as PayPal, Alipay etc 60.1% 64.2%
Required external funds for business growth 54.0% 44.7%
Required external funds for business survival 27.5% 41.0%
A bank was the main source of external finance 36.2% 28.4%
A government grant was the main source of external finance 5.2% 11.2%
Increased number of employees 32.5% 24.8%
Decreased number of employees 6.7% 14.7%
Borrowing costs were the cost increase most detrimental to business 15.0% 22.3%
Business revenue has increased 60.0% 48.1%
Business revenue has decreased 17.6% 29.4%
There was a smaller than expected increase in businesses generating more than 10 per cent of their revenue online. With all markets surveyed experiencing restrictions on business activity at some point in 2020, and much commentary around the anticipated increase in online sales, our expectation was for a larger increase than 6.9 percentage points.
31 | CPA AUSTRALIA ASIA-PACIFIC SMALL BUSINESS SURVEY 2020-21
With over 24 per cent of businesses stating that they began or increased their focus on online sales in response to COVID-19, these results indicate that such a shift was not automatically beneficial to many small businesses last year. Larger businesses may have benefited more from this shift to online commerce. While government grants were not a major source of external finance overall, this was not the case in New Zealand and Hong Kong. In both markets, the government became a major player in small business financing. In New Zealand, the percentage of small businesses that nominated government grants as their main source of external finance surged from 7.0 per cent in 2019 to 51.3 per cent in 2020. For Hong Kong, the results jumped from 9.2 per cent in 2019 to 32.5 per cent last year. With governments across the world substantially ramping up their direct support of businesses through wage subsidies, grants and concessional loans, and many traditional lenders becoming more reluctant to lend given the uncertain economic environment, this result is not surprising.
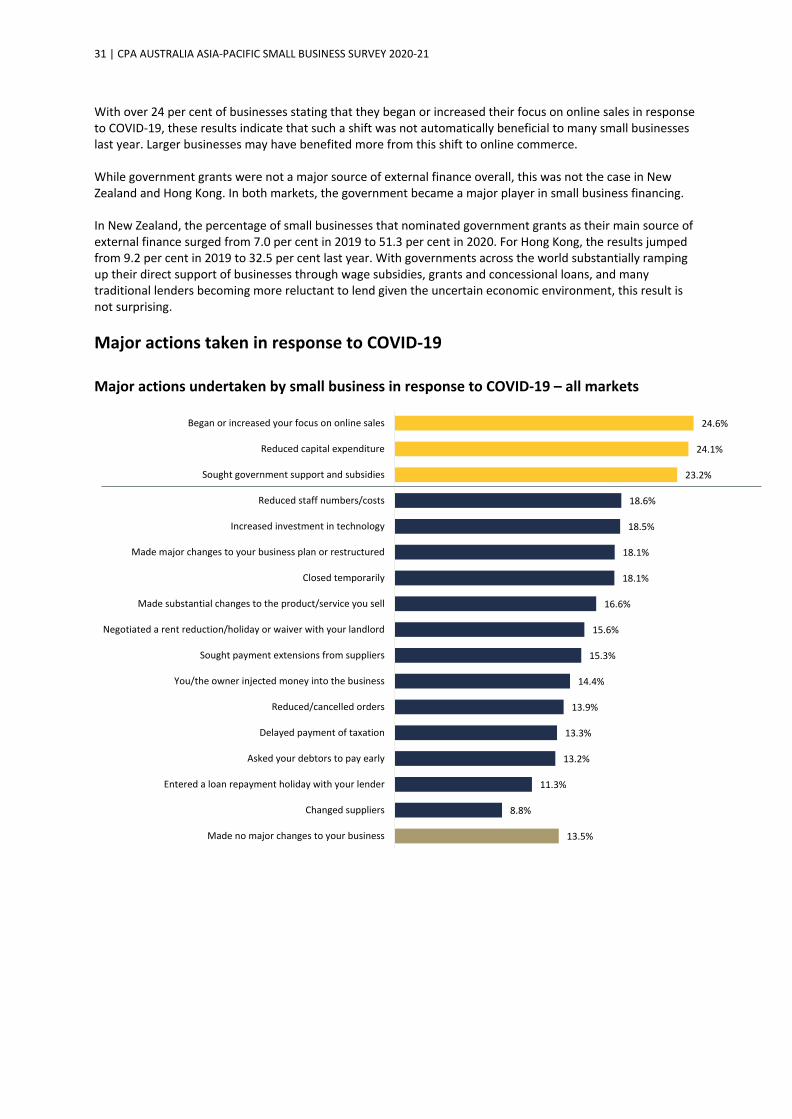
Major actions taken in response to COVID-19 Major actions undertaken by small business in response to COVID-19 – all markets
13.5%
8.8%
11.3%
13.2%
13.3%
13.9%
14.4%
15.3%
15.6%
16.6%
18.1%
18.1%
18.5%
18.6%
23.2%
24.1%
24.6%
Made no major changes to your business
Changed suppliers
Entered a loan repayment holiday with your lender
Asked your debtors to pay early
Delayed payment of taxation
Reduced/cancelled orders
You/the owner injected money into the business
Sought payment extensions from suppliers
Negotiated a rent reduction/holiday or waiver with your landlord
Made substantial changes to the product/service you sell
Closed temporarily
Made major changes to your business plan or restructured
Increased investment in technology
Reduced staff numbers/costs
Sought government support and subsidies
Reduced capital expenditure
Began or increased your focus on online sales
32 | CPA AUSTRALIA ASIA-PACIFIC SMALL BUSINESS SURVEY 2020-21
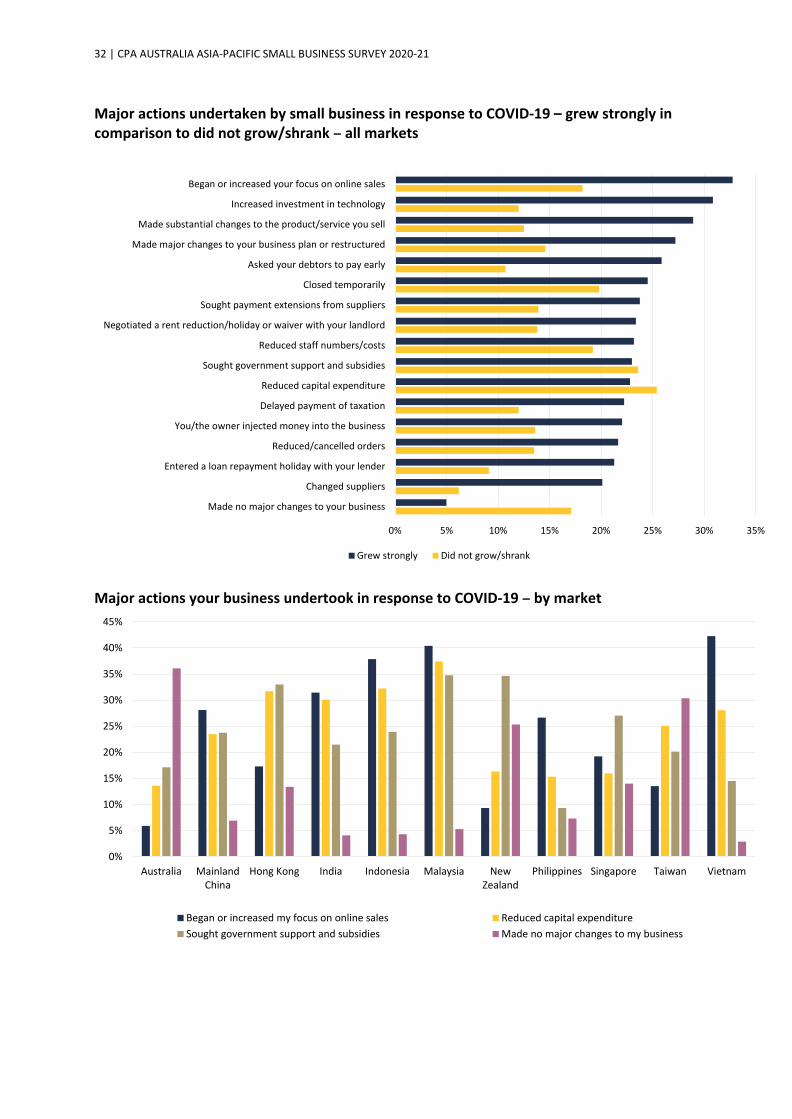
Major actions undertaken by small business in response to COVID-19 – grew strongly in comparison to did not grow/shrank – all markets
Major actions your business undertook in response to COVID-19 – by market
0%
5%
10%
15%
20%
25%
30%
35%
40%
45%
Australia MainlandChina
Hong Kong India Indonesia Malaysia NewZealand
Philippines Singapore Taiwan Vietnam
Began or increased my focus on online sales Reduced capital expenditureSought government support and subsidies Made no major changes to my business
0% 5% 10% 15% 20% 25% 30% 35%
Made no major changes to your business
Changed suppliers
Entered a loan repayment holiday with your lender
Reduced/cancelled orders
You/the owner injected money into the business
Delayed payment of taxation
Reduced capital expenditure
Sought government support and subsidies
Reduced staff numbers/costs
Negotiated a rent reduction/holiday or waiver with your landlord
Sought payment extensions from suppliers
Closed temporarily
Asked your debtors to pay early
Made major changes to your business plan or restructured
Made substantial changes to the product/service you sell
Increased investment in technology
Began or increased your focus on online sales
Grew strongly Did not grow/shrank
33 | CPA AUSTRALIA ASIA-PACIFIC SMALL BUSINESS SURVEY 2020-21
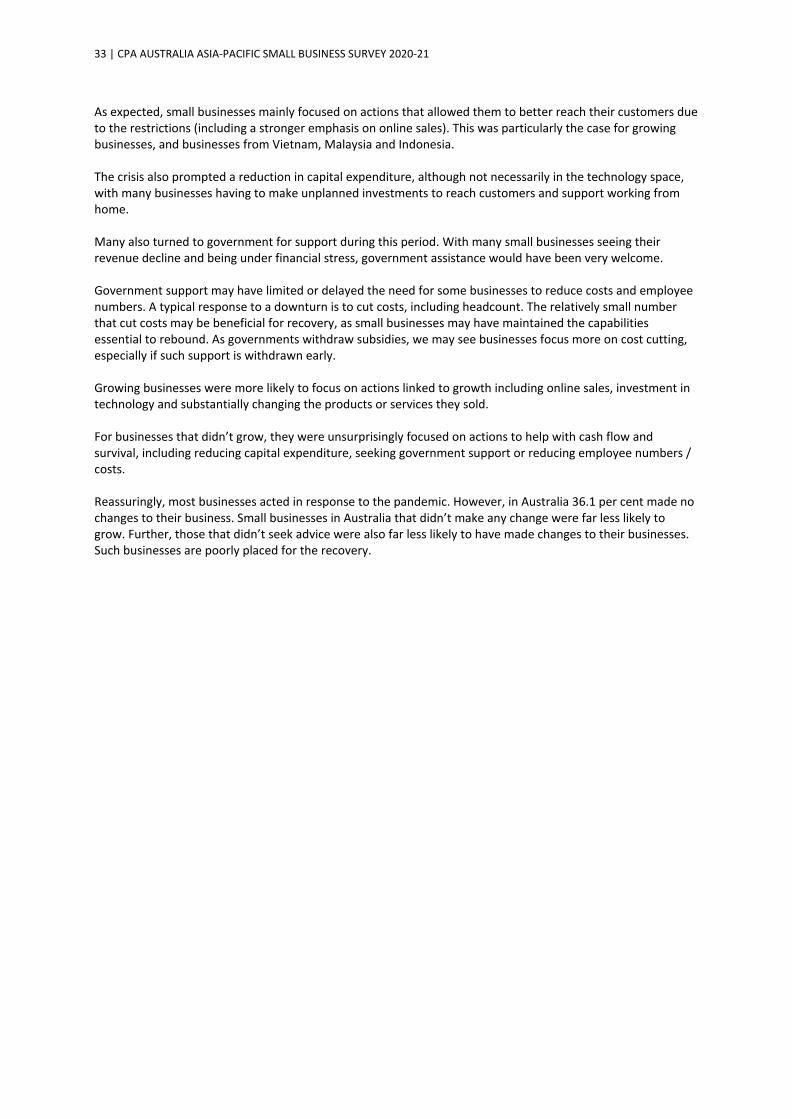
As expected, small businesses mainly focused on actions that allowed them to better reach their customers due to the restrictions (including a stronger emphasis on online sales). This was particularly the case for growing businesses, and businesses from Vietnam, Malaysia and Indonesia. The crisis also prompted a reduction in capital expenditure, although not necessarily in the technology space, with many businesses having to make unplanned investments to reach customers and support working from home. Many also turned to government for support during this period. With many small businesses seeing their revenue decline and being under financial stress, government assistance would have been very welcome. Government support may have limited or delayed the need for some businesses to reduce costs and employee numbers. A typical response to a downturn is to cut costs, including headcount. The relatively small number that cut costs may be beneficial for recovery, as small businesses may have maintained the capabilities essential to rebound. As governments withdraw subsidies, we may see businesses focus more on cost cutting, especially if such support is withdrawn early. Growing businesses were more likely to focus on actions linked to growth including online sales, investment in technology and substantially changing the products or services they sold. For businesses that didn’t grow, they were unsurprisingly focused on actions to help with cash flow and survival, including reducing capital expenditure, seeking government support or reducing employee numbers / costs. Reassuringly, most businesses acted in response to the pandemic. However, in Australia 36.1 per cent made no changes to their business. Small businesses in Australia that didn’t make any change were far less likely to grow. Further, those that didn’t seek advice were also far less likely to have made changes to their businesses. Such businesses are poorly placed for the recovery.

34 | CPA AUSTRALIA ASIA-PACIFIC SMALL BUSINESS SURVEY 2020-21
Recovery from COVID-19 If COVID-19 had a negative impact on your business how long do you believe it will take for it to recover to its pre-COVID-19 level – survey average?
If COVID-19 had a negative impact on your business how long do you believe it will take for it to recover to its pre-COVID-19 level – by market?
4.4%
1.9%
5.2%
1.6%
3.0%
11.0%
33.9%
24.5%
14.5%
Don't know
Not applicable as COVID-19 had a positive impact on my business
Not applicable as COVID-19 had no impact on my business
Will never recover
6 years or more
3 to 5 years
1 to 2 years
Less than a year
Has already recovered
0%
5%
10%
15%
20%
25%
30%
35%
40%
45%
50%
Australia MainlandChina
Hong Kong India Indonesia Malaysia NewZealand
Philippines Singapore Taiwan Vietnam
Has already recovered Less than a year 1 to 2 years 3 years or more/never recover

35 | CPA AUSTRALIA ASIA-PACIFIC SMALL BUSINESS SURVEY 2020-21
COVID-19 has had a diverse impact on the region’s small businesses. Many small businesses from Mainland China and Vietnam have already recovered or expect to recover this year, reflecting the success that those countries had in managing the health and economic impacts of COVID-19 last year. On the other hand, over one-third of India’s small businesses expect it will take three years or more to recover to their pre-COVID-19 level. Businesses in the utilities sector are the most likely to expect to have fully recovered by the end of this year (52.2 per cent), followed by ‘accommodation and food services businesses’ (47.6 per cent). Younger businesses seem more resilient than older businesses. Businesses established for ten years or less are more likely to have recovered or to expect to recover this year. Respondents aged under 40 are also more likely to have found that their business has recovered or expect it to recover this year than older respondents. Overall, most businesses expect to return to their pre-COVID-19 levels in the next two years. The recovery could be accelerated through a fast roll-out of a vaccine. Business solvency Businesses ability to repay its debts in 2020 – by market
38.9%33.6%
21.6%
43.6%
22.6% 22.8%30.0%
24.3%30.9% 28.1%
40.3%
-16.0% -18.4%-24.9%
-33.6%-26.6% -29.1%
-19.7%
-34.3%
-20.5%-13.5% -15.5%
-40%
-30%
-20%
-10%
0%
10%
20%
30%
40%
50%
Australia MainlandChina
Hong Kong India Indonesia Malaysia New Zealand Philippines Singapore Taiwan Vietnam
Easy/very easy Difficult/very difficult

36 | CPA AUSTRALIA ASIA-PACIFIC SMALL BUSINESS SURVEY 2020-21
The mixed results for India’s small businesses are reflected in this test of solvency. While India’s small businesses were the most likely to find it easy or very easy to pay their debts in 2020, they were also the second most likely to find that they had difficult meeting their debt obligations in 2020. Despite most Filipino small businesses growing, this was not necessarily translating to improved cash flow, with less than a quarter finding it easy to pay their debts in 2020. Despite 2020 being a very tough year for many of the region’s small businesses, this has not necessarily translated into heightened concerns over business solvency. For Australia, Hong Kong, New Zealand, Singapore and Taiwan, there is little difference between the percentage of businesses that found it difficult to pay their debts in 2019 and 2020. This is most likely due to the government financial support available in those markets. Vietnam is the one market where the percentage that had trouble paying their debts dropped substantially. In 2019, 42.3 per cent had trouble paying their debts compared to 15.5 per cent in 2020.

37 | CPA AUSTRALIA ASIA-PACIFIC SMALL BUSINESS SURVEY 2020-21
SMALL BUSINESS AND TECHNOLOGY
The impact of technology on small business profitability Investment in technology in 2020 made the business more profitable – by market
Investment in technology in 2020 made the business more profitable – by age of respondent
31.3%
15.0%
50.6%
21.6% 23.8%
41.5%
29.1%
16.0%
31.7% 27.7% 28.1%
44.2%
16.8%
3.9%
6.4%
3.6%
52.0%
32.9%
13.2%
1.7%
24.0%
10.7%3.6%
33.5%
0%
10%
20%
30%
40%
50%
60%
70%
80%
90%
Surveyaverage
Australia MainlandChina
Hong Kong India Indonesia Malaysia NewZealand
Philippines Singapore Taiwan Vietnam
Somewhat more profitable Significantly more profitable
36.0% 36.8%31.6%
23.2%13.3%
22.6% 23.9%
14.4%
5.3%
1.7%
0%
10%
20%
30%
40%
50%
60%
70%
Under 30 30 to 39 40 to 49 50 to 59 60 +
Somewhat more profitable Significantly more profitable
38 | CPA AUSTRALIA ASIA-PACIFIC SMALL BUSINESS SURVEY 2020-21
Key findings The survey results show that choosing the right technology impacts growth. Businesses that grew strongly last year were significantly more likely to find that their investment in technology in 2020 was already profitable (81.0 per cent). In comparison, of those businesses that didn’t grow or shrank, 30.4 per cent found their investment in technology in 2020 was profitable. A lack of investment in technology was also linked with no growth. Businesses that didn’t grow or shrank during 2020 were much more likely to have made no investment in technology (26.5 per cent) than those that grew strongly (6.1 per cent). Likewise, businesses that found technology to be a major positive influence on their business last year were more likely to grow strongly. Small businesses from developing economies were again much more likely to have experienced a boost in profits from their recent investment in technology. For example, 77.7 per cent of small businesses from Vietnam reported their investment in technology last year had already improved their profitability, compared with only 18.9 per cent of Australian small businesses. Age is also a factor in the short-term profitability of technology investment by small business. Respondents aged under 40 were far more likely to state their investment in technology in 2020 was already profitable (60.1 per cent) than respondents over 50 (22.8 per cent). Similarly, older respondents were more likely to have not invested in any technology last year. 36.5 per cent of respondents aged 50 and over didn’t invest in technology in 2020, compared with 11.6 per cent of respondents under 40. Businesses with five or more employees are significantly more likely to be generating a quick return on technology investment. 58.5 per cent of business with five or more employees stated their investment in technology in 2020 was already profitable, compared with 21.1 per cent of businesses with no employees. The technology that was most likely to have significantly increased a business’s profitability in 2020 was business intelligence and analytical software, and customer relationship management software. Suggestions: • Businesses should invest in developing their digital capability so that they are more likely to invest in
technology that improves their profitability sooner. • Businesses can also seek professional advice to improve their understanding of technologies that can
improve their profitability. • Governments, with the support of professional advisers, should be assisting small businesses improve their
understanding of technology.

39 | CPA AUSTRALIA ASIA-PACIFIC SMALL BUSINESS SURVEY 2020-21
Social media NOT using social media for business purposes – by market and over time
NOT using social media for business purposes – by age of respondent and over time
0%
10%
20%
30%
40%
50%
60%
Australia New Zealand Asia
2016 2017 2018 2019 2020
0%
10%
20%
30%
40%
50%
60%
70%
Under 30 30 to 39 40 to 49 50 to 59 60 +
2016 2017 2018 2019 2020
40 | CPA AUSTRALIA ASIA-PACIFIC SMALL BUSINESS SURVEY 2020-21
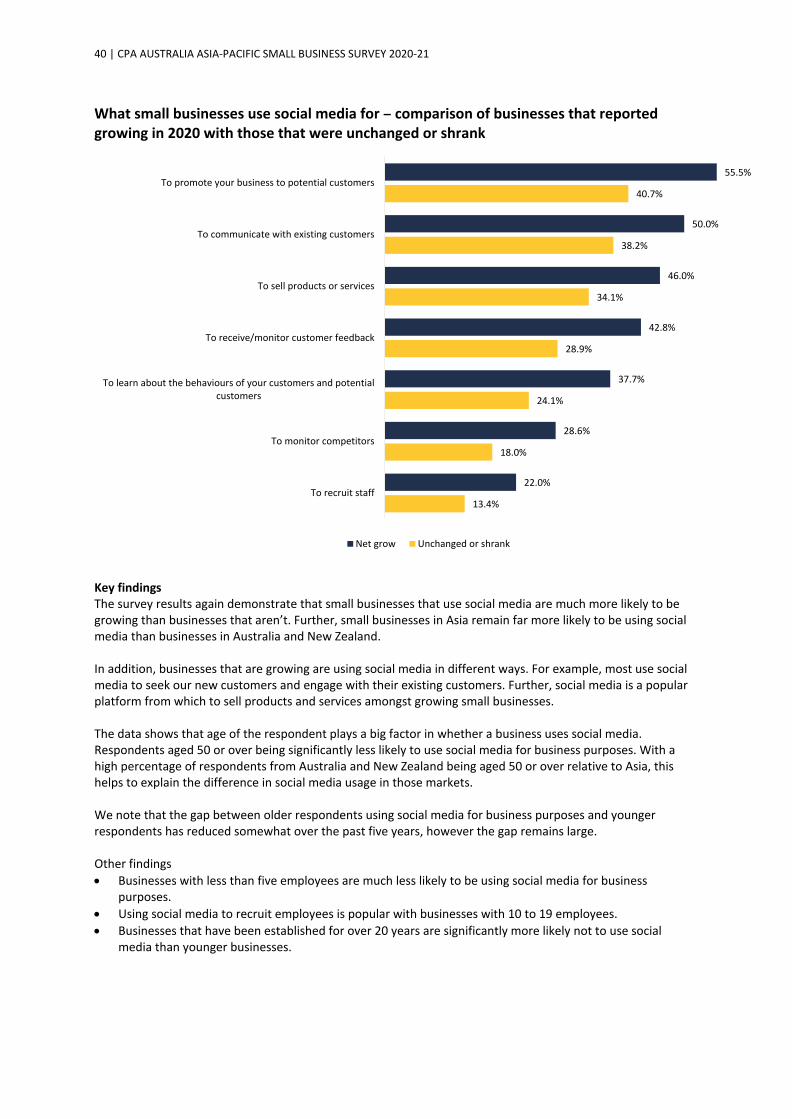
What small businesses use social media for – comparison of businesses that reported growing in 2020 with those that were unchanged or shrank
Key findings The survey results again demonstrate that small businesses that use social media are much more likely to be growing than businesses that aren’t. Further, small businesses in Asia remain far more likely to be using social media than businesses in Australia and New Zealand. In addition, businesses that are growing are using social media in different ways. For example, most use social media to seek our new customers and engage with their existing customers. Further, social media is a popular platform from which to sell products and services amongst growing small businesses. The data shows that age of the respondent plays a big factor in whether a business uses social media. Respondents aged 50 or over being significantly less likely to use social media for business purposes. With a high percentage of respondents from Australia and New Zealand being aged 50 or over relative to Asia, this helps to explain the difference in social media usage in those markets. We note that the gap between older respondents using social media for business purposes and younger respondents has reduced somewhat over the past five years, however the gap remains large. Other findings • Businesses with less than five employees are much less likely to be using social media for business
purposes. • Using social media to recruit employees is popular with businesses with 10 to 19 employees. • Businesses that have been established for over 20 years are significantly more likely not to use social
media than younger businesses.
13.4%
18.0%
24.1%
28.9%
34.1%
38.2%
40.7%
22.0%
28.6%
37.7%
42.8%
46.0%
50.0%
55.5%
To recruit staff
To monitor competitors
To learn about the behaviours of your customers and potentialcustomers
To receive/monitor customer feedback
To sell products or services
To communicate with existing customers
To promote your business to potential customers
Net grow Unchanged or shrank

41 | CPA AUSTRALIA ASIA-PACIFIC SMALL BUSINESS SURVEY 2020-21
Suggestions: • Businesses not yet using social media should do so. • Businesses using social media only to promote their business should look to expand how they use social
media, especially in learning more about their customers, selling and to receive feedback. This may require seeking expert advice.
• Governments, with the support of professional advisers, should educate small businesses about the value of using social media and the various ways social media can be used.
Selling online Percentage of businesses earning more than 10 per cent of revenue online – by whether they grew or not and over time
20%
30%
40%
50%
60%
70%
80%
2014 2015 2016 2017 2018 2019 2020
Grew strongly Grew a little Unchanged or shrank

42 | CPA AUSTRALIA ASIA-PACIFIC SMALL BUSINESS SURVEY 2020-21
Percentage of business earning more than 10 per cent of revenue online – by market in 2020 compared with 2019
Percentage of business earning more than 10 per cent of revenue online – by age and over time
0%
10%
20%
30%
40%
50%
60%
70%
80%
90%
100%
2019 2020 2019 2020 2019 2020 2019 2020 2019 2020 2019 2020 2019 2020 2019 2020 2019 2020 2019 2020 2019 2020 2019 2020
SurveyAverage
Australia MainlandChina
Hong Kong India Indonesia Malaysia NewZealand
Philippines Singapore Taiwan Vietnam
11% to 30% 31% to 99% All my sales revenue comes from online sales
0%
10%
20%
30%
40%
50%
60%
70%
80%
Under 30 30 to 39 40 to 49 50 to 59 60 +
2016 2017 2018 2019 2020

43 | CPA AUSTRALIA ASIA-PACIFIC SMALL BUSINESS SURVEY 2020-21
Key findings Due to COVID-19, selling online became a more important source of revenue for small business across the region last year. However, the 6.9 percentage point increase in businesses generating more than 10 per cent of their revenue through e-commerce was less than expected. The survey data again shows that online sales is important to growth, especially if online sales make up more than 10 per cent of total sales. For those that didn’t grow in 2020, the increased focus on e-commerce should assist with their recovery and growth. Online sales are an essential element of businesses from Mainland China, whereas in Australia and New Zealand it remains significantly less likely to be undertaken by a small business. Large numbers of Indian small businesses turned to online commerce as an important source of revenue in 2020. As with social media usage, the age of the respondent appears to be an important factor influencing whether online sales are important to a business. Respondents aged 50 or over remaining significantly less likely to be selling online than younger respondents. With a higher percentage of Australian and New Zealand respondents being 50 or over relative to respondents in Asia, this helps to explain the difference in the uptake of online sales. Selling online is one way to enter new markets without having to commit significant resources to having a physical presence. It can also help reduce costs by lessening the need for business (especially retail businesses) to be in high rent locations. Other findings
• The more employees a small business has, the more likely they are to be generating more than 10 per cent of sales online.
• Businesses in the ‘Information, media and telecommunications’ and ‘Retail trade’ were the most likely to generate more than 10 per cent of their income through online sales.
• Businesses in the ‘Property and construction’ and ‘Professional, scientific and technical’ sectors were the most likely to not sell online.
• Businesses generating more than 10 per cent of their revenue from online sales are much more likely to have increased employee numbers last year than cut numbers.
Suggestions: • Businesses not selling online should invest in developing their capability to do so, if appropriate. • Businesses looking to expand into Mainland China must consider using a local online sales platform as part
of their strategy to enter that market. • Governments should help small business set up online sales channels and establish the infrastructure
necessary to support online selling.

44 | CPA AUSTRALIA ASIA-PACIFIC SMALL BUSINESS SURVEY 2020-21
New payment technologies Percentage of businesses receiving more than 10 per cent of their sales through new payment technologies such as Alipay, Apple Pay, WeChat Pay etc – by whether they grew or not, and over time
Percentage of businesses receiving more than 10 per cent of their sales through digital payment options, such as Alipay, Apple Pay, WeChat Pay etc – by market and comparing 2019 to 2020
30%
35%
40%
45%
50%
55%
60%
65%
70%
75%
80%
2017 2018 2019 2020
Grew strongly Grew a little Unchanged or shrank
0%
10%
20%
30%
40%
50%
60%
70%
80%
90%
100%
2019 2020 2019 2020 2019 2020 2019 2020 2019 2020 2019 2020 2019 2020 2019 2020 2019 2020 2019 2020 2019 2020 2019 2020
SurveyAverage
Australia MainlandChina
Hong Kong India Indonesia Malaysia NewZealand
Philippines Singapore Taiwan Vietnam
11% to 30% 31% to 99% All my sales revenue comes from online sales

45 | CPA AUSTRALIA ASIA-PACIFIC SMALL BUSINESS SURVEY 2020-21
Percentage of businesses receiving more than 10 per cent of their sales through digital payment options, such as Alipay, Apple Pay, WeChat Pay etc – by age and over time
Key findings The popularity of new digital payment options such as Alipay and Apple Pay remains very high in Mainland China, with India fast catching up. In fact, it would be difficult to find a small business in Mainland China, India or Vietnam that doesn’t offer digital payment options to their clients. As with other technologies, businesses offering new payment technologies to their customers are more likely to be growing. This may help explain why new digital payment technologies continue to increase in popularity. The growth in online sales may also be contributing to the increasing use of new payment technology, with the results showing a link between the two. As with social media and selling online, younger respondents are more likely to state their business generates more than 10 per cent of their revenue through these new payment technologies. While Australian and New Zealand small businesses are unlikely to offer new payment technologies to customers, they are also unlikely to rely on cash sales. 51.7 per cent of New Zealand businesses small businesses and 41.6 per cent of Australian small businesses didn’t receive any cash payments in 2020, the highest results of the markets surveyed. Businesses in Australia and New Zealand would appear to have a strong reliance on credit cards, debit cards and electronic funds transfers. In contrast, while Taiwan’s small businesses are also less likely than others to depend on new payment technologies, they instead place a high degree of reliance on cash sales. 64.7 per cent of Taiwanese small business received 50 per cent or more of their sales in cash, up from 62.5 per cent in 2019.
0%
10%
20%
30%
40%
50%
60%
70%
80%
Under 30 30 to 39 40 to 49 50 to 59 60 +
2017 2018 2019 2020

46 | CPA AUSTRALIA ASIA-PACIFIC SMALL BUSINESS SURVEY 2020-21
While small businesses in developing markets in Asia are big users of technology, cash sales remain fundamental to their business, although it’s trending downwards. For example: • 70.0 per cent of Filipino small businesses received 50 per cent or more of their sales in cash in 2020, down
from 80.3 per cent in 2019. • 61.6 per cent of Malaysian small businesses received 50 per cent or more of their sales in cash in 2020,
down slightly from 62.0 per cent in 2019. • 60.1 per cent of Indonesian small businesses received 50 per cent or more of their sales in cash in 2020,
down from 69.0 per cent in 2019.
Other findings: • Businesses with five or more employees were more likely to be generating more than 10 per cent of their
sales through new payment technologies. • Where the respondent was the business owner, they were less likely than CEOs or accountants to state
their business generated more than 10 per cent of their sales through new payment technologies. • 69.4 per cent of retail businesses generated more than 10 per cent of their sales through new payment
technologies. However, ‘Information, media and telecommunications’ businesses were the most likely to receive payments through new payment technology (79.2 per cent).
Suggestions: • Businesses should consider new payment technologies, particularly online/ digital/ payment methods. • Governments have a role to play in explaining new payment technologies and their advantages. • Governments should encourage the development and deployment of new fintech products that make
payments easier.
Cybersecurity Comparison of those who believe a cyberattack is likely in 2021 against those that have reviewed their cybersecurity in past six months – by market
38.8%
17.8%
34.9%30.1%
68.2%63.8%
46.7%
16.3%
29.0%
36.5% 38.0%
45.5%43.1%
32.5%
58.5%
39.5%
51.0%
43.2% 44.4%
33.3%
38.7% 39.4% 38.9%
32.3%
Surveyaverage
Australia MainlandChina
Hong Kong India Indonesia Malaysia NewZealand
Philippines Singapore Taiwan Vietnam
Cyberattack likely in 2021 Reviewed cybersecurity in past 6 months
47 | CPA AUSTRALIA ASIA-PACIFIC SMALL BUSINESS SURVEY 2020-21
Key findings The perceived threat of a cyberattack on the small businesses of the Asia-Pacific increased slightly in this survey from the previous survey. 38.5 per cent of businesses say that a cyberattack on their business in 2021 is likely, up from 37.5 per cent in 2020. Small businesses in Australia and New Zealand remain the least likely to expect a cyberattack, while small businesses from India and Indonesia are the most likely to expect a cyberattack. The higher uptake of technology by small business in those markets compared to Australia and New Zealand helps to explain that difference. A positive is that in nearly all markets, more businesses reviewed their cybersecurity in the past six months than believe their business is likely to be cyberattacked in 2021. However, there is significant room for improvement in India and Indonesia. Despite nearly seven in ten Indian small businesses expecting that they will be cyberattacked in 2021, only 51.0 per cent have checked their cybersecurity in the past six months. Indonesia has similar concerning results. Other findings: • Businesses with 5 to 19 employees are significantly more likely to have reviewed their cybersecurity in the
past six months than those with less than five employees. • Businesses where the respondent is aged under 40 are more likely to have reviewed their cybersecurity in
the past six months than those where the respondent is aged 50 or over. Similarly, younger respondents are more likely to expect that their business will be cyberattacked this year.
• Businesses that state they will innovate in 2021 are significantly more likely to believe they will be cyberattacked than those not expecting to innovate. Similarly, such innovative businesses are much more likely to have reviewed their cybersecurity in the past six months.
• Manufacturing businesses, ‘Information, media and telecommunications’ businesses and ‘Banking, finance or insurance’ businesses are the most likely to have reviewed their cybersecurity systems in the past six months.
• Manufacturing and ‘Information, media and telecommunications’ businesses are the most likely to expect to be cyberattacked in 2021.
• ‘Property and construction’ businesses and ‘Rental, hiring and real estate’ businesses are the least likely to expected to be cyberattacked this year
Suggestions: • Businesses of all sizes – and using varying levels of technology – are potentially vulnerable to cyberattack.
They should take appropriate action to reduce risk. • Businesses should consider seeking professional advice on what action they should take to reduce their
cyber risk. • Businesses should consider the tips on improving cybersecurity provided by government agencies, such as
the Australian Cyber Security Centre at cyber.gov.au. • Governments seeking to encourage innovation should provide targeted cybersecurity resources to
businesses to help them better manage their (perceived) increased risk of cyberattack.

48 | CPA AUSTRALIA ASIA-PACIFIC SMALL BUSINESS SURVEY 2020-21
SMALL BUSINESS CONDITIONS IN 2020
Businesses growth Businesses that grew in 2020 – by market
Businesses with revenue growth in 2020 – by market
33.9%
14.4%
17.8%
24.0%
29.0%
39.9%
42.7%
49.0%
39.9%
43.0%
46.5%
21.7%
12.3%
2.0%
4.5%
5.7%
6.5%
5.6%
8.3%
3.9%
17.6%
18.7%
16.8%
43.6%
0% 10% 20% 30% 40% 50% 60% 70%
Survey average
Hong Kong
Australia
New Zealand
Singapore
Taiwan
Malaysia
Mainland China
Indonesia
Philippines
Vietnam
India
Grew a little Grew strongly
34.8%
15.7%
18.7%
23.0%
32.2%
40.3%
37.2%
52.4%
44.0%
40.3%
47.4%
22.5%
13.3%
3.6%
6.5%
6.3%
6.8%
4.6%
16.3%
3.3%
11.9%
19.3%
18.7%
46.7%
0% 10% 20% 30% 40% 50% 60% 70%
Survey average
Hong Kong
Australia
New Zealand
Singapore
Taiwan
Indonesia
Mainland China
Malaysia
Philippines
Vietnam
India
Grew a little Grew strongly

49 | CPA AUSTRALIA ASIA-PACIFIC SMALL BUSINESS SURVEY 2020-21
Businesses that grew in 2020 – by age of respondent
Businesses that grew in 2020 compared to expectations for 2020 – by market
48.9%
39.0%
30.7%
19.8%
16.5%
16.0%
18.8%
8.8%
2.7%
2.7%
0% 10% 20% 30% 40% 50% 60% 70%
Under 30
30 to 39
40 to 49
50 to 59
60 +
Grew a little Grew strongly
46.2%
22.3%
52.9%
16.3%
65.2%
57.5%
51.0%
29.7%
61.7%
35.5%
45.5%
63.2%
68.2%
41.1%
79.4%
26.4%
82.0%
88.3%
72.3%
56.7%
93.4%
52.8%
53.2%
95.7%
Survey average
Australia
Mainland China
Hong Kong
India
Indonesia
Malaysia
New Zealand
Philippines
Singapore
Taiwan
Vietnam
Expected to grow in 2020 Grew in 2020

50 | CPA AUSTRALIA ASIA-PACIFIC SMALL BUSINESS SURVEY 2020-21
Key findings 2020 was a poor year for many small businesses across the region. 46.2 per cent reported growing in 2020, compared with 65.8 per cent in 2019. This is the lowest result since the beginning of the survey. Similarly, the percentage of small businesses that shrank in 2020 was the highest since the beginning of the survey. 31.3 per cent shrank last year, more than double the 14.5 per cent that shrank in 2019. It’s no surprise that COVID-19 was the major cause of this result. 57.1 per cent said COVID-19 had a major negative impact on their business in 2020, well ahead of the next most popular option, the related ‘poor overall economic environment’. For businesses that shrank last year, the issue that caused them the most difficulty by far was COVID-19 (70.1 per cent) Customer loyalty, cost control and good employees were the factors which most positively impacted business in 2020. The most popular positive influences on fast-growing businesses were improved customer satisfaction (37.4 per cent), customer loyalty (33.9 per cent) and improved business strategy (33.5 per cent). Vietnam’s small businesses recorded the largest fall in the number of businesses that grew in 2020 compared 2019. The number of Vietnamese small businesses that grew in 2020 was down 31.8 percentage points from 2019. Taiwan recorded the smallest fall, down 7.7 percentage points. It should be noted that the health impact of the pandemic on these markets was low in comparison to many others. Younger respondents remain far more likely to report that their business grew in 2020. 59.9 per cent of respondents aged under 40 reported growing last year, compared with 21.1 per cent of respondents aged 50 and over. Similarly, younger businesses remained far more likely to grow in 2020. 52.7 per cent of businesses established under 11 years grew last year, compared with 33.7 per cent of business established for 11 years or more. Other findings: • Small businesses with more employees are more likely to grow. 52.9 per cent of small businesses with five
to 19 employees grew last year, compared 36.9 per cent with under five employees. • Respondents who were the CEO or CFO were more likely to report their business grew last year than the
business owner: 53.4 per cent compared with 42.6 per cent. • ‘Information, media and telecommunication’ businesses (63.0 per cent) and ‘Banking, finance or insurance’
businesses (60.4 per cent) were the most likely to grow last year. • ‘Wholesale trade’ (42.2 per cent), ‘Arts and recreation services’ (39.8 per cent) and ‘Accommodation and
food services’ (37.4 per cent) were the sectors most likely to shrink last year. • Businesses selling online were far more likely to grow in 2020. 76.2 per cent of businesses that grew
strongly last year, received more than 10 per cent of their revenue through online sales, compared to 48.0 per cent that didn’t grow.
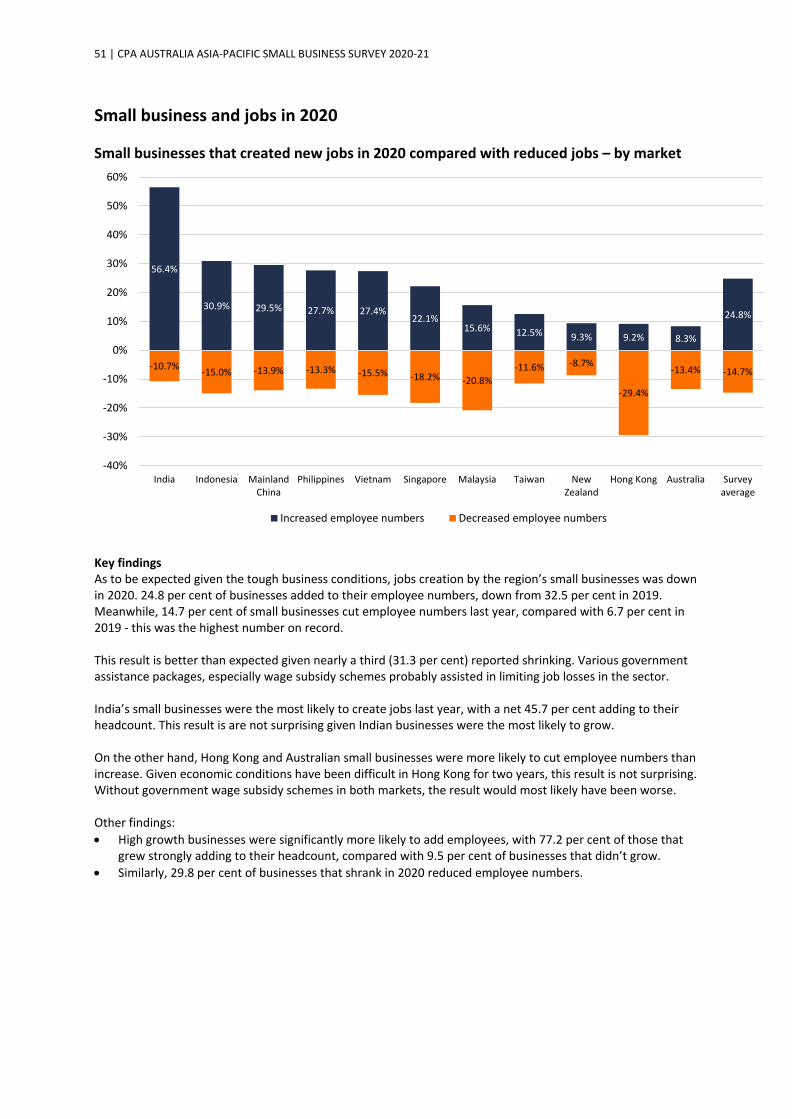
51 | CPA AUSTRALIA ASIA-PACIFIC SMALL BUSINESS SURVEY 2020-21
Small business and jobs in 2020 Small businesses that created new jobs in 2020 compared with reduced jobs – by market
Key findings As to be expected given the tough business conditions, jobs creation by the region’s small businesses was down in 2020. 24.8 per cent of businesses added to their employee numbers, down from 32.5 per cent in 2019. Meanwhile, 14.7 per cent of small businesses cut employee numbers last year, compared with 6.7 per cent in 2019 - this was the highest number on record. This result is better than expected given nearly a third (31.3 per cent) reported shrinking. Various government assistance packages, especially wage subsidy schemes probably assisted in limiting job losses in the sector. India’s small businesses were the most likely to create jobs last year, with a net 45.7 per cent adding to their headcount. This result is are not surprising given Indian businesses were the most likely to grow. On the other hand, Hong Kong and Australian small businesses were more likely to cut employee numbers than increase. Given economic conditions have been difficult in Hong Kong for two years, this result is not surprising. Without government wage subsidy schemes in both markets, the result would most likely have been worse. Other findings: • High growth businesses were significantly more likely to add employees, with 77.2 per cent of those that
grew strongly adding to their headcount, compared with 9.5 per cent of businesses that didn’t grow. • Similarly, 29.8 per cent of businesses that shrank in 2020 reduced employee numbers.
56.4%
30.9% 29.5% 27.7% 27.4%22.1%
15.6% 12.5% 9.3% 9.2% 8.3%
24.8%
-10.7% -15.0% -13.9% -13.3% -15.5% -18.2% -20.8%-11.6% -8.7%
-29.4%
-13.4% -14.7%
-40%
-30%
-20%
-10%
0%
10%
20%
30%
40%
50%
60%
India Indonesia MainlandChina
Philippines Vietnam Singapore Malaysia Taiwan NewZealand
Hong Kong Australia Surveyaverage
Increased employee numbers Decreased employee numbers
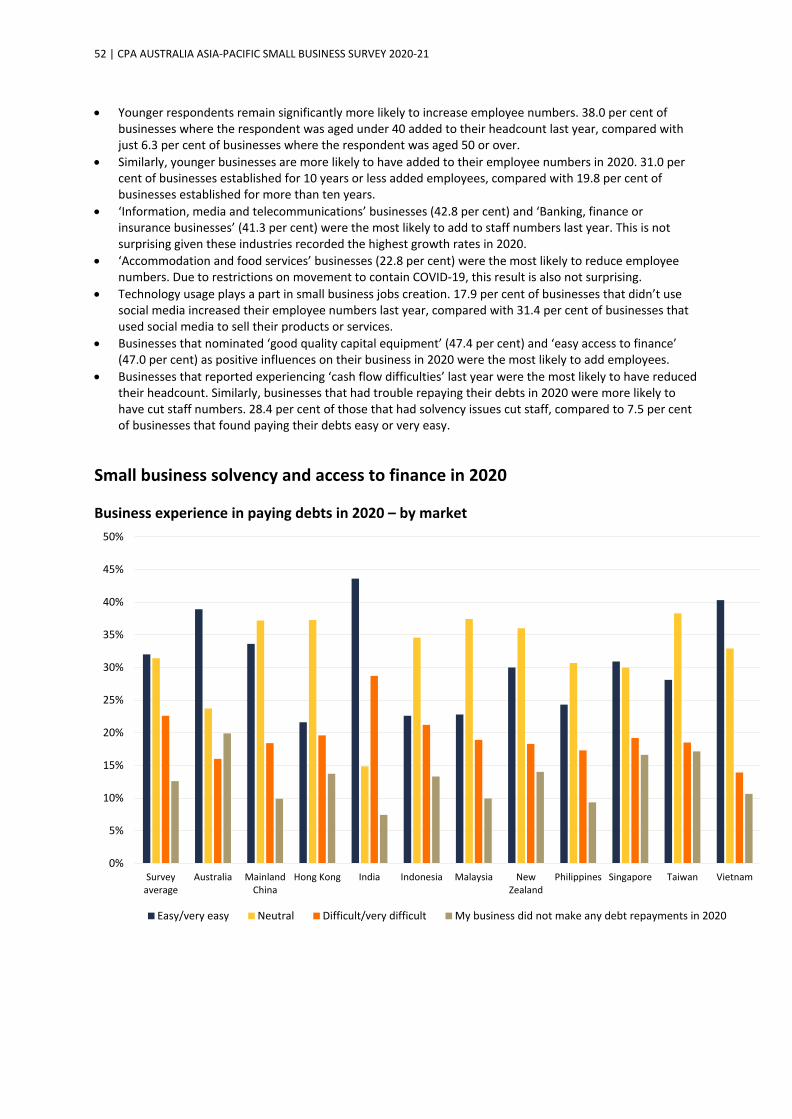
52 | CPA AUSTRALIA ASIA-PACIFIC SMALL BUSINESS SURVEY 2020-21
• Younger respondents remain significantly more likely to increase employee numbers. 38.0 per cent of businesses where the respondent was aged under 40 added to their headcount last year, compared with just 6.3 per cent of businesses where the respondent was aged 50 or over.
• Similarly, younger businesses are more likely to have added to their employee numbers in 2020. 31.0 per cent of businesses established for 10 years or less added employees, compared with 19.8 per cent of businesses established for more than ten years.
• ‘Information, media and telecommunications’ businesses (42.8 per cent) and ‘Banking, finance or insurance businesses’ (41.3 per cent) were the most likely to add to staff numbers last year. This is not surprising given these industries recorded the highest growth rates in 2020.
• ‘Accommodation and food services’ businesses (22.8 per cent) were the most likely to reduce employee numbers. Due to restrictions on movement to contain COVID-19, this result is also not surprising.
• Technology usage plays a part in small business jobs creation. 17.9 per cent of businesses that didn’t use social media increased their employee numbers last year, compared with 31.4 per cent of businesses that used social media to sell their products or services.
• Businesses that nominated ‘good quality capital equipment’ (47.4 per cent) and ‘easy access to finance’ (47.0 per cent) as positive influences on their business in 2020 were the most likely to add employees.
• Businesses that reported experiencing ‘cash flow difficulties’ last year were the most likely to have reduced their headcount. Similarly, businesses that had trouble repaying their debts in 2020 were more likely to have cut staff numbers. 28.4 per cent of those that had solvency issues cut staff, compared to 7.5 per cent of businesses that found paying their debts easy or very easy.
Small business solvency and access to finance in 2020 Business experience in paying debts in 2020 – by market
0%
5%
10%
15%
20%
25%
30%
35%
40%
45%
50%
Surveyaverage
Australia MainlandChina
Hong Kong India Indonesia Malaysia NewZealand
Philippines Singapore Taiwan Vietnam
Easy/very easy Neutral Difficult/very difficult My business did not make any debt repayments in 2020
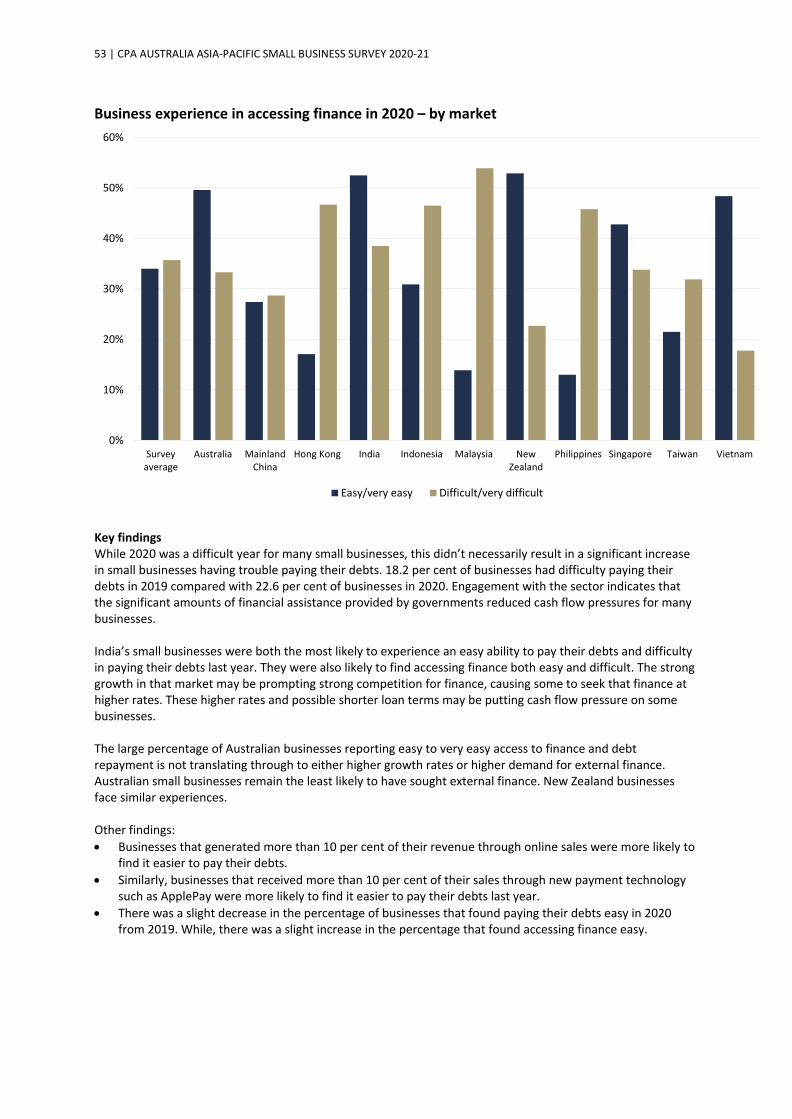
53 | CPA AUSTRALIA ASIA-PACIFIC SMALL BUSINESS SURVEY 2020-21
Business experience in accessing finance in 2020 – by market
Key findings While 2020 was a difficult year for many small businesses, this didn’t necessarily result in a significant increase in small businesses having trouble paying their debts. 18.2 per cent of businesses had difficulty paying their debts in 2019 compared with 22.6 per cent of businesses in 2020. Engagement with the sector indicates that the significant amounts of financial assistance provided by governments reduced cash flow pressures for many businesses. India’s small businesses were both the most likely to experience an easy ability to pay their debts and difficulty in paying their debts last year. They were also likely to find accessing finance both easy and difficult. The strong growth in that market may be prompting strong competition for finance, causing some to seek that finance at higher rates. These higher rates and possible shorter loan terms may be putting cash flow pressure on some businesses. The large percentage of Australian businesses reporting easy to very easy access to finance and debt repayment is not translating through to either higher growth rates or higher demand for external finance. Australian small businesses remain the least likely to have sought external finance. New Zealand businesses face similar experiences. Other findings: • Businesses that generated more than 10 per cent of their revenue through online sales were more likely to
find it easier to pay their debts. • Similarly, businesses that received more than 10 per cent of their sales through new payment technology
such as ApplePay were more likely to find it easier to pay their debts last year. • There was a slight decrease in the percentage of businesses that found paying their debts easy in 2020
from 2019. While, there was a slight increase in the percentage that found accessing finance easy.
0%
10%
20%
30%
40%
50%
60%
Surveyaverage
Australia MainlandChina
Hong Kong India Indonesia Malaysia NewZealand
Philippines Singapore Taiwan Vietnam
Easy/very easy Difficult/very difficult

54 | CPA AUSTRALIA ASIA-PACIFIC SMALL BUSINESS SURVEY 2020-21
• ‘Information, media and telecommunication’ businesses were the most likely to find paying their debts easy in 2020, reflecting the relatively positive year for the sector. Similarly, businesses from that sector were the most likely to have found accessing finance very easy.
• ‘Public administration and safety’ businesses were the most likely to have difficulty paying their debts in 2020, followed by ‘Accommodation and food services’ businesses.
Suggestions: • Small businesses seeking to grow should have a strong focus on technology, innovation and exporting. This
may require building their capabilities in those areas through training, professional advice and/ or recruitment.
• Governments seeking to support business recovery and growing the small business sector should have a strong policy focus on technology, innovation and exporting.
• Governments should implement policies that encourage younger people to buy or establish a business.
Major influences on business in 2020 Most popular positive influences on business in 2020 – by market (Multiple response, so figures will add up to over 100 per cent)
Most popular Second most popular Third most popular
Survey average Customer loyalty (32.6%) Cost control (24.5%) Good employees (22.9%)
Australia Customer loyalty (32.5%) Good employees (19.7%) COVID-19 (18.3%)
Mainland China Customer loyalty (29.4%) Government support/incentives (26.3%)
Improved customer satisfaction (25.9%)
Hong Kong Cost control (32.4%) Customer loyalty (26.8%) Government support/incentives (21.6%)
India Improved business strategy (35.7%)
Improved customer satisfaction (35.0%) Technology (34.8%)
Indonesia Customer loyalty (30.9%) Improved customer satisfaction (27.6%)
Improved business strategy (24.3%)
Malaysia Customer loyalty (42.4%) Cost control (27.5%) Good employees (25.8%) Improved business strategy (25.8%)
New Zealand Customer loyalty (38.7%) Good employees (23.0%) Government support/incentives (16.7%)
Philippines Customer loyalty (32.3%) Improved customer satisfaction (28.7%) Good employees (28.3%)
Singapore Government support/incentives (29.0%) COVID-19 (28.7%) Cost control (27.4%)
Taiwan COVID-19 (35.0%) Cost control (24.8%) Customer loyalty (22.8%)
Vietnam Customer loyalty (50.0%) Technology Improved customer satisfaction (32.9%)
E-commerce (32.3%)

55 | CPA AUSTRALIA ASIA-PACIFIC SMALL BUSINESS SURVEY 2020-21
Most popular positive influences on business in 2020 – by whether the business grew or not (Multiple response, so figures will add up to over 100 per cent)
Most popular Second most popular Third most popular
Grew strongly Improved customer satisfaction (37.4%) Customer loyalty (33.9%) Improved business strategy
(33.5%)
Grew a little Customer loyalty (35.2%) Improved customer satisfaction (29.7%) Good employees (28.5%)
Didn’t grow Customer loyalty (31.3%) Cost control (23.0%) COVID-19 (20.3%
Most popular negative influences on business in 2020 – by market (Multiple response, so figures will add up to over 100 per cent)
Most popular Second most popular Third most popular Fourth most popular
Survey average COVID-19 (57.1%) Poor overall economic environment (26.1%) Increasing costs (23.4%) Increasing competition
(21.8%)
Australia COVID-19 (57.8%) Poor overall economic environment (23.7%) Increasing costs (17.8%) Cash flow difficulties
(14.2%)
Mainland China COVID-19 (49.6%) Increasing costs (23.9%) Cash flow difficulties (22.3%)
Increasing competition (22.0%)
Hong Kong COVID-19 (52.6%) Poor overall economic environment (33.0%)
Political instability (28.4%)
Increasing costs Increasing competition (19.0%)
India COVID-19 (50.0%) Cash flow difficulties (36.9%)
Poor overall economic environment Increasing competition (34.4%)
Increasing costs (32.2%)
Indonesia COVID-19 (68.1%) Increasing competition (29.2%)
Poor overall economic environment (22.9%)
Political instability (20.9%)
Malaysia COVID-19 (66.9%) Increasing costs (27.8%)
Poor overall economic environment Increasing competition (26.5%)
Political instability (26.2%)
New Zealand COVID-19 (60.0%) Increasing costs (18.0%) Poor overall economic environment (16.7%)
Cash flow difficulties (14.7%)
Philippines COVID-19 (58.3%) Increasing costs (26.0%) Increasing competition (23.7%)
Cash flow difficulties (17.0%)
Singapore COVID-19 (54.7%) Poor overall economic environment (27.7%)
Increasing competition (24.1%)
Cash flow difficulties (21.2%)
Taiwan COVID-19 (44.9%) Poor overall economic environment (38.0%)
Difficulty expanding into new markets (21.5%) Increasing costs (20.5%)
Vietnam COVID-19 (81.3%) Poor overall economic environment (32.3%) Increasing costs (28.7%) Tax (27.7%)

56 | CPA AUSTRALIA ASIA-PACIFIC SMALL BUSINESS SURVEY 2020-21
Most popular negative influences on business in 2020 – by whether the business grew or not (Multiple response, so figures will add up to over 100 per cent)
Most popular Second most popular Third most popular Fourth most popular
Grew strongly COVID-19 (45.6%) Increasing competition (33.3%) Increasing costs (30.5%) Poor overall economic
conditions (26.2%)
Grew a little COVID-19 (56.4%) Increasing competition (26.0%) Increasing costs (24.4%) Poor overall economic
conditions (22.4%)
Didn’t grow COVID-19 (60.9%) Poor overall economic conditions (28.9%)
Increasing costs (21.6%) Cash flow difficulties (20.5%)
Key findings It’s no surprise that COVID-19 had the greatest impact on small businesses across the region last year. While the overwhelming majority found the pandemic had negative impacts on their business, 20.2 per cent said it had a positive impact. Health care businesses were the most likely to report the pandemic had a positive impact. Meanwhile, ‘rental, hiring and real estate’ businesses and ‘accommodation and food services’ businesses were the most likely to find it had a negative influence on their business. ‘Customer loyalty’ was the most popular positive influence on business last year. This is no surprise given that in challenging periods, businesses rely more heavily on existing customers than growing their market. However, businesses that grew strongly were more likely to benefit from improving customer satisfaction. To improve customer satisfaction, businesses should consider investments that helps them to better understand their customers, such as business intelligence and analytical software. Other findings: • Retailers were the most likely to report that e-commerce had a positive influence on them last year. • ‘Accommodation and food services’ businesses were the most likely to report that ‘customer loyalty’ and
‘improved customer satisfaction’ had a positive influence on them last year. • Businesses that reported difficulty accessing finance and borrowing for business survival last year were
more likely to have faced cash flow difficulties. • Businesses facing cash flow difficulties were also more likely to reduce employee numbers than increase
them last year. • Businesses that used social media were more likely to report that ‘improved customer satisfaction’ and ‘e-
commerce’ had a positive impact on them last year. • Younger respondents were more likely to have found that ‘improved customer satisfaction’ and ‘improved
business strategy’ had a positive influence on their business last year.

57 | CPA AUSTRALIA ASIA-PACIFIC SMALL BUSINESS SURVEY 2020-21
SMALL BUSINESS AND INNOVATION Small businesses that state they will innovate in the next 12 months - by market^ and year
^ The Philippines and Taiwan were added to this survey in 2018. India was added in 2019. Small businesses that state they will innovate in 2021 - by business growth expectations for that year
0%
10%
20%
30%
40%
50%
60%
Australia MainlandChina
Hong Kong India Indonesia Malaysia NewZealand
Philippines Singapore Taiwan Vietnam
2017 2018 2019 2020 2021
0% 10% 20% 30% 40% 50% 60% 70%
Shrink a lot in 2021
Shrink a little in 2021
Not change in 2021 from 2020
Grow a little in 2021
Grow Strongly in 2021
Will innovate May innovate No innovation planned
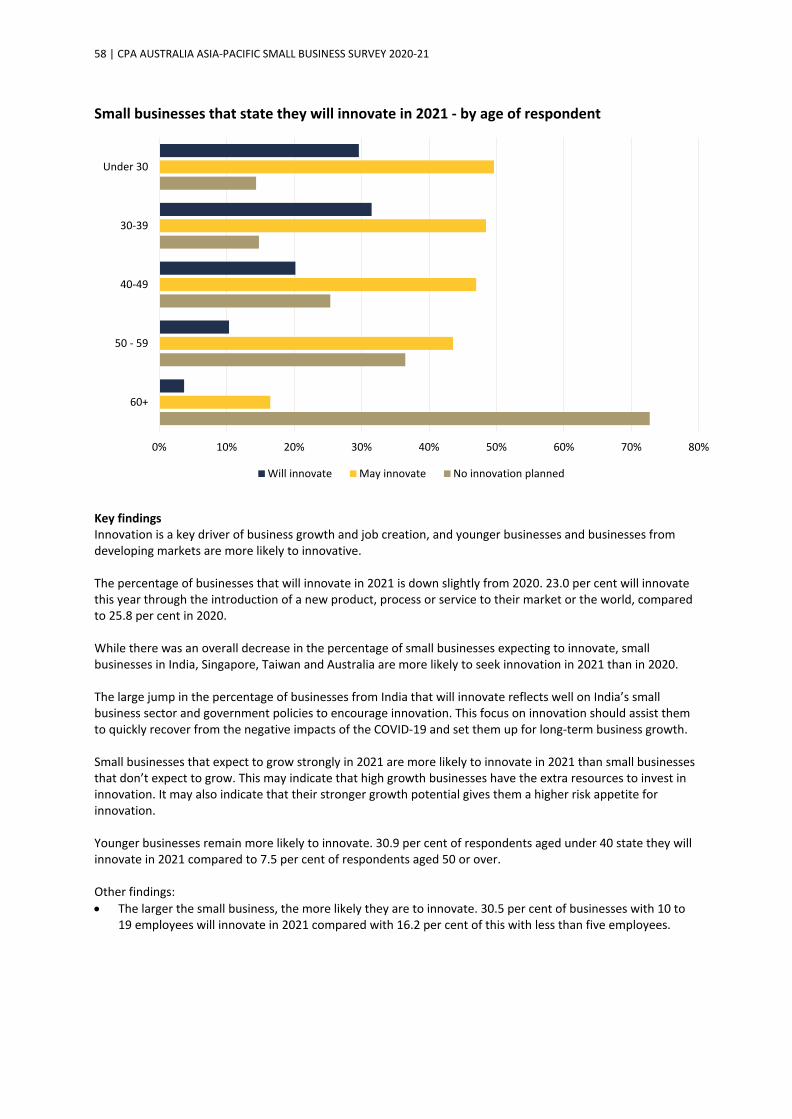
58 | CPA AUSTRALIA ASIA-PACIFIC SMALL BUSINESS SURVEY 2020-21
Small businesses that state they will innovate in 2021 - by age of respondent
Key findings Innovation is a key driver of business growth and job creation, and younger businesses and businesses from developing markets are more likely to innovative. The percentage of businesses that will innovate in 2021 is down slightly from 2020. 23.0 per cent will innovate this year through the introduction of a new product, process or service to their market or the world, compared to 25.8 per cent in 2020. While there was an overall decrease in the percentage of small businesses expecting to innovate, small businesses in India, Singapore, Taiwan and Australia are more likely to seek innovation in 2021 than in 2020. The large jump in the percentage of businesses from India that will innovate reflects well on India’s small business sector and government policies to encourage innovation. This focus on innovation should assist them to quickly recover from the negative impacts of the COVID-19 and set them up for long-term business growth. Small businesses that expect to grow strongly in 2021 are more likely to innovate in 2021 than small businesses that don’t expect to grow. This may indicate that high growth businesses have the extra resources to invest in innovation. It may also indicate that their stronger growth potential gives them a higher risk appetite for innovation. Younger businesses remain more likely to innovate. 30.9 per cent of respondents aged under 40 state they will innovate in 2021 compared to 7.5 per cent of respondents aged 50 or over. Other findings: • The larger the small business, the more likely they are to innovate. 30.5 per cent of businesses with 10 to
19 employees will innovate in 2021 compared with 16.2 per cent of this with less than five employees.
0% 10% 20% 30% 40% 50% 60% 70% 80%
60+
50 - 59
40-49
30-39
Under 30
Will innovate May innovate No innovation planned

59 | CPA AUSTRALIA ASIA-PACIFIC SMALL BUSINESS SURVEY 2020-21
• ‘Information, media and telecommunication’ businesses are the most likely to innovate in 2021 (39.7 per cent). ‘Administrative and support services’ businesses are the least likely to innovate (12.3 per cent).
• Younger businesses are again more likely to state they will innovate. Of the businesses that have been established for ten years or less, 26.1 per cent will innovate in 2021, while only 12.0 per cent of businesses established more than 20 years will innovate.
• Exporting businesses are more likely to innovate 66.2 per cent of businesses that expect their overseas sales revenue to grow strongly in 2021 will innovate in 2021, compared with 12.0 per cent businesses that don’t expect to sell into overseas markets.
• There is a link between cybersecurity concerns and innovation. 72.4 per cent of businesses that believe it very likely their business will be cyberattacked in 2021, will innovate this year, compared with 11.5 per cent that believe a cyberattack on their business is unlikely.
• Of the five cities from India surveyed, business in Delhi/Gurgaon are by far the most likely to state they will innovate in 2021 (82.1 per cent compared with 59.2 per cent in Chennai).
• Of the five cities from Mainland China surveyed, businesses in Chongqing are the most likely to state they will innovate in 2021 (27.7 per cent).
Suggestions: • Policy makers wanting to encourage innovation should consider how best to encourage young people to
start or buy their own small business. • Innovative businesses need to invest more in cybersecurity and governments should be offering
information to assist them. • Businesses seeking to innovate should spend time investigating what other businesses in their industry and
other industries are doing, including in other markets. • Businesses not innovating may wish to partner with innovative businesses.

60 | CPA AUSTRALIA ASIA-PACIFIC SMALL BUSINESS SURVEY 2020-21
SMALL BUSINESS EXPECTATIONS FOR 2021
Small business growth expectations Small business growth - experience in 2020 and expectations for 2021 - by market
Small business growth expectations in 2021 – a comparison by market
0%
10%
20%
30%
40%
50%
60%
70%
80%
90%
2020 2021 2020 2021 2020 2021 2020 2021 2020 2021 2020 2021 2020 2021 2020 2021 2020 2021 2020 2021 2020 2021
Malaysia Singapore Vietnam Indonesia Philippines India MainlandChina
Taiwan Hong Kong Australia NewZealand
Grow a little Grow strongly
40.7%
19.0%
33.9%
32.0%
38.1%
47.5%
54.7%
43.4%
34.0%
43.5%
58.1%
32.0%
20.1%
2.3%
7.5%
12.0%
15.0%
8.6%
5.5%
23.2%
39.3%
32.6%
28.1%
54.7%
0% 10% 20% 30% 40% 50% 60% 70% 80% 90%
Survey average
Hong Kong
Australia
New Zealand
Singapore
Taiwan
Mainland China
Malaysia
Philippines
Indonesia
Vietnam
India
Grow a little Grow strongly

61 | CPA AUSTRALIA ASIA-PACIFIC SMALL BUSINESS SURVEY 2020-21
Small businesses that expect to grow in the next 12 months – a comparison by market and over time
Key findings 2021 should be a more positive year for the region’s small businesses. In all markets, the number of businesses that expect to grow this year is higher than the number that grew last year. There is however a high level of uncertainty around this outlook, although this uncertainty appears to be diminishing at the time of writing. The outlook is dependent on many factors, especially the successful roll out of vaccines and efforts to control the pandemic before then. It also relies on governments not withdrawing support for the economy too early. It’s better to deal with the consequences of providing support for too long withdrawing it too early. The strong performance of India’s small business sector in 2020 should continue and accelerate in 2021. Not only are India’s small businesses the most likely to grow in 2021, they are by far the most likely to grow strongly. 54.7 per cent of Indian small businesses expect to grow strongly this year, significantly higher than the survey average of 20.1 per cent. While Hong Kong’s small businesses are slightly more confident in 2021, they remain the least likely to expect to grow. With only 21.2 per cent of businesses expecting to grow, this is significantly lower than the survey average of 60.8 per cent. Similarly, Hong Kong businesses are the most likely to shrink, although less so than in 2020. 45.5 per cent of Hong Kong’s businesses expect to shrink in 2021, down from 58.5 per cent that shrank last year. This compares to the survey average of 15.6 per cent expecting to shrink. All sectors are looking forward to a stronger 2021. This is especially so for businesses in some of the hardest hit sectors during the pandemic – ‘Arts and recreation services’, ‘Accommodation and food services’ and ‘retail trade’.
10%
20%
30%
40%
50%
60%
70%
80%
90%
100%
2010 2011 2012 2013 2014 2015 2016 2017 2018 2019 2020 2021Australia Mainland China Hong Kong India
Indonesia Malaysia New Zealand Philippines
Singapore Taiwan Vietnam
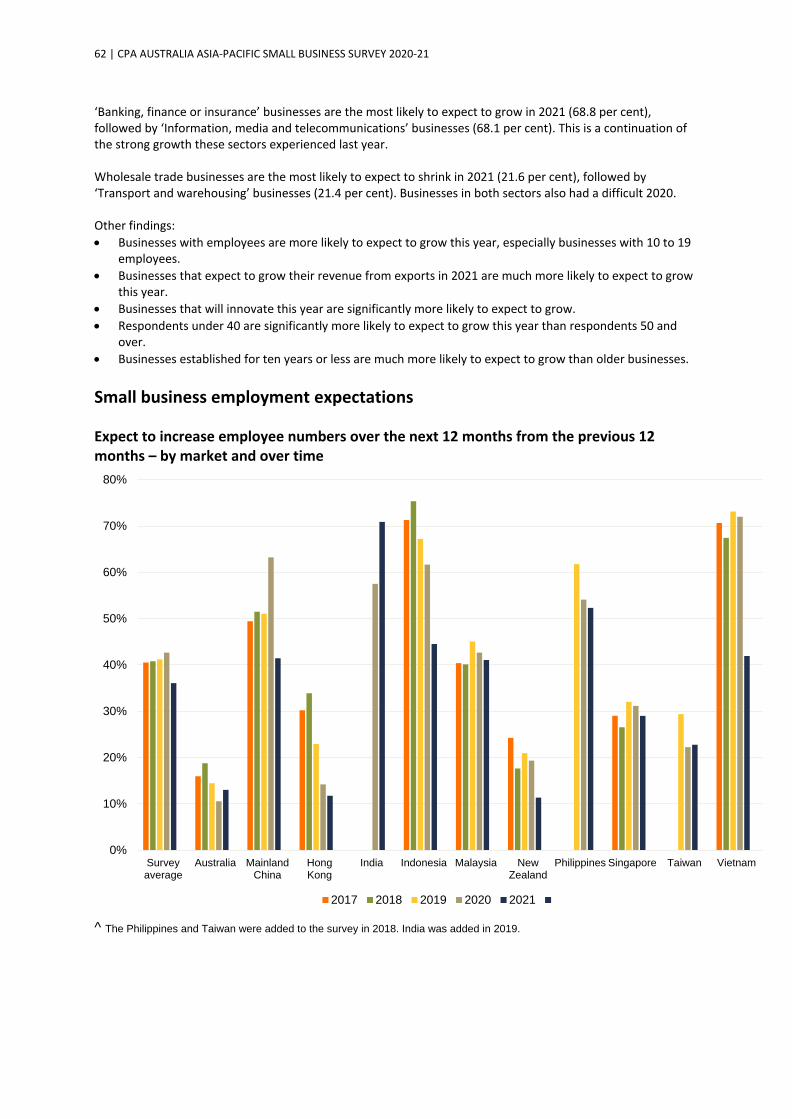
62 | CPA AUSTRALIA ASIA-PACIFIC SMALL BUSINESS SURVEY 2020-21
‘Banking, finance or insurance’ businesses are the most likely to expect to grow in 2021 (68.8 per cent), followed by ‘Information, media and telecommunications’ businesses (68.1 per cent). This is a continuation of the strong growth these sectors experienced last year. Wholesale trade businesses are the most likely to expect to shrink in 2021 (21.6 per cent), followed by ‘Transport and warehousing’ businesses (21.4 per cent). Businesses in both sectors also had a difficult 2020. Other findings: • Businesses with employees are more likely to expect to grow this year, especially businesses with 10 to 19
employees. • Businesses that expect to grow their revenue from exports in 2021 are much more likely to expect to grow
this year. • Businesses that will innovate this year are significantly more likely to expect to grow. • Respondents under 40 are significantly more likely to expect to grow this year than respondents 50 and
over. • Businesses established for ten years or less are much more likely to expect to grow than older businesses. Small business employment expectations Expect to increase employee numbers over the next 12 months from the previous 12 months – by market and over time
^ The Philippines and Taiwan were added to the survey in 2018. India was added in 2019.
0%
10%
20%
30%
40%
50%
60%
70%
80%
Surveyaverage
Australia MainlandChina
HongKong
India Indonesia Malaysia NewZealand
Philippines Singapore Taiwan Vietnam
2017 2018 2019 2020 2021
63 | CPA AUSTRALIA ASIA-PACIFIC SMALL BUSINESS SURVEY 2020-21
Key findings A better 2021 for the region’s small businesses is expected to positively impact jobs. In all markets, businesses are more likely to expect to add employees this year than added employees last year. Similarly, in all markets, businesses are less likely to anticipate reducing their headcount this year than cut employees last year. This is especially the case in Hong Kong, where only 4.6 per cent of businesses expect to reduce employee numbers in 2021, compared with the 29.4 per cent that cut employees in 2020. However, while 2021 is expected to be a better year for the region’s small business, challenging economic conditions and uncertainty are resulting in the sector being somewhat less likely to expect to add employees this year when compared to expectations from previous years. Reflecting strong growth expectations, Indian small businesses are the most likely to expect to add employees this year, while New Zealand small businesses are the least likely. Other findings: • Not surprisingly, businesses that expect to grow strongly are significantly more likely to expect to add
employees this year. • ‘Information, media and communications’ businesses are the most likely to expect to add employees this
year. 54.5 per cent of such businesses expect to add employees this year compared to the survey average of 36.1 per cent
• Wholesale trade businesses are the least likely to expect to add employees (25.2 per cent), and the most likely to expect to reduce employees (15.2 per cent).
• Businesses that expect it will be very difficult to repay their debts in 2021 are the most likely to cut employees this year.
• Confidence in the local economy is a big influence on whether a business will recruit additional employees. 73.8 per cent of businesses that expect their local economy to grow strongly anticipate adding employees this year, compared with 39.5 per cent that expect their economy to grow a little and 15.0 per cent that don’t expect it to grow.
• Exporting businesses are far more likely to recruit extra employees. 55.2 per cent of businesses that expect their revenue from exports will grow anticipate adding employees this year, compared with 26.4 per cent that don’t expect to export.
• Innovative businesses are far more likely to add employees. 69.7 per cent of businesses that say they will innovate in 2021, expect to recruit additional employees this year, compared with 11.9 per cent that say they will not innovate.
• Age of the respondent influences expectations for adding employees. 48.6 per cent of respondents under 40 expect their business will add employees this year, compared with 13.2 per cent of respondents 50 and over.
• Similarly, businesses established for ten years of less are more likely to expect to add to their headcount this year (42.0 per cent) than more established businesses (25.2 per cent).
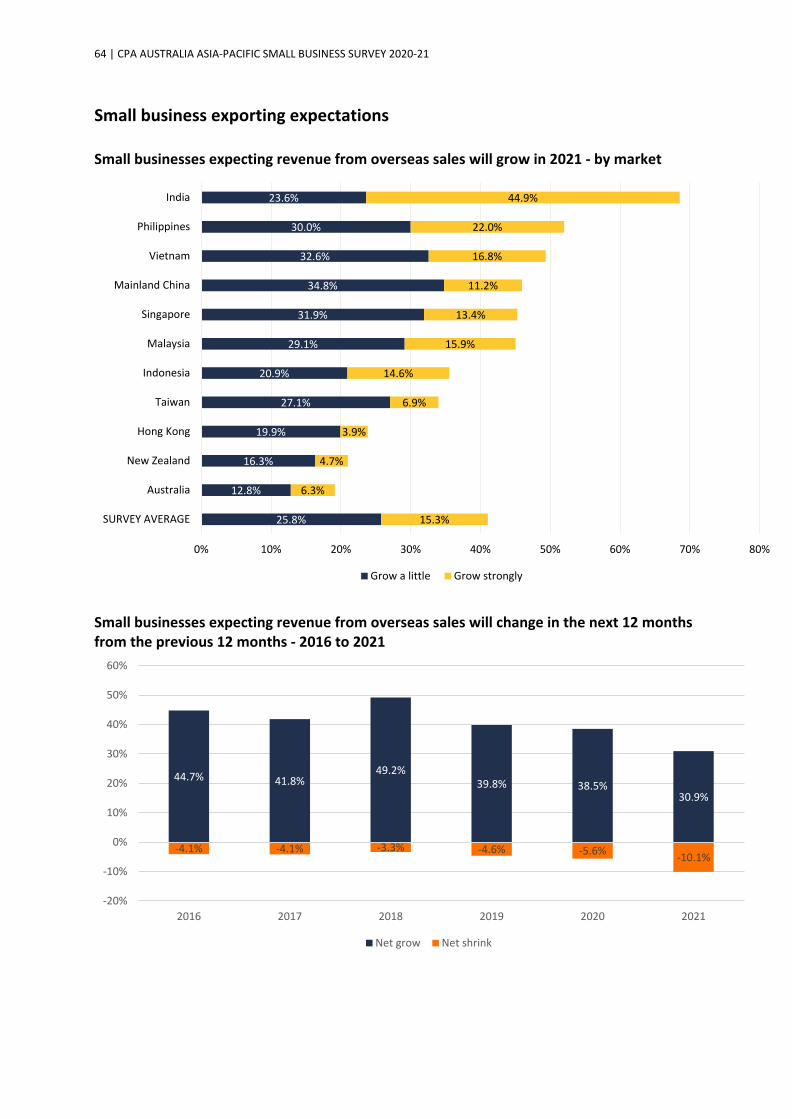
64 | CPA AUSTRALIA ASIA-PACIFIC SMALL BUSINESS SURVEY 2020-21
Small business exporting expectations Small businesses expecting revenue from overseas sales will grow in 2021 - by market
Small businesses expecting revenue from overseas sales will change in the next 12 months from the previous 12 months - 2016 to 2021
25.8%
12.8%
16.3%
19.9%
27.1%
20.9%
29.1%
31.9%
34.8%
32.6%
30.0%
23.6%
15.3%
6.3%
4.7%
3.9%
6.9%
14.6%
15.9%
13.4%
11.2%
16.8%
22.0%
44.9%
0% 10% 20% 30% 40% 50% 60% 70% 80%
SURVEY AVERAGE
Australia
New Zealand
Hong Kong
Taiwan
Indonesia
Malaysia
Singapore
Mainland China
Vietnam
Philippines
India
Grow a little Grow strongly
44.7% 41.8%49.2%
39.8% 38.5%30.9%
-4.1% -4.1% -3.3% -4.6% -5.6% -10.1%
-20%
-10%
0%
10%
20%
30%
40%
50%
60%
2016 2017 2018 2019 2020 2021
Net grow Net shrink
65 | CPA AUSTRALIA ASIA-PACIFIC SMALL BUSINESS SURVEY 2020-21
Key findings It appears that the region’s small business confidence in the global economy is down only slightly this year. 41.1 per cent expect revenue from exports to increase this year, compared with the average for the previous three years of 46.5 per cent. Further, only 10.1 per cent expect their export revenue to decrease. India’s small businesses won’t just be relying on their domestic market for growth this year. They’re the most likely to expect their revenue from overseas sales to grow in 2021. 68.6 per cent of Indian small businesses anticipate their revenue from overseas sales will grow this year, much higher than the survey average of 41.1 per cent. On the other hand, small businesses from Australia and New Zealand remain the least likely to expect to sell into overseas markets this year. 53.6 per cent of Australian small businesses and 49.3 per cent of New Zealand small businesses don’t anticipate exporting in 2021, compared with the survey average of 28.8 per cent. Not surprisingly, businesses that expect to grow this year are much more likely to anticipate their revenue from exports will grow. 54.5 per cent of businesses that believe they will grow forecast their export revenue to grow, compared with 21.8 per cent of businesses that don’t expect to grow. It should be noted that businesses not expecting to grow are only a little more focused on their domestic market. 30.7 per cent of businesses not anticipating they will grow this year, won’t be selling into overseas markets, compared with 27.0 per cent that expect to grow. Other findings: • Businesses with no staff are significantly less likely to expect to sell overseas in 2021. 47.8 per cent don’t
anticipate selling overseas this year, compared with 21.5 per cent of businesses with 5 to 19 staff. • ‘Agriculture, forestry and fishing’ businesses are the most likely not to export in 2021. • ‘Information, media and telecommunications’ businesses are the most likely to expect an increase in their
export revenue this year. • Older respondents are much more likely to not expect to sell overseas in 2021. 55.0 per cent of
respondents aged 60 and over don’t expect to sell overseas this year compared with 22.5 per cent of respondents aged under 40.
• Businesses that will innovate in 2021 are much more likely to expect their export revenue to increase. 71.5 per cent of businesses that will innovate believe their export revenue will increase this year, compared with 12.6 per cent that won’t innovate.
• Businesses that expect their revenue from exports to increase are more likely to have invested in Artificial Intelligence, business intelligence and analytical software, data visualisation software, customer relationship software and enterprise resource planning software than those not anticipating that they will export.

66 | CPA AUSTRALIA ASIA-PACIFIC SMALL BUSINESS SURVEY 2020-21
Small business solvency expectations Business expectation for the ease of paying their debts in 2021 – by market
Key findings The region’s small businesses are most likely to expect that meeting their debt obligations this year will be easy or neutral. This may change as government support payments are withdrawn. The survey results and engagement with the sector indicate that government support payments such as wage subsidy payments and direct grants helped improve cash flow and the solvency of many businesses last year. What is uncertain is the impact their withdrawal or reduction may have on business solvency this year. The expectations for 2021 is almost identical to the experiences business had in 2020. 31.7 per cent of businesses expect it will be easy to repay their debts this year, compared to 32.0 per cent last year. Similarly, 22.7 per cent of businesses anticipate facing difficulty in repaying their debts this year compared to 22.6 per cent last year. Indian small businesses are the most likely to expect it will be easy to repay their debts in 2021. However, they are also one of the most likely to expect to face difficulty repaying debts. This possibly indicates that the expected high growth in India is creating more competition for external finance, leading to some small businesses having to go to short term lenders charging higher rates, putting additional pressure on those businesses. This is reflected in Indian businesses being by far the most likely to nominate borrowing costs as a major impost on their business. Solvency issues appear most concerning in Philippines, Malaysia and Hong Kong. Governments in those markets should be looking at steps that might reduce cash flow pressure such as a continuation of government support payments plus further actions to stimulate the local economy.
23.5%28.0%
36.8%
25.6% 21.7%
47.7%
33.5%28.1%
19.6%
37.9%29.0%
-31.8%-24.8%
-17.1%-23.9%
-32.3% -29.9%
-18.1% -14.2%
-27.7%
-15.8%-21.0%
Malaysia Singapore Vietnam Indonesia Philippines India MainlandChina
Taiwan Hong Kong Australia New Zealand
Easy/very easy Difficult/very difficult

67 | CPA AUSTRALIA ASIA-PACIFIC SMALL BUSINESS SURVEY 2020-21
Access to finance appears to be a big influence on potential solvency issues. 57.2 per cent of businesses that anticipate facing difficulty accessing funds in 2021 expect problems repaying their debts, compared with 5.4 per cent of businesses that believe access to finance will be easy. Not surprisingly, high growth businesses are more likely to expect an easy time meeting their debt obligations this year. 44.1 per cent of businesses that anticipate growing strongly in 2021, believe it will be easy for them to pay their debts, compared with 22.6 per cent of businesses that don’t expect to grow.
Other findings:
• Businesses with 10 to 19 employees are more likely to believe paying their debt obligations will be easy this year. 41.6 per cent of businesses with 10 to 19 staff expect it will be easy to pay their debts in 2021 compared with 26.9 per cent for businesses with nine employees or less.
• ‘Information, media and telecommunication’ businesses are the most likely to anticipate that it will be easy to pay their debts this year.
• ‘Public administration and safety’ businesses are the most likely to believe it will be difficult for them to pay their debts this year.
• Businesses that expect to borrow for business survival are more likely to anticipate it will be difficult to repay their debts this year (33.7 per cent), than businesses that are borrowing for growth (23.3 per cent).
• COVID-19 will continue to impact business solvency this year. 30.0 per cent of businesses that believe it will take them more than a year to recover from COVID-19, expect to face difficulty repaying their debts this year compared with 12.5 per cent of businesses that have already recovered.
Suggestions: • Businesses seeking to grow should spend time investigating new markets, including accessing government
support for exporting. • Governments should continue to create new free trade agreements with other governments. • Governments will need to be mindful of the impacts of the withdrawal of small business support programs.
Where appropriate they should consider a gradual decrease in support to reduce the risk of negative business and economic consequences.

68 | CPA AUSTRALIA ASIA-PACIFIC SMALL BUSINESS SURVEY 2020-21
ACCESS TO FINANCE
Ease of access to finance varies significantly between markets Percentage of businesses that required external finance in the past 12 months – by market and year^
^ The Philippines and Taiwan were added to the survey in 2018. India was added in 2019. Of businesses that required external finance, percentage that experienced easy to very easy financing conditions in the past 12 months – by market^ and year
^ The Philippines and Taiwan were added to the survey in 2018. India was added in 2019.
0%
10%
20%
30%
40%
50%
60%
70%
80%
90%
100%
Australia MainlandChina
Hong Kong India Indonesia Malaysia NewZealand
Philippines Singapore Taiwan Vietnam
2016 2017 2018 2019 2020
0%
10%
20%
30%
40%
50%
60%
Australia MainlandChina
Hong Kong India Indonesia Malaysia New Zealand Philippines Singapore Taiwan Vietnam
2016 2017 2018 2019 2020
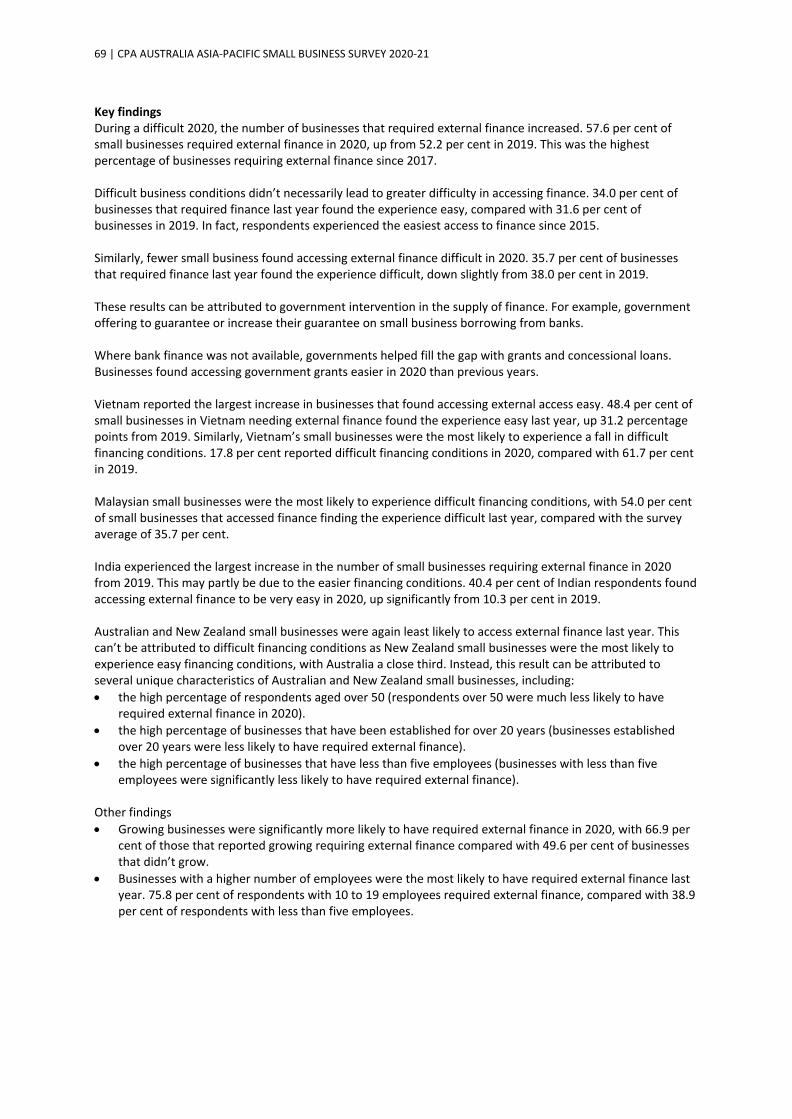
69 | CPA AUSTRALIA ASIA-PACIFIC SMALL BUSINESS SURVEY 2020-21
Key findings During a difficult 2020, the number of businesses that required external finance increased. 57.6 per cent of small businesses required external finance in 2020, up from 52.2 per cent in 2019. This was the highest percentage of businesses requiring external finance since 2017. Difficult business conditions didn’t necessarily lead to greater difficulty in accessing finance. 34.0 per cent of businesses that required finance last year found the experience easy, compared with 31.6 per cent of businesses in 2019. In fact, respondents experienced the easiest access to finance since 2015. Similarly, fewer small business found accessing external finance difficult in 2020. 35.7 per cent of businesses that required finance last year found the experience difficult, down slightly from 38.0 per cent in 2019. These results can be attributed to government intervention in the supply of finance. For example, government offering to guarantee or increase their guarantee on small business borrowing from banks. Where bank finance was not available, governments helped fill the gap with grants and concessional loans. Businesses found accessing government grants easier in 2020 than previous years. Vietnam reported the largest increase in businesses that found accessing external access easy. 48.4 per cent of small businesses in Vietnam needing external finance found the experience easy last year, up 31.2 percentage points from 2019. Similarly, Vietnam’s small businesses were the most likely to experience a fall in difficult financing conditions. 17.8 per cent reported difficult financing conditions in 2020, compared with 61.7 per cent in 2019. Malaysian small businesses were the most likely to experience difficult financing conditions, with 54.0 per cent of small businesses that accessed finance finding the experience difficult last year, compared with the survey average of 35.7 per cent. India experienced the largest increase in the number of small businesses requiring external finance in 2020 from 2019. This may partly be due to the easier financing conditions. 40.4 per cent of Indian respondents found accessing external finance to be very easy in 2020, up significantly from 10.3 per cent in 2019. Australian and New Zealand small businesses were again least likely to access external finance last year. This can’t be attributed to difficult financing conditions as New Zealand small businesses were the most likely to experience easy financing conditions, with Australia a close third. Instead, this result can be attributed to several unique characteristics of Australian and New Zealand small businesses, including: • the high percentage of respondents aged over 50 (respondents over 50 were much less likely to have
required external finance in 2020). • the high percentage of businesses that have been established for over 20 years (businesses established
over 20 years were less likely to have required external finance). • the high percentage of businesses that have less than five employees (businesses with less than five
employees were significantly less likely to have required external finance).
Other findings • Growing businesses were significantly more likely to have required external finance in 2020, with 66.9 per
cent of those that reported growing requiring external finance compared with 49.6 per cent of businesses that didn’t grow.
• Businesses with a higher number of employees were the most likely to have required external finance last year. 75.8 per cent of respondents with 10 to 19 employees required external finance, compared with 38.9 per cent of respondents with less than five employees.
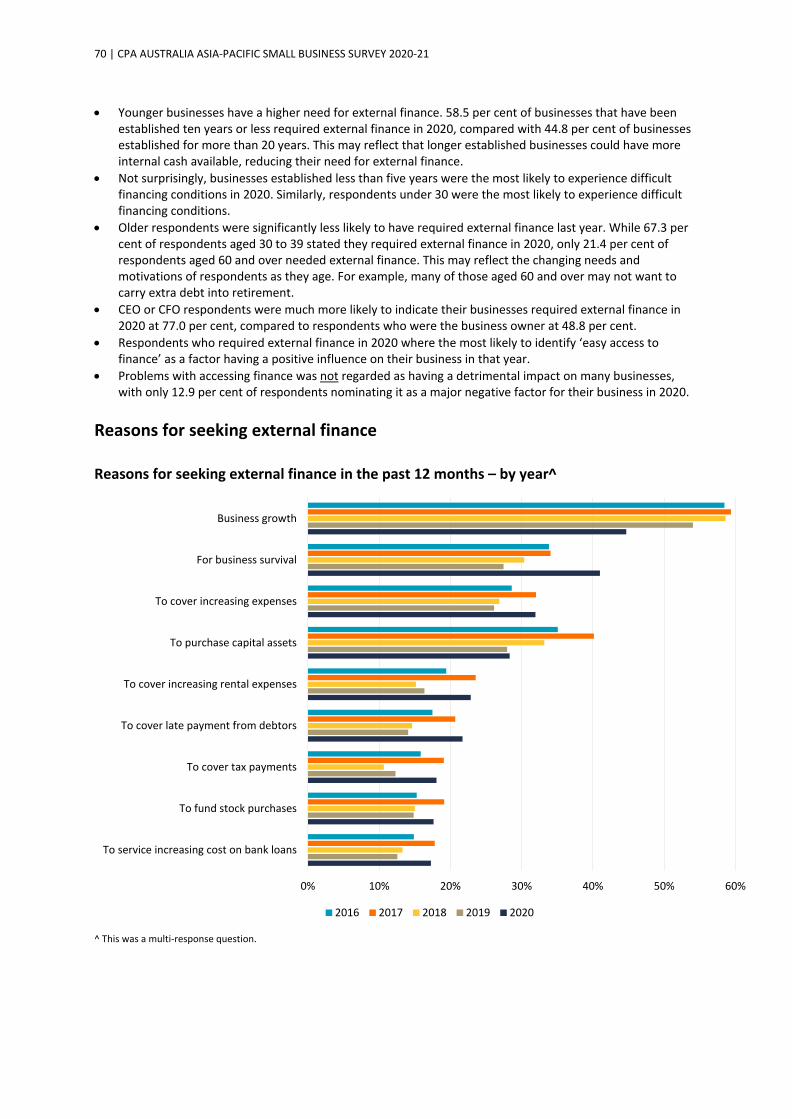
70 | CPA AUSTRALIA ASIA-PACIFIC SMALL BUSINESS SURVEY 2020-21
• Younger businesses have a higher need for external finance. 58.5 per cent of businesses that have been established ten years or less required external finance in 2020, compared with 44.8 per cent of businesses established for more than 20 years. This may reflect that longer established businesses could have more internal cash available, reducing their need for external finance.
• Not surprisingly, businesses established less than five years were the most likely to experience difficult financing conditions in 2020. Similarly, respondents under 30 were the most likely to experience difficult financing conditions.
• Older respondents were significantly less likely to have required external finance last year. While 67.3 per cent of respondents aged 30 to 39 stated they required external finance in 2020, only 21.4 per cent of respondents aged 60 and over needed external finance. This may reflect the changing needs and motivations of respondents as they age. For example, many of those aged 60 and over may not want to carry extra debt into retirement.
• CEO or CFO respondents were much more likely to indicate their businesses required external finance in 2020 at 77.0 per cent, compared to respondents who were the business owner at 48.8 per cent.
• Respondents who required external finance in 2020 where the most likely to identify ‘easy access to finance’ as a factor having a positive influence on their business in that year.
• Problems with accessing finance was not regarded as having a detrimental impact on many businesses, with only 12.9 per cent of respondents nominating it as a major negative factor for their business in 2020.
Reasons for seeking external finance Reasons for seeking external finance in the past 12 months – by year^
^ This was a multi-response question.
0% 10% 20% 30% 40% 50% 60%
To service increasing cost on bank loans
To fund stock purchases
To cover tax payments
To cover late payment from debtors
To cover increasing rental expenses
To purchase capital assets
To cover increasing expenses
For business survival
Business growth
2016 2017 2018 2019 2020

71 | CPA AUSTRALIA ASIA-PACIFIC SMALL BUSINESS SURVEY 2020-21
Key findings While business growth remains the most popular reason for requiring external finance in 2020, it was down from 2019. 44.7 per cent of respondents sourced finance last year to help with growth, compared with 54.0 per cent in 2019. Small businesses from India (58.3 per cent) were the most likely to have required external finance to fund business growth, while small businesses from New Zealand (11.8 per cent) were the least likely to have required external finance for growth. Reflecting tougher trading conditions brought on by COVID-19, borrowing for business survival jumped. 41.0 per cent sought external finance for business survival in 2020, up from 27.5 per cent in 2019. This reflects the more challenging business environment due to COVID-19. Reflecting the successful management of the pandemic in Vietnam, small businesses from that market were the least likely to require external finance for business survival (16.0 per cent). Small businesses in Indonesia were the most likely to require external finance for business survival (51.6 per cent). New Zealand registered the largest increase in the percentage of businesses that sought external finance for business survival. 49.6 per cent of small businesses required funds for survival last year, up 32.1 percentage points from 2019. Small businesses from India were the most likely to state that they required external finance in 2020 to purchase capital assets (44.4 per cent). While New Zealand small businesses were the least likely to cite this as a major reason for accessing finance (5.9 per cent). Other findings: • The number of businesses that stated they required external finance to cover increasing expenses
increased most in India (jumping from 16.9 per cent in 2019 to 50.2 per cent in 2020), while it declined the most in Vietnam (43.2 per cent in 2019 to 30.2 per cent in 2020).
• Businesses established ten years or less were more likely to have required external finance for growth in 2020 (49.1 per cent).
• Businesses with 10 to 19 employees were more likely to have required external finance for growth (50.8 per cent).
• Younger respondents were the most likely to have required external finance for business growth. 51.2 per cent of respondents aged 30 to 39 required finance for growth, compared with only 19.5 per cent of respondents aged 60 and over. This may be due to the possible higher risk appetite of younger respondents. Older respondents may be preparing their business for sale or succession and don’t want to take on additional debt.
• Respondents aged 60 and over were the most likely to require finance for business survival. 52.9 per cent of respondents aged 60 and over sought finance for business survival, compared with 40.6 per cent of respondents aged under 60.
• Businesses from the ‘information, media and telecommunication’ sector were the most likely to have required external finance for business growth (53.4 per cent).
• Businesses from the ‘arts and recreation services’ sector were the most likely to have required external finance for business survival (50.5 per cent).

72 | CPA AUSTRALIA ASIA-PACIFIC SMALL BUSINESS SURVEY 2020-21
Main sources of external finance The major source of external finance in the past 12 months – by year^
^ Single choice only.
Ease or difficulty of accessing finance in 2020 – by source
0% 5% 10% 15% 20% 25% 30% 35% 40% 45%
Peer-to-peer lending
Crowd-sourced funding
Venture capital fund/angel financing
Non-bank financial institution
Your personal resources
Government grant
An investor
Friends or family
Bank
2016 2017 2018 2019 2020
37.9%
23.9%
22.7%
41.6%
21.0%
33.3%
47.1%
59.6%
39.5%
-32.1%
-44.3%
-36.9%
-42.8%
-39.5%
-34.4%
-28.9%
-21.2%
-34.9%
-60% -40% -20% 0% 20% 40% 60% 80%
Bank
Friends or family
Personal resources
Non-bank financial institution
Investor
Government grant
Venture capital fund
Crowd-sourced funding
Peer-to-peer lending
Easy/Very easy Difficult/very difficult
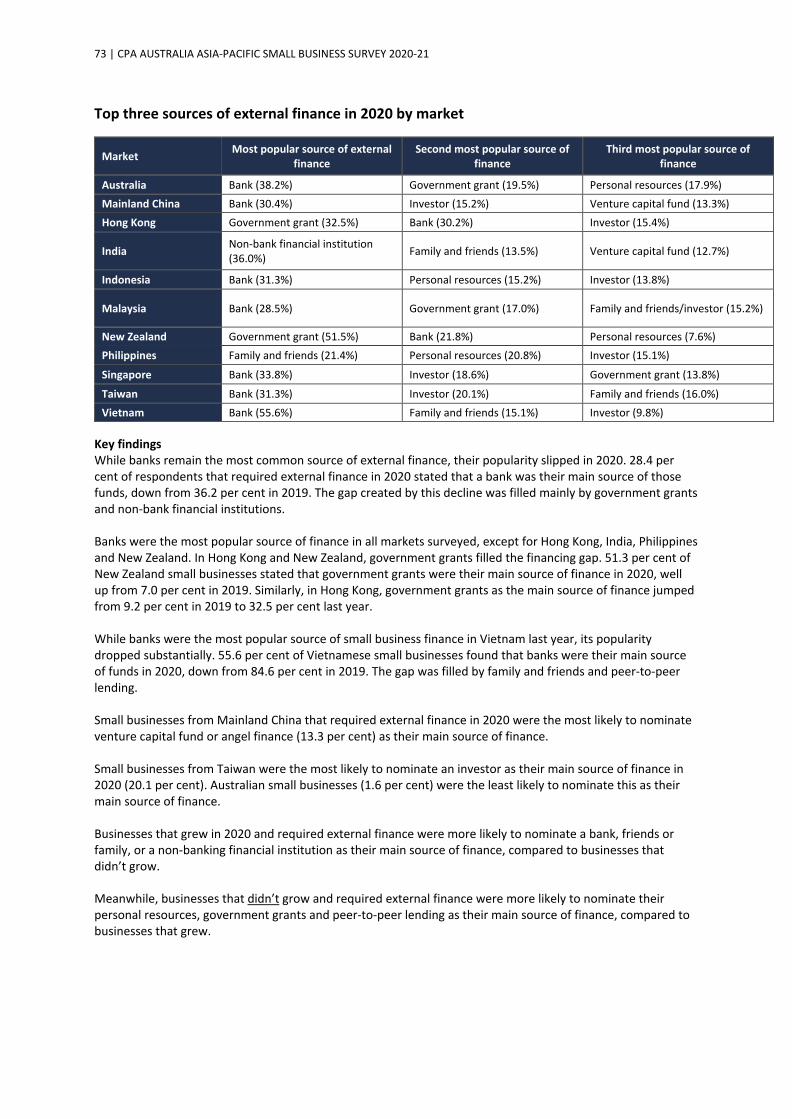
73 | CPA AUSTRALIA ASIA-PACIFIC SMALL BUSINESS SURVEY 2020-21
Top three sources of external finance in 2020 by market
Market Most popular source of external finance
Second most popular source of finance
Third most popular source of finance
Australia Bank (38.2%) Government grant (19.5%) Personal resources (17.9%) Mainland China Bank (30.4%) Investor (15.2%) Venture capital fund (13.3%) Hong Kong Government grant (32.5%) Bank (30.2%) Investor (15.4%)
India Non-bank financial institution (36.0%) Family and friends (13.5%) Venture capital fund (12.7%)
Indonesia Bank (31.3%) Personal resources (15.2%) Investor (13.8%)
Malaysia Bank (28.5%) Government grant (17.0%) Family and friends/investor (15.2%)
New Zealand Government grant (51.5%) Bank (21.8%) Personal resources (7.6%) Philippines Family and friends (21.4%) Personal resources (20.8%) Investor (15.1%)
Singapore Bank (33.8%) Investor (18.6%) Government grant (13.8%)
Taiwan Bank (31.3%) Investor (20.1%) Family and friends (16.0%) Vietnam Bank (55.6%) Family and friends (15.1%) Investor (9.8%)
Key findings While banks remain the most common source of external finance, their popularity slipped in 2020. 28.4 per cent of respondents that required external finance in 2020 stated that a bank was their main source of those funds, down from 36.2 per cent in 2019. The gap created by this decline was filled mainly by government grants and non-bank financial institutions. Banks were the most popular source of finance in all markets surveyed, except for Hong Kong, India, Philippines and New Zealand. In Hong Kong and New Zealand, government grants filled the financing gap. 51.3 per cent of New Zealand small businesses stated that government grants were their main source of finance in 2020, well up from 7.0 per cent in 2019. Similarly, in Hong Kong, government grants as the main source of finance jumped from 9.2 per cent in 2019 to 32.5 per cent last year. While banks were the most popular source of small business finance in Vietnam last year, its popularity dropped substantially. 55.6 per cent of Vietnamese small businesses found that banks were their main source of funds in 2020, down from 84.6 per cent in 2019. The gap was filled by family and friends and peer-to-peer lending. Small businesses from Mainland China that required external finance in 2020 were the most likely to nominate venture capital fund or angel finance (13.3 per cent) as their main source of finance. Small businesses from Taiwan were the most likely to nominate an investor as their main source of finance in 2020 (20.1 per cent). Australian small businesses (1.6 per cent) were the least likely to nominate this as their main source of finance. Businesses that grew in 2020 and required external finance were more likely to nominate a bank, friends or family, or a non-banking financial institution as their main source of finance, compared to businesses that didn’t grow. Meanwhile, businesses that didn’t grow and required external finance were more likely to nominate their personal resources, government grants and peer-to-peer lending as their main source of finance, compared to businesses that grew.
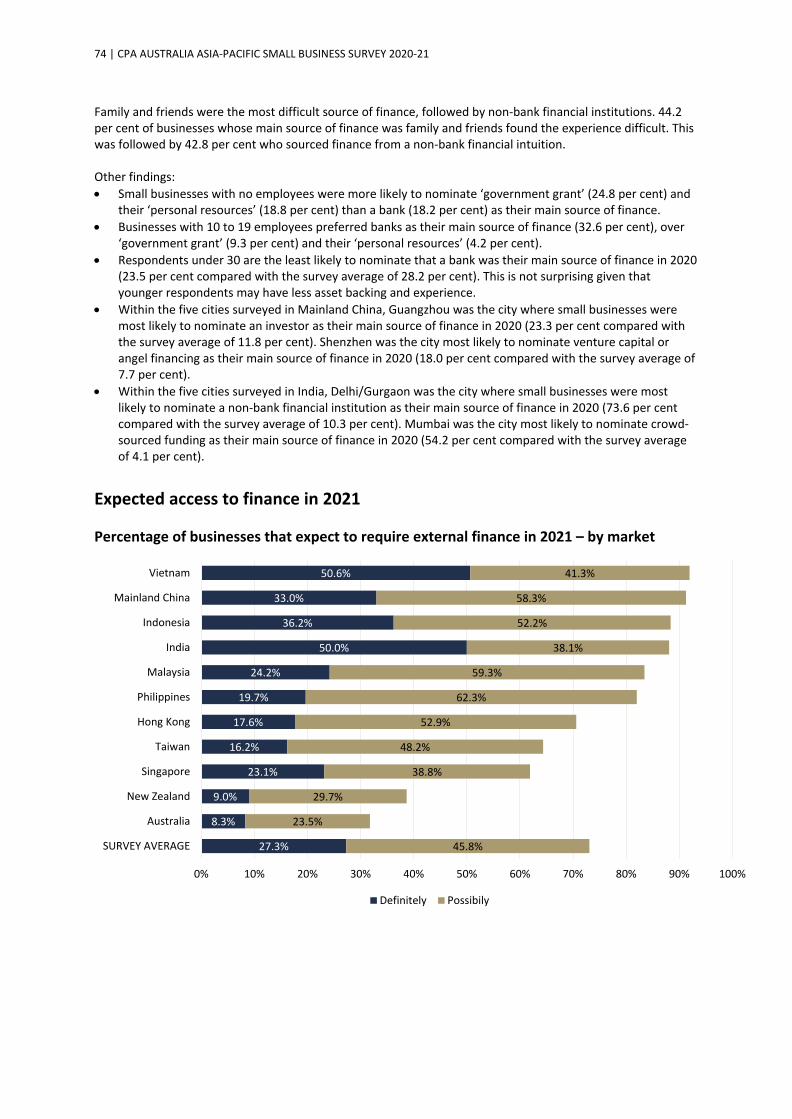
74 | CPA AUSTRALIA ASIA-PACIFIC SMALL BUSINESS SURVEY 2020-21
Family and friends were the most difficult source of finance, followed by non-bank financial institutions. 44.2 per cent of businesses whose main source of finance was family and friends found the experience difficult. This was followed by 42.8 per cent who sourced finance from a non-bank financial intuition. Other findings: • Small businesses with no employees were more likely to nominate ‘government grant’ (24.8 per cent) and
their ‘personal resources’ (18.8 per cent) than a bank (18.2 per cent) as their main source of finance. • Businesses with 10 to 19 employees preferred banks as their main source of finance (32.6 per cent), over
‘government grant’ (9.3 per cent) and their ‘personal resources’ (4.2 per cent). • Respondents under 30 are the least likely to nominate that a bank was their main source of finance in 2020
(23.5 per cent compared with the survey average of 28.2 per cent). This is not surprising given that younger respondents may have less asset backing and experience.
• Within the five cities surveyed in Mainland China, Guangzhou was the city where small businesses were most likely to nominate an investor as their main source of finance in 2020 (23.3 per cent compared with the survey average of 11.8 per cent). Shenzhen was the city most likely to nominate venture capital or angel financing as their main source of finance in 2020 (18.0 per cent compared with the survey average of 7.7 per cent).
• Within the five cities surveyed in India, Delhi/Gurgaon was the city where small businesses were most likely to nominate a non-bank financial institution as their main source of finance in 2020 (73.6 per cent compared with the survey average of 10.3 per cent). Mumbai was the city most likely to nominate crowd-sourced funding as their main source of finance in 2020 (54.2 per cent compared with the survey average of 4.1 per cent).
Expected access to finance in 2021 Percentage of businesses that expect to require external finance in 2021 – by market
27.3%
8.3%
9.0%
23.1%
16.2%
17.6%
19.7%
24.2%
50.0%
36.2%
33.0%
50.6%
45.8%
23.5%
29.7%
38.8%
48.2%
52.9%
62.3%
59.3%
38.1%
52.2%
58.3%
41.3%
0% 10% 20% 30% 40% 50% 60% 70% 80% 90% 100%
SURVEY AVERAGE
Australia
New Zealand
Singapore
Taiwan
Hong Kong
Philippines
Malaysia
India
Indonesia
Mainland China
Vietnam
Definitely Possibily
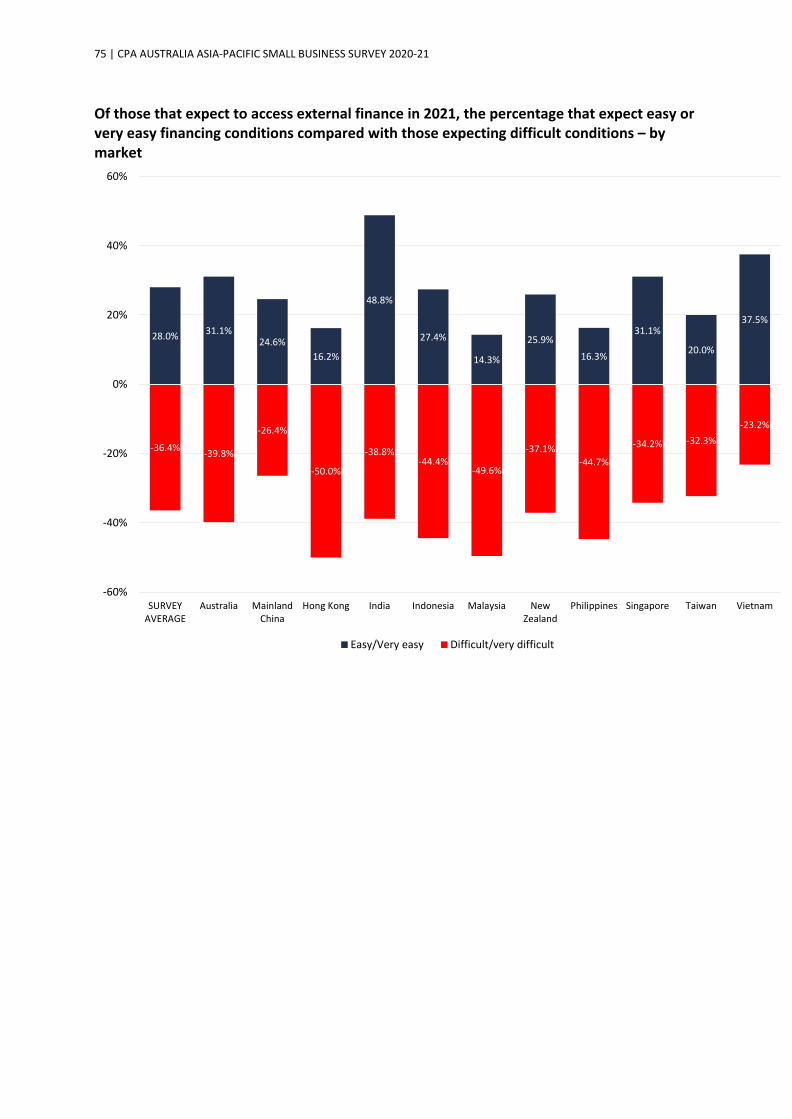
75 | CPA AUSTRALIA ASIA-PACIFIC SMALL BUSINESS SURVEY 2020-21
Of those that expect to access external finance in 2021, the percentage that expect easy or very easy financing conditions compared with those expecting difficult conditions – by market
28.0% 31.1%24.6%
16.2%
48.8%
27.4%
14.3%
25.9%16.3%
31.1%
20.0%
37.5%
-36.4% -39.8%
-26.4%
-50.0%
-38.8%-44.4%
-49.6%
-37.1%-44.7%
-34.2% -32.3%-23.2%
-60%
-40%
-20%
0%
20%
40%
60%
SURVEYAVERAGE
Australia MainlandChina
Hong Kong India Indonesia Malaysia NewZealand
Philippines Singapore Taiwan Vietnam
Easy/Very easy Difficult/very difficult
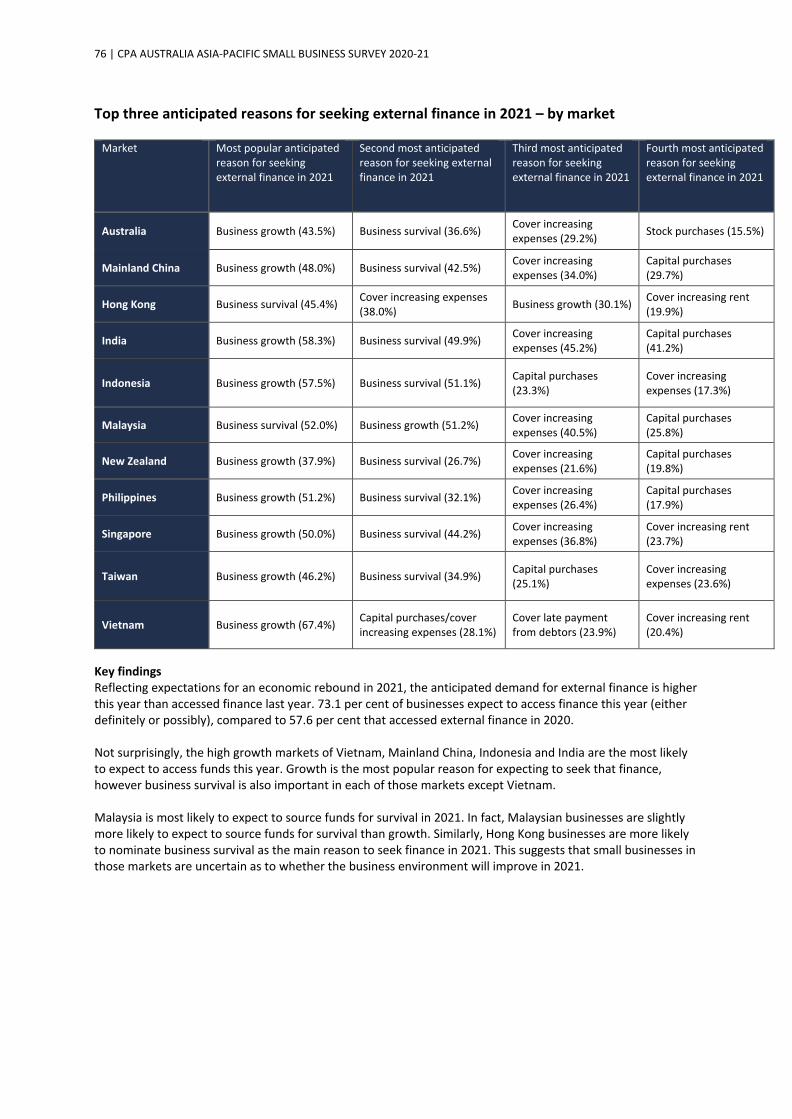
76 | CPA AUSTRALIA ASIA-PACIFIC SMALL BUSINESS SURVEY 2020-21
Top three anticipated reasons for seeking external finance in 2021 – by market
Market Most popular anticipated reason for seeking external finance in 2021
Second most anticipated reason for seeking external finance in 2021
Third most anticipated reason for seeking external finance in 2021
Fourth most anticipated reason for seeking external finance in 2021
Australia Business growth (43.5%) Business survival (36.6%) Cover increasing expenses (29.2%) Stock purchases (15.5%)
Mainland China Business growth (48.0%) Business survival (42.5%) Cover increasing expenses (34.0%)
Capital purchases (29.7%)
Hong Kong Business survival (45.4%) Cover increasing expenses (38.0%) Business growth (30.1%) Cover increasing rent
(19.9%)
India Business growth (58.3%) Business survival (49.9%) Cover increasing expenses (45.2%)
Capital purchases (41.2%)
Indonesia Business growth (57.5%) Business survival (51.1%) Capital purchases (23.3%)
Cover increasing expenses (17.3%)
Malaysia Business survival (52.0%) Business growth (51.2%) Cover increasing expenses (40.5%)
Capital purchases (25.8%)
New Zealand Business growth (37.9%) Business survival (26.7%) Cover increasing expenses (21.6%)
Capital purchases (19.8%)
Philippines Business growth (51.2%) Business survival (32.1%) Cover increasing expenses (26.4%)
Capital purchases (17.9%)
Singapore Business growth (50.0%) Business survival (44.2%) Cover increasing expenses (36.8%)
Cover increasing rent (23.7%)
Taiwan Business growth (46.2%) Business survival (34.9%) Capital purchases (25.1%)
Cover increasing expenses (23.6%)
Vietnam Business growth (67.4%) Capital purchases/cover increasing expenses (28.1%)
Cover late payment from debtors (23.9%)
Cover increasing rent (20.4%)
Key findings Reflecting expectations for an economic rebound in 2021, the anticipated demand for external finance is higher this year than accessed finance last year. 73.1 per cent of businesses expect to access finance this year (either definitely or possibly), compared to 57.6 per cent that accessed external finance in 2020. Not surprisingly, the high growth markets of Vietnam, Mainland China, Indonesia and India are the most likely to expect to access funds this year. Growth is the most popular reason for expecting to seek that finance, however business survival is also important in each of those markets except Vietnam. Malaysia is most likely to expect to source funds for survival in 2021. In fact, Malaysian businesses are slightly more likely to expect to source funds for survival than growth. Similarly, Hong Kong businesses are more likely to nominate business survival as the main reason to seek finance in 2021. This suggests that small businesses in those markets are uncertain as to whether the business environment will improve in 2021.

77 | CPA AUSTRALIA ASIA-PACIFIC SMALL BUSINESS SURVEY 2020-21
The percentage of businesses that expect easy access to finance in 2021 (28.0 per cent) is the highest result since 2018. This result may be influenced by an expectation that governments will continue to support business access to finance through SME loan guarantees and grants. Businesses in India are most likely to expect easy access to finance in 2021 (48.8 per cent compared to the survey average of 28.0 per cent). Reflecting an expected continuation of a tough business environment, businesses in Hong Kong are the most likely to expect difficulty accessing finance (50.0 per cent compared to the survey average of 36.4 per cent). Other findings: • Unsurprisingly, businesses with strong growth expectations for 2021 are more likely to expect easy access
to finance than those that don’t. 40.9 per cent of businesses that expect to grow strongly in 2021 expect easy access to finance, compared with 18.4 per cent of businesses that do not expect to grow.
• Australian businesses are the least likely to nominate borrowing to fund capital purchases as a reason for expecting to seek external funds in 2021. With the Australian government offering substantial tax incentives to encourage such investment, this is disappointing. A possible reason for this is that over one third of Australian businesses didn’t seek advice last year.
• Small businesses with 10 to 19 employees are more likely to expect easy financing conditions in 2021 (36.1 per cent compared with 20.1 per cent of businesses with fewer than five employees).
• Businesses that expect revenue from overseas sales to grow strongly are more likely to expect easy access to finance (45.9 per cent compared with 18.1 per cent of businesses that don’t expect to sell overseas).
• Likewise, businesses that will innovate in 2021 are much more likely to expect easy access to finance (37.3 per cent compared with 17.2 per cent of businesses that don’t expect to innovate). Similarly, innovative businesses are much more likely to expect to borrow. 59.8 per cent of business that will innovate in 2021 will seek external finance compared with 9.4 per cent that won’t innovate.
• Businesses that have already recovered from COVID-19 or expect to recover this year are more likely to expect to seek external finance to support growth. Similarly, businesses that have already recovered from the impacts of COVID-19 are less likely to expect to seek finance for business survival than businesses that have yet to recover.
Suggestions: • Where a business identifies a need for external finance, they should approach their preferred sources of
that finance early to improve the chances of securing the finance at the best possible terms and price. • Businesses should consider engaging a professional, such as an accountant or commercial finance broker,
to assist them seek external finance, provide guidance on developing a business case for external finance and suggest other options.
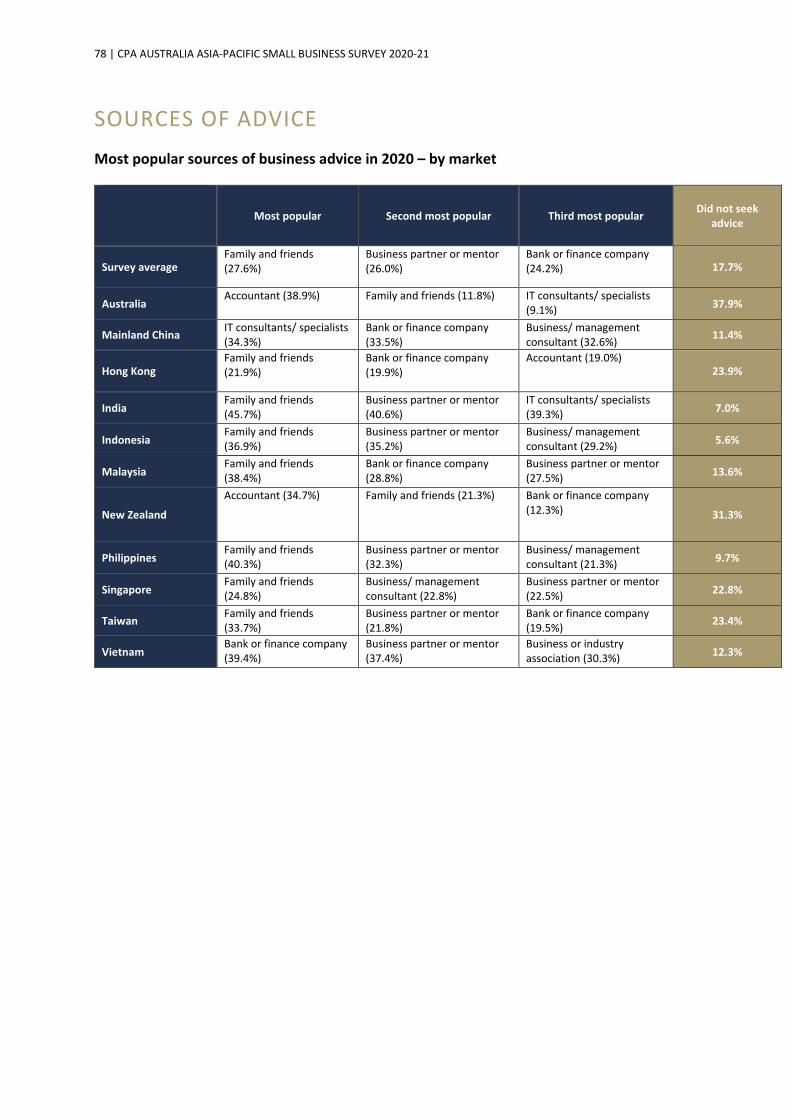
78 | CPA AUSTRALIA ASIA-PACIFIC SMALL BUSINESS SURVEY 2020-21
SOURCES OF ADVICE Most popular sources of business advice in 2020 – by market
Most popular Second most popular Third most popular Did not seek advice
Survey average Family and friends (27.6%)
Business partner or mentor (26.0%)
Bank or finance company (24.2%) 17.7%
Australia Accountant (38.9%) Family and friends (11.8%) IT consultants/ specialists
(9.1%) 37.9%
Mainland China IT consultants/ specialists (34.3%)
Bank or finance company (33.5%)
Business/ management consultant (32.6%) 11.4%
Hong Kong Family and friends (21.9%)
Bank or finance company (19.9%)
Accountant (19.0%) 23.9%
India Family and friends (45.7%)
Business partner or mentor (40.6%)
IT consultants/ specialists (39.3%) 7.0%
Indonesia Family and friends (36.9%)
Business partner or mentor (35.2%)
Business/ management consultant (29.2%) 5.6%
Malaysia Family and friends (38.4%)
Bank or finance company (28.8%)
Business partner or mentor (27.5%) 13.6%
New Zealand
Accountant (34.7%) Family and friends (21.3%) Bank or finance company (12.3%) 31.3%
Philippines Family and friends (40.3%)
Business partner or mentor (32.3%)
Business/ management consultant (21.3%) 9.7%
Singapore Family and friends (24.8%)
Business/ management consultant (22.8%)
Business partner or mentor (22.5%) 22.8%
Taiwan Family and friends (33.7%)
Business partner or mentor (21.8%)
Bank or finance company (19.5%) 23.4%
Vietnam Bank or finance company (39.4%)
Business partner or mentor (37.4%)
Business or industry association (30.3%) 12.3%

79 | CPA AUSTRALIA ASIA-PACIFIC SMALL BUSINESS SURVEY 2020-21
Sources of business advice in 2020 – by market
Key findings Among businesses that sought business advice in 2020, family and friends was the most popular source of advice. Indian small businesses were the most likely to have sought advice from that source, while Australian businesses were the least likely. Similarly, Indian small businesses were the most likely to have sought advice from a business partner or mentor with Australian small businesses the least likely. Small businesses in Australia and New Zealand were significantly less likely than businesses in Asia to have sought business advice in 2020. 37.9 per cent of Australian small businesses and 31.3 per cent of small businesses in New Zealand didn’t seek external advice from any source, compared to only 5.6 per cent in Indonesia. Businesses that didn’t seek advice struggled to grow. 25.1 per cent of businesses that didn’t grow failed to seek external advice, compared with 8.3 per cent that did grow. In addition, only 4.3 per cent of businesses that didn’t seek advice increased their employee count last year, well below the survey average of 24.8 per cent. Businesses that didn’t seek advice were also far less likely to be selling online, using social media and expecting to innovate in 2021. 56.8 per cent of businesses that didn’t grow made no changes to their business in response to COVID-19. In short, these businesses are poorly placed to recover from COVID-19 impacts.
0%
5%
10%
15%
20%
25%
30%
35%
40%
45%
50%
Surveyaverage
Australia MainlandChina
Hong Kong India Indonesia Malaysia NewZealand
Philippines Singapore Taiwan Vietnam
Accountant Family and friends Business/ management consultant Government No advice

80 | CPA AUSTRALIA ASIA-PACIFIC SMALL BUSINESS SURVEY 2020-21
While governments became an increasingly important source of finance in 2020, only a small percentage (12.1 per cent) of businesses turned to them for advice. Businesses were more likely to turn to all other potential sources of advice, except for lawyers. Highlighting the stronger focus on technology adoption, small businesses in India and Mainland China were most likely to have sought advice from IT consultants / specialists. Australian and Taiwanese small businesses were the least likely. Other findings: • Businesses in the ‘Administrative and support services’ sector were the least likely to have sought external
advice in 2020. ‘Banking, finance or insurance’ businesses were the most likely to have sought external advice.
• ‘Information, media and telecommunications’ businesses were the most likely to have approached an IT consultant / specialist for advice
• ‘Accommodation and food services’ businesses were most likely to have sought advice from family and friends.
• Respondents aged below 40 were more likely to have sought external advice than respondents aged 50 or above.
• Businesses that reported growing strongly in 2020 were significantly more likely to have sought external advice compared to businesses that didn’t grow.
• Businesses with fewer than five employees were significantly less likely to have sought advice compared to businesses with more than ten employees.
Suggestions: • Governments seeking to hasten business recovery, support sustainable growth and support job creation
should consider introducing incentives for small businesses to seek professional advice. • Governments should collaborate with professional advisers to assist small businesses build their capability
and help improve their business processes.

81 | CPA AUSTRALIA ASIA-PACIFIC SMALL BUSINESS SURVEY 2020-21
MARKET SUMMARIES Australia market summary
Business and economic conditions
Australia 2020
Survey average
2020
Rank 2020
Australia 2019
Rank 2019
Australia 2018
Australia 2017
Australia 2016
Businesses that grew in the last 12 months
22.3% 46.2% 10/11 35.3% 11/11 42.2% 50.7% 44.1%
Businesses that expect to grow in the next 12 months
41.4% 60.8% 10/11 41.1% 10/11 47.3% 55.6% 51.2%
Businesses that expect the local economy to grow in the next 12 months
44.2% 58.6% 9/11 29.3% 10/11 34.7% 42.3% 38.4%
2020 was a significantly weaker year for Australian small businesses than 2019. Only 22.3 per cent of businesses grew last year. This is the lowest percentage for Australia since 2011 and the second lowest among the 11 markets surveyed. 2021 is expected to be a better year for Australia’s small businesses. However, Australia’s small business sector looks likely to underperform compared to most of the Asia-Pacific region. Only 41.4 per cent of businesses expect to grow compared with the survey average of 60.8 per cent.
20%
30%
40%
50%
60%
70%
80%
2014 2015 2016 2017 2018 2019 2020
Small businesses that reported growing in the previous 12 months - Australia against survey
average
Australia Survey average
20%
30%
40%
50%
60%
70%
80%
2011 2012 2013 2014 2015 2016 2017 2018 2019 2020
Small businesses that expect to grow in the next 12 months - Australia against survey
average
Australia Survey average

82 | CPA AUSTRALIA ASIA-PACIFIC SMALL BUSINESS SURVEY 2020-21
The major contributors to the low anticipated growth rate include a weak and uncertain economic outlook, and the small percentage of Australia’s small businesses that invest in or undertake activities that characterise growing businesses, being: • innovation • e-commerce • social media use • exporting. Impacts of COVID-19
Australia 2020
Survey average
2020 Rank 2020
COVID-19 had a major negative impact on my business in the past 12 months 57.8% 57.1% 6/11
My business’s major reaction to COVID-19 was to begin or increase its focus on online sales
5.9% 24.6% 11/11
My business has already recovered from the negative impacts of COVID-19 or I expect it to recover in the next 12 months
31.4% 39.0% 7/11
Like all markets, Australia’s small businesses considered COVID-19 their biggest challenge in 2020. 57.8 per cent found it had a negative impact on their business, well ahead of the next most selected reason, the related ‘poor overall economic environment’ at 23.7 per cent. Despite the impact COVID-19 had on Australian small businesses last year, 36.1 per cent of respondents made no major changes to their business in response to the pandemic, the highest result of the markets surveyed. Use of technology
Australia 2020
Survey average
2020
Rank 2020
Australia 2019
Rank 2019
Australia 2018
Australia 2017
Australia 2016
Did NOT earn any revenue from online sales
51.3% 22.6% 2/11 56.5% 1/11 59.8% 52.6% 60.2%
Did NOT use social media for business purposes
42.4% 18.3% 1/11 45.1% 1/11 44.8% 42.5% 50.6%
Investment in technology by my business over the past 12 months has improved profitability
18.9% 48.1% 10/11 18.8% 11/11 16.4% 26.7% N/A
Technology my business invested in most heavily over the past 12 months
Website Computer equipment
N/A Computer equipment
N/A Computer equipment
N/A N/A
Consider my business likely to be cyberattacked in next 12 months
17.8% 38.8% 10/11 17.6% 11/11 15.8% 25.8% N/A
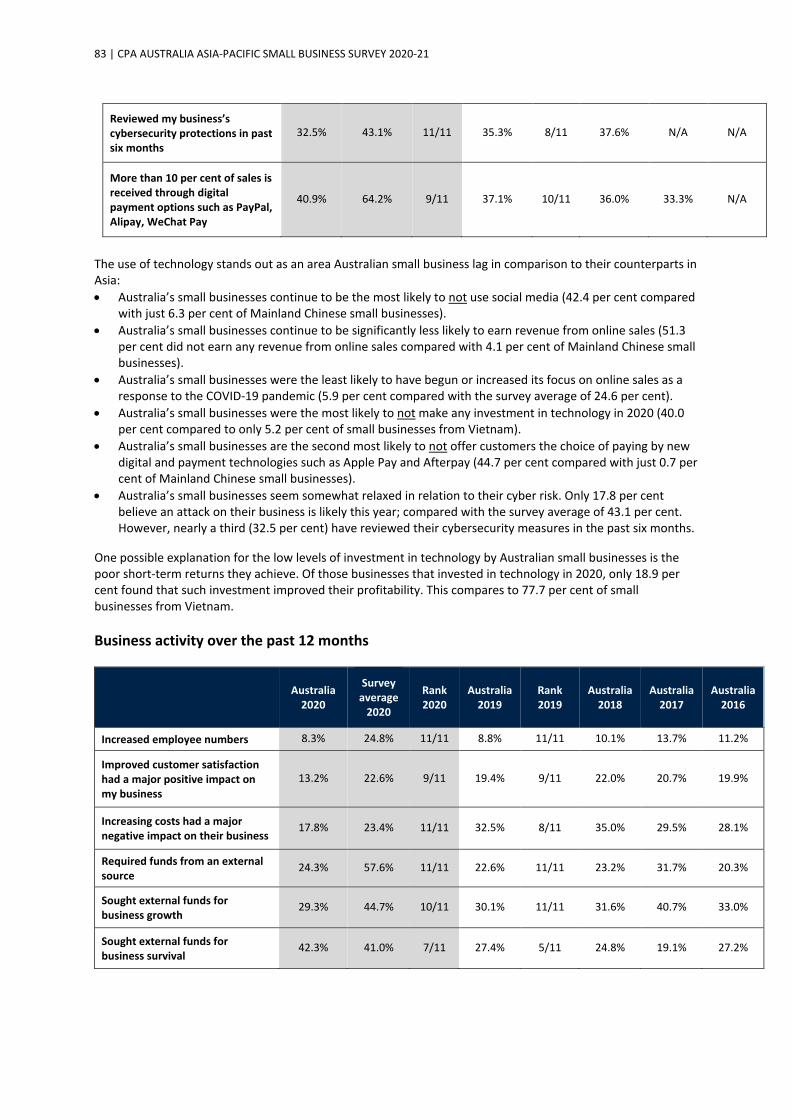
83 | CPA AUSTRALIA ASIA-PACIFIC SMALL BUSINESS SURVEY 2020-21
Reviewed my business’s cybersecurity protections in past six months
32.5% 43.1% 11/11 35.3% 8/11 37.6% N/A N/A
More than 10 per cent of sales is received through digital payment options such as PayPal, Alipay, WeChat Pay
40.9% 64.2% 9/11 37.1% 10/11 36.0% 33.3% N/A
The use of technology stands out as an area Australian small business lag in comparison to their counterparts in Asia: • Australia’s small businesses continue to be the most likely to not use social media (42.4 per cent compared
with just 6.3 per cent of Mainland Chinese small businesses). • Australia’s small businesses continue to be significantly less likely to earn revenue from online sales (51.3
per cent did not earn any revenue from online sales compared with 4.1 per cent of Mainland Chinese small businesses).
• Australia’s small businesses were the least likely to have begun or increased its focus on online sales as a response to the COVID-19 pandemic (5.9 per cent compared with the survey average of 24.6 per cent).
• Australia’s small businesses were the most likely to not make any investment in technology in 2020 (40.0 per cent compared to only 5.2 per cent of small businesses from Vietnam).
• Australia’s small businesses are the second most likely to not offer customers the choice of paying by new digital and payment technologies such as Apple Pay and Afterpay (44.7 per cent compared with just 0.7 per cent of Mainland Chinese small businesses).
• Australia’s small businesses seem somewhat relaxed in relation to their cyber risk. Only 17.8 per cent believe an attack on their business is likely this year; compared with the survey average of 43.1 per cent. However, nearly a third (32.5 per cent) have reviewed their cybersecurity measures in the past six months.
One possible explanation for the low levels of investment in technology by Australian small businesses is the poor short-term returns they achieve. Of those businesses that invested in technology in 2020, only 18.9 per cent found that such investment improved their profitability. This compares to 77.7 per cent of small businesses from Vietnam. Business activity over the past 12 months
Australia 2020
Survey average
2020
Rank 2020
Australia 2019
Rank 2019
Australia 2018
Australia 2017
Australia 2016
Increased employee numbers 8.3% 24.8% 11/11 8.8% 11/11 10.1% 13.7% 11.2%
Improved customer satisfaction had a major positive impact on my business
13.2% 22.6% 9/11 19.4% 9/11 22.0% 20.7% 19.9%
Increasing costs had a major negative impact on their business
17.8% 23.4% 11/11 32.5% 8/11 35.0% 29.5% 28.1%
Required funds from an external source
24.3% 57.6% 11/11 22.6% 11/11 23.2% 31.7% 20.3%
Sought external funds for business growth
29.3% 44.7% 10/11 30.1% 11/11 31.6% 40.7% 33.0%
Sought external funds for business survival
42.3% 41.0% 7/11 27.4% 5/11 24.8% 19.1% 27.2%

84 | CPA AUSTRALIA ASIA-PACIFIC SMALL BUSINESS SURVEY 2020-21
Found it easy or very easy to access external finance
49.6% 34.0% 2/11 46.9% 2/11 47.0% 42.0% 42.7%
A bank was my business’s main source of external finance
38.2% 28.4% 2/11 43.4% 3/11 54.7% 45.7% 50.5%
Planned business activity over the next 12 months
Australia 2021
Survey average
2021
Rank 2021
Australia 2020
Rank 2020
Australia 2019
Australia 2018
Australia 2017
Expect to increase employee numbers
13.0% 36.1% 9/11 10.6% 11/11 14.5% 18.8% 15.9%
Will introduce a new product, service or process unique to their market or the world
6.7% 23.0% 11/11 6.4% 11/11 6.7% 7.4% 4.7%
Expect revenue from overseas markets to grow strongly
6.3% 15.3% 9/11 4.8% 11/11 4.6% 6.7% 3.1%
Will seek external funds 8.3% 27.3% 11/11 6.0% 11/11 6.9% 11.4% 8.5%
Expect easy to very easy access to finance
31.1% 28.0% 3/11 35.6% 2/11 26.5% 25.5% 30.7%
Factors that had positive and negative influences on business
Top four factors that had a positive influence on Australian small business in 2020
Top four factors that had a positive influence Australian on small business in 2019
Top four factors that had a positive influence on Australian small business in 2018
Customer loyalty Customer loyalty Customer loyalty
Good staff Good staff Good staff
COVID-19 Cost control Improved customer satisfaction
Cost control Improved customer satisfaction Cost control
Top four factors that had a negative impact on Australian small business in 2020
Top four factors that had a negative impact on Australian small business in 2019
Top four factors that had a negative impact on Australian small business in 2018
COVID-19 Increasing costs Increasing costs
Poor overall economic environment Poor overall economic environment Increasing competition
Increasing costs Increasing competition Poor overall economic environment
Cash flow difficulties Tax Tax
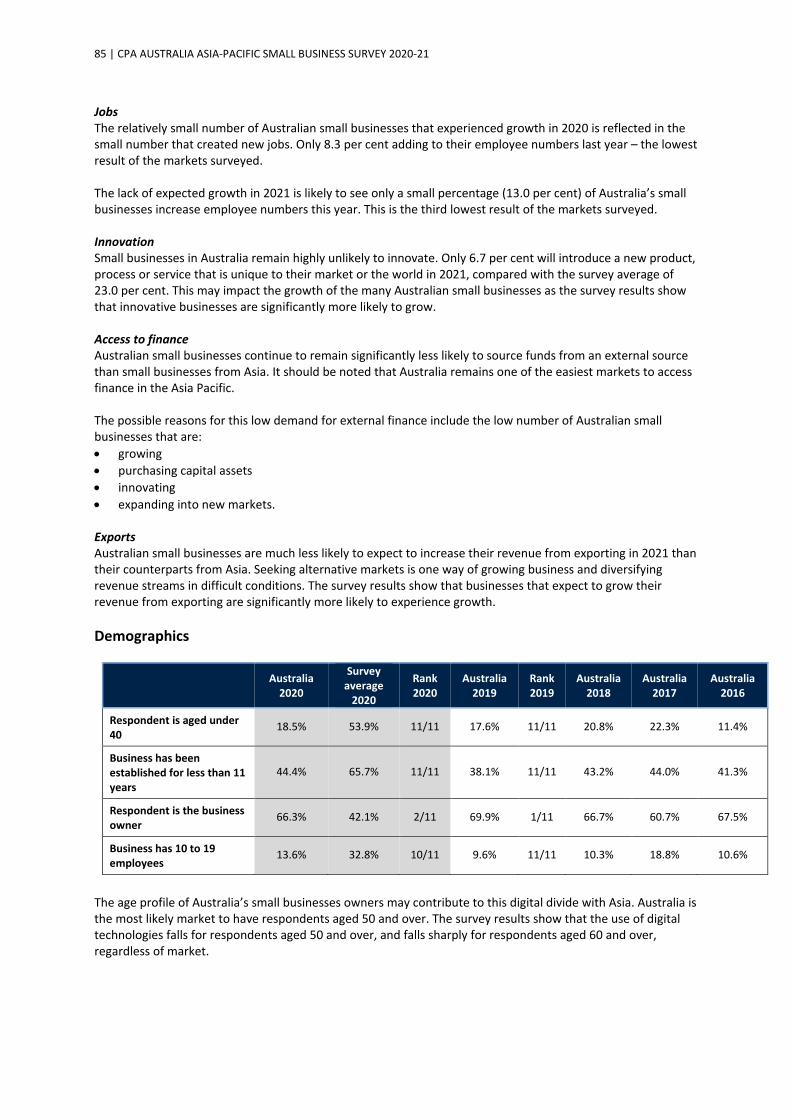
85 | CPA AUSTRALIA ASIA-PACIFIC SMALL BUSINESS SURVEY 2020-21
Jobs The relatively small number of Australian small businesses that experienced growth in 2020 is reflected in the small number that created new jobs. Only 8.3 per cent adding to their employee numbers last year – the lowest result of the markets surveyed. The lack of expected growth in 2021 is likely to see only a small percentage (13.0 per cent) of Australia’s small businesses increase employee numbers this year. This is the third lowest result of the markets surveyed. Innovation Small businesses in Australia remain highly unlikely to innovate. Only 6.7 per cent will introduce a new product, process or service that is unique to their market or the world in 2021, compared with the survey average of 23.0 per cent. This may impact the growth of the many Australian small businesses as the survey results show that innovative businesses are significantly more likely to grow. Access to finance Australian small businesses continue to remain significantly less likely to source funds from an external source than small businesses from Asia. It should be noted that Australia remains one of the easiest markets to access finance in the Asia Pacific. The possible reasons for this low demand for external finance include the low number of Australian small businesses that are: • growing • purchasing capital assets • innovating • expanding into new markets. Exports Australian small businesses are much less likely to expect to increase their revenue from exporting in 2021 than their counterparts from Asia. Seeking alternative markets is one way of growing business and diversifying revenue streams in difficult conditions. The survey results show that businesses that expect to grow their revenue from exporting are significantly more likely to experience growth. Demographics
Australia 2020
Survey average
2020
Rank 2020
Australia 2019
Rank 2019
Australia 2018
Australia 2017
Australia 2016
Respondent is aged under 40
18.5% 53.9% 11/11 17.6% 11/11 20.8% 22.3% 11.4%
Business has been established for less than 11 years
44.4% 65.7% 11/11 38.1% 11/11 43.2% 44.0% 41.3%
Respondent is the business owner
66.3% 42.1% 2/11 69.9% 1/11 66.7% 60.7% 67.5%
Business has 10 to 19 employees
13.6% 32.8% 10/11 9.6% 11/11 10.3% 18.8% 10.6%
The age profile of Australia’s small businesses owners may contribute to this digital divide with Asia. Australia is the most likely market to have respondents aged 50 and over. The survey results show that the use of digital technologies falls for respondents aged 50 and over, and falls sharply for respondents aged 60 and over, regardless of market.

86 | CPA AUSTRALIA ASIA-PACIFIC SMALL BUSINESS SURVEY 2020-21
With a significant proportion of Australian small business owners close to or at retirement age, their lack of focus on digital technologies, innovation and exporting should make their recovery from COVID-19 difficult and long for many. Policy recommendations For policymakers seeking to help Australia’s economic recovery and promote jobs creation, improving the digital capability of small business is essential. With most Australian small businesses having fewer than five employees and being time poor, external advisers will play a critical role in helping them improve such capability.

87 | CPA AUSTRALIA ASIA-PACIFIC SMALL BUSINESS SURVEY 2020-21
Mainland China market summary 2
Business and economic growth
China 2020
Survey average
2020
Rank 2020
China 2019
Rank 2019
China 2018
China 2017
China 2016
Businesses that grew in the past 12 months
52.9% 46.2% 5/11 81.0% 4/11 74.0% 79.5% 74.1%
Businesses that expect to grow in the next 12 months
60.2% 60.8% 6/11 79.4% 5/11 71.1% 78.1% 77.3%
Businesses that expect the local economy to grow in the next 12 months
66.5% 58.6% 6/11 82.6% 3/11 64.3% 76.7% 69.2%
2020 was a weaker year than 2019 for Mainland China’s small business sector. 52.9 per cent of businesses stated that they grew last year, down significantly from 81.0 per cent in 2019. It is also the lowest reading for that market since 2014. However, the result was higher than many developed markets such as Australia, where only 22.3 per cent of small businesses reported growing. 2021 is expected to be a somewhat better year for Mainland China’s small businesses. 60.2 per cent expect to grow. This is also a higher result than for the developed markets. There are many positive results from Mainland China, with most of their small businesses already recovered or expecting to recover from COVID-19 in 2021. Further, digital technology is an important part of most businesses and a sizeable number are innovating. These factors should assist many Mainland Chinese small businesses have a successful 2021 and beyond.
2 All data for Mainland China excludes Hong Kong and Taiwan, which are shown separately for the purposes of this report.
45%
50%
55%
60%
65%
70%
75%
80%
85%
2014 2015 2016 2017 2018 2019 2020
Small businesses that reported growing in the previous 12 months - China against
survey average
China Survey average
45%
50%
55%
60%
65%
70%
75%
80%
85%
2014 2015 2016 2017 2018 2019 2020
Small businesses that expect to grow in the next 12 months - China against survey average
China Survey average

88 | CPA AUSTRALIA ASIA-PACIFIC SMALL BUSINESS SURVEY 2020-21
Impacts of COVID-19
China 2020 Survey
average 2020
Rank 2020
COVID-19 had a major negative impact on my business in the past 12 months 49.6% 57.1% 10/11
My business’s major reaction to COVID-19 was to begin or increase its focus on online sales
28.1% 24.6% 5/11
My business has already recovered from the negative impacts of COVID-19 or I expect it to recover in the next 12 months
51.2% 39.0% 2/11
Like all markets, respondents from Mainland China considered COVID-19 their biggest challenge in 2020 (49.6 per cent). They were however, the second least likely of the markets surveyed to nominate it as a major challenge to their business. COVID-19 is not expected to be a major barrier for many Mainland Chinese small businesses in 2021. 51.2 per cent have already recovered from the negative impacts of the pandemic or expect to recover in 2021, the second highest result amongst the markets surveyed. Use of technology
China 2020
Survey average
2020
Rank 2020
China 2019
Rank 2019
China 2018
China 2017
China 2016
Did NOT earn any revenue from online sales
4.1% 22.6% 11/11 2.1% 11/11 5.4% 6.8% 7.7%
Did NOT use social media for business purposes
6.3% 18.3% 11/11 1.7% 11/11 3.7% 4.8% 2.9%
Investment in technology by the business over the past 12 months has improved profitability
57.0% 48.1% 4/11 56.6% 5/11 67.0% 74.1% N/A
Technology your business invested in most heavily over the past 12 months
Artificial intelligence, machine learning
and chatbots
Computer equipment
N/A Computer equipment
N/A Computer equipment
N/A N/A
Consider your business likely to be cyberattacked in next 12 months
34.9% 38.8% 7/11 45.1% 3/11 46.3% 44.9% N/A
Reviewed your business’s cybersecurity protections in past six months
58.5% 43.1% 1/11 67.6% 2/11 69.0% N/A N/A

89 | CPA AUSTRALIA ASIA-PACIFIC SMALL BUSINESS SURVEY 2020-21
More than 10 per cent of sales is received through digital payment options such as PayPal, Alipay, WeChat Pay
90.8% 64.2% 1/11 91.4% 1/11 87.1% 84.2% N/A
Small businesses from Mainland China continue to be leaders in using technology in their business. Of the 11 markets surveyed, they were the most likely to earn revenue from online sales and the most likely to use social media for business purposes. In fact, it would be difficult to find a business in Mainland China that are not using technology. Further, they are not just dabbling in online sales – a staggering 82.0 per cent earned more than 10 per cent of their revenue through that channel. Mainland China’s small businesses are also clear leaders in the use of digital and online payment options, such as Alipay and WeChat Pay. 90.8 per cent received over 10 per cent of their sales through such technology, significantly above the survey average of 64.2 per cent. Mainland China was the only market where respondents nominated artificial intelligence, machine learning and conversational platforms such as chatbots as the technologies they invested most heavily in in 2020. Small businesses from Mainland China were also the most likely to invest in cloud computing, enterprise resource planning (ERP) software and data visualisation software. This suggests a desire amongst those businesses to move up the value chain. The strong returns generated by such investments are helping to drive this focus on technology. 57.0 per cent of Mainland Chinese businesses that invested in technology in 2020 reported that their investments were already profitable. In Australia, only 18.9 per cent found their technology investment was profitable last year. Most Mainland Chinese small businesses take cybersecurity seriously. 58.5 per cent reviewed their cybersecurity in the past six months – the highest result for all markets surveyed. Only 34.9 per cent expect their business to be cyberattacked in 2021. Business activity over the past 12 months
China 2020
Survey average
2020
Rank 2020
China 2019
Rank 2019
China 2018
China 2017
China 2016
Increased employee numbers 29.5% 24.8% 3/11 57.0% 1/11 39.7% 43.9% 38.8%
Improved customer satisfaction had a major positive impact on my business
25.9% 22.6% 5/11 25.4% 7/11 36.1% 33.0% 36.1%
Increasing costs had a major negative impact on their business
23.9% 23.4% 5/11 26.9% 10/11 34.4% 36.0% 36.2%
Required funds from an external source
67.5% 57.6% 4/11 61.4% 3/11 79.6% 84.5% 80.7%
Sought external funds for business growth
43.2% 44.7% 7/11 53.0% 6/11 59.9% 69.3% 66.5%
Sought external funds for business survival
42.0% 41.0% 8/11 36.3% 3/11 32.9% 35.2% 38.3%

90 | CPA AUSTRALIA ASIA-PACIFIC SMALL BUSINESS SURVEY 2020-21
Found it easy or very easy to access external finance
27.4% 34.0% 7/11 53.8% 1/11 35.4% 36.1% 40.3%
A bank was my business’s main source of external finance
30.4% 28.4% 6/11 18.8% 11/11 29.6% 31.3% 32.5%
Planned business activity over the next 12 months
China 2021
Survey average
2021
Rank 2021
China 2020
Rank 2020
China 2019
China 2018
China 2017
Expect to increase employee numbers 41.5% 36.1% 5/11 63.2% 2/11 51.0% 51.5% 49.4%
Will introduce a new product, service or process unique to their market or the world
21.7% 23.0% 6/11 45.6% 1/11 26.0% 27.2% 28.5%
Expect revenue from overseas markets to grow strongly
11.2% 15.3% 7/11 23.7% 4/11 14.4% 17.2% 16.6%
Will seek external funds 33.0% 27.3% 4/11 33.8% 2/11 36.4% 39.8% 37.0%
Expect easy to very easy access to finance
24.6% 28.0% 7/11 49.8% 1/11 33.8% 39.6% 42.7%
Innovation The innovative culture of Mainland China’s small business sector is supporting its recovery from COVID-19 and improving its competitiveness. It is highly likely that the Chinese Government’s strong focus on innovation and technology is helping keep these issues front of mind for many small businesses. Jobs The smaller number of Mainland China’s small businesses that grew in 2020 is reflected in the lower number that created new jobs. 29.5 per cent added to their employee numbers in 2020, the lowest percentage since 2014, down from 57.0 per cent in 2019. The increase in the number of Mainland Chinese small businesses that expect to grow in 2021 is reflected in the greater number that forecast they will add to their headcount. 41.5 per cent expect to create new jobs this year, beating the survey average of 36.1 per cent. Access to finance Most Mainland Chinese small businesses sourced external finance in 2020. 67.5 per cent needed external financing in 2020, up from 61.4 per cent in 2019. However, the percentage that sought external financing for business growth decreased from 53.0 per cent in 2019 to 43.2 per cent in 2020, while the percentage that sought such finance for survival rose from 36.3 per cent to 42.0 per cent. With challenging business conditions, it is not surprising that Mainland Chinese small businesses found it less easy to access finance last year. 53.8 per cent found accessing finance easy or very easy in 2019 compared with 27.4 per cent in 2020. Mainland China’s small businesses are the most likely to source finance from a venture capital fund or angel financier.

91 | CPA AUSTRALIA ASIA-PACIFIC SMALL BUSINESS SURVEY 2020-21
Factors that had positive and negative influences on business
Top four factors that had a positive influence on Chinese small business in 2020
Top four factors that had a positive influence on Chinese small business in 2019
Top four factors that had a positive influence on Chinese small business in 2018
Customer loyalty Good staff Improved customer satisfaction
Government support/incentives Improved customer satisfaction Introduced a new product or service
Improved customer satisfaction Introduced a new product or service Good staff
Entering new markets Positive overall economic environment Improved business strategy
Top four factors that had a negative impact on Chinese small business in 2020
Top four factors that had a negative impact on Chinese small business in 2019
Top four factors that had a negative impact on Chinese small business in 2018
COVID-19 Increasing costs Increasing costs
Increasing costs Poor overall economic environment Poor overall economic environment
Cash flow difficulties Increasing competition Increasing rent
Increasing competition Increasing rent Increasing competition
Small businesses in Mainland China found that ‘customer loyalty’ and ‘improved customer satisfaction’ had the most positive impacts on their business in 2020. Those businesses are most likely focused on creating and strengthening brand experiences to manage through COVID-19 and position for future growth. More than four in ten of Mainland China’s small businesses identified high staff costs as one of the most detrimental costs to their business last year. It is therefore unsurprising that ‘increasing cost’ was ranked second in the factors that had a negative impact on their business in 2020.
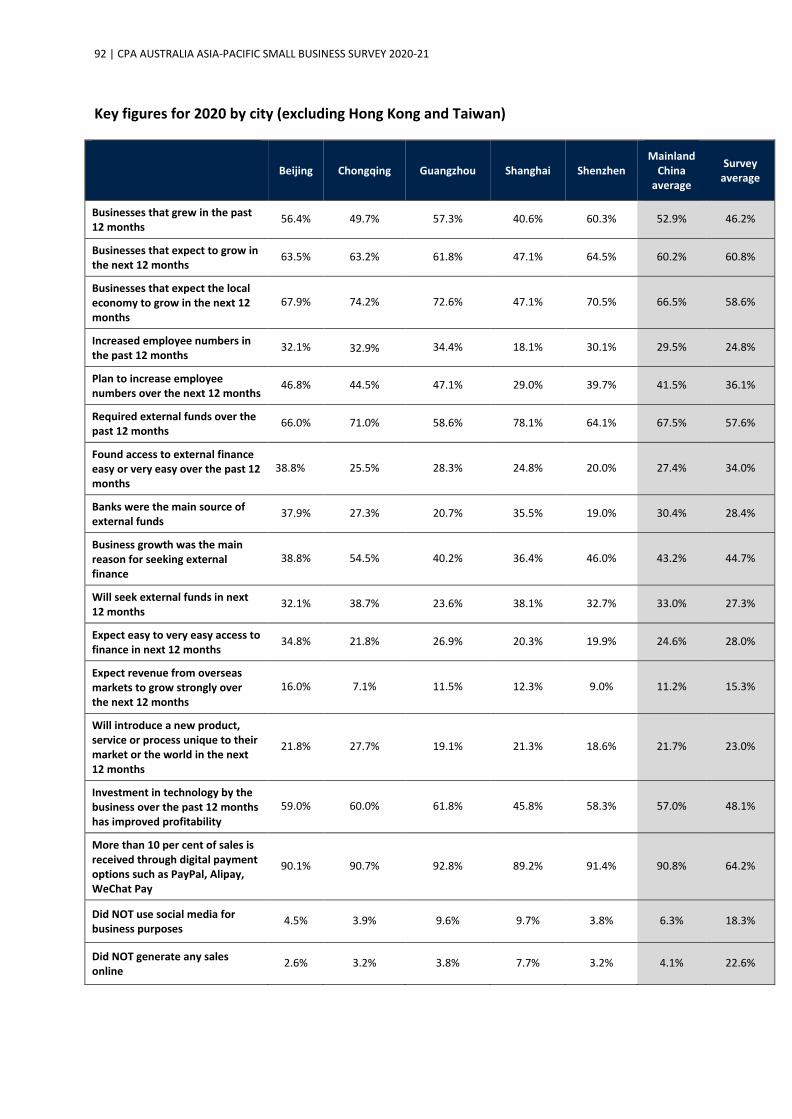
92 | CPA AUSTRALIA ASIA-PACIFIC SMALL BUSINESS SURVEY 2020-21
Key figures for 2020 by city (excluding Hong Kong and Taiwan)
Beijing Chongqing Guangzhou Shanghai Shenzhen Mainland
China average
Survey average
Businesses that grew in the past 12 months
56.4% 49.7% 57.3% 40.6% 60.3% 52.9% 46.2%
Businesses that expect to grow in the next 12 months
63.5% 63.2% 61.8% 47.1% 64.5% 60.2% 60.8%
Businesses that expect the local economy to grow in the next 12 months
67.9% 74.2% 72.6% 47.1% 70.5% 66.5% 58.6%
Increased employee numbers in the past 12 months
32.1% 32.9% 34.4% 18.1% 30.1% 29.5% 24.8%
Plan to increase employee numbers over the next 12 months
46.8% 44.5% 47.1% 29.0% 39.7% 41.5% 36.1%
Required external funds over the past 12 months
66.0% 71.0% 58.6% 78.1% 64.1% 67.5% 57.6%
Found access to external finance easy or very easy over the past 12 months
38.8% 25.5% 28.3% 24.8% 20.0% 27.4% 34.0%
Banks were the main source of external funds
37.9% 27.3% 20.7% 35.5% 19.0% 30.4% 28.4%
Business growth was the main reason for seeking external finance
38.8% 54.5% 40.2% 36.4% 46.0% 43.2% 44.7%
Will seek external funds in next 12 months
32.1% 38.7% 23.6% 38.1% 32.7% 33.0% 27.3%
Expect easy to very easy access to finance in next 12 months
34.8% 21.8% 26.9% 20.3% 19.9% 24.6% 28.0%
Expect revenue from overseas markets to grow strongly over the next 12 months
16.0% 7.1% 11.5% 12.3% 9.0% 11.2% 15.3%
Will introduce a new product, service or process unique to their market or the world in the next 12 months
21.8% 27.7% 19.1% 21.3% 18.6% 21.7% 23.0%
Investment in technology by the business over the past 12 months has improved profitability
59.0% 60.0% 61.8% 45.8% 58.3% 57.0% 48.1%
More than 10 per cent of sales is received through digital payment options such as PayPal, Alipay, WeChat Pay
90.1% 90.7% 92.8% 89.2% 91.4% 90.8% 64.2%
Did NOT use social media for business purposes
4.5% 3.9% 9.6% 9.7% 3.8% 6.3% 18.3%
Did NOT generate any sales online
2.6% 3.2% 3.8% 7.7% 3.2% 4.1% 22.6%
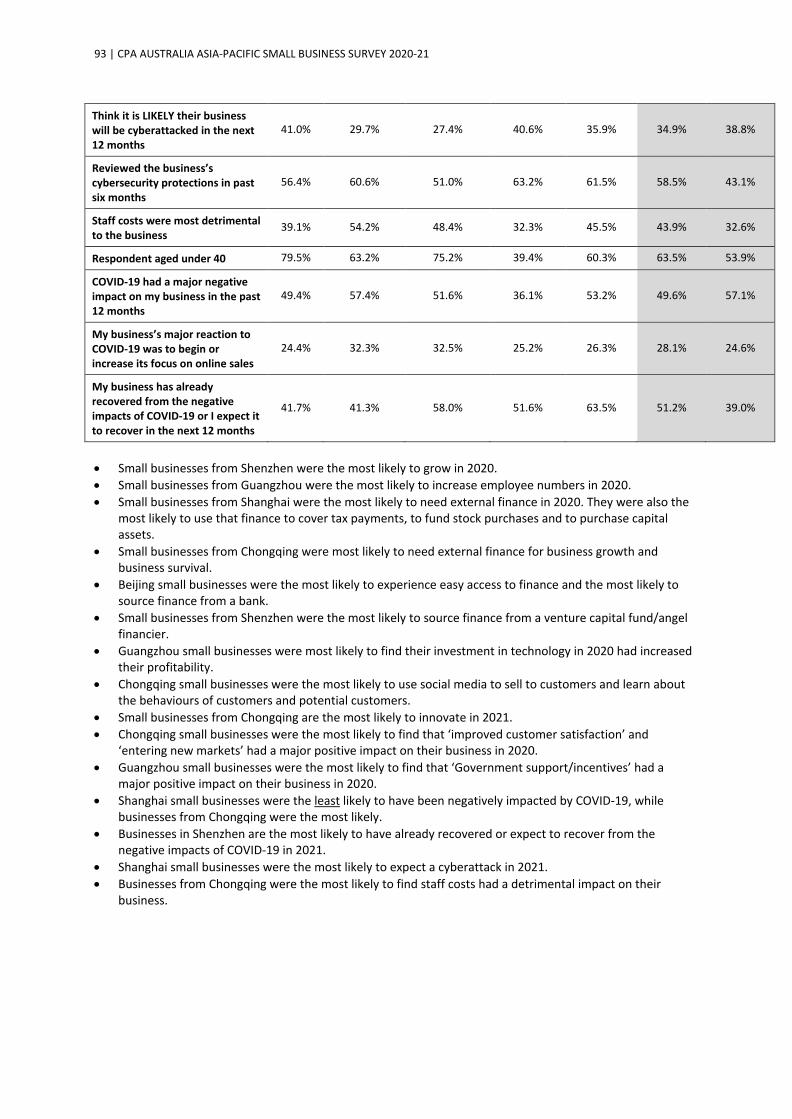
93 | CPA AUSTRALIA ASIA-PACIFIC SMALL BUSINESS SURVEY 2020-21
Think it is LIKELY their business will be cyberattacked in the next 12 months
41.0% 29.7% 27.4% 40.6% 35.9% 34.9% 38.8%
Reviewed the business’s cybersecurity protections in past six months
56.4% 60.6% 51.0% 63.2% 61.5% 58.5% 43.1%
Staff costs were most detrimental to the business
39.1% 54.2% 48.4% 32.3% 45.5% 43.9% 32.6%
Respondent aged under 40 79.5% 63.2% 75.2% 39.4% 60.3% 63.5% 53.9%
COVID-19 had a major negative impact on my business in the past 12 months
49.4% 57.4% 51.6% 36.1% 53.2% 49.6% 57.1%
My business’s major reaction to COVID-19 was to begin or increase its focus on online sales
24.4% 32.3% 32.5% 25.2% 26.3% 28.1% 24.6%
My business has already recovered from the negative impacts of COVID-19 or I expect it to recover in the next 12 months
41.7% 41.3% 58.0% 51.6% 63.5% 51.2% 39.0%
• Small businesses from Shenzhen were the most likely to grow in 2020. • Small businesses from Guangzhou were the most likely to increase employee numbers in 2020. • Small businesses from Shanghai were the most likely to need external finance in 2020. They were also the
most likely to use that finance to cover tax payments, to fund stock purchases and to purchase capital assets.
• Small businesses from Chongqing were most likely to need external finance for business growth and business survival.
• Beijing small businesses were the most likely to experience easy access to finance and the most likely to source finance from a bank.
• Small businesses from Shenzhen were the most likely to source finance from a venture capital fund/angel financier.
• Guangzhou small businesses were most likely to find their investment in technology in 2020 had increased their profitability.
• Chongqing small businesses were the most likely to use social media to sell to customers and learn about the behaviours of customers and potential customers.
• Small businesses from Chongqing are the most likely to innovate in 2021. • Chongqing small businesses were the most likely to find that ‘improved customer satisfaction’ and
‘entering new markets’ had a major positive impact on their business in 2020. • Guangzhou small businesses were the most likely to find that ‘Government support/incentives’ had a
major positive impact on their business in 2020. • Shanghai small businesses were the least likely to have been negatively impacted by COVID-19, while
businesses from Chongqing were the most likely. • Businesses in Shenzhen are the most likely to have already recovered or expect to recover from the
negative impacts of COVID-19 in 2021. • Shanghai small businesses were the most likely to expect a cyberattack in 2021. • Businesses from Chongqing were the most likely to find staff costs had a detrimental impact on their
business.

94 | CPA AUSTRALIA ASIA-PACIFIC SMALL BUSINESS SURVEY 2020-21
Demographics
China 2020
Survey average
2020
Rank 2020
China 2019 Rank 2019 China
2018 China 2017
China 2016
Business has been established for 10 years or less
63.8% 65.7% 6/11 74.2% 3/11 64.8% 73.1% 68.6%
Respondent is aged under 40 63.5% 53.9% 5/11 77.5% 1/11 69.9% 68.5% 60.0%
Respondent is the business owner
24.9% 42.1% 9/11 11.7% 10/11 10.1% 6.1% 9.5%
Business has 10 to 19 employees 46.6% 32.8% 2/11 73.1% 1/11 70.0% 77.9% 68.8%
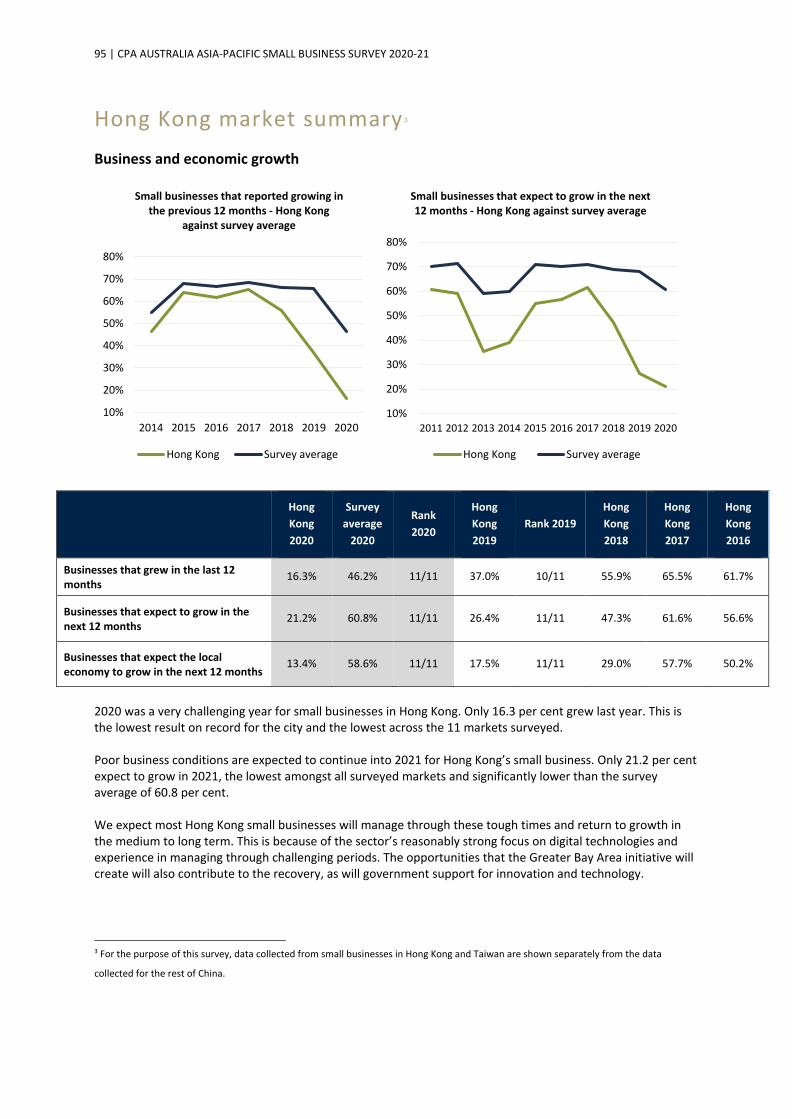
95 | CPA AUSTRALIA ASIA-PACIFIC SMALL BUSINESS SURVEY 2020-21
Hong Kong market summary 3
Business and economic growth
Hong Kong 2020
Survey average
2020
Rank 2020
Hong Kong 2019
Rank 2019 Hong Kong 2018
Hong Kong 2017
Hong Kong 2016
Businesses that grew in the last 12 months
16.3% 46.2% 11/11 37.0% 10/11 55.9% 65.5% 61.7%
Businesses that expect to grow in the next 12 months
21.2% 60.8% 11/11 26.4% 11/11 47.3% 61.6% 56.6%
Businesses that expect the local economy to grow in the next 12 months
13.4% 58.6% 11/11 17.5% 11/11 29.0% 57.7% 50.2%
2020 was a very challenging year for small businesses in Hong Kong. Only 16.3 per cent grew last year. This is the lowest result on record for the city and the lowest across the 11 markets surveyed. Poor business conditions are expected to continue into 2021 for Hong Kong’s small business. Only 21.2 per cent expect to grow in 2021, the lowest amongst all surveyed markets and significantly lower than the survey average of 60.8 per cent. We expect most Hong Kong small businesses will manage through these tough times and return to growth in the medium to long term. This is because of the sector’s reasonably strong focus on digital technologies and experience in managing through challenging periods. The opportunities that the Greater Bay Area initiative will create will also contribute to the recovery, as will government support for innovation and technology.
3 For the purpose of this survey, data collected from small businesses in Hong Kong and Taiwan are shown separately from the data
collected for the rest of China.
10%
20%
30%
40%
50%
60%
70%
80%
2014 2015 2016 2017 2018 2019 2020
Small businesses that reported growing in the previous 12 months - Hong Kong
against survey average
Hong Kong Survey average
10%
20%
30%
40%
50%
60%
70%
80%
2011 2012 2013 2014 2015 2016 2017 2018 2019 2020
Small businesses that expect to grow in the next 12 months - Hong Kong against survey average
Hong Kong Survey average

96 | CPA AUSTRALIA ASIA-PACIFIC SMALL BUSINESS SURVEY 2020-21
Impacts of COVID-19
Hong Kong 2020
Survey average
2020 Rank 2020
COVID-19 had a major negative impact on my business in the past 12 months 52.6% 57.1% 8/11
My business’s major reaction to COVID-19 was to begin or increase its focus on online sales
17.3% 24.6% 8/11
My business has already recovered from the negative impacts of COVID-19 or I expect it to recover in the next 12 months
21.9% 39.0% 10/11
Like all markets, Hong Kong’s small businesses considered COVID-19 their biggest challenge in 2020, with 52.6 per cent saying it had a major impact on their business last year. COVID-19 is expected to continue to have negative impacts on Hong Kong’s small businesses in 2021. Only 21.9 per cent have recovered or expect to recover from the negative impacts of the pandemic in 2021, the second lowest of the 11 markets surveyed. Use of technology
Hong Kong
2020
Survey average
2020 Rank 2020
Hong Kong 2019
Rank 2019
Hong Kong 2018
Hong Kong 2017
Hong Kong 2016
Did NOT earn any revenue from online sales
29.4% 22.6% 4/11 31.7% 5/11 31.9% 17.4% 21.9%
Did NOT use social media for business purposes
19.6% 18.3% 4/11 16.8% 6/11 16.1% 11.3% 11.6%
Investment in technology by the business over the past 12 months has improved profitability
25.2% 48.1% 9/11 29.7% 9/11 32.6% 48.1% N/A
Technology your business invested in most heavily over the past 12 months
Computer equipment
Computer equipment
N/A Computer equipment
N/A Computer equipment
N/A N/A
Consider your business likely to be cyberattacked in next 12 months
30.1% 38.8% 8/11 31.7% 8/11 42.3% 44.2% N/A
Reviewed your business’s cybersecurity protections in last six months
39.5% 43.1% 5/11 39.3% 5/11 53.8% N/A N/A
More than 10 per cent of sales is received through digital payment options such as PayPal, Alipay, WeChat Pay
57.2% 64.2% 7/11 54.2% 4/11 51.9% 54.5% N/A
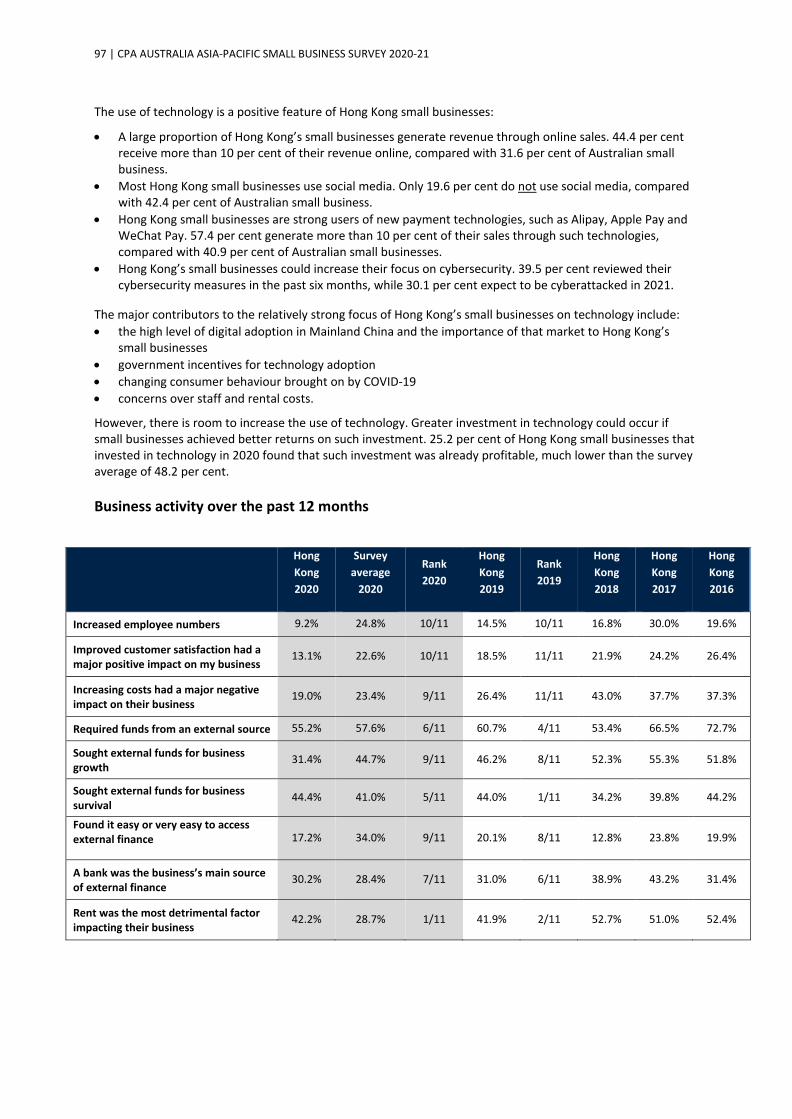
97 | CPA AUSTRALIA ASIA-PACIFIC SMALL BUSINESS SURVEY 2020-21
The use of technology is a positive feature of Hong Kong small businesses:
• A large proportion of Hong Kong’s small businesses generate revenue through online sales. 44.4 per cent receive more than 10 per cent of their revenue online, compared with 31.6 per cent of Australian small business.
• Most Hong Kong small businesses use social media. Only 19.6 per cent do not use social media, compared with 42.4 per cent of Australian small business.
• Hong Kong small businesses are strong users of new payment technologies, such as Alipay, Apple Pay and WeChat Pay. 57.4 per cent generate more than 10 per cent of their sales through such technologies, compared with 40.9 per cent of Australian small businesses.
• Hong Kong’s small businesses could increase their focus on cybersecurity. 39.5 per cent reviewed their cybersecurity measures in the past six months, while 30.1 per cent expect to be cyberattacked in 2021.
The major contributors to the relatively strong focus of Hong Kong’s small businesses on technology include: • the high level of digital adoption in Mainland China and the importance of that market to Hong Kong’s
small businesses • government incentives for technology adoption • changing consumer behaviour brought on by COVID-19 • concerns over staff and rental costs.
However, there is room to increase the use of technology. Greater investment in technology could occur if small businesses achieved better returns on such investment. 25.2 per cent of Hong Kong small businesses that invested in technology in 2020 found that such investment was already profitable, much lower than the survey average of 48.2 per cent. Business activity over the past 12 months
Hong Kong 2020
Survey average
2020
Rank 2020
Hong Kong 2019
Rank 2019
Hong Kong 2018
Hong Kong 2017
Hong Kong 2016
Increased employee numbers 9.2% 24.8% 10/11 14.5% 10/11 16.8% 30.0% 19.6%
Improved customer satisfaction had a major positive impact on my business
13.1% 22.6% 10/11 18.5% 11/11 21.9% 24.2% 26.4%
Increasing costs had a major negative impact on their business
19.0% 23.4% 9/11 26.4% 11/11 43.0% 37.7% 37.3%
Required funds from an external source 55.2% 57.6% 6/11 60.7% 4/11 53.4% 66.5% 72.7%
Sought external funds for business growth
31.4% 44.7% 9/11 46.2% 8/11 52.3% 55.3% 51.8%
Sought external funds for business survival
44.4% 41.0% 5/11 44.0% 1/11 34.2% 39.8% 44.2%
Found it easy or very easy to access external finance 17.2% 34.0% 9/11 20.1% 8/11 12.8% 23.8% 19.9%
A bank was the business’s main source of external finance
30.2% 28.4% 7/11 31.0% 6/11 38.9% 43.2% 31.4%
Rent was the most detrimental factor impacting their business
42.2% 28.7% 1/11 41.9% 2/11 52.7% 51.0% 52.4%

98 | CPA AUSTRALIA ASIA-PACIFIC SMALL BUSINESS SURVEY 2020-21
Planned business activity over the next 12 months
Innovation Hong Kong’s small businesses remain highly unlikely to innovate. Only 8.5 per cent will introduce a new product, process or service that is unique to their market or the world in 2021. This compares with 53.3 per cent of businesses in top-placed India. This may impact the growth of many Hong Kong small businesses as the survey results show that innovative businesses are significantly more likely to grow. To improve innovation, Hong Kong’s small businesses could take greater advantage of Hong Kong’s proximity to leading innovation and technology centres such as Shenzhen. They should also consider the opportunities offered by significant government support for innovation. Jobs The small number of Hong Kong small businesses that grew in 2020 is reflected in the number that created new jobs. Only 9.2 per cent added to their headcount last year, compared with the survey average of 24.8 per cent. Reflecting weak business confidence for 2021, only 11.8 per cent of Hong Kong small businesses expect to increase employee numbers this year. This is the second lowest result of the markets surveyed. Exports COVID-19 has also hit expectations for revenue growth from exports in 2021. Only 3.9 per cent of Hong Kong small businesses expect revenue from overseas markets to grow strongly – the lowest of the markets surveyed. Access to finance Hong Kong small businesses were less likely to have needed external finance for business growth last year. 31.4 per cent of businesses sought finance for growth in 2020 compared with 46.2 per cent in 2019. The percentage that sought external finance for business survival increased slightly from 44.0 per cent in 2019 to 44.4 per cent in 2020. Small businesses in Hong Kong were the most likely to nominate government grants as their main source of finance in 2020 (32.5 per cent). Banks were the next most likely source.
Hong Kong 2021
Survey average
2021
Rank 2021
Hong Kong 2020
Rank
2020
Hong Kong 2019
Hong Kong 2018
Hong Kong 2017
Expect to increase employee numbers 11.8% 36.1% 10/11 14.2% 10/11 22.9% 33.9% 30.2%
Will introduce a new product, service or process unique to their market or the world
8.5% 23.0% 10/11 8.6% 9/11 12.5% 13.5% 14.8%
Expect revenue from overseas markets to grow strongly
3.9% 15.3% 11/11 5.3% 10/11 7.9% 15.5% 13.5%
Will seek external funds 17.6% 27.3% 8/11 14.9% 7/11 17.9% 21.9% 24.4%
Expect easy to very easy access to finance
16.2% 28.0% 10/11 14.1% 10/11 11.8% 21.5% 19.3%

99 | CPA AUSTRALIA ASIA-PACIFIC SMALL BUSINESS SURVEY 2020-21
Factors that had positive and negative influences on business
Top four factors that had a positive influence on Hong Kong small business in 2020
Top four factors that had a positive influence on Hong Kong small business in 2019
Top four factors that had a positive influence on Hong Kong small business in 2018
Cost control Cost control Cost control
Customer loyalty Good staff Customer loyalty
Government support/incentives Customer loyalty Good staff Introduced a new product or service^ Good staff Political stability
^ equal third
Top four factors that had a negative impact on Hong Kong small business in 2020
Top four factors that had a negative impact on Hong Kong small business in 2019
Top four factors that had a negative impact on Hong Kong small business in 2018
COVID-19 Political instability Increasing costs
Poor overall economic environment Poor overall economic environment Increasing competition
Political instability Increasing competition Increasing rent
Increasing costs Increasing competition^
Increasing costs Staff costs
^ equal fourth
Hong Kong’s small businesses faced some significant local and global challenges in 2020. Like all other markets surveyed, COVID-19 was the major barrier to growth for Hong Kong’s small businesses, followed by the related ‘poor overall economic environment’. The costs Hong Kong’s small businesses nominated as being most detrimental to their business in 2020 was again rent, followed by staff costs. Given concerns around costs, it is not surprising that Hong Kong small businesses were again the most likely to nominate cost control as the factor that had the most positive impact on their business last year. Demographics
Hong Kong
2020
Survey average
2020
Rank 2020
Hong Kong 2019
Rank 2019
Hong Kong 2018
Hong Kong 2017
Hong Kong 2016
Business has been established for 10 years or less
54.9% 65.7% 9/11 52.8% 9/11 52.0% 64.8% 68.8%
Respondent is aged under 40 46.4% 53.9% 9/11 53.1% 7/11 44.4% 51.3% 55.3%
Respondent is the business owner 11.4% 42.1% 11/11 8.9% 11/11 11.1% 7.4% 8.4%
Business has 10 to 19 employees 41.8% 32.8% 4/11 50.8% 3/11 42.3% 58.4% 60.5%

100 | CPA AUSTRALIA ASIA-PACIFIC SMALL BUSINESS SURVEY 2020-21
India market summary Business and economic growth
India 2020
Survey average
2020
Rank 2020
India 2019
Rank 2019
Businesses that grew in the last 12 months 65.2% 46.2% 1/11 75.5% 5/11
Businesses that expect to grow in the next 12 months 86.7% 60.8% 1/11 82.0% 4/11
Businesses that expect the local economy to grow in the next 12 months 79.9% 58.6% 2/11 68.2% 5/11
2020 was relatively positive for India’s small businesses. 65.2 per cent of businesses stated that they grew last year. This was highest result amongst the 11 markets surveyed, however it was down from 2019. In addition, 43.6 per cent of India’s small businesses stated that they experienced very strong growth – again the highest result of the markets surveyed. In comparison, only 2.0 per cent of Hong Kong’s businesses recorded very strong growth in 2020. 2021 is expected to be a very strong year for India’s small businesses. 86.7 per cent expect to grow, the highest result of the markets surveyed. There are many positive aspects of the results from India. Many small businesses have characteristics strongly connected with growth, including a focus on: • technology • e-commerce • improving business strategy and customer satisfaction • innovation. We are therefore likely to see India’s small businesses recover quickly from COVID-19 and grow strongly in 2021 and beyond. Several of India’s current small businesses are likely to evolve into large, successful global businesses in the next few years.
75.5%
65.2%65.8%
46.2%
2019 2020
Small businesses that reported growing in the previous 12 months - India against
survey average
India Survey average
82.0%86.7%
68.2%60.8%
2019 2020
Small businesses that expect to grow in the next 12 months - India against survey average
India Survey average

101 | CPA AUSTRALIA ASIA-PACIFIC SMALL BUSINESS SURVEY 2020-21
Impacts of COVID-19
India 2020 Survey
average 2020
Rank 2020
COVID-19 had a major negative impact on my business in the past 12 months 50.0% 57.1% 9/11
My business’s major reaction to COVID-19 was to begin or increase its focus on online sales
31.4% 24.6% 4/11
My business has already recovered from the negative impacts of COVID-19 or I expect it to recover in the next 12 months
28.3% 39.0% 9/11
Like all markets, small businesses from India considered COVID-19 their biggest challenge in 2020. 50.0 per cent selected the pandemic as having a major negative impact on their business last year, which was less than the survey average of 57.1 per cent. The pandemic is likely to remain a significant challenge for India’s small businesses in 2021. Only 28.3 per cent have already recovered or expect to recover from the negative impacts of COVID-19 in 2021 – lower than the survey average of 39.0 per cent. Use of technology
India 2020 Survey
average 2020
Rank 2020 India 2019 Rank 2019
Did NOT earn any revenue from online sales 10.0% 22.6% 10/11 28.1% 6/11
Did NOT use social media for business purposes 14.5% 18.3% 7/11 23.9% 4/11
Investment in technology by the business over the past 12 months has improved profitability
75.8% 48.1% 2/11 59.7% 4/11
Technology your business invested in most heavily over the past 12 months
Customer Relationship Management
software
Computer equipment
N/A Computer equipment
N/A
Consider your business likely to be subjected to a cyberattack in next 12 months
68.2% 38.8% 1/11 38.7% 5/11
Reviewed your business’s cybersecurity protections in last six months
51.0% 43.1% 2/11 38.5% 7/11
More than 10 per cent of sales is received through digital payment options such as PayPal, Alipay, WeChat Pay
82.7% 64.2% 2/11 63.4% 3/11
Small businesses from India are strong users of digital technologies, particularly in comparison to Australia, Singapore and New Zealand. Most make online sales and 75.6 per cent earned more than ten per cent of their revenue from that channel in 2020. In addition, 31.4 per cent began or increased its focus on e-commerce as a response to COVID-19. Further, most use social media for business purposes. Only 14.5 per cent of India’s small businesses do not use social media. 50.2 per cent use it to promote their business to potential customers. Most of India’s small businesses allow customers to pay using new digital payment technologies such as Paytm, PhonePe and Amazon Pay. 82.7 per cent received more than 10 per cent of their sales through such technologies, well above the survey average of 64.2 per cent.

102 | CPA AUSTRALIA ASIA-PACIFIC SMALL BUSINESS SURVEY 2020-21

103 | CPA AUSTRALIA ASIA-PACIFIC SMALL BUSINESS SURVEY 2020-21
India’s small businesses take cybersecurity seriously. 51.0 per cent reviewed their cybersecurity in the past six months. However, an even stronger focus on cybersecurity would be beneficial given 68.2 per cent believe that they will be cyberattacked in 2021 – the highest result of the markets surveyed. Helping to drive this focus on technology are the strong returns such investments are generating. 75.8 per cent of India’s small businesses that invested in technology in 2020 found that such investments were already profitable. This result is the second highest, only behind Vietnam. Business activity over the past 12 months
India 2020
Survey average
2020
Rank 2020
India 2019
Rank 2019
Increased employee numbers 56.4% 24.8% 1/11 39.5% 4/11
Improved customer satisfaction had a major positive impact on my business
35.0% 22.6% 1/11 36.6% 5/11
Increasing costs had a major negative impact on the business 32.2% 23.4% 1/11 35.6% 4/11
Required funds from an external source 79.7% 57.6% 1/11 59.7% 5/11
Sought external funds for business growth 58.3% 44.7% 1/11 58.6% 4/11
Sought external funds for business survival 46.6% 41.0% 3/11 22.5% 7/11
Found it easy or very easy to access external finance 52.5% 34.0% 2/11 31.1% 4/11
A bank was the business’s main source of external finance 11.3% 28.4% 11/11 33.8% 5/11
Planned business activity over the next 12 months
India 2021
Survey average
2021
Rank 2021
India 2020
Rank 2020
Expect to increase employee numbers 70.9% 36.1% 1/11 57.5% 4/11
Will introduce a new product, service or process unique to their market or the world
53.3% 23.0% 1/11 34.2% 4/11
Expect revenue from overseas markets to grow strongly 44.9% 15.3% 1/11 27.5% 2/11
Will seek external funds 50.0% 27.3% 2/11 29.6% 4/11
Expect easy to very easy access to finance 48.8% 28.0% 1/11 26.8% 4/11
Innovation India’s small businesses are very innovative. 53.3 per cent will introduce a totally new product, process or service to their market or the world in 2021 – the highest result of the markets surveyed. The survey results show that innovative businesses are more likely to grow. Jobs Reflecting positive business conditions, India’s small businesses were a major source of jobs growth in 2020. 56.4 per cent added staff – again the highest result of the markets surveyed.

104 | CPA AUSTRALIA ASIA-PACIFIC SMALL BUSINESS SURVEY 2020-21
The very high growth expectations of India’s small businesses in 2021 is expected to see large numbers of businesses employing additional staff. 70.9 per cent expect to add jobs this year, the highest result of the markets surveyed. Access to finance India’s small businesses had very strong demand for external finance in 2020. 79.7 per cent needed external finance last year, up from 59.7 per cent in 2019. India’s small business were the most likely to source that finance for business growth. Of those businesses that sought external finance, most found the experience easy or very easy. India’s small businesses were the second most likely to report easy access to finance. India’s small businesses were the most likely to source that finance from a non-bank financial institution. Factors that had positive and negative influences on business
Top four factors that had a positive influence on Indian small business in 2020
Top four factors that had a positive influence on Indian small business in 2019
Improved business strategy Improved customer satisfaction
Improved customer satisfaction Good staff
Technology Customer loyalty
Customer loyalty Technology
^ equal third Small businesses in India found that ‘improved business strategy’ and ‘improved customer satisfaction’ had the most positive impacts on their business in 2020. This indicates that many of India’s small businesses are focused on longer-term growth.
Top four factors that had a negative impact on Indian small business in 2020
Top four factors that had a negative impact on Indian small business in 2019
COVID-19 Increasing costs
Cash flow difficulties Increasing competition
Poor overall economic environment Increasing competition^
Tax
Cash flow difficulties
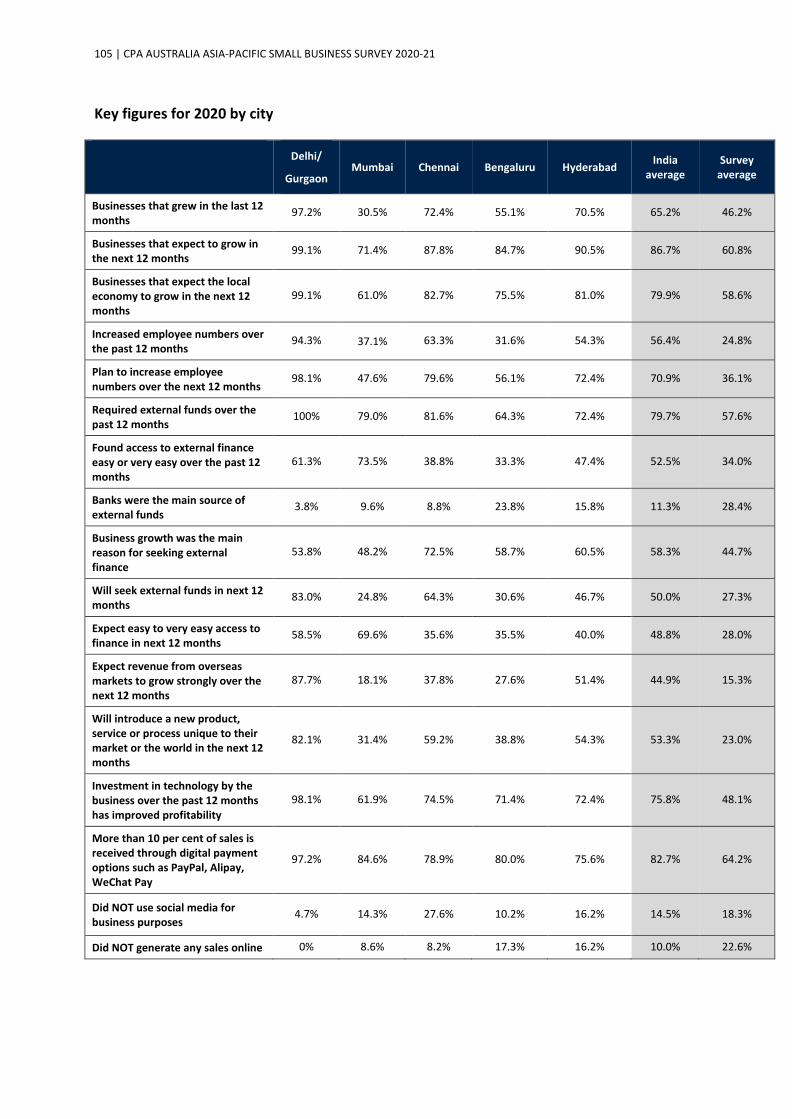
105 | CPA AUSTRALIA ASIA-PACIFIC SMALL BUSINESS SURVEY 2020-21
Key figures for 2020 by city Delhi/
Gurgaon Mumbai Chennai Bengaluru Hyderabad India
average Survey
average
Businesses that grew in the last 12 months
97.2% 30.5% 72.4% 55.1% 70.5% 65.2% 46.2%
Businesses that expect to grow in the next 12 months
99.1% 71.4% 87.8% 84.7% 90.5% 86.7% 60.8%
Businesses that expect the local economy to grow in the next 12 months
99.1% 61.0% 82.7% 75.5% 81.0% 79.9% 58.6%
Increased employee numbers over the past 12 months
94.3% 37.1% 63.3% 31.6% 54.3% 56.4% 24.8%
Plan to increase employee numbers over the next 12 months
98.1% 47.6% 79.6% 56.1% 72.4% 70.9% 36.1%
Required external funds over the past 12 months
100% 79.0% 81.6% 64.3% 72.4% 79.7% 57.6%
Found access to external finance easy or very easy over the past 12 months
61.3% 73.5% 38.8% 33.3% 47.4% 52.5% 34.0%
Banks were the main source of external funds
3.8% 9.6% 8.8% 23.8% 15.8% 11.3% 28.4%
Business growth was the main reason for seeking external finance
53.8% 48.2% 72.5% 58.7% 60.5% 58.3% 44.7%
Will seek external funds in next 12 months
83.0% 24.8% 64.3% 30.6% 46.7% 50.0% 27.3%
Expect easy to very easy access to finance in next 12 months
58.5% 69.6% 35.6% 35.5% 40.0% 48.8% 28.0%
Expect revenue from overseas markets to grow strongly over the next 12 months
87.7% 18.1% 37.8% 27.6% 51.4% 44.9% 15.3%
Will introduce a new product, service or process unique to their market or the world in the next 12 months
82.1% 31.4% 59.2% 38.8% 54.3% 53.3% 23.0%
Investment in technology by the business over the past 12 months has improved profitability
98.1% 61.9% 74.5% 71.4% 72.4% 75.8% 48.1%
More than 10 per cent of sales is received through digital payment options such as PayPal, Alipay, WeChat Pay
97.2% 84.6% 78.9% 80.0% 75.6% 82.7% 64.2%
Did NOT use social media for business purposes
4.7% 14.3% 27.6% 10.2% 16.2% 14.5% 18.3%
Did NOT generate any sales online 0% 8.6% 8.2% 17.3% 16.2% 10.0% 22.6%

106 | CPA AUSTRALIA ASIA-PACIFIC SMALL BUSINESS SURVEY 2020-21
Think it is LIKELY their business will be cyberattacked in the next 12 months
97.2% 66.7% 69.4% 39.8% 65.7% 68.2% 38.8%
Reviewed the business’s cybersecurity protections in past six months
52.8% 61.9% 59.2% 48.0% 33.3% 50.1% 43.1%
Staff costs were most detrimental to the business
47.2% 42.9% 48.0% 35.7% 46.7% 44.1% 32.6%
Respondent aged under 40 90.6% 48.6% 72.4% 59.2% 66.7% 67.6% 53.9%
COVID-19 had a major negative impact on my business in the past 12 months
43.4% 40.0% 52.0% 64.3% 51.4% 50.0% 57.1%
My business’s major reaction to COVID-19 was to begin or increase its focus on online sales
33.0% 20.0% 44.9% 32.7% 27.6% 31.4% 24.6%
My business has already recovered from the negative impacts of COVID-19 or I expect it to recover in the next 12 months
8.5% 26.7% 42.9% 36.7% 28.6% 28.3% 39.0%
• Small businesses from Delhi/Gurgaon were the most likely to grow, increase employee numbers and need
external finance in 2020. • Small businesses from Bengaluru were the most likely to have been negatively impacted COVID-19, while
small businesses from Mumbai were the least. • Small businesses from Chennai were the most likely to have recovered or expect to recover from negative
impacts of COVID-19 in 2021. • Small businesses from Mumbai were the most likely to experience easy financing conditions. • Small businesses from Bengaluru were the most likely to source finance from a bank. • Small businesses from Delhi/Gurgaon were the most likely to source finance from a non-bank financial
institution. • Small businesses from Delhi/Gurgaon are the most likely to innovate in 2021. • Delhi/Gurgaon small businesses were the most likely to find ‘introduced a new product or service’ and
‘improved customer satisfaction’ had major positive impacts on their business in 2020. • Chennai small businesses were the most likely to find ‘technology’ had a major positive impact on their
business in 2020. • Delhi/Gurgaon businesses were the most likely to receive more than 10 per cent of their sales through
digital payment options. • Bengaluru small businesses were the most likely to use social media to promote their business to potential
customers and to communicate with existing customers. • Mumbai small businesses were the most likely to have reviewed their cybersecurity protections in the past
six months. • Delhi/Gurgaon small businesses are the most likely to expect a cyberattack in 2021.

107 | CPA AUSTRALIA ASIA-PACIFIC SMALL BUSINESS SURVEY 2020-21
Demographics
India 2020 Survey average 2020 Rank 2020 India 2019 Rank 2019
Business has been established for 10 years or less
70.3% 65.7% 5/11 72.1% 5/11
Respondent is aged under 40
67.6% 53.9% 3/11 61.3% 6/11
Respondent is the business owner
50.8% 42.1% 6/11 55.1% 5/11
Business has 10 to 19 employees
53.3% 32.8% 1/11 25.7% 5/11

108 | CPA AUSTRALIA ASIA-PACIFIC SMALL BUSINESS SURVEY 2020-21
Indonesia market summary Business and economic growth
Indonesia 2020
Survey average
2020
Rank 2020
Indonesia 2019
Rank 2019
Indonesia 2018
Indonesia 2017
Indonesia 2016
Businesses that grew in the last 12 months
57.5% 46.2% 4/11 87.3% 2/11 86.6% 93.4% 90.4%
Businesses that expect to grow in the next 12 months
76.1% 60.8% 3/11 88.3% 3/11 90.8% 94.7% 94.7%
Businesses that expect the local economy to grow in the next 12 months
68.8% 58.6% 3/11 75.7% 4/11 79.0% 83.6% 90.1%
2020 was a weaker year for Indonesia’s small businesses than 2019. 57.5 per cent grew last year, which is higher than the survey average of 46.2 per cent. However, this is down significantly from the 87.3 per cent that grew in 2019. 2021 is expected to be a better year for Indonesia’s small businesses. 76.1 per cent of businesses expect to grow, the third highest result of the 11 markets surveyed. There are many positive aspects of the results from Indonesia. Many small businesses have characteristics strongly connected with growth, including a focus on: • technology • e-commerce • improving customer satisfaction • innovation. We are therefore likely to see Indonesia’s small businesses recover quickly from COVID-19 and grow strongly in 2021 and beyond. Several of Indonesia’s current small businesses are likely to evolve into large, successful global businesses in the next few years.
40%
50%
60%
70%
80%
90%
100%
2014 2015 2016 2017 2018 2019 2020
Small businesses that reported growing in the previous 12 months - Indonesia against survey
average
Indonesia Survey average
40%
50%
60%
70%
80%
90%
100%
2011 2012 2013 2014 2015 2016 2017 2018 2019 2020
Small businesses that expect to grow in the next 12 months - Indonesia against survey
average
Indonesia Survey average

109 | CPA AUSTRALIA ASIA-PACIFIC SMALL BUSINESS SURVEY 2020-21
Impacts of COVID-19
Indonesia 2020
Survey average
2020 Rank 2020
COVID-19 had a major negative impact on my business in the past 12 months 68.1% 57.1% 2/11
My business’s major reaction to COVID-19 was to begin or increase its focus on online sales 37.9% 24.6% 3/11
My business has already recovered from the negative impacts of COVID-19 or I expect it to recover in the next 12 months
46.8% 39.0% 3/11
Like all markets, Indonesia’s small businesses considered COVID-19 their biggest challenge in 2020. 68.1 per cent selected it as a major barrier to growth, the second highest result amongst the markets surveyed. COVID-19 is however not expected to be a major limiting factor for many Indonesian small businesses in 2021. 46.8 per cent have already recovered from the negative impacts of the pandemic or expect to recover in 2021, the third highest result amongst the markets surveyed. Use of technology
Indonesia 2020
Survey average
2020
Rank 2020
Indonesia 2019
Rank 2019
Indonesia 2018
Indonesia 2017
Indonesia 2016
Did NOT earn any revenue from online sales
12.0% 22.6% 8/11 14.0% 9/11 11.1% 6.9% 14.9%
Did NOT use social media for business purposes
14.6% 18.3% 6/11 11.3% 8/11 7.2% 8.2% 9.6%
Investment in technology by the business over the past 12 months has improved profitability
74.4% 48.1% 3/11 76.7% 2/11 77.4% 85.5% N/A
Technology the business invested in most heavily over the past 12 months
Mobile apps Computer equipment
N/A Computer equipment
Mobile apps^ N/A
Computer equipment
N/A N/A
Consider the business likely to be cyberattacked in next 12 months
63.8% 38.8% 2/11 58.7% 2/11 65.6% 76.6% N/A
Reviewed the business’s cybersecurity protections in past six months
43.2% 43.1% 4/11 47.0% 3/11 47.2% N/A N/A
More than 10 per cent of sales is received through digital payment options such as PayPal, Alipay, WeChat Pay
60.0% 64.2% 6/11 53.9% 4/11 61.4% 48.7% N/A
^ equal first

110 | CPA AUSTRALIA ASIA-PACIFIC SMALL BUSINESS SURVEY 2020-21
One factor driving growth of Indonesia’s small businesses is their relatively strong uptake of new technologies. Most Indonesian small businesses sell online. 58.1 per cent received more than 10 per cent of their revenue from online sales. Further, an overwhelming majority of Indonesia’s small business use social media. Only 12.0 per cent do not use social media in their business. Indonesia’s small businesses are the most likely to use social media for selling products or services. Most of Indonesia’s small businesses offer customers the choice of paying by new digital and mobile payment technologies, such as OVO, GoPay, PayPal and TCASH. 60.0 per cent received more than 10 per cent of their sales through such technology, slightly below the survey average of 64.2 per cent. Cash however remains a very important payment option for Indonesia’s small businesses. 60.0 per cent state that it makes up 50 per cent or more of their sales. This is down from 69.0 per cent in 2019. Given the broad cross-section of industries represented in Indonesia’s survey sample, it is assumed that many business-to-business transactions are done in cash. Indonesia’s small businesses could take cybersecurity more seriously. While 53.8 per cent expect to be cyberattacked in 2021, only 43.2 per cent have reviewed their cybersecurity in the past six months. Helping to drive this focus on technology are the strong returns such investments are generating. 74.4 per cent of Indonesia’s small businesses that invested in technology in 2020 reported such investments were already profitable. This is the third highest result of the 11 markets surveyed. Business activity over the past 12 months
Indonesia 2020
Survey average
2020
Rank 2020
Indonesia 2019
Rank 2019
Indonesia 2018
Indonesia 2017
Indonesia 2016
Increased employee numbers 30.9% 24.8% 2/11 50.7% 2/11 55.7% 65.5% 63.4%
Improved customer satisfaction had a major positive impact on my business
27.6% 22.6% 4/11 41.0% 2/11 46.6% 48.4% 46.9%
Increasing costs had a major negative impact on their business
20.3% 23.4% 8/11 33.3% 7/11 42.0% 35.5% 34.3%
Required funds from an external source
72.1% 57.6% 3/11 70.3% 2/11 75.7% 88.8% 82.5%
Sought external funds for business growth
50.7% 44.7% 3/11 64.9% 2/11 74.9% 77.8% 70.0%
Sought external funds for business survival
51.6% 41.0% 1/11 37.9% 2/11 48.9% 48.5% 50.8%
Found it easy or very easy to access external finance 30.9% 34.0% 6/11 25.6% 6/11 36.4% 47.0% 39.2%
A bank was the business’s main source of external finance
31.3% 28.4% 4/11 34.6% 4/11 43.7% 55.2% 50.0%
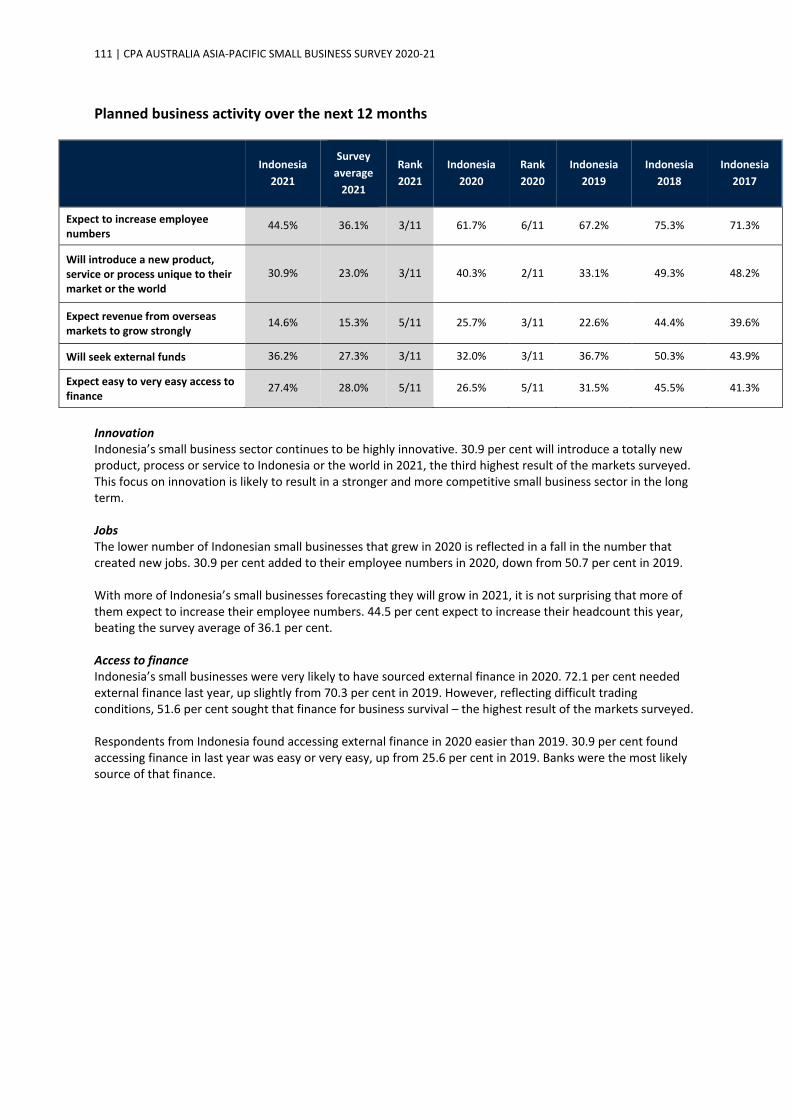
111 | CPA AUSTRALIA ASIA-PACIFIC SMALL BUSINESS SURVEY 2020-21
Planned business activity over the next 12 months
Indonesia 2021
Survey average
2021
Rank 2021
Indonesia 2020
Rank 2020
Indonesia 2019
Indonesia 2018
Indonesia 2017
Expect to increase employee numbers
44.5% 36.1% 3/11 61.7% 6/11 67.2% 75.3% 71.3%
Will introduce a new product, service or process unique to their market or the world
30.9% 23.0% 3/11 40.3% 2/11 33.1% 49.3% 48.2%
Expect revenue from overseas markets to grow strongly
14.6% 15.3% 5/11 25.7% 3/11 22.6% 44.4% 39.6%
Will seek external funds 36.2% 27.3% 3/11 32.0% 3/11 36.7% 50.3% 43.9%
Expect easy to very easy access to finance
27.4% 28.0% 5/11 26.5% 5/11 31.5% 45.5% 41.3%
Innovation Indonesia’s small business sector continues to be highly innovative. 30.9 per cent will introduce a totally new product, process or service to Indonesia or the world in 2021, the third highest result of the markets surveyed. This focus on innovation is likely to result in a stronger and more competitive small business sector in the long term. Jobs The lower number of Indonesian small businesses that grew in 2020 is reflected in a fall in the number that created new jobs. 30.9 per cent added to their employee numbers in 2020, down from 50.7 per cent in 2019. With more of Indonesia’s small businesses forecasting they will grow in 2021, it is not surprising that more of them expect to increase their employee numbers. 44.5 per cent expect to increase their headcount this year, beating the survey average of 36.1 per cent. Access to finance Indonesia’s small businesses were very likely to have sourced external finance in 2020. 72.1 per cent needed external finance last year, up slightly from 70.3 per cent in 2019. However, reflecting difficult trading conditions, 51.6 per cent sought that finance for business survival – the highest result of the markets surveyed. Respondents from Indonesia found accessing external finance in 2020 easier than 2019. 30.9 per cent found accessing finance in last year was easy or very easy, up from 25.6 per cent in 2019. Banks were the most likely source of that finance.
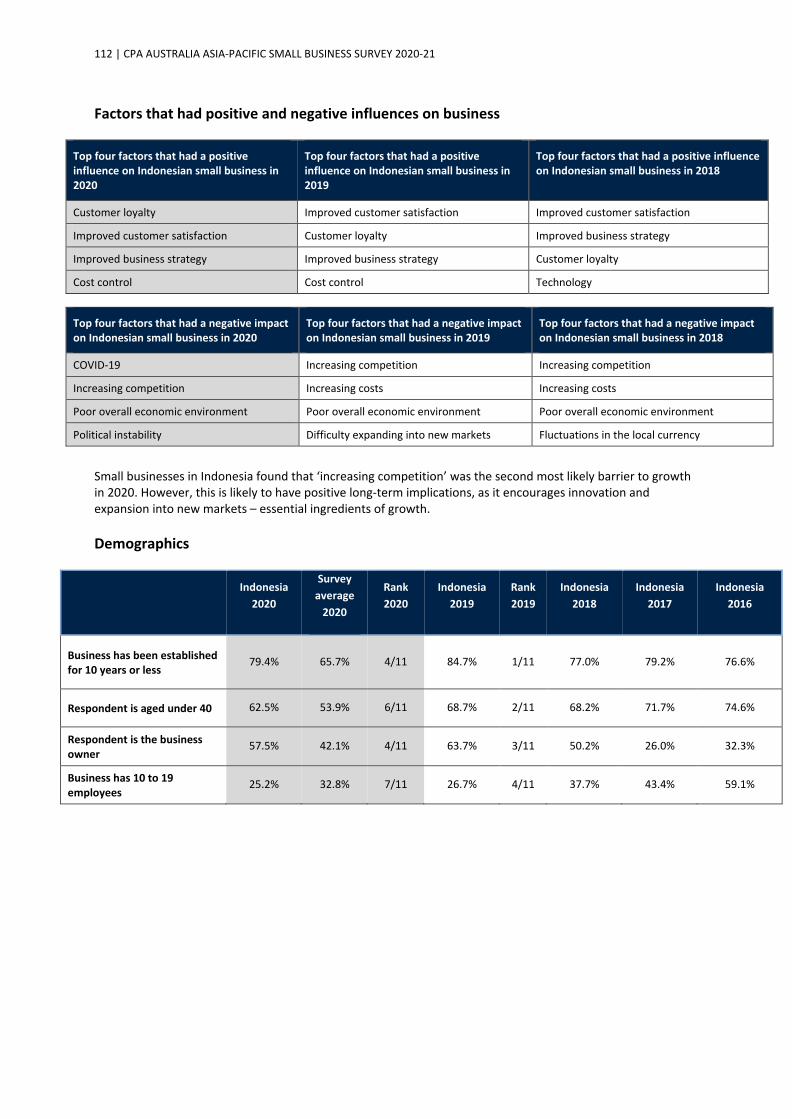
112 | CPA AUSTRALIA ASIA-PACIFIC SMALL BUSINESS SURVEY 2020-21
Factors that had positive and negative influences on business
Top four factors that had a positive influence on Indonesian small business in 2020
Top four factors that had a positive influence on Indonesian small business in 2019
Top four factors that had a positive influence on Indonesian small business in 2018
Customer loyalty Improved customer satisfaction Improved customer satisfaction
Improved customer satisfaction Customer loyalty Improved business strategy
Improved business strategy Improved business strategy Customer loyalty
Cost control Cost control Technology
Top four factors that had a negative impact on Indonesian small business in 2020
Top four factors that had a negative impact on Indonesian small business in 2019
Top four factors that had a negative impact on Indonesian small business in 2018
COVID-19 Increasing competition Increasing competition
Increasing competition Increasing costs Increasing costs
Poor overall economic environment Poor overall economic environment Poor overall economic environment
Political instability Difficulty expanding into new markets Fluctuations in the local currency
Small businesses in Indonesia found that ‘increasing competition’ was the second most likely barrier to growth in 2020. However, this is likely to have positive long-term implications, as it encourages innovation and expansion into new markets – essential ingredients of growth. Demographics
Indonesia
2020
Survey average
2020
Rank 2020
Indonesia 2019
Rank 2019
Indonesia 2018
Indonesia 2017
Indonesia 2016
Business has been established for 10 years or less
79.4% 65.7% 4/11 84.7% 1/11 77.0% 79.2% 76.6%
Respondent is aged under 40 62.5% 53.9% 6/11 68.7% 2/11 68.2% 71.7% 74.6%
Respondent is the business owner
57.5% 42.1% 4/11 63.7% 3/11 50.2% 26.0% 32.3%
Business has 10 to 19 employees
25.2% 32.8% 7/11 26.7% 4/11 37.7% 43.4% 59.1%
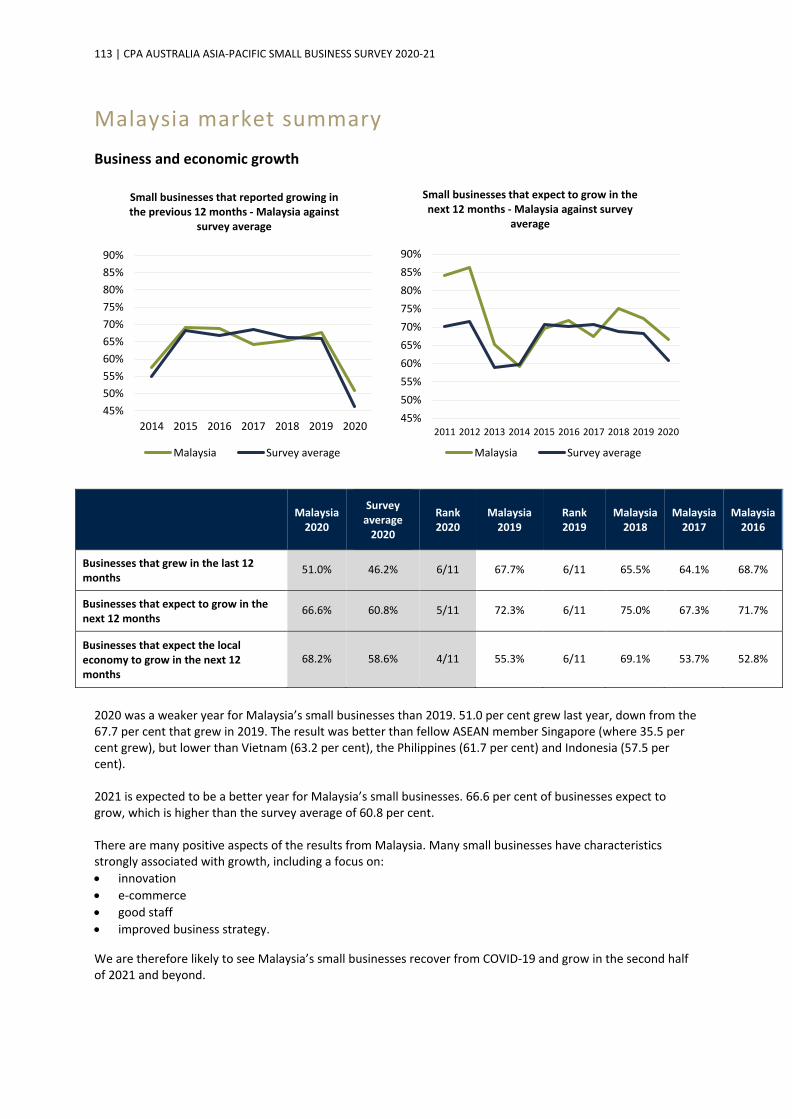
113 | CPA AUSTRALIA ASIA-PACIFIC SMALL BUSINESS SURVEY 2020-21
Malaysia market summary Business and economic growth
Malaysia 2020
Survey average
2020
Rank 2020
Malaysia 2019
Rank 2019
Malaysia 2018
Malaysia 2017
Malaysia 2016
Businesses that grew in the last 12 months
51.0% 46.2% 6/11 67.7% 6/11 65.5% 64.1% 68.7%
Businesses that expect to grow in the next 12 months
66.6% 60.8% 5/11 72.3% 6/11 75.0% 67.3% 71.7%
Businesses that expect the local economy to grow in the next 12 months
68.2% 58.6% 4/11 55.3% 6/11 69.1% 53.7% 52.8%
2020 was a weaker year for Malaysia’s small businesses than 2019. 51.0 per cent grew last year, down from the 67.7 per cent that grew in 2019. The result was better than fellow ASEAN member Singapore (where 35.5 per cent grew), but lower than Vietnam (63.2 per cent), the Philippines (61.7 per cent) and Indonesia (57.5 per cent). 2021 is expected to be a better year for Malaysia’s small businesses. 66.6 per cent of businesses expect to grow, which is higher than the survey average of 60.8 per cent. There are many positive aspects of the results from Malaysia. Many small businesses have characteristics strongly associated with growth, including a focus on: • innovation • e-commerce • good staff • improved business strategy.
We are therefore likely to see Malaysia’s small businesses recover from COVID-19 and grow in the second half of 2021 and beyond.
45%50%55%60%65%70%75%80%85%90%
2014 2015 2016 2017 2018 2019 2020
Small businesses that reported growing in the previous 12 months - Malaysia against
survey average
Malaysia Survey average
45%50%55%60%65%70%75%80%85%90%
2011 2012 2013 2014 2015 2016 2017 2018 2019 2020
Small businesses that expect to grow in the next 12 months - Malaysia against survey
average
Malaysia Survey average

114 | CPA AUSTRALIA ASIA-PACIFIC SMALL BUSINESS SURVEY 2020-21
Impacts of COVID-19
Malaysia 2020
Survey average
2020 Rank 2020
COVID-19 had a major negative impact on my business in the past 12 months 66.9% 57.1% 3/11
My business’s major reaction to COVID-19 was to begin or increase its focus on online sales 40.4% 24.6% 2/11
My business has already recovered from the negative impacts of COVID-19 or I expect it to recover in the next 12 months
31.5% 39.0% 6/11
Like all markets, Malaysian small businesses considered COVID-19 their biggest challenge in 2020. 66.9 per cent selected it as their biggest barrier to growth, the third highest result amongst the markets surveyed. COVID-19 is expected to continue to create challenges for Malaysia’s small businesses in 2021. Only 31.5 per cent have recovered or expect to recover from the negative impacts of the pandemic in 2021, below the survey average of 39.0 per cent. Use of technology
Malaysia 2020
Survey average
2020
Rank 2020
Malaysia 2019
Rank 2019
Malaysia 2018
Malaysia 2017
Malaysia 2016
Did NOT earn any revenue from online sales
14.2% 22.6% 7/11 18.0% 8/11 29.3% 52.6% 59.1%
Did NOT use social media for business purposes
10.6% 18.3% 9/11 11.3% 9/11 15.8% 40.8% 40.2%
Investment in technology by the business over the past 12 months has improved profitability
42.4% 48.1% 6/11 45.7% 6/11 41.4% 50.8% N/A
Technology the business invested in most heavily over the past 12 months
Computer equipment
Computer equipment
N/A Computer equipment
N/A Computer equipment
N/A N/A
Consider the business likely to be cyberattacked in next 12 months
46.7% 38.8% 3/11 41.7% 4/11 45.4% 19.6% N/A
Reviewed the business’s cybersecurity protections in last six months
44.4% 43.1% 3/11 45.0% 4/11 37.2% N/A N/A
More than 10 per cent of sales is received through digital payment options such as PayPal, Alipay, WeChat Pay
52.5% 64.2% 8/11 51.1% 7/11 47.7% 33.0% N/A
One factor driving growth of Malaysia’s small business is their relatively strong use of digital technologies. Selling online is becoming increasingly important for Malaysia’s small businesses. 63.9 per cent earned more than ten per cent of their revenue from online sales in 2020, up from 47.5 per cent in 2019.

115 | CPA AUSTRALIA ASIA-PACIFIC SMALL BUSINESS SURVEY 2020-21
COVID-19 acted as a catalyst for the increase in online sales. 40.4 per cent of Malaysian small businesses began or increased their focus on online sales as a major reaction to COVID-19 – the second highest result of the markets surveyed. Further, an overwhelming majority of Malaysia’s small businesses use social media. Only 10.6 per cent do not use social media in their business. 61.3 per cent use it to promote their business to potential customers. Most of Malaysia’s small businesses offer customers the choice of paying by new digital and mobile payment technologies to customers, such as Alipay, PayPal and iPay88. 52.5 per cent received more than 10 per cent of their sales through such technology, which is however below the survey average of 64.2 per cent. Cash however remains a very important payment option for Malaysia’s small businesses. 61.6 per cent stated that it made up 50 per cent or more of their sales in 2020, well above the survey average of 46.4 per cent. Given the broad cross-section of industries represented in Malaysia’s survey sample, it is assumed that many business-to-business transactions are done in cash. Malaysia’s small businesses have a relatively strong focus on cybersecurity. 44.4 per cent reviewed their cybersecurity measures in the past six months, while 46.7 per cent expected their business will be cyberattacked in 2021. Helping to drive this focus on technology are the strong returns such investments are generating. 42.4 per cent of Malaysia’s small businesses that invested in technology in 2020 reported such investments were already been profitable. Business activity over the past 12 months
Malaysia 2020
Survey average
2020
Rank 2020
Malaysia 2019
Rank 2019
Malaysia 2018
Malaysia 2017
Malaysia 2016
Increased employee numbers 15.6% 24.8% 7/11 26.7% 6/11 25.7% 27.5% 33.6%
Improved customer satisfaction had a major positive impact on my business
25.2% 22.6% 6/11 40.0% 4/11 41.8% 33.7% 30.0%
Increasing costs had a major negative impact on their business
27.8% 23.4% 3/11 44.7% 2/11 51.6% 52.1% 45.9%
Required funds from an external source
54.6% 57.6% 7/11 52.7% 7/11 39.5% 54.7% 62.2%
Sought external funds for business growth
43.6% 44.7% 5/11 58.9% 3/11 55.0% 62.1% 51.3%
Sought external funds for business survival
45.5% 41.0% 4/11 25.3% 6/11 35.8% 33.1% 35.1%
Found it easy or very easy to access external finance 13.9% 34.0% 10/11 15.8% 11/11 16.7% 13.0% 15.7%
A bank was the business’s main source of external finance
28.5% 28.4% 8/11 29.7% 7/11 35.8% 33.7% 40.8%
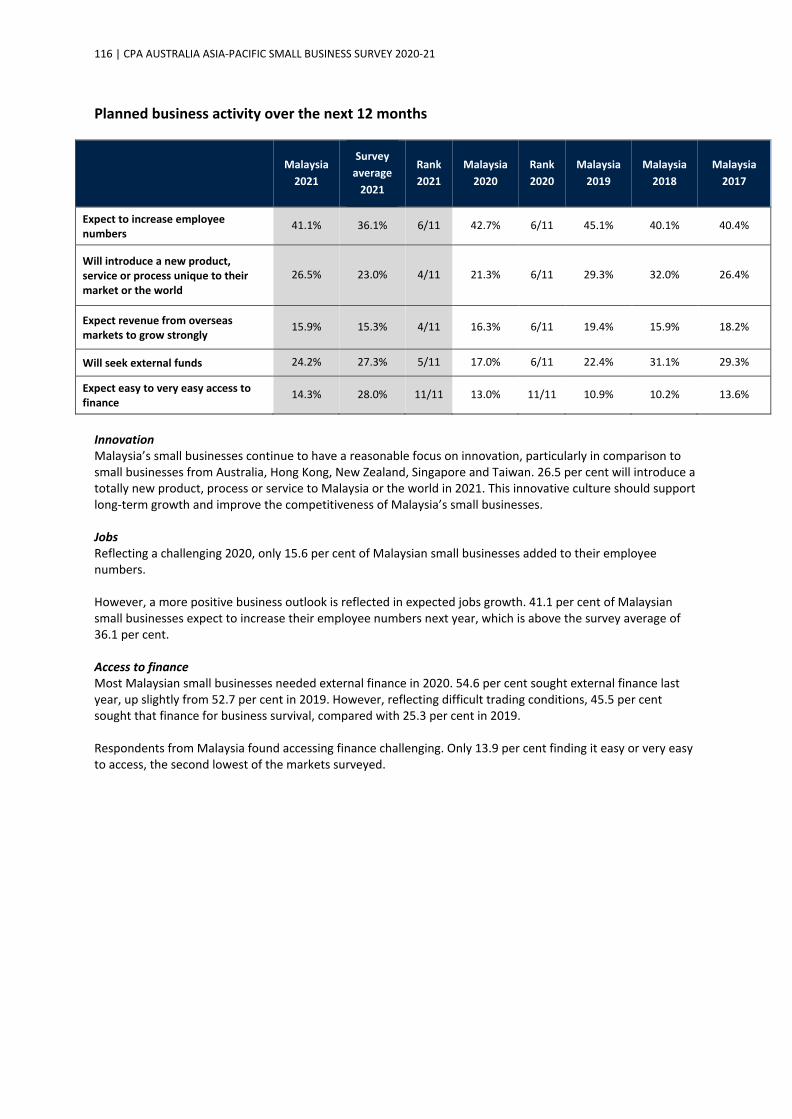
116 | CPA AUSTRALIA ASIA-PACIFIC SMALL BUSINESS SURVEY 2020-21
Planned business activity over the next 12 months
Malaysia 2021
Survey average
2021
Rank 2021
Malaysia 2020
Rank 2020
Malaysia 2019
Malaysia 2018
Malaysia 2017
Expect to increase employee numbers
41.1% 36.1% 6/11 42.7% 6/11 45.1% 40.1% 40.4%
Will introduce a new product, service or process unique to their market or the world
26.5% 23.0% 4/11 21.3% 6/11 29.3% 32.0% 26.4%
Expect revenue from overseas markets to grow strongly
15.9% 15.3% 4/11 16.3% 6/11 19.4% 15.9% 18.2%
Will seek external funds 24.2% 27.3% 5/11 17.0% 6/11 22.4% 31.1% 29.3%
Expect easy to very easy access to finance
14.3% 28.0% 11/11 13.0% 11/11 10.9% 10.2% 13.6%
Innovation Malaysia’s small businesses continue to have a reasonable focus on innovation, particularly in comparison to small businesses from Australia, Hong Kong, New Zealand, Singapore and Taiwan. 26.5 per cent will introduce a totally new product, process or service to Malaysia or the world in 2021. This innovative culture should support long-term growth and improve the competitiveness of Malaysia’s small businesses. Jobs Reflecting a challenging 2020, only 15.6 per cent of Malaysian small businesses added to their employee numbers. However, a more positive business outlook is reflected in expected jobs growth. 41.1 per cent of Malaysian small businesses expect to increase their employee numbers next year, which is above the survey average of 36.1 per cent. Access to finance Most Malaysian small businesses needed external finance in 2020. 54.6 per cent sought external finance last year, up slightly from 52.7 per cent in 2019. However, reflecting difficult trading conditions, 45.5 per cent sought that finance for business survival, compared with 25.3 per cent in 2019. Respondents from Malaysia found accessing finance challenging. Only 13.9 per cent finding it easy or very easy to access, the second lowest of the markets surveyed.

117 | CPA AUSTRALIA ASIA-PACIFIC SMALL BUSINESS SURVEY 2020-21
Factors that had positive and negative influences on business
Top four factors that had a positive influence on Malaysia small business in 2020
Top four factors that had a positive influence on Malaysian small business in 2019
Top four factors that had a positive influence on Malaysian small business in 2018
Customer loyalty Customer loyalty Customer loyalty
Cost control Improved customer satisfaction Improved customer satisfaction
Improved business strategy Good staff^
Good staff Good staff
Improved business strategy Improved business strategy
^ equal third
Top four factors that had a negative impact on Malaysian small business in 2020
Top four factors that had a negative impact on Malaysian small business in 2019
Top four factors that had a negative impact on Malaysian small business in 2018
COVID-19 Increasing costs Increasing costs
Increasing costs Increasing competition Increasing competition
Increasing competition Poor overall economic environment^
Poor overall economic environment Poor overall economic environment
Fluctuations in the value of the local currency
Fluctuations in the value of the local currency
^ equal third Small businesses in Malaysia found that ‘increasing costs’ was the second most likely barrier to growth in 2020. Utilities and materials were the costs that caused them the most detriment. Demographics
Malaysia
2020
Survey average
2020
Rank 2020
Malaysia 2019
Rank 2019
Malaysia 2018
Malaysia 2017
Malaysia 2016
Business has been established for 10 years or less
82.8% 65.7% 2/11 73.0% 4/11 73.7% 70.2% 73.3%
Respondent is aged under 40 66.2% 53.9% 4/11 64.0% 5/11 61.5% 57.6% 76.9%
Respondent is the business owner
51.0% 42.1% 5/11 51.3% 6/11 55.6% 41.7% 33.2%
Business has 10 to 19 employees
25.8% 32.8% 6/11 19.0% 9/11 21.4% 32.0% 47.2%

118 | CPA AUSTRALIA ASIA-PACIFIC SMALL BUSINESS SURVEY 2020-21
New Zealand market summary Business and economic growth
NZ
2020 Survey
average Rank 2020
NZ 2019
Rank 2019
NZ 2018 NZ 2017 NZ 2016
Businesses that grew in the last 12 months 29.7% 46.2% 9/11 49.7% 9/11 57.4% 58.5% 58.1%
Businesses that expect to grow in the next 12 months 44.0% 60.8% 9/11 56.7% 7/11 63.2% 61.8% 71.1%
Businesses that expect the local economy to grow in the next 12 months
41.7% 58.6% 10/11 38.3% 9/11 46.5% 39.9% 61.5%
2020 was a significantly weaker year for New Zealand’s small businesses than 2019. Only 29.7 per cent grew last year, down significantly from the 49.7 per cent that grew in 2019. This result was third lowest among the 11 markets surveyed, with only Australia (22.3 per cent) and Hong Kong (16.3 per cent) reporting a lower percentage of businesses that grew. 2021 is expected to be a better year for New Zealand’s small business. However, New Zealand’s small business sector is likely to significantly underperform most of the Asia-Pacific region. Only 44.0 per cent expect to grow compared with the survey average of 60.8 per cent. The major contributors to the low anticipated numbers of growing businesses this year include a weak and uncertain economic outlook, and the small percentage of New Zealand small businesses that invest in or undertake activities that characterise growing businesses, especially: • innovation • e-commerce • social media use • exporting.
25%
35%
45%
55%
65%
75%
2011 2012 2013 2014 2015 2016 2017 2018 2019 2020
Small businesses that expect to grow in the next 12 months - New Zealand against survey average
New Zealand Survey average
25%
35%
45%
55%
65%
75%
2014 2015 2016 2017 2018 2019 2020
Small businesses that reported growing in the previous 12 months - New Zealand
against survey average
New Zealand Survey average
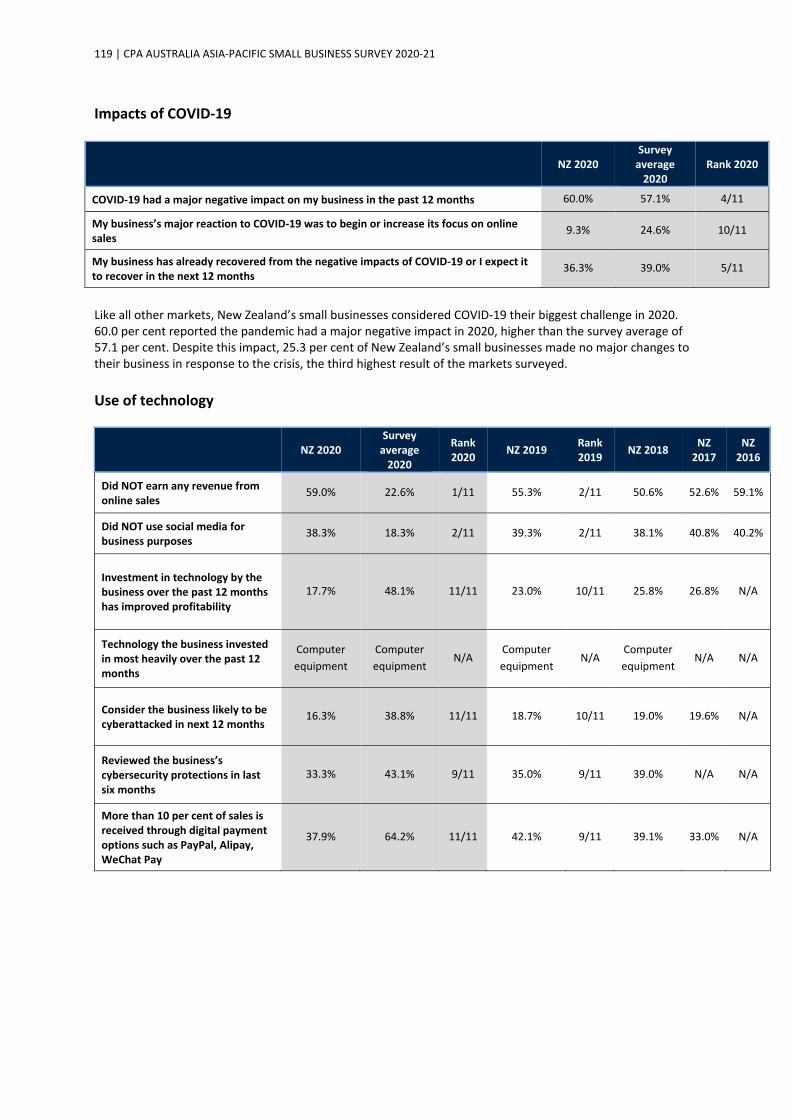
119 | CPA AUSTRALIA ASIA-PACIFIC SMALL BUSINESS SURVEY 2020-21
Impacts of COVID-19
NZ 2020 Survey
average 2020
Rank 2020
COVID-19 had a major negative impact on my business in the past 12 months 60.0% 57.1% 4/11
My business’s major reaction to COVID-19 was to begin or increase its focus on online sales
9.3% 24.6% 10/11
My business has already recovered from the negative impacts of COVID-19 or I expect it to recover in the next 12 months
36.3% 39.0% 5/11
Like all other markets, New Zealand’s small businesses considered COVID-19 their biggest challenge in 2020. 60.0 per cent reported the pandemic had a major negative impact in 2020, higher than the survey average of 57.1 per cent. Despite this impact, 25.3 per cent of New Zealand’s small businesses made no major changes to their business in response to the crisis, the third highest result of the markets surveyed. Use of technology
NZ 2020 Survey
average 2020
Rank 2020 NZ 2019 Rank
2019 NZ 2018 NZ 2017
NZ 2016
Did NOT earn any revenue from online sales
59.0% 22.6% 1/11 55.3% 2/11 50.6% 52.6% 59.1%
Did NOT use social media for business purposes
38.3% 18.3% 2/11 39.3% 2/11 38.1% 40.8% 40.2%
Investment in technology by the business over the past 12 months has improved profitability
17.7% 48.1% 11/11 23.0% 10/11 25.8% 26.8% N/A
Technology the business invested in most heavily over the past 12 months
Computer equipment
Computer equipment
N/A Computer equipment
N/A Computer equipment
N/A N/A
Consider the business likely to be cyberattacked in next 12 months
16.3% 38.8% 11/11 18.7% 10/11 19.0% 19.6% N/A
Reviewed the business’s cybersecurity protections in last six months
33.3% 43.1% 9/11 35.0% 9/11 39.0% N/A N/A
More than 10 per cent of sales is received through digital payment options such as PayPal, Alipay, WeChat Pay
37.9% 64.2% 11/11 42.1% 9/11 39.1% 33.0% N/A

120 | CPA AUSTRALIA ASIA-PACIFIC SMALL BUSINESS SURVEY 2020-21
The use of technology stands out as an area in which New Zealand small businesses lag their Asian counterparts. • New Zealand’s small businesses continue to be significantly more likely to not use social media for business
purposes (38.3 per cent compared with just 6.3 per cent of businesses from Mainland China). • New Zealand’s small businesses continue to be significantly less likely to earn revenue from online sales
(59.0 per cent do not earn any revenue from online sales, compared with only 4.1 per cent of businesses from Mainland China).
• New Zealand’s small businesses were the second least likely to have begun or increased its focus on online sales as a major reaction to COVID-19 (9.3 per cent compared to the survey average of 24.6 per cent).
• New Zealand’s small businesses were the second most likely to not make any investment in technology in 2020 (38.3 per cent compared to only 5.2 per cent of small businesses from Vietnam).
• New Zealand’s small businesses are the most likely to not make new payment technologies such as Apple Pay available to their customers (45.0 per cent compared with just 0.7 per cent of Mainland Chinese small businesses).
• New Zealand’s small businesses seem somewhat relaxed in their cyber risk assessment for 2021. Only 16.3 per cent believe an attack on their business is likely this year. This is the lowest result of the markets surveyed. However, 33.3 per cent reviewed their cybersecurity measures in the past six months
One possible explanation for the low levels of investment in technology by New Zealand’s small businesses is the poor short-term returns they achieve. Of those businesses that invested in technology in 2020, only 17.7 per cent found their investment improved their profitability. This is the lowest result of the 11 markets surveyed and significantly lower than the survey average of 48.1 per cent. Business activity over the past 12 months
NZ 2020 Survey
average
2020
Rank 2020 NZ 2019 Rank
2019 NZ 2018 NZ 2017 NZ 2016
Increased employee numbers 9.3% 24.8% 9/11 14.7% 9/11 18.4% 14.1% 19.6%
Improved customer satisfaction had a major positive impact on my business
11.0% 22.6% 11/11 24.7% 8/11 24.5% 19.6% 21.6%
Increasing costs had a major negative impact on their business
18.0% 23.4% 10/11 33.7% 6/11 38.4% 27.5% 26.6%
Required funds from an external source
39.7% 57.6% 10/11 28.7% 10/11 25.2% 31.7% 25.2%
Sought external funds for business growth
11.8% 44.7% 11/11 31.4% 10/11 37.2% 32.0% 36.8%
Sought external funds for business survival
49.6% 41.0% 2/11 17.4% 9/11 14.1% 15.5% 18.4%
Found it easy or very easy to access external finance
52.9% 34.0% 1/11 41.9% 3/11 51.3% 42.3% 48.7%
A bank was the business’s main source of external finance
21.8% 28.4% 9/11 47.7% 2/11 57.7% 45.4% 48.7%
Planned business activity over the next 12 months

121 | CPA AUSTRALIA ASIA-PACIFIC SMALL BUSINESS SURVEY 2020-21
NZ 2021 Survey
average 2021
Rank 2021 NZ 2020 Rank
2020 NZ 2019 NZ 2018 NZ 2017
Expect to increase employee numbers
11.3% 36.1% 11/11 19.3% 9/11 21.0% 17.6% 24.3%
Will introduce a new product, service or process unique to their market or the world
8.7% 23.0% 9/11 7.3% 10/11 7.7% 9.2% 10.6%
Expect revenue from overseas markets to grow strongly
4.7% 15.3% 10/11 7.7% 8/11 5.5% 8.2% 6.0%
Will seek external funds 9.0% 27.3% 10/11 9.7% 8/11 5.8% 9.8% 8.6%
Expect easy to very easy access to finance
25.9% 28.0% 6/11 32.2% 3/11 30.2% 26.7% 24.5%
Jobs The relatively small number of New Zealand small businesses that experienced growth in 2020 is reflected in the small number that created new jobs last year. Only 9.3 per cent added to their headcount in 2020, down from 14.7 per cent in 2019. The lack of expected growth in 2021 is likely to see only a small percentage (11.3 per cent) of New Zealand’s small businesses increase employee numbers this year. This is the lowest result of the markets surveyed. Innovation Small businesses in New Zealand remain highly unlikely to innovate. Only 8.7 per cent will introduce a new product, process or service that is unique to their market or the world in 2021, compared with the survey average of 23.0 per cent. This small number of innovative businesses may impact the growth of the sector as the survey results show that such businesses are significantly more likely to grow. Access to finance New Zealand’s small businesses continue to remain significantly less likely to source funds from external sources than small businesses from Asia (39.7 per cent, compared with the survey average of 57.6 per cent). Of the New Zealand small businesses that accessed finance, they were significantly more likely to use that finance for survival than growth. 11.8 per cent sourced that finance for business growth, while 49.6 per cent accessed it for survival. Of those New Zealand small businesses that accessed external finance in 2020, 52.9 per cent found the experience easy or very easy - the highest result of the markets surveyed. Exports New Zealand’s small businesses remain much less likely to expect to increase revenue from exporting in 2021 than their peers from Asia. Seeking alternative markets is one way of growing business and diversifying revenue streams in difficult conditions. The survey results show that businesses that expect to grow their revenue from exporting are significantly more likely to grow.
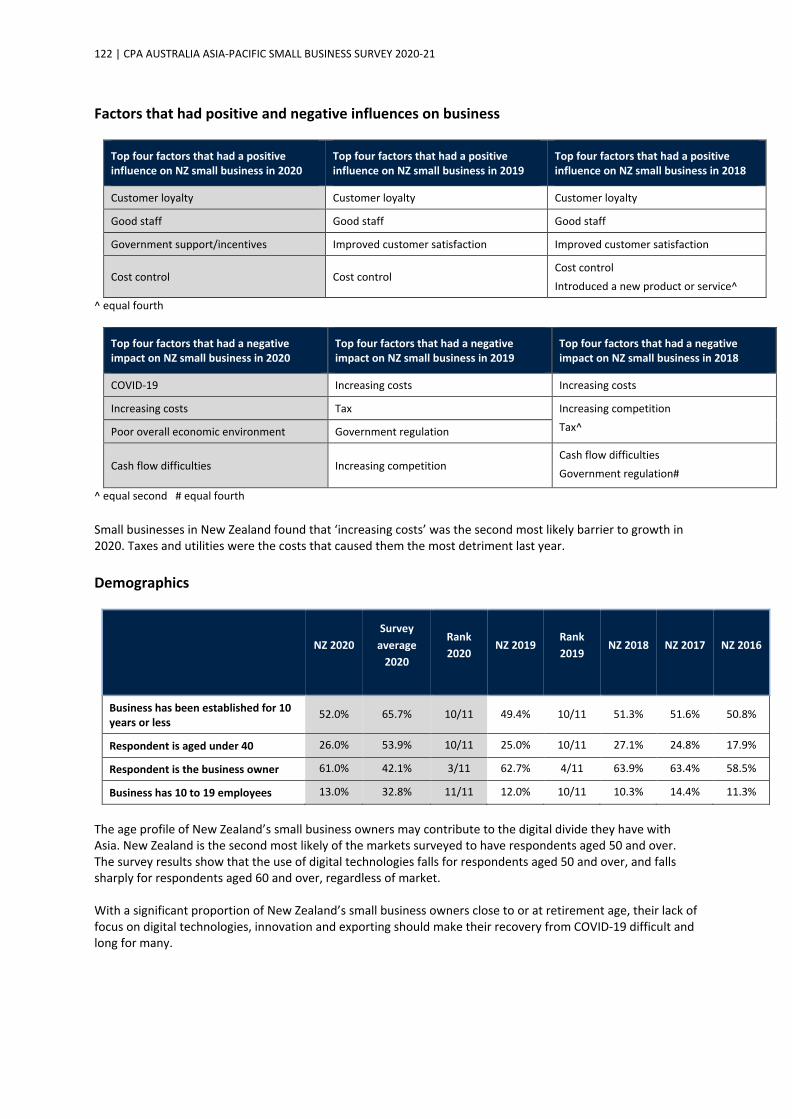
122 | CPA AUSTRALIA ASIA-PACIFIC SMALL BUSINESS SURVEY 2020-21
Factors that had positive and negative influences on business
Top four factors that had a positive influence on NZ small business in 2020
Top four factors that had a positive influence on NZ small business in 2019
Top four factors that had a positive influence on NZ small business in 2018
Customer loyalty Customer loyalty Customer loyalty
Good staff Good staff Good staff
Government support/incentives Improved customer satisfaction Improved customer satisfaction
Cost control Cost control Cost control Introduced a new product or service^
^ equal fourth
Top four factors that had a negative impact on NZ small business in 2020
Top four factors that had a negative impact on NZ small business in 2019
Top four factors that had a negative impact on NZ small business in 2018
COVID-19 Increasing costs Increasing costs
Increasing costs Tax Increasing competition Tax^ Poor overall economic environment Government regulation
Cash flow difficulties Increasing competition Cash flow difficulties Government regulation#
^ equal second # equal fourth Small businesses in New Zealand found that ‘increasing costs’ was the second most likely barrier to growth in 2020. Taxes and utilities were the costs that caused them the most detriment last year. Demographics
NZ 2020 Survey
average 2020
Rank 2020
NZ 2019 Rank 2019
NZ 2018 NZ 2017 NZ 2016
Business has been established for 10 years or less
52.0% 65.7% 10/11 49.4% 10/11 51.3% 51.6% 50.8%
Respondent is aged under 40 26.0% 53.9% 10/11 25.0% 10/11 27.1% 24.8% 17.9%
Respondent is the business owner 61.0% 42.1% 3/11 62.7% 4/11 63.9% 63.4% 58.5%
Business has 10 to 19 employees 13.0% 32.8% 11/11 12.0% 10/11 10.3% 14.4% 11.3%
The age profile of New Zealand’s small business owners may contribute to the digital divide they have with Asia. New Zealand is the second most likely of the markets surveyed to have respondents aged 50 and over. The survey results show that the use of digital technologies falls for respondents aged 50 and over, and falls sharply for respondents aged 60 and over, regardless of market. With a significant proportion of New Zealand’s small business owners close to or at retirement age, their lack of focus on digital technologies, innovation and exporting should make their recovery from COVID-19 difficult and long for many.

123 | CPA AUSTRALIA ASIA-PACIFIC SMALL BUSINESS SURVEY 2020-21
Policy recommendations For policymakers seeking to help New Zealand’s economic recovery and promote jobs creation, improving the digital capability of small business is essential. With most of New Zealand’s small businesses having fewer than five employees and the owners being time poor, external advisers will play a critical role in helping the sector.

124 | CPA AUSTRALIA ASIA-PACIFIC SMALL BUSINESS SURVEY 2020-21
Philippines market summary Business and economic growth
Philippines 2020
Survey average
2020
Rank 2020
Philippines 2019
Rank 2019
Philippines 2018
Businesses that grew in the last 12 months 61.7% 46.2% 3/11 83.0% 3/11 84.0%
Businesses that expect to grow in the next 12 months 73.3% 60.8% 4/11 93.4% 2/11 94.2%
Businesses that expect the local economy to grow in the next 12 months
66.7% 58.6% 5/11 83.3% 2/11 81.8%
2020 was a weaker year for Filipino small businesses than 2019. 61.7 per cent grew last year, down from the 83.0 per cent that grew in 2019. However, the result was higher than many developed markets such as Australia, where only 22.3 per cent of small businesses reported growing. In addition, 18.7 per cent of Philippines small businesses stated that their growth was very strong – the second highest result of the markets surveyed. In comparison, only 2.0 per cent of Hong Kong’s businesses recorded very strong growth in 2020. 2021 is expected to be a better year for Filipino small businesses. 73.3 per cent of businesses expect to grow, beating the survey average of 60.8 per cent. Overall, the results for the Philippines small business sector are positive. Many small businesses have characteristics strongly connected with growth, including a focus on: • technology • e-commerce • improving customer satisfaction • improving business strategy • innovation.
40%
50%
60%
70%
80%
90%
100%
2018 2019 2020
Small businesses that reported growing in the previous 12 months - Philippines against
survey average
Philippines Survey average
40%
50%
60%
70%
80%
90%
100%
2018 2019 2020
Small businesses that expect to grow in the next 12 months - Philippines against survey
average
Philippines Survey average

125 | CPA AUSTRALIA ASIA-PACIFIC SMALL BUSINESS SURVEY 2020-21
We are therefore likely to see many Filipino small businesses recover quickly from COVID-19 and grow strongly in 2021 and beyond. Given these results, we believe several Filipino small businesses are likely to evolve into large, successful global businesses in the next few years. Impacts of COVID-19
Philippines 2020
Survey average 2020 Rank 2020
COVID-19 had a major negative impact on my business in the past 12 months 58.3% 57.1% 5/11
My business’s major reaction to COVID-19 was to begin or increase its focus on online sales
26.7% 24.6% 6/11
My business has already recovered from the negative impacts of COVID-19 or I expect it to recover in the next 12 months
45.7% 39.0% 4/11
Like all markets, Filipino small businesses considered COVID-19 their biggest challenge. 58.3 per cent said that COVID-19 had a major negative impact on their business in the past 12 months, largely in line with the survey average of 57.1 per cent. COVID-19 is not expected to be a major limiting factor for many Filipino small businesses in 2021. 45.7 per cent have already recovered from the negative impacts of the pandemic or expect to recover in 2021, higher than the survey average of 39.0 per cent. Use of technology
Philippines 2020
Survey average
2020
Rank 2020 Philippines 2019 Rank
2019 Philippines
2018
Did NOT earn any revenue from online sales 11.7% 22.6% 9/11 21.3% 7/11 22.7%
Did NOT use social media for business purposes 9.3% 18.3% 10/11 14.1% 7/11 10.2%
Investment in technology by the business over the past 12 months has improved profitability
55.7% 48.1% 5/11 67.5% 3/11 76.4%
Technology the business invested in most heavily over the past 12 months
Computer equipment
Computer equipment
N/A Computer equipment
N/A Computer equipment
Consider the business likely to be cyberattacked in next 12 months
29.0% 38.8% 9/11 33.1% 7/11 28.9%
Reviewed the business’s cybersecurity protections in last six months
38.7% 43.1% 8/11 34.8% 10/11 40.0%
More than 10 per cent of sales is received through digital payment options such as PayPal, Alipay, WeChat Pay
61.3% 64.2% 5/11 47.2% 8/11 43.1%
One factor driving growth of the Philippines small business sector is their relatively strong uptake of new technologies. Most Filipino small businesses sell online. 62.0 per cent received more than 10 per cent of their revenue from online sales, up from 49.8 per cent in 2019.

126 | CPA AUSTRALIA ASIA-PACIFIC SMALL BUSINESS SURVEY 2020-21
One reason for the increase of Filipino small businesses selling online is the impact of COVID-19. 26.7 per cent reported that they began or increased their focus on online sales as a response to COVID-19 – slightly higher than the survey average of 24.6 per cent. Further, an overwhelming majority of Filipino small businesses use social media. Only 9.3 per cent do not use social media in their businesses. They are most likely to use social media to promote their business to potential customers. Most Filipino small businesses offer customers the choice of paying by new digital and mobile payment technologies such as PayPal, PayMaya and Globe Telecom. 61.3 per cent received more than 10 per cent of their sales through such technologies in 2020, up from 47.2 per cent in 2019. Cash however remains a very important payment option for Filipino small businesses. 70.0 per cent received 50 per cent or more of their sales in cash last year, the highest result of the 11 markets surveyed. Given the broad cross-section of industries represented in the Philippines survey sample, it is assumed that many business-to-business transactions are done in cash. Considering their increasing focus on digital technologies, it is surprising that only 29.0 per cent of Filipino small businesses expect to be cyberattacked in 2021. This is below the survey average of 38.8 per cent. However, 38.7 per cent reviewed their cybersecurity measures in the past six months. Helping to drive this focus on technology are the strong returns such investments are generating. 55.7 per cent of Filipino small businesses that invested in technology in 2020 reported such investments were already profitable. This is above the survey average of 48.1 per cent. Business activity over the past 12 months
Philippines 2020
Survey average
2020
Rank 2020
Philippines 2019
Rank 2019
Philippines 2018
Increased employee numbers 27.7% 24.8% 4/11 39.0% 5/11 38.2%
Improved customer satisfaction had a major positive impact on my business
28.7% 22.6% 3/11 40.7% 3/11 51.6%
Increasing costs had a major negative impact on their business
26.0% 23.4% 4/11 34.1% 5/11 50.2%
Required funds from an external source 64.0% 57.6% 5/11 58.0% 6/11 62.7%
Sought external funds for business growth 43.2% 44.7% 6/11 54.8% 5/11 57.4%
Sought external funds for business survival 32.3% 41.0% 10/11 20.9% 8/11 21.3%
Found it easy or very easy to access external finance 13.0% 34.0% 11/11 18.6% 9/11 24.8%
A bank was the business’s main source of external finance
14.6% 28.4% 10/11 28.8% 8/11 30.5%

127 | CPA AUSTRALIA ASIA-PACIFIC SMALL BUSINESS SURVEY 2020-21
Planned business activity over the next 12 months
Philippines 2021
Survey average
2021
Rank 2021
Philippines 2020
Rank 2020 Philippines 2019
Expect to increase employee numbers 52.3% 36.1% 2/11 54.1% 5/11 61.8%
Will introduce a new product, service or process unique to their market or the world
31.3% 23.0% 2/11 32.5% 5/11 35.6%
Expect revenue from overseas markets to grow strongly
22.0% 15.3% 2/11 27.5% 1/11 28.0%
Will seek external funds 19.7% 27.3% 7/11 18.7% 5/11 26.7%
Expect easy to very easy access to finance 16.3% 28.0% 9/11 14.5% 9/11 23.9%
Innovation The Philippines’ small business sector is highly innovative. 31.1 per cent will introduce a totally new product, process or service to the Philippines or the world in 2021; the second highest result of the markets surveyed. This innovative culture is likely to contribute to Filipino small business sector recording strong growth in the coming years. Jobs The lower number of Filipino small businesses that grew in 2020 is reflected in the smaller number that increased their headcount in 2020. 27.7 per cent added to their employee numbers last year, down from 39.0 per cent in 2019. The rebound in growth expectations for 2021 is reflected in an increase in the number of Filipino small businesses that expect to add to their employee numbers this year (52.3 per cent). Access to finance Most Filipino small businesses needed external finance in 2020. 64.0 per cent needed external finance last year, up from 58.0 per cent in 2019. However, reflecting a tougher business environment in 2020, 43.2 per cent sourced finance for growth last year, down from 54.8 per cent in 2019, while 32.2 per cent sought finance for survival, up from 20.9 per cent in 2019. Respondents from the Philippines were the least likely of the markets surveyed to find accessing finance was easy or very easy. They were also the second least likely to have sourced funds from a bank. Instead, they were more likely to source finance from family or friends or from their own personal resources.

128 | CPA AUSTRALIA ASIA-PACIFIC SMALL BUSINESS SURVEY 2020-21
Factors that had positive and negative influences on business
Top four factors that had a positive influence on Filipino small business in 2020
Top four factors that had a positive influence on Filipino small business in 2019
Top four factors that had a positive influence on Filipino small business in 2018
Customer loyalty Customer loyalty Customer loyalty Improved customer satisfaction^ Improved customer satisfaction Improved customer satisfaction
Good staff Good staff Good staff
Improved business strategy Improved business strategy Improved business strategy
^ equal first
Top four factors that had a negative influence on Filipino small business in 2020
Top four factors that had a negative influence on Filipino small business in 2019
Top four factors that had a negative influence on Filipino small business in 2018
COVID-19 Increasing competition Increasing costs
Increasing costs Increasing costs Increasing competition
Increasing competition Tax Tax
Cash flow difficulties Cash flow difficulties Fluctuations in local currency
Small businesses in the Philippines found ‘increasing costs’ and ‘increasing competition’ the second and third largest barriers to growth last year. However, increasing competition is likely to have positive long-term implications, as it encourages innovation and expansion into new markets – essential elements of growth. Demographics
Philippines 2020
Survey average
2020
Rank 2020
Philippines 2019
Rank 2019
Philippines 2018
Business has been established for 10 years or less 82.0% 65.7% 3/11 82.6% 2/11 83.1%
Respondent is aged under 40 69.3% 53.9% 2/11 64.9% 4/11 65.3%
Respondent is the business owner 66.3% 42.1% 1/11 69.5% 2/11 64.9%
Business has 10 to 19 employees 17.0% 32.8% 9/11 22.0% 7/11 26.7%
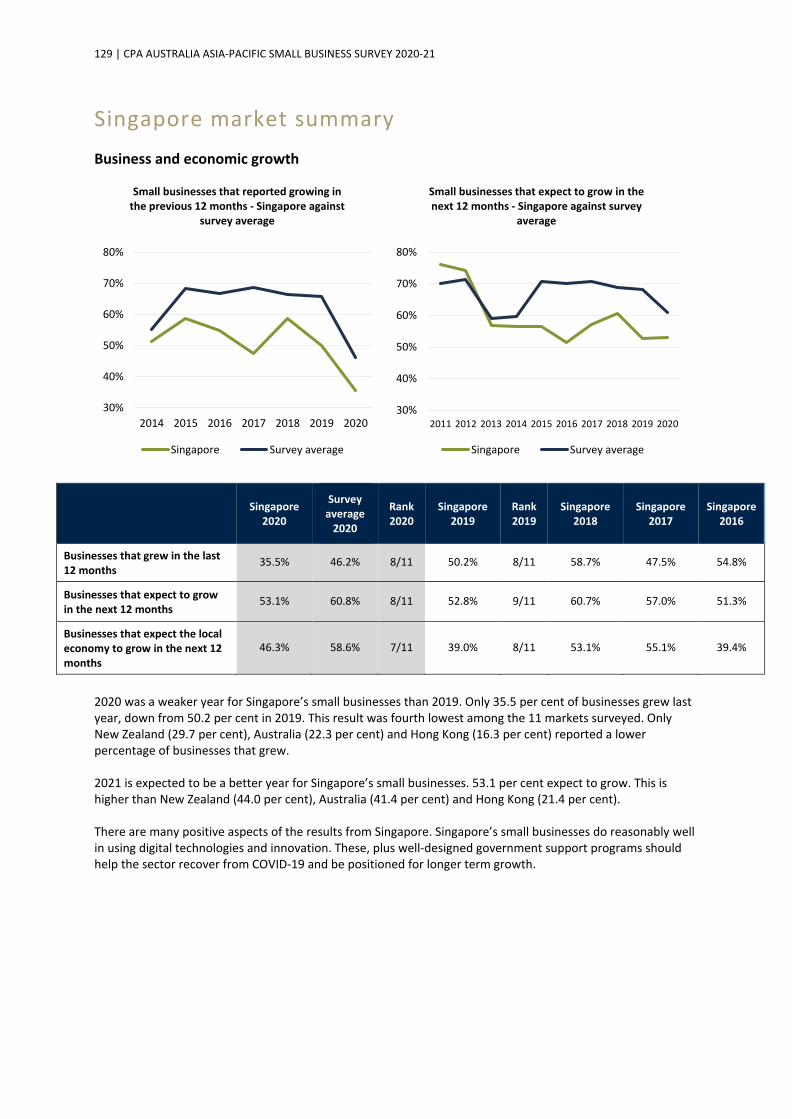
129 | CPA AUSTRALIA ASIA-PACIFIC SMALL BUSINESS SURVEY 2020-21
Singapore market summary Business and economic growth
Singapore 2020
Survey average
2020
Rank 2020
Singapore 2019
Rank 2019
Singapore 2018
Singapore 2017
Singapore 2016
Businesses that grew in the last 12 months
35.5% 46.2% 8/11 50.2% 8/11 58.7% 47.5% 54.8%
Businesses that expect to grow in the next 12 months
53.1% 60.8% 8/11 52.8% 9/11 60.7% 57.0% 51.3%
Businesses that expect the local economy to grow in the next 12 months
46.3% 58.6% 7/11 39.0% 8/11 53.1% 55.1% 39.4%
2020 was a weaker year for Singapore’s small businesses than 2019. Only 35.5 per cent of businesses grew last year, down from 50.2 per cent in 2019. This result was fourth lowest among the 11 markets surveyed. Only New Zealand (29.7 per cent), Australia (22.3 per cent) and Hong Kong (16.3 per cent) reported a lower percentage of businesses that grew. 2021 is expected to be a better year for Singapore’s small businesses. 53.1 per cent expect to grow. This is higher than New Zealand (44.0 per cent), Australia (41.4 per cent) and Hong Kong (21.4 per cent). There are many positive aspects of the results from Singapore. Singapore’s small businesses do reasonably well in using digital technologies and innovation. These, plus well-designed government support programs should help the sector recover from COVID-19 and be positioned for longer term growth.
30%
40%
50%
60%
70%
80%
2014 2015 2016 2017 2018 2019 2020
Small businesses that reported growing in the previous 12 months - Singapore against
survey average
Singapore Survey average
30%
40%
50%
60%
70%
80%
2011 2012 2013 2014 2015 2016 2017 2018 2019 2020
Small businesses that expect to grow in the next 12 months - Singapore against survey
average
Singapore Survey average
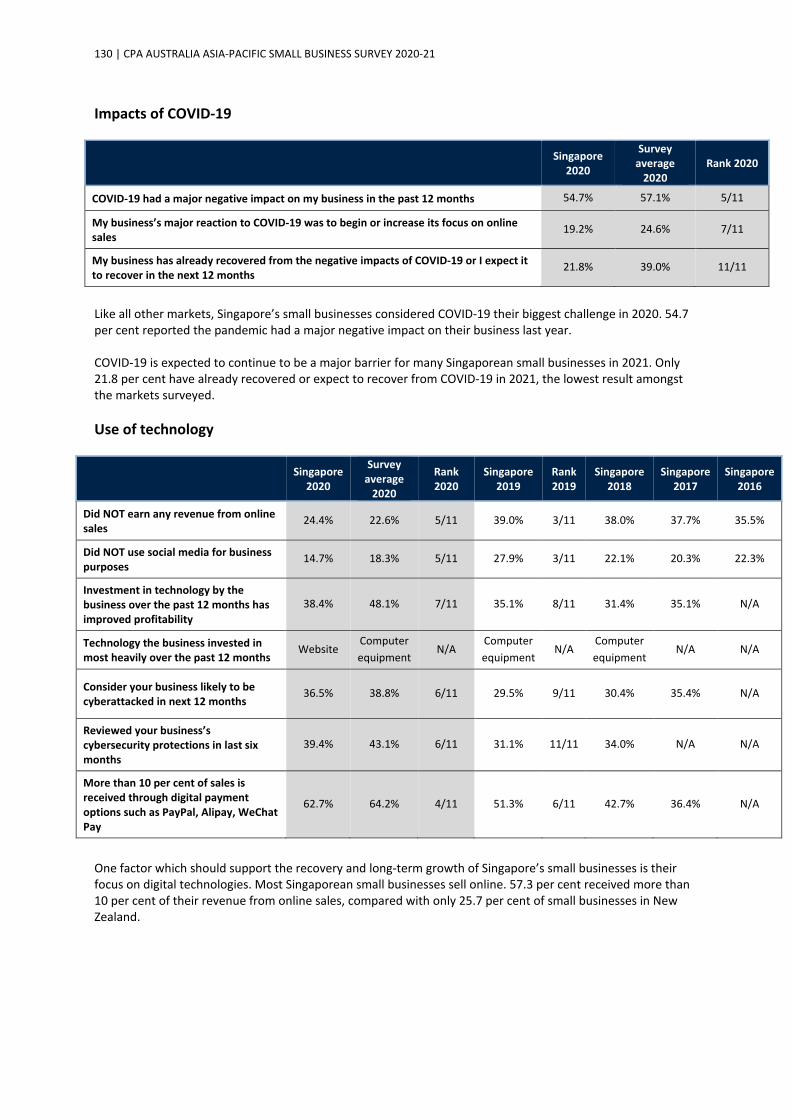
130 | CPA AUSTRALIA ASIA-PACIFIC SMALL BUSINESS SURVEY 2020-21
Impacts of COVID-19
Singapore 2020
Survey average
2020 Rank 2020
COVID-19 had a major negative impact on my business in the past 12 months 54.7% 57.1% 5/11
My business’s major reaction to COVID-19 was to begin or increase its focus on online sales
19.2% 24.6% 7/11
My business has already recovered from the negative impacts of COVID-19 or I expect it to recover in the next 12 months
21.8% 39.0% 11/11
Like all other markets, Singapore’s small businesses considered COVID-19 their biggest challenge in 2020. 54.7 per cent reported the pandemic had a major negative impact on their business last year. COVID-19 is expected to continue to be a major barrier for many Singaporean small businesses in 2021. Only 21.8 per cent have already recovered or expect to recover from COVID-19 in 2021, the lowest result amongst the markets surveyed. Use of technology
Singapore 2020
Survey average
2020
Rank 2020
Singapore 2019
Rank 2019
Singapore 2018
Singapore 2017
Singapore 2016
Did NOT earn any revenue from online sales
24.4% 22.6% 5/11 39.0% 3/11 38.0% 37.7% 35.5%
Did NOT use social media for business purposes
14.7% 18.3% 5/11 27.9% 3/11 22.1% 20.3% 22.3%
Investment in technology by the business over the past 12 months has improved profitability
38.4% 48.1% 7/11 35.1% 8/11 31.4% 35.1% N/A
Technology the business invested in most heavily over the past 12 months
Website Computer equipment
N/A Computer equipment
N/A Computer equipment
N/A N/A
Consider your business likely to be cyberattacked in next 12 months
36.5% 38.8% 6/11 29.5% 9/11 30.4% 35.4% N/A
Reviewed your business’s cybersecurity protections in last six months
39.4% 43.1% 6/11 31.1% 11/11 34.0% N/A N/A
More than 10 per cent of sales is received through digital payment options such as PayPal, Alipay, WeChat Pay
62.7% 64.2% 4/11 51.3% 6/11 42.7% 36.4% N/A
One factor which should support the recovery and long-term growth of Singapore’s small businesses is their focus on digital technologies. Most Singaporean small businesses sell online. 57.3 per cent received more than 10 per cent of their revenue from online sales, compared with only 25.7 per cent of small businesses in New Zealand.
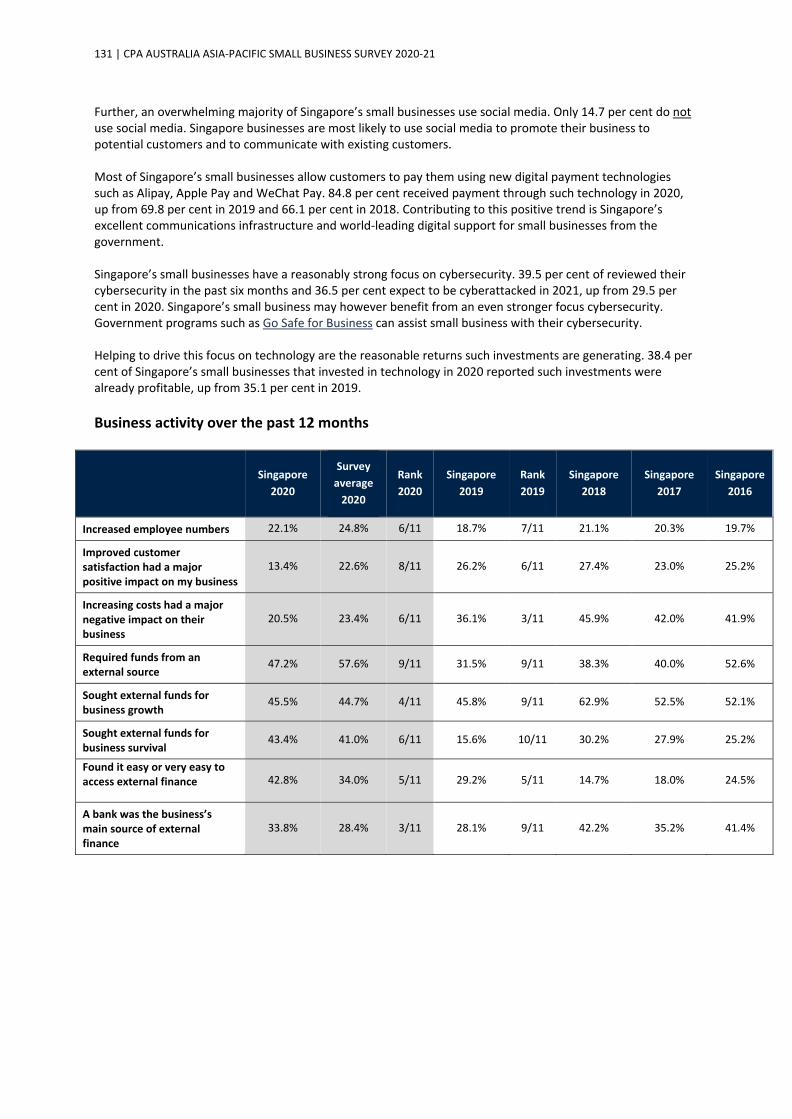
131 | CPA AUSTRALIA ASIA-PACIFIC SMALL BUSINESS SURVEY 2020-21
Further, an overwhelming majority of Singapore’s small businesses use social media. Only 14.7 per cent do not use social media. Singapore businesses are most likely to use social media to promote their business to potential customers and to communicate with existing customers. Most of Singapore’s small businesses allow customers to pay them using new digital payment technologies such as Alipay, Apple Pay and WeChat Pay. 84.8 per cent received payment through such technology in 2020, up from 69.8 per cent in 2019 and 66.1 per cent in 2018. Contributing to this positive trend is Singapore’s excellent communications infrastructure and world-leading digital support for small businesses from the government. Singapore’s small businesses have a reasonably strong focus on cybersecurity. 39.5 per cent of reviewed their cybersecurity in the past six months and 36.5 per cent expect to be cyberattacked in 2021, up from 29.5 per cent in 2020. Singapore’s small business may however benefit from an even stronger focus cybersecurity. Government programs such as Go Safe for Business can assist small business with their cybersecurity. Helping to drive this focus on technology are the reasonable returns such investments are generating. 38.4 per cent of Singapore’s small businesses that invested in technology in 2020 reported such investments were already profitable, up from 35.1 per cent in 2019. Business activity over the past 12 months
Singapore 2020
Survey average
2020
Rank 2020
Singapore 2019
Rank 2019
Singapore 2018
Singapore 2017
Singapore 2016
Increased employee numbers 22.1% 24.8% 6/11 18.7% 7/11 21.1% 20.3% 19.7%
Improved customer satisfaction had a major positive impact on my business
13.4% 22.6% 8/11 26.2% 6/11 27.4% 23.0% 25.2%
Increasing costs had a major negative impact on their business
20.5% 23.4% 6/11 36.1% 3/11 45.9% 42.0% 41.9%
Required funds from an external source
47.2% 57.6% 9/11 31.5% 9/11 38.3% 40.0% 52.6%
Sought external funds for business growth
45.5% 44.7% 4/11 45.8% 9/11 62.9% 52.5% 52.1%
Sought external funds for business survival
43.4% 41.0% 6/11 15.6% 10/11 30.2% 27.9% 25.2%
Found it easy or very easy to access external finance 42.8% 34.0% 5/11 29.2% 5/11 14.7% 18.0% 24.5%
A bank was the business’s main source of external finance
33.8% 28.4% 3/11 28.1% 9/11 42.2% 35.2% 41.4%

132 | CPA AUSTRALIA ASIA-PACIFIC SMALL BUSINESS SURVEY 2020-21
Planned business activity over the next 12 months
Innovation Small businesses in Singapore are increasingly likely to innovate. 18.6 per cent say they will introduce a new product, process or service that is unique to their market or the world in 2021, compared with 13.4 per cent last year and 13.9 per cent in 2019. This increase should have positive impacts on growth in the sector as the results show that innovative businesses are significantly more likely to grow. Jobs Despite a fall in the number of Singaporean small businesses that grew in 2020 from 2019, there was a slight increase in the number that employed additional staff. 22.1 per cent added to their headcount last year compared with 18.7 per cent in 2019. An expected pick up in business activity in 2021 should see the sector create a large number of jobs. 29.0 per cent of Singapore’s small businesses expect to add to their headcount in 2021. Access to finance Singapore’s small businesses were more likely to have accessed external finance in 2020 than 2019. 47.2 per cent needed external finance last year compared with 31.5 per cent in 2019. Reflecting difficult business conditions in 2020, 43.4 per cent sought external finance for business survival, up from 15.6 per cent in 2019. Respondents from Singapore found accessing external finance in 2020 easier than 2019. 42.8 per cent found accessing finance last year was easy or very easy, up from 29.2 per cent in 2019. Banks were the most likely source of that finance.
Singapore 2021
Survey average
2021
Rank 2021
Singapore 2020
Rank 2020
Singapore 2019
Singapore 2018
Singapore 2017
Expect to increase employee numbers
29.0% 36.1% 7/11 31.1% 7/11 32.0% 26.6% 29.0%
Will introduce a new product, service or process unique to their market or the world
18.6% 23.0% 7/11 13.4% 7/11 13.9% 13.1% 8.7%
Expect revenue from overseas markets to grow strongly
13.4% 15.3% 6/11 12.8% 7/11 18.2% 11.5% 11.3%
Will seek external funds 23.1% 27.3% 6/11 9.2% 9/11 16.2% 12.5% 16.1%
Expect easy to very easy access to finance
31.1% 28.0% 4/11 23.4% 6/11 12.0% 12.4% 15.0%
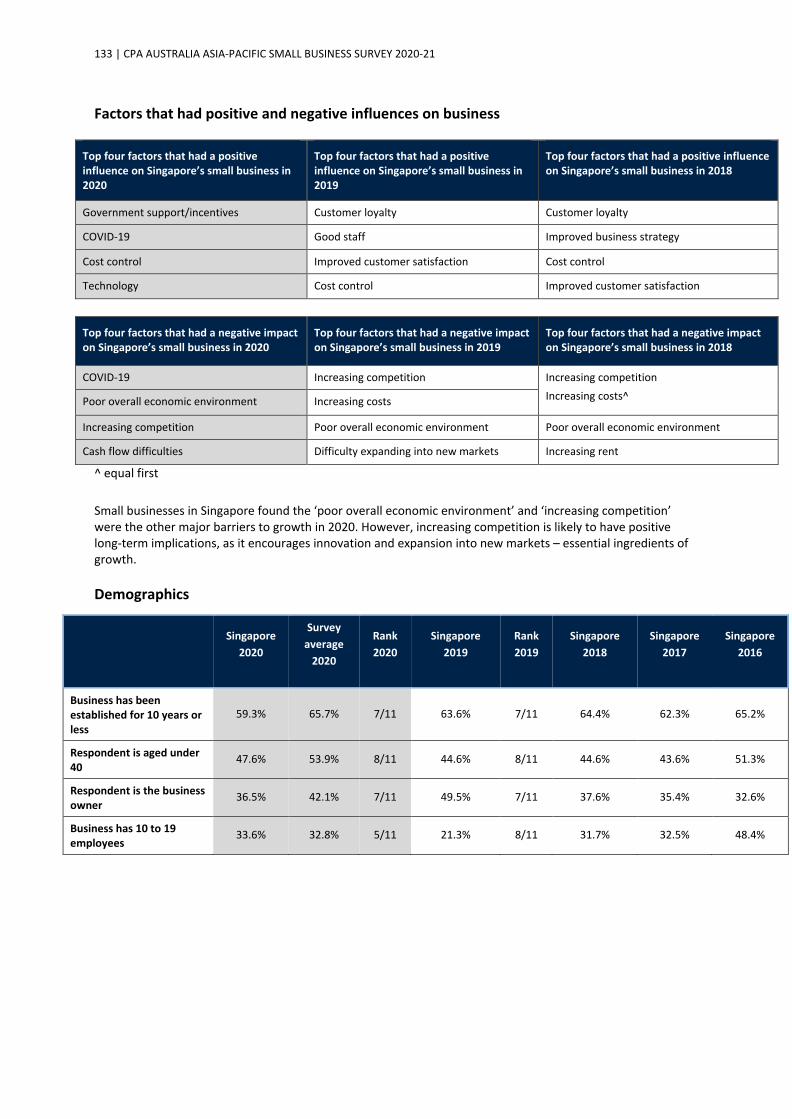
133 | CPA AUSTRALIA ASIA-PACIFIC SMALL BUSINESS SURVEY 2020-21
Factors that had positive and negative influences on business
Top four factors that had a positive influence on Singapore’s small business in 2020
Top four factors that had a positive influence on Singapore’s small business in 2019
Top four factors that had a positive influence on Singapore’s small business in 2018
Government support/incentives Customer loyalty Customer loyalty
COVID-19 Good staff Improved business strategy
Cost control Improved customer satisfaction Cost control
Technology Cost control Improved customer satisfaction
Top four factors that had a negative impact on Singapore’s small business in 2020
Top four factors that had a negative impact on Singapore’s small business in 2019
Top four factors that had a negative impact on Singapore’s small business in 2018
COVID-19 Increasing competition Increasing competition Increasing costs^ Poor overall economic environment Increasing costs
Increasing competition Poor overall economic environment Poor overall economic environment
Cash flow difficulties Difficulty expanding into new markets Increasing rent
^ equal first
Small businesses in Singapore found the ‘poor overall economic environment’ and ‘increasing competition’ were the other major barriers to growth in 2020. However, increasing competition is likely to have positive long-term implications, as it encourages innovation and expansion into new markets – essential ingredients of growth. Demographics
Singapore
2020
Survey average
2020
Rank 2020
Singapore 2019
Rank 2019
Singapore 2018
Singapore 2017
Singapore 2016
Business has been established for 10 years or less
59.3% 65.7% 7/11 63.6% 7/11 64.4% 62.3% 65.2%
Respondent is aged under 40
47.6% 53.9% 8/11 44.6% 8/11 44.6% 43.6% 51.3%
Respondent is the business owner
36.5% 42.1% 7/11 49.5% 7/11 37.6% 35.4% 32.6%
Business has 10 to 19 employees
33.6% 32.8% 5/11 21.3% 8/11 31.7% 32.5% 48.4%
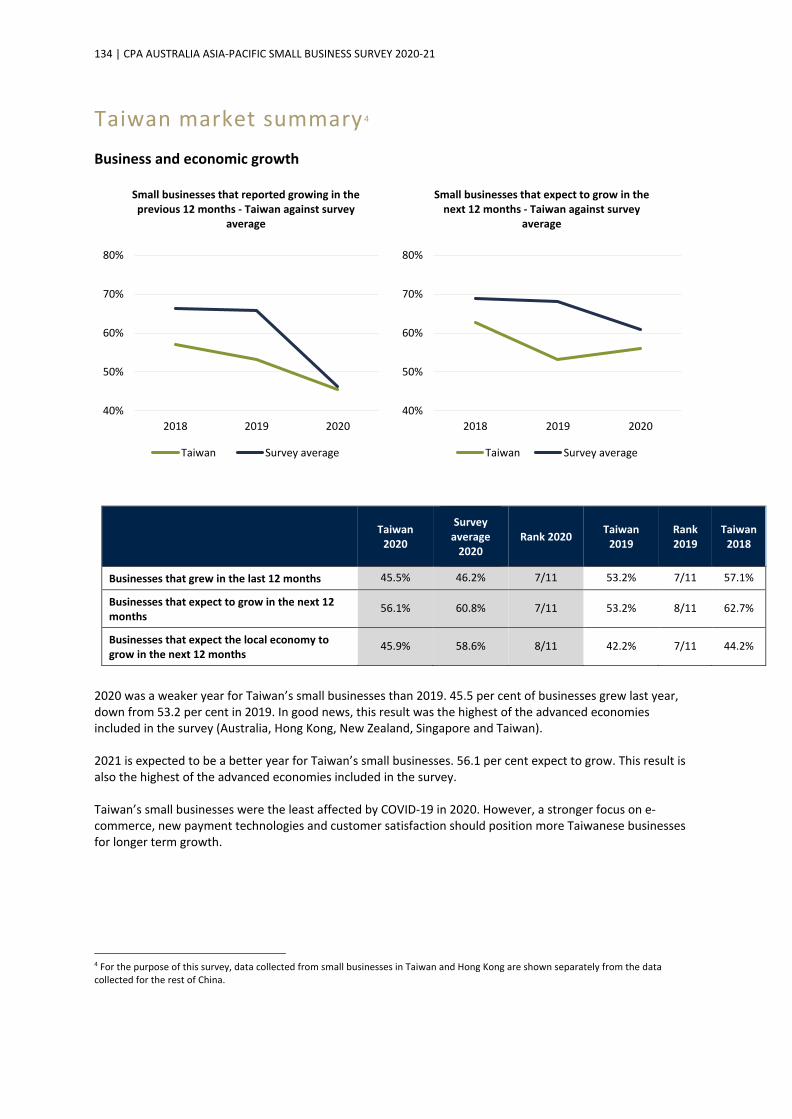
134 | CPA AUSTRALIA ASIA-PACIFIC SMALL BUSINESS SURVEY 2020-21
Taiwan market summary 4
Business and economic growth
Taiwan 2020
Survey average
2020 Rank 2020 Taiwan
2019 Rank 2019
Taiwan 2018
Businesses that grew in the last 12 months 45.5% 46.2% 7/11 53.2% 7/11 57.1%
Businesses that expect to grow in the next 12 months
56.1% 60.8% 7/11 53.2% 8/11 62.7%
Businesses that expect the local economy to grow in the next 12 months
45.9% 58.6% 8/11 42.2% 7/11 44.2%
2020 was a weaker year for Taiwan’s small businesses than 2019. 45.5 per cent of businesses grew last year, down from 53.2 per cent in 2019. In good news, this result was the highest of the advanced economies included in the survey (Australia, Hong Kong, New Zealand, Singapore and Taiwan). 2021 is expected to be a better year for Taiwan’s small businesses. 56.1 per cent expect to grow. This result is also the highest of the advanced economies included in the survey. Taiwan’s small businesses were the least affected by COVID-19 in 2020. However, a stronger focus on e-commerce, new payment technologies and customer satisfaction should position more Taiwanese businesses for longer term growth.
4 For the purpose of this survey, data collected from small businesses in Taiwan and Hong Kong are shown separately from the data collected for the rest of China.
40%
50%
60%
70%
80%
2018 2019 2020
Small businesses that reported growing in the previous 12 months - Taiwan against survey
average
Taiwan Survey average
40%
50%
60%
70%
80%
2018 2019 2020
Small businesses that expect to grow in the next 12 months - Taiwan against survey
average
Taiwan Survey average

135 | CPA AUSTRALIA ASIA-PACIFIC SMALL BUSINESS SURVEY 2020-21
Impacts of COVID-19
Taiwan 2020
Survey average
2020 Rank 2020
COVID-19 had a major negative impact on my business in the past 12 months 44.9% 57.1% 11/11
My business’s major reaction to COVID-19 was to begin or increase its focus on online sales
13.5% 24.6% 9/11
My business has already recovered from the negative impacts of COVID-19 or I expect it to recover in the next 12 months
30.4% 39.0% 8/11
Taiwan’s small businesses were the least likely to report that COVID-19 was a major challenge in 2020. Still, 44.9 per cent reported the pandemic had a major negative impact on their business in 2020, which was the biggest challenge for the island’s businesses. Given this result, it is not surprising that 30.4 per cent of Taiwan’s small businesses made no major changes to their business in response to the crisis, the second highest result of the markets surveyed. Use of technology
Taiwan 2020
Survey average
2020
Rank 2020
Taiwan 2019
Rank 2019
Taiwan 2018
Did NOT earn any revenue from online sales 29.7% 22.6% 3/11 32.2% 4/11 34.0%
Did NOT use social media for business purposes 14.2% 18.3% 8/11 18.6% 5/11 16.8%
Investment in technology by the business over the past 12 months has improved profitability
31.7% 48.1% 8/11 38.5% 7/11 33.0%
Technology your business invested in most heavily over the past 12 months
Computer equipment
Computer equipment
N/A Computer equipment
N/A Computer equipment
Consider your business likely to be subjected to a cyberattack in next 12 months
38.0% 38.8% 5/11 33.9% 6/11 37.3%
Reviewed your business’s cybersecurity protections in last six months
38.9% 43.1% 7/11 38.9% 6/11 42.2%
More than 10 per cent of sales is received through digital payment options such as PayPal, Alipay, WeChat Pay
38.0% 64.2% 10/11 31.5% 11/11 31.4%
There is room for Taiwan’s small businesses to have a stronger focus on technology: • Taiwan’s small businesses could make greater use of e-commerce. 43.6 per cent generated more than 10
per cent of their revenue online, compared with 82.0 per cent of Mainland Chinese small businesses. • Taiwan’s small businesses are the second least likely to generate more than 10 per cent of their sales
through digital and online payment technologies, such as PayPal, Apple Pay and WeChat Pay (38.0 per cent compared with 90.8 per cent of small businesses from Mainland China).
• Taiwan’s small businesses were the third least likely to have begun or increased their focus on online sales as a reaction to COVID-19 (13.5 per cent compared to the survey average of 24.6 per cent).
However, an overwhelming majority of Taiwanese small businesses use social media. Only 14.2 per cent do not use social media, compared with 42.4 per cent of Australian small businesses.
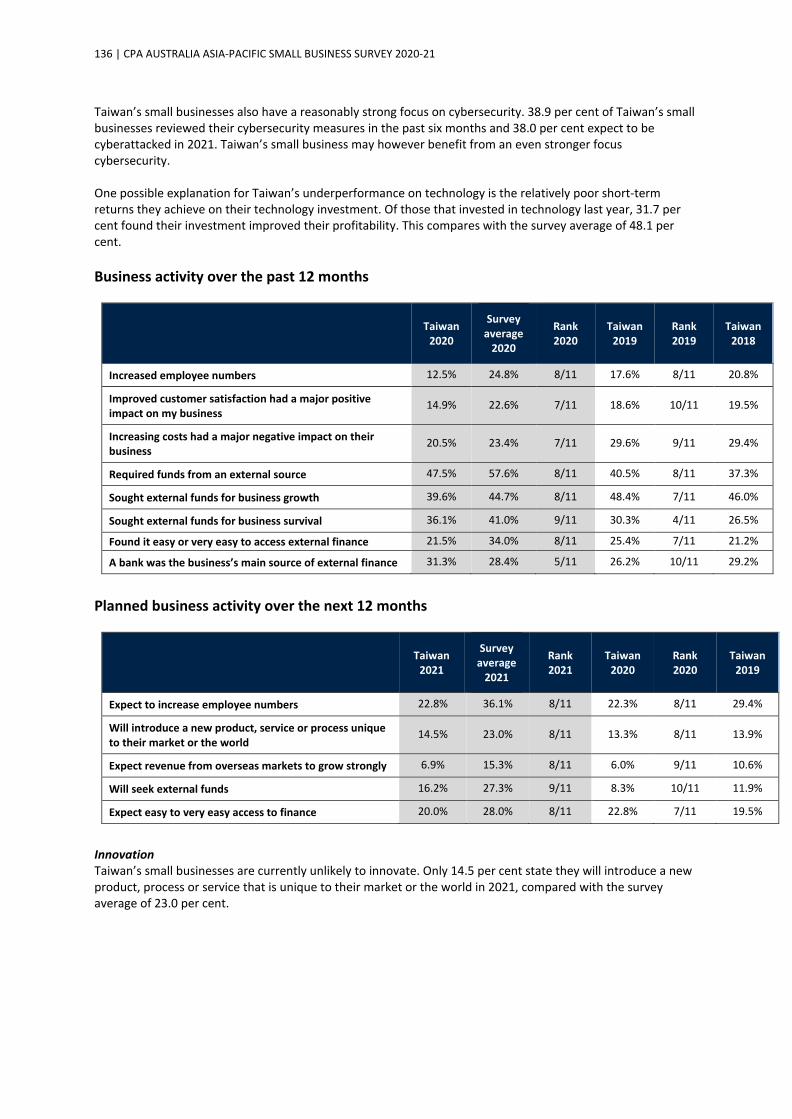
136 | CPA AUSTRALIA ASIA-PACIFIC SMALL BUSINESS SURVEY 2020-21
Taiwan’s small businesses also have a reasonably strong focus on cybersecurity. 38.9 per cent of Taiwan’s small businesses reviewed their cybersecurity measures in the past six months and 38.0 per cent expect to be cyberattacked in 2021. Taiwan’s small business may however benefit from an even stronger focus cybersecurity. One possible explanation for Taiwan’s underperformance on technology is the relatively poor short-term returns they achieve on their technology investment. Of those that invested in technology last year, 31.7 per cent found their investment improved their profitability. This compares with the survey average of 48.1 per cent. Business activity over the past 12 months
Taiwan 2020
Survey average
2020
Rank 2020
Taiwan 2019
Rank 2019
Taiwan 2018
Increased employee numbers 12.5% 24.8% 8/11 17.6% 8/11 20.8%
Improved customer satisfaction had a major positive impact on my business
14.9% 22.6% 7/11 18.6% 10/11 19.5%
Increasing costs had a major negative impact on their business
20.5% 23.4% 7/11 29.6% 9/11 29.4%
Required funds from an external source 47.5% 57.6% 8/11 40.5% 8/11 37.3%
Sought external funds for business growth 39.6% 44.7% 8/11 48.4% 7/11 46.0%
Sought external funds for business survival 36.1% 41.0% 9/11 30.3% 4/11 26.5%
Found it easy or very easy to access external finance 21.5% 34.0% 8/11 25.4% 7/11 21.2%
A bank was the business’s main source of external finance 31.3% 28.4% 5/11 26.2% 10/11 29.2%
Planned business activity over the next 12 months
Taiwan 2021
Survey average
2021
Rank 2021
Taiwan 2020
Rank 2020
Taiwan 2019
Expect to increase employee numbers 22.8% 36.1% 8/11 22.3% 8/11 29.4%
Will introduce a new product, service or process unique to their market or the world
14.5% 23.0% 8/11 13.3% 8/11 13.9%
Expect revenue from overseas markets to grow strongly 6.9% 15.3% 8/11 6.0% 9/11 10.6%
Will seek external funds 16.2% 27.3% 9/11 8.3% 10/11 11.9%
Expect easy to very easy access to finance 20.0% 28.0% 8/11 22.8% 7/11 19.5%
Innovation Taiwan’s small businesses are currently unlikely to innovate. Only 14.5 per cent state they will introduce a new product, process or service that is unique to their market or the world in 2021, compared with the survey average of 23.0 per cent.

137 | CPA AUSTRALIA ASIA-PACIFIC SMALL BUSINESS SURVEY 2020-21
Jobs The decline in the number of Taiwanese small businesses that grew in 2020 is reflected in a decline in the number of small businesses that created new jobs in 2020. Only 12.5 per cent added to their headcount in 2020, down from 17.6 per cent in 2019. An expected pick up in business activity in 2021 should see the sector create more new jobs this year. 22.8 per cent of Taiwan’s small businesses expect to add to their headcount in 2021. Access to finance Taiwan’s small businesses were more likely to have accessed external finance in 2020 than 2019. 47.5 per cent needed external finance last year compared with 40.5 per cent in 2019. Reflecting difficult business conditions in 2020, 36.1 per cent sought external finance for business survival, up from 30.3 per cent in 2019. Respondents from Taiwan found accessing external finance in 2020 slightly less easy than 2019. 21.5 per cent found accessing finance last year was easy or very easy, down from 25.4 per cent in 2019. Banks were the most likely source of that finance. Factors that had positive and negative influences on business in 2020
Top four factors that had a positive influence on Taiwan small business in 2020
Top four factors that had a positive influence on Taiwan small business in 2019
Top four factors that had a positive influence on Taiwan small business in 2018
COVID-19 Customer loyalty Customer loyalty
Cost control Cost control Good staff
Customer loyalty Good staff Cost control
Technology Introduced a new product or service Introduced a new product or service
Top four factors that had a negative impact on Taiwan small business in 2020
Top four factors that had a negative impact on Taiwan small business in 2019
Top four factors that had a negative impact on Taiwan small business in 2018
COVID-19 Increasing costs Increasing costs
Poor overall economic environment Poor overall economic environment Poor overall economic environment
Difficulty expanding into new markets Staff cost Increasing competition
Increasing costs Increasing competition Staff cost^ Political instability
^ equal fourth Taiwan’s small businesses found that ‘poor overall economic environment’, ‘difficulty expanding into new markets’ and ‘increasing costs’ also had negative impacts on their business. Staff costs were the costs most detrimental to Taiwan’s small business in 2020. A stronger focus on technology, such as automation, can reduce the need for staff or free up staff to perform higher value-added tasks.
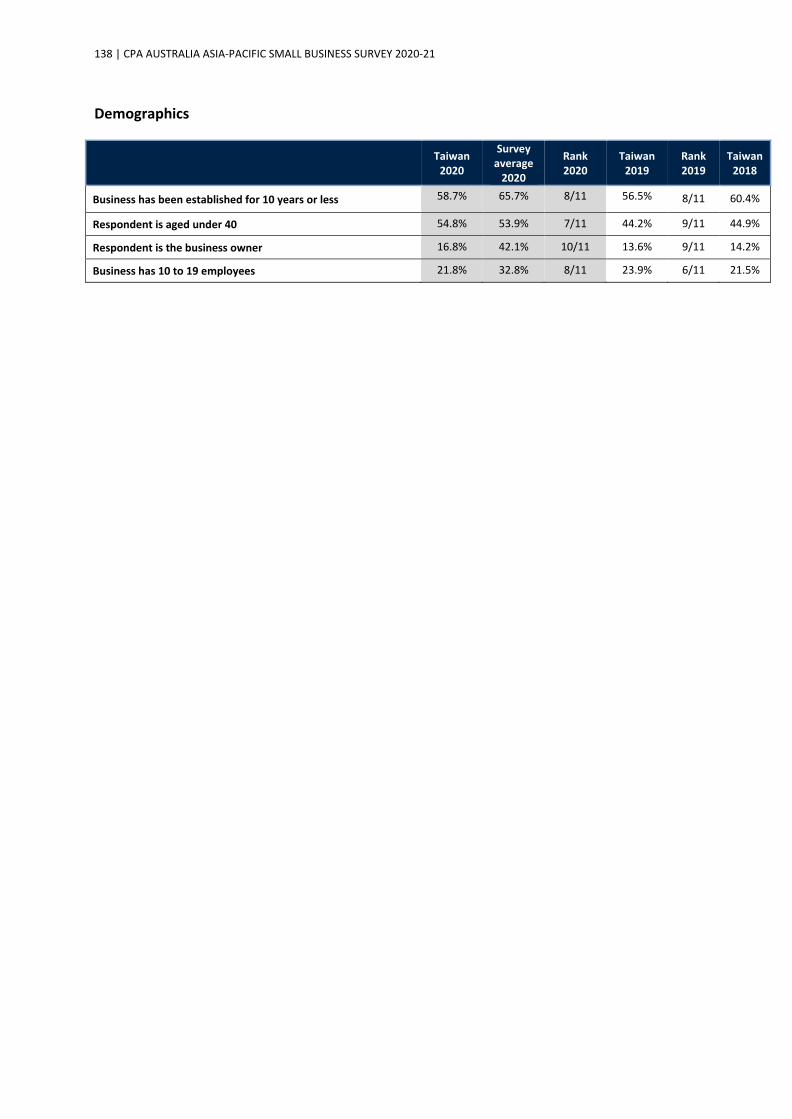
138 | CPA AUSTRALIA ASIA-PACIFIC SMALL BUSINESS SURVEY 2020-21
Demographics
Taiwan 2020
Survey average
2020
Rank 2020
Taiwan 2019
Rank 2019
Taiwan 2018
Business has been established for 10 years or less 58.7% 65.7% 8/11 56.5% 8/11 60.4%
Respondent is aged under 40 54.8% 53.9% 7/11 44.2% 9/11 44.9%
Respondent is the business owner 16.8% 42.1% 10/11 13.6% 9/11 14.2%
Business has 10 to 19 employees 21.8% 32.8% 8/11 23.9% 6/11 21.5%

139 | CPA AUSTRALIA ASIA-PACIFIC SMALL BUSINESS SURVEY 2020-21
Vietnam market summary Business and economic growth
Vietnam 2020
Survey average
2020
Rank 2020
Vietnam 2019
Rank 2019
Vietnam 2018
Vietnam 2017
Vietnam 2016
Businesses that grew in the last 12 months
63.2% 46.2% 2/11 95.0% 1/11 90.0% 90.7% 89.0%
Businesses that expect to grow in the next 12 months
86.1% 60.8% 2/11 95.7% 1/11 91.3% 93.7% 93.9%
Businesses that expect the local economy to grow in the next 12 months
86.5% 58.6% 1/11 95.0% 1/11 92.2% 85.0% 85.8%
2020 was a weaker year for Vietnam’s small businesses than 2019. 63.2 per cent grew last year, down significantly from 95.0 per cent in 2019. However, Vietnam’s businesses were the second most likely to report growing in 2020. Further, more reported growing strongly last year than 2019. 28.1 per cent of Vietnam’s small businesses grew strongly in 2020, compared with 18.0 per cent in 2019. 2021 is expected to be a better year for Vietnam’s small businesses. 86.1 per cent of businesses expect to grow, the second highest result of the 11 markets surveyed. There are many positive aspects of the results from Vietnam. Many small businesses have characteristics strongly connected with growth, especially a focus on: • technology • e-commerce • innovation • exports. We are therefore likely to see Vietnam’s small businesses recover quickly from COVID-19 and grow strongly in 2021 and beyond. Several of Vietnam’s small businesses are likely to evolve into large, successful global businesses in the next few years.
40%
50%
60%
70%
80%
90%
100%
2014 2015 2016 2017 2018 2019 2020
Small businesses that reported growing in the previous 12 months - Vietnam against survey
average
Vietnam Survey average
40%
50%
60%
70%
80%
90%
100%
2014 2015 2016 2017 2018 2019 2020
Small businesses that expect to grow in the next 12 months - Vietnam against
survey average
Vietnam Survey average

140 | CPA AUSTRALIA ASIA-PACIFIC SMALL BUSINESS SURVEY 2020-21
Impacts of COVID-19
Vietnam 2020
Survey average
2020 Rank 2020
COVID-19 had a major negative impact on my business in the past 12 months 81.3% 57.1% 1/11
My business’s major reaction to COVID-19 was to begin or increase its focus on online sales
42.3% 24.6% 1/11
My business has already recovered from the negative impacts of COVID-19 or I expect it to recover in the next 12 months
76.5% 39.0% 1/11
Like all markets, Vietnam’s small businesses considered COVID-19 their biggest challenge in 2020. 81.3 per cent saying it had a major impact on their business last year – the highest of the markets surveyed. COVID-19 is however not expected to be a major barrier for Vietnam’s small businesses in 2021. 76.5 per cent have already recovered from the negative impacts of the pandemic or expect to recover in 2021, the highest result amongst all markets surveyed. Use of technology
Vietnam 2020
Survey average
2020
Rank 2020
Vietnam 2019
Rank 2019
Vietnam 2018
Vietnam 2017
Vietnam 2016
Did NOT earn any revenue from online sales
21.9% 22.6% 6/11 6.3% 10/11 14.9% 4.3% 12.6%
Did NOT use social media for business purposes
21.6% 18.3% 3/11 4.0% 10/11 10.4% 2.0% 8.1%
Investment in technology by the business over the past 12 months has improved profitability
77.7% 48.1% 1/11 88.0% 1/11 76.4% 76.4% N/A
Technology the business invested in most heavily over the past 12 months
Point of Sale equipment
Computer equipment
N/A
Artificial intelligence,
machine learning and
chatbots
N/A Website N/A N/A
Consider the business likely to be cyberattacked in next 12 months
45.5% 38.8% 4/11 64.7% 1/11 65.7% 80.7% N/A
Reviewed the business’s cybersecurity protections in last six months
32.3% 43.1% 11/11 70.7% 1/11 69.6% N/A N/A
More than 10 per cent of sales is received through digital payment options such as PayPal, Alipay, WeChat Pay
74.8% 64.2% 3/11 82.5% 2/11 60.0% 62.5% N/A
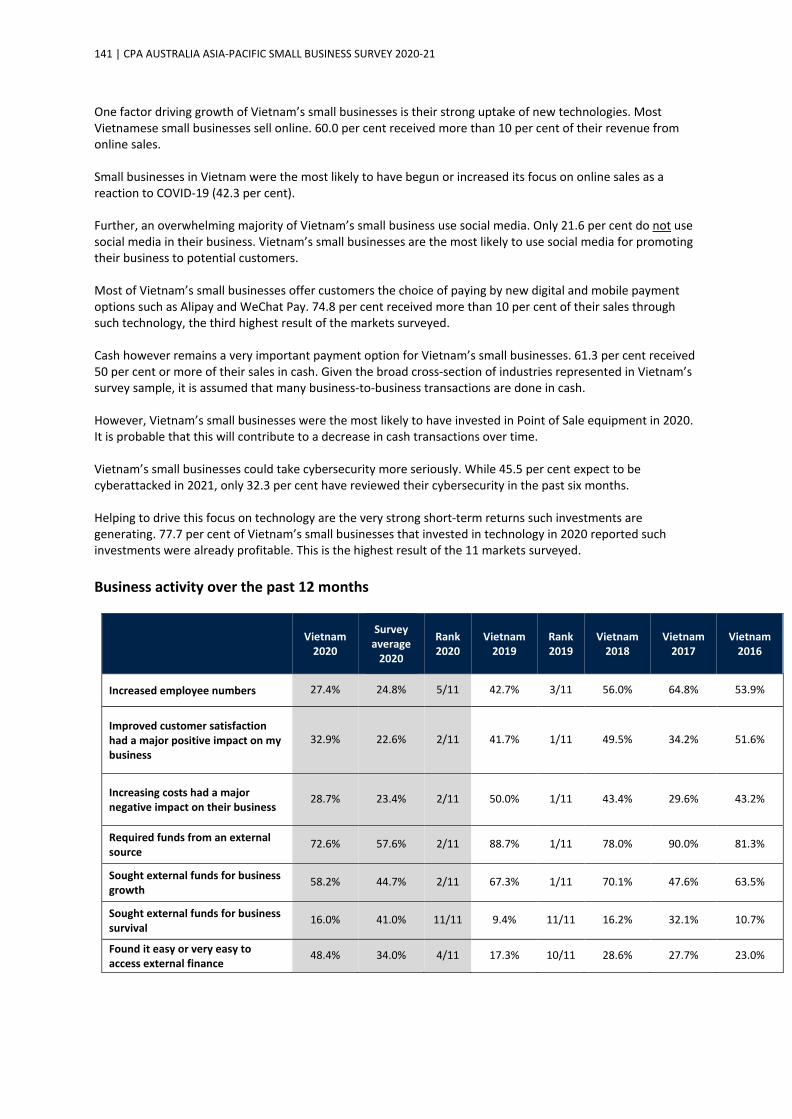
141 | CPA AUSTRALIA ASIA-PACIFIC SMALL BUSINESS SURVEY 2020-21
One factor driving growth of Vietnam’s small businesses is their strong uptake of new technologies. Most Vietnamese small businesses sell online. 60.0 per cent received more than 10 per cent of their revenue from online sales. Small businesses in Vietnam were the most likely to have begun or increased its focus on online sales as a reaction to COVID-19 (42.3 per cent). Further, an overwhelming majority of Vietnam’s small business use social media. Only 21.6 per cent do not use social media in their business. Vietnam’s small businesses are the most likely to use social media for promoting their business to potential customers. Most of Vietnam’s small businesses offer customers the choice of paying by new digital and mobile payment options such as Alipay and WeChat Pay. 74.8 per cent received more than 10 per cent of their sales through such technology, the third highest result of the markets surveyed. Cash however remains a very important payment option for Vietnam’s small businesses. 61.3 per cent received 50 per cent or more of their sales in cash. Given the broad cross-section of industries represented in Vietnam’s survey sample, it is assumed that many business-to-business transactions are done in cash. However, Vietnam’s small businesses were the most likely to have invested in Point of Sale equipment in 2020. It is probable that this will contribute to a decrease in cash transactions over time. Vietnam’s small businesses could take cybersecurity more seriously. While 45.5 per cent expect to be cyberattacked in 2021, only 32.3 per cent have reviewed their cybersecurity in the past six months. Helping to drive this focus on technology are the very strong short-term returns such investments are generating. 77.7 per cent of Vietnam’s small businesses that invested in technology in 2020 reported such investments were already profitable. This is the highest result of the 11 markets surveyed. Business activity over the past 12 months
Vietnam 2020
Survey average
2020
Rank 2020
Vietnam 2019
Rank 2019
Vietnam 2018
Vietnam 2017
Vietnam 2016
Increased employee numbers 27.4% 24.8% 5/11 42.7% 3/11 56.0% 64.8% 53.9%
Improved customer satisfaction had a major positive impact on my business
32.9% 22.6% 2/11 41.7% 1/11 49.5% 34.2% 51.6%
Increasing costs had a major negative impact on their business
28.7% 23.4% 2/11 50.0% 1/11 43.4% 29.6% 43.2%
Required funds from an external source
72.6% 57.6% 2/11 88.7% 1/11 78.0% 90.0% 81.3%
Sought external funds for business growth
58.2% 44.7% 2/11 67.3% 1/11 70.1% 47.6% 63.5%
Sought external funds for business survival
16.0% 41.0% 11/11 9.4% 11/11 16.2% 32.1% 10.7%
Found it easy or very easy to access external finance
48.4% 34.0% 4/11 17.3% 10/11 28.6% 27.7% 23.0%
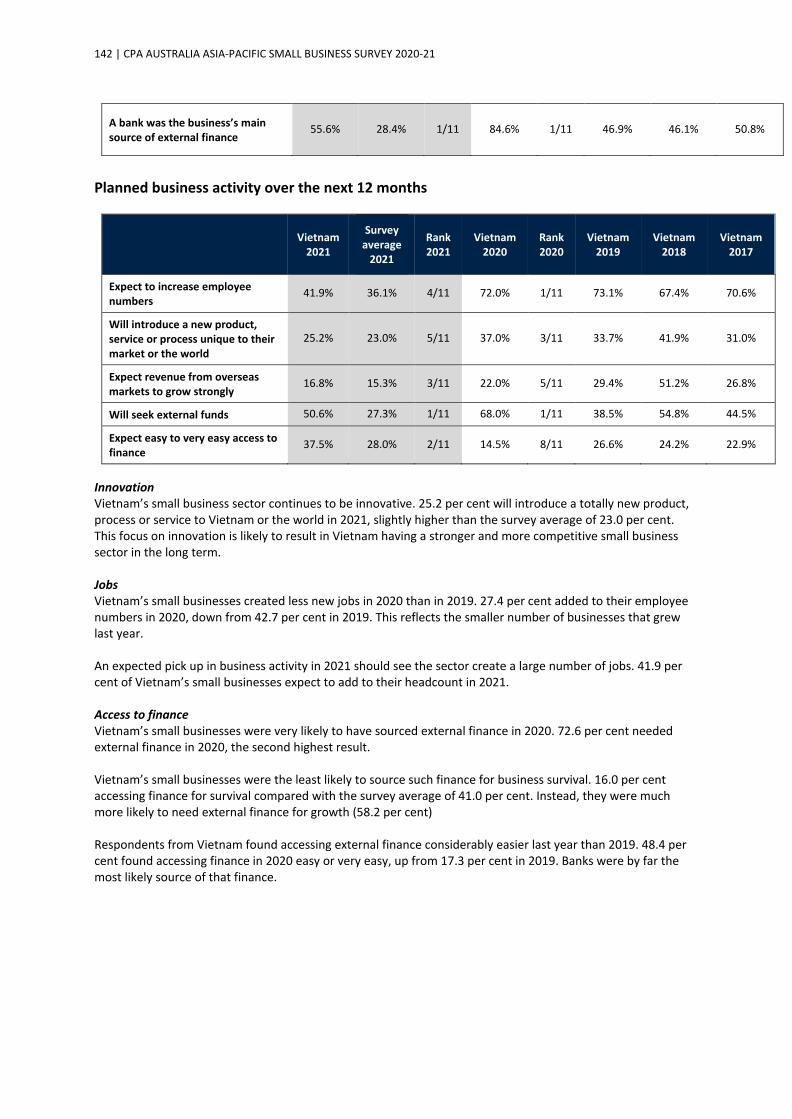
142 | CPA AUSTRALIA ASIA-PACIFIC SMALL BUSINESS SURVEY 2020-21
A bank was the business’s main source of external finance
55.6% 28.4% 1/11 84.6% 1/11 46.9% 46.1% 50.8%
Planned business activity over the next 12 months
Vietnam 2021
Survey average
2021
Rank 2021
Vietnam 2020
Rank 2020
Vietnam 2019
Vietnam 2018
Vietnam 2017
Expect to increase employee numbers
41.9% 36.1% 4/11 72.0% 1/11 73.1% 67.4% 70.6%
Will introduce a new product, service or process unique to their market or the world
25.2% 23.0% 5/11 37.0% 3/11 33.7% 41.9% 31.0%
Expect revenue from overseas markets to grow strongly
16.8% 15.3% 3/11 22.0% 5/11 29.4% 51.2% 26.8%
Will seek external funds 50.6% 27.3% 1/11 68.0% 1/11 38.5% 54.8% 44.5%
Expect easy to very easy access to finance
37.5% 28.0% 2/11 14.5% 8/11 26.6% 24.2% 22.9%
Innovation Vietnam’s small business sector continues to be innovative. 25.2 per cent will introduce a totally new product, process or service to Vietnam or the world in 2021, slightly higher than the survey average of 23.0 per cent. This focus on innovation is likely to result in Vietnam having a stronger and more competitive small business sector in the long term. Jobs Vietnam’s small businesses created less new jobs in 2020 than in 2019. 27.4 per cent added to their employee numbers in 2020, down from 42.7 per cent in 2019. This reflects the smaller number of businesses that grew last year. An expected pick up in business activity in 2021 should see the sector create a large number of jobs. 41.9 per cent of Vietnam’s small businesses expect to add to their headcount in 2021. Access to finance Vietnam’s small businesses were very likely to have sourced external finance in 2020. 72.6 per cent needed external finance in 2020, the second highest result. Vietnam’s small businesses were the least likely to source such finance for business survival. 16.0 per cent accessing finance for survival compared with the survey average of 41.0 per cent. Instead, they were much more likely to need external finance for growth (58.2 per cent) Respondents from Vietnam found accessing external finance considerably easier last year than 2019. 48.4 per cent found accessing finance in 2020 easy or very easy, up from 17.3 per cent in 2019. Banks were by far the most likely source of that finance.
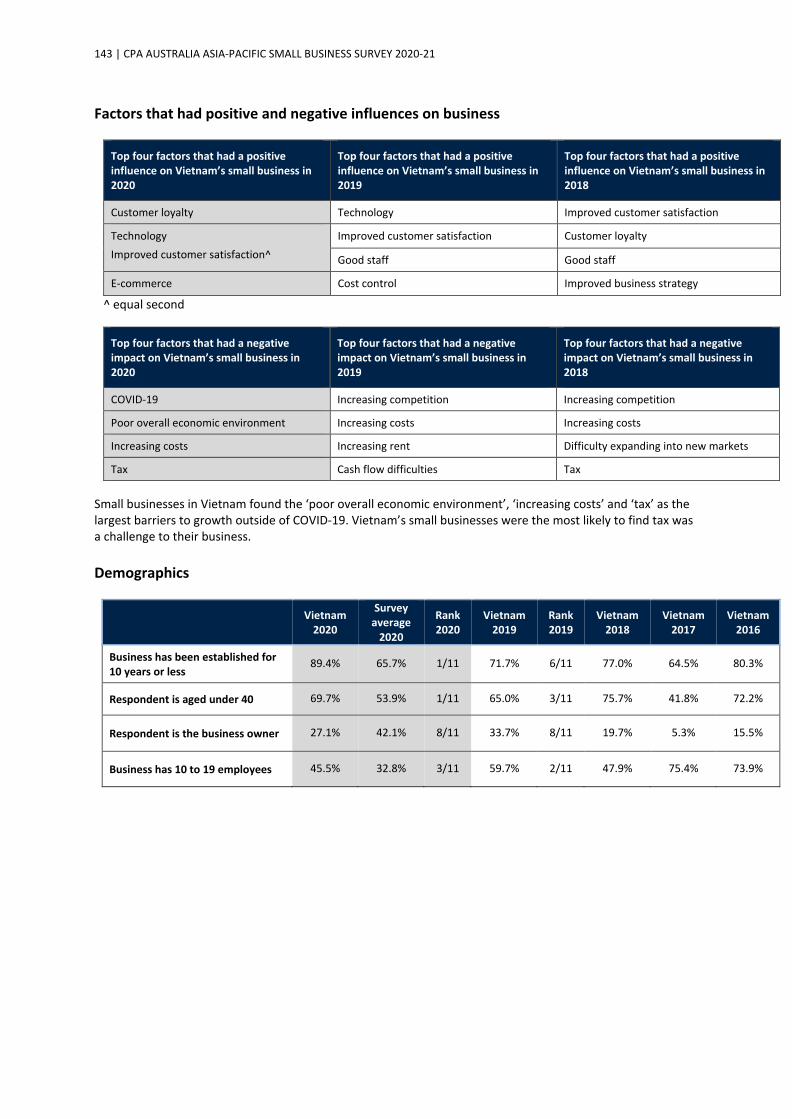
143 | CPA AUSTRALIA ASIA-PACIFIC SMALL BUSINESS SURVEY 2020-21
Factors that had positive and negative influences on business
Top four factors that had a positive influence on Vietnam’s small business in 2020
Top four factors that had a positive influence on Vietnam’s small business in 2019
Top four factors that had a positive influence on Vietnam’s small business in 2018
Customer loyalty Technology Improved customer satisfaction
Technology Improved customer satisfaction^
Improved customer satisfaction Customer loyalty
Good staff Good staff
E-commerce Cost control Improved business strategy
^ equal second
Top four factors that had a negative impact on Vietnam’s small business in 2020
Top four factors that had a negative impact on Vietnam’s small business in 2019
Top four factors that had a negative impact on Vietnam’s small business in 2018
COVID-19 Increasing competition Increasing competition
Poor overall economic environment Increasing costs Increasing costs
Increasing costs Increasing rent Difficulty expanding into new markets
Tax Cash flow difficulties Tax
Small businesses in Vietnam found the ‘poor overall economic environment’, ‘increasing costs’ and ‘tax’ as the largest barriers to growth outside of COVID-19. Vietnam’s small businesses were the most likely to find tax was a challenge to their business. Demographics
Vietnam 2020
Survey average
2020
Rank 2020
Vietnam 2019
Rank 2019
Vietnam 2018
Vietnam 2017
Vietnam 2016
Business has been established for 10 years or less
89.4% 65.7% 1/11 71.7% 6/11 77.0% 64.5% 80.3%
Respondent is aged under 40 69.7% 53.9% 1/11 65.0% 3/11 75.7% 41.8% 72.2%
Respondent is the business owner 27.1% 42.1% 8/11 33.7% 8/11 19.7% 5.3% 15.5%
Business has 10 to 19 employees 45.5% 32.8% 3/11 59.7% 2/11 47.9% 75.4% 73.9%

144 | CPA AUSTRALIA ASIA-PACIFIC SMALL BUSINESS SURVEY 2020-21
ABOUT THE SURVEY The CPA Australia Asia-Pacific Small Business Survey 2020-21 is part of a longitudinal annual study of small business across the region conducted by CPA Australia since 2009. This report presents a cross-market comparison between the eleven markets surveyed and, where applicable, a comparison of results from 2009. The survey was conducted from 9 November 2020 to 10 December 2020. India was included for the first time in 2019. Philippines and Taiwan were first included in 2018. Mainland China and Vietnam were first included in 2014. Indonesia and New Zealand were first included in 2011. The survey in Mainland China was conducted in Beijing, Chongqing, Guangzhou, Shanghai and Shenzhen (Shenzhen was added for the first time in 2018). The survey in India was conducted in Delhi/Gurgaon, Mumbai, Chennai, Bengaluru and Hyderabad. For this report, all data shown for China excludes Hong Kong and Taiwan, which are shown separately. Interview method In each market, the online survey was conducted amongst a random sample of small business owners/senior managers. The sample was obtained through online panel provider Dynata and their Asian panel partner iPanel Online and AIP Corporation. To qualify for the survey, participants were needed to be an owner, a senior manager or a qualified accountant of a business with less than 20 employees. Sample 4227 participants completed the survey, including 507 from Australia, 779 from Mainland China, 306 from Hong Kong, 512 from India, 301 from Indonesia, 302 from Malaysia, 300 from New Zealand, 300 from the Philippines, 307 from Singapore, 303 from Taiwan and 310 from Vietnam. Of the 772 participants from Mainland China (which for this report excludes Hong Kong and Taiwan), 156 were from Beijing, 155 were from Chongqing, 157 were from Guangzhou, 155 were from Shanghai and 156 were from Shenzhen. Of the 506 participants from India, 106 were from Delhi/Gurgaon, 105 were from Mumbai, 89 were from Chennai, 98 were from Bengaluru and 105 were from Hyderabad. Questioning The questions were largely drawn from previous surveys. Several questions and options relating to COVID-19 were added to this survey. Questionnaires in Australia, India, New Zealand, the Philippines and Singapore were administered in English. The Hong Kong and Taiwan questionnaires were administered in traditional Chinese, the questionnaire for Malaysia was administered in both English and Bahasa Malaysia, Indonesia’s questionnaire was administered in Bahasa Indonesia, Mainland China’s questionnaire was administered in simplified Chinese, and Vietnam’s questionnaire was administered in Vietnamese. Rounding All percentage results shown in this report have been rounded to the nearest percentage.