course slides - noldus 1 - measuring behavior · mb2010 heffelaar 24-8-2010 course slides - noldus...
TRANSCRIPT
MB2010 Heffelaar 24-8-2010
Course slides - Noldus 1
The Observer XT in HCI research
Tobias Heffelaar
MB 2010 Eindhoven, Netherlands, 24 August 2010
Scope of this course
• Theme: Measuring user-system interaction
• Context: Research or testing
• For: Academia, industry or consulting
From usability…
• Measuring effectiveness, efficiency, satisfaction
• In relation to well-defined tasks
• Primarily for productivity tools, office applications
…to user experience
• Measuring the complete user experience
• Emotion, fun, excitement, trust
• For consumer products, games, e-learning systems,
web sites
Measuring user-system interaction

MB2010 Heffelaar 24-8-2010
Course slides - Noldus 2
User-Centered Design
Focus on the user: observe and listen
• Ethnography - field studies
• Focus groups
• Formative usability testing
– Low-fidelity prototypes
– High-fidelity prototypes
• Summative usability testing
Professional tools make this work pleasant, efficient and effective!
Course objectives
What you will learn
• learn how to design, execute and analyze observational
studies (such as usability tests)
• learn how to configure and use The Observer in various
stages of the research and development process, from
field observations to summative usability tests
• learn how to combine observational data collection with
other techniques, such as eye tracking and physiological
data acquisition
Course agenda
Designing the coding scheme
Data collection
Multimodal measurements
Analyzing observational data
HILAS case study

MB2010 Heffelaar 24-8-2010
Course slides - Noldus 3
Your instructor
Tobias Heffelaar, Usability specialist (at)
Noldus Information Technology
Wageningen LeesburgThe Netherlands Virginia, USA
www.noldus.com/usability
Company profile
Who we are• Provider of software, hardware and services for HCI
research and usability testing• Founded in 1989• Currently ~90 employees
What we do• Development of data collection and analysis software
(installed base: ~4,000 organizations in >75 countries)• System integration (mobile and stationary usability labs)• Lab rental• Training• Consulting
International Offices
= Noldus office= Distributor
MB2010 Heffelaar 24-8-2010
Course slides - Noldus 4
Sources of data and illustrations
Tools manufacturers• Biopac• Noldus Information Technology• Polar• SensoMotoric Instruments• TechSmith• Tobii Technology• VicarVision
Usability practitioners• Many collaborators and clients
Course agenda
Designing the coding scheme• From basic to elaborate, from generic to specific, best
practices
• Freeform annotation vs. structured event logging
• Optimizing the coding scheme to make scoring easier
Data collection• Real-time logging vs Post-test annotation
Design a simple and effective coding scheme for both qualitative and quantitative data collection
Free-form annotation
Write down what is said and observed during test
• Quick, no equipment required
• Difficult to analyze, expert observer required, how fast
can you write?
Audio recording of participant comments,
post-hoc transcription
• Easy, nothing gets lost
• Context is gone, analysis is laborious, subjective data
collection

MB2010 Heffelaar 24-8-2010
Course slides - Noldus 5
Free-form annotation
User comments
…….
Uhhh…. What do I do here?
Now I see what this is!
So I just click here…(user clicks button)
Oh no (application closes)
Where is my data? Did it save my file?
(restarts application) I hope my document is still
there
….
Structured event logging
Pro
• Pre-defined set of events
• Pre-defined usability goals
• More objective data collection
• Quantitative analysis possible
• Allows validation and reliability analysis
• Facilitates education and training of observers
Con
• Time-consuming
• Requires preparation
• Specify what to code (not always known beforehand)
• Train coding scheme
Best of both worlds
• Start with free-form annotation
• Build coding scheme as you go along

MB2010 Heffelaar 24-8-2010
Course slides - Noldus 6
Structured event logging
Coding scheme (tasks and event categories)
Screen capture
Video control
Event log+ comments
Video inset
The Observer XT Timers
Methods compared
Free-form annotation Structured event logging
and coding
Data produced Qualitative Quantitative
Timing accuracy Not so important Very important
When used Formative tests with few
participants
Summative tests with many
participants, human factors
research
Data used for Communication with
client, compilation of
video highlights
Usability metrics, sequential
analysis, pattern detection
Structured data collection
Logging of important events, such as:
Tasks
• Keep track of user intention
Interface elements
• Menu items, commands, controls, …
Participant behavior
• Comments, gestures, facial expression, …
Encountered problems
• Navigation issues, feedback issues, …
Problem solving strategies
• Trial-and-error, use of info resources, …
MB2010 Heffelaar 24-8-2010
Course slides - Noldus 7
Coding scheme elements
• Name (subject, behavior, modifier)
• Hierarchical level (grouping)
• Definition
• Shortcut key
• State or event
• Sound feedback (e.g. spoken element)
• Image (e.g. facial expression)
• Video clip (e.g. gesture)
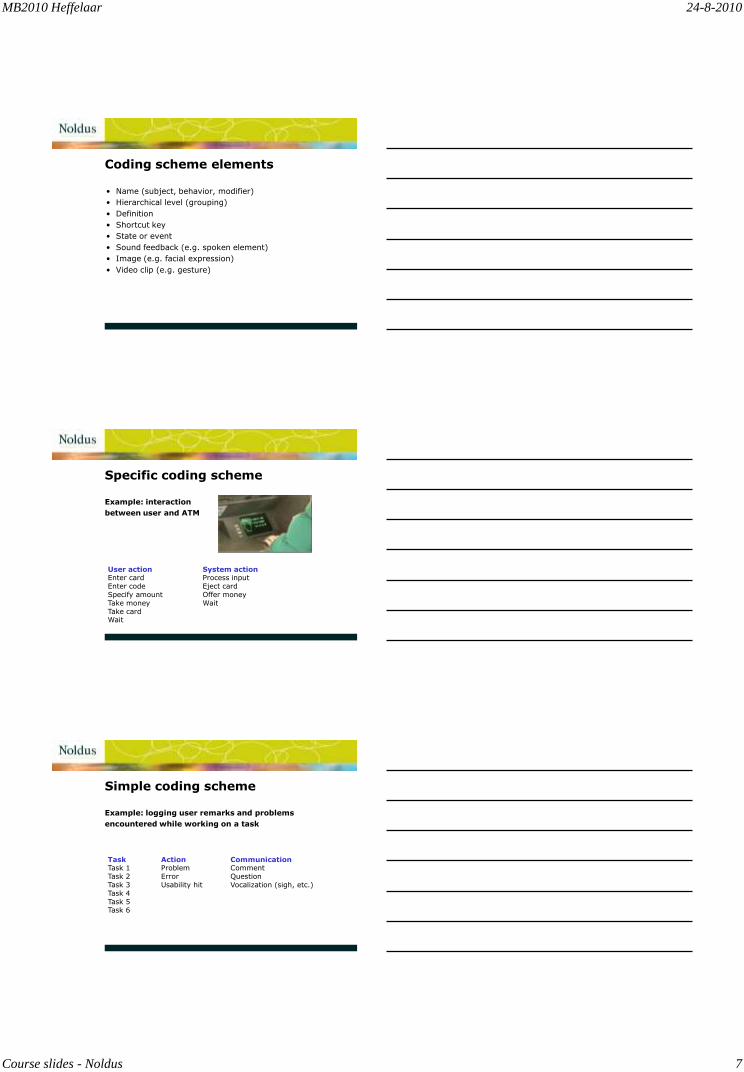
Specific coding scheme
Example: interaction
between user and ATM
User actionEnter cardEnter codeSpecify amountTake moneyTake cardWait
System actionProcess inputEject cardOffer moneyWait
Simple coding scheme
CommunicationCommentQuestionVocalization (sigh, etc.)
TaskTask 1Task 2Task 3Task 4Task 5Task 6
ActionProblemErrorUsability hit
Example: logging user remarks and problems
encountered while working on a task
MB2010 Heffelaar 24-8-2010
Course slides - Noldus 8
Scoring events
• Record events and time of occurrence
• Live or offline: depending on level of detail needed
• Use mouse to select events from list, or
• Type shortcut keys: no need to look away from subject
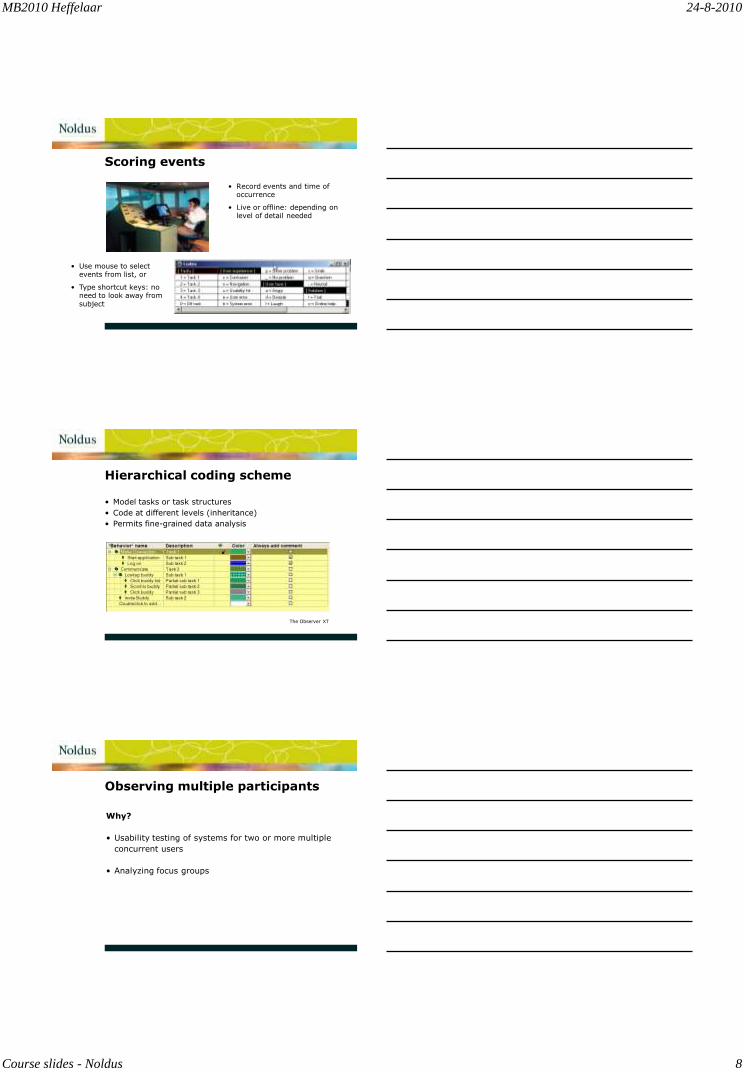
Hierarchical coding scheme
• Model tasks or task structures
• Code at different levels (inheritance)
• Permits fine-grained data analysis
The Observer XT
Observing multiple participants
Why?
• Usability testing of systems for two or more multiple
concurrent users
• Analyzing focus groups
MB2010 Heffelaar 24-8-2010
Course slides - Noldus 9
Focus group coding scheme
Verbal communicationRemarkQuestionExplanation
PersonModeratorParticipant 1Participant 2Participant 3
Non-verbal communicationGestureEye contactLooking awayVocalization (sigh, etc.)
Multi-user applications
Same time Different times
Same
place
Control rooms,
meeting rooms
Project scheduling,
coordination tools
Different
places
Video conferencing,
instant messenging,
multi-player games
Email, bulletin boards
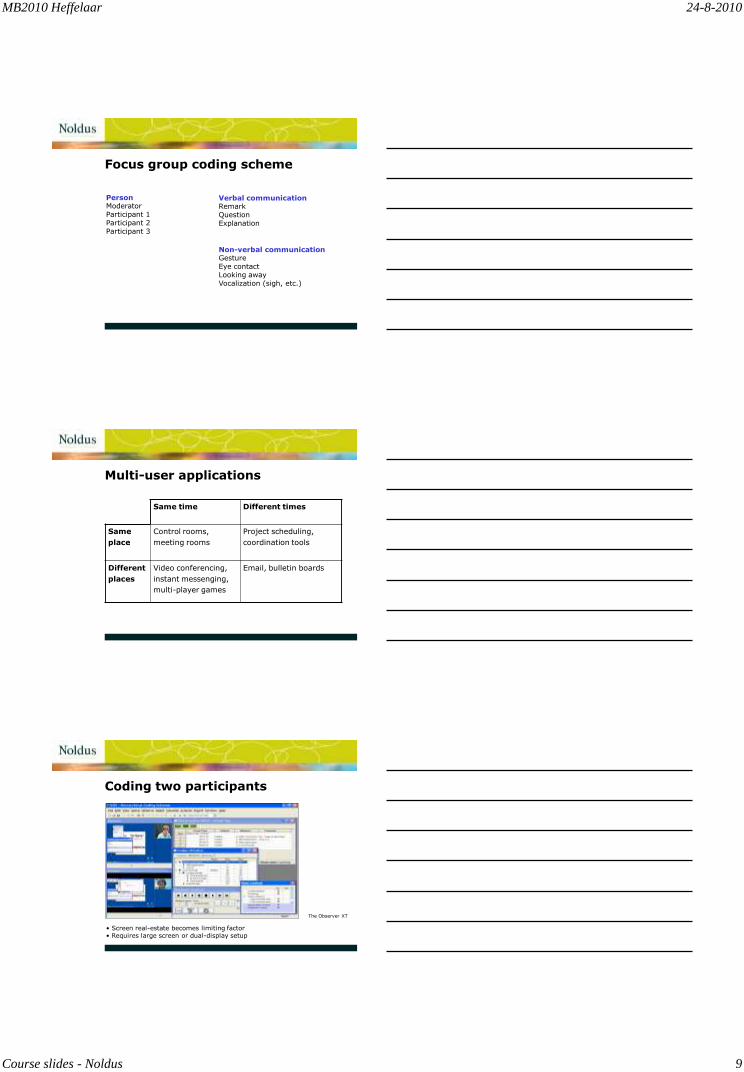
Coding two participants
The Observer XT
• Screen real-estate becomes limiting factor• Requires large screen or dual-display setup

MB2010 Heffelaar 24-8-2010
Course slides - Noldus 10
Multi-user usability tests
Methodological and technical challenges• Coding issues: record individual behaviors as well as
interactions between participants, real-time data
entry requires multiple loggers
• Group behavior is complex: roles can change,
different interaction patterns
• Experiments are more difficult to control: selection of
subject groups, designing experiment and tasks
• Technical issues: video recording, data gathering,
large amount of data for analysis
Complex multi-user coding scheme
MoodPositiveNegativeNeutral
Problem solvingOn-line helpTrial & errorCall supportOther solutionNo solution
PerformanceProblemErrorAssistUsability hit
TaskTask 1Task 2Task 3Task 4Off task
ActionOperateReadWritePhone
HandsKeyboardMousePointingHold
• Code events for each user• Code certain events for certain users
ParticipantUser 1User 2User 3
Complex coding scheme
MoodPositiveNegativeNeutral
System actionAlertResponse
User evaluationCheck resultStopCommentRetryStress
PrepareObject to be treatedSuitable toolsGoal to be defined
OpportunismAdapt resultAd-hoc searchPrevent damage
FeedbackOffer interaction elementVisual guidanceOffer contextPresent resultPrompt user
Task intention coding (partial)(Dzida et al.)
ExecuteCommandData input
MB2010 Heffelaar 24-8-2010
Course slides - Noldus 11
Typical MMI evaluation codingscheme
CommunicationPositive commentNegative commentPositive non-verbal expressionNegative non-verbal expression
Task listTask 1Task 2Etc
Tasks are states (durations) time on task
UsabilitySystem errorUser errorAssistUse of support (or OLH, etc)
All elements are point eventsnumber of occurences
Tools for multi-user tests
• Multiple video cameras, microphones and/or „live‟
observers
• Multiple mixing and recording equipment
• Hardware for recording and playback of multiple
synchronized video and audio streams
• Event logging software that supports multiple loggers
and/or subjects
Observational data collectionThings to keep in mind
• Structured data collection takes more time before and
during test, but it speeds up analysis and improves
the quality of the results
• When observing interactions between users: coding
scheme extra important
• Event logging equipment exists for just about any test
MB2010 Heffelaar 24-8-2010
Course slides - Noldus 12
Course agenda
Multimodal measurements• Eye tracking, physiological data acquisition, keystroke
and mouse logging
• Combining The Observer with other data collection tools:
synchronization of measurements, data import
• Integrated visualization of video streams, events and
signals
Multimodal data collection
Measuring multiple modalities of user-system interaction
Behavioral
• Task performance
• Keyboard activity
• Mouse activity
• Body posture
• Facial expression
• Eye movement
• Gestures
• Verbal comments
Physiological
Emotional state
• Galvanic skin resistance
Mental load
• Pupil diameter
• Heart rate variability
• Respiration
Physical load
• Electromyogram
• Grip force
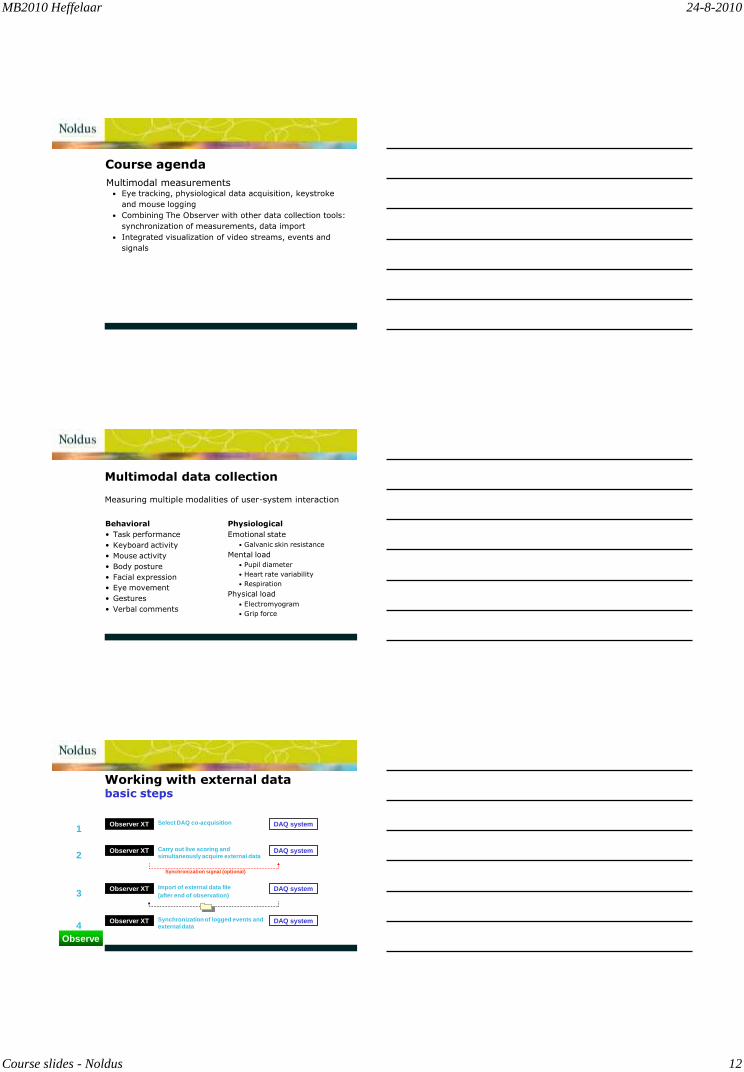
Working with external databasic steps
Observer XT DAQ systemSelect DAQ co-acquisition
Observer XT DAQ systemCarry out live scoring and
simultaneously acquire external data
Synchronization signal (optional)
Observer XT DAQ systemImport of external data file
(after end of observation)
Observer XT DAQ systemSynchronization of logged events and
external data
1
2
3
4
Observe

MB2010 Heffelaar 24-8-2010
Course slides - Noldus 13
Why do I need synchronization?
• Synchronization enables you to examine physiological data in relation to the associated logged events
Observe
Events
Physiology
Methods of synchronization
• Automatic synchronization
• XT computer and DAQ system connected through the synchronization signal
• Manual synchronization
• No connection between XT computer and DAQ system
Observe
Analyze
Visualize DataCreate a chart

MB2010 Heffelaar 24-8-2010
Course slides - Noldus 14
Automatic event logging (1)
• Log mouse clicks, keystrokes, URLs, dialogs, pop-up menus, etc.
• X,Y coordinates logged
• Pro: easy and cost-effective data acquisition• Con: hard to interpret unless combined with
observational data and task information
Morae
Automatic event logging (2)
Caution• Keyboard and mouse
logging tools can create massive amounts of data
• To reduce data volume: select in advance what to track
• Available tools vary in logging capabilities and „intelligence‟
uLog
Automated observation with sensors
Photos: Infusion Systems Ltd
contact pressure ambient light loudness
motion proximity vibration

MB2010 Heffelaar 24-8-2010
Course slides - Noldus 15
Measuring eye gaze
• Tool: eye tracking system, head-mounted or
contact-free
• Measures:
– where the subject looks
– how long and often they look at
something
– path the eyes follow between predefined
areas of interest
– pupil diameter (measure of cognitive
load)
• Complement observational methods, e.g.
find co-occurrence of “confusion” and “fixate”
Tobii Technology
SensoMotoric Instruments
Eye tracking: analysis
Hot spots
Gaze plot
Physiological measurements
• Heart rate variability, skin conductance, blood pressure: indicator of stress level
• Integrate physiology with video, observational data, eye movement, system events…

MB2010 Heffelaar 24-8-2010
Course slides - Noldus 16
The Observer XT
Physiological measurements
Usability testing of aviation systems
Data sources: video, audio, task performance, EOG, EPOG, ECG, EEG, Ear Pulse, etc.
Air Traffic Control simulator
Cockpit
Facial Electromyography (EMG)
• EMG measures contraction of muscles
• Electrodes applied to skin surface
• Can be used to measure difficulty of
motor tasks, e.g. UI operations: cursor
positioning, drag & drop,
resizing windows
• But: rather laborious and obtrusive
Photo courtesy of Richard Hazlett
Photo: Ab de Haan, RadboudUniversity, Nijmegen, The
Netherlands
MB2010 Heffelaar 24-8-2010
Course slides - Noldus 17
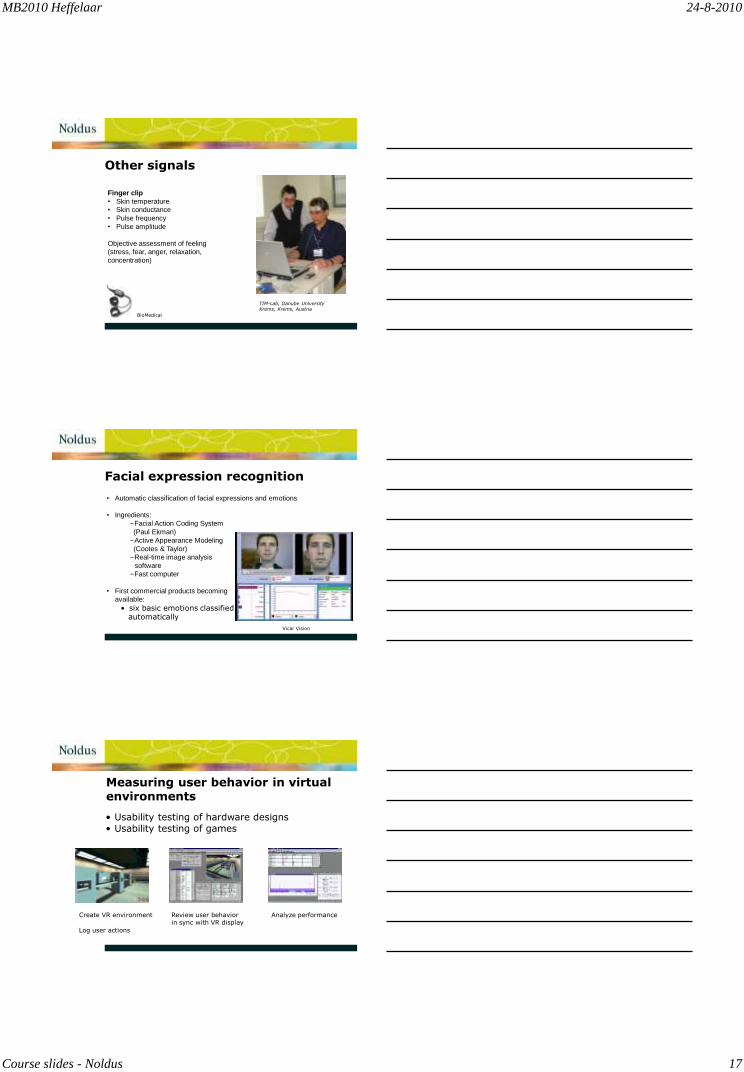
Other signals
Finger clip
• Skin temperature
• Skin conductance
• Pulse frequency
• Pulse amplitude
Objective assessment of feeling
(stress, fear, anger, relaxation,
concentration)
TIM-Lab, Danube University Krems, Krems, Austria
BioMedical
Facial expression recognition
• Automatic classification of facial expressions and emotions
• Ingredients:
–Facial Action Coding System
(Paul Ekman)
–Active Appearance Modeling
(Cootes & Taylor)
–Real-time image analysis
software
–Fast computer
• First commercial products becoming
available:
• six basic emotions classifiedautomatically
Vicar Vision
Measuring user behavior in virtual environments
Create VR environment Review user behavior in sync with VR display
Analyze performance
Log user actions
• Usability testing of hardware designs• Usability testing of games
MB2010 Heffelaar 24-8-2010
Course slides - Noldus 18
Multimodal measurementsThings to keep in mind
• Eye tracking and physiological measurements
can greatly enrich HCI data
• Measurements can be rather invasive
• Technical skills needed for data acquisition
• Integration and synchronization with video
streams and logged events is not trivial
Analyze
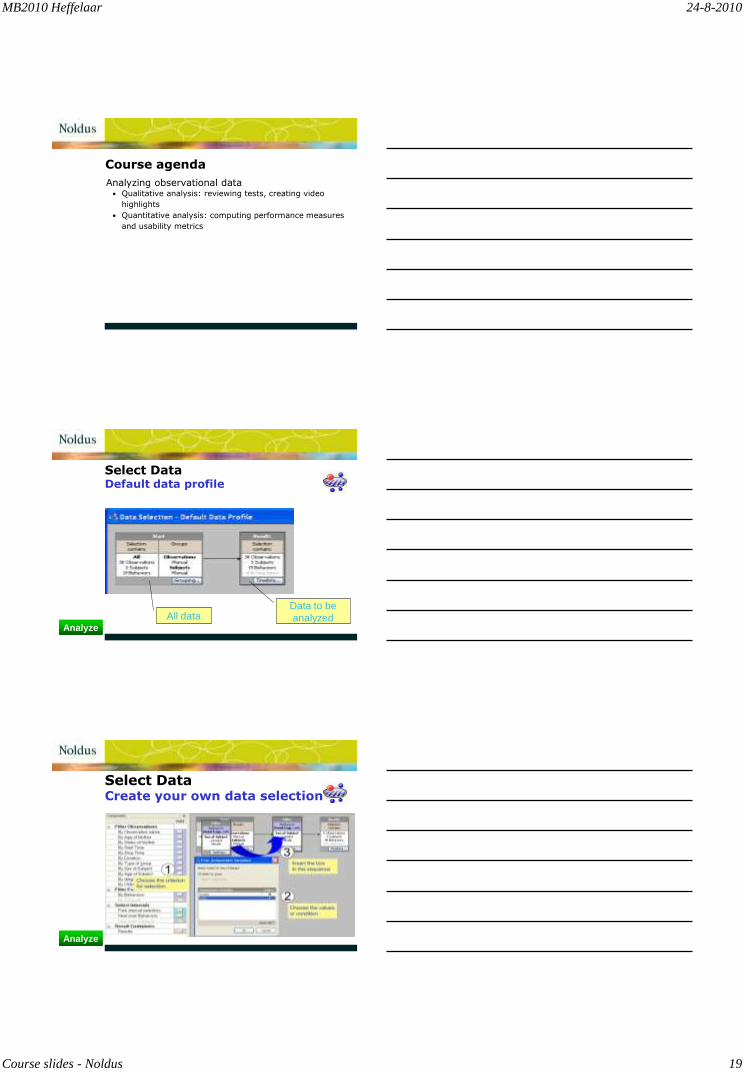
For Behavior Analysis:
• Minimum duration
• Maximum duration
• Total duration
• Total number
• Mean duration
• Standard deviation of duration
• Standard error of duration
• Rate per minute
• Percentage (of observation)
• Percentage (of interval)
Calculate StatisticsStatistics available
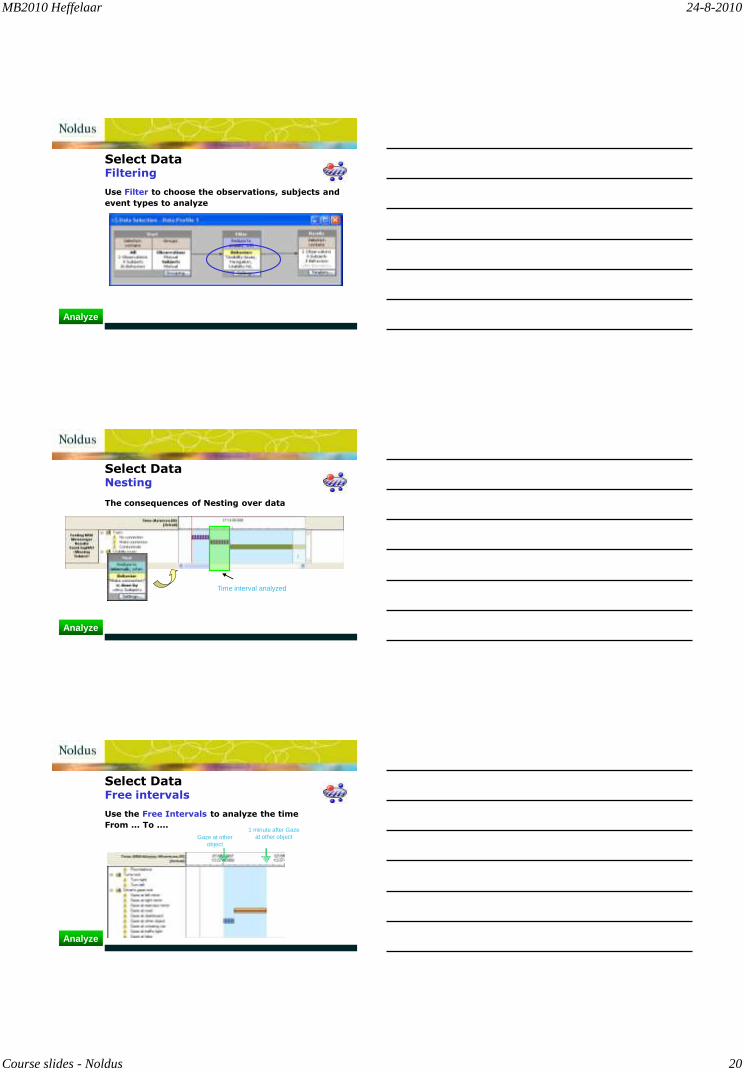
Grouping
means that two or more observations or elements of the coding
scheme are analyzed as one entity
Filtering
means that you choose a subset of elements to be displayed or used in
quantitative analyses
Nesting
means that you analyze time segments based on an event (or a
combination of events) scored for one or more subjects
Select DataDefinitions
Analyze
MB2010 Heffelaar 24-8-2010
Course slides - Noldus 19
Course agenda
Analyzing observational data• Qualitative analysis: reviewing tests, creating video
highlights
• Quantitative analysis: computing performance measures
and usability metrics
Analyze
Select DataDefault data profile
All dataData to be
analyzed
Analyze
Select DataCreate your own data selection
MB2010 Heffelaar 24-8-2010
Course slides - Noldus 20
Use Filter to choose the observations, subjects and
event types to analyze
Analyze
Select DataFiltering
`
Select DataNesting
The consequences of Nesting over data
Time interval analyzed
Analyze
Analyze
Select DataFree intervals
Use the Free Intervals to analyze the time
From ... To ....
Gaze at other
object
1 minute after Gaze
at other object
MB2010 Heffelaar 24-8-2010
Course slides - Noldus 21
Reliability Analysis
Checking the validity of your scores
• Intra-observer reliability — For checking your own
consistency
• Inter-observer reliability — For training observers
Reliability Analysis
• Frequency / Sequence based method used
• Each event in both data files are considered
• The Observer XT searches for matching events within a
defined tolerance window
• The total number of agreements and disagreements are
calculated
Find
agreements
Find
disagreements
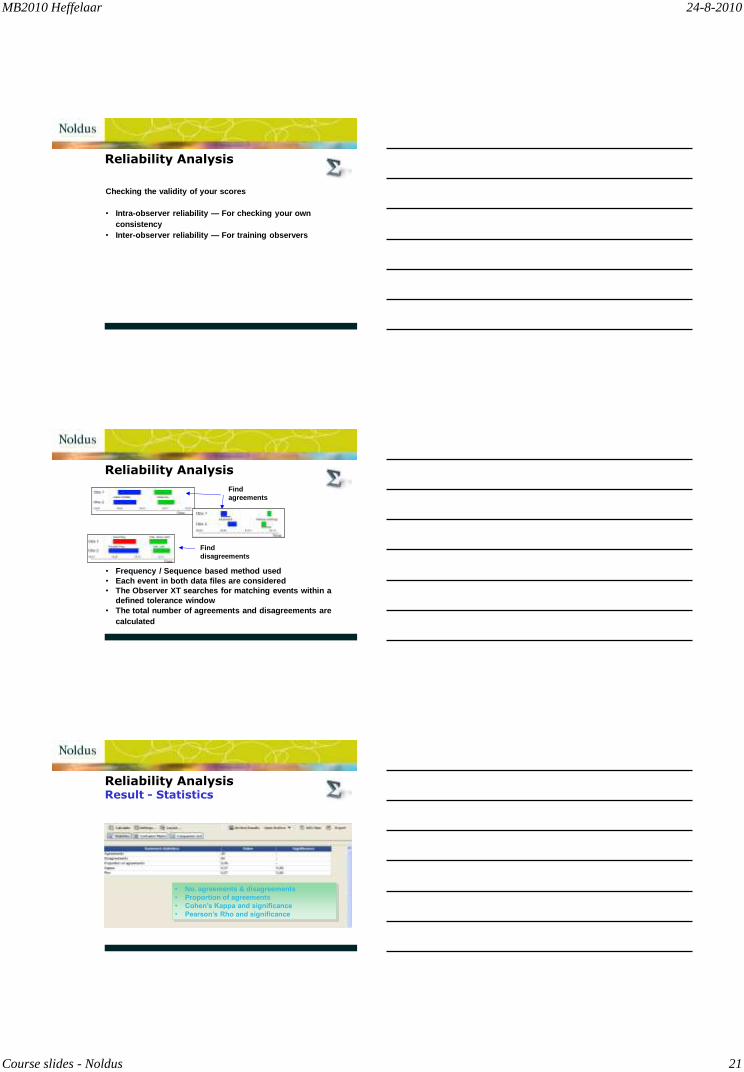
Reliability AnalysisResult - Statistics
• No. agreements & disagreements
• Proportion of agreements
• Cohen’s Kappa and significance
• Pearson’s Rho and significance
MB2010 Heffelaar 24-8-2010
Course slides - Noldus 22
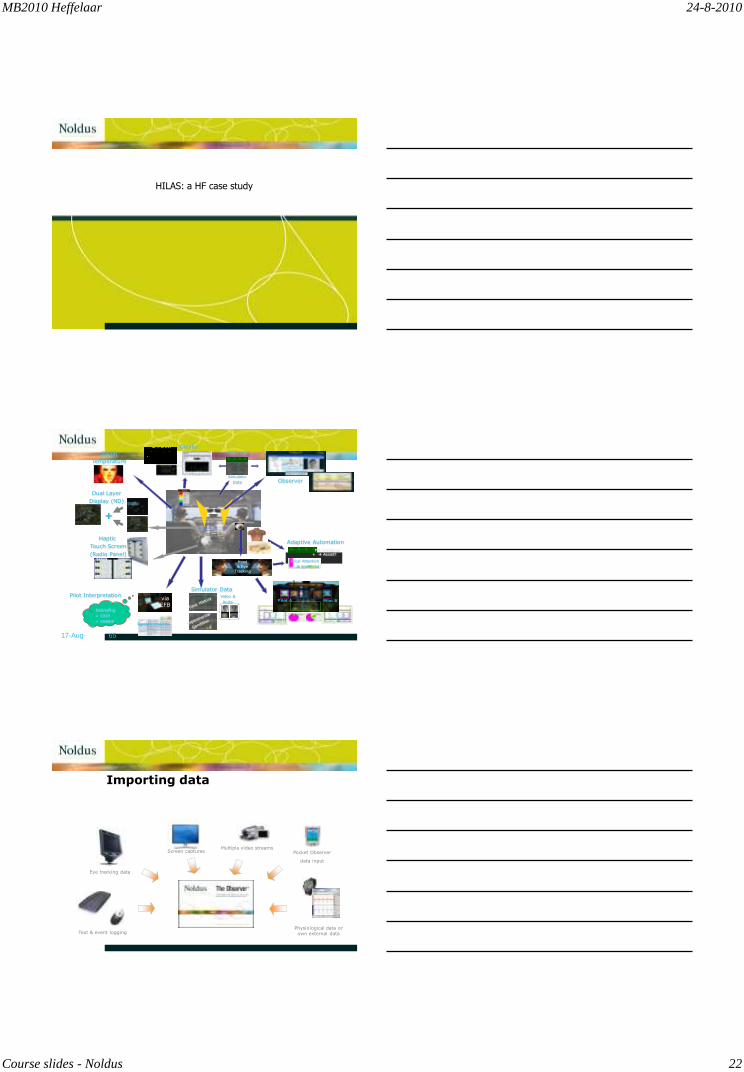
HILAS: a HF case study
17-Aug-
10
65
traffic
+
Dual Layer
Display (ND)
Haptic
Touch Screen
(Radio Panel)
Facial
Temperature
Pilot A Pilot B
Head
& EyeTracking
Observer
Gwylio
Questionnaires
Debriefing
• CRIA
• HEADS
Pilot InterpretationviaEFB
Adaptive Automation
+ Assist?HR Workload
Focal Attention
& Workload
Simulator DataVideo &
Audio
Simulator
Data
Heart rate
Importing data
Screen captures
Eye tracking data
Multiple video streams
Text & event logging
Pocket Observer
data input
Physiological data or own external data

MB2010 Heffelaar 24-8-2010
Course slides - Noldus 23
Import profiles
• Specification of the way data files should be intepreted
• Different profiles for different types of data
Integrated Visualization
Up to four
synced videos
Hairline:
‘You are here’
Video control
Various speeds
One overview of all data
Accurate and visual quality assessment
Event Log
Flight
parameters
Calculate StatisticsBehavior Analysis
• Example: The total amount of time a pilot communicates with the control tower
Numerical Modifier Analysis
• Example: The average variation in plane altitude when flying manual
Lag Sequential Analysis
• Example: The most common action taken when a problem is detected
Reliability Analysis
• Example: The consistency of observations between observers

MB2010 Heffelaar 24-8-2010
Course slides - Noldus 24
The experts
2 expert raters marked all SA relevant events using:
‘SA positive’ or
‘SA negative’ events
Unfortunately no correlation between markings.
General impression (more pos or neg SA events
per observation) did match.
Data distributionPartners geographically dispersed required the same data
• Data was combined by one partner
• Each partner received subset with relevant data
• Domain experts send back their evaluation for further
integration
Independent Variables
Keep track of Trial and/or Crew characteristics
Used when filtering data for analysis
MB2010 Heffelaar 24-8-2010
Course slides - Noldus 25
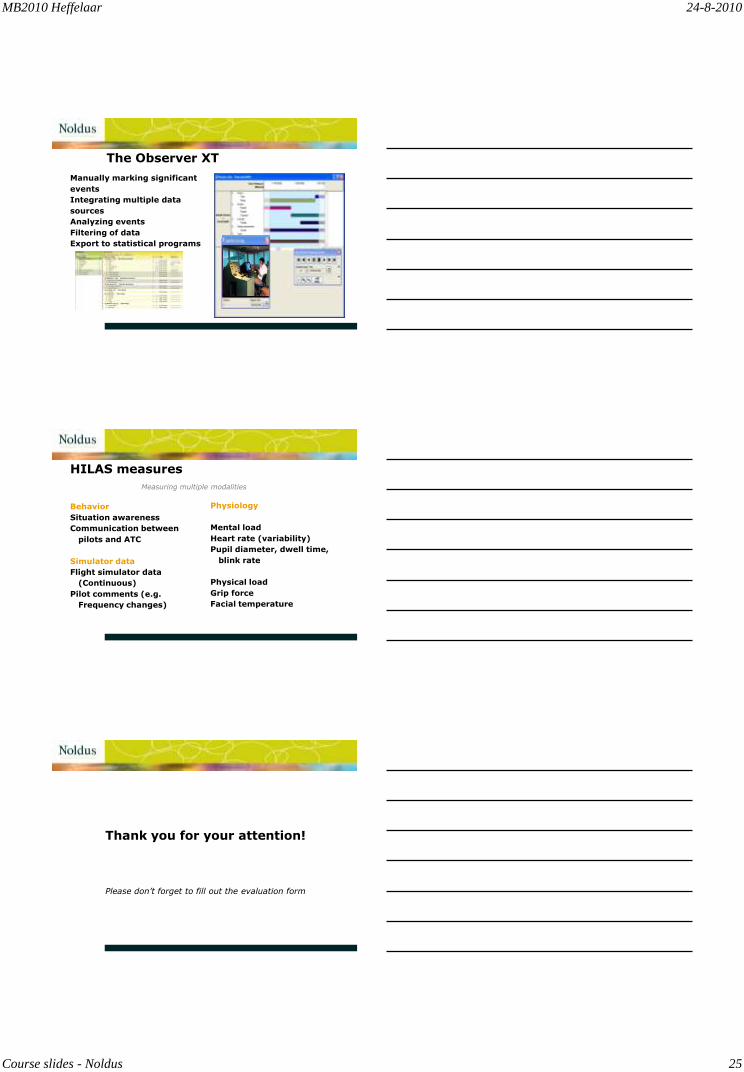
The Observer XT
Manually marking significant
events
Integrating multiple data
sources
Analyzing events
Filtering of data
Export to statistical programs
HILAS measures
Behavior
Situation awareness
Communication between
pilots and ATC
Simulator data
Flight simulator data
(Continuous)
Pilot comments (e.g.
Frequency changes)
Physiology
Mental load
Heart rate (variability)
Pupil diameter, dwell time,
blink rate
Physical load
Grip force
Facial temperature
Measuring multiple modalities
Thank you for your attention!
Please don’t forget to fill out the evaluation form