coupling of an optical parametric ... - ufdc image array...
TRANSCRIPT

1
COUPLING OF AN OPTICAL PARAMETRIC OSCILLATOR LASER AND A FOURIER TRANSFORM ION CYCLOTRON RESONANCE MASS SPECTROMETER TO
DIFFERENTIATE EPIMERIC MONOSACCHARIDES
By
EMILIO BENOZA CAGMAT
A THESIS PRESENTED TO THE GRADUATE SCHOOL OF THE UNIVERSITY OF FLORIDA IN PARTIAL FULFILLMENT
OF THE REQUIREMENTS FOR THE DEGREE OF MASTER OF SCIENCE
UNIVERSITY OF FLORIDA
2010

2
© 2010 Emilio Cagmat

3
To Team Koji

4
ACKNOWLEDGMENTS
The making of this thesis involved many people, and I owe them a debt of
gratitude. I would like to thank my adviser, Professor John Eyler, for the guidance and
help; Dr. Nick Polfer, for lending his expertise in gas phase analysis; and Dr. Dave
Powell for allowing me to use the FT-ICRMS instrument.
I also extend my gratitude to Dr. Cesar Contreras, for introducing me to theoretical
calculations in chemical modeling, to Dr. Lee Pearson, for setting up the instrument and
occasional troubleshooting, and to Dr. Jan Szczepanski, for our in-depth discussions
related to the experiments.
My graduate student life would have been incomplete without the members of the
Polfer and Eyler research groups. In addition, I would like to thank the Filipino graduate
students at the University of Florida, for making Gainesville my second home.
Lastly, I want to express my appreciation to my wife, baby Koji and my parents.

5
TABLE OF CONTENTS page
ACKNOWLEDGMENTS ...................................................................................................... 4
LIST OF FIGURES .............................................................................................................. 7
LIST OF ABBREVIATIONS ................................................................................................ 9
ABSTRACT........................................................................................................................ 10
CHAPTER
1 CARBOHYDRATES ................................................................................................... 11
Introduction ................................................................................................................. 11 Carbohydrate Chemistry............................................................................................. 11
Aldoses ................................................................................................................. 12 Erythreoses, Threoses, Pentoses and Hexoses................................................. 14 Mutarotation, Anomers and Epimers ................................................................... 17 Carbohydrate Analysis ......................................................................................... 20
2 INFRARED MULTIPLE PHOTON DISSOCIATION OF GAS PHASE MOLECULAR IONS TRAPPED IN AN FT-ICR MASS SPECTROMETER ............. 25
Introduction ................................................................................................................. 25 Fourier Transform Ion Cyclotron Resonance ............................................................ 26
Mass Spectrometry .............................................................................................. 26 Sample Ionization................................................................................................. 26 Ion Transfer .......................................................................................................... 27 Ion Excitation ........................................................................................................ 30 Detection .............................................................................................................. 31 Fourier Transform ................................................................................................ 32 Fundamental Equations ....................................................................................... 32
Multiple Photon Dissociation ...................................................................................... 34 IR Spectroscopy ................................................................................................... 34 Infrared Multiple Photon Dissociation .................................................................. 37 OPO Laser ........................................................................................................... 39
3 DIFFERENTIATION OF D-GLUCURONIC AND L-IDURONIC ACIDS .................... 42
Introduction ................................................................................................................. 42 Experimental Techniques ........................................................................................... 43
Sample Preparation ............................................................................................. 43 Instrumentation .................................................................................................... 43 Experimental Procedure ...................................................................................... 44 Calculations .......................................................................................................... 47

6
Results and Discussions ............................................................................................ 49 D-glucuronic and L-iduronic Acids ....................................................................... 49 D-glucuronic Acid ................................................................................................. 50 Methylated β-D-glucuronic Acid .......................................................................... 52 L-iduronic Acid...................................................................................................... 52
Conclusions ................................................................................................................ 54
4 CONCLUSIONS AND FUTURE DIRECTIONS ......................................................... 56
Conclusions ................................................................................................................ 56 Recommendations ...................................................................................................... 57
LIST OF REFERENCES ................................................................................................... 60
BIOGRAPHICAL SKETCH................................................................................................ 64

7
LIST OF FIGURES
Figure page 1-1 The structures of glyceraldehyde, tetrose, pentose and hexose .......................... 12
1-2 Different representations of the 3-dimensional structure of glyceraldehyde.. ...... 13
1-3 Erythrose and threose. ........................................................................................... 14
1-4 Fischer projections of linear forms of D- aldoses. ................................................. 15
1-5 The conversion of D-glucose, drawn in linear Fischer projection, into a cyclic Howarth projection. ................................................................................................ 16
1-6 Conversion of D-glucose from 4C1 to 1C4 chair conformer.. ................................. 17
1-7 Formation of a hemiacetal from an aldehyde and an alcohol............................... 17
1-8 The conversion of a linear D-glucose into a 5-membered ring glucofuranose. ... 18
1-9 The most common monosaccharides and their corresponding abbreviations. ... 19
2-1 The transfer optics of a Bruker FT-ICR mass spectrometer guide the ion packets into the analyzer cell.. ............................................................................... 27
2-2 The cyclotron motion of a negatively charged ion as the ion enters the analyzer cell............................................................................................................ 29
2-3 The cross sections of the four analyzer plates are responsible for the excitation and detection of the ions. ...................................................................... 31
2-4 An example of a simple harmonic oscillator is the spring.. ................................... 36
2-5 The potential energy-curves of anharmonic (curve 1) and harmonic oscillators (curve 2). ............................................................................................... 37
2-6 Simplified schematics of an OPO laser. ................................................................ 39
2-7 An OPO laser is composed of a pump laser (Nd/YAG cw), a periodically poled lithium niobate (PPLN) crystal, etalon and a mirror. ................................... 40
3-1 The structures of GlcA and IdoA only differ in the carboxyl orientation at carbon number 5. ................................................................................................... 43
3-2 The experimental set-up is composed of the ICR cell and the OPO laser. Drawing courtesy of Jan Szczepanski. .................................................................. 45
3-3 The sequence of events during the experiment .................................................... 47

8
3-4 The structure of [β-GlcA+Rb]+ complex showing the clockwise hydrogen bond network. ......................................................................................................... 48
3.5 The IRMPD spectra of glucuronic acid and iduronic acids are different (red is GlcA and black is IdoA) .......................................................................................... 49
3-6 The theoretical spectra of α- and β- glucuronic acids overlapped with the experimental IRMPD spectrum. ............................................................................. 50
3-7 The lowest energy structures of the β- anomer of D-glucuronic acid. .................. 51
3-8 The theoretical and experimental spectra of α- and β- glucuronic acid. .............. 51
3-9 The spectra of D-glucuronic acid (red) and O-methyl-β-D-glucuronic acid (black) are similar.. ................................................................................................. 52
3.10 The experimental spectrum of IdoA closely matched that of a β-1C4. .................. 54
3-11 Two of the predicted low-energy structures of the L-iduronic acid-Rb+ complex.. ................................................................................................................ 54
4-1 The lowest-energy calculated spectrum of [α-GlcA+Rb]+ shows a shoulder between 3575 and 3600 cm-1. ............................................................................... 58
4-2 Iduronate ring structures oscillating between 4C1, 0S2 and 1C4. ........................... 59

9
LIST OF ABBREVIATIONS
FT-ICR-MS Fourier transform ion cyclotron resonance mass spectrometry
OPO Optical parametric oscillator
GlcA D-Glucuronic acid
IdoA L-Iduronic acid

10
Abstract of Thesis Presented to the Graduate School of the University of Florida in Partial Fulfillment of the Requirements for the Degree of Master of Science
COUPLING OF AN OPTICAL PARAMETRIC OSCILLATOR LASER AND A FOURIER
TRANSFORM ION CYCLOTRON RESONANCE MASS SPECTROMETER TO DIFFERENTIATE EPIMERIC MONOSACCHARIDES
By
Emilio Benoza Cagmat
May 2010
Chair: John Eyler Major: Chemistry
Structures of carbohydrates dictate their biological activities. Since carbohydrates
are found with numerous stereoisomeric forms, structural determination and
differentiation are huge challenges to analytical chemists.
Glycosoaminoglycans (GAGs) are linear polysaccharides composed of repeating
monosaccharide units. Special types of GAGs known as heparins (HPs) and heparan
sufates (HS) contain D-glucuronic and L-iduronic acids. These acids are epimers; they
differ only in the orientation of the carboxylic acid group at carbon number 5. Mass
spectrometry cannot differentiate the two compounds. By coupling a Fourier transform
ion cyclotron mass spectrometry and an optical parametric oscillator laser, the two
compounds were differentiated, using infrared multiple photon dissociation
spectroscopy.

11
CHAPTER 1 CARBOHYDRATES
Introduction
Structure influences function. The structures of carbohydrates, however, are very
diverse.1,2 Carbohydrates can assume many structures: linear, branched and a
numerous structural isomers.
Mass spectrometry cannot determine the structure of compounds and, in most
cases, cannot distinguish compounds that are stereoisomers. In this thesis, two
monosaccharides that are epimers were differentiated using a Fourier transform ion
cyclotron resonance (FT-ICR) mass spectrometer coupled to an optical parametric
oscillator (OPO) laser. The monosaccharides in this study were D-glucuronic (GlcA) and
L-iduronic acid (IdoA). These sugars differ only in the orientation of the carboxylic acid
at carbon five.
Carbohydrate Chemistry
Carbohydrate is French for hydrated carbons (hydrate de carbon).3 It is a
simplification used to describe compounds with an empirical formula of Cn(H20)n. Today,
the term carbohydrate is extended to other compounds that don’t follow the empirical
formula, such as sialic acid and glucosamine. In general, these biomolecules are
polyhydroxylated aldehydes and ketones and their simple derivatives, or larger
compounds that can be broken down into such units. In this work, a carbohydrate will be
referred to interchangively as sugar, saccharide or glycan, even though sugar
specifically refers to the low molecular weight and sweet carbohydrates.

12
Aldoses
Aldoses are the most common structures of carbohydrates. Glyceraldehyde,
shown in Figure 1-1, is the simplest example of an aldose. It is composed of a linear
three-carbon chain with an aldehyde group on one end and a primary alcohol on the
other end.
Figure 1-1. The structures of glyceraldehyde, tetrose, pentose and hexose
Higher aldoses with four, five and six carbons are known as tetroses, pentoses
and hexoses, respectively. Since carbons bearing the secondary alcohols (carbon 1 or
C-1 in glyceraldehydes, C-2 and C-3 in tetroses) have four different groups attached,
these locations are considered stereogenic or chiral centers. Compounds with chiral
centers have closely related structures called stereoisomers. Stereoisomers are
compounds having the same molecular weight but only differing in the orientation of the
three dimensional structure of their constituent atoms (or groups of atoms) in space.
Carbohydrates can form numerous stereoisomers, and knowledge of carbohydrate
stereoisomers is relevant in the analysis of these classes of compounds.

13
To easily track the stereogenic centers, carbohydrates should be visualized using
3-dimensional models. These 3-dimensional representations can be illustrated on paper
as 2-dimensional drawings, using the Fischer convention. To illustrate, we can use
glyceraldehyde’s 3-dimensional structure, representations of which are shown in Figure
1-2. In the left column are the D-enantiomers and in the right column are the L-
enantiomers (Enantiomers are non-superimposable mirror images of each other, such
as structures A and B in the Figure). Drawings A to F are the several 3-dimensional
representations of glyceraldehyde. To simplify, the Fischer convention can be used. In
Fischer projections, represented by drawings G and F, the hydrogens are not written
and the -OH groups are extending out of the paper.
Figure 1-2. Different representations of the 3-dimensional structure of glyceraldehyde. G and H are the simplest way to show 3-dimensional structures on a 2-dimensional sheet of paper.

14
Erythreoses, Threoses, Pentoses and Hexoses
Glyceraldehydes contain only one stereogenic center since the carbon containing
the secondary alcohol (C-2) is the only chiral center. Adding another carbon and –OH to
a glyceraldehyde introduces a new stereogenic carbon center and a new compound.
The addition of a stereogenic center to a glyceraldehyde forms tetroses: erythrose and
threose.
Figure 1-3. Erythrose and threose.
Extending the length of tetroses by introducing another stereogenic center forms
pentoses and another addition converts pentoses to hexoses. Note that for the pentose
ribose, extending one carbon chain produces two different hexoses, namely allose and
altrose, where the only difference is the orientation of the newly created chiral center (C-

15
2). Carbohydrates with the same number of C, H, and O atoms can obviously exist in
numerous stereoisomeric forms
Drawing sugars using the Fischer projection is important in structural analysis;
however, 5 and 6 carbon monosaccharides usually exist in nature not as open chain
forms but in the ring forms. Fischer projections can only represent open chain
structures. To represent, for example, D-glucose in its closed ring form, an alternative is
via a Howarth projection.
Figure 1-4 Fischer projections of linear forms of D- aldoses.

16
Figure 1-.5. The conversion of D-glucose, drawn in linear Fischer projection, into a cyclic Howarth projection.
Fischer projection structures are easily converted to cyclic Howarth structures as
shown in Figure 1-5. However, it is important to correctly draw the stereogenic centers.
A handy mnemonic called LURD is used to verify that the structures are drawn
correctly. The mnemonic LURD stands for Left-Up Right-Down. This means that the –
OH group on the right side of the Fischer projection goes down when converted to
Howarth. The exception is in the carbon atom that closes the ring. Figure 1-5 illustrates
the method. Carbon 2 is on the right side when drawn in Fischer projection; therefore it
goes down when converted to cyclic Howarth projection.
From the Howarth projection, a realistic representation is to pucker the flat ring to
form a chair. This is done by raising the C-4 atom and lowering the C-1 atom to form the
4C1 configuration, shown in Figure 1-5. Puckering the ring in the opposite way is also
possible, to form the 1C4 conformation, as shown in Figure 1-6.

17
Figure 1-6. Conversion of D-glucose from 4C1 to 1C4 chair conformer. D-glucose is more stable in the 4C1 conformation.
Mutarotation, Anomers and Epimers
In this section, anomers will be defined, followed by discussions of mutarotation
and then epimers, since these concepts are relevant to structural determination of
carbohydrates.
Figure 1-7. Formation of a hemiacetal from an aldehyde and an alcohol. Six-membered monosaccharides exist almost exclusively in the ring forms, as cyclic hemiacetals.

18
Aldehydes and alcohols can react to form hemiacetals. Five- or six-carbon
monosaccharides form cyclic hemiacetals. The mechanisms by which linear hexoses
are formed into 6- and 5-membered rings are shown in Figures 1-7 and 1-8,
respectively. Studies have shown that for glucose, the 5-membered rings form faster but
the 6-membered rings are more stable, and most likely will predominate in solution.
The cyclization reaction forms a new chiral center at C-1. Carbon 1 in the cyclic
form is referred to as the anomeric carbon. In carbohydrate analysis, the chemistry at
the anomeric position is relevant because the hydroxyl group at C-1 can assume two
possible positions, α or β. The strict definition if it is α or β depends on the C-1
substituent. If the –OH group (or any other group) is cis to the oxygen atom of the
highest numbered stereogenic center (which is C-5 for hexoses) when drawn in Fischer
projection, then it’s α. Otherwise, it’s designated β. To simplify the precise but
cumbersome definition, the rule of thumb is that α is axial, which is down in D-sugars
and β is equatorial, or up in D-sugars.
Figure 1-8. The conversion of a linear D-glucose into a 5-membered ring glucofuranose.
19
When a pure α-D-Glucose (or a pure β-D-glucose) is dissolved in water, the
solution equilibrates and will end up not as the pure starting material, but a mixture of
both anomers. This event is termed mutarotation. It results in a change in optical
rotation over time, when a pure α-D-Glucose (or a pure β-D-glucose) is dissolved in
water. Pure α-D-Glucose when dissolved in water starts with +112 optical rotation while
that of pure β-D-glucose is +19. With time, a pure β-D-glucose will end up having an
optical rotation of +52.7, the same end result as when starting with the α anomer. For
an analytical chemist performing gas phase analysis, the primary concern is: what
anomer predominates in gas phase?
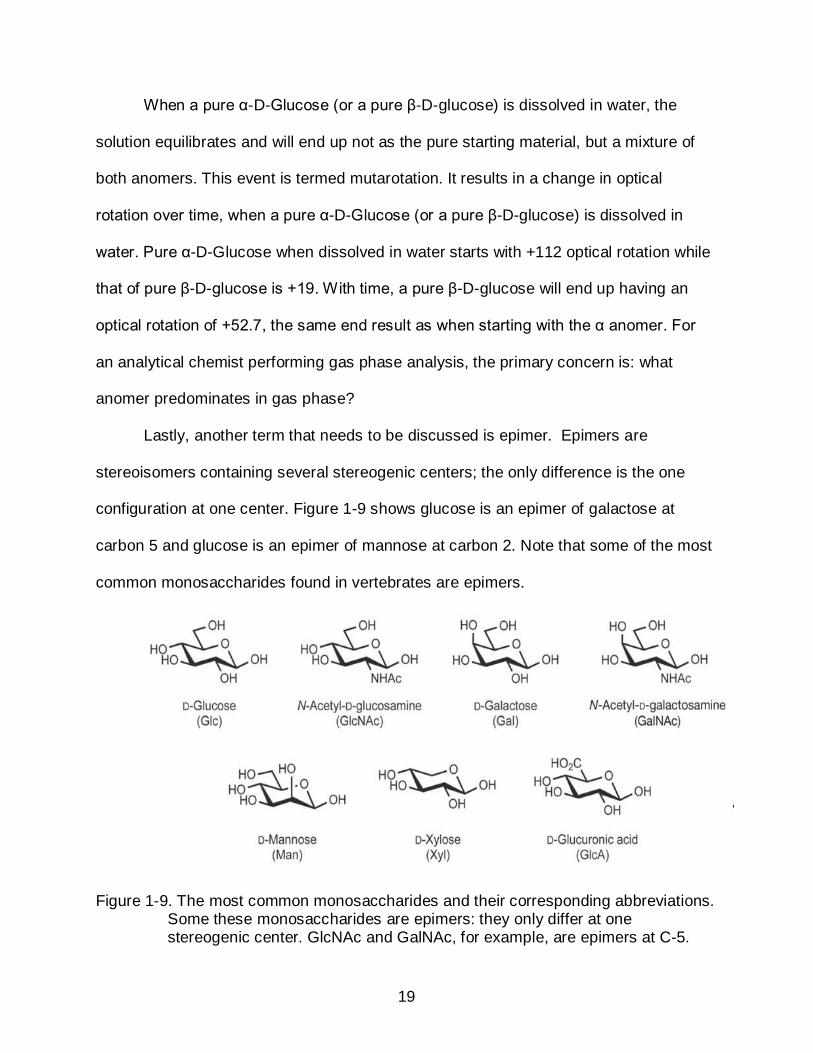
Lastly, another term that needs to be discussed is epimer. Epimers are
stereoisomers containing several stereogenic centers; the only difference is the one
configuration at one center. Figure 1-9 shows glucose is an epimer of galactose at
carbon 5 and glucose is an epimer of mannose at carbon 2. Note that some of the most
common monosaccharides found in vertebrates are epimers.
Figure 1-9. The most common monosaccharides and their corresponding abbreviations. Some these monosaccharides are epimers: they only differ at one stereogenic center. GlcNAc and GalNAc, for example, are epimers at C-5.

20
Carbohydrate Analysis
Carbohydrates are not just intermediates in generating energy, signaling effectors,
recognition markers or structural components, as was thought before. They also play
key roles in complex multicellular organisms. These roles encompass the whole life-
cycle of a living thing, from growth and development to even the survival of an
organism1.
Specifically, glycans are the first line of defense invaders encounter. The outside
of a cell is a dense, jungle-like coating of carbohydrates that cover the cell’s surface.
These are the cells’ gatekeepers. Communications with other cells is through interaction
with the receptors of another cell. Cell-cell interactions and recognitions differentiate
invading pathogens from friends. For example, the cells of the immune system use
glycans to identify enemies, such as bacterial invaders, and differentiate themselves
from friendly fellow leukocytes. In tumor development, cancer cells evade the immune
system by altering their glycoprotein expressions. Tumor cells can then pass as a friend
by ‘decorating’ their surfaces with the proper glycoproteins. To improve our knowledge
of disease progression and cellular functions, we need to establish the exact structures
of carbohydrates in biological systems.
The diverse range of carbohydrate functions comes from the huge database of
structural motifs. The large library of structures can be attributed to the numerous
stereoisomers the sugars can assume. Unlike proteins, RNA or DNA, glycans not only
exhibit a linear motif but also branched structures and numerous possible isomers.
Nucleotides and proteins only form linear structures and have only one type of linkage.
So if you have three nucleotide bases or amino acids, they can only generate six
variations.

21
Contrast that to carbohydrates, where each monosaccharide can link α or β to
another monosaccharide, in any of several positions available (e.g., carbons 1-6). To
illustrate, three hexoses, for example, can generate around 27,648 unique
trisaccharides4, and the number of possible structures increases with increasing
monosaccharide units. For example, if we consider nine of the most common
monosaccharides in the human body, there are 15 million ways to assemble a
tetrasaccharide5. Furthermore, glycans can attach themselves to other biomolecules,
proteins and lipids for example. It is estimated that 50% of proteins contain glycans.
The attachment of glycans to proteins, a process called protein glycosylation, is
considered a major post-translational modification.
These modifications are inherently linked to a protein’s function. The diversity of
carbohydrate structures made the biopolymer a viable tool for evolution6. However,
carbohydrate analysis is a huge challenge to an analytical chemist.
To date, there is no single technology that can “sequence” carbohydrates in a
straightforward manner as is possible for DNA, RNA and proteins. Carbohydrates are
equally important biopolymers. What complicates sugar analysis are the several
stereogenic centers, and to understand fully the functions of carbohydrates requires
knowledge of their sequences and three dimensional structures. Therefore,
development of new methods is needed to determine the structures and sequence of
carbohydrates. To sequence completely a complex polysaccharide, the parameters
below should be known:
• Components and stereoisomers of each monosaccharide
• Configuration (D or L) and ring size (pyranose or furanose)

22
• Position and stereoisomerism of the linkage ( α (1 → 4), which means the first monosaccharide is α in carbon 1 and connected to the next monosaccharide at carbon number 4)
• Branching connections,
• Non-carbohydrate groups (i.e., phosphate, sulfate) attached.
In addition to the primary structures listed above, knowledge of secondary
structures is also necessary. These are defined as the dihedral angles of each
monosaccharide and the torsional angles around the bonds. Because of the
compound’s inherent flexibility, these angles are difficult to establish. Usually,
theoretical calculations supplement experimental data to establish the secondary
structures.
The strategies to analyze sugars depend on the sample and the information
needed. For example, if the information needed is to detect the presence of glycans in
raw biological samples, specific antibodies or commercially available kits can be used.
If the component monosaccharide needs to be quantified, analysis depends on whether
or not the glycans are still attached to proteins or lipids. Glycoconjugates can be
released from their attachments by specific enzymes and then separated if they are
present in a mixture, before analysis. There is no universal protocol for analyzing
carbohydrates.
After glycoconjugates are released from their attachments, separated and purified,
the next step is to quantify and determine the compositions of the monosaccharides.
Historically, method development in the1960s was dominated by gas or liquid
chromatography (GLC) for the analysis of the component monosaccharides7. These
methods could quantify the amount of the monosaccharides and were also useful in
identifying peaks when coupled with mass spectrometry.

23
By the 1970s, analysts were able to separate between D- and L- isomers using
GLC. By incorporation of an optically pure chiral aglycone in combination with
trimethylsilylation, the isomers could be separated and absolute configuration could be
determined (MS).
High performance liquid chromatography (HPLC) became popular during the
1980s4,8, quantifying monosaccharides using pre- or postcolumn derivatization. And in
the 1990s, high-pH anion-exchange chromatography with pulsed amperometric
detection (HPAEC-PAD) became popular because it doesn’t require the derivatization
step; HPAEC-PAD surpassed HPLC.
The methods of quantifying sugars are relatively robust and validated. The
challenge is in structure elucidation, in tracking all the possible stereoisomers.
Determining the stereoisomers and linkages is currently a field of active research.
Historically, biochemists have been using specific enzymes to provide information on
specific structures. However, this method is time consuming and labor-intensive. In
addition, analysis is limited by the enzymes that are available.
Other methods such as nuclear magnetic resonance (NMR) can provide the
sequence and stereoisomers of polysaccharides without the need to use other
techniques. The issue, however, is sensitivity. NMR needs relatively higher
concentrations of carbohydrate samples compared to MS. This becomes a serious
concern when dealing with rare biological glycans.
Although MS can only detect mass-to-charge ratios and cannot differentiate
stereoisomers, advances in MS technology for the past years focused on distinguishing
isomers by looking at patterns of fragmentation. Stereoisomers can be fragmented by

24
collisionally induced dissociation (CID). Studies showed that fragmentation patterns
could provide information on the stereochemistry.8-10 For example, by looking at the
ratios of fragment ions and parent ions, a β-isomer (cellobiose) of a disaccharide was
found to have a higher product ion to parent ion ratio when compared to the α-isomer
(maltose).11
In disaccharides, the link between two monosaccharides (i.e., 1-6 vs. 1-4) was
also determined using MS.12 Disaccharides linked differently showed fragmentation
patterns that could be assigned to either 1-6, 1-1, 1-2, 1-3 or 1-4 linkages.
Lasers can fragment ions in the gas phase. Polfer13 and co-workers distinguished
disaccharides by coupling MS with a wavelength tunable infrared (ir) laser. The
disaccharide was trapped inside a Fourier transform-ion cyclotron resonance (FT-ICR)
mass spectrometer and the ions were irradiated with a wavelength-tunable ir laser. The
fragmentation patterns of each disaccharide were unique and served as fingerprints.
This method, however, used an expensive laser maintained at a large facility.
To solve the problem of cost, the work reported in this thesis used a relatively
inexpensive wavelength tunable ir laser. The drawback with this set-up however, is the
limited available wavelength range of the laser. The next chapter will discuss the basics
of a wavelength tunable ir laser and the theories of FT-ICR mass spectrometry and
OPO lasers.

25
CHAPTER 2 INFRARED MULTIPLE PHOTON DISSOCIATION OF GAS PHASE MOLECULAR
IONS TRAPPED IN AN FT-ICR MASS SPECTROMETER
Introduction
The development of FT-ICR mass spectrometry can be traced back to the 1930’s,
when Lawrence built the first cyclotron accelerator to study the fundamental properties
of an atom.14 In 1950, Sommer et al., made the Omegatron by incorporating the
principle of ion cyclotron resonance into a mass spectrometer. Comisarow and
Marshall15 then added Fourier transform methods to ICR mass spectrometry in 1974.
On the other hand, the use of light to fragment molecules came in the years 1920-
1940,16 when A.N. Terenin studied the phenomenon of photodissociation of molecules
using ultraviolet radiation (UV). Molecular ions will dissociate as a consequence of
photon absorption. However, a UV photon has much more energy than an infrared (IR)
photon. CO2 lasers eventually were demonstrated as an IR source during the late
1970s.17-19 Molecules must absorb a number of low-energy IR photons to reach a
dissociation threshold. This approach is thus known as infrared multiple photon
dissociation (IRMPD).
One of the earliest accounts of the coupling of an ICR cell and light to dissociate
gaseous ions came from R.C. Dunbar.20 In the late 1970’s, low-powered lasers were
used to dissociate small ions18,19 and the approach was later applied to larger
biomolecules.21 The technique was also successful in differentiating heptene isomers,22
however, the spectra were limited by the wavelengths available from a tunable CO2
laser.23 Today, wavelength-tunable infrared radiation is available from a number of
sources, including optical parametric oscillator (OPO) lasers. The wavelength range of
these lasers is useful for biologically relevant compounds. More recently, OPO lasers

26
were used in IRMPD experiments to differentiate isomeric oligosaccharides.23,24 In this
chapter, theories and fundamentals of FT-ICR MS and infrared multiple photon
dissociation will be discussed, followed by some comments about optical parametric
oscillator (OPO) lasers.
Fourier Transform Ion Cyclotron Resonance
Mass Spectrometry
FT-ICR MS is versatile. The experimental sequence can vary for each user,
depending on the experiments performed. Nevertheless, the basic procedures are (1)
ionization of the sample, (2) ion transfer into the analyzer cell, (3) ion excitation, (4)
detection and (5) Fourier transformation to produce a mass spectrum. In this
experiment, a procedure which can be considered “(2a) OPO laser irradiation” was
inserted after ion transfer in the listing above
Sample Ionization
To analyze macromolecules using FT-ICR MS, the sample should be ionized and
in the gas phase; therefore, a prior method of ionization is required. Ions are most often
generated from neutral samples outside the analyzer cell. Although there are several
methods of ionization, the most common are matrix assisted laser desorption ionization
(MALDI)25,26 and electrospray ionization (ESI).27-30 ESI is mostly used because it
minimizes ion fragmentation and can produce intact ions from non-volatile and relatively
large molecules, very important in studying labile molecules such as biopolymers.
Oligosaccharides can be ionized as native oligosaccharides, protonated,
deprotonated, derivatized, or adducted to metal ions.31,32 In the experiments reported in
Chapter 3, the monosaccharide samples were tagged with Rb+ and were introduced
from solution into the gas phase using ESI and then guided into the analyzer cell.

27
Ion Transfer
In the Bruker FT-ICR mass spectrometer used for this research ions generated by
the ESI source are guided by series of electrostatic lenses into the analyzer cell, as
shown in Figure 2-1.
Figure 2-1. The transfer optics of a Bruker FT-ICR mass spectrometer guide the ion packets into the analyzer cell. (Drawing courtesy of Cesar Contreras).
To increase the ion density inside the analyzer cell so ions can be detected with
higher S/N, the ions are first accumulated in an rf hexapole ion trap, and then released
as packet of ions. These ion packets are steered to the analyzer cell by a series of
electrostatic lenses (Figure 2-1). These lenses are basically electrodes to which
potentials are applied, to deflect and guide the ion packets into the analyzer cell, in the
same way that mirrors and optical lenses guide light in the desired direction. In
addition, the regions through which the ions travel are differentially pumped, to achieve
low pressures and reduce or eliminate collisions between the ionized sample and
unwanted gasses.
The final destination of the ions is the analyzer cell, located within a strong and
homogeneous magnetic field. This is where the ions are stored, mass selected and
analyzed. The magnetic field strength varies from 1 to 15 T in commercial magnets,
either produced by a permanent magnet, an electromagnet or solenoidal
superconducting magnets.33 Increasing the magnetic field strength improves FT-ICR

28
MS performance in terms of mass resolving power, dynamic range and mass accuracy.
However, increasing magnetic field also increases the acquisition and maintenance
costs of the system.
As the ions enter the analyzer cell, they may experience a magnetic mirror effect.34
The magnetic mirror effect comes from the large magnetic field gradient at the entrance
of the cell. When the ions encounter the fringing magnetic field, a force opposes the
forward motion of the ions. To eliminate the magnetic mirror effect, focusing optics such
as hexapoles, octapoles, rf-quadrupoles, or electrostatic lenses, as with the Bruker FT-
ICR mass spectrometer, are used.
The designs of the cells that trap ion packets vary from instrument to instrument.
Usually, the design is a compromise among mass accuracy, resolution, ion capacity and
complexity. However, the most common cells are cubic or cylindrical in shape.
Typically, the cell includes two opposing plates for excitation and another set of
oppositing plates for detection. To ensure that charged ions don’t escape the cell,
trapping plates or cylinders are added.
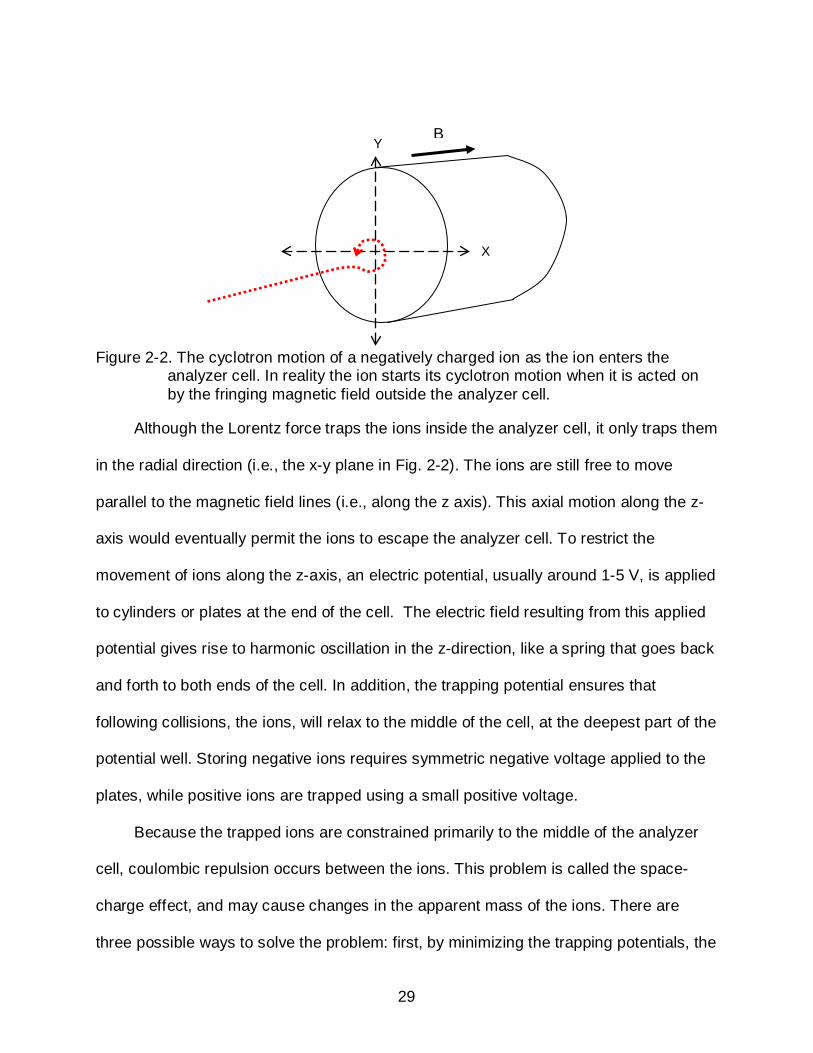
Since the analyzer cell is within a strong magnet, the magnetic field acts on the
charged particles. In a magnetic field ions experience a force known as the Lorentz
force. This force is perpendicular to the magnetic field and the ion’s velocity, and
causes the ions to move in a circular orbit (Fig. 2-2). The circular motion is known as the
cyclotron motion, and it’s a result of the Lorentz force and the opposing centrifugal
force acting on the ion.
29
Figure 2-2. The cyclotron motion of a negatively charged ion as the ion enters the
analyzer cell. In reality the ion starts its cyclotron motion when it is acted on by the fringing magnetic field outside the analyzer cell.
Although the Lorentz force traps the ions inside the analyzer cell, it only traps them
in the radial direction (i.e., the x-y plane in Fig. 2-2). The ions are still free to move
parallel to the magnetic field lines (i.e., along the z axis). This axial motion along the z-
axis would eventually permit the ions to escape the analyzer cell. To restrict the
movement of ions along the z-axis, an electric potential, usually around 1-5 V, is applied
to cylinders or plates at the end of the cell. The electric field resulting from this applied
potential gives rise to harmonic oscillation in the z-direction, like a spring that goes back
and forth to both ends of the cell. In addition, the trapping potential ensures that
following collisions, the ions, will relax to the middle of the cell, at the deepest part of the
potential well. Storing negative ions requires symmetric negative voltage applied to the
plates, while positive ions are trapped using a small positive voltage.
Because the trapped ions are constrained primarily to the middle of the analyzer
cell, coulombic repulsion occurs between the ions. This problem is called the space-
charge effect, and may cause changes in the apparent mass of the ions. There are
three possible ways to solve the problem: first, by minimizing the trapping potentials, the
X
Y B

30
ions will be spread throughout the cell and experience less ion-ion repulsion; second,
exciting the ions into larger cyclotron radii also spreads them spatially; and third,
injecting a controlled number of ions into the analyzer cell leads to at least consistent
space-charge effects in repetitive experiments.
In addition to space-charge effects, another problem is the complex and
inescapable magnetron motion. This motion is a product of the electric fields from the
trapping plates combined with the magnetic field. When an ion’s z-axis movement is
restricted it tends to diffuse radially in the x-y plane. Magnetron motion is related to this
radial diffusion. Calculated magnetron frequencies are between 1-100 Hz and are
considered to have no analytical use.33
Ion Excitation
When the circulating ions first enter the cell, the orbit traversed by the ions is small
compared to the cell’s dimensions and ion motion is not coherent; therefore, the
alternating current or the image current produced is undetectable. To detect the
circulating ions, the ions are excited into larger radii and a coherent ion packet. This is
achieved by applying an RF pulse (sinusoidal voltage) to the excitation plates for a short
period of time. This pulse can be composed of one frequency or a range of frequencies.
Nevertheless, ions with the same frequency (i.e. in resonance) with the oscillating
electric field produced by the RF voltage pulse will experience an outward net force,
thereby increasing their orbital paths. Ions with the same mass-to-charge ratios are
excited coherently and move as a packet. Ions not in resonance with the oscillating
electric field produced by the pulse will be unperturbed. If the RF pulse is applied
continuously, the ions in resonance will spiral outward and eventually hit the plates of
the cell.

31
This method of applying a certain voltage continuously is useful and applied if the
user wants to eliminate unwanted ions.
Detection
The coherent ion packets will induce an oscillating differential image current on the
detection plates. Potential (voltage) changes between the detection plates can be
measured as function of time (known as the ‘transient’, ‘time domain data’, FID or free
induction decay). The signal is stored, amplified and digitized.
Figure 2-3. Cross sectional view of the four analyzer plates responsible for the excitation and detection of the ions. The excitation plates are shown in blue and the detection plates depicted in black.
In FT-ICRMS, simultaneous detection of several ions is possible, by using
broadband detection methods. Broadband detection is achieved using an r.f. voltage
chirp sweeping over a range of frequencies (e.g., 100 kHz to 10 MHz) in a short period
Excitation
Detection

32
of time to excite the ions. A frequency synthesizer can generate a voltage chirp which
causes all the ions within the swept frequency range to be excited and then detected.
Fourier Transform
The acquired raw data is in the form of voltage vs. time, and thus not yet in an
intensity vs. m/z form, as is typical for mass spectra. As mentioned earlier, the raw data
are voltages related to the image currents induced by the ion packets as a function of
time. This signal is composed of a superposition of sine waves. Fourier transformation
is a mathematical procedure that converts the superposition of sine waves into
individual frequencies and, with the equations developed below, into corresponding m/z
values for the ions in the analyzer cell.
Fundamental Equations
In this section, the fundamental equations related to the motion of the ions will be
discussed.
Ions acted upon by magnetic fields follow the Lorentz force equation given by
equation 2-1.
F = qvBsinθ, 2-1
where
q is the charge of the ion or the charged particle, in coulombs, C, v is the velocity of the ion, in m/s, B is the magnetic field in Tesla (T), and θ is the angle between the axis of the ion motion and the axis of the magnetic
flux.
The ions move perpendicular to the axis of the magnetic field in most FT-ICR MS
setups; so equation 1 can be simplified to equation 2-2.
F = qvB 2-2

33
F = ma = qvB 2-3
m(v2/r) = qvB 2-4
mv/r = qB 2-5
v/ r= qB/m 2-6
The term v/r is the angular frequency; it measures how fast the ions are rotating
and is the same as the cyclotron frequency (equation 2-7). The units for ωc are rad/s.
After dividing by 2π, the frequency can be expressed in hertz:
ωc = qB/m 2-7
fc = qB/2π m 2-8
The cyclotron frequency is inversely related to m/q, directly related to B and there
is no kinetic energy (KE) component. Inherent to FT-ICRMS is high mass resolving
power. One of the reasons is because the detected signal is not strongly influenced by
the kinetic energy spread of the ions. The performance of FT-ICRMS does not suffer
from problems encountered by time-of-flight (TOF) or magnetic sector mass
spectrometers. The resolution of time-of-flight and magnetic sector instruments is
hindered by the spread of the kinetic energies of the ions. The ultra high mass resolving
power of FT-ICR MS is also helped by high vacuum (very low pressures) inside the
analyzer cell. High vacuum allows coherent packets of ions to circulate in the cell for
many seconds, or longer, without collision. This produces long transient response
signals, which after Fourier transformation lead to very narrow peaks with highly precise
frequency (and thus m/z) values.
The coherent ion packets are also ideal for ion dissociation studies. There are
several ways to dissociate the trapped ions: via lasers, collisions with neutrals or
34
heating.35 In the work reported in this thesis, a laser was used for dissociaiton. To
understand ion dissociations, the next section will discuss the technique called infrared
multiple photon dissociation (IRMPD).
Multiple Photon Dissociation
Gas-phase molecular ions can be trapped inside the analyzer cell of an FT-ICR
mass spectrometer for prolonged periods of time. These long trapping/observation
times make FT-ICR MS particularly useful, among other things, for structure elucidation.
Fragmentation methods such as collision-induced dissociation can be employed. In
addition, longer trapping times provide adequate irradiation time to photodissociate ions,
even with lower-powered lasers.
Recently, FT-ICR mass spectrometers have been coupled to optical parametric
oscillator (OPO) laser to produce infrared multiple photon dissociation (IRMPD)
spectra.24,37 In this section, the basic principles of IR spectroscopy will be discussed,
since IR spectroscopy is related to IRMPD. This will be followed by a discussion of
IRMPD, its mechanism, and finally a description of the OPO laser.
IR Spectroscopy
Infrared multiple photon dissociation is related to IR spectroscopy. Infrared
spectroscopy is based on excitation of the vibrations of atoms in molecules. In a
standard IR spectroscopy experiment, the IR spectrum is obtained by passing IR
radiation through the sample.38 When light passes through a sample the phenomenon
observed is a decrease in the intensity of the light that is subsequently transmitted
through the sample. The transmitted light is related to the radiation that is absorbed at
a particular frequency. In a typical IR spectrum, the x-axis is in wavenumbers (cm-1),

35
since this unit is linear with energy (and inversely proportional to the wavelength of the
light) and the y-axis is either the percent transmittance or absorbance.
Unlike ultraviolet light, a single infrared photon is not energetic enough to
promote electronic transitions; thus, IR techniques examine vibrational transitions. A
molecule can vibrate. During vibration, the dipole moment changes as the bonds
expand or contract. In general, for a particular molecular vibration to absorb photons,
there should be a net change in dipole moment caused by the atomic motion related to
that vibration. In particular, the oscillating dipole of the molecule should be in
resonance with the frequency of the photons that will be absorbed. As an example, let’s
look at the polar hydrogen chloride molecule. When HCl vibrates, there is a regular
fluctuation in dipole moment. During vibration, the oscillating dipole of the molecule
interacts with the oscillating electric field of the incoming electromagnetic IR radiation. If
the IR frequency matches the molecule’s vibrational frequency, absorption occurs and
the amplitude of the molecular vibration increases. However, if the frequencies of the
light and the molecular vibrations are not the same, this transition is non-resonant with
the incoming light and the molecule doesn’t absorb.
Mechanical model of stretching vibrations. The mechanical model of stretching
vibrations of HCl can be viewed and approximated using an example below.
In the mechanical model, a mass is connected to a spring. One end of the spring
is anchored and immovable. When the movable mass m is disturbed, it is displaced by
a distance y from the equilibrium position. A force F, however, will restore m in the
direction of its original or equilibrium position. The resulting vibration is called simple
harmonic motion. The motion is governed by Hooke’s law (Eq. 2-10) where F is

36
Figure 2-4. An example of a simple harmonic oscillator is the spring. One end of the
spring is immovable and the other end is attached to mass m. The deepest part of the potential energy-diagram of a simple harmonic oscillator is where the system is in equilibrium. If the mass is disturbed, the displacement is y.
proportional to the displacement y and k is the force constant. The constant k depends
on the spring’s stiffness.
F=-ky 2-10
When the mass and spring are not moving, we can arbitrarily assign the
equilibrium position as zero in terms of potential energy. Compressing or stretching the
spring to some position y + dy, changes in potential energy dE
dE=-Fdy 2-11
Combining 2.10 and 2.11 yields
dE=ky dy 2-12
Integrating from the equilibrium position y=0 to y gives
E=1/2 ky2 2-13
The potential-energy curve of a simple harmonic oscillation is a parabola.
However, the realistic vibrational potentials of molecules are not harmonic oscillations
Displacement y
-A +A
0
m 0
+A
-A
y P
oten
tial e
nerg
y E

37
but rather anharmonic39. In a simple mechanical harmonic oscillator, the differences
between the vibrational energy levels are uniform. In reality, they are not. The
vibrational ΔE continuously decreases for higher energy levels.
Figure 2-5. The potential energy-curves of harmonic (curve 1) and anharmonic
oscillators (curve 2).
In an anharmonic oscillator, the vibrational energy levels form a continuum at
higher energy states, because the mechanical model does not account for the
coulombic repulsions of atoms. There are two forces acting at the same direction, if two
atoms are close to one another. These forces are the coulombic force and the restoring
force. Adding the two forces together results in the faster rise of potential energy,
compared to the predicted mechanical harmonic approximation. The part of the
stretching potential that is not harmonic is referred to as the vibrational anharmonicity,
the part of the potential that does not vary as the square of the displacement y.
Infrared Multiple Photon Dissociation
Infra-red multiple photon dissociation is also related to the vibrations of molecules;
however, gaseous ions are not abundant enough (~106 ions/cm3) to detect an
1
2
2 1
Dissociation
v=0 v=1
v=2 v=3
v=4
Interatomic distance r
Pot
entia
l ene
rgy
E r1
r2

38
absorbance.40 In IRMPD, the absorbance is not directly detected. Instead, what is
detected is the “action” or the consequence of photon absorption by the ions. Therefore,
the technique is also referred to as “action” spectroscopy (or consequence
spectroscopy).23,40,41
When molecular ions absorb the photons, their internal energy is increased. If the
increase in internal energy is above the dissociation limit, the weakest (usually) bond of
the molecular ion will break. For weakly bound complexes, such as the [sugar+Rb]+
complexes studied in this thesis, a low power OPO laser can be used to detach Rb+
from the sugar. The appearance of Rb+ was monitored as the wavelength of the OPO
laser was scanned.
Mechanism of IRMPD. The mechanism of IRMPD consists of several steps
leading to the fragmentation of the molecular ions. Molecular bonds break when the
internal energy is above the dissociation threshold. The internal energy of molecules is
raised when the molecules absorb the photons from the laser. To absorb the photons,
the energy of the incoming IR should be in resonance (i.e., a match) with the energy
difference between the vibrational energy levels (e.g., v1 v2) of the ion. After a
photon is absorbed, the ion has been excited to a higher vibrational energy level.
Photon absorption is followed by a fast intramolecular vibrational redistribution
(IVR). In IVR, the vibrational energy in one mode is redistributed to several other
vibrational modes of the ion . The initial absorbing mode de-excites to the ground state
level, allowing the absorption of another photon. The absorbed photons thus raise the
internal energy of the whole molecule and the molecule enters a quasi-continuum23,35.
In the quasi-continuum, the photon absorption rate is enhanced. As long as (i) the

39
fluence (or density over time) of the IR irradiation source is large, (ii) the IVR occurs
rapidly, (iii) the incoming IR wavelength is in resonance with the frequency of an allowed
normal mode, and (iv) the absorbing vibrational state de-excites fast via IVR, the initial
mode can continue to absorb the incoming photons. The cycle of absorption, excitation
and IVR continues until the molecule dissociates.
Because the mechanisms of IR spectroscopy and IRMPD are slightly different
(single vs. multiple photon absorptions), an IRMPD spectrum is not expected to be
identical to a pure IR spectrum. Nevertheless, IRMPD studies have produced spectra
that are similar to the IR spectra of corresponding neutral species.23 In addition, IRMPD
spectra are similar to calculated spectra, which assume absorption of one photon by
harmonic normal modes. The difference between theoretical calculations and the
observed IRMPD absorptions is often the red shifting of the bands in IRMPD spectra.
This red shift is due to the anharmonic coupling of the absorbing normal modes with
other modes. In this thesis, the calculated spectra were scaled by 0.958 to match the
red-shifted observed spectra.
OPO Laser
An optical parametric oscillator (OPO) laser was used in the experiments reported
here to irradiate the molecular ions trapped in the analyzer cell.
Figure 2-6. Simplified schematics of an OPO laser.
OPO Pump
Residual Pump Idler Signal

40
As shown in Figure 2-6, an OPO laser produces two wavelengths, idler and
signal beam. An OPO laser is made up of a pump laser, a non-linear crystal and optical
resonator cavity.42 The input laser, called the ‘pump’, interacts with the medium to
generate emissions. The medium in an OPO is a non-linear optical crystal. In this study,
a periodically poled lithium niobate (PPLN) crystal was used. The OPO converts the
pump into two output waves of lower frequency. For historical reason, the outputs are
called ‘signal’ and ‘idler’. Conversion of energy dictates that the sum of output wave
frequencies is equal to the pump frequency. The optical resonator cavity is the mirrors
of both ends in Figure 2-7.
The wavelength of OPO lasers can be varied (wavelength tunability), to access
wavelengths in the mid-infrared, infrared or the terahertz region. These regions are
difficult or impossible to access by any other type of laser. To change the wavelength of
the OPO laser, the temperature of the crystal is changed. These lasers provide access
to the spectral regions of 2500-4000 cm-1, which is useful for studies involving the C-H,
N-H and O-H stretching vibrations.
Figure 2-7. An OPO laser is composed of a pump laser (Nd/YAG cw), a periodically poled lithium niobate (PPLN) crystal, an etalon and a mirror. The input beam (yellow) passes through the crystal and is converted into an idler (blue) and signal (red) beam. The etalon is used as an optical filter to tune to a particular wavelength (Linos Photonics).

41
The results of the experiments are discussed in the next chapter, including the
structures of the sugars investigated, the importance of the study, the details of sample
preparation and instrument parameters.

42
CHAPTER 3 DIFFERENTIATION OF D-GLUCURONIC AND L-IDURONIC ACIDS
Introduction
Glycosoaminoglycans (GAGs) are linear polysaccharides composed of repeating
monosaccharide units. Heparins (HPs) and heparan sulfates (HSs), both types of
GAGs, contain L-iduronic (IdoA) and D-Glucuronic acids (GlcA) as their
monosaccharide units. These GAGs are found in almost all tissues of most organisms.
The biological activities of HP and HS depend on the sequence and structure of the
polysaccharide. Therefore, knowing the sequence of the polysaccharide and the
structure of each monosaccharide unit is important.
In general, the determination of carbohydrate structure is challenging because
sugars can exist in numerous structural isomeric forms. In addition, most biological
carbohydrates are attached to proteins and the additional steps of removing the
carbohydrates from proteins complicate the analysis.
The analysis of carbohydrates has lagged behind DNA and protein sequencing.5
New analytical tools have advanced the fields of genomics and proteomics. Routine and
high throughput sequencing of DNA and proteins has compiled massive amounts of
data and large searchable databases of mass spectra. In contrast, carbohydrates don’t
have large databases of mass spectra43 and even lack the computational tools to assist
the determination of their structures.44
IdoA and GlcA are epimers that differ only in the orientation of the carboxylic acid
group at carbon number 5 (Fig. 3-1). The aim of the work reported in this thesis was to
generate gas phase, IRMPD spectra of the two epimers, in order to differentiate the two
monosaccharides. In addition, the gas phase structures were predicted theoretically,

43
and spectra of the calculated lowest-energy structures were matched with the
experimental spectra.
Although NMR can differentiate these epimers, it is not as sensitive as mass
spectrometry methods. Mass spectrometry is sensitive, but cannot differentiate epimers
by measuring mass alone. By coupling an FT-ICRMS and a wavelength tunable OPO
laser, unique IRMPD spectra were obtained and used for epimer differentiation.
Figure 3-1. The structures of GlcA and IdoA only differ in the carboxyl orientation at carbon number 5.
Experimental Techniques
Sample Preparation
GlcA was obtained from Sigma-Aldrich. Both IdoA and O-methyl-β-D-glucuronic
acid were purchased from Carbosynth, UK. The samples were used without further
purification. Using MilliQ water and 99.9% methanol from Sigma-Aldrich, stock solutions
were prepared by dissolving the solid samples in 10 mL mixture of 60:40 MeOH:water
mixture. The stock solutions were diluted to 10-5 M using 60:40 MeOH:water and
prepared with an equimolar amount of RbCl.
Instrumentation
Mass Spectrometry. The mass spectrometer used was a FT-ICR 4.7 T Apex II
mass spectrometer (Bruker, Billerica, MA), with ESI as the ionization source (Analytica
44
of Branford, Inc., Branford, CT). The FT-ICR mass spectrometer is located in the
University of Florida Department of Chemistry’s mass spectrometry services laboratory.
The flow rate of the samples was set to 5 μL/min, the nebulizing nitrogen gas flow was
30 L/hr and the desolvation gas flow was 155 L/hr. The Bruker X-MASSTM data
acquisition system was used to acquire the data.
Optical parametric oscillator laser. The laser used in our experiments was an
OS 4000 optical parametric oscillator (OPO) laser (LINOS Photonics, München,
Germany). The OPO is pumped by a continuous wave Nd/YAG laser (2 W, 1064 nm).
The laser has 18 poling periods, and use of each poling periods made available a range
of possible wavelengths. The pump laser interacts with a particular poling period of a
crystal, in this case a lithium niobate crystal, producing signal and idler beams. The
relationship of the wavelengths of the pump, signal and idler beams is shown in
Equation 3.1.
To achieve a particular wavelength in a particular poling period, the temperature
(from 50 to 150 °C) of the OPO crystal was varied. However, for a particular poling
period and crystal temperature, several competing wavelengths can be emitted by the
laser. Tuning to a specific wavelength was achieved using an etalon to eliminate other
wavelengths. In addition, the lock-in electronics kept a particular wavelength in
resonance. Changing the angle of the etalon removed interfering wavelengths. The
wavelength ranges of the OPO were 1.38-2.0 and 2.28-4.67 microns.
Experimental Procedure
Coupling of FT-ICRMS and OPO laser. Figure 3-2 is a diagram of the ICR cell
coupled to the OPO laser beams. The laser is placed on a stable laser table. The
heights of the beams and the center of the ICR cell are the same. The heights were

45
measured roughly using a ruler. Adjustable mirrors guided the two idler beams into the
center of the cell.
Figure 3-2. The experimental set-up is composed of the ICR cell and the OPO laser. Drawing courtesy of Jan Szczepanski.
Between runs in which the sample was irradiated, one of idler beams is directed to
the power meter to measure the power of the single beam. In contrast, the signal beam
is permanently directed to a wavemeter to measure the wavelength. Since the pump,
the idler and the signal beams are related, the wavelength of the idler beams was
obtained by manipulating the equation below.
1/λp = 1/λi + 1/λs 3-1
OPO Laser
ICR
4.7 T Magnet Power Meter
Uniblitz Beam Reflecting Shutter
Wavemeter
IR Idler Beam
NIR Signal Beam
ESI

46
Here λp, λi and λs are the wavelengths of the pump, idler and signal beams,
respectively.
Before every experiment, the alignment of the idler beams was verified by using
the beams to dissociate [GlcA+Rb]+. This complex dissociates completely around ~
3652 cm-1 under irradiation by the two idler beams. If the observed dissociation was
incomplete, the beams were aligned by blocking the second beam. The first beam
alone, when properly aligned, could dissociate the sample around 80-90%. The second
beam was aligned by blocking the first and aligning the second beam.
Multiple photon dissociation. The [GlcA+Rb]+ or [IdoA+Rb]+ samples were
formed by ESI and guided into the analyzer cell. The FT-ICR parameters were tuned to
achieve stable and maximum ion counts. The signal to noise ratio and the number of
ions were noted. In addition, undesirable ions were removed if present in the mass
spectrum, by ejection from the cell. A range of continuous sinusoidal voltages, excluding
that of the sample, was applied to the excitation plates, removing the unwanted ions.
When in resonance, these ions will spiral outward and hit the plates. The remaining
[sugar+Rb]+ complexes were then irradiated by the two idler beams for 10 s. The
precursor and any fragments ions were excited, detected and recorded (Fig. 3-3). Also
recorded were the corresponding wavelength and power of the laser.
In our experiments, the laser fluence entering the cell at some wavelengths was
low due to water absorption. Water absorption was still present to some extent even
though the pathways of the beams were purged by N2 gas. To avoid this absorption, we
set a power cut-off of ~35 mW. Wavelengths that produced lower than ~35 mW as read

47
on the power meter were removed from the data or were avoided during the succeeding
experiments.
Figure 3-3. The sequence of events during the experiment involved (1) quenching of ions from previous experiments, (2) extracting the ions from the source, (3) trapping the ions inside the analyzer cell, (4) ejecting unwanted ions, (5) irradiating the ions with the OPO laser for 10 s, (6) exciting and (7) detecting the fragments and precursor ions.
Calculations
Candidate structures of the sugar+Rb+ complexes were systematically built using
the Gaussview™ program. These structures were used to find the optimized geometry.
In building the sugars, the hydrogen bonding network of the –OH groups was varied.
This network was initally set to either clockwise or counterclockwise. Rb+ was initally
placed at 15 total positions, above, below and on the sides of the sugars.
Detect
Excite
OPO irradiation
Eject
Trap
Extract
Quench
Time

48
Figure 3-4. The structure of [β-GlcA+Rb]+ complex showing the clockwise hydrogen
bond network. The Rb+ is closest to the oxygen of carbon 1, the oxygen forming the ring, and one of the oxygens of the carboxylic acid
For GlcA, 4C1 structures were built. The 4C1 chair conformation was used since this
structure was used in previous studies.43 Thirty structures of GlcA in 4C1 conformers,
composed of 15 α- and 15 β- anomers, were systematically constructed.
For IdoA, 60 structures were calculated. These contained not only 4C1 but also 1C4
and skew (2S0). Previous NMR data and force-field calculations of IdoA concluded that
4C1, 1C4 and skew-boat (2S0) conformers are stable.45,46
The minimum energies, geometries and the respective vibrational frequencies of
the sugar+Rb+ complexes were calculated using density functional theory (DFT),
implemented using the Gaussian03™ software.47 The functional and basis set used for
the sugar were Becke3−Lee−Yang−Parr (B3LYP) .48 and 6-31+G(d,p), respectively.
For Rb+, the Stuttgart-Dresden (SD) basis set was used. The experimental IRMPD
spectra were averaged and analyzed using Origin™ software version 7.5. Because
experimental bands are usually red-shifted compared to predicted spectra, the
calculated spectra were scaled uniformly by a factor of 0.958, to match the selected
regions of the experimental data.

49
Results and Discussions
D-glucuronic and L-iduronic Acids
The spectra (Fig. 3-5) of GlcA and IdoA are different and therefore the two
epimers can be distinguished from each other. Both epimers showed a band around
3550 cm-1 to 3580 cm-1. This band, due to the carboxylic acid vibrations, can thus not be
used to distinguish the two epimers. However, the size and intensity of the band around
~3600 could be used to differentiate the two epimers. GlcA has broad band from 3600
cm-1 up to 3675 cm-1. In contrast, IdoA has a smaller band and lesser intensity, from
3630 cm-1 to 3675 cm-1.
The spectra were different because the attachment of Rb+ to the monosaccharide
differs between epimers. The attachment of the Rb+ to the sugar will be elaborated in
detail in the next sections. In addition, theoretical and experimental spectra will be
compared and discussed.
Figure 3.5. The IRMPD spectra of glucuronic acid and iduronic acids are different (red is GlcA and black is IdoA)
50
D-glucuronic Acid
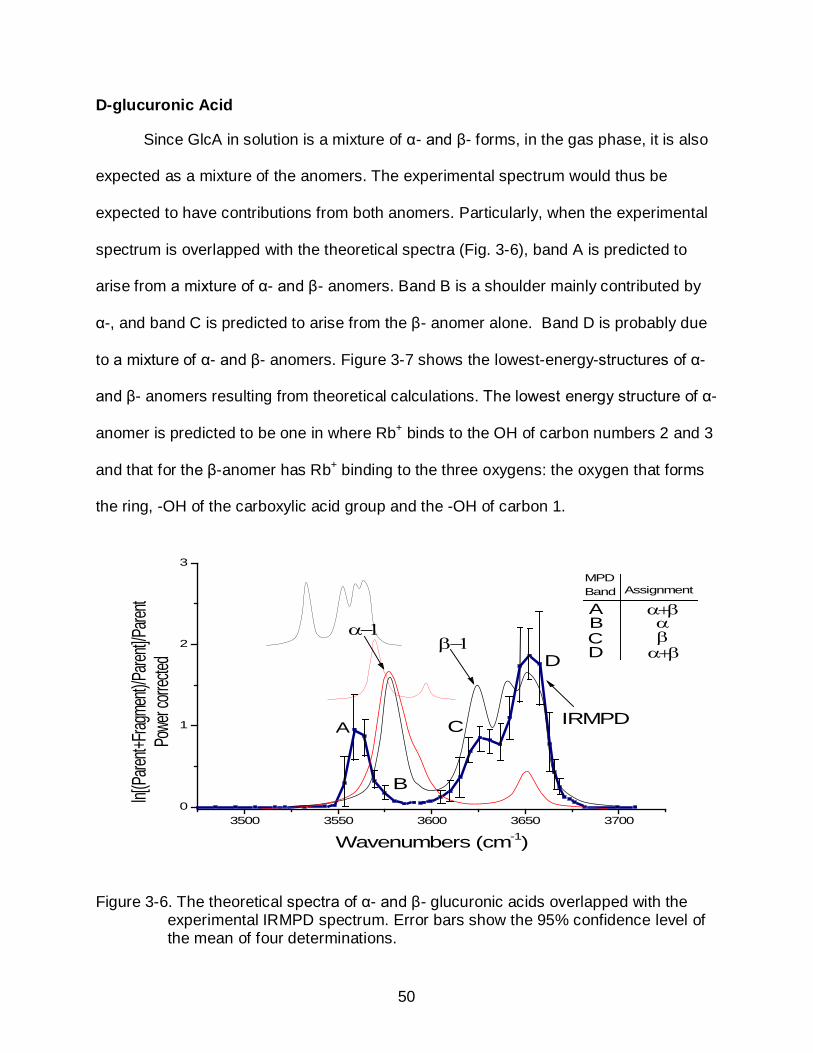
Since GlcA in solution is a mixture of α- and β- forms, in the gas phase, it is also
expected as a mixture of the anomers. The experimental spectrum would thus be
expected to have contributions from both anomers. Particularly, when the experimental
spectrum is overlapped with the theoretical spectra (Fig. 3-6), band A is predicted to
arise from a mixture of α- and β- anomers. Band B is a shoulder mainly contributed by
α-, and band C is predicted to arise from the β- anomer alone. Band D is probably due
to a mixture of α- and β- anomers. Figure 3-7 shows the lowest-energy-structures of α-
and β- anomers resulting from theoretical calculations. The lowest energy structure of α-
anomer is predicted to be one in where Rb+ binds to the OH of carbon numbers 2 and 3
and that for the β-anomer has Rb+ binding to the three oxygens: the oxygen that forms
the ring, -OH of the carboxylic acid group and the -OH of carbon 1.
3500 3550 3600 3650 37000
1
2
3
ln[(Pa
rent+F
ragme
nt)/Pa
rent]/P
arent
Powe
r corr
ected
Wavenumbers (cm-1)
α−1β−1
IRMPD
MPD Band
ABCD
Assignment
α+βαβα+β
A
B
C
D
Figure 3-6. The theoretical spectra of α- and β- glucuronic acids overlapped with the
experimental IRMPD spectrum. Error bars show the 95% confidence level of the mean of four determinations.

51
Figure 3-7. The lowest energy structure of the β- anomer of D-glucuronic acid predicts that Rb+ is bound to the sugar at the carboxylic acid group, the oxygen that forms the ring and the –OH of carbon 1. In the α- anomer, Rb+ is attached to the –OHs of carbon 2 and 3.
Figure 3-8. The theoretical and experimental spectra of α- and β- glucuronic acid.
3350 3400 3450 3500 3550 3600 3650 37000.0
0.5
1.0
1.5
2.03350 3400 3450 3500 3550 3600 3650 37000
50
100
150
3350 3400 3450 3500 3550 3600 3650 37000
100
200
300
3400 3450 3500 3550 3600 3650 37000
100
200
300
IRMPD (exp) IRMPD (exp)
α-1 (0.0)
α-2 (1.52)
α-3 (2.82) β-3 (2.83)
β-2 (1.87)
β-1 (0.0)
3350 3400 3450 3500 3550 3600 3650 37000.0
0.5
1.0
1.5
2.03350 3400 3450 3500 3550 3600 3650 37000
100
200
300
3350 3400 3450 3500 3550 3600 3650 37000
100
200
3003350 3400 3450 3500 3550 3600 3650 37000
100
200
300
Wavenumbers (cm-1) Wavenumbers (cm-1)
Frag
men
t yie
ld
β-D-glucuronic acid (0.00 kcal/mol) α-D-glucuronic acid (0.00 kcal/mol)

52
Methylated β-D-glucuronic Acid
GlcA is a mixture of α- and β- anomers in solution and in the gas phase. To study
the spectrum of GlcA due to the β- anomer alone, the spectrum of O-methyl-β-D-
glucuronic acid was recorded (Fig. 3.9). Mutarotation was blocked by replacing the –OH
at the anomeric carbon with –O-CH3. The methyl group prevents the opening of the
ring, locking the sugar in a β- conformer permanently.
The spectrum of O-methylated-D-glucuronic acid is similar to that of GlcA;
however, there are three differences. First is the higher peak intensity of GlcA at the
wavelengths ~3600 to 3670 cm-1 range (0.8 vs. 1.9). Second, the peak of GlcA is
broader. Third, the methylated sugar peak does not have a pronounced shoulder
around 3570 cm-1 as that seen for α-D-glucuronic acid.
Figure 3-9. The spectra of D-glucuronic acid (red) and O-methyl-β-D-glucuronic acid
(black) are similar. The intensity of O-methyl-β-D-glucuronic acid spectrum is less intense at ~ 3620 to 3660 cm-1.
L-iduronic Acid
Previous structural elucidations of IdoA have produced conflicting results.49 Early
NMR investigations concluded IdoA adopts the 1C4 structure.50,51 Diffraction analysis52
of crystals of dermatan sulfates suggested that IdoA is 4C1.

53
Pyranose rings in general can adopt 1C4, 4C1, boat, envelope and skew-boat
structures,53 however, the structures mentioned are strained and unstable except for the
chair conformations. For example, in solution, D-glucose can assume the two chair
conformers and is more stable as 4C1. On the other hand, IdoA is a more flexible
structure compared to the rigid GlcA,54 IdoA can oscillate between 1C4, 4C1 and skew-
boat (2S0) structures. Early force field studies of IdoA showed 1C4, 4C1 and 2S0 are
stable and with almost equal lowest calculated energies. In studies of heparin and
heparan sulfates, IdoA was shown to exist as 1C4, 4C1 and skew boat (2S0).46 In general,
the relative abundance of 1C4, 4C1 and 2S0 depends on the sequence of the
glycosoaminoglycan (GAG) and sulfation pattern of IdoA. In nature, IdoA can exist in
unsulfated or sulfated forms.
Studies of IdoA have usually been carried out in the solid or liquid phase. Gas
phase studies are rare. Recently, calculations of the structure of 1,4-diOMe IdoA2S
were reported.45 In this experiment, IdoA was O-methylated at carbons 1 and 4, and
carbon 2 was sulfated. In addition, the –O-methyl at carbon 1 was in the α- position. It
was concluded that this structure is stable in the 2S0 form.
In our experiments, the gas phase IRMPD spectrum of IdoA was recorded and
compared to theoretically predicted spectra. Figure 3-10 shows that the experimental
spectrum best matches the β- 1C4 calculated spectrum. The lowest-energy structures of
4C1 and 2S0 and their corresponding theoretical spectra (not shown) did not match the
experimental spectra. In addition, the calculated structure for β- 1C4 predicted that the
Rb+ is below the iduronate ring (Fig. 3-11).

54
Figure 3.10. The experimental spectrum of IdoA closely matched that predicted for a β-
1C4.configuration.
Figure 3-11. Two of the predicted low-energy structures of the L-iduronic acid-Rb+
complex. The theoretical spectrum of β-D-iduronic acid fits the experimental spectrum. Note that the Rb+ is positioned below the sugar.
Conclusions
The objective of the experiments reported in this chapter was to differentiate
monosaccharides that are epimers. We have described a method to differentiate
Integral intensities (Km
/mol) Fragm
ent yield

55
epimers in the gas phase, by coupling an FT-ICR mass spectrometry to a wavelength
tunable OPO laser. In addition, we predicted the gas phase structures of the sugars. In
the gas phase, GlcA is a mixture of both anomers. On the other hand, IdoA, a more
flexible compound based on previous reports, best fit the β- 1C4 theoretical spectrum.
To further study the GlcA compound in the gas phase, the IRMPD spectrum of O-
methylated-α-D-glucuronic acid should be taken. Also, both anomers of IdoA should be
locked and the IRMPD spectrum should be recorded and compared to that of IdoA.
Since we avoided certain wavelengths due to water absorptions, an improvement
in this study would be to use fiber optics to transmit IR radiation from the OPO laser to
the ICR cell. This would increase the number of wavelengths and the number of sample
points taken across each spectrum.

56
CHAPTER 4 CONCLUSIONS AND FUTURE DIRECTIONS
Conclusions
Recent developments in biological analyses have been heavily focused on
proteins and DNA. The next advancement in bioanalytical techniques should focus also
on carbohydrates, equally important biomolecules, that are crucial in our understanding
of diseases such as cancer.1
There are other robust techniques, such as nuclear magnetic resonance (NMR),
capable of analyzing and elucidating structures of carbohydrates. However, NMR
requires relatively larger concentrations in contrast to mass spectrometry. Therefore,
there are instances for which NMR is not an option, for example, if one deals with low-
concentrations of very rare biological samples.
However, mass spectrometry alone is blind to structures. What is needed is an
additional step, and for FT-ICR mass spectrometry this can occur after the ions are
trapped inside an ICR analyzer cell. In 1964, after the invention of the ruby laser, it was
touted that “lasers are solutions looking for problems.”55 With the advancements of fast
electronics, ionization methods and laser technologies, OPO lasers may have found a
niche in analytical and physical chemistry. The coupling of an OPO laser and FT-ICR
mass spectrometry, in conjunction with theoretical calculations, has helped MS to
elucidate structures at the University of Florida. The technique known as IRMPD
creates “action” spectra of ions. The concentrations of electrosprayed carbohydrates
trapped in an FT-ICR mass spectrometer are abundant enough to carry out IRMPD. In
addition, the OPO laser is wavelength-tunable. Although limited in wavelength, the OPO
laser generates output wavelengths that are in energy ranges that can probe the –O-H,

57
-N-H and –C-H vibrations of ions. These functional groups are relevant, especially when
dealing with biological samples such as carbohydrates. In our experiments, GlcA and
IdoA epimers were differentiated and their corresponding structures in the gas phase
were elucidated.
Recommendations
The investigation and differentiation of GlcA and IdoA has led to several
recommendations with regard to (1) hardware, (2) sample and (3) calculations.
Hardware. Regarding hardware, fiber optics could be used to replace mirrors in
directing IR radiation into the ICR analyzer cell. This idea came from an OPOTEK
application scientist who has been using fiber optics to direct the IR beam from a
pulsed, wavelength-tunable, OPO laser into experimental apparatus. Fiber optics would
eliminate the need to use purging N2 gas.
To change the wavelength of the laser, the oven temperature housing the crystal
is changed. Control of the oven temperature is in turn achieved via a computer. The
computer communicates with the OPO laser’s hardware through a home-built
electronics control box and LabView software (National Instruments LabView).
However, changing the temperature doesn’t guarantee a stable wavelength, and an
additional step of manually adjusting the etalon’s angle is needed. The etalon eliminates
competing wavelengths in the resonance cavity of the OPO. It is also used to produce
a stable wavelength output with the maximum possible power output. Changing the
etalon’s angle should also be performed using the computer. This improvement would
save time.
Sample. In addition to the O-methyl-β-D-glucuronic acid spectrum, obtained in the
work reported in this thesis, the spectrum of the α-anomer (O-methyl-α-D-glucuronic

58
acid) should also be obtained. This will resolve the assignments of the bands for this
sample, as illustrated in Fig. 4-1. The experimental spectrum of O-methyl-α-D-
glucuronic acid will confirm if the shoulder between 3575 and 3600 cm-1 is an artifact or
real. Figure 4-1 shows a slight shoulder due to low-intensity bands between 3575 and
3600 cm-1. This shoulder appears in our experimental spectrum, but is not well defined.
Figure 4-1. The lowest-energy calculated spectrum of [α-GlcA+Rb]+ shows a shoulder between 3575 and 3600 cm-1.
In addition to recording the experimental spectrum of O-methyl-α-D-glucuronic
acid, the spectrum of each IdoA anomer should also be recorded. The bands seen in
the IdoA spectrum obtained in the work reported in this thesis are contributed by both
the α-IdoA and β-IdoA anomers. By obtaining the spectra of O-methyl-α-L-iduronic acid
and O-methyl-β-L-iduronic acid, the bands of IdoA reported here can be dissected and
assigned. For example, the band of IdoA around ~3660 cm-1 in Fig. 3-5, could be
assigned as a contribution of the two anomers, or the α-anomer alone, depending on
the analysis.
Inte
gral
inte
nsiti
es
3500 3550 3600 3650 37000
100
200
300
Wavenumbers in cm-1

59
Another recommended experiment is to use NMR to determine which anomer
predominates in the solution phase. Moreover, since IdoA and GlcA are sulfated in
nature, IRMPD spectra of the sulfated acid would be useful.
Calculations. Pyranose rings can oscillate between 4C1 and 1C4 conformations,
with several conformers in between. These conformational itineraries include boats and
skew-boats.53,54 For the work reported here the IdoA structures were calculated based
on 4C1, 1C4 and 0S2 conformers only, since previous reports showed IdoA to be stable in
these conformations.46 However, it is possible that lower energy structures exist. These
structures could be other skew-boats. These skew-boats are 3S1, 5S1, 2SO, 1S3 and 1S5,
so the author recommends calculating the lowest-energy of these structures (which are
shown in Fig 4-2). On the other hand, GlcA was calculated only in 4C1 conformations.
Structures that are 1C4 should also be calculated.
Figure 4-2. Iduronate ring structures shown to oscillate between 4C1, 0S2 and 1C4. The author recommends calculation of other skew-boat conformers of IdoA (3S1, 5S1, 2SO, 1S3 and 1S5).

60
LIST OF REFERENCES
Reference List
1. Varki, A. Glycobiology 1993, 3, 97-130.
2. Varki, A. Cell 2006, 126, 841-45.
3. Davis, B. G.; Fairbanks, A. J. Carbohydrate Chemistry, Oxford University Press: New York, 2002.
4. Manzi, A. E. Essentials of Glycobiology, Varki, A.; Cummings, R.; Esko, J. D.; Freeze, H.; Hart, G.Marth, J., Eds.; Cold Spring Harbor Laboratory Press: New York, 1999; Chapter 2.
5. Dove, A. Nature Biotechnology 2001, 19, 913-17.
6. Varki, A Cell 2006, 126, 841-45.
7. Hindsgaul, O. Essentials of Glycobiology, Varki, A.; Cummings, R.; Esko, J. D.; Freeze, H.; Hart, G.Marth, J., Eds.; Cold Spring Harbor Laboratory: New York, 1999; Chapter 38.
8. Hoffmann, d. E.; Stroobant, V. Mass Spectrometry, Hoffmann, d. E.; Stroobant, V., Eds.; 2nd ed.; John Wiley & Sons: West Sussex, 2002; Chapter 7.
9. Fang, T. T.; Zirrolli, J.; Bendiak, B. Carbohydrate Research 2007, 342, 217-35.
10. Fang, T. T.; Bendiak, B. J. Am. Chem. Soc. 2007, 129, 9721-36.
11. Mendonca, Sanford; Cole, Richard B.; Zhu, Junhua; Cai, Yang; French, Alfred D.; Johnson, Glenn P.; Laine, Roger A. Journal of the American Society for Mass Spectrometry 2003, 14, 63-78.
12. Hofmeister, G. E.; Zhou, Z.; Leary, J. A. J. Amer. Chem. Soc. 1991, 113, 5964-70.
13. Polfer, N. C.; Valle, J. J.; Moore, D. T.; Oomens, J.; Eyler, J. R.; Bendiak, B. Anal.Chem. 2006, 78, 670-79.
14. Amster, I. J. Journal of Mass Spectrometry 1996, 31, 1325-37.
15. Comisarow, M. B.; Marshall, A. G. Chem.Phys. Lett. 1974, 25, 282-83.
16. Bagratashvili, V. N.; Letokhov, V. S.; Makarov, A. A.; Ryabov, E. A. Multiple Photon Infrared Laser Photophysics and Photochemistry., Hardwood Academic Publishers: Amsterdam, 1985.
17. Dunbar, R. C. J. Am. Chem. Soc. 1971, 93, 4354.

61
18. Wight, C. A.; Beauchamp, J. L. J. Am. Chem. Soc. 1981, 103, 6499-501.
19. Woodin, R.; Bomse, D.; Beauchamp, J. L. J. Am. Chem. Soc. 1978, 100, 3246.
20. Dunbar, R. C.; Kramer, J. M. J. Am. Chem. Soc. 1972, 94, 4346-53.
21. Little, D. P.; Speir, J. P.; Senko, M. W.; O'Conner, P. B.; McLafferty, P. W. Ana.l Chem. 1994, 66, 2809-15.
22. Bensimon, M; Rapin, J.; Gaumann, T. Int J of Mass Spectrom Ion Process 1986, 72, 125-35.
23. Eyler, J. Mass Spectrometry Reviews 2009, 28, 448-67.
24. Contreras, C. S. University of Florida, 2008. Thesis
25. Karas, M.; Bachmann, D.; Bahr, U.; Hillenkamp, F. International Journal of Mass Spectrometry and Ion Processes 1987, 78, 53-68.
26. Tanaka, K.; Ido, Y.; Akita, S.; Yoshida, Y. Iyo Masu Kenkyukai Koenshu 1987, 12, 219-22.
27. Fenn, J. B. Abstracts of Papers of the American Chemical Society 2003, 225, U108.
28. Fenn, J. B. Angewandte Chemie-International Edition 2003, 42, 3871-94.
29. Fenn, J. B.; Mann, M.; Meng, C. K.; Wong, S. F.; Whitehouse, C. M. Mass Spectrometry Reviews 1990, 9, 37-70.
30. Fenn, J. B.; Mann, M.; Meng, C. K.; Wong, S. F.; Whitehouse, C. M. Science 1989, 246, 64-71.
31. Park, Y. Lebrilla C. B. Mass Spectrometry Reviews 2005, 24, 232-64.
32. Park, Y. M.; Lebrilla, C. B. Mass Spectrometry Reviews 2005, 24, 232-64.
33. Amster, I. J. Journal of Mass Spectrometry 1996, 31, 1325-37.
34. Hakansson, K.; Cooper, H. J.; Hudgins, R. R.; Nilsson, C. L. Current Organic Chemistry 2003, 7, 1503-25.
35. Laskin, J.; Futrell, J. H. Mass Spectrometry Reviews 2005, 24, 135-67.
36. Stefan, S. E.; Eyler, J. R. Anal. Chem. 2009, 81, 1224-27.
37. Bush, M. F.; Saykally, R. J.; Williams, E. R. J. Am. Chem. Soc. 2008, 130, 15482-86.

62
38. Skoog, D. A.; Holler, F. J.; Crouch, S. R. Principles of Instrumental Analysis, 6th ed.; Thompson: Belmont, 2007.
39. Mueller, M. Fundamentals of Quantum Chemistry. Molecular Spectroscopy and Modern Electronic Strucuture Computations., Kluwer Academic/Plenum Publishers: New York, 2001.
40. Polfer, N. C.; Oomens, J. Mass Spectrometry Reviews 2009, 28, 468-94.
41. Fridgen, T. D. Mass Spectrometry Reviews 2009, 28, 586-607.
42. Bosenberg, W. R.; Drobshoff, A.; Alexander, J. I. Optics Letters 1996, 21, 713-15.
43. Kovacs, A.; Nyerges, B.; Izvekov, V. The Journal of Physical Chemistry 2008, 112, 5728-35.
44. Zaia, J Chemistry and Biology 2008, 15, 881-92.
45. Remko, M.; Von der, L.; Claus, S. Journal of Chemical Information and Modeling 2006, 46, 1194-200.
46. Dino R.; Provasoli, A.; Ragazzi, M.; Casu, B.; Torri, G.; Bossennec, V.; Perly,B.; Sinaÿ, P.; Petitou, M.; Choay, J. Carbohydrate Research 1990, 195, 157-67.
47. Frisch, M. J., Trucks, G. W., Schlegel, H. B., Scuseria, G. E., Robb, M. A., Cheeseman, J. R., Montgomery, J. A., Jr., Vreven, T., Kudin, K. N., Burant, J. C., Millam, J. M., Iyengar, S. S., Tomasi, J., Barone, V., Mennucci, B., Cossi, M., Scalmani, G., Rega, N., Nakatsuji, H., Hada, M., Ehara, M., Toyota, K., Fukuda, R., Hasegawa, J., Ishida, M., Nakajima, T., Honda, Y., Kitao, O., Nakai, H., Klene, M., Li, X., Knox, J. E., Hratchian, H. P., Cross, J. B., Bakken, V., Adamo, C., Jaramillo, J., Gomperts, R., Stratmann, R. E., Yazyev, O., Austin, A. J., Cammi, R., Pomelli, C., Ochterski, J. W., Ayala, P. Y., Morokuma, K., Voth, G. A., Salvador, P., Dannenberg, J. J., Zakrzewski, V. G., Dapprich, S., Daniels, A. D., Strain, M. C., Farkas, O., Malick, D. K., Rabuck, A. D., Raghavachari, K., Foresman, J. B., Ortiz, J. V., Cui, Q., Baboul, A. G., Clifford, S., Cioslowski, J., Stefanov, B. B., Liu, G., Liashenko, A., Piskorz, P., Komaromi, I., Martin, R. L., Fox, D. J., Keith, T., Al-Laham, M. A., Peng, C. Y., Nanayakkara, A., Challacombe, M., Gill, P. M. W., Johnson, B., Chen, W., Wong, M. W., Gonzalez, C., and Pople, J. A. Gaussian03. [B.05]. 2004. Wallingford, CT, Gaussian, Inc.
Ref Type: Computer Program
48. Becke, Axel D. Journal of Chemical Physics 1993, 98, 5648.
49. Das, S. K; Mallet, J. M.; Esnault, J.; Driguez, P. A.; Dachaussoy, P.; Sizun, P.; Herault, J. P.; Herbert, J. M.; Petitou, M.; Sinay, P. Chemistry European Journal 2001, 7, 4821-34.

63
50. Gatti, G.; Casu, B.; Torri, G.; Vercelotti, J. R. Carbohydrate Research 1979, 68, C-3-C-7.
51. Perlin, A. S.; Casu, B.; Sanderson, G. R.; Johnson, L. F. Can.J.Chem. 1970, 48, 2260-68.
52. Mitra, A. K.; Amott, S.; Isaac, D. H.; Atkins, E. D. T. J. Mol. Biol. 1983, 169, 873-901.
53. Cremer, D.; Pople, J. A. J. Am. Chem. Soc. 1975, 97, 1354-58.
54. Mulloy, Barbara; Forster, Mark J. Glycobiology 2000, 10, 1147-56.
55. Snook, R. Chemical Society Reviews 1997, 26, 319-26.

64
BIOGRAPHICAL SKETCH
The author attended to the University of the Philippines at Los Baños for his
undergraduate degree in chemistry. After a stint as a quality control engineer at NEC
Corporation, he applied for graduate study. To satisfy his curiosity regarding fatigue and
human performance, he went to the University of Central Florida to study exercise
physiology. In 2005, Emilio was accepted at the University of Florida’s chemistry
graduate program. After graduation, his goals are to teach chemistry at a community
college in the mornings and coach middle school soccer during the afternoons, and to
finish the Boston marathon and the Hawaii Ironman triathlon, someday.