coupled dynamic flow and geomechanical simulations for … · obtained from the two reservoir...
TRANSCRIPT
Energy Procedia 63 ( 2014 ) 2879 – 2893
Available online at www.sciencedirect.com
ScienceDirect
1876-6102 © 2014 The Authors. Published by Elsevier Ltd. This is an open access article under the CC BY-NC-ND license (http://creativecommons.org/licenses/by-nc-nd/3.0/).Peer-review under responsibility of the Organizing Committee of GHGT-12doi: 10.1016/j.egypro.2014.11.311
GHGT-12
Coupled Dynamic Flow and Geomechanical Simulations for an Integrated Assessment of CO2 Storage Impacts in a Saline Aquifer
Elena Tillnera*, Ji-Quan Shib, Giacomo Baccib, Carsten M. Nielsenc, Peter Frykmanc, Finn Dalhoffd, Thomas Kempkaa
aGFZ German Research Centre for Geosciences, Section 5.3 – Hydrogeology, Telegrafenberg, 14473 Potsdam, Germany. bImperial College London, Department of Earth Science & Engineering, South Kensington Campus, London SW7 2AZ, United Kingdom.
cGeological Survey of Denmark and Greenland (GEUS), Department of Reservoir Geology, Øster Voldgade 10, 1350 Copenhagen, Denmark. dVattenfall Research and Development AB, Stoberigade 14, DK-2450 Copenhagen SV, Denmark.
Abstract
Pore pressure variation resulting from geological CO2 storage may compromise reservoir, caprock and fault integrity. Therefore, we investigate the mechanical impact of industrial-scale CO2 storage at a prospective Danish site by coupled 3D hydro-mechanical simulations carried out by two independent modelling groups. Even though the two chosen modelling strategies are not identical, simulation results demonstrate that storage integrity is maintained at any time. Vertical displacements are mainly determined by hydraulic fault conductivity influencing spatial pore pressure elevation. The introduced fault zone implementation in the hydro-mechanical model allows for localization of potential leakage pathways for formation fluids along the fault plane. © 2013 The Authors. Published by Elsevier Ltd. Selection and peer-review under responsibility of GHGT.
Keywords: CO2 storage; hydro-mechanical simulation; ground uplift; fault reactivation
1. Introduction
Underground storage of the greenhouse gas carbon dioxide (CO2) is currently seen as a promising strategy to limit the anthropogenic contribution to global climate change. However, effective stress changes resulting from pore pressure elevation generally accompanying CO2 injection may pose a serious impact on the integrity of faults, reservoir and caprock. Ground surface uplift, reactivation of adjacent faults or caprock fracturing may become potential
* Corresponding author. Tel.: +49 331 288 28748; fax: +49 331 288 1529.
E-mail address: [email protected]
© 2014 The Authors. Published by Elsevier Ltd. This is an open access article under the CC BY-NC-ND license (http://creativecommons.org/licenses/by-nc-nd/3.0/).Peer-review under responsibility of the Organizing Committee of GHGT-12

2880 Elena Tillner et al. / Energy Procedia 63 ( 2014 ) 2879 – 2893
consequences [e.g. 1-6]. In order to investigate how geological CO2 storage affects the mechanical behaviour of reservoir, caprock and fault zones, coupled dynamic flow and hydro-mechanical simulations for an onshore saline aquifer were undertaken by two different modelling groups. For this purpose, the two dynamic flow simulation codes ECLIPSE [7] and TOUGH2-MP/ECO2N [8,9] were applied for the multi-phase flow simulations and coupled to the mechanical simulators VISAGE [10] and FLAC3D [11], respectively. Although potential formation fluid leakage via hydraulically conductive faults at the Vedsted site was assessed previously by dynamic flow simulations [12], using the conceptual approach similar to that introduced by Tillner et al. [13], hydro-mechanical effects were not considered.
1.1. Study area
The Vedsted site, a prospective deep saline onshore CO2 storage formation, is located in the Norwegian-Danish Basin in Northern Denmark (Figure 1).
Fig. 1. The injection well of the prospective CO2 storage site is located close to Vedsted in northern Denmark. The dotted rectangle indicates the approximate extension of the structural geological model applied in all simulations. National borders and elevation data were obtained from the
DIVA-GIS database [14]. Axes show UTM-coordinates (Spatial Reference: EPSG Projection 32632 - WGS84 / UTM zone 32N).
The Vedsted area is part of the Fjerritslev Trough, a large graben structure in the Sorgenfrei-Tornquist Zone that developed due to a late Carboniferous to Early Permian rifting phase [15]. The structure is bounded by northwest-southeast trending faults and comprises several marine and fluvial sandstone reservoirs of Upper Triassic to Lower Jurassic age, sealed by a multi-barrier system of caprocks consisting of marine Jurassic claystones and Cretaceous chalks [16]. The marine and fluvial sandstones of the Gassum Formation intercalated with marine and lacustrine mudstones form one potential reservoir suitable for geological CO2 storage at Vedsted and were chosen as the target horizon for CO2 injection. The Gassum Formation is located at a depth between 1,700 m and 2,000 m and characterized by an average thickness of about 290 m, whereas only the upper 64 m and the lower 85 m are sandstone
Elena Tillner et al. / Energy Procedia 63 ( 2014 ) 2879 – 2893 2881
dominated [12]. The primary seal is the Fjerritslev Formation with a thickness of 530 m [12,17,18].
2. Coupled hydro-mechanical simulations
In the present modelling study, a one-way coupling procedure was applied, whereby the pore pressure distribution obtained from the two reservoir simulators ECLIPSE and TOUGH2-MP served as a coupling parameter. The two mechanical codes VISAGE and FLAC3D were employed to subsequently calculate strain changes based on effective stress variations as a response to the injection induced pore pressure elevation as previously proposed by e.g. Rutqvist et al. [19,20]. Open and closed fault scenarios were considered in the numerical simulations.
2.1. Structural geological model and parameterization
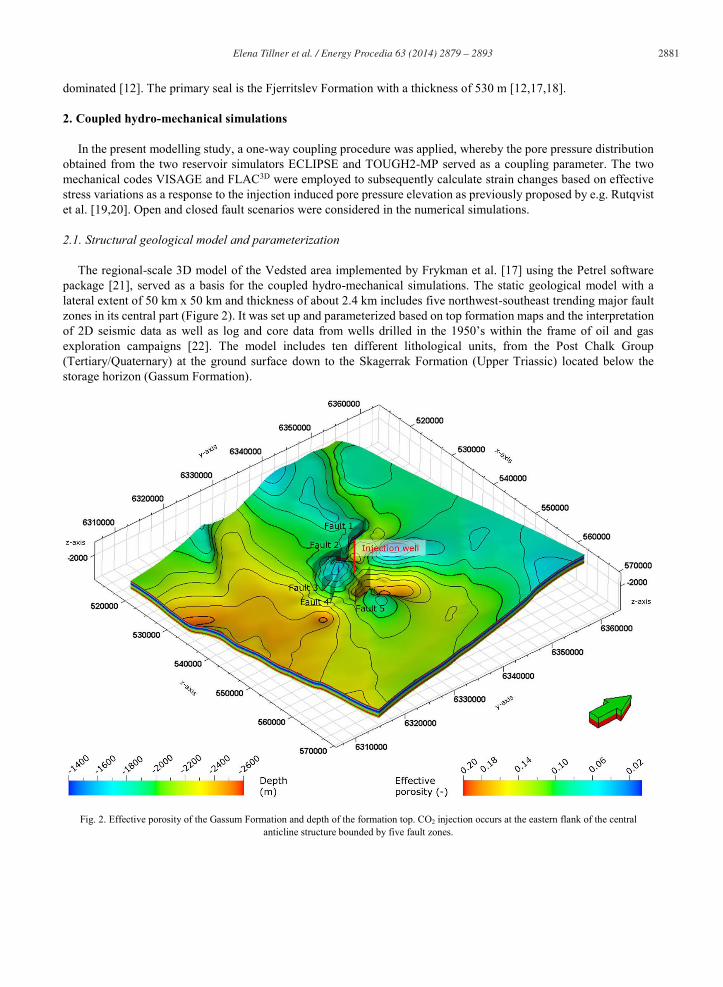
The regional-scale 3D model of the Vedsted area implemented by Frykman et al. [17] using the Petrel software package [21], served as a basis for the coupled hydro-mechanical simulations. The static geological model with a lateral extent of 50 km x 50 km and thickness of about 2.4 km includes five northwest-southeast trending major fault zones in its central part (Figure 2). It was set up and parameterized based on top formation maps and the interpretation of 2D seismic data as well as log and core data from wells drilled in the 1950’s within the frame of oil and gas exploration campaigns [22]. The model includes ten different lithological units, from the Post Chalk Group (Tertiary/Quaternary) at the ground surface down to the Skagerrak Formation (Upper Triassic) located below the storage horizon (Gassum Formation).
Fig. 2. Effective porosity of the Gassum Formation and depth of the formation top. CO2 injection occurs at the eastern flank of the central anticline structure bounded by five fault zones.

2882 Elena Tillner et al. / Energy Procedia 63 ( 2014 ) 2879 – 2893
The porosity and permeability distribution of the storage horizon were modelled as homogenous in vertical and horizontal direction, varying between 0 – 0.25 and 0.01 mD – 70 mD, respectively, due to the alternating sand and shale dominated layers within the lithological sequence of the Gassum Formation [12,15,16,23].
All boundaries of the 3D regional-scale dynamic model are characterized by no-flow boundary conditions. However, to simulate an infinite aquifer and to minimize the influence of boundary effects, a pore volume multiplier at the outer lateral boundary elements was applied. The individual simulation runs start from hydrostatic equilibrium assuming an average hydrostatic pressure gradient of 10.3 MPa/km. Hence, at a depth of 1,995 m in the injection well, the pressure is 22.6 MPa considering a brine density of about 1,120 kg/m3 and a reservoir temperature of 66 °C. Temperature is determined by a geothermal gradient of 30 °C/km and constant in the simulations. Rock compressibility amounts to 6.96 x 10⁻¹⁰ Pa-1 in all formations. A maximum capillary entry pressure of 0.1 MPa corresponds to the low-permeability shales representing the primary seal as well as the intra-formational shale dominated layers within the Gassum Formation. Sand dominated layers of the storage horizon were parameterized with a lower entry pressure of 0.01 MPa. During the individual simulation runs 2 Mt CO2/year, corresponding to 63.42 kg/s, were injected into the Gassum Formation over a time span of 40 years by using a single injection well located at the eastern flank of the central anticline structure.
Both modelling groups developed their individual simulation strategies with differences in grid discretization and parameterization as e.g. caprock permeabilities, fault implementation and hydraulic fault conductivity, discussed in more detail in the following sections.
2.2. GFZ Potsdam simulation strategy
For the assessment of ground surface uplift and reservoir, caprock and fault integrity by coupled hydro-mechanical simulations, a dynamic reservoir model was implemented based on the structural geological model presented in Section 2.1. Subsequently, reservoir flow simulations were performed using the TOUGH2-MP/ECO2N software package to calculate CO2 injection induced pore pressure changes. In order to minimize the influence of the model boundaries on pressure propagation and stress distribution, the numerical reservoir model was extended in downward and lateral directions. In a next step, the pressure distribution at selected time steps obtained from the dynamic flow simulations was scaled to the extended hydro-mechanical model. Finally, the geomechanical response to the altered pore pressure, and thus effective stress distribution was calculated using the FLAC3D software package.
2.2.1. Dynamic flow simulations and results
For dynamic flow simulations with TOUGH2-MP/ECO2N, the regional-scale 3D model presented in Section 2.1, was discretized into a total number of 720,000 elements (nx = 200, ny = 200; nz = 18) with a constant element size in horizontal direction of 250 m x 250 m. The vertical resolution varies between 25 m and a few hundred meters depending on the different lithological units incorporated. The dynamic flow model comprises nine units from the Post Chalk Group at the ground surface down to the Gassum Formation at a depth of about 1,700 m (top of anticline). During the gridding process, the five vertical fault zones were implemented into the numerical model. Faults were treated as either hydraulically conductive or non-conductive to fluid flow in horizontal direction. Furthermore, a permeability of 0.01 mD was assigned to the caprock (Fjerritslev Formation) and the intra-formational shale layers of the Gassum Formation. It was assumed that the injection well is not completed over the entire storage horizon but only in the upper permeable sandstone dominated part of the storage reservoir. After the 40-year injection period, a ten-year post-injection period was simulated to assess the pore pressure development after site abandonment.
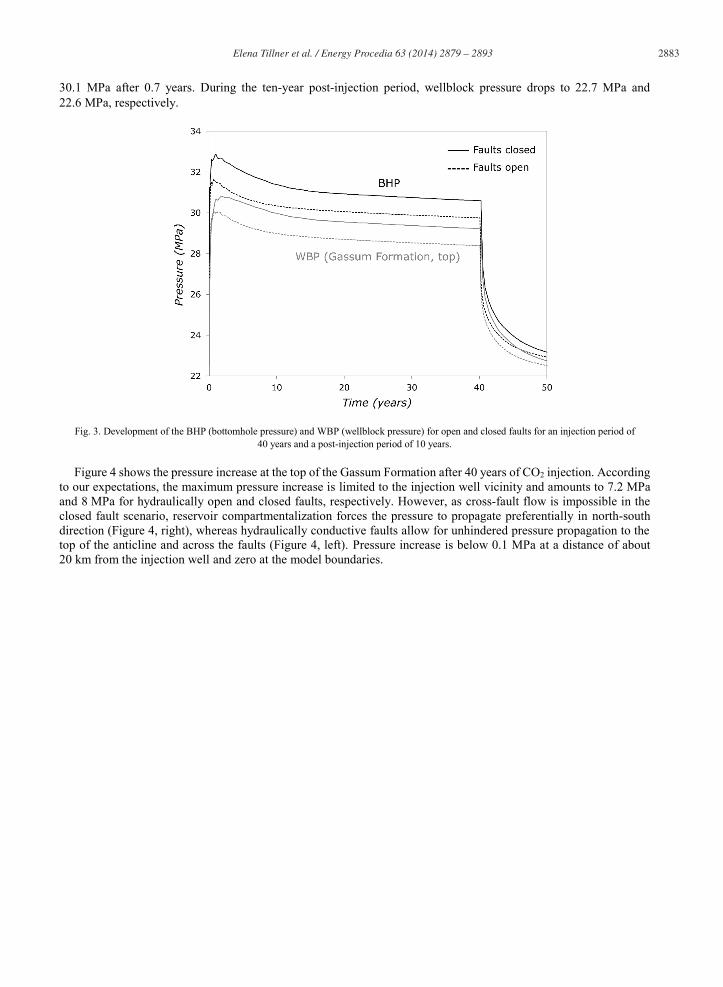
The simulation results show that the bottomhole pressure at the injection increases almost immediately after the injection start by a factor of 1.45 (closed faults) and 1.40 (open faults) up to a maximum of 32.9 MPa and 31.7 MPa at a simulation time of one year and 0.7 years, respectively (Figure 3). From this time on, pressure continuously decreases to 30.6 MPa (closed faults) and 29.8 MPa (open faults) until the end of injection after 40 years. Subsequent to the injection stop, bottomhole pressure drops abruptly and almost reaches initial conditions of 22.6 MPa at the end of the ten-year post-injection period (23.2 MPa, closed faults; 22.9 MPa, open faults). Compared to the bottomhole pressure, wellblock pressure increases less sharply exceeding a maximum of 30.7 MPa after 1 year (closed faults) and
Elena Tillner et al. / Energy Procedia 63 ( 2014 ) 2879 – 2893 2883
30.1 MPa after 0.7 years. During the ten-year post-injection period, wellblock pressure drops to 22.7 MPa and 22.6 MPa, respectively.
Fig. 3. Development of the BHP (bottomhole pressure) and WBP (wellblock pressure) for open and closed faults for an injection period of 40 years and a post-injection period of 10 years.
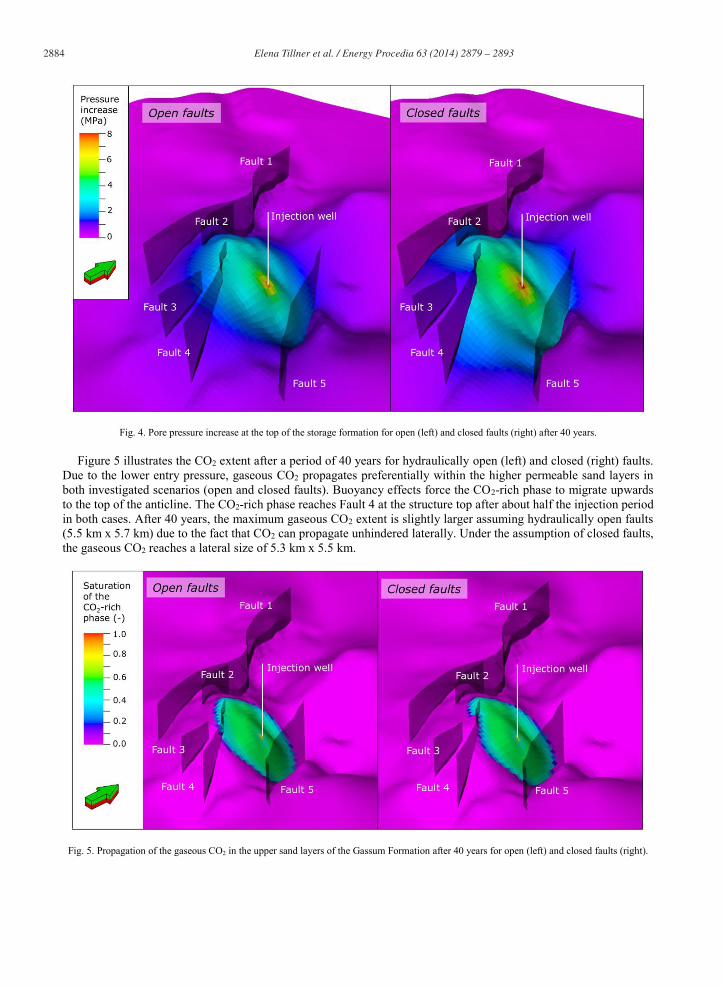
Figure 4 shows the pressure increase at the top of the Gassum Formation after 40 years of CO2 injection. According to our expectations, the maximum pressure increase is limited to the injection well vicinity and amounts to 7.2 MPa and 8 MPa for hydraulically open and closed faults, respectively. However, as cross-fault flow is impossible in the closed fault scenario, reservoir compartmentalization forces the pressure to propagate preferentially in north-south direction (Figure 4, right), whereas hydraulically conductive faults allow for unhindered pressure propagation to the top of the anticline and across the faults (Figure 4, left). Pressure increase is below 0.1 MPa at a distance of about 20 km from the injection well and zero at the model boundaries.
2884 Elena Tillner et al. / Energy Procedia 63 ( 2014 ) 2879 – 2893
Fig. 4. Pore pressure increase at the top of the storage formation for open (left) and closed faults (right) after 40 years.
Figure 5 illustrates the CO2 extent after a period of 40 years for hydraulically open (left) and closed (right) faults. Due to the lower entry pressure, gaseous CO2 propagates preferentially within the higher permeable sand layers in both investigated scenarios (open and closed faults). Buoyancy effects force the CO2-rich phase to migrate upwards to the top of the anticline. The CO2-rich phase reaches Fault 4 at the structure top after about half the injection period in both cases. After 40 years, the maximum gaseous CO2 extent is slightly larger assuming hydraulically open faults (5.5 km x 5.7 km) due to the fact that CO2 can propagate unhindered laterally. Under the assumption of closed faults, the gaseous CO2 reaches a lateral size of 5.3 km x 5.5 km.
Fig. 5. Propagation of the gaseous CO2 in the upper sand layers of the Gassum Formation after 40 years for open (left) and closed faults (right).
Elena Tillner et al. / Energy Procedia 63 ( 2014 ) 2879 – 2893 2885
2.2.2. Geomechanical simulations and results
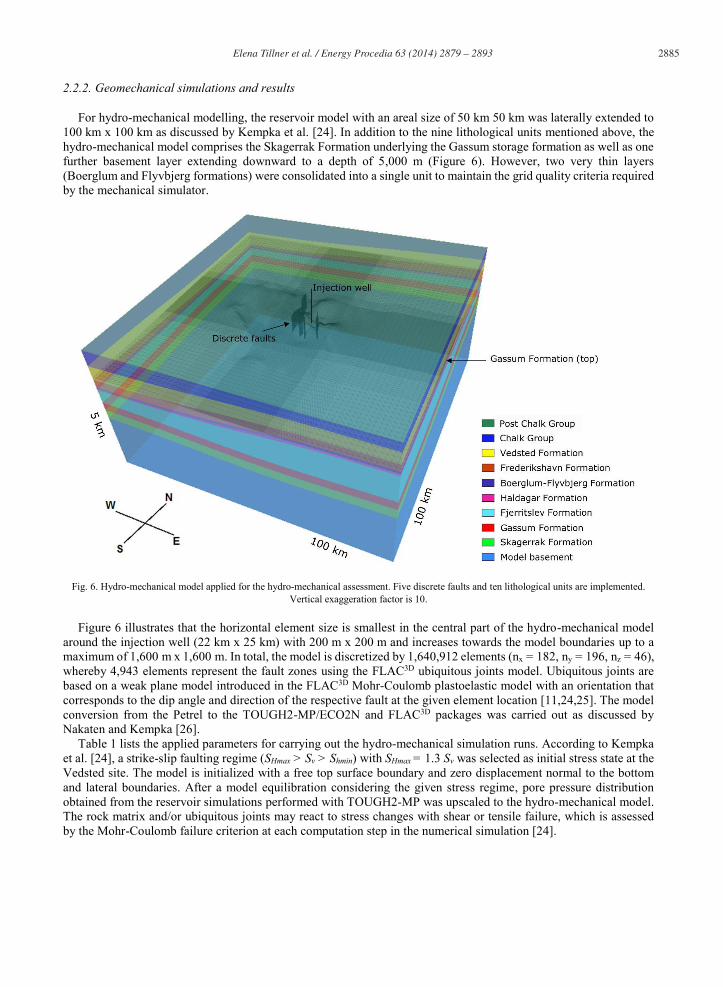
For hydro-mechanical modelling, the reservoir model with an areal size of 50 km 50 km was laterally extended to 100 km x 100 km as discussed by Kempka et al. [24]. In addition to the nine lithological units mentioned above, the hydro-mechanical model comprises the Skagerrak Formation underlying the Gassum storage formation as well as one further basement layer extending downward to a depth of 5,000 m (Figure 6). However, two very thin layers (Boerglum and Flyvbjerg formations) were consolidated into a single unit to maintain the grid quality criteria required by the mechanical simulator.
Fig. 6. Hydro-mechanical model applied for the hydro-mechanical assessment. Five discrete faults and ten lithological units are implemented. Vertical exaggeration factor is 10.
Figure 6 illustrates that the horizontal element size is smallest in the central part of the hydro-mechanical model around the injection well (22 km x 25 km) with 200 m x 200 m and increases towards the model boundaries up to a maximum of 1,600 m x 1,600 m. In total, the model is discretized by 1,640,912 elements (nx = 182, ny = 196, nz = 46), whereby 4,943 elements represent the fault zones using the FLAC3D ubiquitous joints model. Ubiquitous joints are based on a weak plane model introduced in the FLAC3D Mohr-Coulomb plastoelastic model with an orientation that corresponds to the dip angle and direction of the respective fault at the given element location [11,24,25]. The model conversion from the Petrel to the TOUGH2-MP/ECO2N and FLAC3D packages was carried out as discussed by Nakaten and Kempka [26].
Table 1 lists the applied parameters for carrying out the hydro-mechanical simulation runs. According to Kempka et al. [24], a strike-slip faulting regime (SHmax > Sv > Shmin) with SHmax = 1.3 Sv was selected as initial stress state at the Vedsted site. The model is initialized with a free top surface boundary and zero displacement normal to the bottom and lateral boundaries. After a model equilibration considering the given stress regime, pore pressure distribution obtained from the reservoir simulations performed with TOUGH2-MP was upscaled to the hydro-mechanical model. The rock matrix and/or ubiquitous joints may react to stress changes with shear or tensile failure, which is assessed by the Mohr-Coulomb failure criterion at each computation step in the numerical simulation [24].

2886 Elena Tillner et al. / Energy Procedia 63 ( 2014 ) 2879 – 2893
Table 1. Mechanical properties derived from Kempka et al. [24] (adapted from [27,28,29]) as well as formation depths, densities, pore pressures and vertical stresses. Dilation angle is 0° for all units and 10° for the fault zones.
Lithological unit Depth (m)
Density (kg/m3)
Sv (MPa)
Pp (MPa)
Elastic modulus (GPa)
Poisson ratio (-)
Friction angle
(°)
Cohesion (MPa)
Tensile limit
(MPa)
Post Chalk Group 0 1,900 0.00 0.00 3.50 0.47 35 0.0 0.00
Chalk Group 37 2,112 0.69 0.37 13.2 0.32 30 5.0 2.35
Vedsted Formation 445 2,228 9.14 4.45 9.50 0.21 25 5.0 5.00
Frederikshavn Formation 850 2,186 18.0 8.51 10.0 0.35 25 5.0 5.00
Boerglum-Flyvbjerg Formation 1,075 2,329 22.8 10.8 9.50 0.21 25 5.0 5.00
Haldagar Formation 1,150 2,215 24.5 11.6 19.9 0.35 25 5.0 5.00
Fjerritslev Formation 1,240 2,362 26.5 12.5 19.9 0.21 25 5.0 5.00
Gassum Formation 1,825 2,298 40.0 18.8 19.9 0.35 25 5.0 5.00
Skagerrak Formation 2,138 2,415 47.1 22.2 24.9 0.22 24 5.0 8.30
Model basement >5,000 2,700 60.0 0.19 30 5.0 5.00
Faults zones 20 0.0
Figure 7 shows the vertical displacements after 40 years of simulation assuming open faults. The maximum vertical
displacement at the Gassum Formation top is 6.1 cm and 21 cm at the ground surface, close to the injection well located at the top of the anticline structure. It is obvious that the calculated vertical displacements appear almost radial symmetric around the injection well. At the ground surface, a region with a radius of 20 km around the injection well is affected by the induced uplift.
Fig. 7. Vertical displacements at the Gassum Formation top (left) and ground surface (right) after 40 years, assuming hydraulically open faults.
The maximum vertical displacement assuming closed faults is 7.9 cm at the reservoir top and 26 cm at the ground surface after 40 years of CO2 injection (Figure 8). However, due to the fact that the majority of the faults is located west of the injection, vertical displacements do not appear radial symmetric around the injection well, but rather in

Elena Tillner et al. / Energy Procedia 63 ( 2014 ) 2879 – 2893 2887
northern, southern and eastern direction. At the ground surface, vertical displacements are still observed about 18 km from the injection well.
Fig. 8. Vertical displacements at the Gassum Formation top (left) and ground surface (right) after 40 years, assuming hydraulically closed faults.
Figure 9 illustrates the slip and dilation tendencies at all fault planes after 40 years of simulation. Neither fault slip, nor dilation as a potential consequence of slip is to be expected during the investigated time span. Both tendencies remained identical to those prior to CO2 injection and resulting pore pressure elevation.
Fig. 9. Slip (left) and dilation tendency (right) after 40 years assuming hydraulically open faults. A value of 1 indicates the likely occurrence of slip/dilation, whereas a value of 0 indicates that slip/dilation is unlikely.

2888 Elena Tillner et al. / Energy Procedia 63 ( 2014 ) 2879 – 2893
2.3. Imperial College London (ICL) Simulation Strategy
Prior to the hydro-mechanical simulations for the assessment of ground surface uplift and storage integrity, a dynamic reservoir model was implemented based on the structural geological model presented in Section 2.1. Subsequently, reservoir flow simulations were performed using the commercial code ECLIPSE. For mechanical simulations using the VISAGE software package, the reservoir model was extended downward and laterally as discussed before. Then the augmented reservoir model was imported back into the ECLIPSE simulation model for computation of injection induced pore pressure changes at selected time steps, which were then used as input for the hydro-mechanical simulations.
2.3.1. Dynamic flow simulations and results
For dynamic reservoir flow simulation the static regional-scale model as presented in Section 2.1 with an areal size of 50 km x 50 km x 2.4 km is used. The model includes all overburden layers above the Gassum Formation up to the ground surface and one basement layer. It is discretized by a total number of 1,187,500 regular grid elements (nx = 250, ny = 250; nz = 19), each with an lateral dimension of 200 m x 200 m. In vertical direction, the first ten layers represent the overburden, whereas layers 11 to 18 comprise the Gassum Formation and layer 19 the basement layer.
The overburden and basement layers are assumed almost impermeable with a very low permeability of 0.0001 mD. The simulations were carried out using ECLIPSE 100, a black-oil simulator capable of handling up to four phases, whereby the fluid properties of CO2 are assigned to the gas phase and brine properties to the oil phase, respectively. It is assumed that the injection well is completed in all layers of the proposed reservoir (Gassum Formation). The five northwest-southeast trending vertical faults (Figure 2) where implemented into the static regional-scale model during the gridding process and treated as hydraulically closed for cross-fault flow in the dynamic reservoir flow simulations. Hydraulically open faults were not taken into account in the present strategy, as the focus was on identifying the mechanical response to the greatest pore pressure increase under the given assumptions. The maximum pore pressure increase can be expected, if faults are closed, and thus introducing a reservoir compartmentalization.
The simulation results show that the bottomhole pressure (BHP) increases almost immediately after the injection start by a factor of 1.6 from the initial pressure of 22.6 MPa up to a maximum of 37.1 MPa (Figure 10).
Fig. 10. Development of the BHP (bottomhole pressure) and WBP (wellblock pressure) for hydraulically closed faults.

Elena Tillner et al. / Energy Procedia 63 ( 2014 ) 2879 – 2893 2889
Pressure subsequently decreases down to 33.4 MPa and starts to increase again after 1.5 years up to 34.4 MPa at the end of the simulation after 40 years. The wellblock pressure (WBP) increases less sharply, but on contrary to the bottomhole pressure continuously during the entire injection period and reaching a value of 32.7 MPa after 40 years.
Figure 11 (left) illustrates that the pressure elevation after 40 years is restricted to the near-well area with a maximum of 11.8 MPa at the injection well and zero pressure build-up at the model boundaries, respectively. As Figure 11 (left) shows, hydraulically closed faults lead to a higher pore pressure increase by about 8 MPa on the eastern side of Fault 3, facing the injection well compared to a pore pressure increase of 4 MPa west of Fault 3.
Fig. 11. Pore pressure increase in the storage formation (left) and propagation of the CO2-rich phase in the reservoir (right) after 40 years, assuming hydraulically non-conductive faults.
The CO2-rich phase migrates preferentially to the anticline top due to buoyancy effects. Figure 11 (right) shows the gaseous CO2 extent after 40 years. At this time, the CO2 has already reached the western part of Fault 3 at the anticline top. Nevertheless, compared to the pressure build-up in the storage formation, a much smaller domain is affected by the CO2 extent.
2.3.2. Geomechanical simulations and results
For computational reasons, a coarser model than that applied for flow simulations with ECLIPSE including the Gassum Storage Formation, the overburden up to the ground surface as well as one basement layer were introduced into the hydro-mechanical model. Therefore, the regional-scale model as described in Section 2.3.1 was reduced to a total number of 234,375 elements (nx = 125, ny = 125, nz = 15), each with an lateral dimension of 400 m x 400 m, by merging different overburden layers. However, the vertical resolution of the storage reservoir (Gassum Formation) and its overlying caprock (Fjerritslev Formation) remained unchanged. The hydro-mechanical model was set up in VISAGE by embedding the coarsened reservoir model in a much larger domain in order to minimize the influence of model boundaries on pressure, and thus on stress changes. The vertical stress (Sv) prior to CO2 injection was assumed to be determined by overlying rock load and calculated using an average rock density of 2,318 kg/m3 derived from available sonic log measurements. Table 2 lists the rock elastic properties and strength parameters assigned to the different lithological units.

2890 Elena Tillner et al. / Energy Procedia 63 ( 2014 ) 2879 – 2893
Table 2. Densities and mechanical properties of the lithological units used in the VISAGE based hydro-mechanical model. Properties for the first lithological unit were taken from Bell [28], while the properties for the remaining units were obtained from Goodman [30].
Lithological unit Density (kg/m3)
Elastic modulus (GPa)
Poisson ratio (-)
Friction angle (°)
Cohesion BC (UC) (MPa)
Post Chalk Group & Chalk Group 2,318 11.0 0.32 30 0.0 (2.6)
Vedsted Formation 2,318 8.50 0.27 15 0.0 (4.0)
Frederikshavn Formation 2,318 8.50 0.27 15 0.0 (4.0)
Boerglum Formation 2,318 8.50 0.27 15 0.0 (4.0)
Flyvbjerg Formation 2,318 8.50 0.27 15 0.0 (4.0)
Haldagar Formation 2,318 8.50 0.27 15 0.0 (4.0)
Fjerritslev Formation 2,318 8.50 0.27 15 0.0 (4.0)
Gassum Formation 2,318 15.0 0.32 35 0.0 (0.0)
Model basement 2,318 15.0 0.32 35 0.0 (0.0)
Abbreviations: BC = base case; UC = unfavorable case Two different scenarios with respect to the magnitude of the maximum (SHmax) and minimum (Shmin) horizontal
stresses were studied. In a base case scenario, the ratio of horizontal stresses to vertical stress is assumed to be equal to one (Sv = SHmax = Shmin = 1). An unfavorable case examines the mechanical response of a strike-slip faulting regime to the CO2 injection induced pore pressure changes (SHmax > Sv > Shmin) with SHmax = 1.2 Sv and Shmin = 0.8 Sv, which is almost identical to the strike-slip faulting stress regime applied in the GFZ simulation strategy. Potential shear failure assessment was carried out by application of the Mohr-Coulomb failure criterion subsequent to the calculation.
Figure 12 shows that the pressure build-up as described above as well as presented in Figure 10 and 11 (left) would cause a maximum vertical displacement at the top of the Gassum Formation of about 9.4 cm and a ground surface uplift of 11.8 cm under the assumption of an isostatic stress field (base case).
Fig. 12. Vertical displacements for the base case scenario after 40 years of simulation.
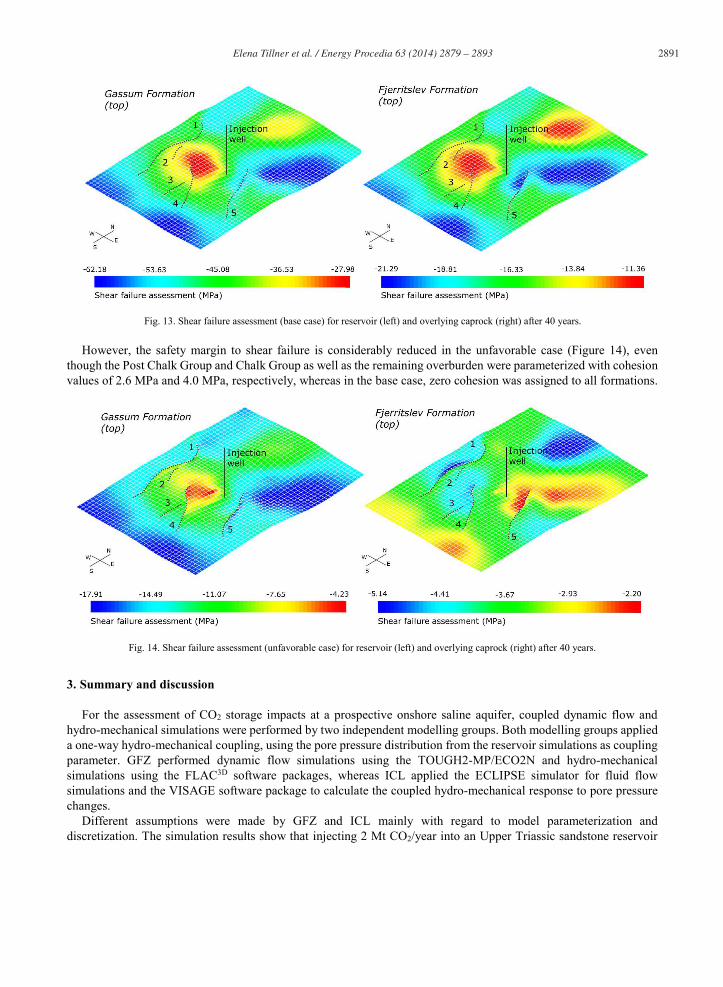
Figure 13 (base case) and 14 (unfavourable case) show the tendency of shear failure occurrence as defined by the Mohr-Coulomb failure criterion. A value equal or greater than zero indicates that shear failure occurs, whereas a value smaller than zero indicates that shear failure is not to be expected and the rock remains intact. It can be seen from the two figures that the mechanical reservoir (Gassum Formation) and caprock (Fjerritslev Formation) integrity is not compromised after 40 years of CO2 injection in both cases.
Elena Tillner et al. / Energy Procedia 63 ( 2014 ) 2879 – 2893 2891
Fig. 13. Shear failure assessment (base case) for reservoir (left) and overlying caprock (right) after 40 years.
However, the safety margin to shear failure is considerably reduced in the unfavorable case (Figure 14), even though the Post Chalk Group and Chalk Group as well as the remaining overburden were parameterized with cohesion values of 2.6 MPa and 4.0 MPa, respectively, whereas in the base case, zero cohesion was assigned to all formations.
Fig. 14. Shear failure assessment (unfavorable case) for reservoir (left) and overlying caprock (right) after 40 years.
3. Summary and discussion
For the assessment of CO2 storage impacts at a prospective onshore saline aquifer, coupled dynamic flow and hydro-mechanical simulations were performed by two independent modelling groups. Both modelling groups applied a one-way hydro-mechanical coupling, using the pore pressure distribution from the reservoir simulations as coupling parameter. GFZ performed dynamic flow simulations using the TOUGH2-MP/ECO2N and hydro-mechanical simulations using the FLAC3D software packages, whereas ICL applied the ECLIPSE simulator for fluid flow simulations and the VISAGE software package to calculate the coupled hydro-mechanical response to pore pressure changes.
Different assumptions were made by GFZ and ICL mainly with regard to model parameterization and discretization. The simulation results show that injecting 2 Mt CO2/year into an Upper Triassic sandstone reservoir
2892 Elena Tillner et al. / Energy Procedia 63 ( 2014 ) 2879 – 2893
over 40 years results in a maximum pore pressure increase by a factor between 1.45 (GFZ) and 1.6 (ICF), considering hydraulically non-conductive faults.
Assuming hydraulically conductive faults allowing for cross-fault flow would reduce the maximum pore pressure increase to a factor of 1.4. The pressure increase in the reservoir after 40 years is mainly limited to the near-well area and declines continuously towards the model boundaries. However, at a distance of at least 20 km from the injection well, pressure increase is still 0.1 MPa, and thus propagates much further than the gaseous CO2 reaching a maximum extent of 5.7 km x 5.5 km after 40 years.
The hydro-mechanical simulation results show that pore pressure elevation leads to maximum vertical displacements of 7.9 cm at the reservoir top and 26.0 cm at the ground surface after 40 years of simulation assuming closed faults (GFZ). In accordance with the maximum pressure increase, maximum vertical displacements occur close to the injection well. The maximum vertical displacement is about 1.8 cm lower at the reservoir top and 5 cm lower at the ground surface, if faults are implemented as hydraulically conductive in horizontal direction. However, open faults allow for an unhindered and more rapid pressure propagation almost radial symmetrical around the injection well. Consequently, a larger area is affected by ground surface uplift but with comparably lower vertical displacements.
ICL calculated a slightly higher vertical displacement at the top of the reservoir of 9.4 cm and a lower ground surface uplift of 11.8 cm after 40 years of simulation considering closed faults. The difference in these results occurs mainly due to varying parameterization of the two hydro-mechanical models. GFZ used a caprock permeability of 0.01 mD, whereas ICL assumed a substantially lower value of 0.0001 mD, resulting in less pressure perturbation in the caprock, and thus higher vertical displacements at the reservoir top. Furthermore, the mean weight of the overburden was determined with 2,190 kg/m3 (GFZ) and 2,318 kg/m3 (ICL), respectively. Therefore, the magnitude of the vertical stress calculated by ICL is higher, inducing a lower vertical uplift of the overburden.
In order to be able to localize potential failure, and thus fault slip at pre-defined fault planes, fault zones were implemented into the hydro-mechanical model as ubiquitous joints (GFZ). The simulation results show that neither fault slip, nor dilation is to be expected in the investigated time span, since both tendencies remained unchanged by CO2 injection.
4. Conclusions
Two modelling groups carried out independent coupled hydro-mechanical simulations to evaluate the mechanical impact at a prospective Danish CO2 storage site. Despite differing model discretization and parameterization, both modelling groups demonstrated that the mechanical reservoir, caprock and fault integrity is not compromised at any time. Major effective stress changes after 40 years of injection are limited to the injection well vicinity where the highest pressure build-up occurs. Calculated vertical displacements at the reservoir top and ground surface range between 9.4 cm - 26.0 cm depending on horizontal hydraulic fault conductivity. Furthermore, the presented implementation of fault zones into the hydro-mechanical model allows for a spatial identification of potential zones of failure on the fault plane, and thus potential leakage pathways for formation fluids.
Acknowledgements
The research leading to these results has been carried out within the SiteChar project and received funding from the European Union Seventh Framework Programme (FP7/2007-2013) under grant agreement n° 256705. The authors are very grateful for the financial support.
References
[1] Rutqvist J, Birkholzer JT, Tsang C-F. Coupled reservoir–geomechanical analysis of the potential for tensile and shear failure associated with CO2 injection in multilayered reservoir–caprock systems. Int J Rock Mech Min 2008; 45(2): 132–143.
[2] Cappa F, Rutqvist J. Modeling of coupled deformation and permeability evolution during fault reactivation induced by deep underground

Elena Tillner et al. / Energy Procedia 63 ( 2014 ) 2879 – 2893 2893
injection of CO2. Int J Greenh Gas Con 2012; 5: 336–346. [3] Rutqvist J, Birkholzer J, Cappa F, Tsang CF. Estimating maximum sustainable injection pressure during geological sequestration of CO2
using coupled fluid flow and geomechanical fault-slip analysis. Energ Convers Manage 2007; 48: 1798–1807. [4] Röhmann L, Tillner E, Magri F, Kühn M, Kempka T. Fault Reactivation and Ground Surface Uplift Assessment at a Prospective German CO2
Storage Site. Energy Procedia 2013; 40: 437–446. doi: 10.1016/j.egypro.2013.08.050. [5] Magri F, Tillner E, Wang W, Watanabe N, Zimmermann G, Kempka T. 3D Hydro-mechanical Scenario Analysis to Evaluate Changes of the
Recent Stress Field as a Result of Geological CO2 Storage. Energy Procedia 2013; 4: 375–383. doi: 10.1016/j.egypro.2013.08.043. [6] Vidal-Gilbert S, Nauroy JF, Brosse E. 3D geomechanical modelling for CO2 geologic storage in the Dogger carbonates of the Paris Basin. Int
J Greenh Gas Con 2009; 3: 288-299. [7] Schlumberger 2007. ECLIPSE 100, Schlumberger Information Solutions. [8] Zhang K, Wu YS, Pruess K. User’s Guide for TOUGH2-MP –A Massively Parallel Version of the TOUGH2 Code. Report LBNL-315E,
2008; Earth Sciences Division, Lawrence Berkeley National Laboratory, Berkeley, California. [9] Pruess K. ECO2N: A TOUGH2 Fluid Property Module for Mixtures of Water, NaCl, and CO2. Report LBNL-57952, 2005; Lawrence
Berkeley National Laboratory, Berkeley, California. [10] Schlumberger 2010. VISAGETM 2010, Schlumberger Information Solutions. [11] Itasca 2012. FLAC3DTM – Fast Lagrangian Analysis of Continua in 3 Dimensions. User’s Manual. [12] Mbia EN, Frykman P, Nielsen CM, Fabricius IL, Pickup GE, Sørensen AT. Modeling of the pressure propagation due to CO2 injection and
the effect of fault permeability in a case study of the Vedsted structure, Northern Denmark. Int J Greenh Gas Con 2014; 28: 1–10. [13] Tillner E, Kempka T, Nakaten B, Kühn M. Brine migration through fault zones: 3D numerical simulations for a prospective CO2 storage site
in Northeast Germany. Int J Greenh Gas Con 2013; 19: 689–703. doi: 10.1016/j.ijggc.2013.03.012. [14] Hijmans RJ, Guarino L, Mathur P. DIVA-GIS Version 7.5 Manual. 2012; Website http://www.diva-gis.org. [15] Nielsen LH. Late Triassic – Jurassic development of the Danish Basin and the Fennoscandian Border Zone, southern Scandinavia. In: Ineson
JR, Surlyk F, editors. The Jurassic of Denmark and Greenland. Geological Survey of Denmark and Greenland Bulletin 2003; 1: 459–526. [16] Dalhoff F, Klinkby L, Sørensen AT, Bernstone C, Frykman P, Andersen C, Christensen NP. CCS demo Denmark: The Vedsted case. Energy
Procedia 2011; 4: 4704–4710. [17] Frykman P, Nielsen CM, Dalhoff F, Sørensen AT, Klinkby L, Nielsen LH. Geological modelling for site evaluation at the Vedsted structure,
NW Denmark. Energy Procedia 2011; 4: 4711–4718. [18] Frykman P, Bech N, Sørensen AT, Nielsen LH, Nielsen CM, Kristensen L, Bidstrup T. Geological modeling and dynamic flow analysis as
initial site investigation for large-scale CO2 injection at the Vedsted structure, NW Denmark. Energy Procedia 2009; 1(1): 2975–2982. [19] Rutqvist J. Status of the TOUGH-FLAC simulator and recent applications related to coupled fluid flow and crustal deformations. Comput
Geosci, 2011; 37(6): 739–750. [20] Rutqvist J, Wu Y-S, Tsang C-F, Bodvarsson G. A modeling approach for analysis of coupled multiphase fluid flow, heat transfer, and
deformation in fractured porous rock. Int J Rock Mech Min 2002; 39(4): 429–442. [21] Schlumberger 2012. Petrel Seismic-to-Evaluation Software, Version 2011.1, Schlumberger Information Solutions. [22] Britze P, Japsen P. Geological map of Denmark 1:400,000. The Danish Basin. “Top Zechstein” of the Triassic (two-way traveltime and
depth, thickness and interval velocity). Geological Survey of Denmark Map Series 1991; 31: 4 maps and 4 pp. [23] Larsen M, Bidstrup T, Dalhoff F. CO2 storage potential of selected saline aquifers in Denmark. Danmarks og Grønlands Geologiske
Undersøgelse Rapport 2003; 39: 83 pp. [24] Kempka T, Nielsen CM, Frykman F, Shi JQ, Bacci G, Dalhoff F. Coupled Hydro-Mechanical Simulations of CO2 Storage Supported by
Pressure Management Demonstrate Synergy Benefits from Simultaneous Formation Fluid Extraction. Oil Gas Sci Technol 2014; doi: 10.10501/ogst/2014029, published online 07.2014.
[25] Jiang D, Williams P, Carter B. Numerical modeling of the development of kink-bands in anisotropic plastic materials. In: (eds.) Köhn D, Malthe-Sørenssen A. Numerical Modeling of Microstructures, Journal of the Virtual Explorer 2004; Electronic Edition, 15, Paper No. 4.
[26] Nakaten B, Kempka T. Workflow for fast and efficient integration of Petrel-based fault models into coupled hydro-mechanical TOUGH2-MP - FLAC3D simulations of CO2 storage. Energy Procedia 2014 (this issue).
[27] Ouellet A, Bérard T, Frykman P, Welsh P, Minton J, Pamucku Y. Reservoir geomechanics case study of seal integrity under CO2 storage conditions at Ketzin, Germany. Ninth Annual Conference on Carbon Capture and Sequestration 2010; 10-13 May.
[28] Bell FG. A note on the physical properties of chalk. Eng Geol 1977; 11: 217–225. [29] Nagelhout ACG, Roest JPA. Investigating fault slip in a model of an underground gas storage facility. Int J Rock Mech Min 1997; 34(3-4):
Paper No. 212. [30] Goodman, RE. Introduction to rock mechanics. 2nd ed. John Wiley and Sons; 1989. 562 pp.