task 1: task 4: xrct piv lb tough2
TRANSCRIPT

1 | US DOE Geothermal Office eere.energy.gov
Public Service of Colorado Ponnequin Wind Farm
Geothermal Technologies Office 2013 Peer Review
An integrated experimental and numerical study: Developing a reaction transport model that couples chemical reactions of mineral dissolution / precipitation with spatial and temporal flow variations in CO2/brine/rock systems
Principal Investigator: Martin Saar Department of Earth Sciences University of Minnesota Track Name: Resource Characterization, Modeling, Supercritical CO2 / Rock Chemical Interactions
Total Project Funding: $1,937,523 ($1,550,018 from DOE-GTP)
This presentation does not contain any proprietary confidential, or otherwise restricted information. Mandatory slide
April 23, 2013, 9:30-10:00am
R&D Project
Supercritical CO2 / Rock Chemical
Interactions
Task 1: Experiments
Task 3: PIV
Task 2: XRCT
Task 4: LB
Task 5: TOUGH2

2 | US DOE Geothermal Office eere.energy.gov
Relevance/Impact of Research
Project Outcome: This project will result in a numerical simulator (modified version of TOUGH2) that can adjust porosity and permeability fields according to experimentally observed chemical fluid-rock interactions (mineral dissolution or precipitation) under realistic conditions likely found when water or (supercritical) CO2 is injected into geothermal reservoirs for heat energy extraction. Relevance/Impact: The simulator can thus help determine if CO2 injection into EGS brines will cause clogging of pore spaces or dissolution of host rocks with potentially detrimental consequences to heat extraction. As a result, this simulator will play a critical role when assessing long-term sustainability of geothermal energy utilization in enhanced and natural geothermal systems. The simulator can also be used to evaluate long-term CO2 sequestration potentials.
General Research Topic/Goal and impact on GTP’s goals: This project applies to the DOE Geothermal Technologies Program’s Multi-Year Research, Develop-ment, and Demonstration (MYRDD) plan as the research would further the development and commercial operation of an enhanced geothermal system (EGS) resource through investigation of Topic 14 of FOA DE-PS36-09GO99018. In particular, the proposed study would address issues related to geothermal reservoir sustainability. The goal of “Reservoir Sustainability,” as outlined in MYRDD’s Technical Plan, is to “Develop the ability to manage EGS reservoirs for maintenance of reservoir lifetime and productivity.” Our proposed study would address the two tasks listed in Table 4.29 (Page 75) of MYRDD’s “Reservoir Sustainability” section, i.e., “Stimulation and management of created reservoir” and “Maintaining fluid flow and reservoir lifetime.” These tasks would be achieved via the approach listed in Table 4.29 entitled “Improve understanding of rock-fluid geochemistry for scale and dissolution prediction.”
Weight: 20%

3 | US DOE Geothermal Office eere.energy.gov
Scientific/Technical Approach Weight: 30%
Reactive flow modeling of CO2 injection into subsurface brines
Permeability change flow velocity field change
TOUGH- REACT
Task 1: Laboratory experiments with supercritical CO2, brine, rock. Measure fluid chemistry and bulk rock/sediment permeability changes over time
Task 2: X-Ray Computed Tomography (XRCT) before and after experiments Measure 3D pore space geometry change due to mineral/fluid reactions
Task 3: PIV experiments of multiphase fluid flow and interactions with solid boundaries Validate LB code
Task 4: Extend lattice-Boltzmann (LB) fluid flow code (LBHydra) and use 3D XRCT images in simulations Determine 3D flow field change due to reactive pore space geometry and Related permeability changes.
Task 5: Parameterize permeability changes due to reactive flow experiments. Enables TOUGH2 simulations of permeability and related flow velocity field change for the reactive flow conditions experimentally investigated (fluid/mineral composition, P, T).
conv
entio
nal a
ppro
ach
4 | US DOE Geothermal Office eere.energy.gov
Scientific/Technical Approach
Task 1 Weight: 30%
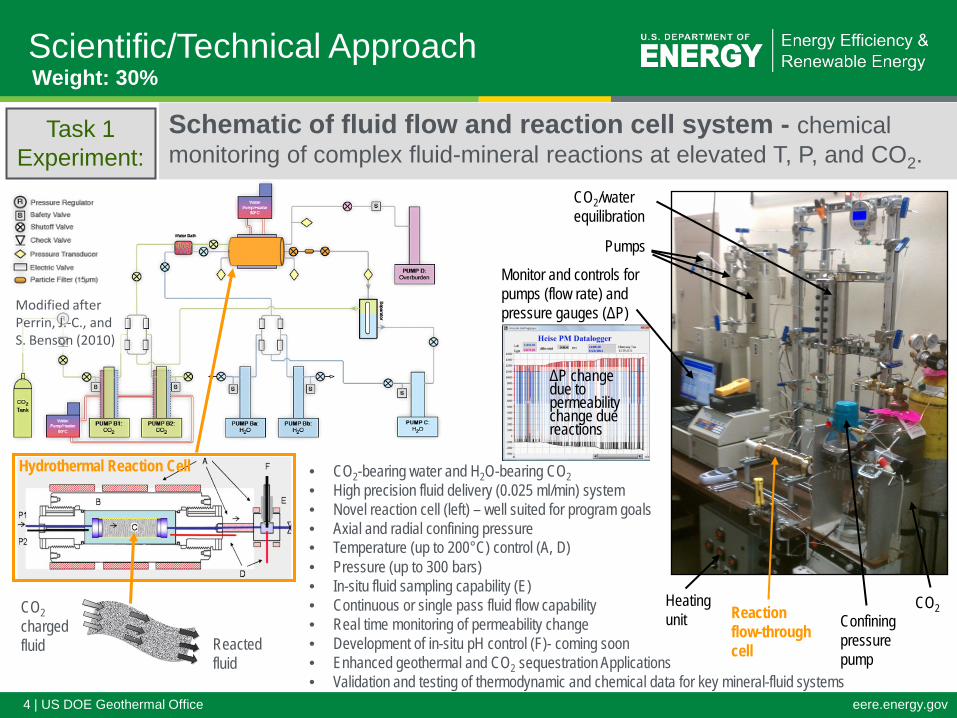
Hydrothermal Reaction Cell • CO2-bearing water and H2O-bearing CO2 • High precision fluid delivery (0.025 ml/min) system • Novel reaction cell (left) – well suited for program goals • Axial and radial confining pressure • Temperature (up to 200°C) control (A, D) • Pressure (up to 300 bars) • In-situ fluid sampling capability (E) • Continuous or single pass fluid flow capability • Real time monitoring of permeability change • Development of in-situ pH control (F)- coming soon • Enhanced geothermal and CO2 sequestration Applications • Validation and testing of thermodynamic and chemical data for key mineral-fluid systems
Modified after Perrin, J.-C., and S. Benson (2010)
Task 1 Experiment:
Schematic of fluid flow and reaction cell system - chemical monitoring of complex fluid-mineral reactions at elevated T, P, and CO2.
Pumps
CO2/water equilibration
Reaction flow-through cell
CO2 Confining pressure pump
Heating unit
Monitor and controls for pumps (flow rate) and pressure gauges (ΔP)
CO2 charged fluid Reacted
fluid
ΔP change due to permeability change due reactions

5 | US DOE Geothermal Office eere.energy.gov
Scientific/Technical Approach
Drop Generator
Cameras
Beam Expander Tank
Laser Mirror
1) Sequences of fluid motion (e.g. interface, bulk drop) are
captured at high repetition rate using high speed cameras. 2) Temporal deformation of interface or drop under different
conditions can be compared with results from LB code. 3) Time series of volumetric velocity fields are acquired using 3D
tomographic PIV (TPIV). 4) Velocity obtained simultaneously in two immiscible fluids by
matching refractive indices (likely 1st time as TPIV worldwide).
Weight: 30%
Task 3 PIV:
Tomographic Particle Image Velocimetry (TPIV) setup
Multiphase flow through porous media CO2
brine
-Study simple test cases
-Study effects of parameters on flow behavior
-Use PIV and analog fluids to test LB code (then use LB code to run simulations with CO2 and brine)
Complicated! (moving contact lines, wide range of scales, …)
thus
Fluid I g Fluid II
Solid
6 | US DOE Geothermal Office eere.energy.gov
Scientific/Technical Approach Weight: 30%
2 panels to the right: Walsh
et al., 2009
Task 4 LB:
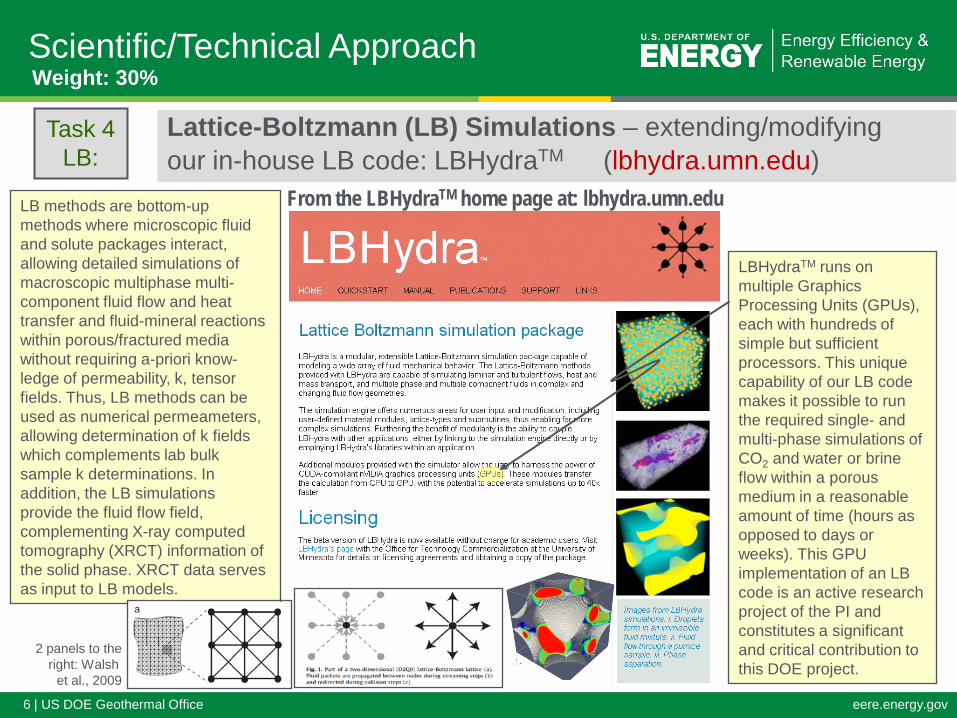
Lattice-Boltzmann (LB) Simulations – extending/modifying our in-house LB code: LBHydraTM (lbhydra.umn.edu)
From the LBHydraTM home page at: lbhydra.umn.edu
LBHydraTM runs on multiple Graphics Processing Units (GPUs), each with hundreds of simple but sufficient processors. This unique capability of our LB code makes it possible to run the required single- and multi-phase simulations of CO2 and water or brine flow within a porous medium in a reasonable amount of time (hours as opposed to days or weeks). This GPU implementation of an LB code is an active research project of the PI and constitutes a significant and critical contribution to this DOE project.
LB methods are bottom-up methods where microscopic fluid and solute packages interact, allowing detailed simulations of macroscopic multiphase multi-component fluid flow and heat transfer and fluid-mineral reactions within porous/fractured media without requiring a-priori know-ledge of permeability, k, tensor fields. Thus, LB methods can be used as numerical permeameters, allowing determination of k fields which complements lab bulk sample k determinations. In addition, the LB simulations provide the fluid flow field, complementing X-ray computed tomography (XRCT) information of the solid phase. XRCT data serves as input to LB models.

7 | US DOE Geothermal Office eere.energy.gov
• Design and testing of experimental system highly successful • Permeability tests completed at 25<T<150°C and CO2 saturation at 200 bars for arkose and dolostone
samples and beginning to test basalt samples (have now found basalt samples with sufficient permeability) • Sampling of fluid chemistry with simultaneous measurement of permeability on-going with arkosic
sandstone with moderately high permeability (so far at T=100, 125, and 150°C). • Modeling of geochemical data indicates importance of kinetic processes • CO2 saturated source fluid (100-130 bar) acidic but with no buffer capacity. Thus, incipient reaction results
in a significant pH increase and mineral saturation. • In-situ pH sensor indicate viability for real time measurement of pH at elevated temperatures and
pressures.
Task 1 Experiment:
Permeability Test of Mineral Simulant at 25°C: Data Show that even Unusually Low Permeability Geochemical Systems can be Studied
2.00E-009 4.00E-009 6.00E-0090
100000
200000
300000
400000
500000
600000
DIW-CO2liq at 22oC-195 barsconf-100 barsout 03152011 - 40 u Ceramic grain
P dr
op (P
a)
Flow Rate (m3/s)
Equat i on y = a + b*x
Wei ght No Wei ght i ng
Resi dual Sum of Squar es
4. 59643E7
Adj . R- Squar e 0. 99962
Val ue St andar d Er r or
P dr opI nt er cept - 16571. 42857 2562. 48444
Sl ope 8. 44118E13 6. 74105E11
Permeability k(t) = 3.4652x10⁻¹⁵m2
pCO2= 100 bar, k = 3.46-15m2
150°C Arkose Experiment: Real Time Fluid Flow Rate, ΔP, and Permeability Data
3 4 5 6 7
-4000
-2000
0
2000
4000
6000
8000
10000
12000
14000
16000
0.25
ml/m
in
0.20
ml/m
in
0.15
ml/m
in
0.10
ml/m
in
0.05
ml/m
in
KPa
hours
05232011 90-120 µm core
DIW-CO2liqat 150oC-120 bars-200 barsconf.
in flow
out flow
P drop0.20
0.25
1.00E-009 2.00E-009 3.00E-009 4.00E-0090
500
1000
1500
2000
2500
3000
3500
P dr
op (K
Pa)
Flow Rate (m3/sT,P)
Equat i on y = a + b*x
Wei ght No Wei ght i ng
Resi dual Sum of Squar es
7173. 91345
Adj . R- Squar e 0. 99478Val ue St andar d Er r or
P dr opI nt er cept 57. 436 73. 35145Sl ope 6. 94394E11 2. 90182E10
05232011 90-120 µm coreDIW-CO2
liqat 150oC-120 bars-200 barsconf.
k(t) = 8.0561 x 10⁻¹⁴ m2
Confining pressure = 200 bars, pCO2= 120 bars
Accomplishments, Results & Progress Weight: 40%
Initial (25°C) permeability = ~10-11m2
Final (150°C) permeability = 8x10-14m2 (after some reactions)

8 | US DOE Geothermal Office eere.energy.gov
Basalt core drilled from a piece of Columbia River Basalt collected in Washington. XRCT scans before and after flow-though carbon sequestration experiments are used to document changes in pore space geometries produced by mineral dissolution and/or precipitation. Sample size is approximately 0.5 in X 1 in.
Figure below: Dissolution channel developed in dolostone core exposed to flowing brine with dissolved CO2. Yellow dissolution channel illustrates the network of connected pore space mapped using post-experiment XRCT scans. One molal NaCl brine with a CO2 concentration of 0.6 mol/kg H2O flows from left to right. Core is 1.3 cm in diameter and 2.5 cm long. The dissolution channel penetrated 1.4 cm of the core’s length over 6.1 hours of fluid flow through the core. Permeability was measured with increasing from 4.3 × 10⁻¹⁶ m2 to 1.4 × 10⁻¹⁵ m2 because of the development of a dissolution channel. Pre- and post-experiment XRCT scans were used to show that pore volume increased from 139.0 mm3 to 212.1 mm3, pore surface area increased 0.0200 m2 from to 0.0224 m2, porosity increased from 5.75% to 6.37%, and specific surface area (pore surface area to pore volume) decreased from 1.436 × 10⁵ m-1 to 1.057 × 10⁵ m-1.
Figure below: Permeability, k, fields are numerically determined by numerical simulations of equilibrium fluid flows through the dolostone samples using lattice-Boltzmann method. (a) Permeability fields (in m2) of a Representative Elementary Volume (REV) along the connected channel of the dolostone sample. This REV has a size of around 1 × 1 × 1 mm3, which is a portion of the connected channel from Fig.1 (b). The velocity field at equilibrium status of a micro-channel in the sub-REV scale, which has a size of 200 × 120 × 80 µm3.
Permeability, k, field, where Each k value is determined For one Representative Elementary Volume (REV) Shown on the right.
One Representative Elementary Volume (REV).
Dissolution Channel Determined from Before XRCT images From before and after Reactive flow.
Accomplishments, Results & Progress Weight: 40%
Tasks 1 & 2 Exp., XRCT
Reactive flow-through experiments and X-Ray Computed Tomography (XRCT) before and after experiments

9 | US DOE Geothermal Office eere.energy.gov
Accomplishments, Results & Progress Weight: 40%
Tasks 1 & 2 Exp., XRCT
Reactive flow-through experiments and X-Ray Computed Tomography (XRCT) before and after experiments
Dolostone dissolution
Intermediate Q Exp. Flow rate: 0.1 ml/min
Volume injected: 37 ml Initial k: 4.3 10-16 m2 Final k: 1.4 10-15 m2
High Q Exp. Flow rate: 1 ml/min
Volume injected: 61 ml Initial k: 3.5 10-16 m2
Final k: 3.1 10-15 m2
Low Q Exp. Flow rate: 0.01 ml/min
Volume injected: 127 ml Initial k: 3.8 10-16 m2 Final k: 1.8 10-15 m2
Heated Sediment Exp.
Luhmann, A.J., X.-Z. Kong, B.M. Tutolo, K. Ding, M.O. Saar, and W.E. Seyfried, Jr. 2012. Permeability reduction produced by grain reorganization and accumulation of exsolved CO2 during geologic carbon sequestration: A new CO2 trapping mechanism. Environmental Science & Technology. 47(1):242-251.
Heated Rock Exp. Arkose
For explanation of results, see:

10 | US DOE Geothermal Office eere.energy.gov
PIV Experiments
Tasks 3,4 PIV, LB:
Drop flow through orifice as simple analogue to multiphase
CO2
brine
D d
a) Aspect ratio =
c) Surface wetting
b) Reynolds # =
Hydrophobic (Draining)
Analog for CO2 drop (non- wetting) displacing brine
105°
Silicone oil
Acrylic
Water/glycerin
d/D = 1.0
d/D = 0.75
Effect of Aspect Ratio,d/D, with ReD=13.5, hydrophobic
flow through a porous medium
Effect of Reynolds #, Re with d/D ~ 0.75, hydrophobic
Re = 12.5
Re = 19
Accomplishments, Results & Progress Weight: 40%
LB simulation Of Re=13.5 And d/D=0.75
Bordoloi, A., Longmire, E.K. 2012. Effects of surface wettability and edge geometry on drop motion through an orifice. Am. Phys. Soc. Meeting, 2012. Bordoloi, A.D. and Longmire, E.K. 2012. Effect of neighboring perturbations on drop coalescence at an interface. Physics of Fluids. 24(062106):1-21.
Hydrophobic (Draining)
11 | US DOE Geothermal Office eere.energy.gov
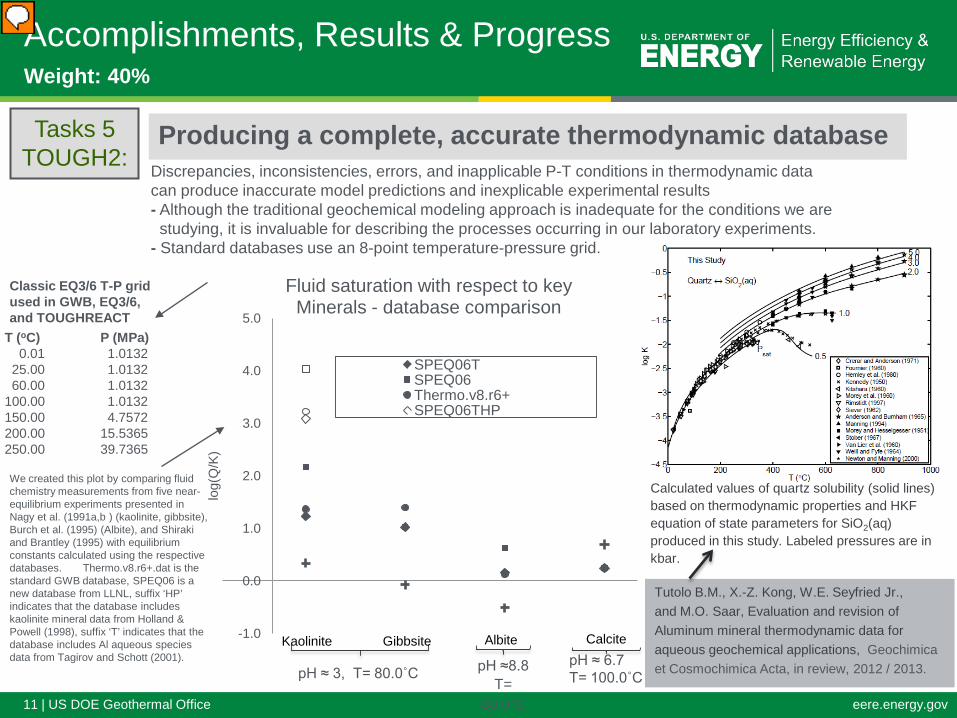
Discrepancies, inconsistencies, errors, and inapplicable P-T conditions in thermodynamic data can produce inaccurate model predictions and inexplicable experimental results - Although the traditional geochemical modeling approach is inadequate for the conditions we are studying, it is invaluable for describing the processes occurring in our laboratory experiments. - Standard databases use an 8-point temperature-pressure grid.
Tasks 5 TOUGH2:
Accomplishments, Results & Progress Weight: 40%
Producing a complete, accurate thermodynamic database
-1.0
0.0
1.0
2.0
3.0
4.0
5.0
log(
Q/K
)
Fluid saturation with respect to key Minerals - database comparison
SPEQ06T SPEQ06 Thermo.v8.r6+ SPEQ06THP
Kaolinite Gibbsite Albite Calcite
pH ≈ 3, T= 80.0˚C pH ≈ 6.7 T= 100.0˚C
pH ≈8.8 T=
80.0˚C
T (oC) P (MPa) 0.01 1.0132 25.00 1.0132 60.00 1.0132 100.00 1.0132 150.00 4.7572 200.00 15.5365 250.00 39.7365
Classic EQ3/6 T-P grid used in GWB, EQ3/6, and TOUGHREACT
We created this plot by comparing fluid chemistry measurements from five near-equilibrium experiments presented in Nagy et al. (1991a,b ) (kaolinite, gibbsite), Burch et al. (1995) (Albite), and Shiraki and Brantley (1995) with equilibrium constants calculated using the respective databases. Thermo.v8.r6+.dat is the standard GWB database, SPEQ06 is a new database from LLNL, suffix ‘HP’ indicates that the database includes kaolinite mineral data from Holland & Powell (1998), suffix ‘T’ indicates that the database includes Al aqueous species data from Tagirov and Schott (2001).
Tutolo B.M., X.-Z. Kong, W.E. Seyfried Jr., and M.O. Saar, Evaluation and revision of Aluminum mineral thermodynamic data for aqueous geochemical applications, Geochimica et Cosmochimica Acta, in review, 2012 / 2013.
Calculated values of quartz solubility (solid lines) based on thermodynamic properties and HKF equation of state parameters for SiO2(aq) produced in this study. Labeled pressures are in kbar.

12 | US DOE Geothermal Office eere.energy.gov
Tasks 5 TOUGH2:
TOUGH2 Simulations: Effects of permeability heterogeneity on density driven con-vection during CO2 injection into saline aquifers. (manuscript in prep.)
Accomplishments, Results & Progress Weight: 40%
permeability (m2)
mass fraction CO2
(m)
(m) (m)
(m) (m)
(m) (m)
(m)
(m) (m)
(m)
(m)

13 | US DOE Geothermal Office eere.energy.gov
Accomplishments, Results and Progress
Mandatory- may utilize multiple slides
Original Planned Milestone/Technical Accomplishment
Actual Milestone/Technical Accomplishment
Date Completed
Task 1: Laboratory experiments with supercritical CO2, brine, rock. Measure fluid chemistry and bulk rock/sediment permeability change over time Task 1 is scheduled to occur throughout the grant duration. Task 2: X-Ray Computed Tomography (XRCT) before and after experiments Measure 3D pore space geometry change due to mineral/fluid reactions Task 2 is scheduled to occur throughout the grant duration.
--------------------------- Task 3: PIV experiments of multiphase fluid flow and interactions with solid boundaries to validate LB code Task 4: Extend lattice-Boltzmann (LB) fluid flow code (LBHydra) and use 3D XRCT images in simulations -------------------------------------------- Task 5: TOUGH2 simulations, Parameterize permeability changes due to reactive flow experiments, Thermodynamic data base assessment
Luhmann, A.J., X.-Z. Kong, B.M. Tutolo, K. Ding, M.O. Saar, and W.E. Seyfried, Jr. 2012. Permeability reduction produced by grain reorganization and accumulation of exsolved CO2 during geologic carbon sequestration: A new CO2 trapping mechanism. Environmental Science & Technology. 47(1):242-251. Luhmann, A.J., X.-Z. Kong, B.M. Tutolo, M.O. Saar, and W.E. Seyfried, Jr. 2012. Physical and chemical processes affecting permeability during geologic carbon sequestration in arkose and dolostone: Experimental observations. Abstract H32A-07. Fall Meeting, AGU, 2012. Kong, X.-Z., B.M. Tutolo, A.J. Luhmann, M.O. Saar, and W.E. Seyfried, Jr. 2012. Characterization of permeability fields and fluid flow through rock core during CO2 sequestration. Abstract H23E-1422. 2012 Fall Meeting, AGU, 2012. Tutolo, B.M., A.J. Luhmann, X.-Z. Kong, M.O. Saar, and W.E. Seyfried, Jr. 2012. Linking pore-scale chemical processes to continuum-scale flow properties: An experimental and theoretical reactive transport approach. Abstract H23E-1425. Fall Meeting, AGU, 2012. Luhmann, A.J., B.M. Tutolo, X.-Z. Kong, K. Ding, M.O. Saar, and W.E. Seyfried, Jr. 2012. Permeability change from CO2 injection: Experimental considerations. 2012 Goldschmidt Meeting, Montreal, Canada, 2012. Tutolo, B.M., A.J. Luhmann, X.-Z. Kong, M.O. Saar, and W.E. Seyfried, Jr. 2012. Evaluating permeability change due to altered pore geometry in CO2 sequestration systems. 2012 Goldschmidt Meeting, Montreal, Canada, 2012. Kong, X. and M.O. Saar. 2011. Effects of permeability heterogeneity on density-driven convection during CO2 dissolution storage in saline aquifers. Abstract H21C-1121 Fall Meeting, 2011. Luhmann, A.J., K. Ding, M.O. Saar and W.E. Seyfried, Jr. 2011. Effects of small-scale chemical reactions between supercritical CO2 and arkosic sandstone on large-scale permeability fields: An experimental study with implications for geologic carbon sequestration. Abstract H51G-1261. AGU 2011 Fall Meeting, San Francisco, CA. ------------------------------------------------------------------------------------------------------------------------------------------------------------------------------------- Bordoloi, A.D. and Longmire, E.K. 2013. Parametric study of drop motion through an axisymmetric orifice. 8th International Conference on Multiphase Flow. Jiju, South Korea. 26-31 May 2013. Bordoloi, A., Longmire, E.K. 2012. Effects of surface wettability and edge geometry on drop motion through an orifice. American Physical Society. 65th Annual Meeting, San Diego, Nov 2012. Bordoloi, A.D. and Longmire, E.K. 2012. Effect of neighboring perturbations on drop coalescence at an interface. Physics of Fluids. 24(062106):1-21. Bordoloi, A. D., Longmire, E. K., Kong, X. and Saar, M. O. 2011. Investigation of drop motion through circular orifices. American Physical Society Division of Fluid Dynamics. 64th Annual Meeting, Baltimore, 2011. -------------------------------------------------------------------------------------------------------------------------------------------------------------------------------------- Tutolo B.M., X.-Z. Kong, W.E. Seyfried Jr., and M.O. Saar, Evaluation and revision of Aluminum Mineral Thermodynamic Data for aqueous geochemical applications, Geochimica et Cosmochimica Acta, in review, 2012 / 2013. Kong, Xiang-Zhao, B.M. Tutolo, and M.O. Saar. 2013. DBCreate: A SUPCRT92-based Program for Producing EQ3/6, TOUGHREACT, and GWB Thermodynamic Databases at user-defined T and P. Computers & Geosciences. 51:415-417. Kong, X. and M.O. Saar. 2011. Effects of permeability heterogeneity on density-driven convection during CO2 dissolution storage in saline aquifers. Abstract H21C-1121. AGU 2011 Fall Meeting, San Francisco, CA. Tutolo, B.M., W.E. Seyfried and M.O. Saar. 2011. An assessment of thermodynamic database effects on reactive transport models’ predictions of permeability fields. Abstract H51C-1216. AGU 2011 Fall Meeting, San Francisco, CA. Randolph, J.B., and M.O. Saar. 2011. Combining geothermal energy capture with geologic carbon dioxide sequestration. Geophysical Research Letters. 38(L10401):1-7. Randolph, J.B. and M.O. Saar. 2011. Coupling carbon dioxide sequestration with geothermal energy capture in naturally permeable, porous geologic formations: Implications for CO2 sequestration. Energy Procedia. 4:2206-2213. DOI: 10.1016/j.egypro.2011.02.108.
See dates of publications + work is ongoing ------------------------ See dates of publications + work is ongoing ------------------------ See dates of publications + work is ongoing
Weight: 40%

14 | US DOE Geothermal Office eere.energy.gov
Describe deployment strategy or expected outcome of this effort. Discuss future research, development or deployment needs. – Explain key activities for the rest of FY2013 and to project completion. – Be as specific as possible; avoid blanket statements. – Address how you will deal with any decision points during that time and any remaining issues, including any alternative development pathways under consideration to
mitigate risk of not achieving milestones.
• The project is on track and should finish by the end date of 9/30/2013 (~6 months from now). • An NSF proposal has been submitted in January 2013 to continue this type of research by conducting in-situ XRCT experiments to allow for higher temporal resolution time series experiments of reactive transport. This would improve our understanding of how mineral dissolution or precipitation affect permeabilities during geologic CO2 sequestration and/or usage of CO2 as a working fluid during geothermal heat energy extraction. Include the planned milestones and go/no-go decisions for FY13 and beyond and current status of working towards them. You may utilize the table below for this purpose. If this is different from your original plan, please explain why.
• The project has no go/no-go decision points or specific milestones to be reached before the expected project completion date. The project is on track and should come to completion by the expected completion date of 9/30/2013 if no further complications arise.
Mandatory slide-may utilize multiple slides
Future Directions Project Management/Coordination
Weight: 10%
The project is progressing well and is entering its final phase. Portions of tasks 1-4 are still in progress and Task 5 has now also been entered during which results from Tasks 1-4 will be integrated. Thus all 5 tasks are progressing well and work will continue throughout the remainder of the project which has a current end date of 9/30/2013.
Task 1: We have run dolostone and arkose reactive flow-through experiments and will continue with a few more. We have had difficulty finding basalts with sufficient initial permeability but now have working samples. This will complete Task 1. Task 2: XRCT 3D imaging is ongoing before and after each experiment from Task 1. Task 3: PIV experiments are ongoing to test the LB fluid flow simulator (Task 4) Task 4: The LB code has been extended and is being used to determine permeability fields of XRCT determined 3D pore structure of representative elementary volumes (REVs) with one permeability value for each REV. Task 5: We have started to run TOUGH2 simulations of CO2/water/brine flow and heat transfer. Simulations and are now beginning to use the results from Tasks 1-4 to integrate the information on how reactions, due to CO2/water/mineral reactions, affect permeability fields, to include in parameterized form, for various rock types, temperatures, and pressures into TOUGH2.

15 | US DOE Geothermal Office eere.energy.gov
• Summarize the key points you wish the reviewers and the audience to take away from your presentation.
Mandatory Summary Slide
Mandatory slide- keep to one slide
Project Management/Coordination Weight: 10%
The project is progressing well and is on schedule.
The following accomplishments have been made to date (March 2013):
• We have conducted reactive flow-through experiments with carbonates (dolostone) and arkose sandstones and have started experiments with basalts that show high-enough initial permeability for experiments. (Task 1) • We have installed and tested our in-house X-Ray Tomography (XRCT) system in the spring of 2012 and conducted before and after (experiment) 3D imaging of rocks at this facility and in since 2011 at Argonne National Lab. (Task 2) • We have conducted Particle Image Velocimetry (PIV) experiments of multiphase (analogue) fluid flow through simple porous media (orifice plate) as well as drop collapse PIV experiments to test our in-house LB code. (Task 3) • We have run lattice-Boltzmann (LB) multiphase fluid flow simulations of the PIV experiments and of fluid flow through XRCT-determined 3D pore spaces of our actual samples to determine permeability fields and their changes (due to reactions) of the reactive flow experiments. These simulations help parameterization of permeability changes due to reactive transport as observed in the physical experiments which will be integrated into TOUGH2. (Task 1-4) • We have run TOUGH2 simulations of water/brine and dissolved CO2 to investigate CO2 dissolution (in brine) storage with implications for CO2 plume formation and related CO2-based heat energy extraction and CO2 storage capacity. (Task 5) • We have found a new CO2 storage mechanism due to exsolution of CO2 out of water/brine and published the results. (Task 1-4) • We have developed a long-overdue update of the thermodynamic data base used in aqueous geochemical modeling (e.g., in TOUGHREACT, GWB, …) and developed software (DBCreate) for rapid inclusion of the updated data for user-defined P-T conditions (essentially resolved the so-called Aluminum problem). See publications. (Task 5) • We have measured contact angles between CO2, water/brine, and various minerals for inclusion in LB simulations. (Tasks 1, 4) Remaining tasks (aside from finishing some of the above tasks: Tasks 1-5): • Parameterization of how permeability changes at various P-T conditions for the investigated lithologies. (Task 5) • Inclusion of the above parameterization into TOUGH2 so that permeability fields are adjusted during simulations based on the results of this study. (Task 5)

16 | US DOE Geothermal Office eere.energy.gov
• The purpose of this slide is to provide some context for evaluating your project. • Please prepare one overview slide containing the following information:
Timeline:
Budget:
• Summarize management activities or approaches, for example: – Application of resources and leveraged funds/budget/spend plan – How is this project integrated with other projects in the Office? Results from this project have been used to submit an NSF proposal in January 2013 that, if funded, would take the research started under this DOE grant to the next level by conducting in-situ XRCT experiments. This would allow improved (higher temporal resolution) time series analysis of how reactive transport (due to CO2 injection into deep saline aquifers during CO2 sequestration and/or CO2-based geothermal energy extraction) affects permeability field variations with implications to injectivity, CO2 storage capability, and heat extraction capability. – Coordination with industry & stakeholders CO2-Plume Geothermal (CPG) technology has been patented by the University of Minnesota and licensed to Heat Mining Company LLC for commercialization.
• If your project is behind schedule, please tell us here.
Project Management
Mandatory slide- keep to one slide (this should be final slide of presentation)
Federal Share Cost Share Planned Expenses to
Date
Actual Expenses to
Date
Value of Work Completed
to Date*
Funding needed to
Complete Work
$1,550,018 $387,505 $1,520,000 $1,410,442 $1,494,000 $527,081
Planned Start Date
Planned End Date
Actual Start Date
Current End Date
01/08/2010 02/28/2013 04/01/2010 09/30/2013
The project is approximately on schedule and should be finished by the current expected completion date of 9/30/2013, if no further complications arise.
Project Management/Coordination Weight: 10%
* Estimate made using the updated worksheet.