cost recovery overview - home page | unicef challenges remain, as a few funding and national...
TRANSCRIPT

Cost Recovery Overview
Joint UNDP, UNICEF, UNFPA and UN Women Executive Board informal
3 February 2017
1

1. Observations
2. Basics on cost recovery
3. Cost recovery information 2014 and 2015
4. Challenges facing organizations in recovering costs
5. Recap and way forward
6. Q & A
Annex I – background EB decisions and notional rates
Annex II – UNFPA details
Annex III – UNICEF details
Annex IV – UN Women details
Annex V – UNDP details
Outline
2

The four agencies are compliant with the harmonized cost recovery
and integrated budget frameworks approved by the Executive Boards
The four agencies have applied the approved cost recovery
framework and the approved cost recovery rates consistently
The independent consultant’s report has positively validated the
fundamental principles of the model and the agencies’ adherence to it
Significant challenges remain, as some funding and national
government implementing partners are unwilling to include eligible
direct costs in programmes
Some challenges remain, as a few funding and national government
implementing partners are unwilling to accept the harmonized cost
recovery rate
Longer-term institutional agreements, including with UN partners,
locked into lower cost recovery rates
The four agencies recognize that differences in business and funding
models, as well as relative size, have an impact on comparability
Observations
3

General Assembly Resolution 67-226, section II, stressed that core resources remain “the
bedrock of operational activities for development of the UN System”
Core resources provide funding base for each agency’s programmes in individual countries,
regionally and centrally, and also provide an essential and predictable foundation for
responding to the needs of programme countries and supporting the mandate, integrity and
resource mobilization platform leading to the results of the agencies’ Strategic Plans
Core resources, per the approved harmonized cost classification categories of the current
integrated budget, cover:
Programme activities;
Development effectiveness activities;
UN development coordination activities;
Management activities:
Critical cross-cutting management functions which are integral to the existence and
the advancement of the mandate of the organizations, irrespective of the volume of
Programme implementation;
Management costs related to the support of core programme delivery*;
Comparable special purpose activities (Capital investments); and
Agency specific special purpose activities
Role and Use of Regular (Core) Resources
4
* For UNDP, transitional measures were approved by the Executive Board for 2014-2017 period

Components of Costs
Cost recovery refers to the requirement for the organization to ensure that
regular resources are not used to subsidize the implementation of
programmes funded from other resources.
Indirect costs
• Costs that are indirectly linked to the delivery of development results are
recovered through the cost recovery rate
Direct costs
• Costs that are directly linked to the delivery of development results are
directly funded from regular resources or other resources, depending on
where the cost originates
As such total costs include both indirect and direct costs incurred by the
organizations.
Indirect costs
Direct costs
Total Costs
5

What is the link between cost recovery and cost
classification?
6
Types of activities Types of costs
Development
Effectiveness
Recurring costs
Non recurring costs
UN Development
Coordination
Capital Investments
Other activities
ProgrammeDevelopment activities
Management activities
UN Development
Coordination
Comparable Special
Purpose
Other Special Purpose
Cost recovery applies

Executive Board approved model cost recovery – step by
step
7
Proportionate percentage share of RR and OR
in the planned use of resourcesRegular resources: $40
Other resources: $60
Inst. Budget: $12.6
Development Effectiveness: ($2)
Non-comparable Special Purpose: ($1)
UN Dev. Coordination: ($1)
Critical cross-cutting: ($1)
IB Subject to cost
recovery: $7.6
IB proportion OR (7.6*60%) = $4.56
IB proportion RR (7.6*40%)= $3.04
IB proportion OR: $4.56 / ($60-$4.56) = 8.2%
IB proportion RR: $3.04 / ($40-$3.04) = 8.2%
Result of step 4 = 8.2% established cost
recovery rate
Step 1: Calculate the sum of management and
comparable Special Purpose costs and remove
costs related to critical, cross-cutting functions
Step 2: Take the amount calculated in step (1)
and split it proportionally according to the levels
of total planned core and non-core expenditures
Step 3: Take the amount calculated in step (2)
to be recovered from non-core resources and
calculate it as a percent of total planned non-
core development expenditures
Step 4: The amount in step (3) equals the
notional cost-recovery rate on non-core
resources
Illustrative Example:
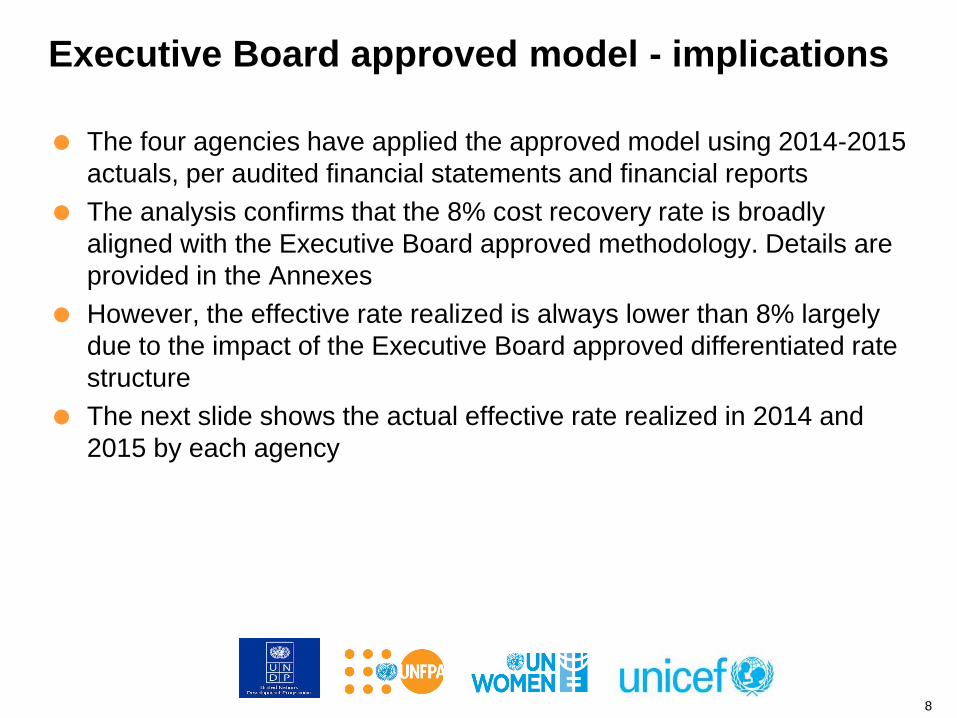
The four agencies have applied the approved model using 2014-2015
actuals, per audited financial statements and financial reports
The analysis confirms that the 8% cost recovery rate is broadly
aligned with the Executive Board approved methodology. Details are
provided in the Annexes
However, the effective rate realized is always lower than 8% largely
due to the impact of the Executive Board approved differentiated rate
structure
The next slide shows the actual effective rate realized in 2014 and
2015 by each agency
Executive Board approved model - implications
8

Agency 2014 2015
UNDP 6.1% 6.3%
UNFPA 7.02% 7.03%
UNICEF 6.3% 6.5%
UN Women 7.12% 7.00%
Effective cost recovery rates 2014 and 2015 by agency
9
Details for each Agency are presented in the Annexes at the end
of this presentation
The effective rate represents the rate that was realized based on the actual
cost recovery vs. the actual OR spending*. These rates were also reported in
the independent external consultants’ report.
*For UN Women, based on collected revenue

Number of Waivers – 2014 and 2015
10
• Per EB decision, “on an exceptional basis (….) the Administrator (…) and the
Executive Director (…) may consider granting a waiver of the cost-recovery
rates on a case-by-case basis, (…) and that the Executive Board will be
informed of these waivers in the annual financial reports”
• Total financial impact of the cost recovery waivers in response to partner
requests is immaterial (but should continue to be given very exceptionally)
• The waivers granted are reported in the respective agency annual reports
Number of
waivers
2014 2015
UNDP 24 9
UNFPA 4 8
UNICEF 1 9
UN Women 1 1

Key Challenges
11
Continuously declining core resources negatively impact on:
forward-looking and strategic choices and investments;
ability to deliver on development results
institutional capacity for quality assurance and accountability
Some funding and national government implementing partners are unwilling to
include eligible direct costs in programmes. This, by definition, results in cross-
subsidization
Some funding and national government implementing partners are unwilling to
pay the standard cost recovery rates
Longer-term institutional agreements, including with UN partners, locked into
lower cost recovery rates
Comparability amongst agencies is affected by different business and funding
models, and size
While the cost recovery rate is established based on the planned estimates,
the actual performance will by definition be different (i.e. different income and
different actual costs)

Recap
12
The four agencies are compliant with the harmonized cost recovery
and integrated budget frameworks approved by the Executive Boards
The four agencies have applied the approved cost recovery rate
consistently
The effective rate is by definition lower than the approved 8% rate,
taking into account the EB approved differentiated rates; waivers and
legacy rates
Effective rates have generally increased over the years
It remains a challenge that some funding and national government
implementing partners are unwilling to include eligible direct costs in
programmes
The four agencies recognize that differences in business and funding
models, as well as relative size, have an impact on comparability

Next steps
13
• Against the backdrop of GA resolution 71/243 on the
QCPR and guidance of the Executive Board:
• Hold joint informal in April in order to discuss the 2016
information (after financial books are closed)
• Prepare the next integrated budgets on the basis of
the current Executive Board approved cost recovery
and integrated budget frameworks
• Continue to monitor and report on actual cost recovery on
an annual basis
• Continue to strongly advocate of inclusion of eligible
direct costs in programmes/projects.

Q&A
14

Annex I
15
Background Executive Board Decisions and
summary of notional cost recovery rates for
2014-2015

“Approves the harmonized methodology for calculating cost-recovery rates (…) and
welcomes the increased transparency and proportionality in the new harmonized
framework”
“Endorses a general, harmonized cost-recovery rate of 8 per cent for non-core
contributions that will be reviewed in 2016, with the possibility of increasing the rate if it
is not consistent with the principle of full cost recovery, proportionally from core and
noncore funding sources (…)”
“Requests that an independent and external assessment be performed in 2016 on the
consistency and alignment of the new cost-recovery methodology with General
Assembly resolution 67/226”
Background: Approval of cost recovery framework
16
Executive Board decision on cost recovery (February 2013)
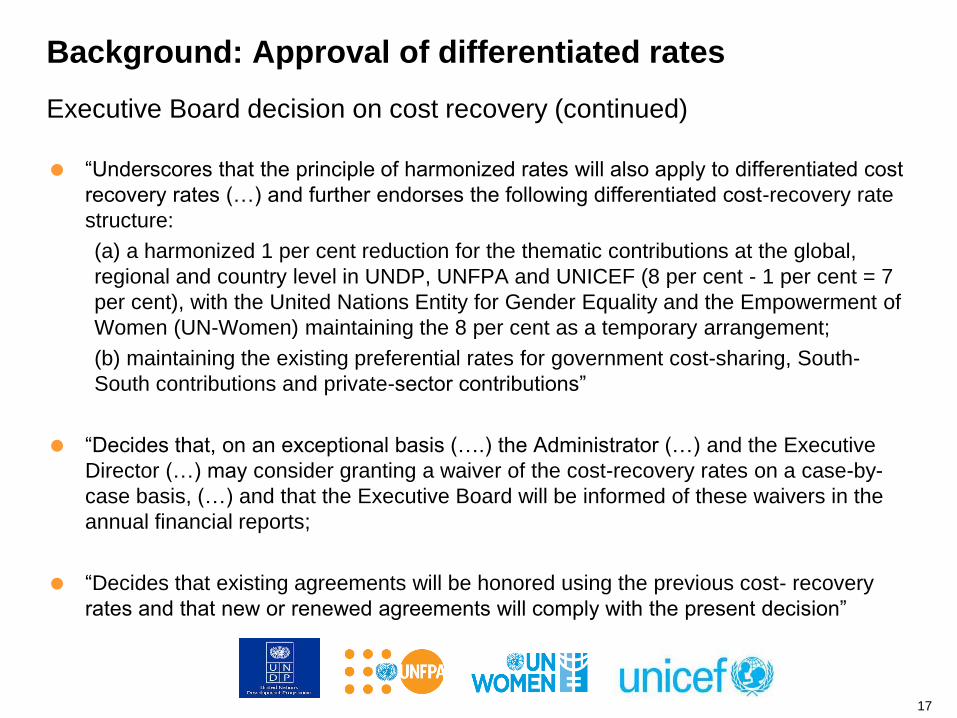
“Underscores that the principle of harmonized rates will also apply to differentiated cost
recovery rates (…) and further endorses the following differentiated cost-recovery rate
structure:
(a) a harmonized 1 per cent reduction for the thematic contributions at the global,
regional and country level in UNDP, UNFPA and UNICEF (8 per cent - 1 per cent = 7
per cent), with the United Nations Entity for Gender Equality and the Empowerment of
Women (UN-Women) maintaining the 8 per cent as a temporary arrangement;
(b) maintaining the existing preferential rates for government cost-sharing, South-
South contributions and private-sector contributions”
“Decides that, on an exceptional basis (….) the Administrator (…) and the Executive
Director (…) may consider granting a waiver of the cost-recovery rates on a case-by-
case basis, (…) and that the Executive Board will be informed of these waivers in the
annual financial reports;
“Decides that existing agreements will be honored using the previous cost- recovery
rates and that new or renewed agreements will comply with the present decision”
Background: Approval of differentiated rates
17
Executive Board decision on cost recovery (continued)

“Requests (…) to include in the midterm review of their integrated budgets, information
on the implementation of the approved cost-recovery rates, including the approved
underlying calculation methodology and the inclusion of each cost category; their
actual cost-recovery rates for the two previous financial years; and an analysis of
compliance with the principle of full cost recovery, funded proportionally from core and
non-core resources, as mandated in General Assembly resolution 67/226” (Executive
Board decision from September 2013)
“Requests (…) to present in accordance with the Executive Board decision 2013/2, all
requested information on cost recovery to the Executive Board in time to be included
for the consultations on the strategic plan 2018-2021 and the integrated budget 2018-
2019 at its Annual session 2017” (Executive Board decision from September 2016)
Background: Request for further information
18
Executive Board decision on cost recovery (continued)

Agency 2014 2015
UNDP 7.9% 7.0%
UNFPA 7.9% 7.8%
UNICEF 6.2% 6.0%
UN Women 8.3% 8.1%
Executive Board approved model – calculation of
notional rate using 2014 and 2015 actuals
19
Details for each Agency are presented in the following Annexes
The rates below result from applying the Executive Board approved
methodology to 2014 and 2015 actuals:

Annex II
20
UNFPA specific details

UNFPA Calculation of rate in line with approved formula in documents
DP-FPA/2013/1–E/ICEF/2013/8
21
Calculation of Rate based on Approved Methodology 2014 and 2015 (in US$ Million) - UNFPA
Use of resources 2014 2015
A1 Regular resources (RR) 444.8 449.9
A2 Other resources (OR), gross (A) 515.0 505.3
Total 959.8 955.2
1. Calculate the proportionate percentage share of RR and OR in the planned use of resources
B1 Proportionate share RR 46% 47%
B2 Proportionate share OR (B) 54% 53%
2. Calculate the sum of management and comparable Special Purpose costs [and remove costs related to critical,
cross-cutting functions)
C Institututional Budget 141.1 140.3
Less
C1 Development Effectiveness Activities (30.4) (31.1)
C2 Non-Comparable Special purpose Activities
C3 UN Development Coordination Activities (2.0) (2.1)
C4 Critical cross-cutting management functions based on standard costs (38.3) (37.9)
3. Take the amount calculated in step 2. and split it proportionally according to the levels of total planned core and non-core use of resources
D=C-(C1:C4) Institutional Budget Subject to Cost Recovey based on approved methodology 70.5 69.3
E1=B1*D Regular Resources Proportional Share of IB 32.7 32.6
E2=B2*D Other Resources Proportional Share of IB 37.8 36.6
F=E2/(A2-E2) Notional Rate 7.9% 7.8%
G Cost Recovery actually earned 33.8 33.2
H=G/(A2-G) Effective Rate 7.02% 7.03%
Actual Expenses

UNFPA – impact of differentiated rates, legacy and waivers vs. the
standard rate
22
UNFPA
Type of agreement 2014 2015 2014 2015
Standard Rate 8.00% 8.00% - -
Thematic Trust Funds 7.00% 7.00% 2,003,189 1,610,350
Various Umbrella Agreements 7.00% 7.00% 626,436 704,370
Country Programme Donor 5.00% 5.00% 448,235 681,793
Joint Programme 7.00% 7.00% 372,727 512,793
Legacy 7.00% 7.00% 762,906 510,362
Exception 5.20% 5.19% 79,532 119,162
Others (small contributions) 6.93% 6.99% 50,601 12,802
Total 7.02% 7.03% 4,343,627 4,151,633
Effective rates Variance vs. standard rate
Note: Variance vs. the standard rate represents the difference between the effective cost
recovery received and the cost recovery that would have been earned using the standard
approved rate (8%). Thus the amount is not exactly the same when comparing the
effective cost recovey received to the notional rate derived by applying the approved
methodology.

Annex III
23
UNICEF specific details
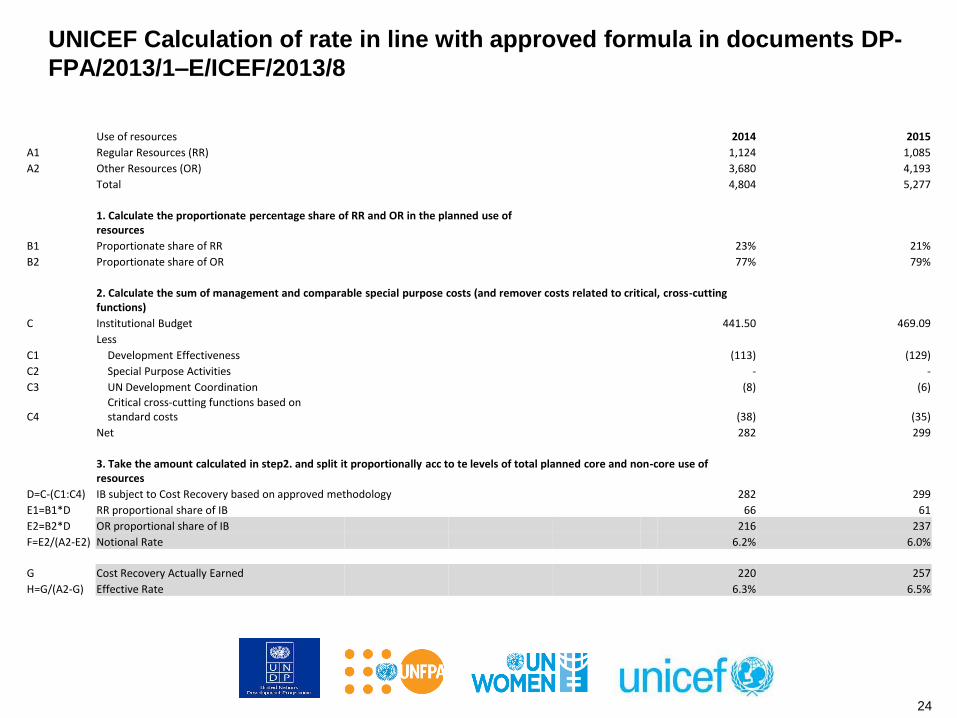
UNICEF Calculation of rate in line with approved formula in documents DP-
FPA/2013/1–E/ICEF/2013/8
24
Use of resources 2014 2015
A1 Regular Resources (RR) 1,124 1,085
A2 Other Resources (OR) 3,680 4,193
Total 4,804 5,277
1. Calculate the proportionate percentage share of RR and OR in the planned use of resources
B1 Proportionate share of RR 23% 21%
B2 Proportionate share of OR 77% 79%
2. Calculate the sum of management and comparable special purpose costs (and remover costs related to critical, cross-cutting functions)
C Institutional Budget 441.50 469.09
Less
C1 Development Effectiveness (113) (129)
C2 Special Purpose Activities - -
C3 UN Development Coordination (8) (6)
C4Critical cross-cutting functions based on standard costs (38) (35)
Net 282 299
3. Take the amount calculated in step2. and split it proportionally acc to te levels of total planned core and non-core use of resources
D=C-(C1:C4) IB subject to Cost Recovery based on approved methodology 282 299
E1=B1*D RR proportional share of IB 66 61
E2=B2*D OR proportional share of IB 216 237
F=E2/(A2-E2) Notional Rate 6.2% 6.0%
G Cost Recovery Actually Earned 220 257
H=G/(A2-G) Effective Rate 6.3% 6.5%

Annex IV
25
UN Women specific details

UN Women Calculation of rate in line with approved formula in documents
DP-FPA/2013/1–E/ICEF/2013/8
26
Calculation of Rate based on Approved Methodology 2014 and 2015 (in US$Million) - UNWOMEN Actual expenses
Use of Resources 2014 2015
Regular resources 143 149
Other resources (OR), Gross (A) 131 169
Total 274 318
1. Calculate the proportionate percentage share of RR and OR in the planned use of resources
Proportionate share RR 52% 47%
Proportionate share OR (B) 48% 53%
2014 2015
Institututional Budget 73.0 82.5
Less
Development Effectiveness Activities (21.3) (23.4)
Non-Comparable Special purpose Activities
UN Development Coordination Activities (10.4) (12.4)
Critical cross-cutting management functions based on standard costs (18.5) (21.0)
Institutional Budget Subject to Cost Recovery based on approved methodology 22.8 25.7
Regular Resources Proportional share of IB 11.9 12.0
Other Resources Proportional Share of IB 10.9 13.7
Notional rate 8.3% 8.1%
Cost recovery actually earned 10.3 11.5
Effective Rate 7.12 7.00
2. Calculate the sum of management and comparable Special Purpose costs [and remove costs related to critical, cross-cutting functions)
3. Take the amount calculated in step 2 and split it proportionally according to the levels of total planned core and non-core use of
resources

Year Collected Revenue Support cost recorded Effective rate
A B B divided by A
2014 146,110,705.37 10,367,460.42 7.10%
2015 165,030,949.79 11,529,076.89 6.99%
UN Women Effective indirect cost recovery rates 2014
and 2015
27

Annex V
28
UNDP specific details

29
(*) Based on data reported in UNDP ARFS for 2014 and 2015 in annexes 1&2, net of GLOC and in-kind contributions
UNDP Calculation of rate in line with approved formula in documents
DP-FPA/2013/1–E/ICEF/2013/8 2014 2015 2014-2015
Actuals (use of resources) (*)
A1 Regular resources 835 714 1,548
A2 Other resources 4,191 4,258 8,449
Total 5,026 4,971 9,997
B1 Proportionate share Regular Resources 17% 14% 15%B2 Proportionate share Other Resources 83% 86% 85%
1. Calculate the sum of management & comparable Special Purpose costs (and remove costs related to critical, cross-cutting management functions)
C Institutional budget 670 659 1,329
less
C1 Development Effectiveness activities (122) (148) (270)
C2 Non-comparable special purpose activities (67) (70) (137)
C3 UN development coordination activities (73) (76) (149)
C4 Critical cross-cutting management functions based on standard costs (40) (41) (81)D = C + C1..C4 Total 368 324 692
2. Take amount calculated in step (1) and split proportionally according to levels of total core and non-core expenditures
D = C + C1..C4
Total Inst. budget (actuals) subject to cost recovery (i.e. numerators for calculation cost recovery rate on RR and OR) 368 324 692
E1 = B1 * D Regular Resources proportional share of IB actuals 61 46 107
E2 = B2 * D Other Resources proportional share of IB actuals 307 277 585
F = E2/[A2-E2] (= E1/[A1-E1])
Calculation of cost recovery rate using EB approved model on 2014 and 2015 actuals (same rate on RR and OR) 7.9% 7.0% 7.4%

30
* Based on financial information reported in UNDP's audited financial statements and annual financial reports for 2014 and 2015.
• In 2014-15, UNDP was in full compliance with the harmonized EB approved cost recovery policy and
the integrated budget framework.
• On ‘core’ resources, UNDP ’charged’ an equivalent of 7.7%, yielding $80m.
• Note that ’core’ also financed critical cross-cutting management functions ($81m), and transitionary
measures ($132.8m) - i.e. measures approved by the EB in the Integrated Budget, due to time
required for full implementation of the cost recovery policy (noting that the EB approved cost recovery
methodology included differentiated rates, legacy rates, and waivers disclosed to EB).
• On ‘non-core’ resources, UNDP charged an actual effective cost recovery rate of 6.1% in 2014 and
6.3% in 2015, yielding $454.5m in cost recovery revenue.
• UNDP had indicated to the EB as part of its 2014-2017 integrated budget, that it would require
abovementioned transitionary measures (approved with $133m for 2014-2015 and $66m for 2016-
2017). Adding $132.8m transitionary measures to $454m in cost recovery revenue adds to $587.3m.
• When adding the ‘core’ charge of $80m, this adds to total (core/non-core) funding of $667m
• Noting that costs were $692m, this resulted in a gap of $25m, which was financed from prior year
accumulated XB reserves. No additional core resources were used to finance these costs in 2014-
2015, hence UNDP complied with the cost recovery policy.
• Note that if UNDP would in 2014-2015 have charged a cost recovery rate of 8% on all non-core
programme expenses, it would have yielded $570m in cost recovery revenue ($115.5m more than the
$454.5m in actual cost recovery revenue yielded in 2014-2015).
• Together with the $80m in core ‘charge’, this would result in total funding for management activities of
$650m, leading, if transitionary measures were excluded, to a gap of $42m (= $692m- $650m)
UNDP compliance with cost recovery policy - funding of $692m in IB costs
$80m Core (7.7% charge on
[$1,124m-$80m] – see next slide)
$454.5m Non-core (6.1% & 6.3%
charged in 2014 & 2015, respectively – see
next slides)
$132.8m EB approved trans measures
$587.3m subtotal (see next slide)
$667m total (core/non-core) funding

31
UNDP compliance with cost recovery policy (continued)
Notes: * Based on financial information reported in UNDP's audited financial statements and annual financial reports for 2014 and 2015.
* $294m in core total expenditure reconciles with total UNDP core expenditure on management activities ($289m) plus capital
investments ($5m). (see later slide).
2014 - 2015 2014 2015Core Non-core Core Non-core Core Non-core
A Delivery (basis for calculation of actual cost recovery charged) $1,124 $7,688 $587 $3,883 $537 $3,806
BActual cost recovery charged (see further slides for details on non-core) $80 $455 $42 $225 $38 $229% (=B / [A - B]) 7.7% 6.3% 7.7% 6.1% 7.7% 6.3%
C EB approved Transitionary measures $133 $133 66 66 66 66
D = B + C Total actual cost recovery including Transitionary measures $213 $587 $108 $292 $105 $296
E Critical cross cutting management functions ('CCCM') $81 - $40 - $41 -
F = D + E Total (including Transitionary measures and CCCM) $294 $587 $148 $292 $146 $296% of non-core delivery 8.0% 7.9% 8.2%
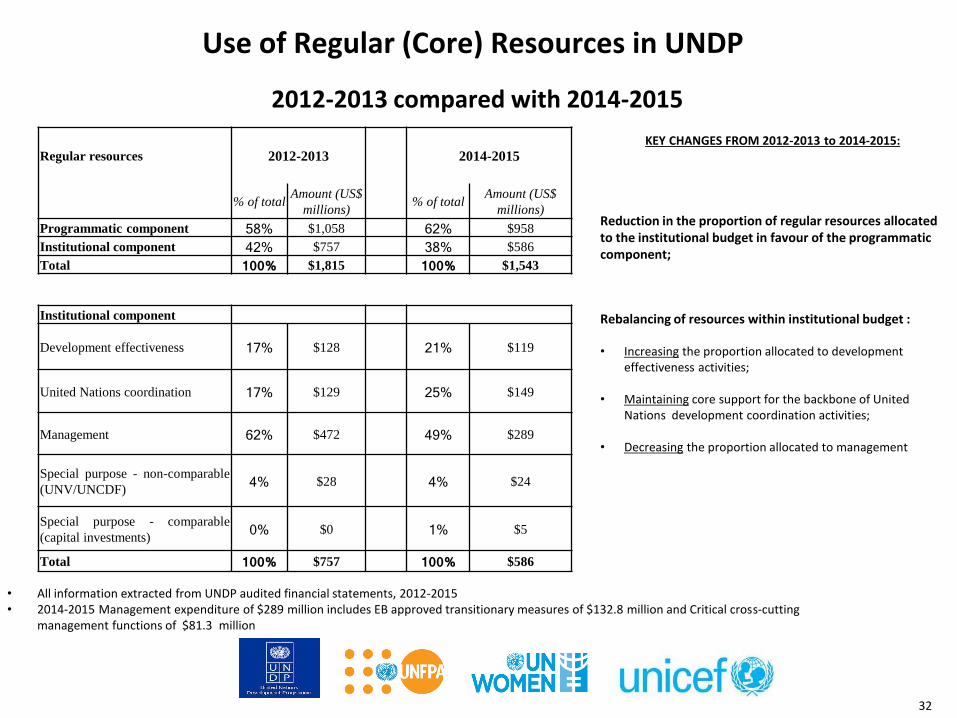
Use of Regular (Core) Resources in UNDP
32
2012-2013 compared with 2014-2015
• All information extracted from UNDP audited financial statements, 2012-2015• 2014-2015 Management expenditure of $289 million includes EB approved transitionary measures of $132.8 million and Critical cross-cutting
management functions of $81.3 million
KEY CHANGES FROM 2012-2013 to 2014-2015:
Reduction in the proportion of regular resources allocated to the institutional budget in favour of the programmatic component;
Rebalancing of resources within institutional budget :
• Increasing the proportion allocated to development effectiveness activities;
• Maintaining core support for the backbone of United Nations development coordination activities;
• Decreasing the proportion allocated to management
Regular resources 2012-2013 2014-2015
% of totalAmount (US$
millions)% of total
Amount (US$
millions)
Programmatic component 58% $1,058 62% $958
Institutional component 42% $757 38% $586
Total 100% $1,815 100% $1,543
Institutional component
Development effectiveness 17% $128 21% $119
United Nations coordination 17% $129 25% $149
Management 62% $472 49% $289
Special purpose - non-comparable
(UNV/UNCDF)4% $28 4% $24
Special purpose - comparable
(capital investments)0% $0 1% $5
Total 100% $757 100% $586

33
UNDP - Effective average cost recovery rate calculation with amounts by funding stream in US$ million dollars
Notes:1. All amounts from Atlas GL in line with UNDP audited Financial Statements for 2014 and 2015.2. Note that in calculation of the effective average cost recovery rate, the denominator is adjusted for $34.3m for 2014 and $38.5m for 2015 to take into
account GEF/Montreal Protocol related accounting.3. Programme country governments also contribute to offset local office costs through cash as well as in-kind contributions.
Planning assumption for implementing cost-recovery rate of 8% was that 50 per cent of 3rd party agreementswould be in compliance with the cost recovery policy by the end of 2015. However, UNDP exceeded thatinitially envisaged level by achieving 76 per cent rate of the compliance by the end of 2015.
Effective average cost recovery rate: 2014 2015
6.1% 6.3% The effective average cost recovery rate is calculated as follows:
Total Cost recovery revenue ______________________(Total non-core programmeexpenses less Total Cost recovery revenue)
2014 2015
Funding streamNon-core
programme expenses
Cost recovery revenue
Non-core programme
expenses
Cost recovery revenue
Third party Cost Sharing 1,293.4 77.6 1,296.5 82.6
European Union 254.7 16.4 347.4 20.8
Programme Country government Cost Sharing 907.1 35.0 918.0 35.5
South-South Contributions 3.1 0.2 2.6 0.2
Thematic Trust Funds 114.7 6.8 107.8 4.4
GEF 350.8 37.1 374.2 41.7
GFATM 474.0 31.2 423.2 28.6
Montreal Protocol 38.0 2.5 37.4 2.4
LOTFA 382.7 14.7 247.4 9.5
Other Trust Funds 64.1 3.7 51.1 3.6
Grand Total 3,882.8 225.2 3,805.5 229.3