cost plus world market 2003 annual report€¦ · · 2012-06-18and food and wine has always made...
TRANSCRIPT

Bring home the world.
COST PLUS WORLD MARKET 2003 ANNUAL REPORT

1505-AR-2004

That’s the opportunity wegive our customers — no matter
what they’re shopping for.
The world under one roof — that’s what you’ll find at Cost Plus World Market. We offer
value-oriented home furnishings, decorative accessories, and gourmet food and wine
from more than 60 countries.
Our stores have the informal, unhurried ambience of an open-air marketplace in a foreign land. And we constantly bring in new products
from around the world, so our customers know they can always find something new and
wonderful for entertaining or relaxing or just plain living.
01

E N T E R TA I N I NG
With our unique mix of quality home furnishings and gourmet food and
wine, we have products to celebrateany occasion, from holiday to every day.

holiday spirit

casual everyday elegance

Life of the party.
Whether it’s a formal holiday party or simple Saturday evening supper, entertaining is all about creating the right combination of food, wine,
and atmosphere. At Cost Plus World Market, shoppers can create that combination with a single shopping trip. We have a unique mix of products —
combining home furnishings with gourmet food and wine — and a broad selection, with more
than 10,000 items in every store, from Champagne to table settings.
We also continually update our selection tokeep our merchandise fresh and interesting. And
we always offer extraordinary value on our extraordinary products. Offering home furnishings
and food and wine has always made Cost Plus World Market unique, and our customers have long
known that they can count on us to help make any celebration a success.
05

R E L A X I NG
Warm bath or warm breeze, indoorsor outside — wherever our customers want to relax, we have products that
can help them make it happen.

unwind indoors

easy outdoor living
A little peace and quiet.
In a stressful world, we all need a chance to relax. That’s why our buyers are constantly looking for
unique and affordable products that can bring a feeling of sanctuary to any home. In the garden, for example,
our customers can unwind with colorful patio furniture and accessories. And they can turn any
bathroom into a luxurious spa.
Or they can spend an hour at Cost Plus World Market. For our customers, that’s a recipe for relaxation,
too, because our stores make shopping calm and pleasant. The atmosphere is casual, with exposed rafters,
polished concrete floors, warm colors, and natural lighting. And our f loor plan and product displays
are open and unstructured to encourage wandering and extended browsing. In short, our stores are fun places
to shop — further proof that we understand the importance of giving our customers an opportunity
for a little peace and quiet.
09

L I V I NG
We search the world for extraordinary items — big and small —
that can help a customer transform his or her house into a home.

big values

small surprises

Home is where the heart is.
And the soul, too, because nothing embodies the American dream like the home. Maybe it used to be cars or clothes or careers, but today it is our
homes that most clearly define who we are, how we live,and what we value. This focus on the home, which includes
everyone from Baby Boomers to Generations X and Y, has translated into strong, steady growth
in the home furnishings market.
In this market, our large assortment of unique furniture and accessories, including rugs, decorative gifts, and kitchen items, has made Cost Plus World
Market a leading destination retailer. This, coupled withour relaxing and fun shopping environment and
our commitment to excellent quality at an affordableprice, has translated into extraordinarily loyal customers,
who know they can always expect to find something new, distinctive and delightful for their homes
at Cost Plus World Market.
13

MURRAY H. DASHE
CH A I R MA N, CH I E F E X E C U T I V E O F F I C E R & P R E S I D E N T
14 /15
TO OUR SHAREHOLDERS,
Cost Plus World Market experienced another successful and productive year in 2003. Total salesgrew 15.8% to $801.6 million, driven by solid performance at the 31 new stores we opened duringthe year, and a 2.7% increase in our same store sales. Net income rose 16.2% to $33 million, or$1.48 per fully diluted share, as we continued to gain earnings leverage from our substantial infra-structure investments of the past five years.
A Unique and Popular Retail Concept in a High-Opportunity Market The strength of our 2003 performance reflects the strength of the Cost Plus World Market concept.We offer customers a unique mix of casual home furnishings and non-perishable gourmet foods andwines in a relaxed and pleasant shopping environment. We update our product selection continuously,changing approximately 60% of our merchandise every year, and we always offer excellent qualityat an affordable price. As you will read in the rest of this annual report, Cost Plus World Market hasa distinctly global sensibility. We truly give our customers a way to bring home the world.
This has proven to be an important advantage for Cost Plus World Market. The home has been atthe heart of the American Dream since the end of World War II and in recent years there has been amuch-discussed shift by consumers toward increased investment in their homes. Like many otherhome furnishings retailers we have benefited from this trend, but we believe we have out-competedour peers in large part because of our international perspective. It inspires the adventurous atmos-phere of our stores. It allows us to provide exceptional value on items at every price point. And itenables us to offer truly unique products that are casual without being common and that avoid short-lived design trends in favor of a more timeless style.
The word our buyers use is “authentic,” and they continually search through more than 60 countrieseach year looking for items that have the authenticity that we know our customers will recognize andappreciate. To ensure a unique selection, we are active in countries such as India, Vietnam, and evenChile where other importers have not established as strong a presence, and once we identify areasof opportunity we focus our resources on building strong relationships with local craftsmen and man-ufacturers. You can see the results of their hard work in our stores every day.
Focused on Operating Efficiency Throughout the CompanyWhile our concept and compelling product selection are driving our strong sales growth, it is ouroperating efficiency that is driving our increasing profitability. This improved efficiency is the result of
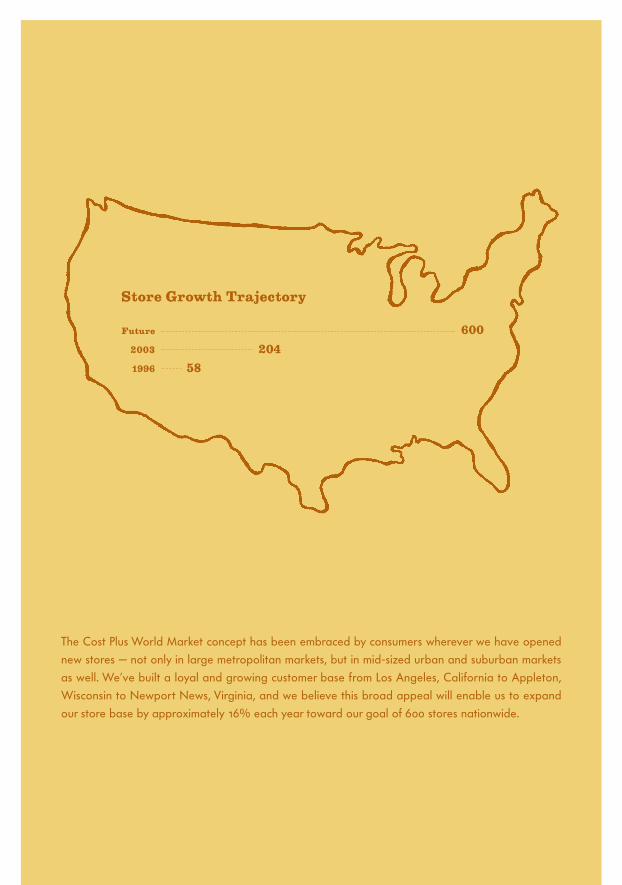
58
204
600
Store Growth Trajectory
The Cost Plus World Market concept has been embraced by consumers wherever we have openednew stores — not only in large metropolitan markets, but in mid-sized urban and suburban marketsas well. We’ve built a loyal and growing customer base from Los Angeles, California to Appleton,Wisconsin to Newport News, Virginia, and we believe this broad appeal will enable us to expandour store base by approximately 16% each year toward our goal of 600 stores nationwide.
Future
2003
1996

16 /17
our recent investments in better systems and processes throughout the organization, from productplanning and purchasing to inventory management. These new systems, coupled with the opening ofour Virginia distribution center, have dramatically improved productivity. Our in-stock position is con-sistently excellent, with all of our products moving through the distribution center and to our stores upto 65% faster than three years ago when we brought the first of our new systems online.
Our merchandising functions are also stronger. Advanced sales analysis, forecasting, and planningsoftware have allowed us not only to improve our purchasing efficiency, but also to identify areas ofopportunity for sales and margin growth. This kind of comprehensive strategic planning has driventhe success of our private label program – we carry more than 3000 private label products through-out our stores – and enabled us to conduct several theme-oriented promotions that have spurredcustomer traffic and sales during traditionally slow periods of the year.
Better planning has also enabled us to develop successful new product categories, such as artificialflowers, bedding, and personal bath items. At any given time, we will be testing new products andcategories in up to two dozen of our stores, always looking for breakthrough ideas that will keep cus-tomers intrigued, excited, and coming back to Cost Plus World Market again and again.
Building on Our Momentum in 2004 and Beyond As we wrote in last year’s annual report, the Cost Plus World Market concept has proven to be successful not just in large metropolitan areas, but even in mid-sized urban and suburban marketsaround the country. We also have discovered that we can cluster stores in larger urban markets withoutany long-term negative impact on an established store’s sales. Our concept is broadly appealing andour customers are deeply loyal. Based on these two facts — and a great deal of detailed demo-graphic and geographic research — we believe there is room for at least 600 Cost Plus World Marketstores in the United States.
As we expand our store base we will continue to insist on sites that offer ample parking and bothhigh-traffic thoroughfares and other destination retailers nearby. We will also continue our practiceof “seeding” new stores with experienced managers and staff to ensure that we open successfully andestablish our strong, sustainable store economics. In 2003 we followed this approach and we projectthat our 31 new stores will average nearly $3.5 million in annualized sales — performance that all ofour store personnel can be extremely proud of.
In 2004 we intend to again grow our store base by another 16%, adding a net of 33 new stores andentering several new markets. Following our model, we also expect to increase sales nearly 18% —
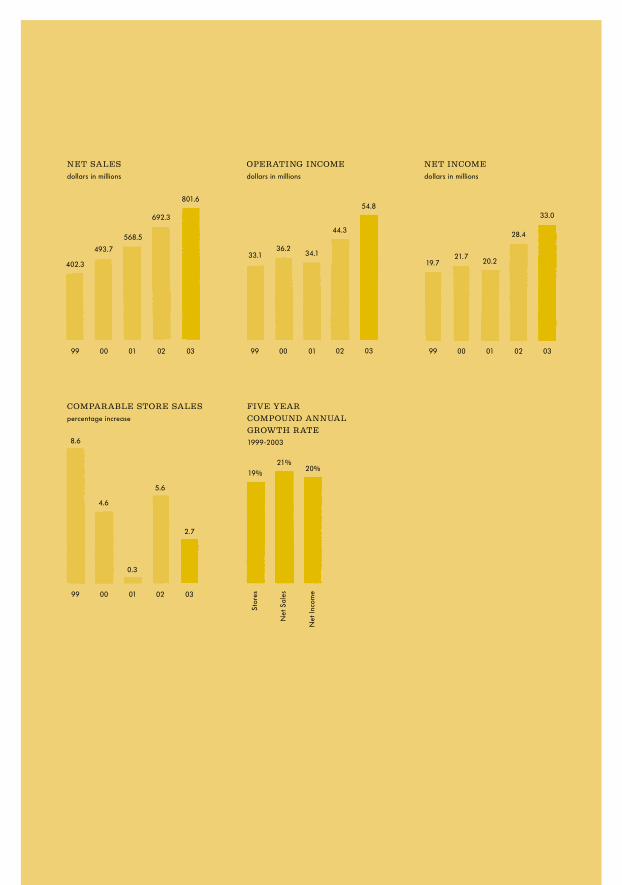
NET SALES
dollars in millions
402.3
493.733.1
801.6
99 00 01
NET INCOME
dollars in millions
19.721.7
OPERATING INCOME
dollars in millions
99 00 01
36.234.1
99 00 01
20.2
FIVE YEAR
COMPOUND ANNUAL
GROWTH RATE
1999-2003
19%21%
20%
COMPARABLE STORE SALES
percentage increase
99 00 01
8.6
4.6
0.3
Stor
es
Net
Sal
es
Net
Inco
me
692.3
568.5
02 03 02 03
44.3
54.8
02 03
28.4
33.0
02 03
5.6
2.7

18/19
again driven by both new stores and same store sales gains — and grow earnings per share approx-imately 20%. This kind of strong, steady profitable growth is well within reach if we continue to executeour winning concept successfully.
And we fully intend to do so. The management and employees of Cost Plus World Market haveproven their ability to move this company forward even during the challenging economic climate ofthe last two years. We believe years of exciting growth are still ahead of us, and we look forward toreporting on our progress as we expand our company into a truly national retail chain.
Murray H. DasheChairman, Chief Executive Officer, and President
March 2004
2003 Financial Overview
Five Year Summary of Selected Financial Data . . . . . . . . . . . . . . . . . . . . . . . . . . . . . . . . . . . . . . . . . . . . . . . . . . . . . . . . . . . . . . . . . . . . . . . . . . . . . . . . . . . . 21
Management’s Discussion and Analysis of Financial Condition and Results of Operations. . . . . . . . . . 22
Consolidated Balance Sheets . . . . . . . . . . . . . . . . . . . . . . . . . . . . . . . . . . . . . . . . . . . . . . . . . . . . . . . . . . . . . . . . . . . . . . . . . . . . . . . . . . . . . . . . . . . . . . . . . . . . . . . . . . . . . . . . . . . . 33
Consolidated Statements of Operations . . . . . . . . . . . . . . . . . . . . . . . . . . . . . . . . . . . . . . . . . . . . . . . . . . . . . . . . . . . . . . . . . . . . . . . . . . . . . . . . . . . . . . . . . . . . . . . . . . 34
Consolidated Statements of Shareholders’ Equity . . . . . . . . . . . . . . . . . . . . . . . . . . . . . . . . . . . . . . . . . . . . . . . . . . . . . . . . . . . . . . . . . . . . . . . . . . . . . . . . 35
Consolidated Statements of Cash Flows . . . . . . . . . . . . . . . . . . . . . . . . . . . . . . . . . . . . . . . . . . . . . . . . . . . . . . . . . . . . . . . . . . . . . . . . . . . . . . . . . . . . . . . . . . . . . . . . 36
Notes to Consolidated Financial Statements. . . . . . . . . . . . . . . . . . . . . . . . . . . . . . . . . . . . . . . . . . . . . . . . . . . . . . . . . . . . . . . . . . . . . . . . . . . . . . . . . . . . . . . . . . 37
Independent Auditors’ Report. . . . . . . . . . . . . . . . . . . . . . . . . . . . . . . . . . . . . . . . . . . . . . . . . . . . . . . . . . . . . . . . . . . . . . . . . . . . . . . . . . . . . . . . . . . . . . . . . . . . . . . . . . . . . . . . . . 48
Store Locations . . . . . . . . . . . . . . . . . . . . . . . . . . . . . . . . . . . . . . . . . . . . . . . . . . . . . . . . . . . . . . . . . . . . . . . . . . . . . . . . . . . . . . . . . . . . . . . . . . . . . . . . . . . . . . . . . . . . . . . . . . . . . . . . . . . . . . . . . . 49
Directors and Officers. . . . . . . . . . . . . . . . . . . . . . . . . . . . . . . . . . . . . . . . . . . . . . . . . . . . . . . . . . . . . . . . . . . . . . . . . . . . . . . . . . . . . . . . . . . . . . . . . . . . . . . . . . . . . . . . . . . . . . . . . . . . . . . . 50
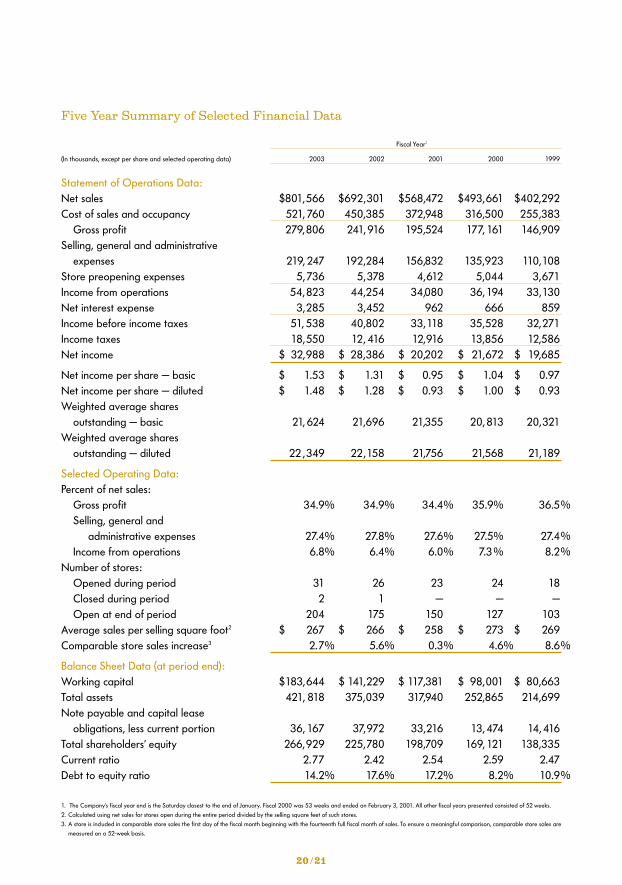
Five Year Summary of Selected Financial Data
Fiscal Year1
(In thousands, except per share and selected operating data) 2003 2002 2001 2000 1999
Statement of Operations Data:Net sales $801,566 $692,301 $568,472 $493,661 $402,292Cost of sales and occupancy 521, 760 450,385 372,948 316,500 255,383
Gross profit 279,806 241, 916 195,524 177, 161 146,909Selling, general and administrative
expenses 219, 247 192,284 156,832 135,923 110,108Store preopening expenses 5,736 5,378 4,612 5,044 3,671Income from operations 54,823 44,254 34,080 36,194 33,130Net interest expense 3,285 3,452 962 666 859Income before income taxes 51, 538 40,802 33,118 35,528 32,271Income taxes 18,550 12, 416 12,916 13,856 12,586Net income $ 32,988 $ 28,386 $ 20,202 $ 21,672 $ 19,685
Net income per share — basic $ 1.53 $ 1.31 $ 0.95 $ 1.04 $ 0.97Net income per share — diluted $ 1.48 $ 1.28 $ 0.93 $ 1.00 $ 0.93Weighted average shares
outstanding — basic 21, 624 21,696 21,355 20, 813 20,321Weighted average shares
outstanding — diluted 22 ,349 22,158 21,756 21,568 21,189
Selected Operating Data:Percent of net sales:
Gross profit 34.9% 34.9% 34.4% 35.9% 36.5Selling, general and
administrative expenses 27.4% 27.8% 27.6% 27.5% 27.4Income from operations 6.8% 6.4% 6.0% 7.3% 8.2
Number of stores:Opened during period 31 26 23 24 18Closed during period 2 1 — — —Open at end of period 204 175 150 127 103
Average sales per selling square foot2 $ 267 $ 266 $ 258 $ 273 $ 269Comparable store sales increase3 2.7% 5.6% 0.3% 4.6% 8.6
Balance Sheet Data (at period end):Working capital $183,644 $ 141,229 $ 117,381 $ 98,001 $ 80,663Total assets 421, 818 375,039 317,940 252,865 214,699Note payable and capital lease
obligations, less current portion 36, 167 37,972 33,216 13, 474 14, 416Total shareholders’ equity 266,929 225,780 198,709 169, 121 138,335Current ratio 2.77 2.42 2.54 2.59 2.47Debt to equity ratio 14.2% 17.6% 17.2% 8.2% 10.9
1. The Company’s fiscal year end is the Saturday closest to the end of January. Fiscal 2000 was 53 weeks and ended on February 3, 2001. All other fiscal years presented consisted of 52 weeks.2. Calculated using net sales for stores open during the entire period divided by the selling square feet of such stores.3. A store is included in comparable store sales the first day of the fiscal month beginning with the fourteenth full fiscal month of sales. To ensure a meaningful comparison, comparable store sales are
measured on a 52-week basis.
20 /21
%
%%
%
%

Management’s Discussion and Analysis of Financial Conditionand Results of Operations
Forward-Looking Statements
This report includes a number of forward-looking statements, which reflect the Company’s current beliefs andestimates with respect to future events and the Company’s future financial performance, operations and com-petitive position.
An asterisk “*” denotes a forward-looking statement reflecting current expectations that involve risks anduncertainties. Actual results may differ materially from those discussed in such forward-looking statements andshareholders of Cost Plus, Inc. (the “Company” or “Cost Plus”) should carefully review the cautionary statementsset forth in this Annual Report, including “Factors Affecting Future Performance” and “Quarterly Results andSeasonality” beginning on page 25 and 28, respectively. In addition to statements marked with an asterisk “*”,the words “expect,” “anticipate,” “estimate,” “believe,” “looking ahead,” “forecast,” “may,” “will,” “should,” “project,”“continue,” “aims,” “intends,” “likely,” “plan” and similar expressions identify forward-looking statements. TheCompany may from time to time make additional written and oral forward-looking statements, includingstatements contained in the Company’s filings with the Securities and Exchange Commission. The Companydoes not undertake to update any forward-looking statement that may be made from time to time by or onbehalf of the Company.
Overview
Cost Plus, Inc. is a leading specialty retailer of casual home furnishings and entertaining products. As of January31, 2004, the Company operated 204 stores under the name “World Market,” “Cost Plus World Market,” “CostPlus” and “Cost Plus Imports” in 26 states. The Company’s business strategy is to differentiate itself by offering alarge and ever-changing selection of unique products, many of which are imported, at value prices in an excitingshopping environment. Many of the Company’s products are proprietary or private label, often incorporating theCompany’s own designs, “World Market” brand name, quality standards and specifications and typically are notavailable at department stores and other specialty retailers.
Cost Plus’ strategy is to increase market share through expansion by opening stores primarily in metropolitanand suburban markets that can support multiple stores and enable the Company to achieve advertising, distri-bution and operating efficiencies. The Company may also selectively enter mid-size markets which can supportone or two stores that the Company believes can meet its profitability criteria. In fiscal 2004, the Company hasannounced plans to grow its store base by another 16%, adding a net 33 new stores and entering several newmarkets.*
In fiscal 2004, the Company plans to begin construction on the expansion of its 500,000 square foot Virginia dis-tribution center to 1,000,000 square feet with the added capacity scheduled to come online in the first half of fiscal2005.* In connection with the expansion, the Company also reached an agreement to purchase the existing500,000 square foot facility currently under lease for $26.5 million, which is expected to close in May 2004.* Thecompletion of both transactions is subject to obtaining necessary approvals and permits.
The Company expects capital expenditures on the purchase and expansion project will total $50.5 million, with$42.5 million of expenditures expected in fiscal 2004 and $8.0 million expected in fiscal 2005.* The Companyplans to fund a portion of the purchase and expansion projects, approximately $10.0 million, from internally

generated funds and its existing revolving credit facility.* The remaining balance of the purchase and expansionis planned to be financed through new long-term debt of $20.0 million and through a new $20.0 millionrevolving line of credit, a portion of which will convert to fixed rate long-term debt in fiscal 2005.* Interest onthe loan for the purchase of the existing facility has been fixed at 4.82% per annum. Interest on the revolvingline of credit is at LIBOR plus 0.9%. Financing for the purchase and expansion project is subject to the executionof a definitive loan agreement.
Critical Accounting Policies and Estimates
Cost Plus, Inc.’s and its subsidiaries’ discussion and analysis of its financial condition and results of operations arebased upon the Company’s consolidated financial statements, which have been prepared in accordance withaccounting principles generally accepted in the United States of America. The preparation of these financialstatements requires the Company to make estimates and judgments that affect the reported amounts of assets,liabilities, revenues and expenses and related disclosure of contingent assets and liabilities. Estimates andassumptions include, but are not limited to, inventory values, fixed asset lives, intangible asset values, deferredincome taxes, self-insurance reserves and the impact of contingencies and litigation. The Company bases itsestimates on historical experience and on various other assumptions that are believed to be reasonable underthe circumstances, the results of which form the basis for making judgments about the carrying values of assetsand liabilities that are not readily apparent from other sources. Actual results may differ from those estimatesunder different assumptions or conditions. The Company has also chosen certain accounting policies whenoptions are available, including the retail inventory method of accounting for inventories and the intrinsic valuemethod to account for common stock options. These accounting policies are applied consistently for all yearspresented. Operating results would be affected if other alternatives were used. Information about the impacton operating results by using Accounting Principles Board Opinion No. 25, “Accounting for Stock Issued toEmployees,” is included in Note 1 to the consolidated financial statements.
Although not all inclusive, the Company believes that the following represent the more critical estimates andassumptions used in the preparation of the consolidated financial statements.
Revenue Recognition The Company recognizes revenue from the sale of merchandise, net of discounts and anallowance for estimated returns, at the time the merchandise is sold. The allowance for sales returns is based onhistorical experience and was approximately $0.3 million for both fiscal 2003 and 2002 and $0.2 million forfiscal 2001.
Inventory Inventories are stated at the lower of cost or market with cost determined under the retail inventorymethod (“RIM”), in which the valuation of inventories at cost and gross margins is calculated by applying a cal-culated cost-to-retail ratio to the retail value of inventories. RIM is an averaging method that is widely used inthe retail industry due to its practicality. Also, the Company’s use of the RIM results in valuing inventories atlower of cost or market as markdowns are currently taken as a reduction of the retail value of inventories.Inherent in the RIM calculation are certain significant management judgments and estimates including, amongothers, merchandise markon, markdowns and shrinkage, which impact the ending inventory valuation at cost aswell as gross margin. To reduce the potential of such distortions in the valuation of inventory, the Company’sRIM utilizes multiple departments in which fairly homogeneous classes of merchandise inventories having similargross margins are grouped. In addition, failure to take timely markdowns could result in an overstatement ofcost under the lower of cost or market principle. When necessary, the Company records a markdown allowancethat reduces inventory value to the lower of cost or market. Management believes that the Company’s RIM
22/23
provides an inventory valuation that reasonably approximates cost and results in carrying inventory at thelower of cost or market.
Insurance / Benefits The Company records estimates for certain health and welfare, workers’ compensationand casualty insurance costs that are self-insurance programs with per occurrence and aggregate limits on losses.Should a greater amount of claims occur compared to what was estimated or costs of medical care increasebeyond what was anticipated, reserves recorded may not be sufficient and additional costs to the consolidatedfinancial statements could be required.
Other Accounting Estimates Estimates inherent in the preparation of the Company’s financial statementsinclude those associated with the evaluation of the recoverability of recorded deferred tax assets, the adequacyof recorded deferred tax liabilities, the impairment of goodwill and long-lived assets and those estimates usedin the determination of liabilities related to litigation, claims and assessments. Various assumptions and otherfactors underlie the determination of these significant estimates. The process of determining significant estimatesis fact specific and takes into account factors such as historic experience and current and expected economicconditions. The Company periodically reevaluates these significant factors and makes adjustments where factsand circumstances dictate. To date, actual results have not significantly deviated from those determined usingthe estimates described above.
The Company has not recorded a valuation allowance to reduce its deferred tax assets and believes therecorded deferred tax liability is adequate. The Company has considered future taxable income and ongoingprudent and feasible tax planning strategies in assessing the need for a valuation allowance and the adequacyof the recorded deferred tax liability. In the event the Company were to determine that it would not be able torealize all or part of its net deferred tax assets in the future, an adjustment to deferred tax assets would becharged to income in the period such a determination was made. Likewise, should the Company determine itwould be able to realize deferred tax assets in the future in excess of the net recorded amount, an adjustmentto the deferred tax asset would increase income in the period such a determination was made. If the Companywere to determine that its recorded tax liabilities were understated, an adjustment to deferred tax liabilitieswould be charged to income in the period such a determination was made. Conversely, should the Companydetermine that its deferred tax liabilities are in excess of its actual liability, an adjustment to deferred tax liabili-ties would increase income in the period such a determination was made.
The Company had net goodwill in the amount of $4.2 million at January 31, 2004. In accordance withStatement of Financial Accounting Standard No. 142, “Goodwill and Other Intangible Assets,” the Companyperformed an impairment test, which resulted in no impairment being identified.
The Company is involved in litigation, claims and assessments incidental to its business, the disposition of whichis not expected to have a material effect on the Company’s financial position or results of operations.* It is pos-sible, however, that future results of operations for any particular quarterly or annual period could be materiallyaffected by changes in the Company’s assumptions related to these matters. The Company accrues its best esti-mate of the probable cost for the resolution of claims. When appropriate, such estimates are developed in con-sultation with outside counsel handling the matters and are based upon a combination of litigation and settle-ment strategies. To the extent additional information arises or the Company’s strategies change, it is possiblethat the Company’s best estimate of its probable liability may change.

Factors Affecting Future Performance
The Company’s continued success depends, in part, upon its ability to increase sales at existing locations, to opennew stores and to operate stores on a profitable basis. There can be no assurance that the Company’s existingstrategies and store expansion program will result in a continuation of revenue and profit growth. Future eco-nomic and industry trends that could potentially impact revenue and profitability are difficult to predict.
The Company’s future performance is subject to risks and uncertainties that include, without limitation, a gener-al deterioration in economic trends, ongoing competitive pressures in the retail industry, obtaining acceptablestore locations, timely introduction and customer acceptance of the Company’s merchandise offering, theCompany’s ability to efficiently source and distribute products, the Company’s ability to realize expected operational and cost efficiencies from its distribution centers, the Company’s ability to successfully extend itsgeographic reach into new markets, unseasonable weather trends, significant increases in the cost of fuel or util-ity services, changes in the level of consumer spending on, or preferences for, home-related merchandise, fluc-tuations in the value of the U.S. dollar against foreign currencies, changes in accounting rules and regulations,the Company’s ability to attract and retain the retail talent necessary to execute its strategies, internationalconflicts and political strife and the effects on the flow or price of merchandise from overseas, terrorist attacksand our nation’s response thereto and the Company’s ability to implement and integrate various new systemsand technologies. In addition, the Company’s corporate headquarters, one of its distribution centers and a significant number of its stores are located in California; therefore, a downturn in the California economy or amajor natural disaster could significantly affect the Company’s operating results and financial condition.
In addition to the above factors, the retail industry is highly seasonal. The net sales of the Company for thefourth (Holiday) fiscal quarter are historically higher than each of the first three fiscal quarters. The Companyhas realized a significant portion of its profits in each fiscal year during the fourth fiscal quarter. If intensifiedprice competition, lower than anticipated consumer demand or other factors were to occur during the fourth fis-cal quarter, the Company’s fiscal year results could be adversely affected.
Results of Operations
Fiscal 2003 Compared to Fiscal 2002
Net Sales Net sales consist of sales from comparable stores and non-comparable stores. Net sales increased$109.3 million, or 15.8%, to $801.6 million in fiscal 2003, from $692.3 million in fiscal 2002. The increase in netsales was attributable to an increase in comparable and non-comparable store sales. Comparable store salesrose 2.7%, or $18.1 million in fiscal 2003, compared to 5.6%, or $30.1 million, in fiscal 2002. Comparablestore sales increased primarily as a result of an increase in average transaction size per customer. The increasein average transaction size per customer resulted primarily from strong net sales increases in products such asfurniture that carry a higher average price. Non-comparable store sales, which include all stores open less thanfourteen full fiscal months, increased $91.2 million. As of January 31, 2004, the Company operated 204 storescompared to 175 stores as of February 1, 2003.
The Company classifies its sales into the home furnishings and consumables product lines. Home furnishings were62% of sales in fiscal 2003 compared to 63% in the prior year and consumables were 38% in fiscal 2003 com-pared to 37% in the prior year. The sales mix shift to consumables was primarily due to strong beverage sales.
Cost of Sales and Occupancy Cost of sales and occupancy, which consists of costs to acquire merchandise inven-tory, costs of freight and distribution, as well as certain facility costs, increased $71.4 million, or 15.8%, to $521.8
24 /25

million, in fiscal 2003 compared to $450.4 million in fiscal 2002. Cost of sales increased $61.0 million primarilydue to increased sales volume. Occupancy costs increased $10.4 million due to the addition of 29 net new storesin fiscal 2003, increased common area maintenance costs passed through by landlords and higher real estatetax assessments. Total cost of sales and occupancy as a percentage of sales was 65.1%, the same as last year.
Gross Profit As a percentage of net sales, gross profit was 34.9% in fiscal 2003 and fiscal 2002. Althoughgross profit for the year was consistent with last year, the Company experienced improved margins related todistribution center cost efficiencies, higher mark-ups and lower inventory shrinkage, which were offset by highermarkdowns and occupancy costs.
Selling, General and Administrative (“SG&A”) Expenses SG&A expense increased $27.0 million, or 14.0%, infiscal 2003 compared to fiscal 2002. The increase was primarily due to the addition of new stores openedthroughout fiscal 2002 and 2003, totaling a net of 54 new stores. As a percentage of net sales, SG&A expensedecreased to 27.4% in the current year from 27.8% last year. Results for fiscal 2002 included a charge for awage and hour lawsuit settlement and professional fees related to an employment and capital investment taxstudy. Together these costs impacted the SG&A rate in fiscal 2002 by approximately 0.5 percentage points.
Store Preopening Expenses Store preopening expenses, which include grand opening advertising and pre-opening merchandise setup expenses, were $5.7 million in fiscal 2003 compared to $5.4 million in fiscal 2002.The Company opened 31 stores in fiscal 2003 compared to 26 stores in fiscal 2002. Expenses vary dependingon the particular store site and whether it is located in a new or existing market.
Net Interest Expense Net interest expense, which includes interest on capital leases and interest expense on theCompany’s revolving line of credit, net of interest income earned on Company investments, was $3.3 million infiscal 2003 and $3.5 million in fiscal 2002. This decrease in net interest expense is primarily due to lower aver-age borrowings on the line of credit compared to last year.
Income Taxes The Company’s effective tax rate was 36.0% in fiscal 2003 and 30.4% in fiscal 2002. The ratefor fiscal 2002 was substantially reduced by tax credits relating to an employment and capital investment taxstudy completed in 2002. Of the credits recognized in 2002, $2.4 million related to prior years. Excluding theeffect of the tax credits recorded in fiscal 2002 that related to prior years, the Company’s effective tax rate infiscal 2002 was 35.8%. For fiscal 2004, the Company expects that the effective tax rate will be 38.0% due tothe diminishing impact of the employment and capital investment tax credits.*
Fiscal 2002 Compared to Fiscal 2001
Net Sales Net sales consist of sales from comparable stores and non-comparable stores. Net sales increased$123.8 million, or 21.8%, to $692.3 million in fiscal 2002, from $568.5 million in fiscal 2001. The increase in netsales was attributable to an increase in comparable and non-comparable store sales. Comparable store salesrose 5.6%, or $30.1 million for fiscal 2002, compared to 0.3%, or $1.3 million, in fiscal 2001. Comparable storesales increased as a result of a 2.7% increase in customer sales checks and a 2.9% increase in average trans-action size per customer. The increase in average transaction size per customer resulted primarily from a salesmix shift to home furnishings, which carry a higher average retail price. Non-comparable store sales, whichinclude all stores open less than fourteen full fiscal months, increased $93.7 million. As of February 1, 2003, theCompany operated 175 stores compared to 150 stores as of February 2, 2002.
The Company classifies its sales into the home furnishings and consumables product lines. Home furnishingswere 63% of sales in fiscal 2002 compared to 62% in the prior year, and consumables were 37% in fiscal
2002 compared to 38% in the prior year. The sales mix shift to home furnishings was primarily due to strongsales in the dining and living room furniture categories.
Cost of Sales and Occupancy Cost of sales and occupancy, which consists of costs to acquire merchandiseinventory, costs of freight and distribution, as well as certain facility costs, increased $77.4 million, or 20.8%, infiscal 2002 compared to fiscal 2001. Cost of sales increased $67.4 million due to the increased sales volume, aswell as an increase in distribution costs from the ramp-up of the Company’s new Virginia distribution center.Occupancy costs increased $10.0 million due to the addition of 25 net new stores in fiscal 2002, an increase inrental rates for renewal lease agreements and increases in common area maintenance costs passed through bylandlords under these agreements. Total cost of sales and occupancy decreased 0.5 percentage points to65.1% of sales in fiscal 2002 from 65.6% of sales in fiscal 2001. The decline was mainly due to a higher salesmix of home furnishings in fiscal 2002 which have a lower product cost as a percentage of sales.
Gross Profit As a percentage of net sales, gross profit was 34.9% in fiscal 2002 and 34.4% in fiscal 2001. Theincrease was largely due to a sales mix shift to higher margin home furnishings. Home furnishings made up63% of total sales in fiscal 2002, compared to 62% in fiscal 2001.
Selling, General and Administrative ( “SG&A”) Expenses As a percentage of net sales, SG&A expensesincreased to 27.8% in fiscal 2002 from 27.6% in fiscal 2001. The increase in the SG&A expense rate resultedprimarily from costs associated with the settlement of claims relating to the California wage and hour lawsuitand professional fees related to an employment and capital investment tax study. The combined impact of thelegal settlement and the tax study was approximately $3.5 million. Additional costs associated with new storesadded in fiscal 2001 and 2002, which together totaled a net of 48 new stores, together with the cost of the set-tlement and tax study substantially contributed to the $35.5 million increase in SG&A expenses. Partially offset-ting this effect was the additional leverage on operating expenses from increased sales.
Store Preopening Expenses Store preopening expenses, which include grand opening advertising and pre-opening merchandise setup expenses, were $5.4 million in fiscal 2002 and $4.6 million in fiscal 2001. Expensesvary depending on the particular store site and whether it is located in a new or existing market. The Companyopened 26 stores in fiscal 2002 compared to 23 stores in fiscal 2001.
Net Interest Expense Net interest expense, which includes interest on capital leases and interest expense on theCompany’s revolving line of credit, net of interest income earned on Company investments, was $3.5 million infiscal 2002 and $1.0 million in fiscal 2001. This increase in net interest expense was due to an increase in capi-tal lease interest incurred in connection with leases signed for the Virginia distribution center, higher averageborrowings and lower interest earned on investments due to a significant drop in the prime rate.
Income Taxes The Company’s effective tax rate was 30.4% in fiscal 2002 and 39.0% in fiscal 2001. The decreasein the tax rate was substantially due to tax credits relating to an employment and capital investment tax studyrecorded in fiscal 2002. Of the credits recognized in fiscal 2002, $2.4 million related to prior years. Excluding theeffect of the prior year credits and associated fees, the Company’s effective tax rate was 35.8% for fiscal 2002.
Inflation
The Company does not believe that inflation has had a material effect on its financial condition and results ofoperations during the past three fiscal years. However, there can be no assurance that the Company’s businesswill not be affected by inflation in the future.
26/27
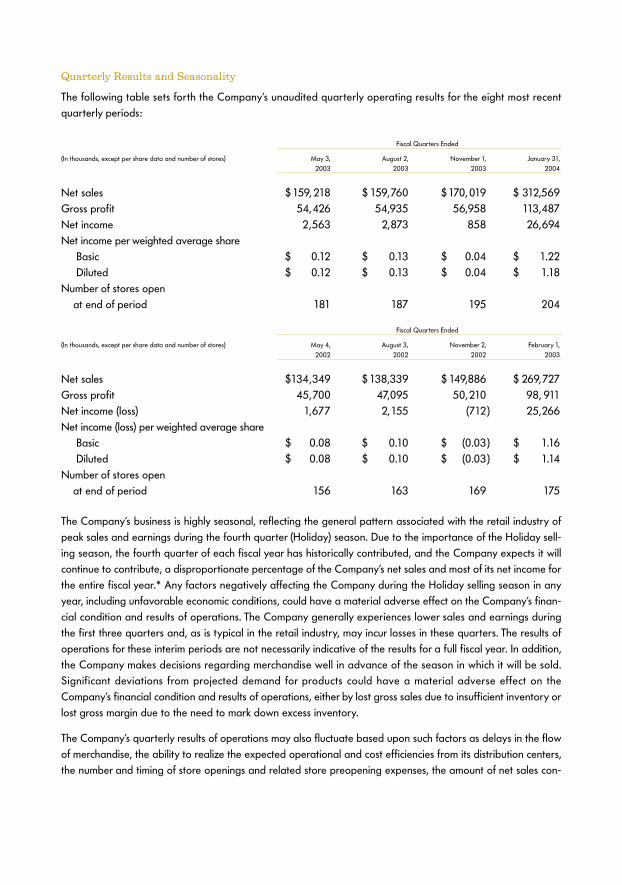
Quarterly Results and Seasonality
The following table sets forth the Company’s unaudited quarterly operating results for the eight most recentquarterly periods:
Fiscal Quarters Ended
(In thousands, except per share data and number of stores) May 3, August 2, November 1, January 31, 2003 2003 2003 2004
Net sales $159, 218 $ 159,760 $170,019 $ 312,569Gross profit 54,426 54,935 56,958 113,487Net income 2,563 2,873 858 26,694Net income per weighted average share
Basic $ 0.12 $ 0.13 $ 0.04 $ 1.22Diluted $ 0.12 $ 0.13 $ 0.04 $ 1.18
Number of stores open at end of period 181 187 195 204
Fiscal Quarters Ended
(In thousands, except per share data and number of stores) May 4, August 3, November 2, February 1, 2002 2002 2002 2003
Net sales $134,349 $138,339 $ 149,886 $ 269,727Gross profit 45,700 47,095 50,210 98, 911Net income (loss) 1,677 2,155 (712) 25,266Net income (loss) per weighted average share
Basic $ 0.08 $ 0.10 $ (0.03) $ 1.16Diluted $ 0.08 $ 0.10 $ (0.03) $ 1.14
Number of stores open at end of period 156 163 169 175
The Company’s business is highly seasonal, reflecting the general pattern associated with the retail industry ofpeak sales and earnings during the fourth quarter (Holiday) season. Due to the importance of the Holiday sell-ing season, the fourth quarter of each fiscal year has historically contributed, and the Company expects it willcontinue to contribute, a disproportionate percentage of the Company’s net sales and most of its net income forthe entire fiscal year.* Any factors negatively affecting the Company during the Holiday selling season in anyyear, including unfavorable economic conditions, could have a material adverse effect on the Company’s finan-cial condition and results of operations. The Company generally experiences lower sales and earnings duringthe first three quarters and, as is typical in the retail industry, may incur losses in these quarters. The results ofoperations for these interim periods are not necessarily indicative of the results for a full fiscal year. In addition,the Company makes decisions regarding merchandise well in advance of the season in which it will be sold.Significant deviations from projected demand for products could have a material adverse effect on theCompany’s financial condition and results of operations, either by lost gross sales due to insufficient inventory orlost gross margin due to the need to mark down excess inventory.
The Company’s quarterly results of operations may also fluctuate based upon such factors as delays in the flowof merchandise, the ability to realize the expected operational and cost efficiencies from its distribution centers,the number and timing of store openings and related store preopening expenses, the amount of net sales con-
tributed by new and existing stores, the mix of products sold, the timing and level of markdowns, store closingsor relocations, competitive factors, changes in fuel and other shipping costs, general economic conditions,geopolitical conditions, fluctuations in the value of the U.S. dollar against foreign currencies, labor market fluc-tuations, changes in accounting rules and regulations and unseasonable weather conditions.
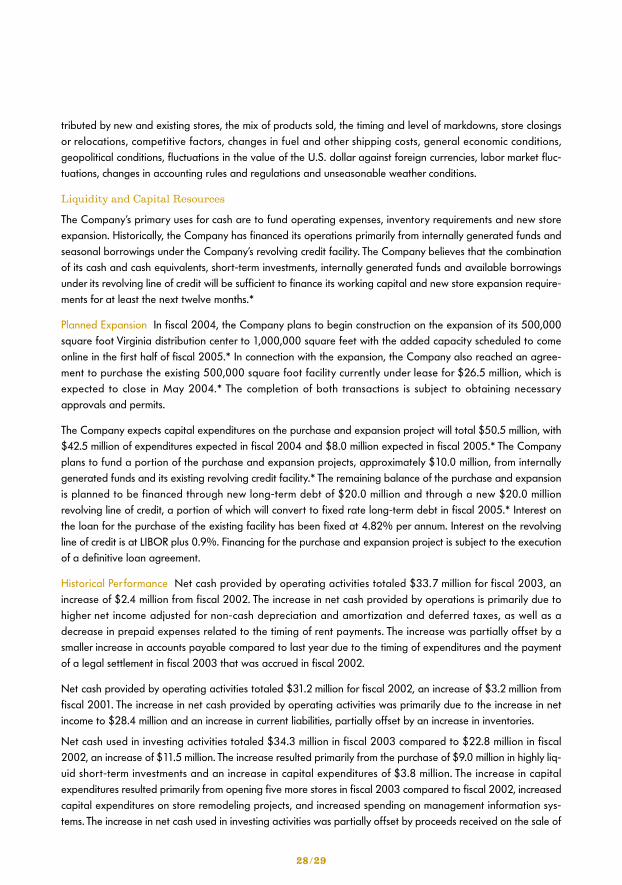
Liquidity and Capital Resources
The Company’s primary uses for cash are to fund operating expenses, inventory requirements and new storeexpansion. Historically, the Company has financed its operations primarily from internally generated funds andseasonal borrowings under the Company’s revolving credit facility. The Company believes that the combinationof its cash and cash equivalents, short-term investments, internally generated funds and available borrowingsunder its revolving line of credit will be sufficient to finance its working capital and new store expansion require-ments for at least the next twelve months.*
Planned Expansion In fiscal 2004, the Company plans to begin construction on the expansion of its 500,000square foot Virginia distribution center to 1,000,000 square feet with the added capacity scheduled to comeonline in the first half of fiscal 2005.* In connection with the expansion, the Company also reached an agree-ment to purchase the existing 500,000 square foot facility currently under lease for $26.5 million, which isexpected to close in May 2004.* The completion of both transactions is subject to obtaining necessaryapprovals and permits.
The Company expects capital expenditures on the purchase and expansion project will total $50.5 million, with$42.5 million of expenditures expected in fiscal 2004 and $8.0 million expected in fiscal 2005.* The Companyplans to fund a portion of the purchase and expansion projects, approximately $10.0 million, from internallygenerated funds and its existing revolving credit facility.* The remaining balance of the purchase and expansionis planned to be financed through new long-term debt of $20.0 million and through a new $20.0 millionrevolving line of credit, a portion of which will convert to fixed rate long-term debt in fiscal 2005.* Interest onthe loan for the purchase of the existing facility has been fixed at 4.82% per annum. Interest on the revolvingline of credit is at LIBOR plus 0.9%. Financing for the purchase and expansion project is subject to the executionof a definitive loan agreement.
Historical Performance Net cash provided by operating activities totaled $33.7 million for fiscal 2003, anincrease of $2.4 million from fiscal 2002. The increase in net cash provided by operations is primarily due tohigher net income adjusted for non-cash depreciation and amortization and deferred taxes, as well as adecrease in prepaid expenses related to the timing of rent payments. The increase was partially offset by asmaller increase in accounts payable compared to last year due to the timing of expenditures and the paymentof a legal settlement in fiscal 2003 that was accrued in fiscal 2002.
Net cash provided by operating activities totaled $31.2 million for fiscal 2002, an increase of $3.2 million fromfiscal 2001. The increase in net cash provided by operating activities was primarily due to the increase in netincome to $28.4 million and an increase in current liabilities, partially offset by an increase in inventories.
Net cash used in investing activities totaled $34.3 million in fiscal 2003 compared to $22.8 million in fiscal2002, an increase of $11.5 million. The increase resulted primarily from the purchase of $9.0 million in highly liq-uid short-term investments and an increase in capital expenditures of $3.8 million. The increase in capitalexpenditures resulted primarily from opening five more stores in fiscal 2003 compared to fiscal 2002, increasedcapital expenditures on store remodeling projects, and increased spending on management information sys-tems. The increase in net cash used in investing activities was partially offset by proceeds received on the sale of
28/29
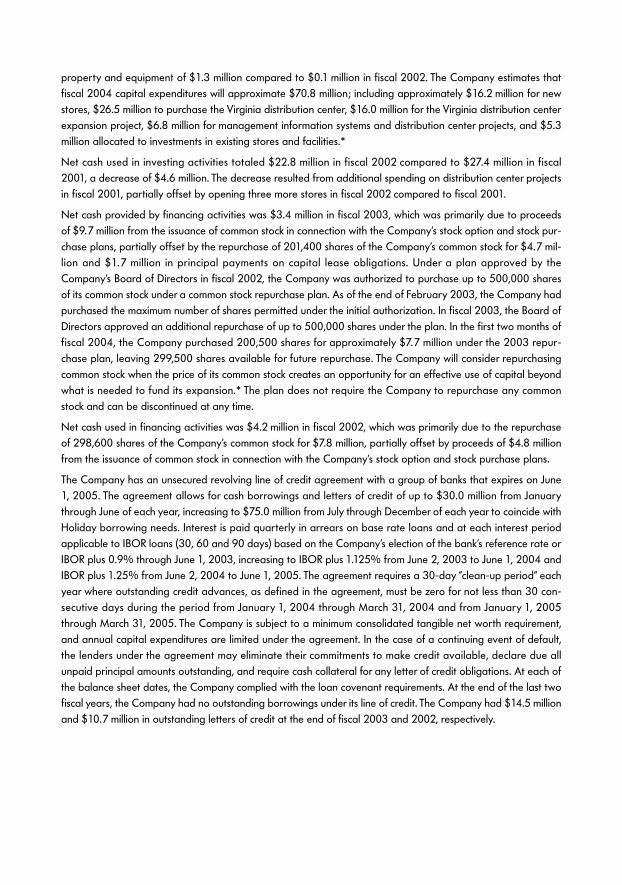
property and equipment of $1.3 million compared to $0.1 million in fiscal 2002. The Company estimates thatfiscal 2004 capital expenditures will approximate $70.8 million; including approximately $16.2 million for newstores, $26.5 million to purchase the Virginia distribution center, $16.0 million for the Virginia distribution centerexpansion project, $6.8 million for management information systems and distribution center projects, and $5.3million allocated to investments in existing stores and facilities.*
Net cash used in investing activities totaled $22.8 million in fiscal 2002 compared to $27.4 million in fiscal2001, a decrease of $4.6 million. The decrease resulted from additional spending on distribution center projectsin fiscal 2001, partially offset by opening three more stores in fiscal 2002 compared to fiscal 2001.
Net cash provided by financing activities was $3.4 million in fiscal 2003, which was primarily due to proceedsof $9.7 million from the issuance of common stock in connection with the Company’s stock option and stock pur-chase plans, partially offset by the repurchase of 201,400 shares of the Company’s common stock for $4.7 mil-lion and $1.7 million in principal payments on capital lease obligations. Under a plan approved by theCompany’s Board of Directors in fiscal 2002, the Company was authorized to purchase up to 500,000 sharesof its common stock under a common stock repurchase plan. As of the end of February 2003, the Company hadpurchased the maximum number of shares permitted under the initial authorization. In fiscal 2003, the Board ofDirectors approved an additional repurchase of up to 500,000 shares under the plan. In the first two months offiscal 2004, the Company purchased 200,500 shares for approximately $7.7 million under the 2003 repur-chase plan, leaving 299,500 shares available for future repurchase. The Company will consider repurchasingcommon stock when the price of its common stock creates an opportunity for an effective use of capital beyondwhat is needed to fund its expansion.* The plan does not require the Company to repurchase any commonstock and can be discontinued at any time.
Net cash used in financing activities was $4.2 million in fiscal 2002, which was primarily due to the repurchaseof 298,600 shares of the Company’s common stock for $7.8 million, partially offset by proceeds of $4.8 millionfrom the issuance of common stock in connection with the Company’s stock option and stock purchase plans.
The Company has an unsecured revolving line of credit agreement with a group of banks that expires on June1, 2005. The agreement allows for cash borrowings and letters of credit of up to $30.0 million from Januarythrough June of each year, increasing to $75.0 million from July through December of each year to coincide withHoliday borrowing needs. Interest is paid quarterly in arrears on base rate loans and at each interest periodapplicable to IBOR loans (30, 60 and 90 days) based on the Company’s election of the bank’s reference rate orIBOR plus 0.9% through June 1, 2003, increasing to IBOR plus 1.125% from June 2, 2003 to June 1, 2004 andIBOR plus 1.25% from June 2, 2004 to June 1, 2005. The agreement requires a 30-day “clean-up period” eachyear where outstanding credit advances, as defined in the agreement, must be zero for not less than 30 con-secutive days during the period from January 1, 2004 through March 31, 2004 and from January 1, 2005through March 31, 2005. The Company is subject to a minimum consolidated tangible net worth requirement,and annual capital expenditures are limited under the agreement. In the case of a continuing event of default,the lenders under the agreement may eliminate their commitments to make credit available, declare due allunpaid principal amounts outstanding, and require cash collateral for any letter of credit obligations. At each ofthe balance sheet dates, the Company complied with the loan covenant requirements. At the end of the last twofiscal years, the Company had no outstanding borrowings under its line of credit. The Company had $14.5 millionand $10.7 million in outstanding letters of credit at the end of fiscal 2003 and 2002, respectively.

The line of credit represents the Company’s only commercial credit facility in fiscal 2003. In fiscal 2004, theCompany expects to obtain an additional credit facility and incur long-term debt related to its planned pur-chase and expansion of the Virginia distribution center.*
Off-Balance Sheet Arrangements
The Company has no financial arrangements involving special-purpose entities or lease agreements, commonlydescribed as synthetic leases, or any off-balance sheet arrangements that have a material current effect, orthat are reasonably likely to have a material future effect, on the Company’s financial condition, revenues orexpenses, results of operations, liquidity, capital expenditures or capital resources.*
Contractual Obligations
The table below presents significant contractual obligations of the Company at January 31, 2004:
Total AmountContractual Obligations (in millions) Less than 1 year 1-3 years 4-5 Years After 5 Years Committed
Operating leases1 $ 60.0 $ 167.1 $ 98.0 $ 137.0 $ 462.1Capital leases (principal and interest)1 5.2 15.3 9.5 44.4 74.4Purchase obligations2 100.0 — — — 100.0Other long-term obligations3 — — — — —Total contractual cash obligations4 $165.2 $182.4 $ 107.5 $ 181.4 $ 636.5
1. In addition, the Company will have future obligations for real estate taxes and common area maintenance charges passed through by landlords. For the year ended January 31,
2004, the Company paid approximately $13.0 million in such costs for its leased properties. The company expects these costs will increase annually.* The present value of capital
lease obligations is included in the Company’s Consolidated Balance Sheet. See Note 4 of the Notes to Consolidated Financial Statements for additional information about the
Company’s lease obligations.
2. As of January 31, 2004, the Company had approximately $100.0 million of outstanding purchase orders, which were primarily related to merchandise inventory. Such purchase
orders are generally cancelable at the discretion of the Company until the order has been shipped. The table above excludes certain immaterial executory contracts for goods and
services that tend to be recurring in nature and similar in amount year over year.
3. The Company’s Consolidated Balance Sheet as of January 31, 2004 includes $15.2 million classified as other long-term obligations. This caption consists primarily of deferred rent
(see Note 1 of the Consolidated Financial Statements for more information) and deferred compensation. The deferred rent liability has been excluded from the above table as future
cash flows related to the deferred rent balance are included in the operating leases caption. The deferred compensation balance has been excluded from the above table as the
timing and/or the amount of any cash payment is uncertain. The obligations of the Company under the deferred compensation plan are payable when employees elect distribution.
Employees, other than retirees, are required to provide notice of their intent to withdraw funds two years prior to withdrawal. The Company is unable to predict when employees will
make any such withdrawal elections; however, when such elections are made they will be funded solely from segregated assets held in trust for this purpose.
4. The above amounts do not include payments that may be due under employment agreements with certain employees. The terms and amounts under such agreements are disclosed
in the Proxy Statement for the Company’s 2004 Annual Meeting of Shareholders.
New Accounting Pronouncements
In December 2003, the Financial Accounting Standards Board (“FASB”) issued FASB Interpretation No. 46(R)“Consolidation of Variable Interest Entities,” (“FIN 46(R)”). FIN 46(R) replaces FIN 46 and addresses consolida-tion by business enterprises of variable interest entities. The provisions of FIN 46(R) are effective for the firstreporting period that ends after December 15, 2003 for variable interests in those entities commonly referredto as special-purpose entities. Application of the provisions of FIN 46(R) for all other entities is effective for thefirst reporting period ending after March 15, 2004. The Company has no interest in any entity considered aspecial-purpose entity; therefore, the initial adoption of FIN 46(R) did not have an impact on the Company. TheCompany also believes the adoption of the provisions of FIN 46(R) in the first quarter of 2004 will have noimpact on net earnings, cash flows or financial position.*
30/31
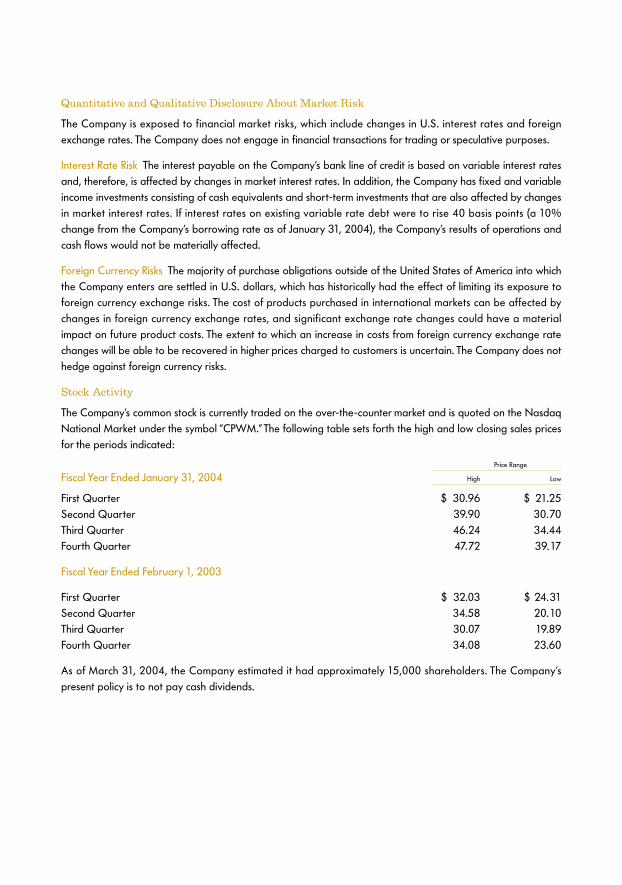
Quantitative and Qualitative Disclosure About Market Risk
The Company is exposed to financial market risks, which include changes in U.S. interest rates and foreignexchange rates. The Company does not engage in financial transactions for trading or speculative purposes.
Interest Rate Risk The interest payable on the Company’s bank line of credit is based on variable interest ratesand, therefore, is affected by changes in market interest rates. In addition, the Company has fixed and variableincome investments consisting of cash equivalents and short-term investments that are also affected by changesin market interest rates. If interest rates on existing variable rate debt were to rise 40 basis points (a 10%change from the Company’s borrowing rate as of January 31, 2004), the Company’s results of operations andcash flows would not be materially affected.
Foreign Currency Risks The majority of purchase obligations outside of the United States of America into whichthe Company enters are settled in U.S. dollars, which has historically had the effect of limiting its exposure toforeign currency exchange risks. The cost of products purchased in international markets can be affected bychanges in foreign currency exchange rates, and significant exchange rate changes could have a materialimpact on future product costs. The extent to which an increase in costs from foreign currency exchange ratechanges will be able to be recovered in higher prices charged to customers is uncertain. The Company does nothedge against foreign currency risks.
Stock Activity
The Company’s common stock is currently traded on the over-the-counter market and is quoted on the NasdaqNational Market under the symbol “CPWM.” The following table sets forth the high and low closing sales pricesfor the periods indicated:
Price Range
Fiscal Year Ended January 31, 2004 High Low
First Quarter $ 30.96 $ 21.25Second Quarter 39.90 30.70Third Quarter 46.24 34.44Fourth Quarter 47.72 39.17
Fiscal Year Ended February 1, 2003
First Quarter $ 32.03 $ 24.31Second Quarter 34.58 20.10Third Quarter 30.07 19.89Fourth Quarter 34.08 23.60
As of March 31, 2004, the Company estimated it had approximately 15,000 shareholders. The Company’spresent policy is to not pay cash dividends.
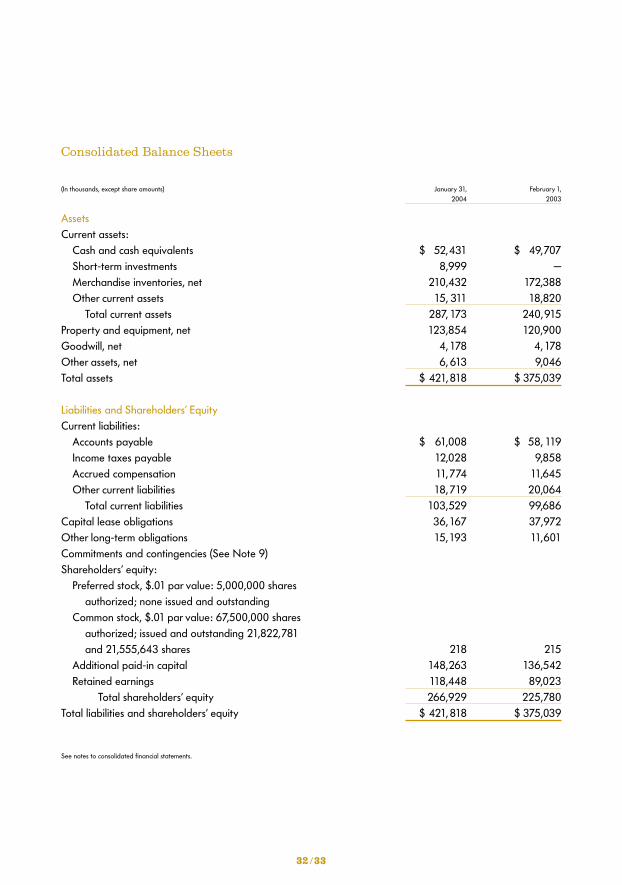
Consolidated Balance Sheets
(In thousands, except share amounts) January 31, February 1, 2004 2003
AssetsCurrent assets:
Cash and cash equivalents $ 52,431 $ 49,707Short-term investments 8,999 —Merchandise inventories, net 210,432 172,388Other current assets 15, 311 18,820
Total current assets 287, 173 240,915Property and equipment, net 123,854 120,900Goodwill, net 4,178 4,178Other assets, net 6, 613 9,046Total assets $ 421,818 $ 375,039
Liabilities and Shareholders’ EquityCurrent liabilities:
Accounts payable $ 61,008 $ 58, 119Income taxes payable 12,028 9,858Accrued compensation 11,774 11,645Other current liabilities 18,719 20,064
Total current liabilities 103,529 99,686Capital lease obligations 36,167 37,972Other long-term obligations 15,193 11,601Commitments and contingencies (See Note 9)Shareholders’ equity:
Preferred stock, $.01 par value: 5,000,000 shares authorized; none issued and outstanding
Common stock, $.01 par value: 67,500,000 shares authorized; issued and outstanding 21,822,781and 21,555,643 shares 218 215
Additional paid-in capital 148,263 136,542Retained earnings 118,448 89,023
Total shareholders’ equity 266,929 225,780Total liabilities and shareholders’ equity $ 421, 818 $ 375,039
See notes to consolidated financial statements.
32 /33
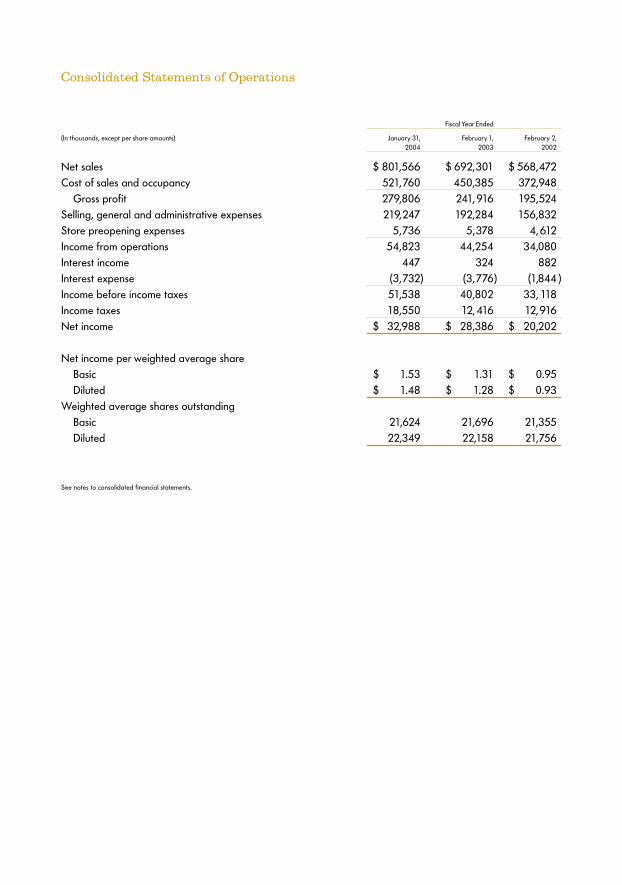
Consolidated Statements of Operations
Fiscal Year Ended
(In thousands, except per share amounts) January 31, February 1, February 2, 2004 2003 2002
Net sales $ 801,566 $ 692,301 $ 568,472Cost of sales and occupancy 521,760 450,385 372,948
Gross profit 279,806 241, 916 195,524Selling, general and administrative expenses 219,247 192,284 156,832Store preopening expenses 5,736 5,378 4, 612Income from operations 54,823 44,254 34,080Interest income 447 324 882Interest expense (3,732) (3,776) (1,844 )Income before income taxes 51,538 40,802 33, 118Income taxes 18,550 12, 416 12,916Net income $ 32,988 $ 28,386 $ 20,202
Net income per weighted average shareBasic $ 1.53 $ 1.31 $ 0.95Diluted $ 1.48 $ 1.28 $ 0.93
Weighted average shares outstandingBasic 21,624 21,696 21,355Diluted 22,349 22,158 21,756
See notes to consolidated financial statements.
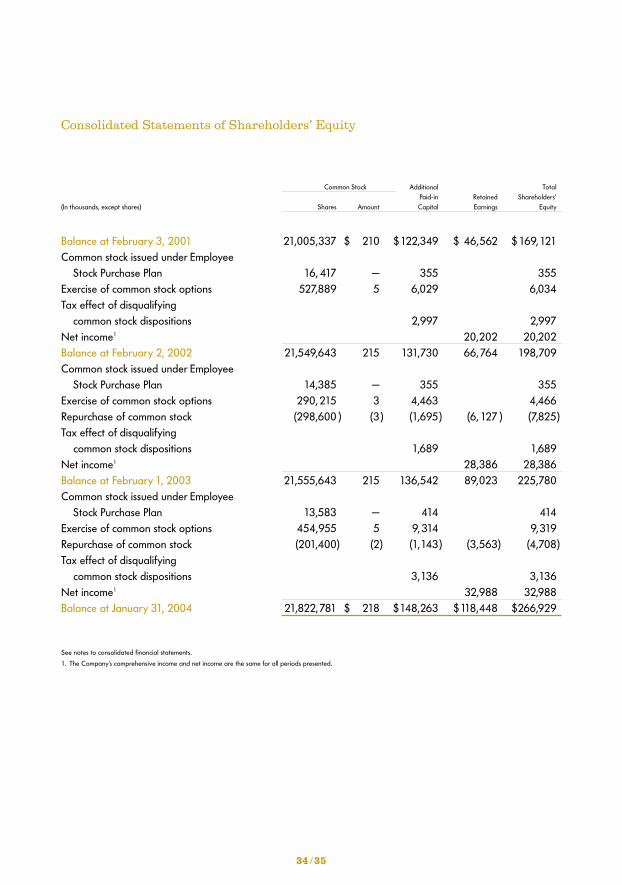
Consolidated Statements of Shareholders’ Equity
Common Stock Additional TotalPaid-in Retained Shareholders’
(In thousands, except shares) Shares Amount Capital Earnings Equity
Balance at February 3, 2001 21,005,337 $ 210 $122,349 $ 46,562 $169,121Common stock issued under Employee
Stock Purchase Plan 16, 417 — 355 355Exercise of common stock options 527,889 5 6,029 6,034Tax effect of disqualifying
common stock dispositions 2,997 2,997Net income1 20,202 20,202Balance at February 2, 2002 21,549,643 215 131,730 66,764 198,709Common stock issued under Employee
Stock Purchase Plan 14,385 — 355 355Exercise of common stock options 290, 215 3 4,463 4,466Repurchase of common stock (298,600 ) (3 ) (1,695) (6, 127 ) (7,825)Tax effect of disqualifying
common stock dispositions 1,689 1,689Net income1 28,386 28,386Balance at February 1, 2003 21,555,643 215 136,542 89,023 225,780Common stock issued under Employee
Stock Purchase Plan 13,583 — 414 414Exercise of common stock options 454,955 5 9, 314 9,319Repurchase of common stock (201,400) (2) (1,143) (3,563) (4,708)Tax effect of disqualifying
common stock dispositions 3,136 3,136Net income1 32,988 32,988Balance at January 31, 2004 21,822,781 $ 218 $148,263 $118,448 $266,929
See notes to consolidated financial statements.
1. The Company’s comprehensive income and net income are the same for all periods presented.
34 /35

Consolidated Statements of Cash Flows
Fiscal Year Ended
(In thousands) January 31, February 1, February 2, 2004 2003 2002
Cash Flows From Operating Activities:Net income $ 32,988 $ 28,386 $ 20,202Adjustments to reconcile net income to net cash provided by operating activities:
Depreciation and amortization 22, 740 19,895 16,523Deferred income taxes 5,981 961 234Changes in assets and liabilities:
Merchandise inventories (38,044) (41,044) (21, 515)Other assets 2,035 (3,154) (5,667)Accounts payable 2,889 14,129 12,398Other liabilities 5,069 12,050 5,832
Net cash provided by operating activities 33,658 31,223 28,007
Cash Flows From Investing Activities:Purchase of short-term investments (8,999) — —Purchases of property and equipment (26,636) (22, 874) (27,444)Proceeds from sale of property and equipment 1,348 90 33
Net cash used in investing activities (34,287) (22,784) (27, 411)
Cash Flows From Financing Activities:Principal payments on capital lease obligations (1,672) (1, 148) (380)Common stock repurchases (4,708) (7,825) —Proceeds from the issuance of common stock 9,733 4,821 6,389
Net cash provided by (used in) financing activities 3,353 (4, 152) 6,009
Net increase in cash and cash equivalents 2,724 4,287 6,605
Cash and Cash Equivalents:Beginning of period 49,707 45,420 38, 815End of period $ 52,431 $ 49, 707 $ 45,420
Supplemental Disclosures of Cash Flow Information:Cash paid for interest $ 3,609 $ 3,283 $ 912Cash paid for taxes $ 7,262 $ 9,988 $ 9, 537
Non-cash Financing:Capital lease obligation related to distribution center $ — $ 6,686 $ 20,632
See notes to consolidated financial statements.
Notes to Consolidated Financial Statements
Note 1. Summary of Business and Significant Accounting Policies
Business Cost Plus, Inc. and its subsidiaries (the “Company”) is a specialty retailer of casual home living andentertaining products. At January 31, 2004, the Company operated 204 stores in 26 states under the names“World Market,” “Cost Plus World Market,” “Cost Plus” and “Cost Plus Imports.” The Company’s product offeringsare designed to provide solutions to customers’ casual home furnishing and home entertaining needs. The offer-ings include home decorating items such as furniture and rugs, as well as a variety of tabletop and kitchenproducts. Cost Plus stores also offer a number of gift and decorative accessories including collectibles, cards,wrapping paper and other seasonal items. In addition, Cost Plus offers its customers a wide selection of gour-met foods and beverages, including wine, micro-brewed and imported beer, coffee and tea. The Companyaccounts for its operations as one operating segment.
Fiscal Year The Company’s fiscal year end is the Saturday closest to the end of January. The current and prior fiscalyears ended January 31, 2004 (fiscal 2003), February 1, 2003 (fiscal 2002) and February 2, 2002 (fiscal 2001).
Reclassification Certain amounts for the year ended February 1, 2003, have been reclassified to conform to thecurrent year’s presentation.
Principles of Consolidation The consolidated financial statements include the accounts of Cost Plus, Inc. and itssubsidiaries. Intercompany balances and transactions are eliminated in consolidation.
Accounting Estimates The preparation of financial statements in conformity with accounting principles generallyaccepted in the United States of America requires management to make estimates and assumptions that affectthe reported amounts of assets and liabilities, including disclosures of contingent assets and liabilities, as of thedate of the financial statements, as well as the reported amounts of revenues and expenses during the reportingperiod. Actual results could differ from those estimates.
The Company’s significant accounting judgments and estimates affect the valuation of inventories, depreciablelives and impairments of long-lived assets, accrued liabilities, deferred taxes, self-insurance reserves andallowances for sales returns.
Estimated Fair Value of Financial Instruments The carrying value of cash and cash equivalents, short-terminvestments, accounts receivable and accounts payable approximates their estimated fair value.
Cash Equivalents The Company considers all highly liquid investments with original maturities of three monthsor less as cash equivalents.
Short-term Investments Short-term investments are classified as available-for-sale and are carried at fair mar-ket value. Short-term investments are comprised primarily of government agency and municipal obligationswith an original maturity greater than 90 days and less than one year.
Inventories Inventories are stated at lower of cost or market under the retail inventory method (“RIM”), in whichthe valuation of inventories at cost and gross margins is calculated by applying a calculated cost-to-retail ratioto the retail value of inventories. Cost includes certain buying and distribution costs related to the procurement,processing and transportation of merchandise. Management believes that the Company’s RIM provides aninventory valuation which reasonably approximates cost and results in carrying inventory at the lower of costor market.
36/37
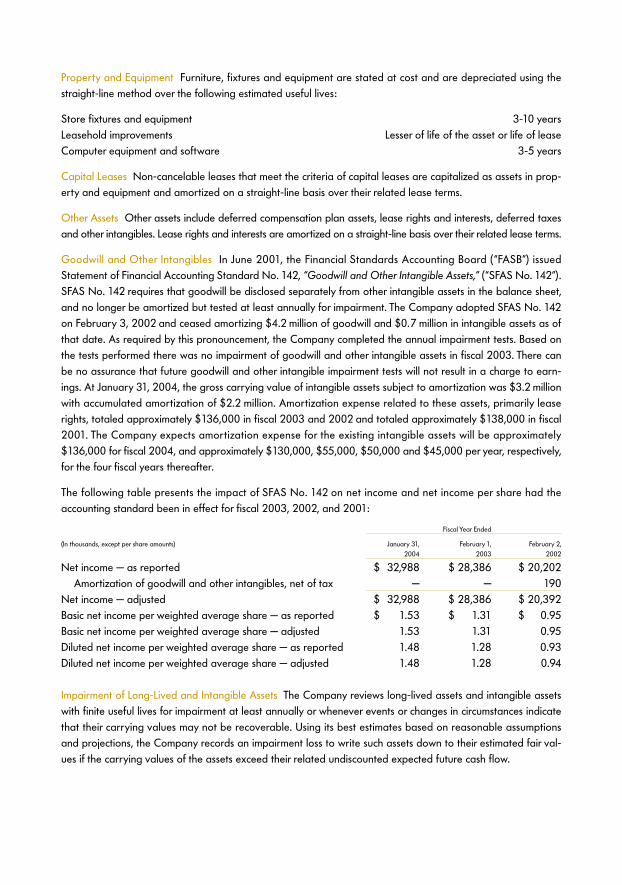
Property and Equipment Furniture, fixtures and equipment are stated at cost and are depreciated using thestraight-line method over the following estimated useful lives:
Store fixtures and equipment 3-10 yearsLeasehold improvements Lesser of life of the asset or life of leaseComputer equipment and software 3-5 years
Capital Leases Non-cancelable leases that meet the criteria of capital leases are capitalized as assets in prop-erty and equipment and amortized on a straight-line basis over their related lease terms.
Other Assets Other assets include deferred compensation plan assets, lease rights and interests, deferred taxesand other intangibles. Lease rights and interests are amortized on a straight-line basis over their related lease terms.
Goodwill and Other Intangibles In June 2001, the Financial Standards Accounting Board (“FASB”) issuedStatement of Financial Accounting Standard No. 142, “Goodwill and Other Intangible Assets,” (“SFAS No. 142”).SFAS No. 142 requires that goodwill be disclosed separately from other intangible assets in the balance sheet,and no longer be amortized but tested at least annually for impairment. The Company adopted SFAS No. 142on February 3, 2002 and ceased amortizing $4.2 million of goodwill and $0.7 million in intangible assets as ofthat date. As required by this pronouncement, the Company completed the annual impairment tests. Based onthe tests performed there was no impairment of goodwill and other intangible assets in fiscal 2003. There canbe no assurance that future goodwill and other intangible impairment tests will not result in a charge to earn-ings. At January 31, 2004, the gross carrying value of intangible assets subject to amortization was $3.2 millionwith accumulated amortization of $2.2 million. Amortization expense related to these assets, primarily leaserights, totaled approximately $136,000 in fiscal 2003 and 2002 and totaled approximately $138,000 in fiscal2001. The Company expects amortization expense for the existing intangible assets will be approximately$136,000 for fiscal 2004, and approximately $130,000, $55,000, $50,000 and $45,000 per year, respectively,for the four fiscal years thereafter.
The following table presents the impact of SFAS No. 142 on net income and net income per share had theaccounting standard been in effect for fiscal 2003, 2002, and 2001:
Fiscal Year Ended
(In thousands, except per share amounts) January 31, February 1, February 2, 2004 2003 2002
Net income — as reported $ 32,988 $ 28,386 $ 20,202Amortization of goodwill and other intangibles, net of tax — — 190
Net income — adjusted $ 32,988 $ 28,386 $ 20,392Basic net income per weighted average share — as reported $ 1.53 $ 1.31 $ 0.95Basic net income per weighted average share — adjusted 1.53 1.31 0.95Diluted net income per weighted average share — as reported 1.48 1.28 0.93Diluted net income per weighted average share — adjusted 1.48 1.28 0.94
Impairment of Long-Lived and Intangible Assets The Company reviews long-lived assets and intangible assetswith finite useful lives for impairment at least annually or whenever events or changes in circumstances indicatethat their carrying values may not be recoverable. Using its best estimates based on reasonable assumptionsand projections, the Company records an impairment loss to write such assets down to their estimated fair val-ues if the carrying values of the assets exceed their related undiscounted expected future cash flow.
Store specific long-lived assets and intangible assets with finite lives are evaluated at an individual store level,which is the lowest level at which individual cash flows can be identified. Corporate assets or other long-livedassets that are not store specific are evaluated at a consolidated entity level.
Based on the impairment tests performed, there was no impairment of long-lived and intangible assets in fiscal2003. There can be no assurance that future long-lived and intangible asset impairment tests will not result in acharge to earnings.
Self-Insurance The Company is self insured for workers’ compensation, general liability costs and certain healthinsurance plans with per occurrence and aggregate limits on losses. The self-insurance liability recorded in thefinancial statements is based on claims filed and an estimate of claims incurred but not yet reported. The follow-ing sets forth the significant insurance coverage by major category:
Workers’ compensation The Company retains losses on individual claims up to a maximum of $300,000. General liability insurance The Company maintains a $50,000 deductible for each submitted claim.Property insurance The Company maintains a $250,000 deductible for each submitted claim. Health insurance The Company has a stop loss provision per claim of $200,000.
Deferred Rent Certain of the Company’s operating leases contain predetermined fixed escalations of minimumrentals during the initial term. For these leases, the Company recognizes the related rental expense on astraight-line basis over the life of the lease and records the difference between amounts charged to operationsand amounts paid as deferred rent. As part of its lease agreements, the Company may receive certain leaseincentives, primarily construction allowances. These allowances are also deferred and are amortized as areduction of rent expense on a straight-line basis over the life of the lease. The cumulative net excess of recordedrent expense over lease payments made in the amount of $12.8 million and $10.5 million is reflected in otherlong-term obligations on the balance sheets as of January 31, 2004 and February 1, 2003, respectively.
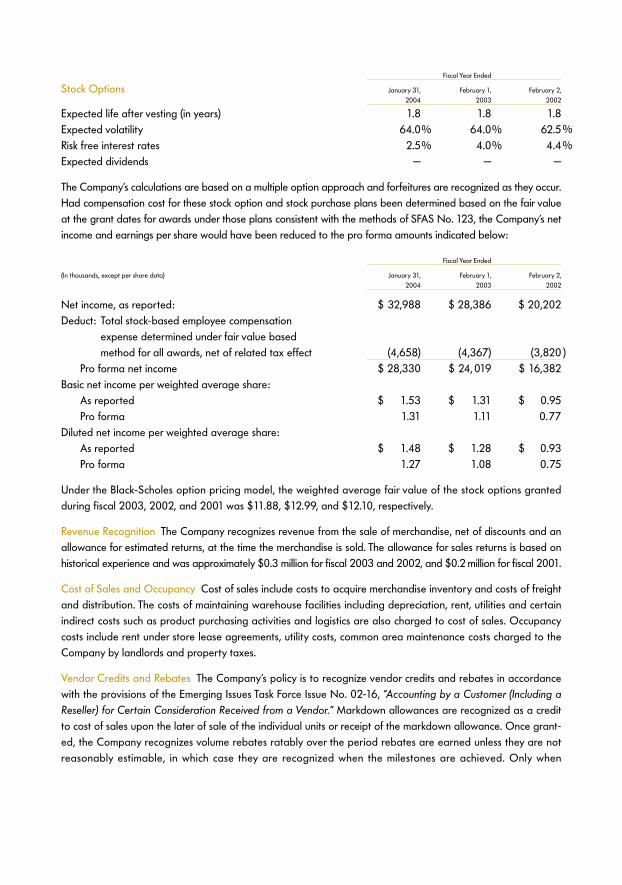
Stock-Based Compensation The Company accounts for stock-based awards to employees using the intrinsicvalue method prescribed by Accounting Principles Board Opinion No. 25, “Accounting for Stock Issued toEmployees.” Consequently, no compensation expense has been recognized in the financial statements foremployee stock arrangements. The disclosure requirements of SFAS No. 123, “Accounting for Stock-BasedCompensation,” are set forth below.
SFAS No. 123 establishes a fair value method of accounting for stock options and other equity instruments.SFAS No. 123 requires the disclosure of pro forma net income and earnings per share as if the Company hadadopted the fair value method. For determining pro forma earnings per share, the fair value of the stock optionsand employees’ purchase rights were estimated using the Black-Scholes option pricing model with the followingassumptions:
38 /39
Fiscal Year Ended
Stock Options January 31, February 1, February 2, 2004 2003 2002
Expected life after vesting (in years) 1.8 1.8 1.8Expected volatility 64.0% 64.0% 62.5Risk free interest rates 2.5% 4.0% 4.4Expected dividends — — —
The Company’s calculations are based on a multiple option approach and forfeitures are recognized as they occur.Had compensation cost for these stock option and stock purchase plans been determined based on the fair valueat the grant dates for awards under those plans consistent with the methods of SFAS No. 123, the Company’s netincome and earnings per share would have been reduced to the pro forma amounts indicated below:
Fiscal Year Ended
(In thousands, except per share data) January 31, February 1, February 2, 2004 2003 2002
Net income, as reported: $ 32,988 $ 28,386 $ 20,202Deduct: Total stock-based employee compensation
expense determined under fair value basedmethod for all awards, net of related tax effect (4,658) (4,367) (3,820
Pro forma net income $ 28,330 $ 24, 019 $ 16,382Basic net income per weighted average share:
As reported $ 1.53 $ 1.31 $ 0.95Pro forma 1.31 1.11 0.77
Diluted net income per weighted average share:As reported $ 1.48 $ 1.28 $ 0.93Pro forma 1.27 1.08 0.75
Under the Black-Scholes option pricing model, the weighted average fair value of the stock options grantedduring fiscal 2003, 2002, and 2001 was $11.88, $12.99, and $12.10, respectively.
Revenue Recognition The Company recognizes revenue from the sale of merchandise, net of discounts and anallowance for estimated returns, at the time the merchandise is sold. The allowance for sales returns is based onhistorical experience and was approximately $0.3 million for fiscal 2003 and 2002, and $0.2 million for fiscal 2001.
Cost of Sales and Occupancy Cost of sales include costs to acquire merchandise inventory and costs of freightand distribution. The costs of maintaining warehouse facilities including depreciation, rent, utilities and certainindirect costs such as product purchasing activities and logistics are also charged to cost of sales. Occupancycosts include rent under store lease agreements, utility costs, common area maintenance costs charged to theCompany by landlords and property taxes.
Vendor Credits and Rebates The Company’s policy is to recognize vendor credits and rebates in accordancewith the provisions of the Emerging Issues Task Force Issue No. 02-16, “Accounting by a Customer (Including aReseller) for Certain Consideration Received from a Vendor.” Markdown allowances are recognized as a creditto cost of sales upon the later of sale of the individual units or receipt of the markdown allowance. Once grant-ed, the Company recognizes volume rebates ratably over the period rebates are earned unless they are notreasonably estimable, in which case they are recognized when the milestones are achieved. Only when
%%
)

achievement of the rebate appears probable does the Company recognize the credit over the milestone period.The rebates are recognized as a credit to cost of sales. Lost sales allowances for items such as defective merchan-dise and shipping delays are recognized as a credit to cost of sales as the related specific merchandise is sold.
Selling, General and Administrative Selling, general and administrative expenses include costs related to func-tions such as advertising, store operations expenses, corporate management, marketing, administration andlegal and accounting, among others. Such costs include compensation, insurance costs, employment taxes, prop-erty taxes, credit card fees, management information systems operating costs, telephone and other communica-tion charges, travel related expenses, professional and other consulting fees and utilities, among other costs.
Advertising Expense Advertising costs, which include newspaper, radio and other media advertising, areexpensed as incurred. For fiscal 2003, 2002 and 2001, advertising costs were $46.2 million, $38.7 million and$30.6 million, respectively.
Store Preopening Expenses Store preopening expenses include grand opening advertising, labor, travel andhiring expenses and are expensed as incurred.
Concentration of Credit Risk Financial instruments, which potentially subject the Company to concentration ofcredit risk, consist principally of cash, cash equivalents, and short-term investments. The Company places itscash and short-term investments with high quality financial institutions. At times, such balances may be in excessof FDIC insurance limits.
Income Taxes Income taxes are accounted for using an asset and liability approach that requires recognition ofdeferred tax assets and liabilities for the expected future tax consequences of events that have been recog-nized in the Company’s consolidated financial statements or tax returns. The Company had a net deferred taxliability of $2.5 million for fiscal 2003, of which $2.4 million is included in other current liabilities and $0.1 millionis included in other long-term obligations on the Company’s balance sheet. For fiscal 2002, the Company had anet deferred tax asset of $3.5 million of which $3.4 million is included in other assets and $0.1 million is includedin other current assets on the Company’s balance sheet.
Comprehensive Income The Company’s comprehensive income and net income are the same for all periodspresented.
Net Income per Share SFAS No. 128 “Earnings Per Share,” requires earnings per share (“EPS”) to be computedand reported as both basic EPS and diluted EPS. Basic EPS is computed by dividing net income by the weightedaverage number of common shares outstanding for the period. Diluted EPS is computed by dividing net incomeby the weighted average number of common shares and dilutive common stock equivalents outstanding duringthe period. Dilutive EPS reflects the potential dilution that could occur if options to issue common stock wereexercised into common stock. The following is a reconciliation of the weighted average number of shares used inthe Company’s basic and diluted per share computations:
Fiscal Year Ended
(In thousands) January 31, February 1, February 2,2004 2003 2002
Basic shares 21,624 21,696 21,355Effect of dilutive stock options 725 462 401Diluted shares 22,349 22,158 21,756
40 /41

Certain options to purchase common stock were outstanding but were not included in the computation of dilut-ed earnings per share because the effect would be anti-dilutive. For the fiscal year ended January 31, 2004there were no anti-dilutive options. For the years ended February 1, 2003 and February 2, 2002, these optionstotaled 241,399, and 288,374, respectively.
New Accounting Pronouncements In December 2003, the Financial Accounting Standards Board (“FASB”)issued FASB Interpretation No. 46(R), “Consolidation of Variable Interest Entities,” ( “FIN 46(R)”) . FIN 46(R)replaces FIN 46 and addresses consolidation by business enterprises of variable interest entities. The provisionsof FIN 46(R) are effective for the first reporting period that ends after December 15, 2003 for variable interestsin those entities commonly referred to as special-purpose entities. Application of the provisions of FIN 46(R) forall other entities is effective for the first reporting period ending after March 15, 2004. The Company has nointerest in any entity considered a special-purpose entity; therefore, the initial adoption of FIN 46(R) did nothave an impact on the Company. The Company also believes the adoption of the provisions of FIN 46(R) in thefirst quarter of 2004 will have no impact on net earnings, cash flows or financial position.
Note 2. Property and Equipment
Property and equipment consist of the following:
(In thousands) January 31, February 1,2004 2003
Land and land improvements $ — $ 530Building and leasehold improvements 77,472 69,554Furniture, fixtures and equipment 104, 115 88,298Facilities under capital leases 51,982 51,982
Total 233,569 210,364Less accumulated depreciation and amortization (109, 715) (89,464)Property and equipment, net $ 123,854 $ 120,900
Note 3. Other Assets
Other assets consist of the following:
(In thousands) January 31, February 1, 2004 2003
Deferred income taxes $ — $ 3,381Lease rights and interests 3,146 3,146Other intangibles 1, 517 1,439Deferred compensation plan assets 2,229 1,160Other 4,220 4,021
Total 11, 112 13, 147Less accumulated amortization (4,499) (4, 101)Other assets, net $ 6, 613 $ 9,046
Other intangibles are primarily costs associated with obtaining liquor licenses. In accordance with SFAS No.142, “Goodwill and Other Intangible Assets,” the Company does not amortize other intangible assets and hascompleted an annual impairment test. Based on the impairment tests performed, there was no impairment ofother intangibles in fiscal 2003. There can be no assurance that future other intangible impairment tests will notresult in a charge to earnings.
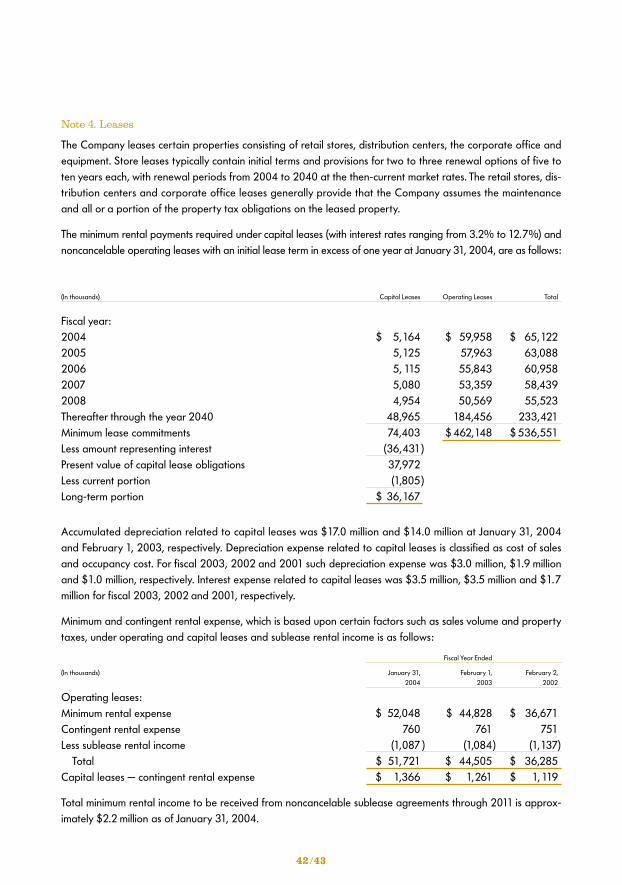
Note 4. Leases
The Company leases certain properties consisting of retail stores, distribution centers, the corporate office andequipment. Store leases typically contain initial terms and provisions for two to three renewal options of five toten years each, with renewal periods from 2004 to 2040 at the then-current market rates. The retail stores, dis-tribution centers and corporate office leases generally provide that the Company assumes the maintenanceand all or a portion of the property tax obligations on the leased property.
The minimum rental payments required under capital leases (with interest rates ranging from 3.2% to 12.7%) andnoncancelable operating leases with an initial lease term in excess of one year at January 31, 2004, are as follows:
(In thousands) Capital Leases Operating Leases Total
Fiscal year:2004 $ 5,164 $ 59,958 $ 65,1222005 5,125 57,963 63,0882006 5, 115 55,843 60,9582007 5,080 53,359 58,4392008 4,954 50,569 55,523Thereafter through the year 2040 48,965 184,456 233,421Minimum lease commitments 74,403 $ 462,148 $ 536,551Less amount representing interest (36,431)Present value of capital lease obligations 37,972Less current portion (1,805)Long-term portion $ 36,167
Accumulated depreciation related to capital leases was $17.0 million and $14.0 million at January 31, 2004and February 1, 2003, respectively. Depreciation expense related to capital leases is classified as cost of salesand occupancy cost. For fiscal 2003, 2002 and 2001 such depreciation expense was $3.0 million, $1.9 millionand $1.0 million, respectively. Interest expense related to capital leases was $3.5 million, $3.5 million and $1.7million for fiscal 2003, 2002 and 2001, respectively.
Minimum and contingent rental expense, which is based upon certain factors such as sales volume and propertytaxes, under operating and capital leases and sublease rental income is as follows:
Fiscal Year Ended
(In thousands) January 31, February 1, February 2,2004 2003 2002
Operating leases:Minimum rental expense $ 52,048 $ 44,828 $ 36,671Contingent rental expense 760 761 751Less sublease rental income (1,087 ) (1,084) (1,137)
Total $ 51,721 $ 44,505 $ 36,285Capital leases — contingent rental expense $ 1,366 $ 1,261 $ 1, 119
Total minimum rental income to be received from noncancelable sublease agreements through 2011 is approx-imately $2.2 million as of January 31, 2004.
42 /43

Note 5. Revolving Line of Credit
The Company has an unsecured revolving line of credit agreement with a group of banks that expires on June1, 2005. The agreement allows for cash borrowings and letters of credit of up to $30.0 million from Januarythrough June of each year, increasing to $75.0 million from July through December of each year to coincide withHoliday borrowing needs. Interest is paid quarterly in arrears on base rate loans and at each interest periodapplicable to IBOR loans (30, 60 and 90 days) based on the Company’s election of the bank’s reference rate orIBOR plus 0.9% through June 1, 2003, increasing to IBOR plus 1.125% from June 2, 2003 to June 1, 2004 andIBOR plus 1.25% from June 2, 2004 to June 1, 2005. The agreement requires a 30-day “clean-up period” eachyear where outstanding credit advances, as defined in the agreement must be zero for not less than 30 consec-utive days during the period from January 1, 2004 through March 31, 2004 and from January 1, 2005 throughMarch 31, 2005. The Company is subject to a minimum consolidated tangible net worth requirement and annualcapital expenditures are limited under the agreement. In the case of a continuing event of default, the lendersunder the agreement may eliminate their commitments to make credit available, declare due all unpaid princi-pal amounts outstanding, and require cash collateral for any letter of credit obligations. At each of the balancesheet dates, the Company complied with the loan covenant requirements. At the end of the last two fiscal years,the Company had no outstanding borrowings under its line of credit. The Company had $14.5 million and $10.7million in outstanding letters of credit at the end of fiscal 2003 and 2002, respectively.
Note 6. Income Taxes
The provision for income taxes consists of the following:Fiscal Year Ended
(In thousands) January 31, February 1, February 2, 2004 2003 2002
Current:Federal $ 11, 713 $ 10,656 $ 10,788State 856 799 1,894Total current 12,569 11,455 12,682Deferred:Federal 6,655 4,973 422State (674) (4,012) (188)Total deferred 5,981 961 234Provision for income taxes $ 18,550 $ 12,416 $ 12, 916
The differences between the U.S. federal statutory tax rate and the Company’s effective tax rate are as follows:
Fiscal Year Ended
January 31, February 1, February 2, 2004 2003 2002
U.S. federal statutory tax rate 35.0% 35.0% 35.0State income taxes (net of U.S. federal income tax benefit) 3.7 2.4 3.3Benefit of wage and other tax credits (3.2) (7.5) —Non-deductible expenses 0.2 0.2 0.2Other 0.3 0.3 0.5Effective income tax rate 36.0% 30.4% 39.0
%
%
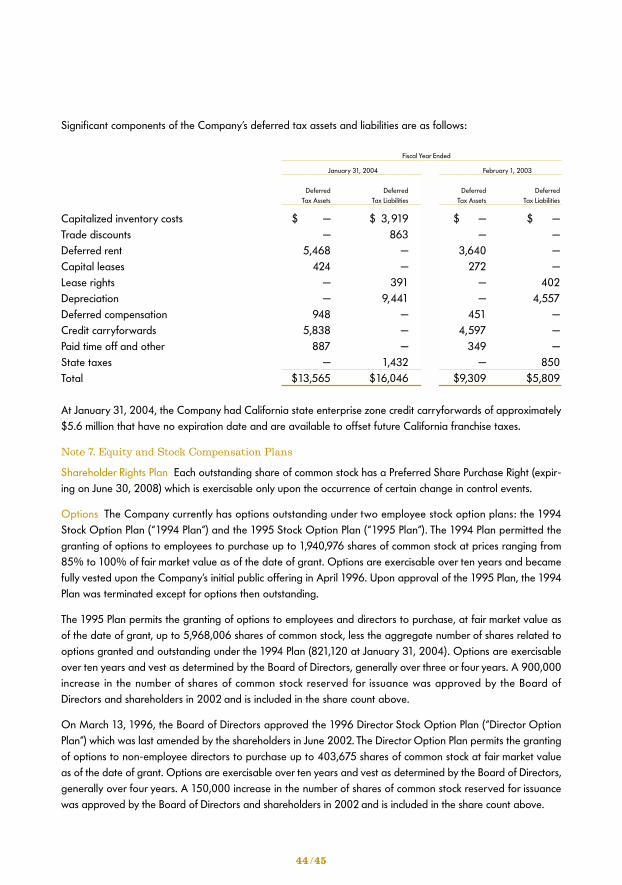
Significant components of the Company’s deferred tax assets and liabilities are as follows:
Fiscal Year Ended
January 31, 2004 February 1, 2003
Deferred Deferred Deferred DeferredTax Assets Tax Liabilities Tax Assets Tax Liabilities
Capitalized inventory costs $ — $ 3,919 $ — $ —Trade discounts — 863 — —Deferred rent 5,468 — 3,640 —Capital leases 424 — 272 —Lease rights — 391 — 402Depreciation — 9,441 — 4,557Deferred compensation 948 — 451 —Credit carryforwards 5,838 — 4,597 —Paid time off and other 887 — 349 —State taxes — 1,432 — 850Total $13,565 $16,046 $9,309 $5,809
At January 31, 2004, the Company had California state enterprise zone credit carryforwards of approximately$5.6 million that have no expiration date and are available to offset future California franchise taxes.
Note 7. Equity and Stock Compensation Plans
Shareholder Rights Plan Each outstanding share of common stock has a Preferred Share Purchase Right (expir-ing on June 30, 2008) which is exercisable only upon the occurrence of certain change in control events.
Options The Company currently has options outstanding under two employee stock option plans: the 1994Stock Option Plan (“1994 Plan”) and the 1995 Stock Option Plan (“1995 Plan”). The 1994 Plan permitted thegranting of options to employees to purchase up to 1,940,976 shares of common stock at prices ranging from85% to 100% of fair market value as of the date of grant. Options are exercisable over ten years and becamefully vested upon the Company’s initial public offering in April 1996. Upon approval of the 1995 Plan, the 1994Plan was terminated except for options then outstanding.
The 1995 Plan permits the granting of options to employees and directors to purchase, at fair market value asof the date of grant, up to 5,968,006 shares of common stock, less the aggregate number of shares related tooptions granted and outstanding under the 1994 Plan (821,120 at January 31, 2004). Options are exercisableover ten years and vest as determined by the Board of Directors, generally over three or four years. A 900,000increase in the number of shares of common stock reserved for issuance was approved by the Board ofDirectors and shareholders in 2002 and is included in the share count above.
On March 13, 1996, the Board of Directors approved the 1996 Director Stock Option Plan (“Director OptionPlan”) which was last amended by the shareholders in June 2002. The Director Option Plan permits the grantingof options to non-employee directors to purchase up to 403,675 shares of common stock at fair market valueas of the date of grant. Options are exercisable over ten years and vest as determined by the Board of Directors,generally over four years. A 150,000 increase in the number of shares of common stock reserved for issuancewas approved by the Board of Directors and shareholders in 2002 and is included in the share count above.
44 /45
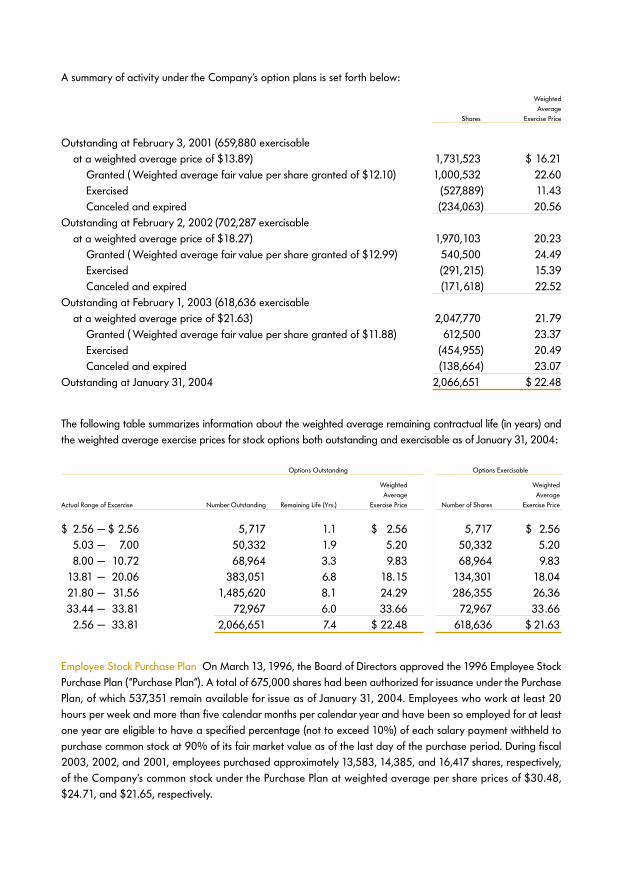
A summary of activity under the Company’s option plans is set forth below:
WeightedAverage
Shares Exercise Price
Outstanding at February 3, 2001 (659,880 exercisable at a weighted average price of $13.89) 1,731,523 $ 16.21
Granted ( Weighted average fair value per share granted of $12.10) 1,000,532 22.60Exercised (527,889) 11.43Canceled and expired (234,063) 20.56
Outstanding at February 2, 2002 (702,287 exercisable at a weighted average price of $18.27) 1,970,103 20.23
Granted ( Weighted average fair value per share granted of $12.99) 540,500 24.49Exercised (291,215) 15.39Canceled and expired (171,618) 22.52
Outstanding at February 1, 2003 (618,636 exercisable at a weighted average price of $21.63) 2,047,770 21.79
Granted ( Weighted average fair value per share granted of $11.88) 612,500 23.37Exercised (454,955) 20.49Canceled and expired (138,664) 23.07
Outstanding at January 31, 2004 2,066,651 $ 22.48
The following table summarizes information about the weighted average remaining contractual life (in years) andthe weighted average exercise prices for stock options both outstanding and exercisable as of January 31, 2004:
Options Outstanding Options Exercisable
Weighted Weighted Average Average
Actual Range of Excercise Number Outstanding Remaining Life (Yrs.) Exercise Price Number of Shares Exercise Price
$ 2.56 — $ 2.56 5,717 1.1 $ 2.56 5, 717 $ 2.565.03 — 7.00 50,332 1.9 5.20 50,332 5.20 8.00 — 10.72 68,964 3.3 9.83 68,964 9.83
13.81 — 20.06 383,051 6.8 18.15 134,301 18.04 21.80 — 31.56 1,485,620 8.1 24.29 286,355 26.36 33.44 — 33.81 72,967 6.0 33.66 72,967 33.66
2.56 — 33.81 2,066,651 7.4 $ 22.48 618,636 $ 21.63
Employee Stock Purchase Plan On March 13, 1996, the Board of Directors approved the 1996 Employee StockPurchase Plan (“Purchase Plan”). A total of 675,000 shares had been authorized for issuance under the PurchasePlan, of which 537,351 remain available for issue as of January 31, 2004. Employees who work at least 20hours per week and more than five calendar months per calendar year and have been so employed for at leastone year are eligible to have a specified percentage (not to exceed 10%) of each salary payment withheld topurchase common stock at 90% of its fair market value as of the last day of the purchase period. During fiscal2003, 2002, and 2001, employees purchased approximately 13,583, 14,385, and 16,417 shares, respectively,of the Company’s common stock under the Purchase Plan at weighted average per share prices of $30.48,$24.71, and $21.65, respectively.

Note 8. Employee Benefit Plans
The Company has a 401(k) plan for employees who meet certain service and age requirements. Participantsmay contribute up to 25% of their salaries to a maximum of $13,000 per year and participants age 50 or oldermay contribute an additional catch-up deferral amount of up to $3,000 in 2004. The Company matches 50%of the first 4% of base salary that the employee contributes to the 401(k) plan. The Company contributedapproximately $478,000 in fiscal 2003, $455,000 in fiscal 2002 and $442,000 in fiscal 2001.
In addition, a non-qualified deferred compensation plan is available to certain employees whose benefits arelimited under Section 401(k) of the Internal Revenue Service Code. Compensation deferrals approximated$818,000 for fiscal 2003 and $456,000 for fiscal 2002.
Note 9. Commitments and Contingencies
The Company is involved in litigation, claims and assessments incidental to its business, the disposition of whichis not expected to have a material effect on the Company’s financial position or results of operations. It is possi-ble, however, that future results of operations for any particular quarterly or annual period could be materiallyaffected by changes in the Company’s assumptions related to these matters. The Company accrues its best esti-mate of the probable cost for the resolution of claims. When appropriate, such estimates are developed in con-sultation with outside counsel handling these matters and are based upon a combination of litigation and set-tlement strategies. To the extent additional information arises or the Company’s strategies change, it is possiblethat the Company’s best estimate of its probable liability in these matters may change.
Note 10. Quarterly Information (unaudited)Fiscal Quarters Ended
(In thousands, except per share data) May 3, 2003 August 2, 2003 November 1, 2003 January 31, 2004
Net sales $159, 218 $ 159,760 $ 170,019 $ 312,569Gross profit 54, 426 54,935 56,958 113,487Net income 2,563 2,873 858 26,694Net income per weighted average share
Basic $ 0.12 $ 0.13 $ 0.04 $ 1.22Diluted $ 0.12 $ 0.13 $ 0.04 $ 1.18
Fiscal Quarters Ended
(In thousands, except per share data) May 4, 2002 August 3, 2002 November 2, 2002 February 1, 2003
Net sales $134,349 $ 138,339 $ 149,886 $ 269,727Gross profit 45, 700 47,095 50,210 98, 911Net income (loss) 1,677 2,155 (712) 25,266Net income (loss) per weighted average share
Basic $ 0.08 $ 0.10 $ (0.03) $ 1.16Diluted $ 0.08 $ 0.10 $ (0.03) $ 1.14
46 /47
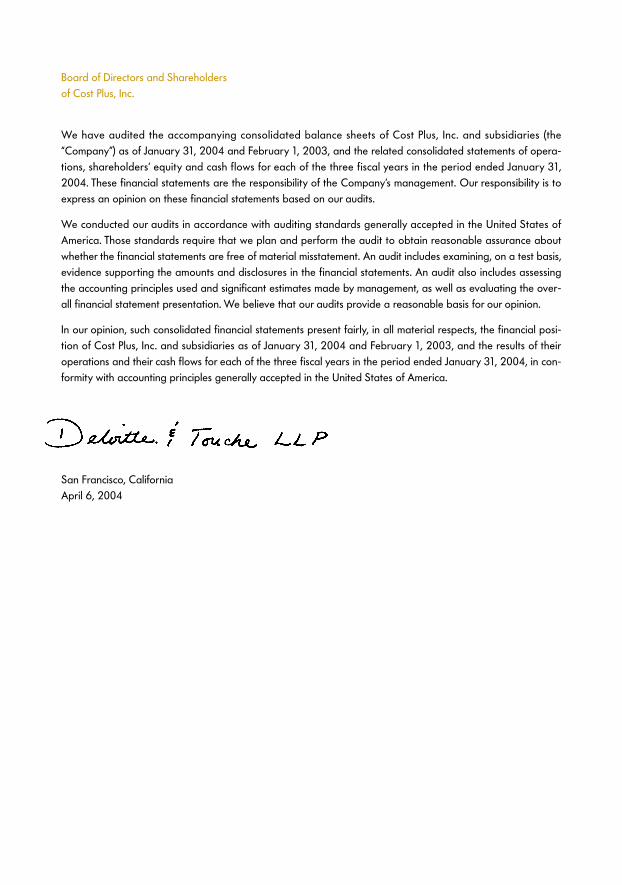
Board of Directors and Shareholdersof Cost Plus, Inc.
We have audited the accompanying consolidated balance sheets of Cost Plus, Inc. and subsidiaries (the“Company”) as of January 31, 2004 and February 1, 2003, and the related consolidated statements of opera-tions, shareholders’ equity and cash flows for each of the three fiscal years in the period ended January 31,2004. These financial statements are the responsibility of the Company’s management. Our responsibility is toexpress an opinion on these financial statements based on our audits.
We conducted our audits in accordance with auditing standards generally accepted in the United States ofAmerica. Those standards require that we plan and perform the audit to obtain reasonable assurance aboutwhether the financial statements are free of material misstatement. An audit includes examining, on a test basis,evidence supporting the amounts and disclosures in the financial statements. An audit also includes assessingthe accounting principles used and significant estimates made by management, as well as evaluating the over-all financial statement presentation. We believe that our audits provide a reasonable basis for our opinion.
In our opinion, such consolidated financial statements present fairly, in all material respects, the financial posi-tion of Cost Plus, Inc. and subsidiaries as of January 31, 2004 and February 1, 2003, and the results of theiroperations and their cash flows for each of the three fiscal years in the period ended January 31, 2004, in con-formity with accounting principles generally accepted in the United States of America.
San Francisco, CaliforniaApril 6, 2004
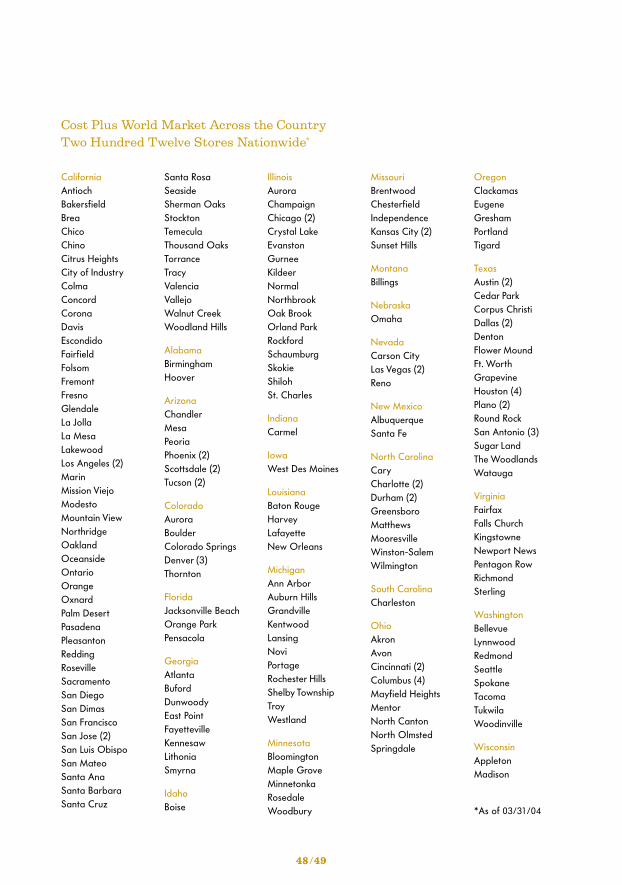
CaliforniaAntiochBakersfieldBreaChicoChinoCitrus HeightsCity of IndustryColmaConcordCoronaDavisEscondidoFairfieldFolsomFremontFresnoGlendaleLa JollaLa MesaLakewoodLos Angeles (2)MarinMission ViejoModestoMountain ViewNorthridgeOaklandOceansideOntarioOrangeOxnardPalm DesertPasadenaPleasantonReddingRosevilleSacramentoSan DiegoSan DimasSan FranciscoSan Jose (2)San Luis ObispoSan MateoSanta AnaSanta BarbaraSanta Cruz
Santa RosaSeasideSherman OaksStocktonTemeculaThousand OaksTorranceTracyValenciaVallejoWalnut CreekWoodland Hills
AlabamaBirminghamHoover
ArizonaChandlerMesaPeoriaPhoenix (2)Scottsdale (2)Tucson (2)
ColoradoAuroraBoulderColorado SpringsDenver (3)Thornton
FloridaJacksonville BeachOrange ParkPensacola
GeorgiaAtlanta BufordDunwoodyEast PointFayettevilleKennesawLithoniaSmyrna
IdahoBoise
IllinoisAuroraChampaignChicago (2)Crystal LakeEvanstonGurneeKildeerNormalNorthbrookOak BrookOrland ParkRockfordSchaumburgSkokieShilohSt. Charles
IndianaCarmel
IowaWest Des Moines
LouisianaBaton RougeHarveyLafayetteNew Orleans
MichiganAnn ArborAuburn HillsGrandvilleKentwoodLansingNoviPortageRochester HillsShelby TownshipTroyWestland
MinnesotaBloomingtonMaple GroveMinnetonkaRosedaleWoodbury
MissouriBrentwoodChesterfieldIndependenceKansas City (2)Sunset Hills
MontanaBillings
NebraskaOmaha
NevadaCarson CityLas Vegas (2)Reno
New MexicoAlbuquerqueSanta Fe
North CarolinaCaryCharlotte (2)Durham (2)GreensboroMatthewsMooresvilleWinston-Salem Wilmington
South CarolinaCharleston
OhioAkronAvonCincinnati (2)Columbus (4)Mayfield HeightsMentorNorth CantonNorth OlmstedSpringdale
OregonClackamasEugeneGreshamPortlandTigard
TexasAustin (2)Cedar ParkCorpus ChristiDallas (2)DentonFlower MoundFt. WorthGrapevineHouston (4)Plano (2)Round RockSan Antonio (3)Sugar LandThe WoodlandsWatauga
VirginiaFairfaxFalls ChurchKingstowneNewport NewsPentagon RowRichmondSterling
WashingtonBellevueLynnwoodRedmondSeattleSpokaneTacomaTukwilaWoodinville
WisconsinAppletonMadison
*As of 03/31/04
48 /49
Cost Plus World Market Across the CountryTwo Hundred Twelve Stores Nationwide*
Directors and Officers
Directors
Murray H. DasheChairman, Chief Executive Officer and PresidentCost Plus, Inc.
Joseph H. Coulombe 1
Independent Management Consultant
Barry J. Feld 2,3
President, Chief Executive OfficerChairman, PCA International, Inc.Professional Photography Service Firm
Danny W. Gurr 1,3
Independent Financial Consultant
Kim D. Robbins 2
Independent Management Consultant
Fredric M. Roberts 2,4
President, F. M. Roberts and Company, Inc.Investment Banking Firm
Thomas D. Willardson 1, 3
Chief Financial OfficerArchimedes Technology Group
1 Member of the Audit Committee of the Board of Directors.2 Member of the Compensation Committee of the Board of Directors.3 Member of the Nominating Committee of the Board of Directors.4 Lead Independent Director.
Senior Officers
Murray H. DasheChairman of the Board, Chief Executive Officerand President
Gary D. WeatherfordExecutive Vice President, Operations
Michael J. AllenSenior Vice President, Store Operations
Joan S. FujiiSenior Vice President, Human Resources
Stephen L. HigginsSenior Vice President, Merchandising
Patricia A. JuckettSenior Vice President, Marketing and Advertising
John J. LuttrellSenior Vice President and Chief Financial Officer
Judith A. SoaresSenior Vice President, Cost Plus Management Services, Inc.
Officers
Jane L. BaughmanVice President, Financial Planning, Treasurerand Corporate Secretary
Gail H. FullerVice President, Divisional Merchandise Manager,Trend Director
Lisa J. GriffinVice President, Planning and Allocation
Steven J. KnightVice President, Distribution
Cliff A. MarchVice President, Information Services
Chris M. MillerVice President, Controller
Janet L. TuckerVice President, Divisional Merchandise Manager
Cost Plus World Market management opensthe NASDAQ Market commemorating its 200thstore, November 5, 2003.
Strategic Design Communications: Turner and Associates, San Francisco

Corporate Data
Corporate HeadquartersCost Plus, Inc.200 4th StreetOakland, California 94607www.worldmarket.com
Annual Report on Form 10-KA copy of the Company’s fiscal 2003 Annual Report on Form 10-K as filed with the Securities and ExchangeCommission is available to shareholders by contacting the Investor Relations Department at the address above or online at www.worldmarket.com.
Independent AuditorsDeloitte & Touche LLPSan Francisco, California
Transfer Agent and RegistrarBank Bostonc/o EquiServe, LPBoston, Massachusetts(781) 575-3120
Corporate CounselWilson Sonsini Goodrich & RosatiPalo Alto, California
Board of Directors, pictured from left: Joseph H. Coulombe, Kim D. Robbins, Fredric M. Roberts, Murray H. Dashe,Thomas D. Willardson, Danny W. Gurr, Barry J. Feld
50 /51

200 4th StreetOakland, California 94607
www.costplusworldmarket.com