cost estimation of injury-related hospital admissions in...
TRANSCRIPT

Cost Estimation of Injury-Related Hospital Admissions in 10European CountriesSuzanne Polinder, MD, Willem Jan Meerding, PhD, Margriet E. van Baar, PhD, Hidde Toet, MD,Saakje Mulder, PhD, Ed F. van Beeck, PhD, and the EUROCOST reference group
Background: Injuries are a majorcause of total health care costs. Cost esti-mations may help identify injuries andhigh risk-groups to be considered for po-tential intervention.
Methods: Hospital discharge registersof 10 European countries were used to esti-mate injury incidence. Consensus wasreached between the participating countriesabout methodology, definition, classifica-tion, cost measurements, and valuation tomaximize crossnational comparability ofoutcomes. The data of the countries werealso used to give an estimate of the costs percapita by age, sex, type of injury, and exter-nal cause in Europe.
Results: Large international differ-ences were observed in injury incidenceand associated costs related to hospital
admissions, with relatively high costsper capita for Austria, followed by Den-mark and Norway. In Greece, Italy, Ire-land, and Wales, intermediate costs percapita were found, but these costs wererelatively low for Spain, England, andthe Netherlands. The patterns of costsby age, sex, injury type, and externalcause are quite similar between thecountries. For all countries, costs percapita increase exponentially in olderage groups (age >65 years), due to thecombined effect of high incidence andhigh costs per patient. The elderly fe-males account for almost triple costscompared with same age males. Youngchildren and male adolescents are alsohigh-cost groups. Highest costs werefound for hip fractures, fractures of the
knee/lower leg, superficial injuries,skull-brain injuries, and spinal cord in-juries. Home and leisure injuries (in-cluding sport injuries) and occupationalinjuries combined make a major contri-bution (86%) to the hospital costs of in-jury.
Conclusion: Elderly patients aged 65years and older, especially women, con-sume a disproportionate share of hospitalresources for trauma care, mainly causedby hip fractures and fractures of the knee/lower leg, which indicates the importanceof prevention and investing in traumacare for this specific patient group.
Key Words: Unintentional and inten-tional injuries, Hospital costs, Interna-tional comparison, Europe.
J Trauma. 2005;59:1283–1291.
Injuries are a major cause of total health care costs in theindustrialized world. Because injuries represent a widevariety of external causes and health consequences,
comprehensive and detailed information on health carecosts may help to identify previously unnoticed healthproblems within this field.1 Similar to indicators of burdenof disease, cost estimates provide a measure that enablesrapid comparison among several types of injury that differ
with respect to severity and health care need.2– 4 This mayhelp policy makers to set priorities in injury preventionand trauma care. Comprehensive cost estimates subdividedby injury diagnoses, external cause, and sociodemographicindicators show at a glance where costs might potentiallybe saved or where interventions are most needed.
The international application of injury cost modelsmay enhance its value for policymaking purposes. Aninternational comparison of costs can both show commonproblems for several countries, as well as specific prob-lems for individual countries. This, however, is only pos-sible when data and methods used are harmonized betweencountries. So far, within Europe, several cost-of-injurystudies were conducted.5–10 These studies, however, showlarge differences with respect to their methodology, in-cluding comprehensiveness, matters of definition and clas-sification, and the way they measure and value costs.2 Sofar, they are limited to specific countries, injuries, healthcare sectors, and age groups. Because of incomparablemethods, the differences and commonalities of medicalcosts of injury between European countries are not known.Therefore, within the framework of an internationalproject (EUROCOST), a uniform method with several har-monization procedures was applied in 10 Europeancountries.11 In this article, the following question is ad-dressed: what are the costs of injury-related hospital ad-
Submitted for publication February 9, 2005.Accepted for publication June 27, 2005.Copyright © 2005 by Lippincott Williams & Wilkins, Inc.From the Department of Public Health (S.P., W.J.M., M.E.B., E.F.B.),
Erasmus MC, University Medical Centre Rotterdam, Rotterdam, and theConsumer Safety Institute (H.T., S.M.), Amsterdam, the Netherlands.
EUROCOST reference group: Robert Bauer, Austrian Institute forHome and Leisure Safety, Sicher Leben, Austria; Claus Falck Larsen,Copenhagen University Hospital, Denmark; Ronan Lyons, University ofWales, United Kingdom; Tim McCarthy, Ministry of Health, Ireland;Catherine Perez, Municipal Institute of Public Health, Spain; Eleni Pet-ridou, Athens University Medical School, Greece; Alessio Pitidis, De-partment of Environment and Primary Prevention, National Institute ofHealth, Italy; Anne Mette Tranberg Kejs, National Institute of PubicHealth, Denmark; Johannes Wiik, Norwegian Institute of Public Health,Norway.
Address for reprints: Suzanne Polinder, MD, Department of PublicHealth, Erasmus MC, PO BOX 2040, University Medical Centre Rotterdam,Rotterdam 3000 CA, the Netherlands; email: [email protected].
DOI: 10.1097/01.ta.0000195998.11304.5b
The Journal of TRAUMA� Injury, Infection, and Critical Care
Volume 59 • Number 6 1283

missions in Europe, subdivided by country, age, sex, injurytype, and external cause?
MATERIALS AND METHODSData Sources
The following countries participated in the EUROCOSTproject: Austria, Denmark, England, Greece, Ireland, Italy,Netherlands, Norway, Spain, and Wales. For the EURO-COST project, two primary data sources were used to esti-mate the incidence and health care consumption for eachcountry: hospital discharge registers (HDR) with (almost) fullnational coverage and the emergency department (ED) sam-ple-based surveillance systems (both from the year 1999).This article focuses only on the admitted injury patients.HDR data were used as the primary data source to estimateinjury incidence of admitted patients for all injuries combined(intentional and unintentional). For Greece, we used the EDdata system to estimate the number of hospitalizations be-cause no HDR data were made available. The data systemsthat were used are presented in Table 1. This shows coveragerates of 90 to 100% of the HDR systems of all countriesexcept Spain, where 90% of the public hospitals but only30% of the private hospitals are covered. For Greece, therespective figures are based on the number of the ED visitsfrom which the total number of hospital admissions can beapproximated.12 Figure 1 gives a description of the age dis-tribution for admitted injury patients per country. In Ireland
and Greece, the admitted injury population is relativelyyoung. For the other countries, the percentage of patientsolder than 65 years varies from 65 to 75%.
Injury IncidenceAll participating countries delivered HDR data using the
same inclusion criteria, definitions, and classifications. Basedupon this international agreement, similar selections of acci-dents (i.e., external causes), injuries (i.e., medical diagnoses),and cost elements (i.e., health care sectors) were studied in allcountries. In our analysis, only injury principal diagnoseswere included, and cases with an injury diagnosis as a sec-ondary or subsequent diagnosis were not included in theanalysis. Selecting an injury on the basis of any diagnosticfield is problematic because some countries had only infor-mation available about the principal diagnosis. Furthermore,in many cases where the injury diagnosis appears in thesecond or subsequent diagnosis fields, it would be difficult todetermine whether the person would have been “admitted” tothe hospital if they had only the injury.13 However, onlyincluding injury principal diagnosis will result in a slightunderestimation of the injury incidence of admitted patients.We used the international classification of disease codesE800 to E999 (ICD-9)14 to select and classify injuries, except“misadventures to patients during surgical and medical care”(ICD-9 E870–876), “surgical and medical procedures as thecause of abnormal reaction of patients or later complication,without mention of misadventure at the time of procedure”(ICD-9 E878–879), “drugs, medicaments and biological sub-stances causing adverse effects in therapeutic use” (ICD-9E930-E949), and “late effects of injury” (ICD-9 E905-E909).Unintentional injuries (E47-E53) including transport injuries(E470-E474, E479) and intentional injuries (E54-E56) wereanalyzed. Furthermore, injuries were classified by locationand type into 39 groups (and an aggregation level of 29groups)15 after consultations with experts in traumatology,orthopedics, and rehabilitation, to represent groups of patientsthat have homogeneous health care consumption.
Day cases and inpatients with length of stay of zero wereboth classified as a day patients and were excluded from theanalyses presented. Due to the lack of reliable information onFig. 1. Age distribution for admitted injury patients by country.
Table 1 Description of the Data System Used per Country
Country Data System Coverage Registered Cases
Austria Hospital Discharge Register 100% 187,225Denmark National Discharge Register 100% 99,618Greece ED Injury Surveillance System 100%* 144,000Ireland Hospital Inpatient Enquiry 95% 58,196Italy Hospital Discharge Register 90–95% 928,317Netherlands Dutch Information System 100% 102,768Norway National Injury Register 100% 66,962Spain Hospital Discharge Register 90% public/30%private 194,856England Hospital Discharge Register 100% 632,179Wales Hospital Discharge Register 100% 48,266
*National estimates derived from ED visits.
The Journal of TRAUMA� Injury, Infection, and Critical Care
1284 December 2005
readmissions (they could only be distinguished for threecountries), these are included in all analyses as first admis-sions.
To adjust for differences in the demographic composi-tion of the countries, age-standardized (18 groups) and sex-standardized incidence rates (per 1,000) and costs per capita(mean costs per inhabitant) were calculated for the year 1999using the direct method of standardization. The total popula-tion of the participating countries was used as the referencepopulation.
Cost CalculationsAn incidence-based approach was used, calculating the
medical costs of injuries occurring in a specific year (1999).A full description of the cost model can be found in the finalreport of EUROCOST.11 The calculation of the direct med-ical costs (costs within the healthcare sector) of injury isrestricted to hospital costs of inpatients, consisting of costsper inpatient day in hospital and ED costs preceding thehospitalization. The hospital cost of inpatients is the sum ofthe number of ED visits multiplied by the costs per ED visitand the number of hospital admissions multiplied by length ofstay and unit costs per inpatient day.
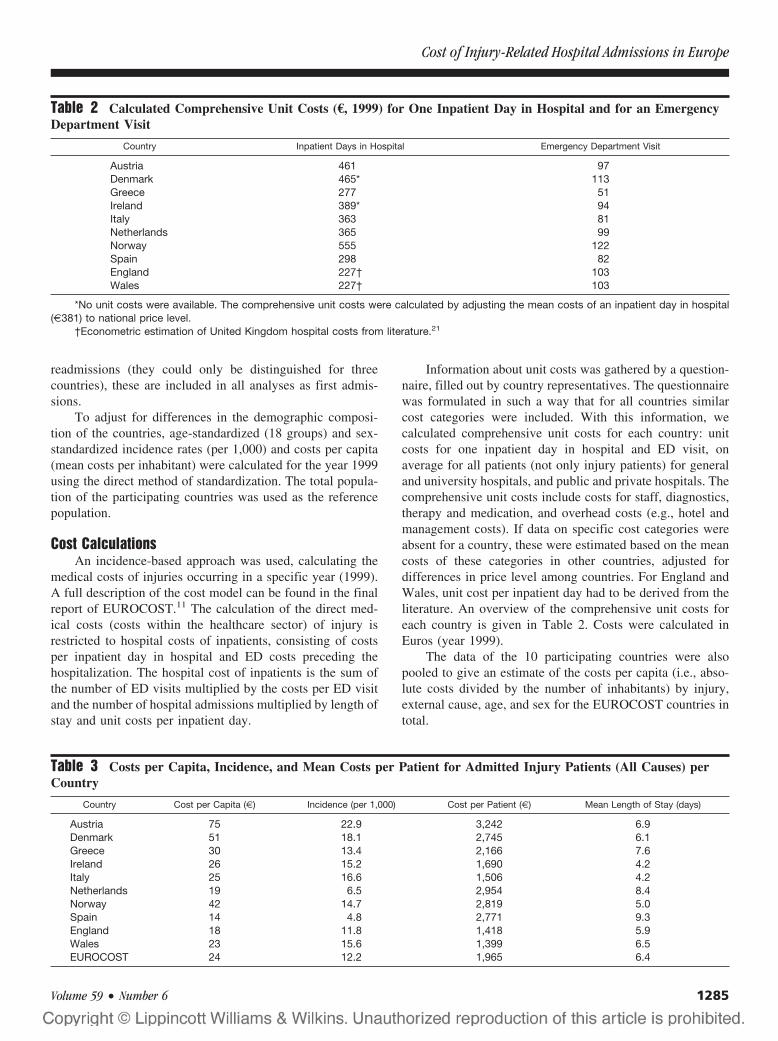
Information about unit costs was gathered by a question-naire, filled out by country representatives. The questionnairewas formulated in such a way that for all countries similarcost categories were included. With this information, wecalculated comprehensive unit costs for each country: unitcosts for one inpatient day in hospital and ED visit, onaverage for all patients (not only injury patients) for generaland university hospitals, and public and private hospitals. Thecomprehensive unit costs include costs for staff, diagnostics,therapy and medication, and overhead costs (e.g., hotel andmanagement costs). If data on specific cost categories wereabsent for a country, these were estimated based on the meancosts of these categories in other countries, adjusted fordifferences in price level among countries. For England andWales, unit cost per inpatient day had to be derived from theliterature. An overview of the comprehensive unit costs foreach country is given in Table 2. Costs were calculated inEuros (year 1999).
The data of the 10 participating countries were alsopooled to give an estimate of the costs per capita (i.e., abso-lute costs divided by the number of inhabitants) by injury,external cause, age, and sex for the EUROCOST countries intotal.
Table 2 Calculated Comprehensive Unit Costs (€, 1999) for One Inpatient Day in Hospital and for an EmergencyDepartment Visit
Country Inpatient Days in Hospital Emergency Department Visit
Austria 461 97Denmark 465* 113Greece 277 51Ireland 389* 94Italy 363 81Netherlands 365 99Norway 555 122Spain 298 82England 227† 103Wales 227† 103
*No unit costs were available. The comprehensive unit costs were calculated by adjusting the mean costs of an inpatient day in hospital(€381) to national price level.
†Econometric estimation of United Kingdom hospital costs from literature.21
Table 3 Costs per Capita, Incidence, and Mean Costs per Patient for Admitted Injury Patients (All Causes) perCountry
Country Cost per Capita (€) Incidence (per 1,000) Cost per Patient (€) Mean Length of Stay (days)
Austria 75 22.9 3,242 6.9Denmark 51 18.1 2,745 6.1Greece 30 13.4 2,166 7.6Ireland 26 15.2 1,690 4.2Italy 25 16.6 1,506 4.2Netherlands 19 6.5 2,954 8.4Norway 42 14.7 2,819 5.0Spain 14 4.8 2,771 9.3England 18 11.8 1,418 5.9Wales 23 15.6 1,399 6.5EUROCOST 24 12.2 1,965 6.4
Cost of Injury-Related Hospital Admissions in Europe
Volume 59 • Number 6 1285

RESULTSCosts by Country
Table 3 shows the costs of admitted injury patients foreach participating EUROCOST country. Large internationaldifferences exist in costs per capita of injury-related hospitaladmissions. Compared with the mean costs per capita for theEUROCOST countries in total (€24), Austria generated threetimes higher costs per capita, followed by Denmark andNorway with (almost) twice as high costs. In Greece, Ireland,Italy, and Wales, intermediate costs per capita were foundand costs per capita were substantial below the mean forSpain, England, and the Netherlands. The variation in costsper capita between the countries is mainly caused by the highvariation in injury incidence between the countries and is inlesser order due to differences in the mean costs per patient.The mean costs per patient are low in England and Wales andrelatively high in Austria, the Netherlands, and Norway.Despite different cost levels, age and sex patterns between thecountries were broadly similar.
Costs by Age and SexFigure 2 gives an overview of the costs per capita for all
admitted injury patients by age and sex for the EUROCOSTcountries combined. Peaks in costs per capita are observedamong children 0–4 years old and among 15- to 24-year-oldmales, due to high incidence rates among these age groups.
Costs per capita increase exponentially in older agegroups (age �65 years) and older females in particular, dueto the combined effect of high incidence and high costs perpatient. In total, 46% of total costs of injury-related hospitaladmissions are due to persons older than 65 years. Thoughwomen sustained only 45% of the total number of injuries,they accounted for 59% of the costs. This is mainly becausemany of the injuries suffered by older women require a highlevel of care and females outnumber males at higher ages.
Costs per Accident CategoryHome and leisure, sport, and occupational accidents
combined make a major contribution (86%) of the total hos-pital costs of injury in Europe. The costs of violence andsuicide, on the contrary, are both less than 1% of the total
medical costs of injury in Europe. Traffic injuries are respon-sible for the other 12% of hospital costs in Europe. The meanhospital costs per admitted patient are the highest for trafficinjuries (€2,330), followed by nontraffic injuries (€2,140),which are home and leisure, sport, and occupational acci-dents. They are relatively low for violence (€730) and suicide(€670). The observed variation is due to large differences inhealth care use per category.
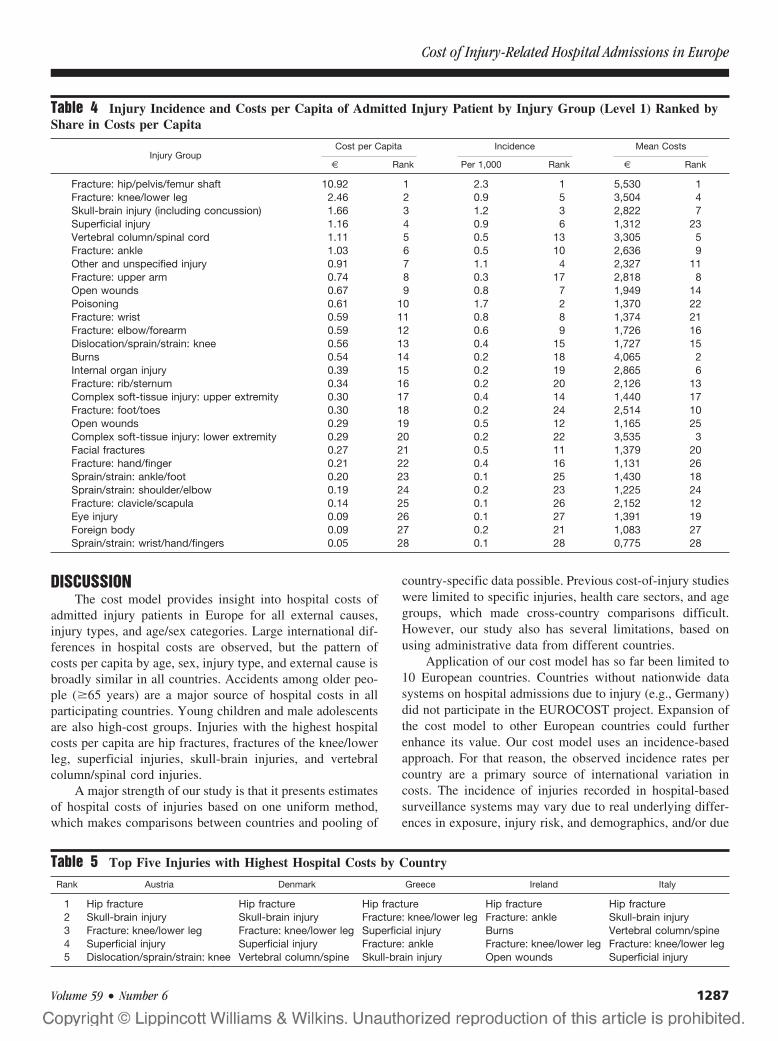
Costs by Injury TypeTable 4 shows the share of specific injuries in costs per
capita, injury incidence, and mean costs per patient for ad-mitted patients for the EUROCOST countries. Injury patientsadmitted with a hip fracture have by far the highest share intotal costs, caused by the highest incidence rate and also thehighest mean costs per patient. Among the five injuries withhighest cost per capita, we further observe two injuries withboth high incidence and high costs per patient (fracture of theknee/lower leg and skull brain injury, including concussion),one injury with high incidence but low costs per patient(superficial injury), and one injury with low incidence andhigh costs per patient (vertebral column/spinal cord injury).Apart from hip fracture, spinal cord injury, lower extremityinjuries (fractures and complex soft-tissue injuries), andburns cause high costs per admitted patient.
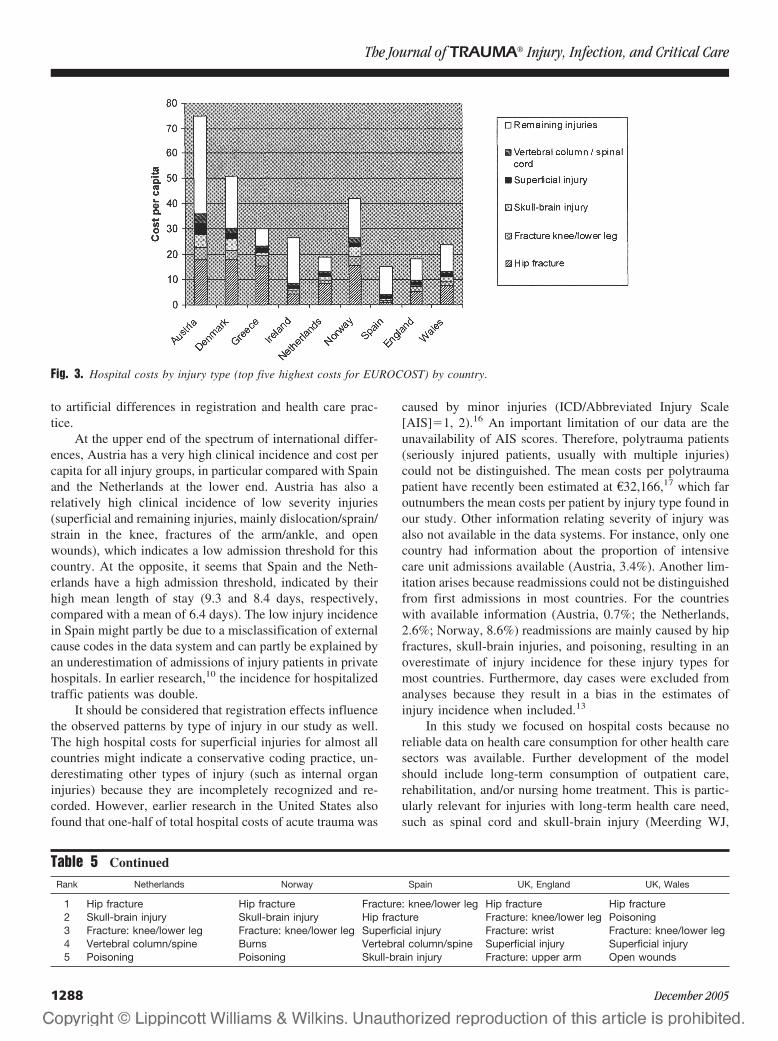
The patterns of the injuries with highest costs per capitaper country are quite similar between the countries (Table 5).The costs per capita are for all countries (except Spain) by farthe highest for hip fractures (Fig. 3). Furthermore, fracture ofthe knee/lower leg (all countries) and skull-brain injuries andsuperficial injuries (seven countries) were in the top fiveinjuries with the highest cost per capita. Skull-brain injuriesgenerate relatively low costs per capita in Ireland, England,and Wales, which might be due to traffic safety. Poisoning(the Netherlands, Norway, and Wales) and burns (Norwayand Ireland) result in high costs per capita, probably causedby a registration effect. Injury patients with wrist and upper-arm fractures generate relatively high costs per capita inEngland, which might indicate that England has a stringentadmission policy for this group of patients.
Austria generates the highest cost per capita for all injurygroups shown in Figure 2. The countries with highest meancost per capita (Austria, Norway, and Denmark) show re-markably higher costs per capita for hip fractures, fractureknee/lower leg, skull-brain injury, and spinal-cord injurycompared with countries with relatively low cost per capita(Netherlands, Spain, Ireland, England, and Wales).
In Figure 4 the costs of the elderly (patients older than 65years) are shown as a proportion of the total costs. For mostcountries, 20 to 30% of total costs of admitted injury patientswere due to this specific patient group; this group accountedfor 40% of total costs in Greece. Only in Spain is the share ofthis patient group below 10%. For all countries, femalesaccount for 75 to 85% of these costs.
Fig. 2. Hospital cost per capita (€) for admitted injury patients byage and sex for the EUROCOST countries.
The Journal of TRAUMA� Injury, Infection, and Critical Care
1286 December 2005
DISCUSSIONThe cost model provides insight into hospital costs of
admitted injury patients in Europe for all external causes,injury types, and age/sex categories. Large international dif-ferences in hospital costs are observed, but the pattern ofcosts per capita by age, sex, injury type, and external cause isbroadly similar in all countries. Accidents among older peo-ple (�65 years) are a major source of hospital costs in allparticipating countries. Young children and male adolescentsare also high-cost groups. Injuries with the highest hospitalcosts per capita are hip fractures, fractures of the knee/lowerleg, superficial injuries, skull-brain injuries, and vertebralcolumn/spinal cord injuries.
A major strength of our study is that it presents estimatesof hospital costs of injuries based on one uniform method,which makes comparisons between countries and pooling of
country-specific data possible. Previous cost-of-injury studieswere limited to specific injuries, health care sectors, and agegroups, which made cross-country comparisons difficult.However, our study also has several limitations, based onusing administrative data from different countries.
Application of our cost model has so far been limited to10 European countries. Countries without nationwide datasystems on hospital admissions due to injury (e.g., Germany)did not participate in the EUROCOST project. Expansion ofthe cost model to other European countries could furtherenhance its value. Our cost model uses an incidence-basedapproach. For that reason, the observed incidence rates percountry are a primary source of international variation incosts. The incidence of injuries recorded in hospital-basedsurveillance systems may vary due to real underlying differ-ences in exposure, injury risk, and demographics, and/or due
Table 4 Injury Incidence and Costs per Capita of Admitted Injury Patient by Injury Group (Level 1) Ranked byShare in Costs per Capita
Injury GroupCost per Capita Incidence Mean Costs
€ Rank Per 1,000 Rank € Rank
Fracture: hip/pelvis/femur shaft 10.92 1 2.3 1 5,530 1Fracture: knee/lower leg 2.46 2 0.9 5 3,504 4Skull-brain injury (including concussion) 1.66 3 1.2 3 2,822 7Superficial injury 1.16 4 0.9 6 1,312 23Vertebral column/spinal cord 1.11 5 0.5 13 3,305 5Fracture: ankle 1.03 6 0.5 10 2,636 9Other and unspecified injury 0.91 7 1.1 4 2,327 11Fracture: upper arm 0.74 8 0.3 17 2,818 8Open wounds 0.67 9 0.8 7 1,949 14Poisoning 0.61 10 1.7 2 1,370 22Fracture: wrist 0.59 11 0.8 8 1,374 21Fracture: elbow/forearm 0.59 12 0.6 9 1,726 16Dislocation/sprain/strain: knee 0.56 13 0.4 15 1,727 15Burns 0.54 14 0.2 18 4,065 2Internal organ injury 0.39 15 0.2 19 2,865 6Fracture: rib/sternum 0.34 16 0.2 20 2,126 13Complex soft-tissue injury: upper extremity 0.30 17 0.4 14 1,440 17Fracture: foot/toes 0.30 18 0.2 24 2,514 10Open wounds 0.29 19 0.5 12 1,165 25Complex soft-tissue injury: lower extremity 0.29 20 0.2 22 3,535 3Facial fractures 0.27 21 0.5 11 1,379 20Fracture: hand/finger 0.21 22 0.4 16 1,131 26Sprain/strain: ankle/foot 0.20 23 0.1 25 1,430 18Sprain/strain: shoulder/elbow 0.19 24 0.2 23 1,225 24Fracture: clavicle/scapula 0.14 25 0.1 26 2,152 12Eye injury 0.09 26 0.1 27 1,391 19Foreign body 0.09 27 0.2 21 1,083 27Sprain/strain: wrist/hand/fingers 0.05 28 0.1 28 0,775 28
Table 5 Top Five Injuries with Highest Hospital Costs by Country
Rank Austria Denmark Greece Ireland Italy
1 Hip fracture Hip fracture Hip fracture Hip fracture Hip fracture2 Skull-brain injury Skull-brain injury Fracture: knee/lower leg Fracture: ankle Skull-brain injury3 Fracture: knee/lower leg Fracture: knee/lower leg Superficial injury Burns Vertebral column/spine4 Superficial injury Superficial injury Fracture: ankle Fracture: knee/lower leg Fracture: knee/lower leg5 Dislocation/sprain/strain: knee Vertebral column/spine Skull-brain injury Open wounds Superficial injury
Cost of Injury-Related Hospital Admissions in Europe
Volume 59 • Number 6 1287
to artificial differences in registration and health care prac-tice.
At the upper end of the spectrum of international differ-ences, Austria has a very high clinical incidence and cost percapita for all injury groups, in particular compared with Spainand the Netherlands at the lower end. Austria has also arelatively high clinical incidence of low severity injuries(superficial and remaining injuries, mainly dislocation/sprain/strain in the knee, fractures of the arm/ankle, and openwounds), which indicates a low admission threshold for thiscountry. At the opposite, it seems that Spain and the Neth-erlands have a high admission threshold, indicated by theirhigh mean length of stay (9.3 and 8.4 days, respectively,compared with a mean of 6.4 days). The low injury incidencein Spain might partly be due to a misclassification of externalcause codes in the data system and can partly be explained byan underestimation of admissions of injury patients in privatehospitals. In earlier research,10 the incidence for hospitalizedtraffic patients was double.
It should be considered that registration effects influencethe observed patterns by type of injury in our study as well.The high hospital costs for superficial injuries for almost allcountries might indicate a conservative coding practice, un-derestimating other types of injury (such as internal organinjuries) because they are incompletely recognized and re-corded. However, earlier research in the United States alsofound that one-half of total hospital costs of acute trauma was
caused by minor injuries (ICD/Abbreviated Injury Scale[AIS]�1, 2).16 An important limitation of our data are theunavailability of AIS scores. Therefore, polytrauma patients(seriously injured patients, usually with multiple injuries)could not be distinguished. The mean costs per polytraumapatient have recently been estimated at €32,166,17 which faroutnumbers the mean costs per patient by injury type found inour study. Other information relating severity of injury wasalso not available in the data systems. For instance, only onecountry had information about the proportion of intensivecare unit admissions available (Austria, 3.4%). Another lim-itation arises because readmissions could not be distinguishedfrom first admissions in most countries. For the countrieswith available information (Austria, 0.7%; the Netherlands,2.6%; Norway, 8.6%) readmissions are mainly caused by hipfractures, skull-brain injuries, and poisoning, resulting in anoverestimate of injury incidence for these injury types formost countries. Furthermore, day cases were excluded fromanalyses because they result in a bias in the estimates ofinjury incidence when included.13
In this study we focused on hospital costs because noreliable data on health care consumption for other health caresectors was available. Further development of the modelshould include long-term consumption of outpatient care,rehabilitation, and/or nursing home treatment. This is partic-ularly relevant for injuries with long-term health care need,such as spinal cord and skull-brain injury (Meerding WJ,
Fig. 3. Hospital costs by injury type (top five highest costs for EUROCOST) by country.
Table 5 Continued
Rank Netherlands Norway Spain UK, England UK, Wales
1 Hip fracture Hip fracture Fracture: knee/lower leg Hip fracture Hip fracture2 Skull-brain injury Skull-brain injury Hip fracture Fracture: knee/lower leg Poisoning3 Fracture: knee/lower leg Fracture: knee/lower leg Superficial injury Fracture: wrist Fracture: knee/lower leg4 Vertebral column/spine Burns Vertebral column/spine Superficial injury Superficial injury5 Poisoning Poisoning Skull-brain injury Fracture: upper arm Open wounds
The Journal of TRAUMA� Injury, Infection, and Critical Care
1288 December 2005

Toet H, Mulder S, van Beeck EF, unpublished data, 2004).Earlier studies show that hospital care comprises on average69% of total health care costs in the Netherlands (MeerdingWJ, Toet H, Mulder S, van Beeck EF, unpublished data,2004), 73% in the United States,18 and 71% in Australia.19
Our results confirm outcomes of other studies1 in whichhip fractures, mainly due to home and leisure injuries amongelderly people, and skull-brain injuries were found as majorsources of injury costs (also Meerding WJ, Toet H, Mulder S,van Beeck EF, unpublished data, 2004). In the United States,it was also found that spinal cord injuries accounted for alarge share in total hospital expenditures.16 The high costs offractures of the knee and/or lower leg (9%), and of lower-extremity injuries in general (54% of total costs) are consis-tent with findings in Sweden (46% of health care costs ofunintentional injuries),5 and the United States (45% of hos-pital costs of injuries).16 In a classical study from the UnitedStates,20 medical costs for admitted injury patients were es-timated at about $8,800 per capita (adjusted for inflation up to1999), which is more than three times the estimate in ourpresent study ($2,600). This difference can partly be ex-plained by the use of charges instead of unit costs in the UScost calculations. However, in another cost study in theUnited States,16 twofold greater mean costs for admittedinjury patients were also found ($5,400). Because manymethodological and country-specific issues may cause differ-ences between Europe and the United States, a full compar-ison will need a specific study, with harmonized methods forthe United States and Europe.
The total hospital costs generated by injuries indicate therelative importance of injuries in the healthcare sector as awhole and may be useful in convincing politicians of theimportance of preventing injuries and investing in traumacare. Our cost model can be used for prioritizing policies byidentifying injuries and risk-groups to be considered for po-tential intervention. The future development of the costmodel concerns the inclusion of more cost items (e.g., costs
of extramural care, direct nonmedical costs) and countries tomake prioritizing possible based on total expenses. For pur-poses of setting priorities in injury prevention and traumacare, detailed information about external causes, severity(AIS/Injury Severity Score), and polytrauma should be avail-able, along with information about economic costs as as-sessed in this study. Moreover, it would be worthwhile toanalyze the differences in costs for specific injury groups(e.g., fractures, brain injury) in more detail and disentanglethe effect of differences in treatment and operation strategiesand differences in the way trauma care is delivered (includingthe specialties involved, such as trauma surgeons, orthopedicsurgeons, and neurosurgeons). Therefore, research in thisarea should be encouraged, including international studies oncosts of polytrauma with the help of trauma center databases.
Based on our current study, we conclude that the elderlyolder than age 65 years consume a disproportionate share ofhospital resources for trauma care, mainly caused by hipfractures and fractures of the knee/lower leg. They consti-tuted only 16% of the European population in 1999, butaccounted for 40% of total hospital costs,21 and the propor-tion of the population that is elderly is growing rapidly.Additional work should focus on societal cost–benefit anal-yses of interventions targeting elderly, quality of life follow-ing trauma, and injury prevention needs (e.g., prevention offalls) of the elderly. Other priority areas are skull-brain inju-ries, spinal cord injuries, burns, and complex soft-tissue in-juries of the lower extremities, deserving special attention asbeing the most important “low frequency, high impact” typesof injury. Our cost model can contribute to policy setting byidentifying types of injuries and high cost groups for potentialintervention.
REFERENCES1. Mulder S, Meerding WJ, Van Beeck EF. Setting priorities in injury
prevention: the application of an incidence based cost model. InjPrev. 2002;8:74–78.
Fig. 4. Hospital costs of elderly (�65 years) with a hip fracture as proportion of total costs by country.
Cost of Injury-Related Hospital Admissions in Europe
Volume 59 • Number 6 1289
2. Meerding WJ. Describing health and medical costs, and theeconomic evaluation of health care: applications in injuries andcervical cancer, in Department of Public Health. 2004, ErasmusMC:Rotterdam, the Netherlands.
3. MacKenzie EJ, Siegel JH, Shapiro S, et al. Functional recovery andmedical costs of trauma: an analysis by type and severity of injury.J Trauma. 1988;28:281–297.
4. Segui-Gomez M, Mackenzie EJ. Measuring the Public Health impactof injuries. Epidemiol Rev. 2003;25:3–19.
5. Lindqvist KS, Brodin H. One-year economic consequences ofaccidents in a Swedish municipality. Accid Anal and Prev. 1996;28:209–219.
6. Kopjar B. Costs of health care for unintentional injury in Stavanger,Norway. Eur J Public Health. 1997;7:321–327.
7. Bauer R. Overall costs to the Austrian national economy from homeand leisure accidents. Eur J Consumer Safety. 1995;2:7.
8. van Beeck E. Medical costs and economic production losses due toinjuries in the Netherlands. J Trauma. 1997;42:1116–1123.
9. Kidholm K, Soegaard J. A study of the cost of injury in roadaccidents [in Norwegian]. Odense: Odense University Press, 1997.
10. Bastida JL, Aguilar PS, Gonzalez BD. The economic costs of trafficaccidents in Spain. J Trauma. 2004;56:883–889.
11. Polinder S, Meerding WJ, Toet H, et al. A surveillance basedassessment of medical costs of injury in Europe: phase 2.Amsterdam: Consumer and Safety Institute, 2004.
12. Dessypris N, Petridou E, Skalkidis Y, et al. Countrywide estimationof the burden of injuries in Greece: a limited resources approach.J Cancer Epidemiol Prev. 2002;7:123–129.
13. Langley J, Stephenson S, Cryer C, Borman B. Traps for the unwaryin estimating person based injury incidence using hospital dischargedata. Inj Prev. 2002;8:332–337.
14. World Health Organization. International Classification of Diseases,9th edition. Geneva: World Health Organization, 1997.
15. Meerding WJ, Toet H, Mulder S, et al. A surveillance basedassessment of medical costs of injury in Europe: phase 1.Amsterdam: Consumer and Safety Institute, 2002.
16. Mackenzie EJ, Morris JA, Smith GS, Fahey M. Acute hospital costsof trauma in the United States: implications for regionalized systemsof care. J Trauma. 1990;30:1096–1101.
17. Schwermann T, Grotz M, Blanke, S. Ruchholtz, et al. Evaluation derKosten von polytraumatisierten Patienten insbesondere aus derPerspektive des Krankenhauses. Unfallchirurg. 2004;107:563–574.
18. Miller TR, Lestina DC. Patterns in US medical expenditures andutilization for injury, 1987. Am J Public Health. 1996;86:89–93.
19. Mathers CD, Penm R, Stevenson C, Carter R. Health system costs ofdiseases and injury in Australia, 1993–4. Health and WelfareExpenditure Series No. 2. Canberra: AIHW, 1998.
20. Rice DP, MacKenzie EJ. Cost of injury in the United States: a reportto congress. San Francisco: Institute for Health and Ageing,University of California, 1989.
21. European Network for Safety among Elderly. The right for a betterquality of life. Available at: http://www.cc.uoa.gr/health/socmed/hygien/eunese/. Accessed November 11, 2005.
EDITORIAL COMMENTThe observational review article by Polinder et al. on
“Cost of Injury-Related Hospital Admissions in Europe” useshospital discharge information from 10 European countries toexamine the use of hospital resources for injured patients andto determine the population that is not only most vulnerableto injury but also the most costly. As we all know, popula-tion-based registries provide the best demographic and over-all information of care provided by a region. However, there
are some limitations to this database, such as the inability toutilize secondary diagnosis and the necessity of using histor-ical data from Wales.1 Unfortunately, the sophisticatedhealthcare system of Germany is not included in the EURO-COST project due to the lack of a national data system onhospital admissions due to injuries. When the polytraumadatabase of the German Trauma Society is compared with theBritish Trauma Audit Research Network, it appears that thereare significant differences between these two countries, suchas a significantly higher percentage of pedestrian injuries andan increase in mortality in the United Kingdom, even thoughthere are higher transfusion rates, longer periods of mechan-ical ventilation and ventilator-associated pneumonia, longerintensive care unit (ICU) stays and use of the ICU inGermany.2 Unfortunately, comparing two different databasesdoes not necessarily explain differences between two differ-ent populations based on different medical systems.
The Polinder article found large European country dif-ferences in costs per inpatient day, with Norway being mostexpensive and the United Kingdom being less than half thecost, as well as emergency department costs with Norwayagain being most expensive and Greece being almost 60%less. Although the US population over 65 years of age isprojected to double between years 2000 and 2030 with ananticipated increase in the number of elderly patients injured,the Eurocost data shows quite clearly that the elderly femaleaccounts for a disproportionate share of hospital resourcesdue primarily to hip fractures, which is the top injury withhighest hospital cost in 9 out of the 10 countries examined,with fracture of the knee or lower leg and skull or brain injuryfollowing in prevalence and cost.1,3 In fact, 46% of the totalcosts of injury-related hospital admissions are due to personsover 65 years, with women accounting for 45% of overallinjuries, but accounting for 59% of the costs.
Interestingly, Spain has the highest mean length of staybut has the lowest cost per capita, suggesting that there is anovertriage with many patients with minimal or no injurybeing admitted for “observation,” a practice that is beingperformed less and less in the United States due to the factthat the number of trauma and critical care beds comparedwith 10 years ago have decreased, despite an increasingnumber in the US census. In fact, a survey of 12 geographicand socially diverse European countries suggests that stan-dardization of management of training would have merit,especially in a region of the world that is becoming morecohesive through the European Union. However, it also mustbe recognized that not all countries have philosophies or evenhealth care that would allow complete uniformity.4
The current database does not allow an analysis of thedifferences in costs for specific injury groups in detail. It alsodoes not allow further analysis of ICU patients regarding dayson the ventilators, number of ventilated patients, or compli-cations that may occur prolonging hospitalization.
Ideally, it would be optimal to take the best of eachcountry and make that the model trauma system for the
The Journal of TRAUMA� Injury, Infection, and Critical Care
1290 December 2005
region. However, due to differences in the health care sys-tems, the role of the various caregivers and the difficulty ofensuring that there is a uniform method of data collection, theresults of this study must be interpreted with caution. Also, ascosts of health care delivery in general appear to be moreexpensive in the United States, it would also be worthwhile tobe able to attempt to look at both of these systems on eitherside of the Atlantic to see where in the United States costsmight be diminished without a change in patient outcome orcare. Of course, the tort liability issue also significantly in-creases health care expenditures in the United States, withsome fields experiencing upwards of 30% increase in annualmalpractice premiums.
All in all, the issues in managing trauma patients aresimilar around the world. As healthcare improves, our pop-ulations are increasing in age and with additional comorbidi-ties and decreased physiologic reserve, the elderly are requir-ing increased intensity and utilization of our health care
resources. Unfortunately, the global shortage of healthcareproviders may make it difficult to improve on the intensity ofcare that the population requires, which is a frighteningthought as we all go through the aging process.
Marc J. Shapiro, MD, MSSUNY Stony BrookStony Brook, NY
REFERENCES1. Polinder et al. Cost Estimation of Injury-Related Hospital
Admissions in 10 European Countries. J. Trauma. 2005;59:1283–1291.
2. Hildebrand F. Management of polytraumatized patients withassociated blunt chest trauma: a comparison of two Europeancountries. Injury Int J Care Injured. 2005;36:293–302.
3. Clark DE, Chu MK. Increasing importance of the elderly in a traumasystem. Am J Emerg Med. 2002;20:108–111.
4. Uranus S, Lennquist S. Trauma Management and Education inEurope: A survey of twelve geographically and socioeconomicallydiverse European countries. Eur J Surg. 2002;168:730–735.
Cost of Injury-Related Hospital Admissions in Europe
Volume 59 • Number 6 1291