cost estimation methods: strategies and examples for
TRANSCRIPT

University of Kentucky University of Kentucky
UKnowledge UKnowledge
Health Management and Policy Presentations Health Management and Policy
3-29-2013
Cost Estimation Methods: Strategies and Examples for Public Cost Estimation Methods: Strategies and Examples for Public
Health Services & Systems Research Health Services & Systems Research
Glen P. Mays University of Kentucky, [email protected]
Follow this and additional works at: https://uknowledge.uky.edu/hsm_present
Part of the Econometrics Commons, Health and Medical Administration Commons, Health Economics
Commons, Health Policy Commons, Health Services Administration Commons, and the Health Services
Research Commons
Right click to open a feedback form in a new tab to let us know how this document benefits you. Right click to open a feedback form in a new tab to let us know how this document benefits you.
Repository Citation Repository Citation Mays, Glen P., "Cost Estimation Methods: Strategies and Examples for Public Health Services & Systems Research" (2013). Health Management and Policy Presentations. 30. https://uknowledge.uky.edu/hsm_present/30
This Presentation is brought to you for free and open access by the Health Management and Policy at UKnowledge. It has been accepted for inclusion in Health Management and Policy Presentations by an authorized administrator of UKnowledge. For more information, please contact [email protected].

Cost Estimation Methods: Strategies and Examples for Public Health
Services & Systems Research
Glen Mays, PhD, MPH University of Kentucky
Public Health PBRN Skill-Building Webinar • 29 March 2012

Why the Focus on Costs?
2012 Institute of Medicine Recommendations • Identify the components and costs of a minimum package
of public health services – Foundational capabilities – Basic programs
• Allow greater flexibility in how states and localities use federal public health funds
• Implement a national chart of accounts for tracking spending levels and flow of funds
• Expand research on costs and effects of public health delivery
Institute of Medicine. For the Public’s Health: Investing in a Healthier Future. Washington, DC: National Academies Press; 2012.
Public Health PBRN Research Streams • Delivery System Organization and Structure • Practice Variation • Volume, Intensity, and Quality of Delivery • Cost of Delivery • Value and ROI of Public Health
Why the Focus on Costs?

Institute of Medicine. An Integrated Framework for Assessing the Value of Community-Based Prevention. Washington, DC; 2012.
Valuing Prevention & Public Health
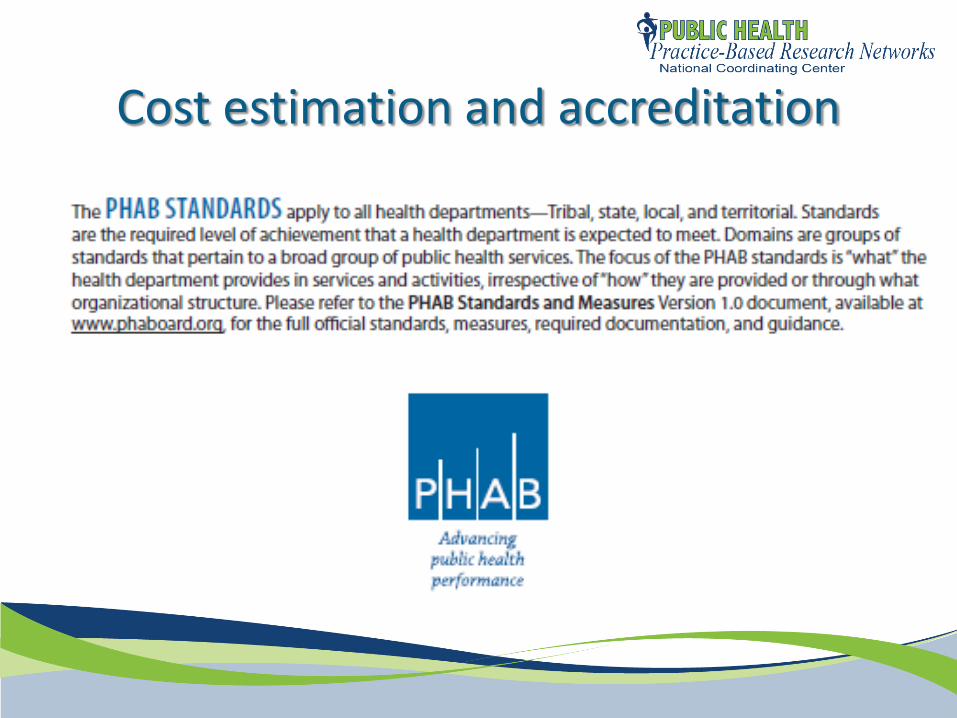
Cost estimation and accreditation
Key questions
What level of resources are required to deliver a given bundle of public health activities for a given population?
How do delivery costs vary across communities and population groups?
Where are the opportunities to realize efficiencies in delivery?
Policy relevance: ROI
Do outcomes achieved by public health interventions justify their costs?
Where should new investments be directed to achieve their greatest impact?

Related questions of value…
• How much health can we produce through public health investments?
• Can public health investments help “bend the curve” to contain medical costs?

ROI Uncertainty and Controversy

Challenges in estimating costs and ROI in public health
Time lag between costs and benefits Distribution of costs and benefits: concentrated costs but diffuse benefits Measurement of costs and benefits requires good information systems
• Attribution of costs and benefits: the counterfactual

CDC’s Public Health Model for Prevention

First Principles
Estimating total economic costs of an activity Costs = value of resources used to produce activity Resources = people, facilities, equipment, supplies …Key concept: opportunity costs

Financial Costs
Expenditures for resources to implement the activity – based on market prices Often reflected in expenditure reports, invoices Convenient, sometimes incomplete, measures Examples: Salaries for project personnel Supply costs Computer purchases Cost of curriculum materials
Economic Costs
Value of the lost benefit because the resource is not available for its next best use Examples: Volunteer time Donated space
Shadow prices may be used when market price does not accurately reflect the value of the resource

Developing a cost classification system Perspective: who incurs cost Timeframe: over what period Type of resource Labor, equipment, supplies, facilities, etc
Activity domains/areas Training, curriculum development, surveillance,
recruitment, screening, administration Pre-implementation vs. post-implementation
“Direct” vs. “indirect” activities Capital vs. operating costs (& depreciation)
Developing a cost classification system Common resource categories Noncontract labor Contract services Materials/supplies Building/facilities Donated labor and resources Other resources not funded directly

Developing a cost classification system Don’t overlook...
Resources that are hard to measure or value Resources used in small amounts Resources procured without money Volunteer time Parent/caregiver time Intervention recipient time In-kind contributions/donated materials Existing resources
Developing a cost classification system Include measures of units of activity Unit costs
Fixed vs. variable costs Variable costs vary with activity level Fixed costs are constant despite volume of activity Long term, all costs are variable

Developing a cost classification system Handling resources that are shared by multiple programs, activities, or organizations Cost allocation methods Time Intensity of use
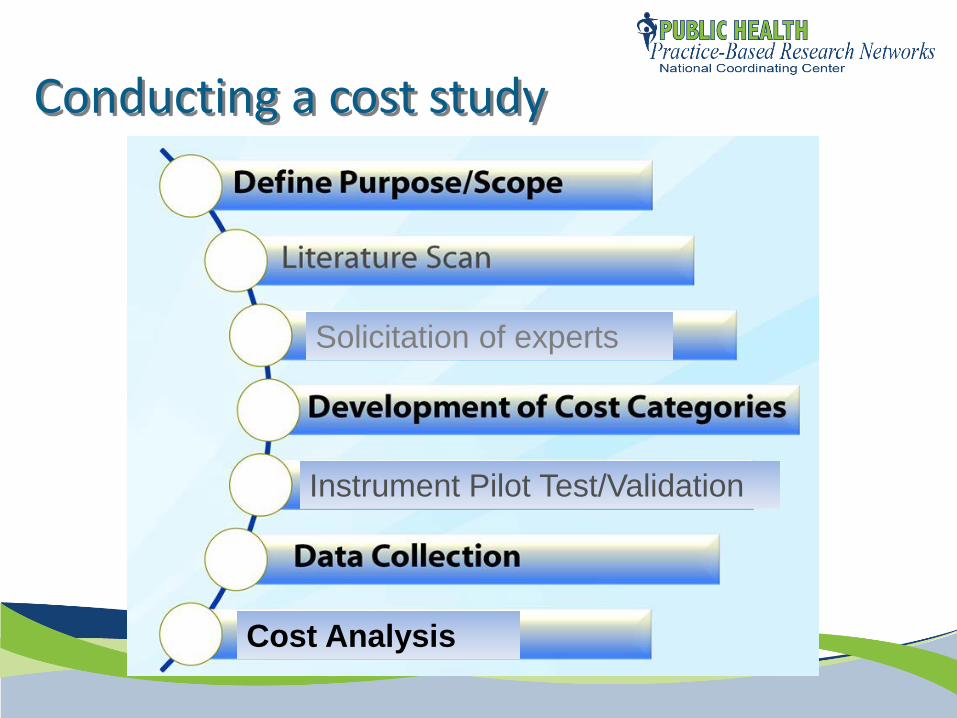
Conducting a cost study
Solicitation of experts
Instrument Pilot Test/Validation
Cost Analysis
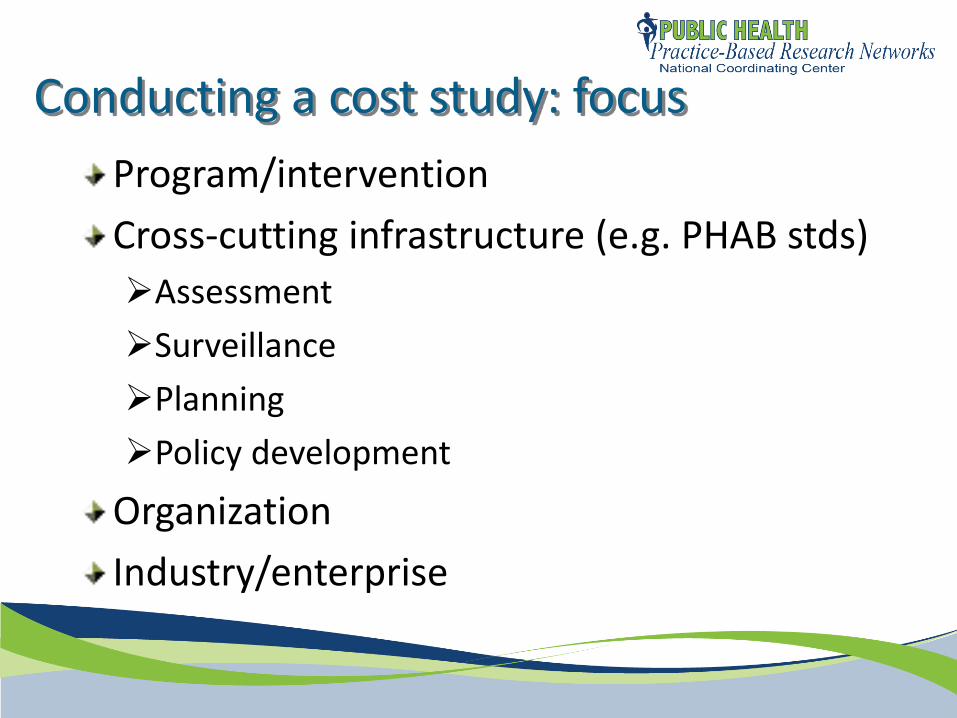
Conducting a cost study: focus Program/intervention Cross-cutting infrastructure (e.g. PHAB stds) Assessment Surveillance Planning Policy development
Organization Industry/enterprise

Cost data collection methods Direct observation methods Time studies and time-and-motion methods
random moment time sampling
Activity logs Analysis of administrative records Surveys
Program delivery staff Program managers/directors
Group process methods with vignettes

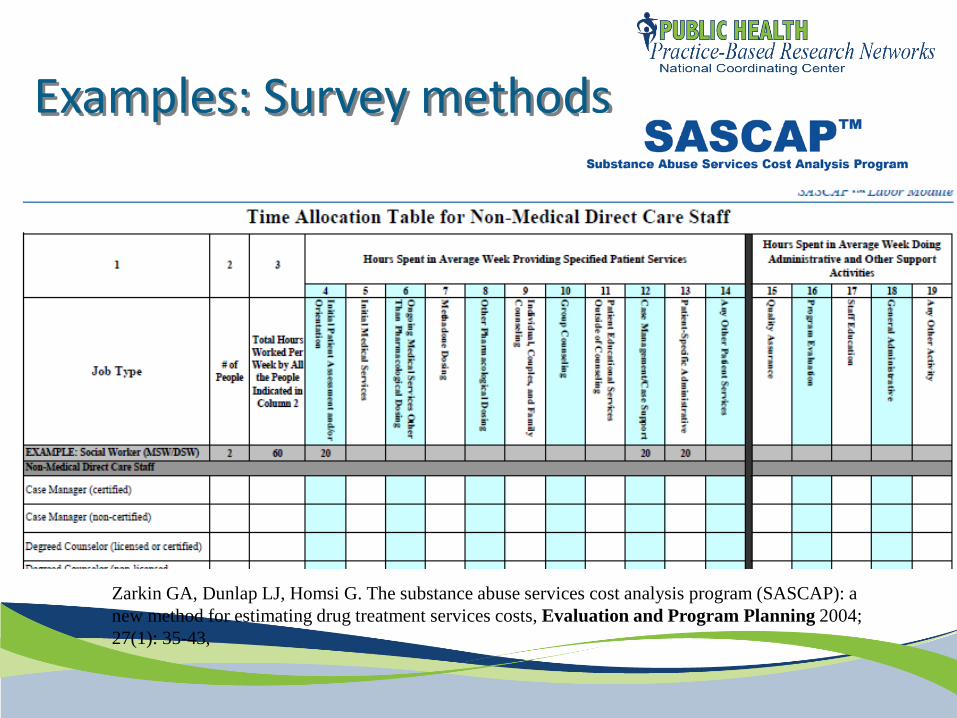
Examples: Survey methods
Three dimensions of work: Mental effort and judgment Technical skill and physical effort Stress

Examples: Survey methods

Examples: Survey methods
Zarkin GA, Dunlap LJ, Homsi G. The substance abuse services cost analysis program (SASCAP): a new method for estimating drug treatment services costs, Evaluation and Program Planning 2004; 27(1): 35-43,
Surveys program managers Refers to expenditure records (not budgets) Explicit allocation of resources across multiple programs Available at:
http://www.rti.org/page.cfm?objectid=7E6095C8-AE6E-4568-874839C81FAD414B
Examples: Survey methods
Zarkin GA, Dunlap LJ, Homsi G. The substance abuse services cost analysis program (SASCAP): a new method for estimating drug treatment services costs, Evaluation and Program Planning 2004; 27(1): 35-43,

Analyzing costs Average vs. marginal costs? Compared to what? Doing nothing Status quo Other settings, implementation strategies Other activities/interventions
Quantifying variation in costs Scale and scope Context

Analyzing costs: example

Analyzing costs Identifying determinants of costs
cost function estimation Examining cost heterogeneity and efficiency
Stochastic frontier analysis Data envelopment analysis

Analyzing costs

Resources USDHHS Assistant Secretary for Planning and Evaluation. Guide to Analyzing the Cost-Effectiveness of Community Public Health Prevention Approaches. www.aspe.hhs.gov/health/reports/06/cphpa/report.pdf Haddix AC et al (CDC). Prevention Effectiveness: A Guide to Decision Analysis and Economic Evaluation. Oxford University Press. RTI. Substance Abuse Services Cost Analysis Program. http://www.rti.org/page.cfm?objectid=7E6095C8-AE6E-4568-874839C81FAD414B

Glen P. Mays, Ph.D., M.P.H. [email protected]
University of Kentucky College of Public Health Lexington, KY
Supported by The Robert Wood Johnson Foundation
Email: [email protected] Web: www.publichealthsystems.org Journal: www.FrontiersinPHSSR.org
For more information

Michael Morris Department of Health Policy & Management
Fay W. Boozman College of Public Health University of Arkansas for Medical Sciences
03/29/2013
1
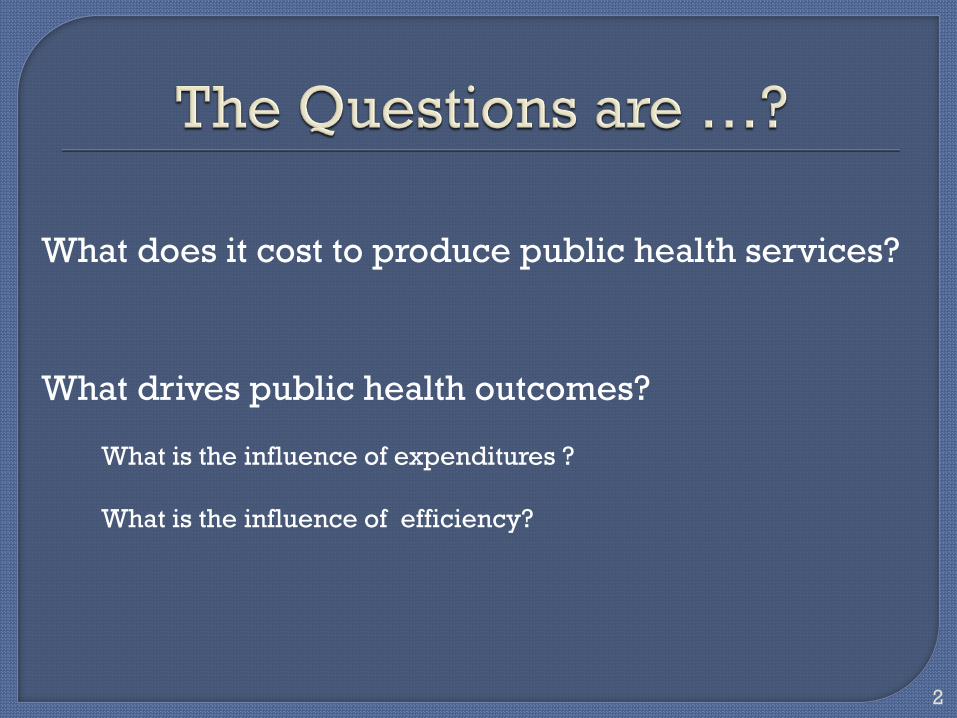
What does it cost to produce public health services? What drives public health outcomes?
What is the influence of expenditures ?
What is the influence of efficiency?
2

Lots of different “Cost Function” models
Inputs Processes Outputs Selected a Hybrid Translog Cost Model
***How you approach depends on*** The data that you have and the questions you are asking
3

Data … Data … Data … & Data!!
Inputs • What goes into creating the product
Process • How “it” happens. Usually a “black box”
Outputs • What is produced from the Inputs
4
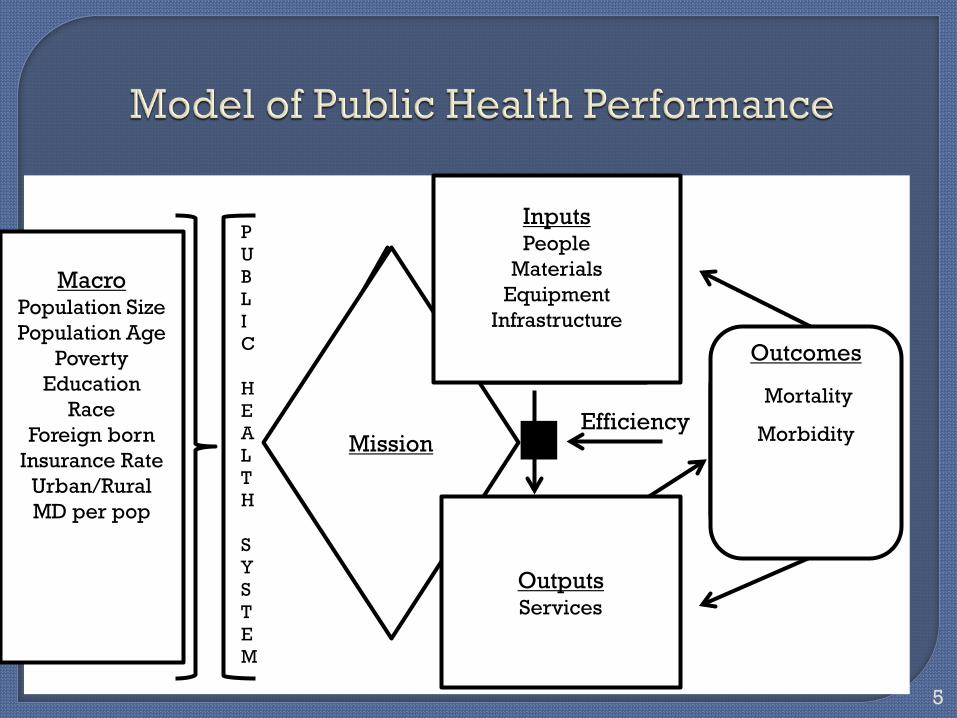
5
M A C R O C O N T E X T
P U B L I C H E A L T H St Y S T E M
tPHS Mission
Inputs
Outputs
Outcomes Efficiency
Mission
Inputs People
Materials Equipment
Infrastructure
Outputs Services
Outcomes
Mortality
Morbidity
Macro Population Size Population Age
Poverty Education
Race Foreign born
Insurance Rate Urban/Rural MD per pop

Florida 2005 to 2009
Maternal & child health service line • Includes expenditures & services for… Women infants and children program (WIC) Family planning services Maternal, Infant, Child & Adolescent services
6

Two Components of Inputs • Labor FTEs X Salary
• Capital Buildings Information systems
Where to get data? • Florida Department of Health FDOH collects FTE data by service lines FDOH no data on capital used
• County Budgets Crude estimate of capital based on expenditures for
facilities
7

No direct capture of this
Will use efficiency frontier as a proxy when we examine efficiency
8

Two Components of Outputs • Number of Outputs • Quality of Outputs
Where to get data? • Florida Department of Health FDOH defines what a service is by type of service FDOH collects data on the number of services FDOH No data on the quality of services
• National Public Health Performance Standards Used as proxy for quality
9
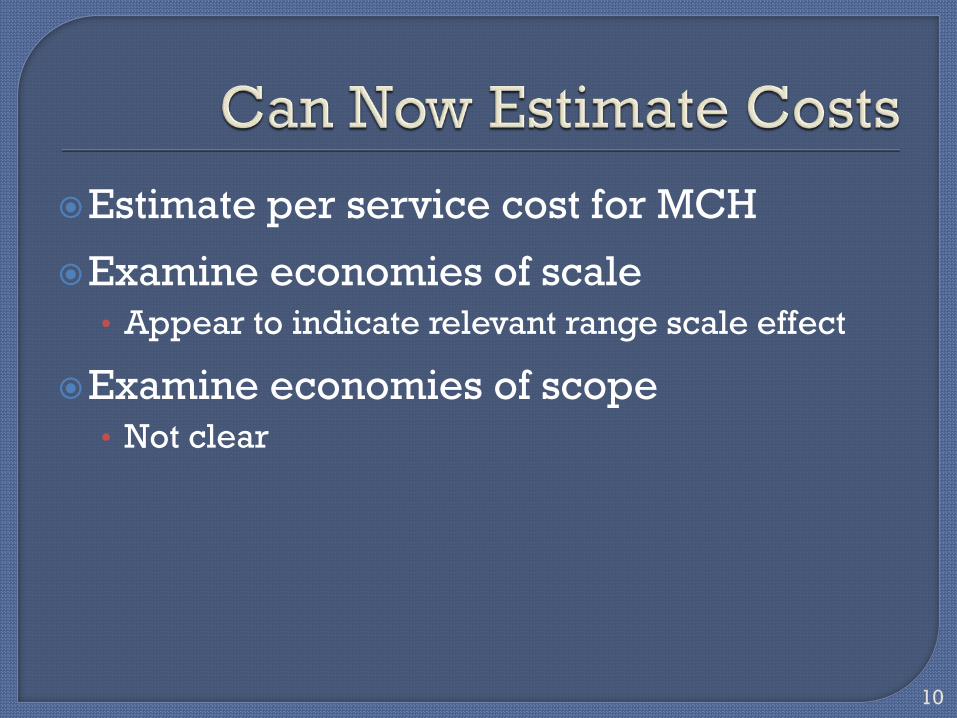
Estimate per service cost for MCH
Examine economies of scale • Appear to indicate relevant range scale effect
Examine economies of scope • Not clear
10

Mortality • Infant mortality rates
Morbidity • Low birth weight rates
Where to get data? • Florida Department of Health CHARTS Data System
11
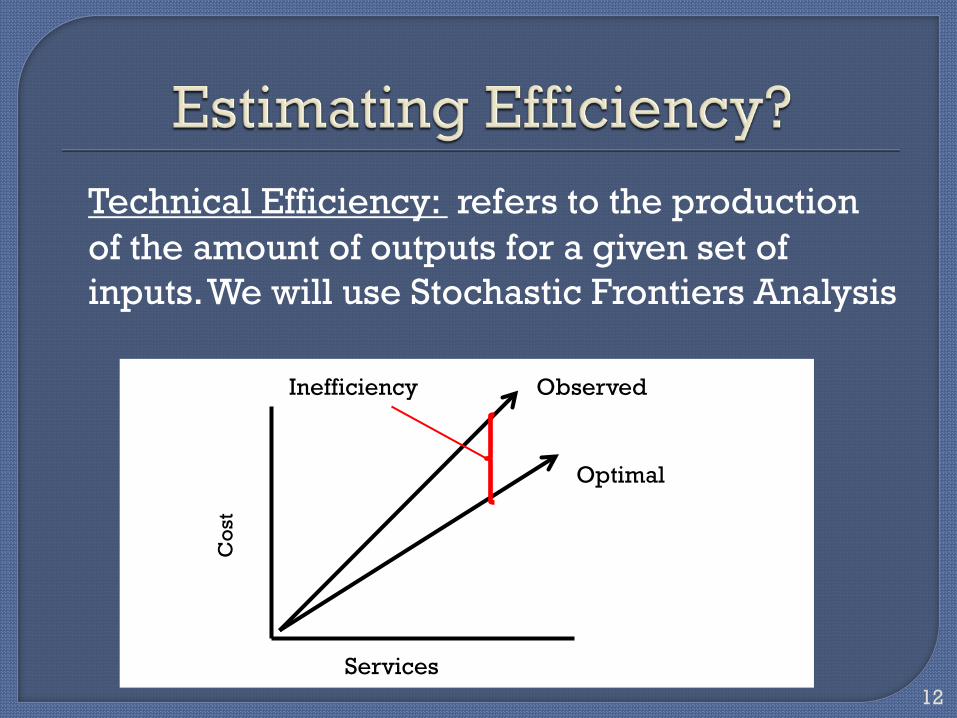
Technical Efficiency: refers to the production of the amount of outputs for a given set of inputs. We will use Stochastic Frontiers Analysis
12
Cos
t
Services
Observed
Optimal
Inefficiency

First introduced 1977, (Aigner, Lovell and Schmidt)
Estimates a maximum output per input “Frontier”
Compares observed input to output functions in relation to the “Frontier” (Benchmarking)
SFA results range from 0 to 1 where 1 = optimality
13

0.66
0.68
0.7
0.72
0.74
0.76
0.78
0.8
0.82
0.84
2005 2006 2007 2008 2009
Overall
WIC
14

Modeling Approach • Panel Regression (Fixed effects) • Expenditures & Efficiency lagged (t-1) • Comparison to instrumental variable approach
Models
A. Model for each of the health outcomes with expenditures
B. Model for each of the health outcomes with efficiency
C. Model for each of the health outcomes with expenditures & efficiency
15

Primary Independent Variable
Coefficient 95% CI Low High
P-value
MCH Expenditures
Per Capita
-0.021
-0.032 -0.011
.041
MCH
Technical Efficiency
-0.036
-0.053 -0.014
.037
Expenditure and
Technical Efficiency in model
-0.112
-0.204 -0.020
.022
16
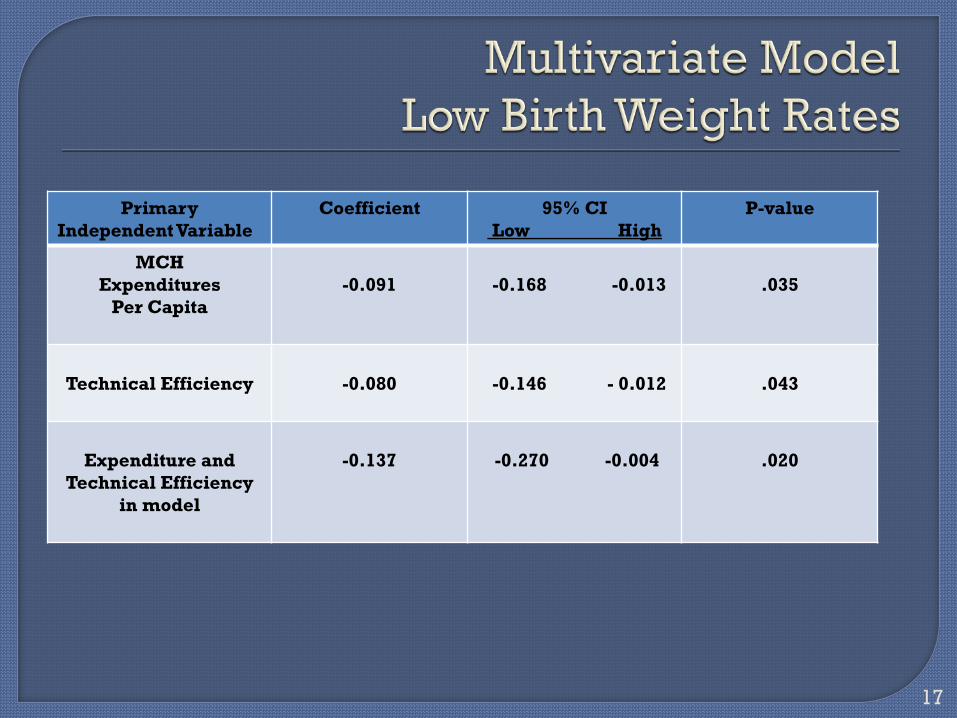
Primary Independent Variable
Coefficient 95% CI Low High
P-value
MCH Expenditures
Per Capita
-0.091
-0.168 -0.013
.035
Technical Efficiency
-0.080
-0.146 - 0.012
.043
Expenditure and
Technical Efficiency in model
-0.137
-0.270 -0.004
.020
17

Expenditures associated with mortality
Expenditures associated with morbidity
Efficiency associated with mortality
Efficiency associated with morbidity
Expenditures and Efficiency strongest predictor
18

Indicates importance of base funding
Indicates process can influence outcomes
Indicates the need for better management data
Indicates the need for better service measures
19

P.M. Bernet, Hinfo.org (03.29.2013) Public Health Cost Estimation Methods. page 1 of 19
Public Health Cost Estimation Methods
Project goal - Scalable cost model Data sources Key proxy variables Models Major determinants Findings
Team: Jason Orcena Terry Allan Nancy Osborn Patrick Bernet Simone Singh Beth Bickford Matthew Stefanak Gene Nixon Krista Wasowski Ohio Research Association for Public Health Improvement (RAPHI) Association of Ohio Health Commissioners Funding for this Quick Strike project provided by the Robert Wood Johnson Foundation.
Presented to 2013 Public Health PBRN Quarterly Skill-Building Webinar. 29 March 2013.
. Presented by Patrick M. Bernet, Associate Professor of Healthcare Finance.
w. www.Hinfo.org. e. [email protected]. .
P.M. Bernet, Hinfo.org (03.29.2013) Public Health Cost Estimation Methods. page 2 of 19
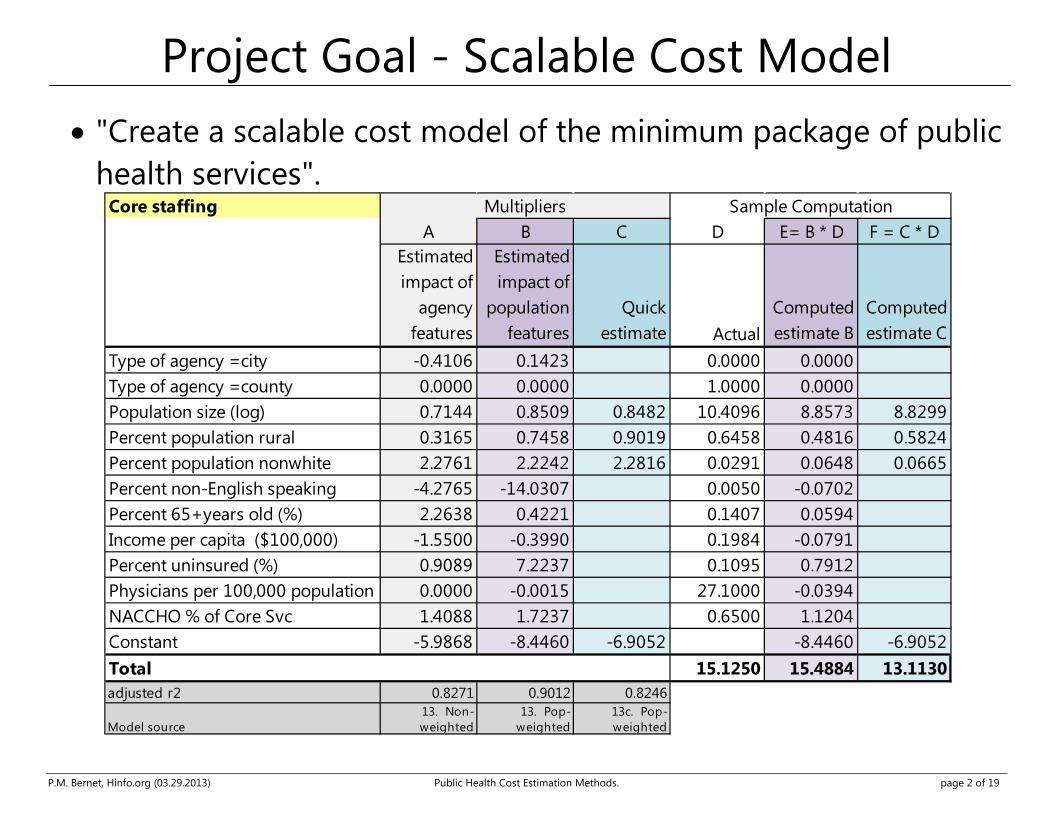
Project Goal - Scalable Cost Model
• "Create a scalable cost model of the minimum package of public health services".
Core staffingA B C D E= B * D F = C * D
Estimated impact of
agency features
Estimated impact of
population features
Quick estimate Actual
Computed estimate B
Computed estimate C
Type of agency =city -0.4106 0.1423 0.0000 0.0000Type of agency =county 0.0000 0.0000 1.0000 0.0000Population size (log) 0.7144 0.8509 0.8482 10.4096 8.8573 8.8299Percent population rural 0.3165 0.7458 0.9019 0.6458 0.4816 0.5824Percent population nonwhite 2.2761 2.2242 2.2816 0.0291 0.0648 0.0665Percent non-English speaking -4.2765 -14.0307 0.0050 -0.0702Percent 65+years old (%) 2.2638 0.4221 0.1407 0.0594Income per capita ($100,000) -1.5500 -0.3990 0.1984 -0.0791Percent uninsured (%) 0.9089 7.2237 0.1095 0.7912Physicians per 100,000 population 0.0000 -0.0015 27.1000 -0.0394NACCHO % of Core Svc 1.4088 1.7237 0.6500 1.1204Constant -5.9868 -8.4460 -6.9052 -8.4460 -6.9052Total 15.1250 15.4884 13.1130adjusted r2 0.8271 0.9012 0.8246
Model source13. Non-weighted
13. Pop-weighted
13c. Pop-weighted
Sample ComputationMultipliers

P.M. Bernet, Hinfo.org (03.29.2013) Public Health Cost Estimation Methods. page 3 of 19
Core Services and Foundational Capabilities

P.M. Bernet, Hinfo.org (03.29.2013) Public Health Cost Estimation Methods. page 4 of 19
Expenditures
• Annual Financial Report (AFR).
AFR Expense Category Clinical Core & Foundational
Environmental Health Core General Administration Core Health Promotion Core Home Health Clinical Personal Health Clinical Personal Health - Other Clinical Laboratory (Clinical and Environmental) Core Vital Statistic Core

P.M. Bernet, Hinfo.org (03.29.2013) Public Health Cost Estimation Methods. page 5 of 19
Staff
Positions considered "clinical" (Annual Financial Report) Clinical Supervisor Dentist Home Health Care Aide Hygienist Licensed Practical Nurse * 0.91 Medical Transcriptionist Nurse Practitioner Physician Public Health RN (I, II, etc.) * 0.91 Dental Assistants
• Team's subjective input used to estimate portion of LPN and RN time dedicated to clinical care.

P.M. Bernet, Hinfo.org (03.29.2013) Public Health Cost Estimation Methods. page 6 of 19
Foundational Capabilities
Improvement Standard area
Example accreditation requirement # criterion
Quality assurance Engage staff at all organizational levels in establishing or updating a performance management system (9.1.1)
9
Information management and analysis
Communicate with surveillance sites at least annually (1.2.2)
8
Policy development Communicate research findings, including public health implications (10.2.3)
5
Resource development
Maintain a human resources system (11.1.4) 5
Legal support Review laws to determine the need for revisions (6.1.1) 3 Laboratory capacity Maintain access to laboratory and other support personnel
and infrastructure capable of providing surge capacity (2.3.3)
2
Support and expertise for LHD community engagement strategies
Maintain written protocols for urgent 24/7 communications (2.4.1)
22

P.M. Bernet, Hinfo.org (03.29.2013) Public Health Cost Estimation Methods. page 7 of 19
NACCHO - Core/Clinical Services
Category Clinical Services Clinical preventive services
Adult immunizations, Childhood immunizations, HIV screening, STD screening, Tuberculosis screening, Cancer screening,
Cardiovascular disease screening, Diabetes screening, Blood pressure screening, Family planning, EPSTD services,
Medical treatment services
HIV treatment, STD treatment, Tuberculosis treatment, Prenatal care,
Obstetrical services, Primary care services, Home health care, School based clinics
Specialty care services
Dental services,
Substance abuse treatment,
Population-based activities
Tobacco prevention, Injury prevention, Occupational safety, Emergency Preparedness
School health, Health education, Epidemiological investigation
Regulatory-licensing activities
Swimming pool inspection, food inspection,
food service licensing, private drinking water inspection,
Environmental health activities
Indoor air quality monitoring, animal control, vector control,
ground water protection, surface water protection,
P.M. Bernet, Hinfo.org (03.29.2013) Public Health Cost Estimation Methods. page 8 of 19
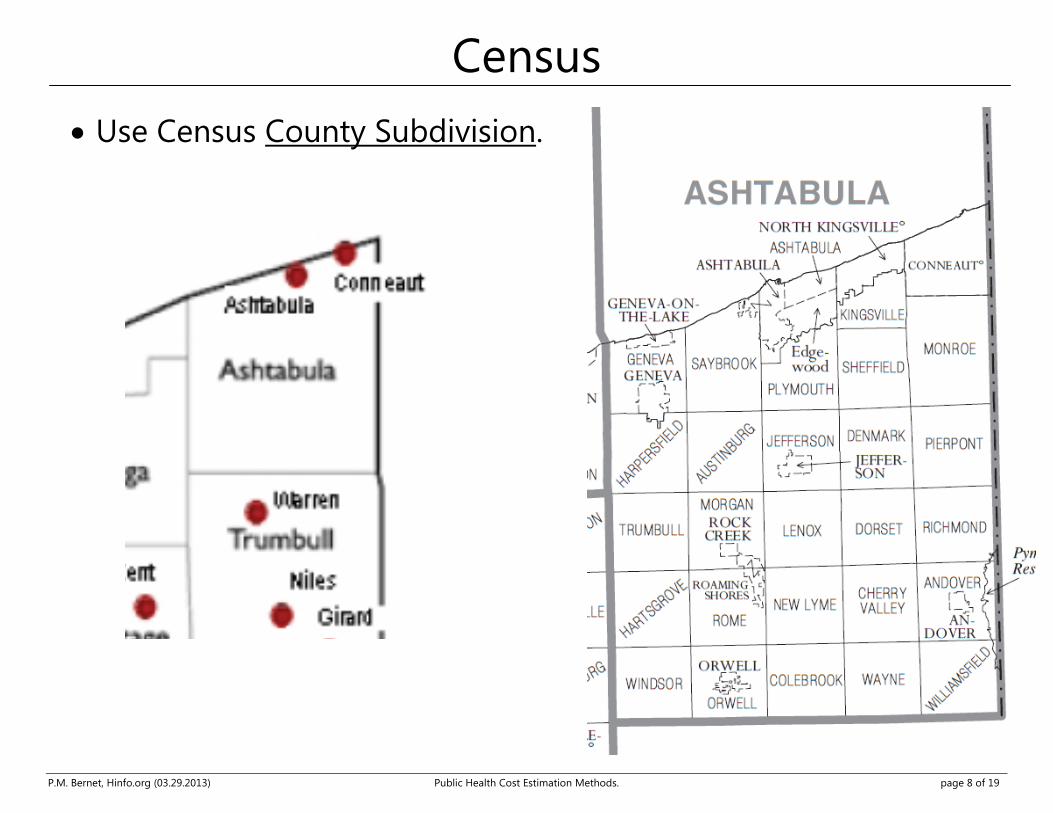
Census
• Use Census County Subdivision.

P.M. Bernet, Hinfo.org (03.29.2013) Public Health Cost Estimation Methods. page 9 of 19
Service Mix Intensity

P.M. Bernet, Hinfo.org (03.29.2013) Public Health Cost Estimation Methods. page 10 of 19
Clincial Non-weighted (each LHD = 1) Population-weighted FTEs _21 _22 _23 _24 _25 _26 _21 _22 _23 _24 _25 _26
Agency characteristicsType of agency =city 0.00 0.00 0.00 0.00 0.00 0.00 0.60 0.70 0.42 * 0.60 0.66 0.08Type of agency =county 0.84 0.33 0.50 0.77 0.59 0.45 0.00 0.00 0.00 0.00 0.00 0.00
Population characteristicsPopulation size (log) 0.71 *** 0.47 ** 0.78 *** 0.63 *** 0.71 *** 0.76 *** 1.05 *** 0.93 *** 1.07 *** 0.95 *** 1.03 *** 0.88 ***Percent population rural 0.00 0.13 0.17 0.14 0.20 0.21 1.03 1.20 * 0.76 ** 1.38 * 1.19 0.78Percent population nonwhite 1.84 1.55 1.25 1.38 1.35 0.60 -1.57 -1.43 -0.07 -1.62 -1.51 -0.56Average years of educationPercent non-English speaking -2.22 0.95 -3.52 0.38 -4.78 -3.46 -12.83 -12.18 -17.42 *** -7.70 -15.43 -17.85 *Percent 65+years old (%) 1.98 4.55 1.82 5.11 5.18 6.15 3.26 4.83 -0.04 6.13 4.19 3.98Income per capita ($100,000) -6.36 *** -3.90 * -3.30 ** -4.25 * -5.30 ** -5.44 ** -3.29 -2.74 -1.09 -1.77 -2.98 -3.99Percent uninsured (%) 2.50 5.87 0.44 -0.01 2.37 3.45 6.71 8.80 8.23 *** 3.46 7.18 7.46Physicians per 100,000 population 0.00 0.00 0.00 0.00 0.00 0.00 0.01 0.01 0.00 0.01 0.01 0.01
Core-Plus Scale measuresNACCHO breadth of coverage 0.02 ** 0.01 0.01 *** 0.01 0.02 *** 0.03 *** 0.03 *** 0.03 *** 0.02 *** 0.03 *** 0.04 *** 0.04 ***
Scope of Service% spending on direct patient care 0.86 *** 1.05 ***Staffing Mix - Admin -10.14 *** -5.66 **% staffing on direct patient care 6.55 *** 7.46 ***Case complexity 2.59 *** 1.91 **Foundational Capability Strength -0.35 -0.41
Foundational Capability Mix QA 0.00 0.31 Information Mgt 0.44 -0.03 Policy Development -0.35 0.49 Resource Development 1.66 2.61 ** Legal Support -0.73 -1.93 ** Lab Capacity -0.60 -0.29 Comm Engage -0.05 -1.43
Run summaryConstant -7.23 *** -4.18 * -9.23 *** -6.90 *** -7.46 *** -8.65 *** -12.54 *** -11.17 *** -13.40 *** -12.15 *** -12.31 *** -10.30 ***F 10.81 *** 11.19 *** 47.84 *** 8.10 *** 6.64 *** 4.42 *** 16.34 *** 14.44 *** 72.35 *** 14.59 *** 13.41 *** 9.35 ***r2 0.57 0.58 0.86 0.50 0.45 0.47 0.67 0.64 0.90 0.64 0.62 0.66adjusted r2 0.52 0.53 0.84 0.44 0.38 0.37 0.63 0.60 0.89 0.60 0.58 0.59N 101.00 101.00 101.00 101.00 101.00 101.00 101.00 101.00 101.00 101.00 101.00 101.00
FTEs per capitaPopulation size (log) -0.29 -0.53 *** -0.22 * -0.37 * -0.29 -0.24 0.05 -0.07 0.07 -0.05 0.03 -0.12Run summary
F 5.75 *** 6.02 *** 32.85 *** 3.76 *** 2.69 *** 1.92 ** 5.79 *** 4.71 *** 37.60 *** 4.79 *** 4.12 *** 3.20 ***adjusted r2 0.34 0.36 0.78 0.23 0.16 0.14 0.34 0.29 0.80 0.29 0.26 0.27
Models

P.M. Bernet, Hinfo.org (03.29.2013) Public Health Cost Estimation Methods. page 11 of 19
Best Models • Select based on accuracy, data availability and parsimony.
Core & Foundational Non-weighted (each LHD = 1) Population-weighted FTEs _01 _03 _13 _23 _01 _03 _13 _23
Agency characteristicsType of agency =city -0.45 * -0.03 -0.41 -0.43 * 0.26 0.64 *** 0.14 0.21Type of agency =county 0.00 0.00 0.00 0.00 0.00 0.00 0.00 0.00
Population characteristicsPopulation size (log) 0.82 *** 0.93 *** 0.71 *** 0.72 *** 1.01 *** 1.10 *** 0.85 *** 0.92 ***Percent population rural 0.36 0.54 * 0.32 0.29 0.90 *** 0.86 ** 0.75 *** 0.75 ***Percent population nonwhite 2.75 *** 2.28 *** 2.26 *** 2.55 *** 2.22 *** 1.67 **Percent non-English speaking -4.74 -1.85 -4.28 -3.36 -19.86 *** -21.18 *** -14.03 *** -13.74 ***Percent 65+years old (%) 1.41 1.22 2.26 1.91 1.28 -0.09 0.42 0.18Income per capita ($100,000) -1.51 -2.01 * -1.55 -1.21 0.10 -1.50 -0.40 0.10Percent uninsured (%) 0.51 -1.23 0.91 0.37 7.88 *** 8.49 *** 7.22 *** 6.18 ***Physicians per 100,000 population 0.00 0.00 0.00 0.00 0.00 0.00 0.00 0.00
Core-Plus Scale measuresNACCHO breadth of coverage 0.02 *** 0.02 ***NACCHO % of Core Svc 1.41 *** 1.72 ***
Scope of Service% staffing on direct patient care 0.69 ** 0.68 *
Run summaryConstant -5.56 * -7.14 *** -5.99 *** -5.93 *** -9.84 *** -10.02 *** -8.45 *** -8.96 ***
adjusted r2 0.79 0.78 0.83 0.83 0.86 0.85 0.90 0.90N 113.00 113.00 111.00 111.00 113.00 113.00 111.00 111.00
FTEs per capitaPopulation size (log) -0.18 ** -0.07 -0.29 *** -0.28 *** 0.01 0.10 -0.15 ** -0.08Run summary
F 3.73 *** 2.96 *** 6.91 *** 6.52 *** 8.99 *** 9.35 *** 17.48 *** 14.96 ***adjusted r2 0.20 0.12 0.35 0.36 0.42 0.37 0.60 0.58

P.M. Bernet, Hinfo.org (03.29.2013) Public Health Cost Estimation Methods. page 12 of 19
Model Fit
Core Staffing Core Spending
Ac-tu- al Estimate
Ac-tu- al Estimate
P.M. Bernet, Hinfo.org (03.29.2013) Public Health Cost Estimation Methods. page 13 of 19
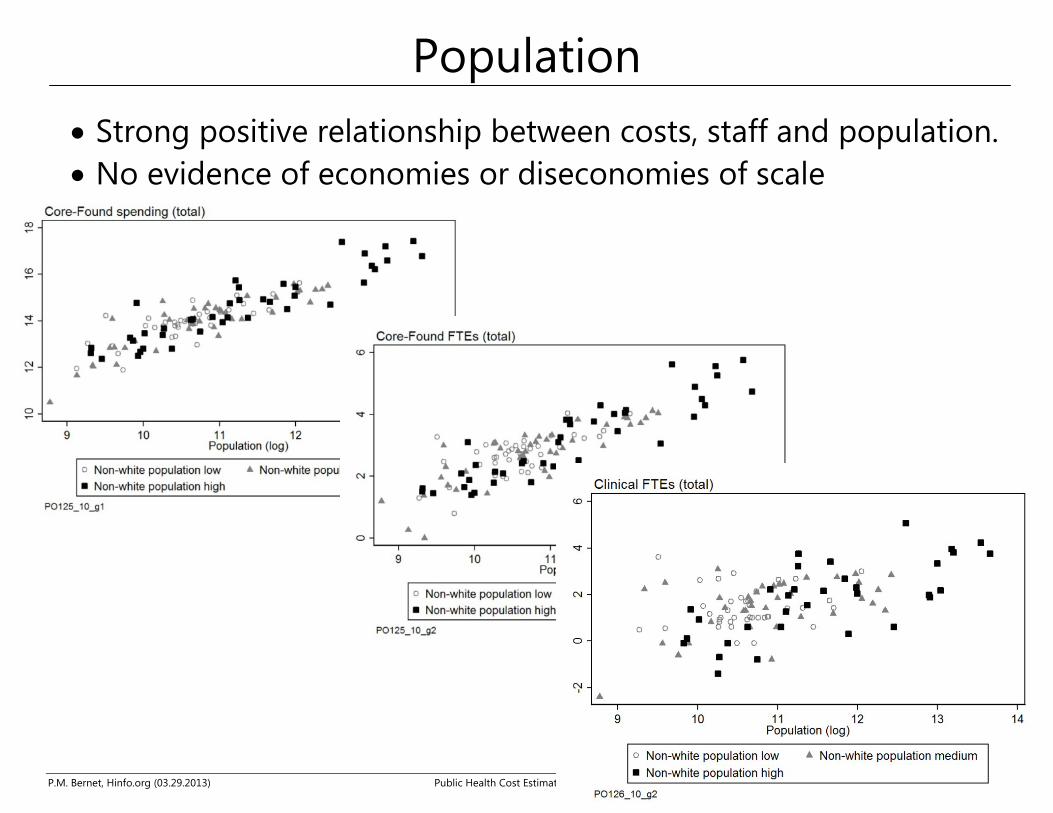
Population
• Strong positive relationship between costs, staff and population. • No evidence of economies or diseconomies of scale

P.M. Bernet, Hinfo.org (03.29.2013) Public Health Cost Estimation Methods. page 14 of 19
Rural
Some LHDs need more staff to care for same

P.M. Bernet, Hinfo.org (03.29.2013) Public Health Cost Estimation Methods. page 15 of 19
Race

P.M. Bernet, Hinfo.org (03.29.2013) Public Health Cost Estimation Methods. page 16 of 19
Language
Most high non-English speaking on lower edge, using fewer resources for same size population

P.M. Bernet, Hinfo.org (03.29.2013) Public Health Cost Estimation Methods. page 17 of 19
Core service coverage
P.M. Bernet, Hinfo.org (03.29.2013) Public Health Cost Estimation Methods. page 18 of 19
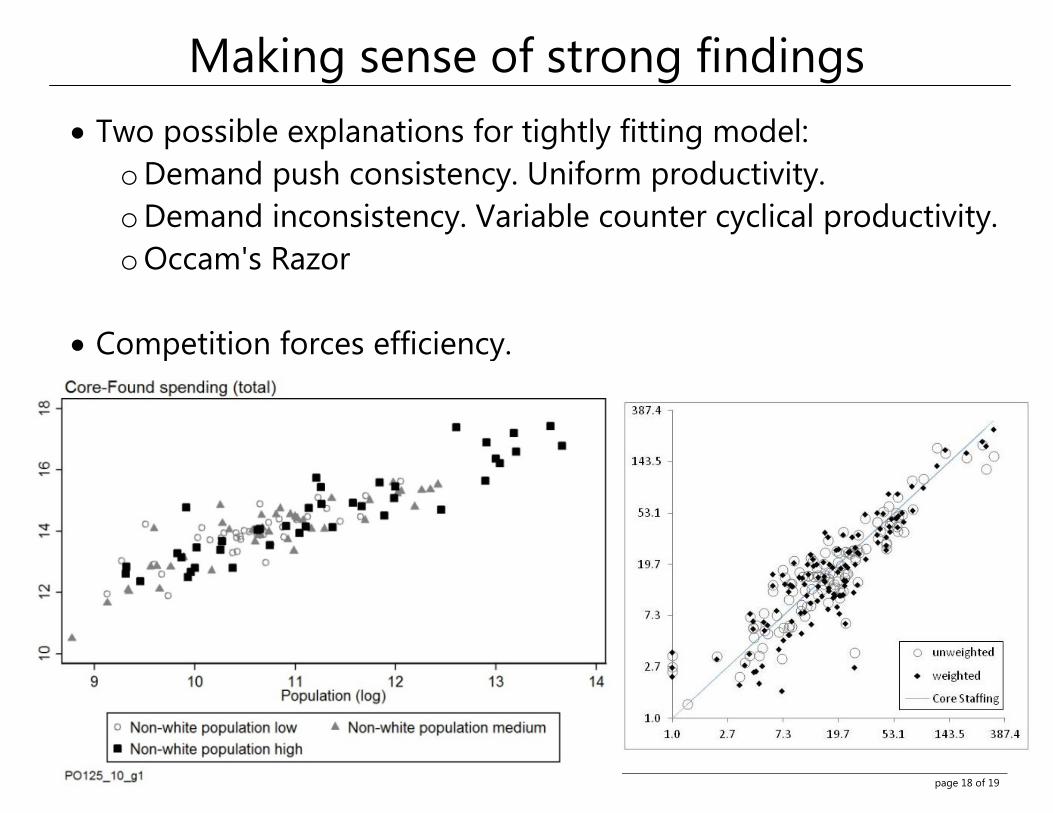
Making sense of strong findings
• Two possible explanations for tightly fitting model: o Demand push consistency. Uniform productivity. o Demand inconsistency. Variable counter cyclical productivity. o Occam's Razor
• Competition forces efficiency.
P.M. Bernet, Hinfo.org (03.29.2013) Public Health Cost Estimation Methods. page 19 of 19
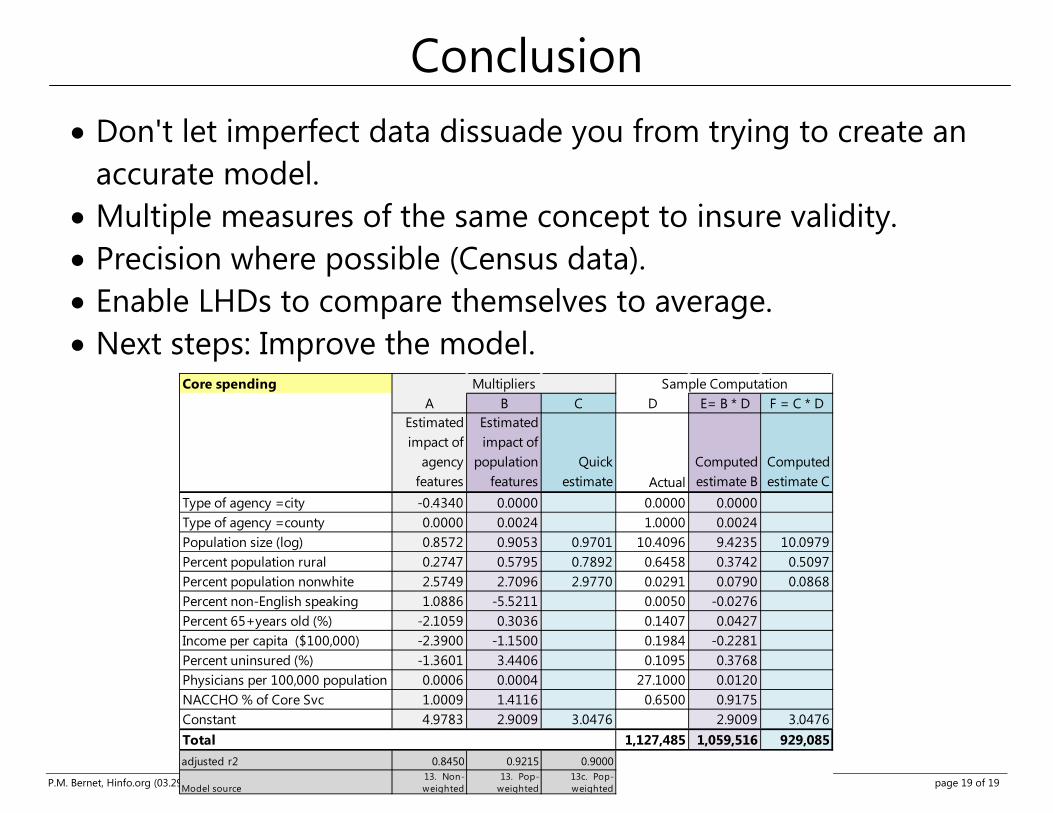
Conclusion
• Don't let imperfect data dissuade you from trying to create an accurate model.
• Multiple measures of the same concept to insure validity. • Precision where possible (Census data). • Enable LHDs to compare themselves to average. • Next steps: Improve the model.
Core spendingA B C D E= B * D F = C * D
Estimated impact of
agency features
Estimated impact of
population features
Quick estimate Actual
Computed estimate B
Computed estimate C
Type of agency =city -0.4340 0.0000 0.0000 0.0000Type of agency =county 0.0000 0.0024 1.0000 0.0024Population size (log) 0.8572 0.9053 0.9701 10.4096 9.4235 10.0979Percent population rural 0.2747 0.5795 0.7892 0.6458 0.3742 0.5097Percent population nonwhite 2.5749 2.7096 2.9770 0.0291 0.0790 0.0868Percent non-English speaking 1.0886 -5.5211 0.0050 -0.0276Percent 65+years old (%) -2.1059 0.3036 0.1407 0.0427Income per capita ($100,000) -2.3900 -1.1500 0.1984 -0.2281Percent uninsured (%) -1.3601 3.4406 0.1095 0.3768Physicians per 100,000 population 0.0006 0.0004 27.1000 0.0120NACCHO % of Core Svc 1.0009 1.4116 0.6500 0.9175Constant 4.9783 2.9009 3.0476 2.9009 3.0476Total 1,127,485 1,059,516 929,085adjusted r2 0.8450 0.9215 0.9000
Model source13. Non-weighted
13. Pop-weighted
13c. Pop-weighted
Multipliers Sample Computation