cost-effective pile design using measured
TRANSCRIPT

Cost-Effective Pile Design Using Measured Set-up for the I-480 Valley View Bridge
Benjamin White, P.E.
GRL Engineers, Inc.

---Table of Contents---
• Existing Bridge information
• Current Project Information
• Design Phase Pile Test Program Details
• Test Program Results
• Production Testing Info
• Depth Variable Criteria Development
• Thoughts on Cost Savings
• Discussion Topics
Only Required for after lunch presentations
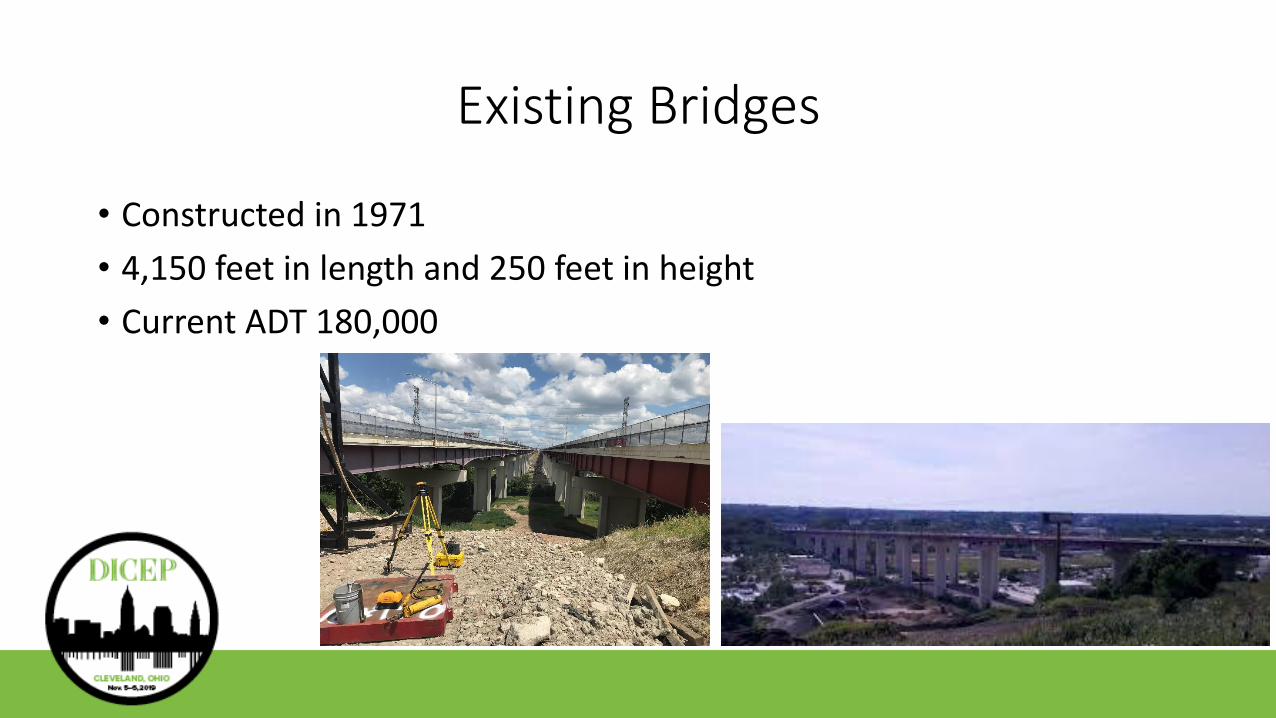
Existing Bridges
• Constructed in 1971
• 4,150 feet in length and 250 feet in height
• Current ADT 180,000
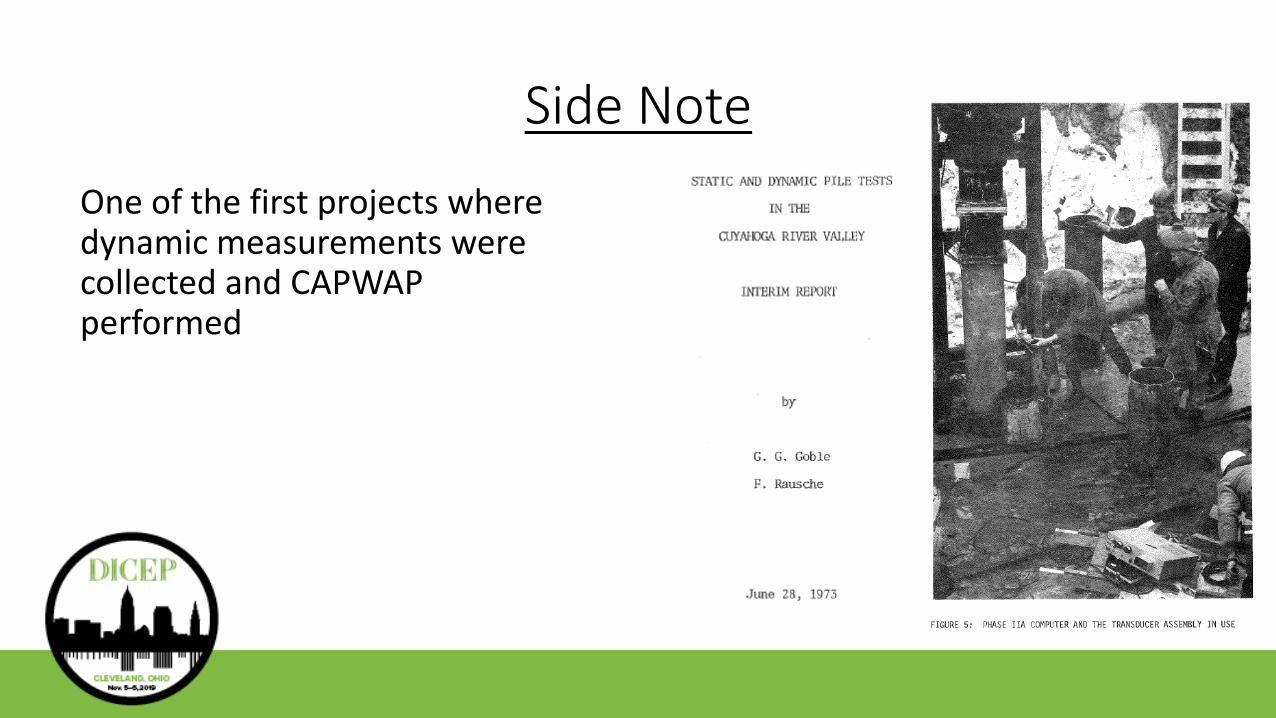
Side Note
One of the first projects where dynamic measurements were collected and CAPWAP performed
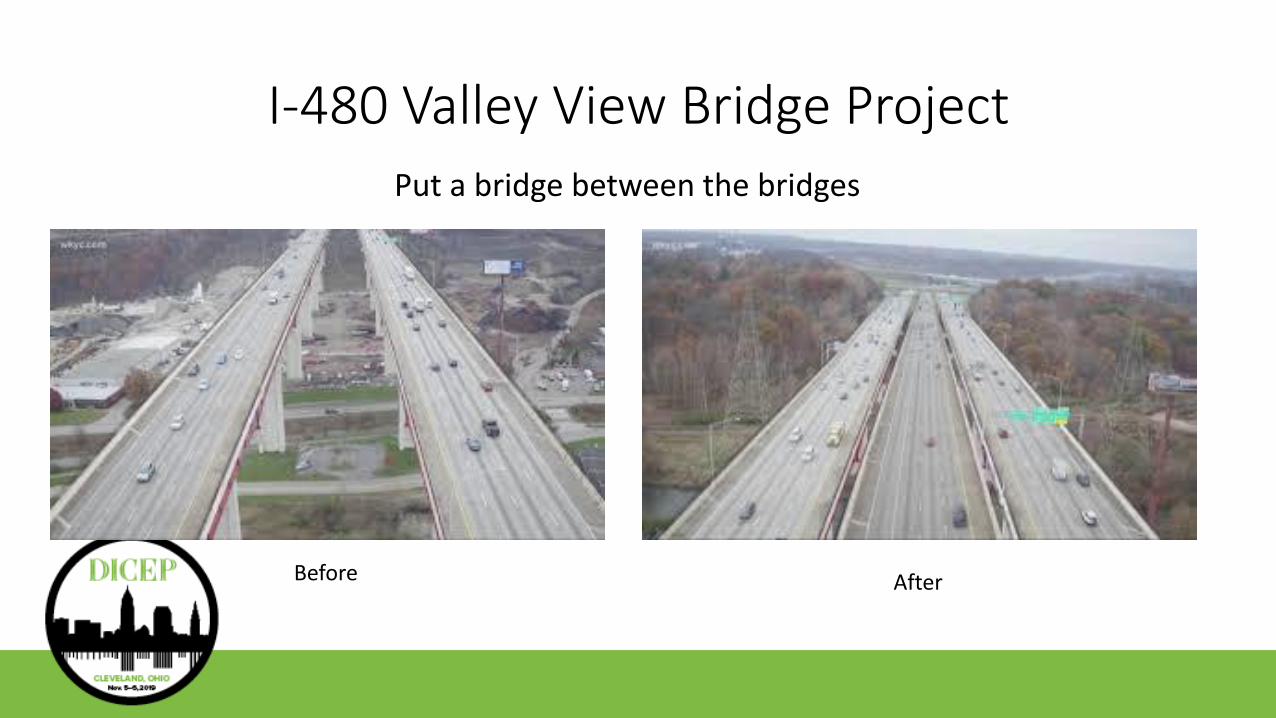
I-480 Valley View Bridge ProjectPut a bridge between the bridges
Before After
Project Information
• Design Build letting awarded to Walsh Construction
• Very early recognized the need for a design phase pile test program
• Piers at set locations to match existing structures
• Foundation selection complicated by site soil conditions
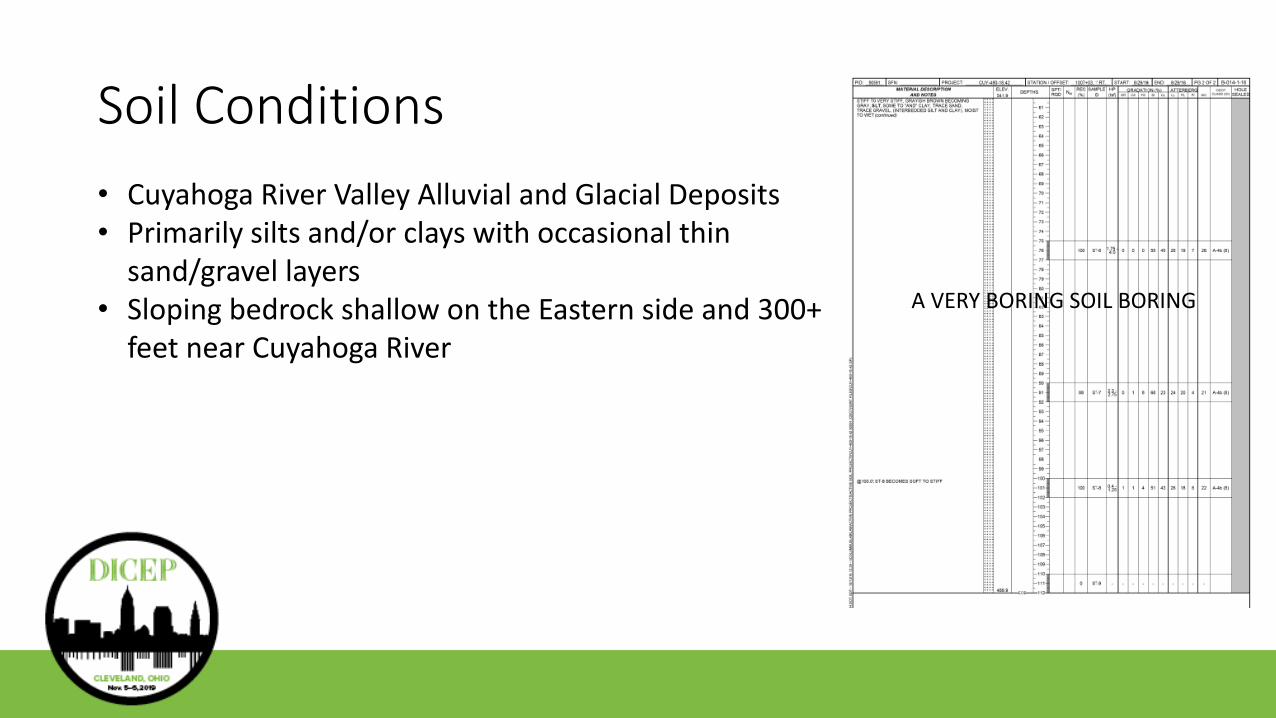
Soil Conditions
• Cuyahoga River Valley Alluvial and Glacial Deposits• Primarily silts and/or clays with occasional thin
sand/gravel layers• Sloping bedrock shallow on the Eastern side and 300+
feet near Cuyahoga River
A VERY BORING SOIL BORING
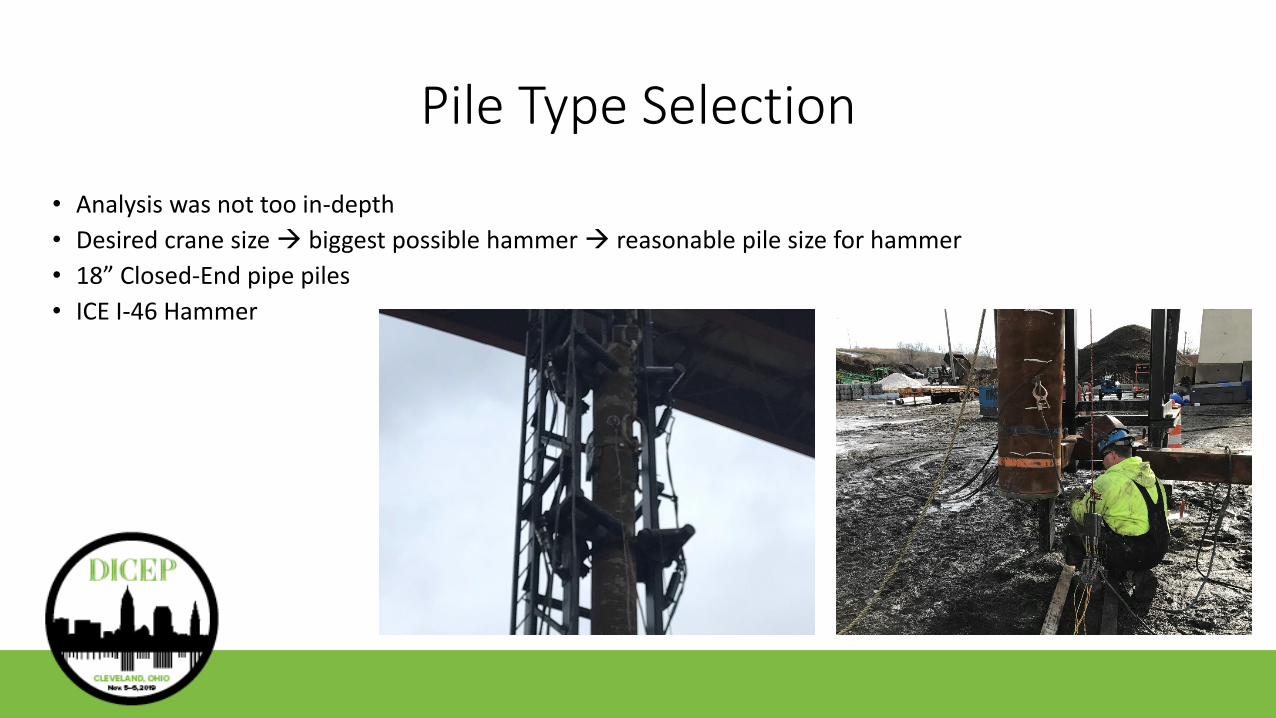
Pile Type Selection
• Analysis was not too in-depth
• Desired crane size → biggest possible hammer → reasonable pile size for hammer
• 18” Closed-End pipe piles
• ICE I-46 Hammer
Design Phase Pile Test Program Goals
• Quantify soil set-up vs. depth through a dynamic testing program at piers 1 through 11. One test pile at each pier (except SLT locations)
• Apply the measured soil set-up to production phase pile testing and create depth dependent driving criteria to optimize pile lengths
• Utilize a resistance factor of 0.8 by performing 3 static load tests, Piers 1, 4, and 9 (results not incorporated into driving criteria directly)
• SLT piers had 5 test piles (reaction piles)
Soil Set-up
• Increase of soil resistance with time
• Disturbed soil remolds around pile
• Pore water pressure dissipates and effective stress of soil against pile increases over time
• Occurs to some degree in almost all soil conditions
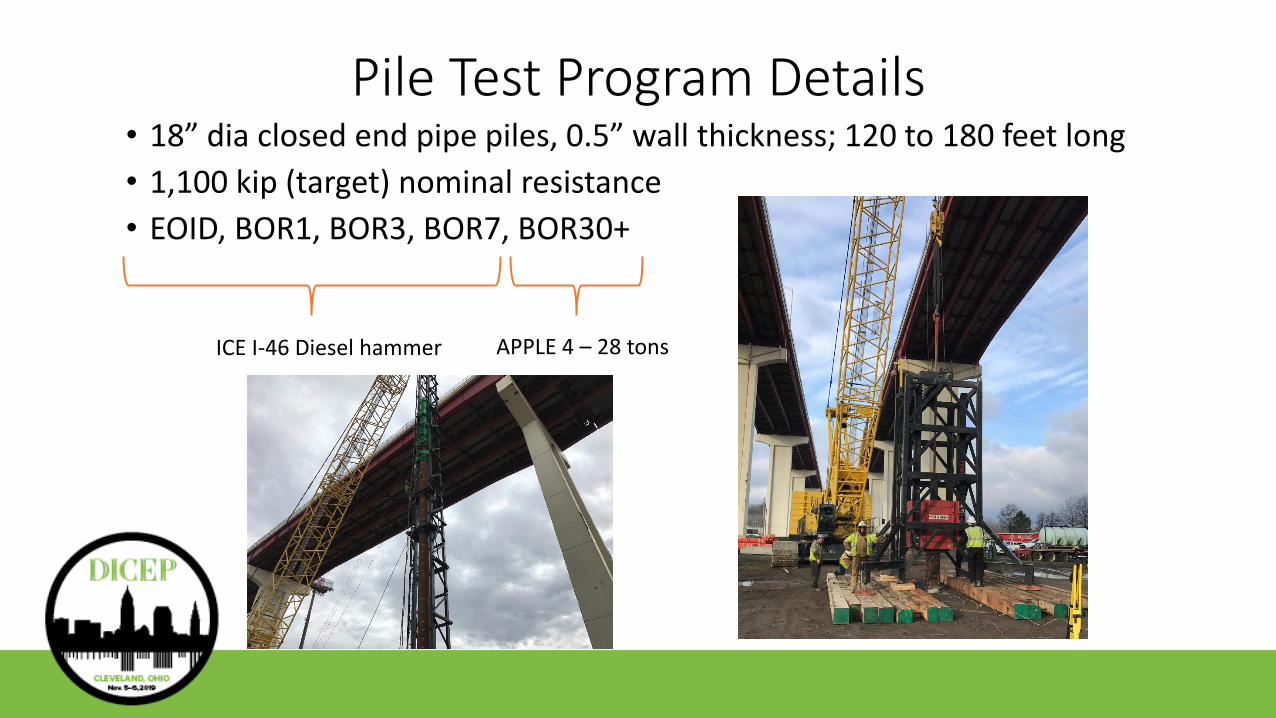
Pile Test Program Details• 18” dia closed end pipe piles, 0.5” wall thickness; 120 to 180 feet long
• 1,100 kip (target) nominal resistance
• EOID, BOR1, BOR3, BOR7, BOR30+
ICE I-46 Diesel hammer APPLE 4 – 28 tons
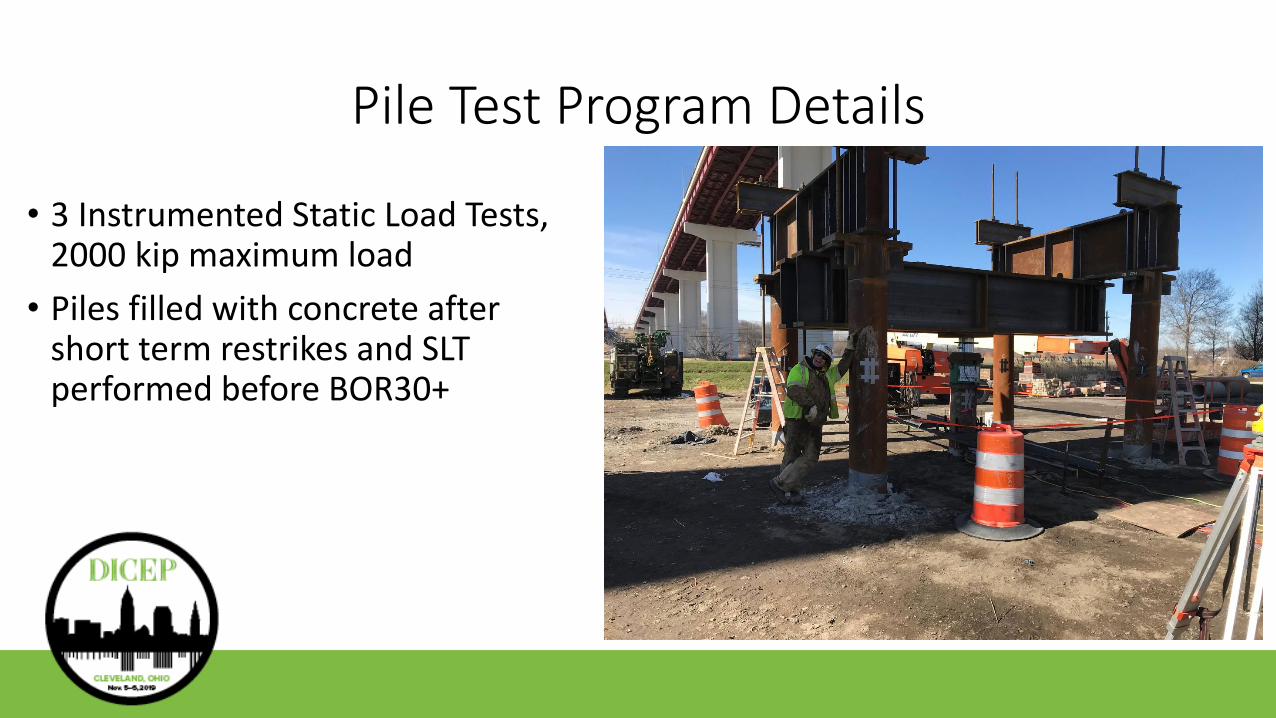
Pile Test Program Details
• 3 Instrumented Static Load Tests, 2000 kip maximum load
• Piles filled with concrete after short term restrikes and SLT performed before BOR30+
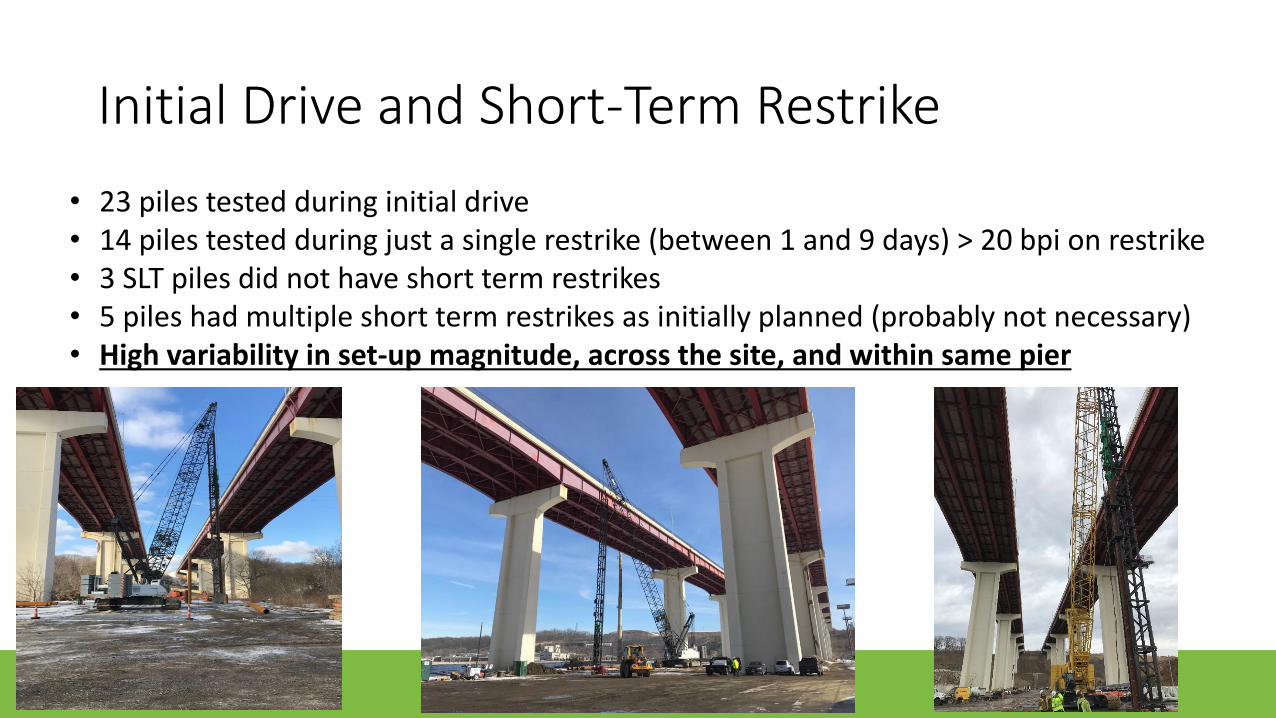
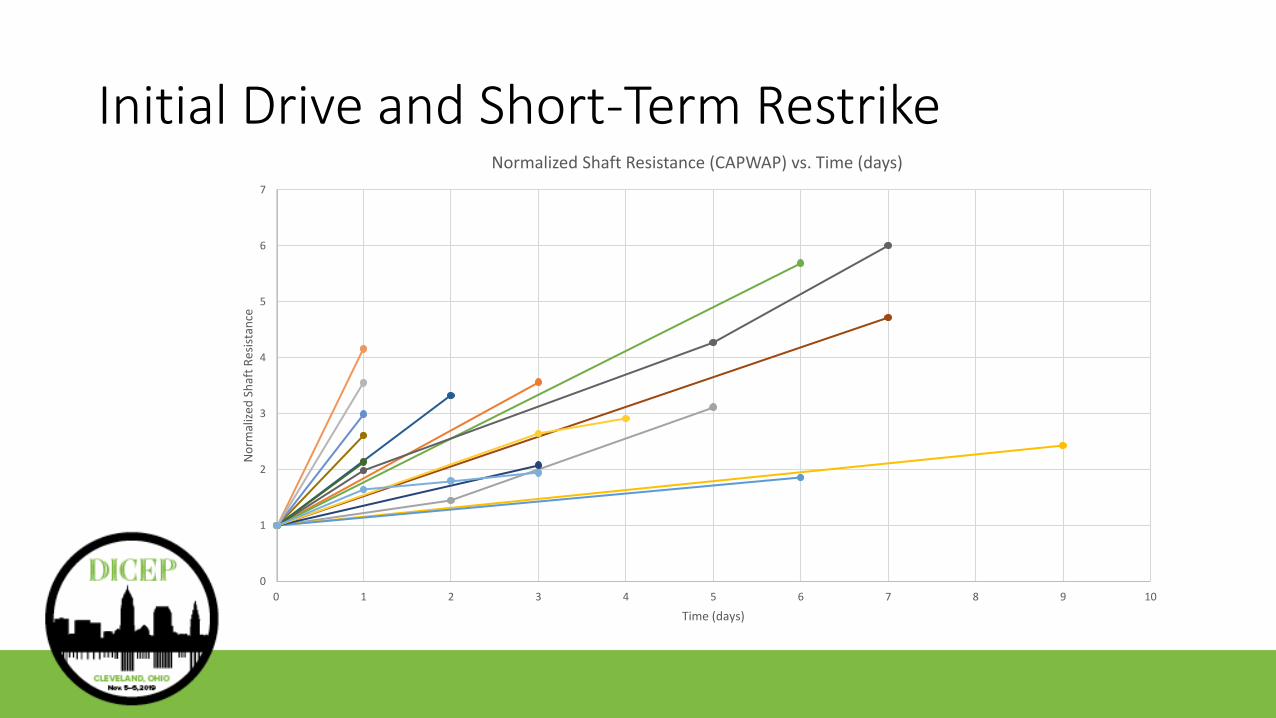
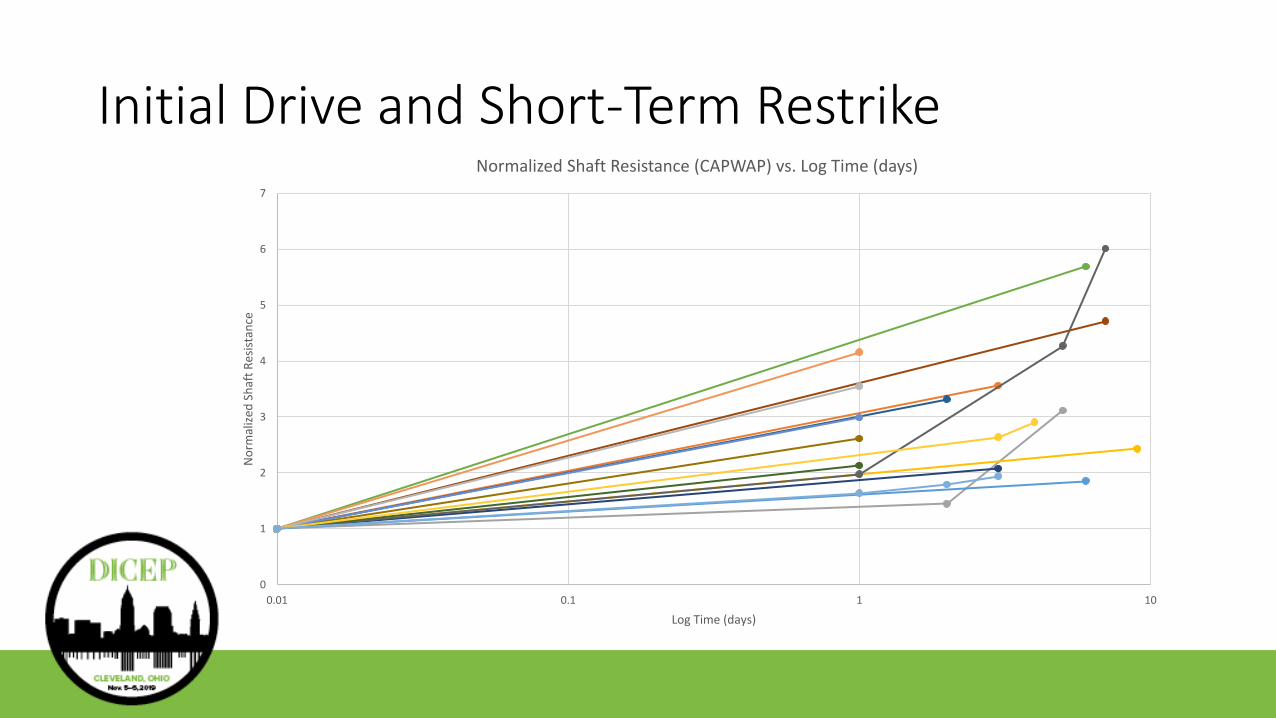
Initial Drive and Short-Term Restrike
• 23 piles tested during initial drive• 14 piles tested during just a single restrike (between 1 and 9 days) > 20 bpi on restrike• 3 SLT piles did not have short term restrikes• 5 piles had multiple short term restrikes as initially planned (probably not necessary)• High variability in set-up magnitude, across the site, and within same pier
Initial Drive and Short-Term Restrike
0
1
2
3
4
5
6
7
0 1 2 3 4 5 6 7 8 9 10
No
rmal
ized
Sh
aft
Res
ista
nce
Time (days)
Normalized Shaft Resistance (CAPWAP) vs. Time (days)
Initial Drive and Short-Term Restrike
0
1
2
3
4
5
6
7
0.01 0.1 1 10
No
rmal
ized
Sh
aft
Res
ista
nce
Log Time (days)
Normalized Shaft Resistance (CAPWAP) vs. Log Time (days)
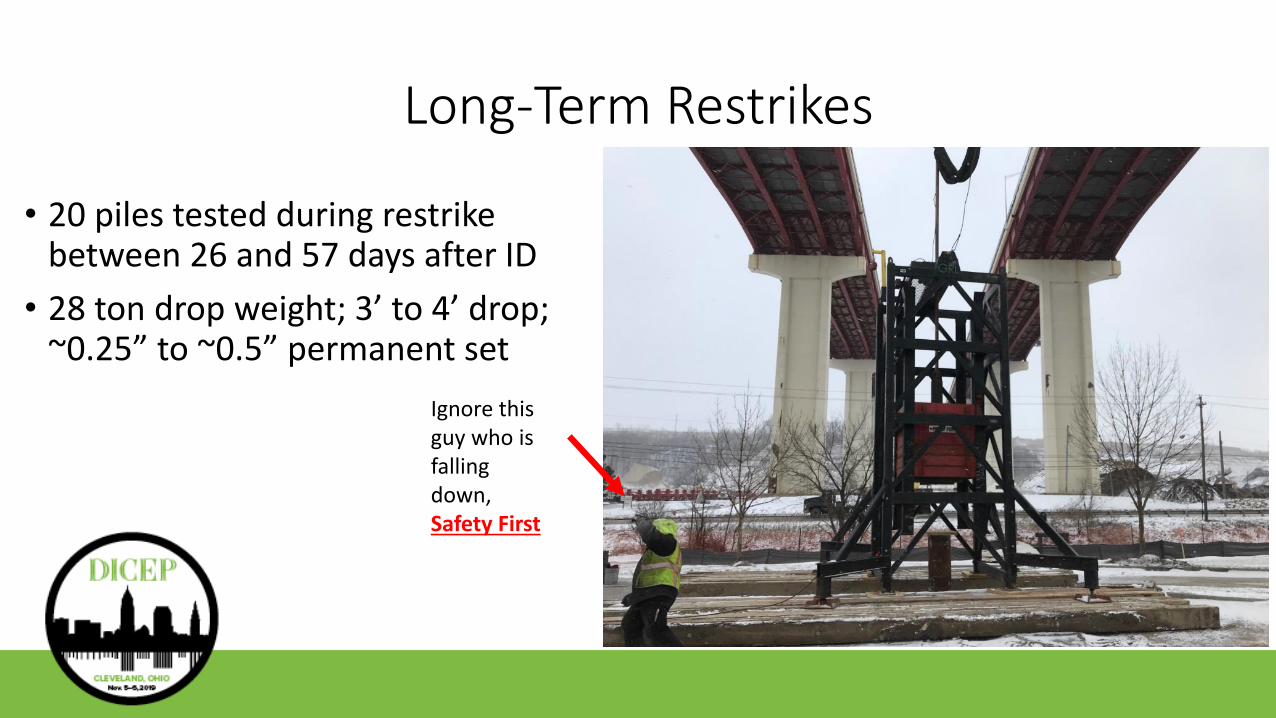
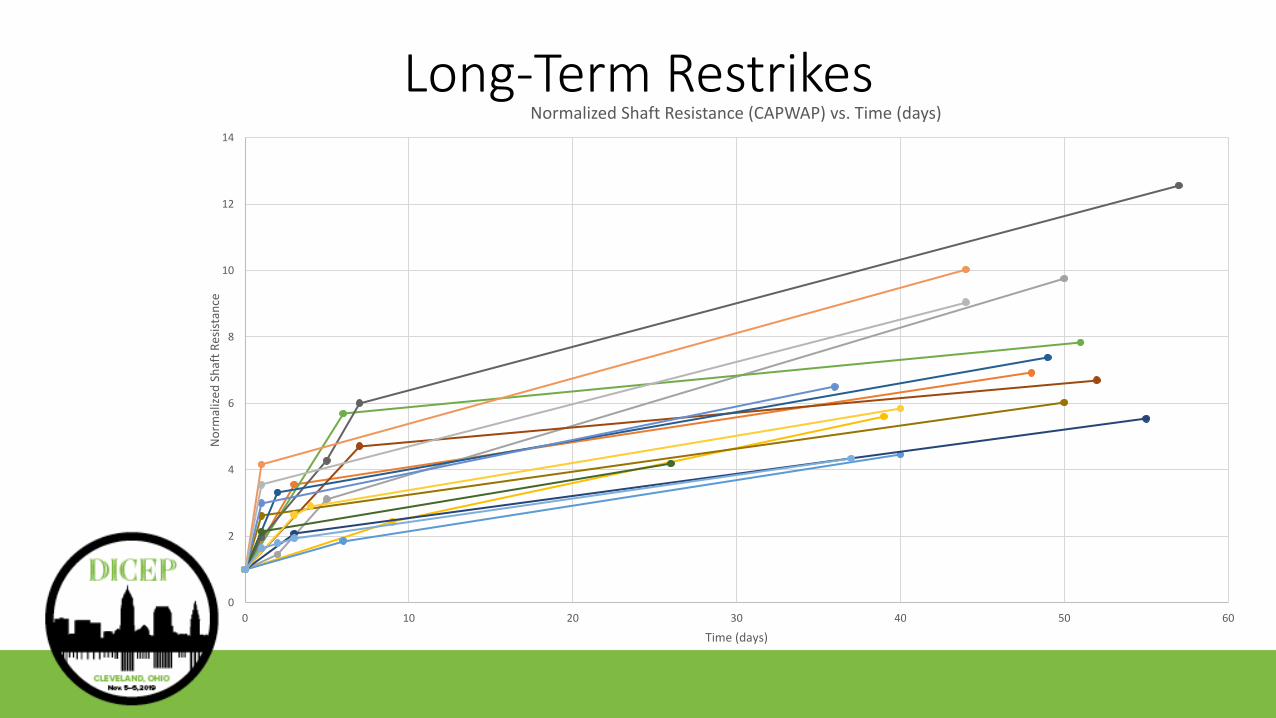
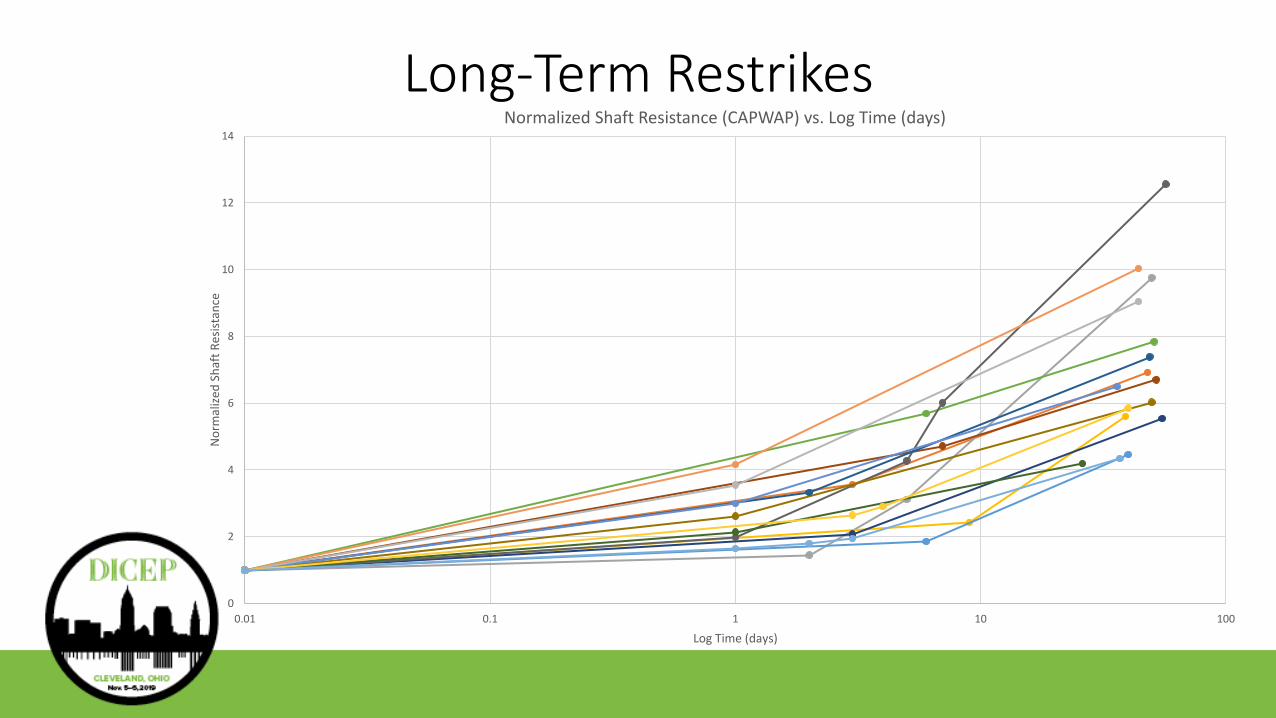
Long-Term Restrikes
• 20 piles tested during restrike between 26 and 57 days after ID
• 28 ton drop weight; 3’ to 4’ drop; ~0.25” to ~0.5” permanent set
Ignore this guy who is falling down, Safety First

Long-Term Restrikes
0
2
4
6
8
10
12
14
0 10 20 30 40 50 60
No
rmal
ized
Sh
aft
Res
ista
nce
Time (days)
Normalized Shaft Resistance (CAPWAP) vs. Time (days)
Long-Term Restrikes
0
2
4
6
8
10
12
14
0.01 0.1 1 10 100
No
rmal
ized
Sh
aft
Res
ista
nce
Log Time (days)
Normalized Shaft Resistance (CAPWAP) vs. Log Time (days)
0
200
400
600
800
1000
1200
1400
1600
1800
WA P1 P2 P3 P4 P5 P6 P7 P8 P9 P10 P11
kip
s
EOID Restrike
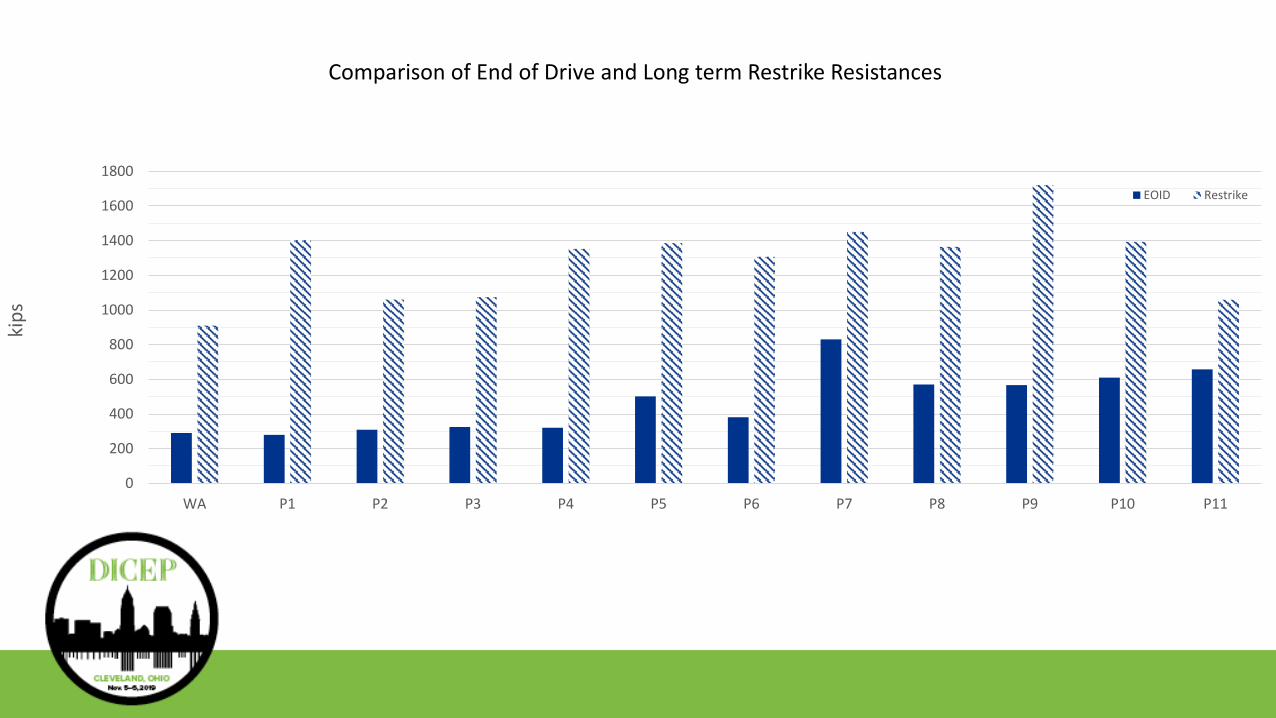
Comparison of End of Drive and Long term Restrike Resistances
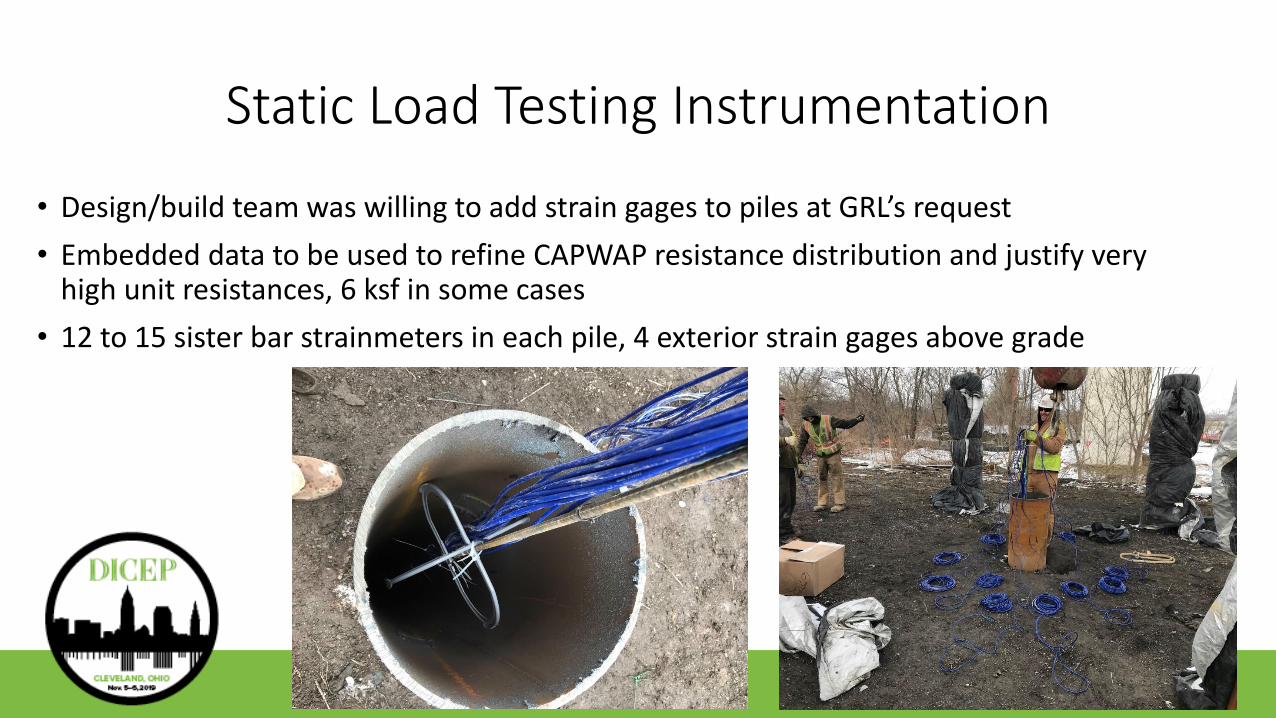
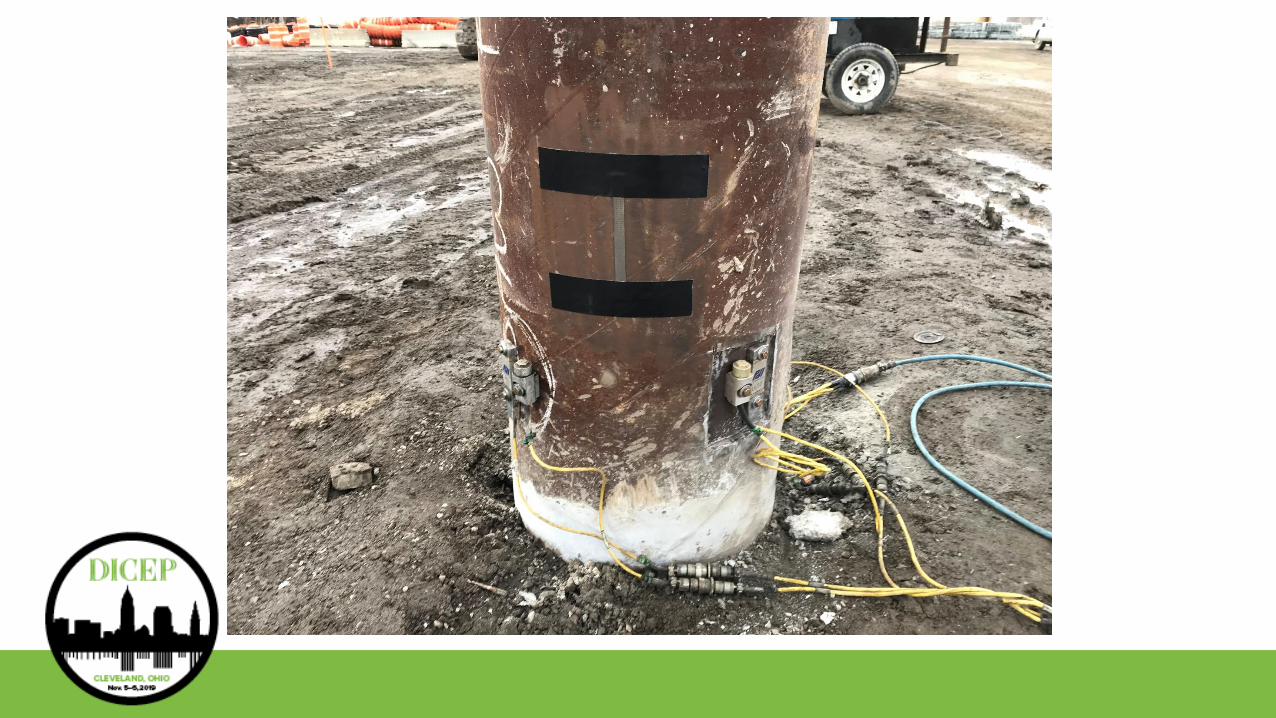
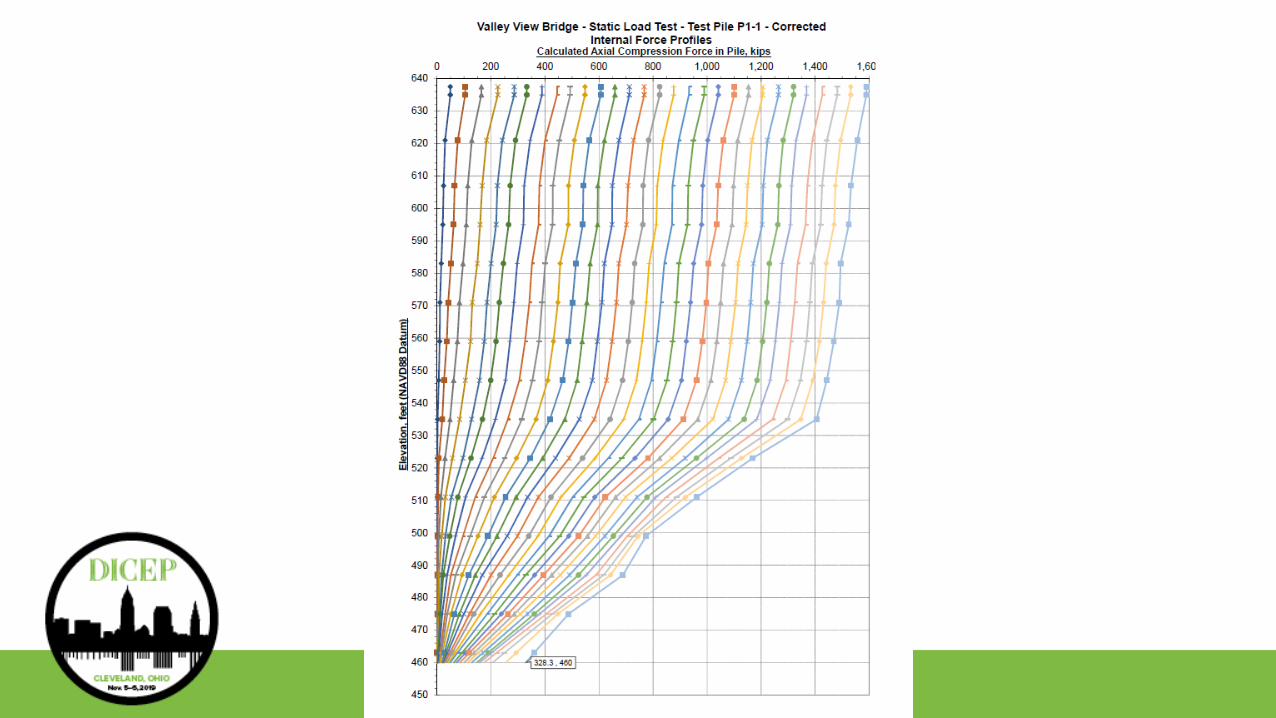
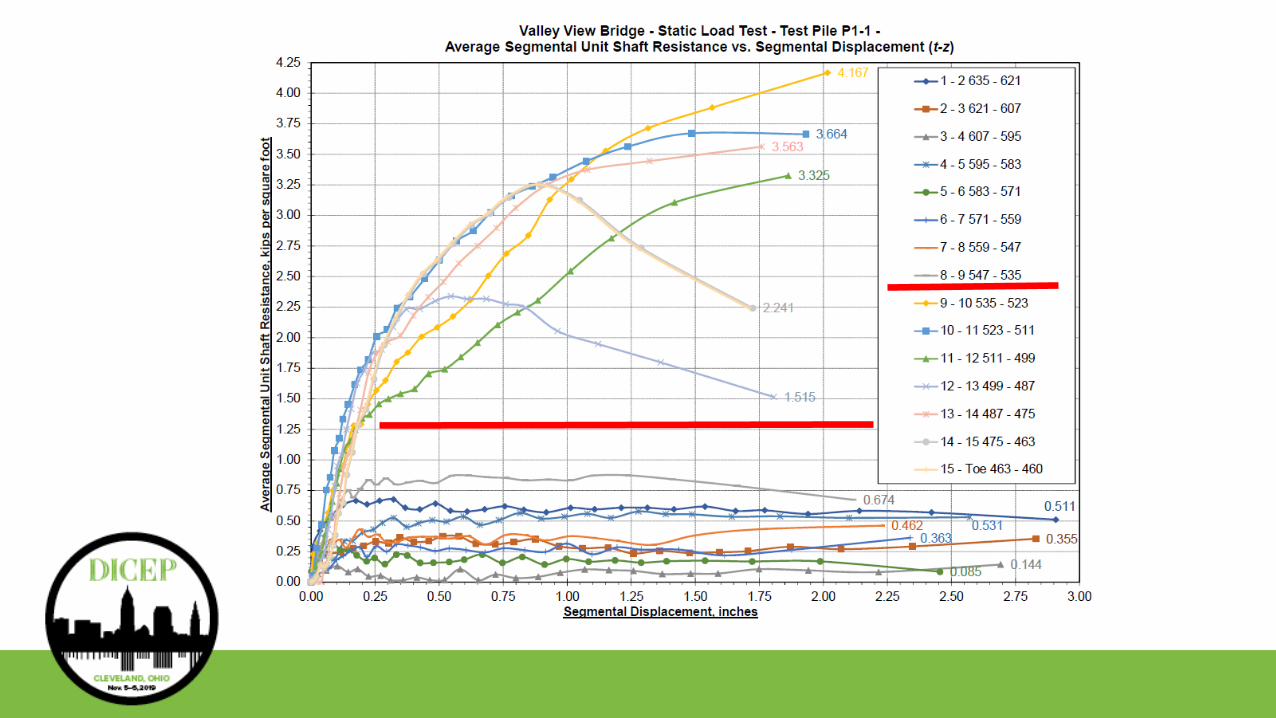
Static Load Testing Instrumentation
• Design/build team was willing to add strain gages to piles at GRL’s request
• Embedded data to be used to refine CAPWAP resistance distribution and justify very high unit resistances, 6 ksf in some cases
• 12 to 15 sister bar strainmeters in each pile, 4 exterior strain gages above grade
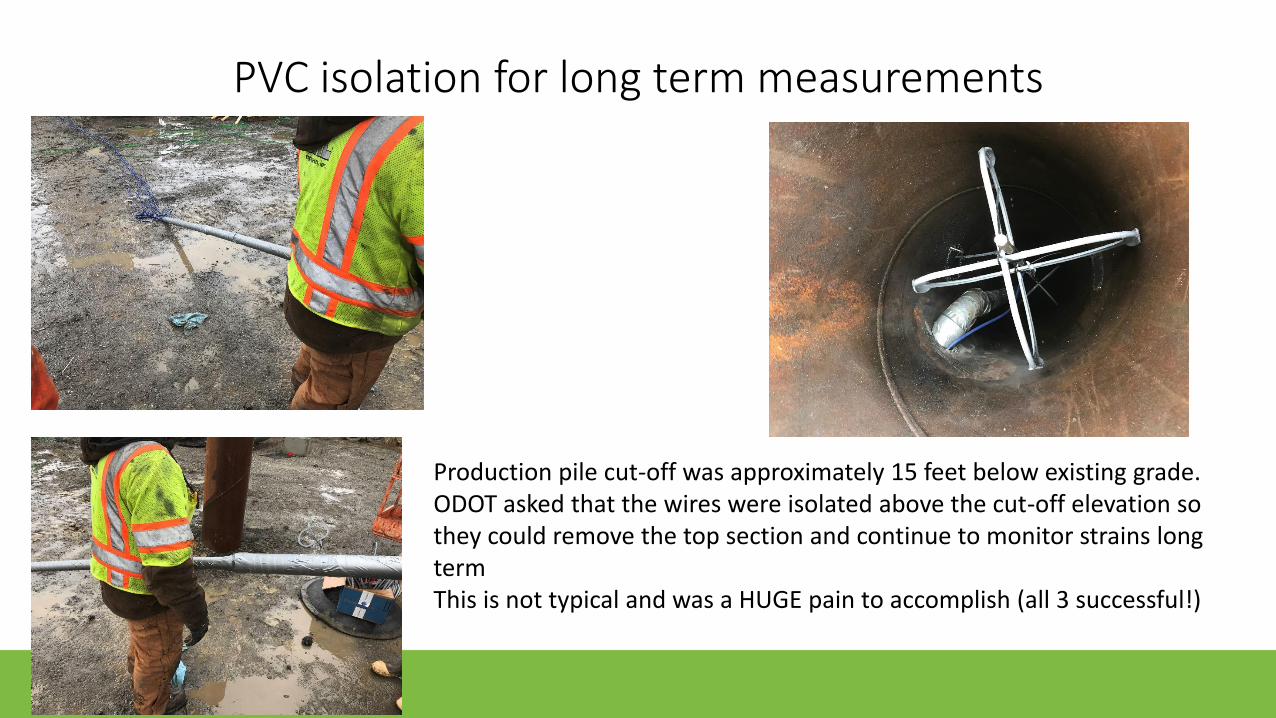
PVC isolation for long term measurements
Production pile cut-off was approximately 15 feet below existing grade.ODOT asked that the wires were isolated above the cut-off elevation so they could remove the top section and continue to monitor strains long termThis is not typical and was a HUGE pain to accomplish (all 3 successful!)
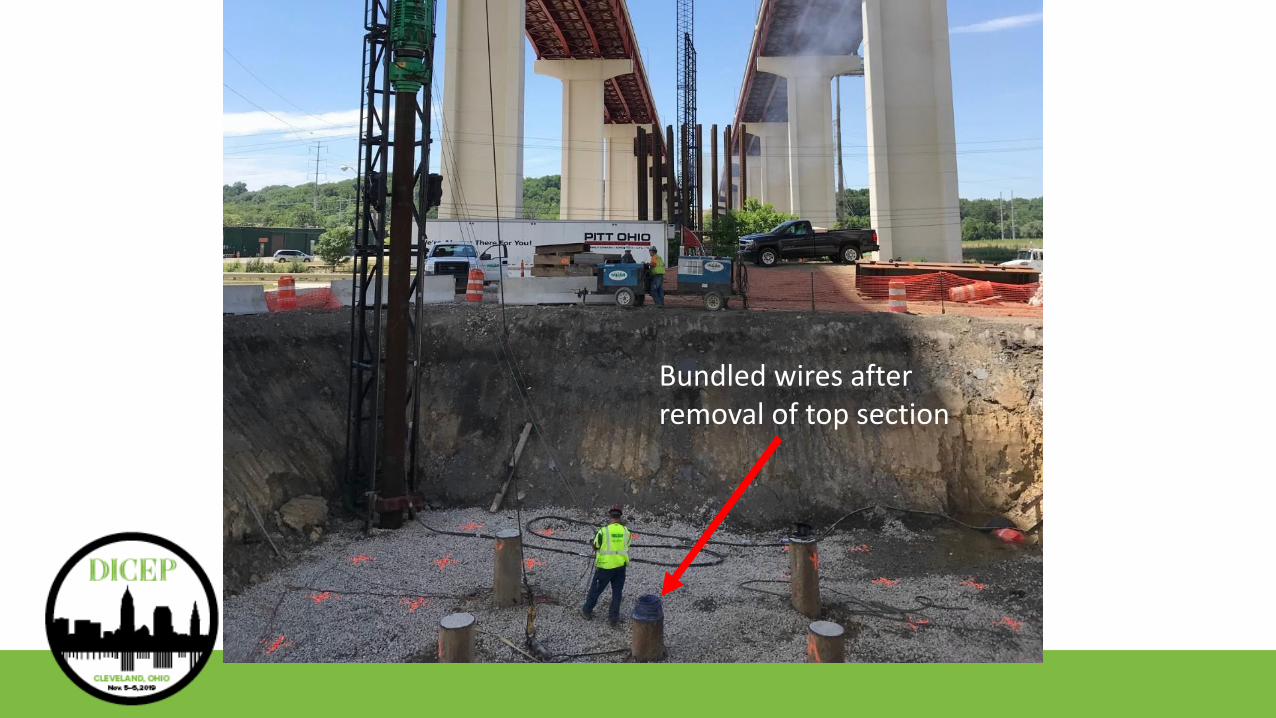
Bundled wires after removal of top section


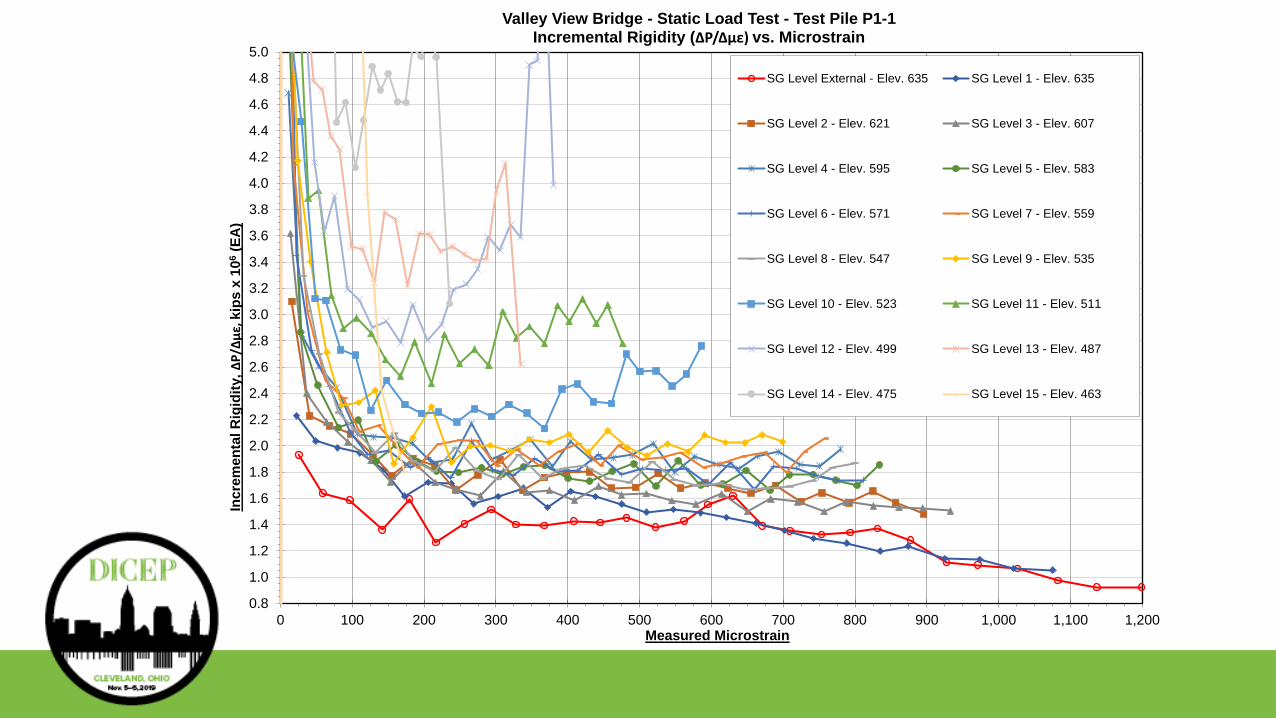
Force = ƐEA
Ɛ – Strain – is measured
A – Area – is known
E – is composite elastic modulus
0.8
1.0
1.2
1.4
1.6
1.8
2.0
2.2
2.4
2.6
2.8
3.0
3.2
3.4
3.6
3.8
4.0
4.2
4.4
4.6
4.8
5.0
0 100 200 300 400 500 600 700 800 900 1,000 1,100 1,200
Incre
men
tal
Rig
idit
y, Δ
P/Δ
µε,
kip
s x
10
6(E
A)
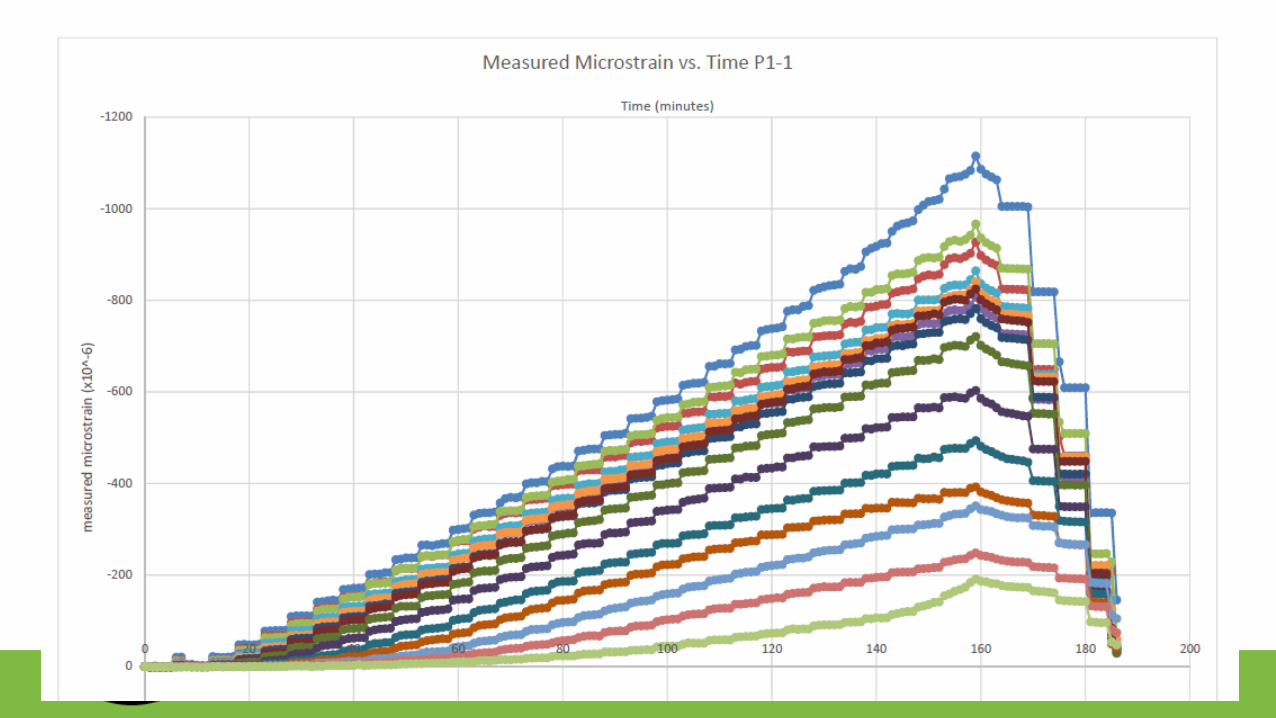
Measured Microstrain
Valley View Bridge - Static Load Test - Test Pile P1-1 Incremental Rigidity (ΔP/Δµε) vs. Microstrain
SG Level External - Elev. 635 SG Level 1 - Elev. 635
SG Level 2 - Elev. 621 SG Level 3 - Elev. 607
SG Level 4 - Elev. 595 SG Level 5 - Elev. 583
SG Level 6 - Elev. 571 SG Level 7 - Elev. 559
SG Level 8 - Elev. 547 SG Level 9 - Elev. 535
SG Level 10 - Elev. 523 SG Level 11 - Elev. 511
SG Level 12 - Elev. 499 SG Level 13 - Elev. 487
SG Level 14 - Elev. 475 SG Level 15 - Elev. 463
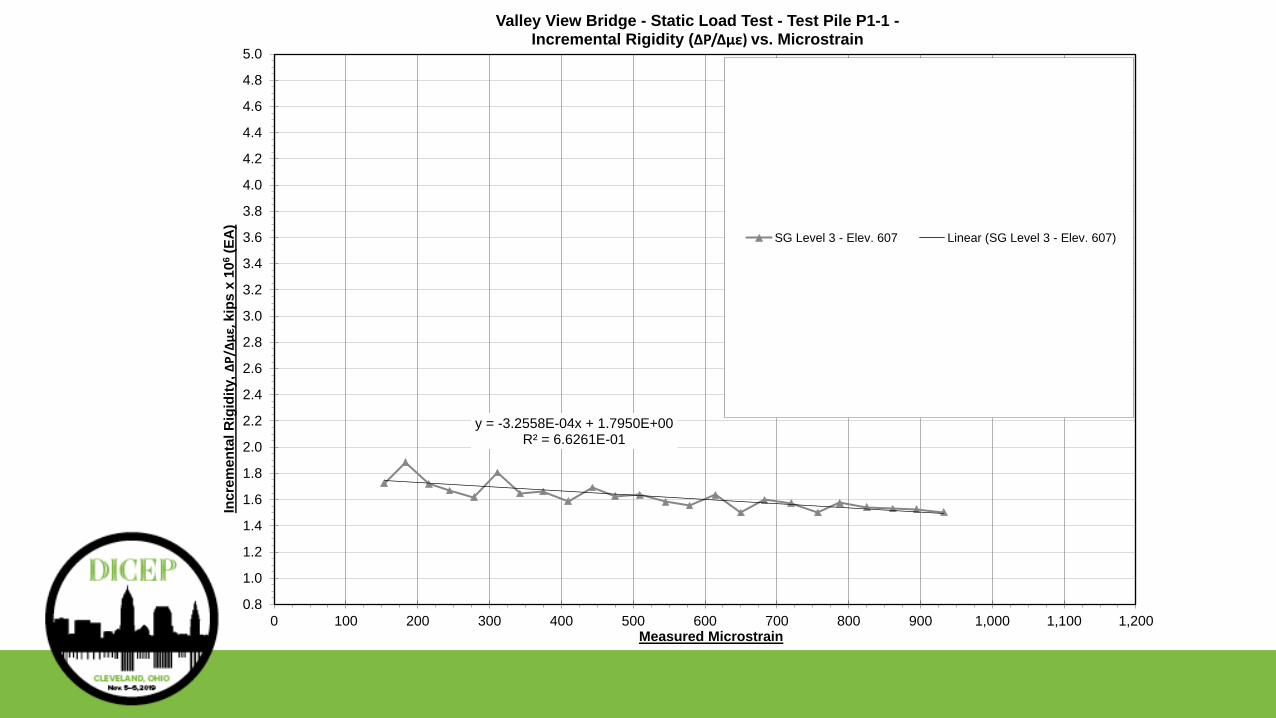
y = -3.2558E-04x + 1.7950E+00R² = 6.6261E-01
0.8
1.0
1.2
1.4
1.6
1.8
2.0
2.2
2.4
2.6
2.8
3.0
3.2
3.4
3.6
3.8
4.0
4.2
4.4
4.6
4.8
5.0
0 100 200 300 400 500 600 700 800 900 1,000 1,100 1,200
Incre
men
tal
Rig
idit
y, Δ
P/Δ
µε,
kip
s x
10
6(E
A)
Measured Microstrain
Valley View Bridge - Static Load Test - Test Pile P1-1 -Incremental Rigidity (ΔP/Δµε) vs. Microstrain
SG Level 3 - Elev. 607 Linear (SG Level 3 - Elev. 607)

0.0
0.1
0.2
0.3
0.4
0.5
0.6
0.7
0.8
0.9
1.0
1.1
1.2
1.3
1.4
1.5
1.6
1.7
1.8
1.9
2.0
2.1
2.2
2.3
2.4
2.5
2.6
2.7
2.8
2.9
3.0
3.1
0 100 200 300 400 500 600 700 800 900 1000 1100 1200 1300 1400 1500 1600 1700
Dis
pla
cem
ent
(in
ches
)
Applied Load (Kips)
Static Load Test Results - P1-1
Elastic Compression Davisson Failure Line Load-Displacement Curve

SLT – PDA Comparison
Pile SLT (Davisson) CAPWAP
P1-1 1,450 kips 1,495 kips
P4-1 940 kips 945 kips
P9-1 1,870+ kips (no failure) 2,081+ kips (0.05” set)
NOT TOO BAD!
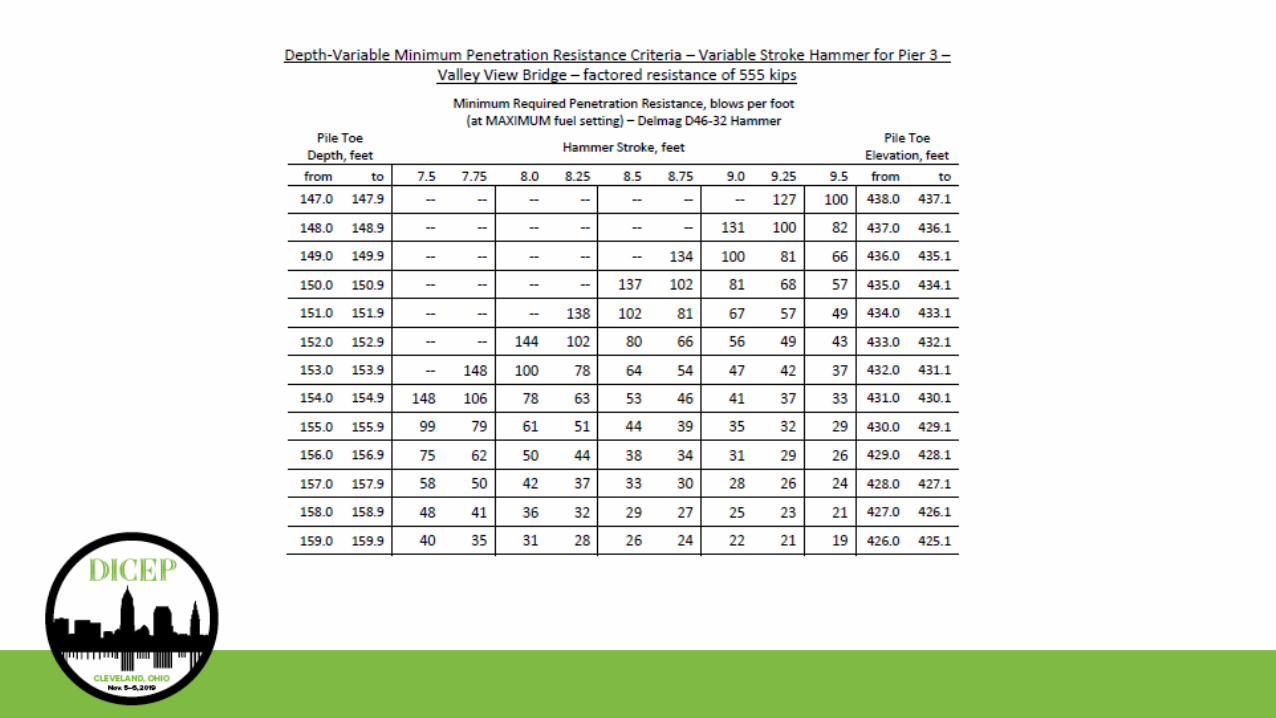
Depth Variable Driving Criteria
• Implemented based on test program results as well as production pile testing
• ɸ=0.8 for resistance measured at EOID
• ɸ=0.55 or 0.6 as negotiated by ODOT
420
440
460
480
500
520
540
560
580
600
0 100 200 300 400 500 600 700 800 900
Ele
vati
on
, ft
Shaft Resistance, kip
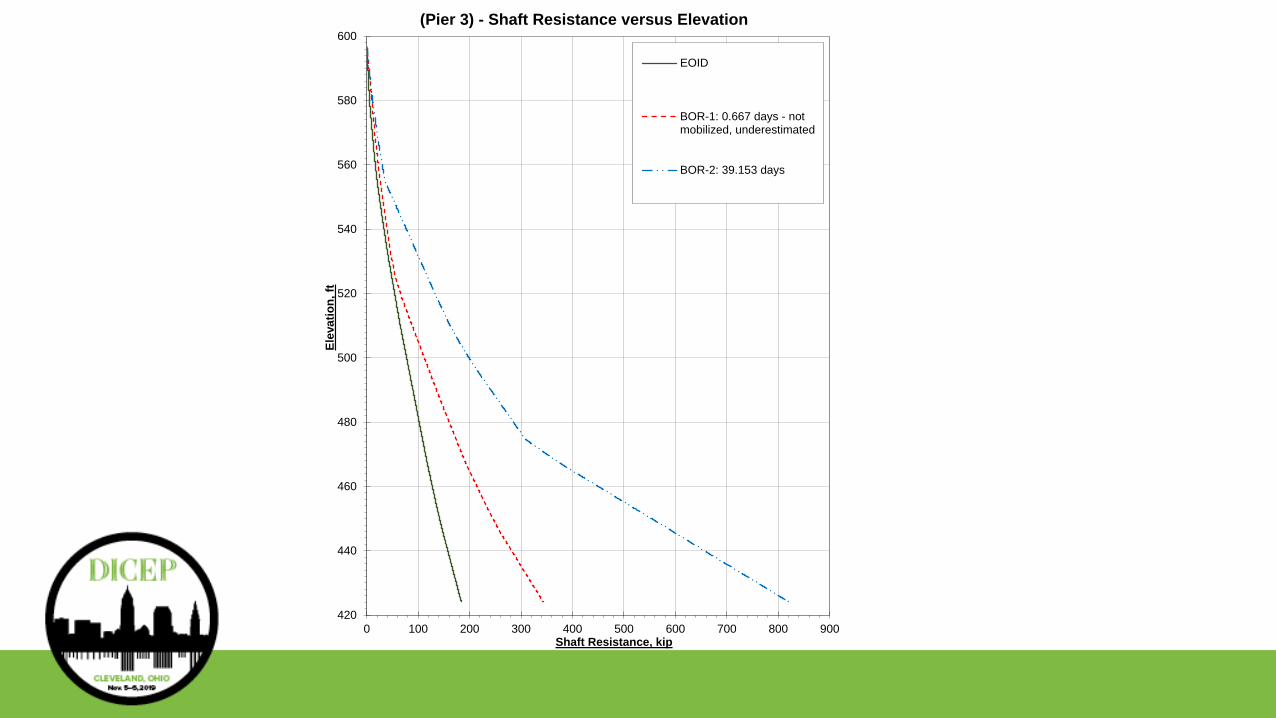
(Pier 3) - Shaft Resistance versus Elevation
EOID
BOR-1: 0.667 days - notmobilized, underestimated
BOR-2: 39.153 days
420
440
460
480
500
520
540
560
580
600
0 100 200 300 400 500 600 700
Ele
vati
on
, ft
Capacity, kip
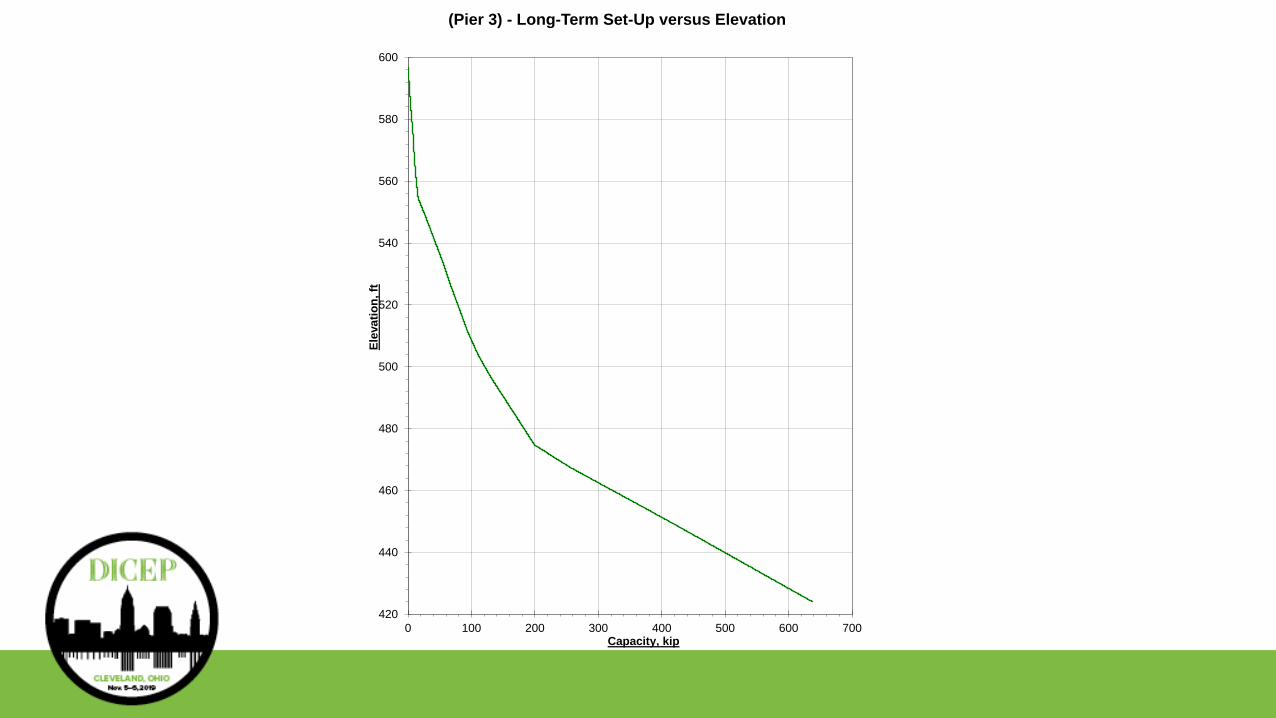
(Pier 3) - Long-Term Set-Up versus Elevation
420
440
460
480
500
520
540
560
580
600
0 100 200 300 400 500 600 700
Ele
vati
on
, ft
Factored Resistance, kips
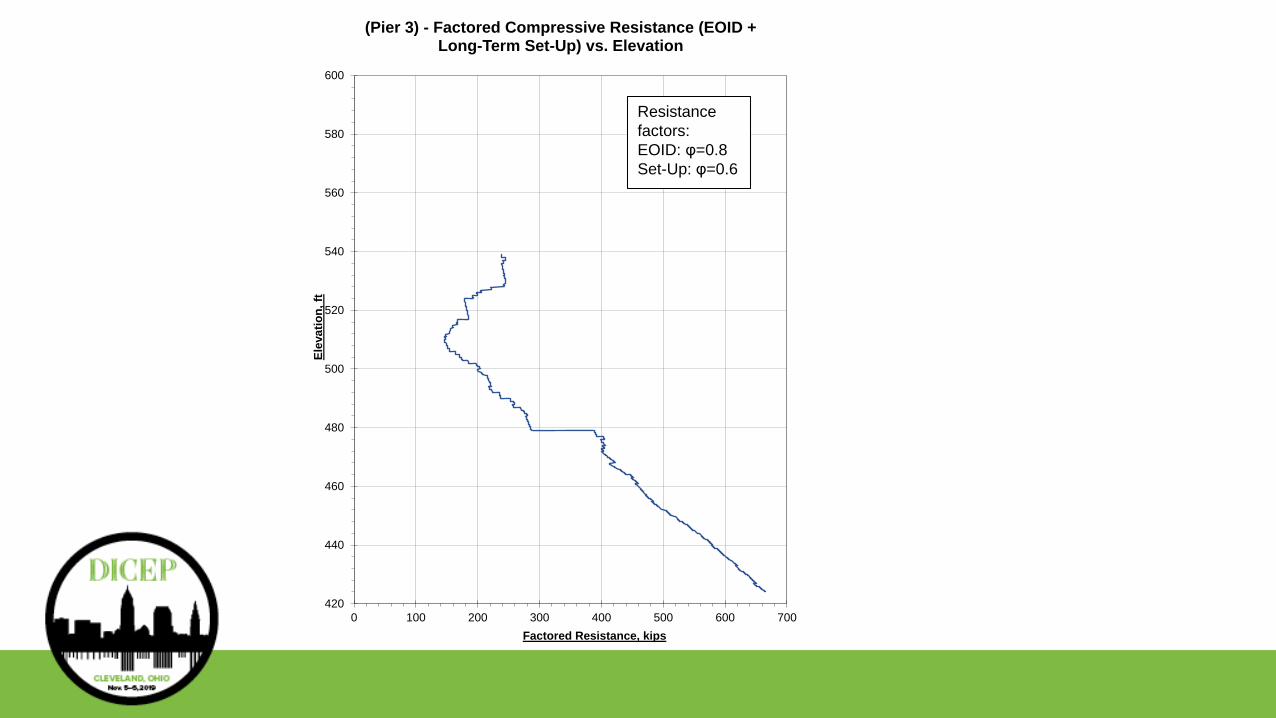
(Pier 3) - Factored Compressive Resistance (EOID + Long-Term Set-Up) vs. Elevation
Resistance
factors:
EOID: φ=0.8
Set-Up: φ=0.6

420
440
460
480
500
520
540
560
580
600
0 100 200 300 400 500 600 700
Pil
e T
oe E
levati
on
, ft
Resistance, kips
Figure __ (Pier 3) - Required EOID Resistance vs. Pile Toe Elevation
Theoretical curve based on designsetup values
P3-17
P3-1
Target factored capacity is 555 kips.
Plot assumes following resistance
factors:
EOID: φ=0.8
Set-Up: φ=0.6
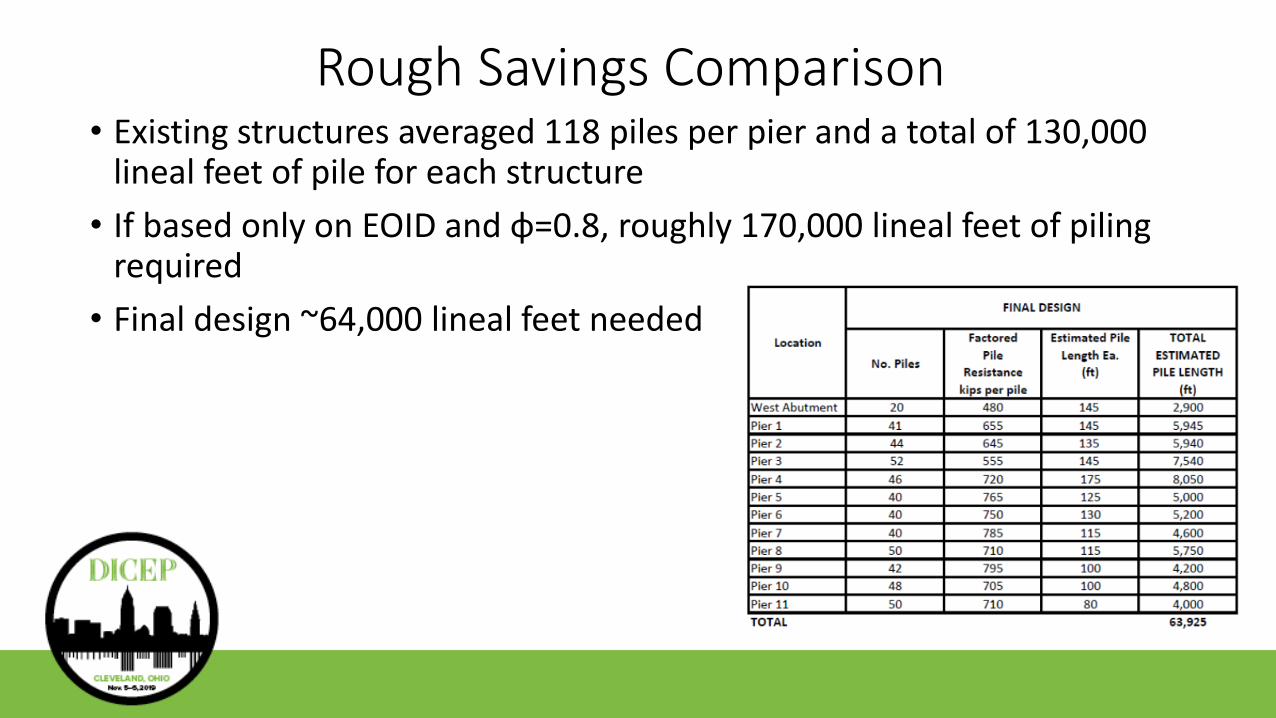
Rough Savings Comparison• Existing structures averaged 118 piles per pier and a total of 130,000
lineal feet of pile for each structure
• If based only on EOID and ɸ=0.8, roughly 170,000 lineal feet of piling required
• Final design ~64,000 lineal feet needed

Advantages of Design Phase Test Program
• Once production begins, long term restrike values already realized, no delays, piling well ahead of subsequent operations
• Pile lengths are refined for ordering
• Equipment can be adjusted to optimize production
• Risk and unknowns are minimized
Drawbacks of Design-Phase Test Program
• Project schedule must allow for test program
• Physical location of test program may not be representative
• $$$
• Time
Pile Nerd Discussion Topics…
• Soil Set-up Resistance Factors
• Soil set-up mechanisms, how does installation affect results?
• Is adding instrumentation to SLT worth it? Analysis methods?
• Reliance on CAPWAP analysis results
Final Thought:Always take a close look at your foundations
Thank You