cost-benefit analysis of implementing the 2011 national ... · pdf filecost-benefit analysis...
TRANSCRIPT
Cost-Benefit Analysis of
Implementing the 2011
National Energy Code for
Buildings in Newfoundland
and Labrador
Prepared for:
Office of Climate Change and
Energy Efficiency
Executive Council, Government
of Newfoundland & Labrador
St John’s, Newfoundland and
Labrador, A1B 4J6
Prepared by:
Stantec Consulting Ltd
102-40 Highfield Park Drive
Dartmouth, NS, B3A 0A3
134231089
February, 2014

COST-BENEFIT ANALYSIS OF IMPLEMENTING THE 2011 NATIONAL ENERGY CODE FOR
BUILDINGS IN NEWFOUNDLAND AND LABRADOR
i
Table of Contents
EXECUTIVE SUMMARY ............................................................................................................... I
ABBREVIATIONS ......................................................................................................................... I
1.0 INTRODUCTION ...........................................................................................................1.1
1.1 BACKGROUND ............................................................................................................... 1.1
1.2 OBJECTIVES OF PROJECT .............................................................................................. 1.1
1.3 REPORT STRUCTURE ........................................................................................................ 1.2
2.0 CONTEXT .....................................................................................................................2.1
2.1 NATIONAL MODEL CONSTRUCTION CODES............................................................... 2.1
2.2 PROVINCIAL AND TERRITORIAL REGULATOR AND POLICY FRAMEWORKS ............. 2.1
2.2.1 Comparison of ASHRAE 90.1 and the NECB ............................................ 2.3
2.3 NEWFOUNDLAND AND LABRADOR SITUATION OVERVIEW ...................................... 2.4
2.4 TRENDS AND OPPORTUNITIES ........................................................................................ 2.5
2.4.1 Current Building Practices in Newfoundland and Labrador ................. 2.5
2.4.2 Build Better Buildings Policy in Newfoundland and Labrador ............... 2.5
2.4.3 Advantages of Adopting an Energy Code ............................................. 2.8
3.0 NECB OVERVIEW .........................................................................................................3.1
3.1 CODE COMPLIANCE ..................................................................................................... 3.4
4.0 METHODOLOGY ..........................................................................................................4.1
4.1 APPROACH ..................................................................................................................... 4.1
4.2 CHOOSING STUDY BUILDINGS ...................................................................................... 4.1
4.3 DATA COLLECTION ........................................................................................................ 4.2
4.4 ENERGY MODELING ....................................................................................................... 4.2
4.4.1 EE4 .................................................................................................................. 4.3
4.4.2 eQUEST .......................................................................................................... 4.3
4.4.3 NECB Energy Models ................................................................................... 4.3
4.4.4 Building Envelope ........................................................................................ 4.5
4.4.5 Mechanical Systems ................................................................................... 4.6
4.4.6 Lighting .......................................................................................................... 4.6
4.5 FINANCIAL IMPACT OF CODE ADOPTION .................................................................. 4.6
4.5.1 Baseline Costs............................................................................................... 4.6
4.5.2 NECB Costs ................................................................................................... 4.6
4.5.3 Operating Cost Savings .............................................................................. 4.7
4.5.4 Project Life .................................................................................................... 4.7
4.6 LIMITATIONS .................................................................................................................... 4.7
5.0 RESULTS ........................................................................................................................5.1
5.1 SCHOOL AND LONG-TERM CARE FACILITY ................................................................ 5.1
5.1.1 School Results ............................................................................................... 5.3
5.1.2 Long-Term Care Facility Results ................................................................. 5.5

COST-BENEFIT ANALYSIS OF IMPLEMENTING THE 2011 NATIONAL ENERGY CODE FOR
BUILDINGS IN NEWFOUNDLAND AND LABRADOR
ii
5.2 OVERALL BUILDING RESULTS ......................................................................................... 5.6
5.2.1 Baseline Energy Results ............................................................................... 5.8
5.2.2 NECB Energy Results .................................................................................... 5.9
5.2.3 Impact by Building .................................................................................... 5.12
5.3 MECHANICAL AND LIGHTING SYSTEMS ..................................................................... 5.16
5.3.1 Lighting Systems ......................................................................................... 5.17
6.0 DISCUSSION ................................................................................................................6.1
6.1 LOCAL CONTEXT ............................................................................................................ 6.1
6.2 MECHANICAL AND LIGHTING SYSTEMS AND BUILDING ENVELOPE ......................... 6.1
7.0 CONCLUSIONS ............................................................................................................7.1

COST-BENEFIT ANALYSIS OF IMPLEMENTING THE 2011 NATIONAL ENERGY CODE FOR
BUILDINGS IN NEWFOUNDLAND AND LABRADOR
i
Executive Summary
To gain an understanding of the feasibility of adopting the National Energy Code of Canada for Buildings
2011 (NECB) in Newfoundland and Labrador, a cost benefit analysis was completed. Stantec Consulting
Ltd. (Stantec) was contracted by the Government of Newfoundland & Labrador’s Office of Climate Change
and Energy Efficiency (CCEE) to complete this analysis for commercial buildings.
The NECB details minimum energy performance requirements for new buildings and new additions. The
most recent version, published in 2011, significantly updates the original Model National Energy Code for
Buildings (MNECB) which was released in 1997. All provinces and two territories are considering
adopting the 2011 NECB, but provincial approaches vary significantly
Like the 1997 MNECB, the 2011 NECB defines requirements for the performance of five building
elements: (1) the building envelope; (2) lighting systems; (3) heating, ventilation, and air-conditioning
(HVAC) systems and equipment; (4) service water heating systems; and (5) electrical systems and motors.
Within these categories of building systems, specific design requirements are established based on the
climate zone in which the proposed building will be constructed.
In order to assess the benefits and costs of adopting the code, it is necessary to understand the current
energy performance of buildings and to assess this against the new requirements of the NECB. However,
there is no information available for the existing stock of buildings in the province, with the exception of
new public buildings, such as schools and medical facilities, and new private sector buildings that are
registered for the Leadership in Energy and Environmental Design (LEED), a certification program for
high performance green buildings. Given this, this study was limited to selecting those buildings for
which energy models are available. Seven buildings were included in the study. These were selected to
reflect as much diversity as possible, including different building and construction categories and regional
representation. Of note, the buildings range in size from about 3,800 m2 to 16,000 m2, some have ground
source heat pumps, and most are multi-story with complex mechanical and lighting systems. The seven
buildings are summarized below.
Building No. Category Building Town
1 Office
Office St John’s
2 Office St John’s
3 Education
School Torbay
4 College Campus Labrador City
5 Health Long-Term Care
Facility Corner Brook
6 MURB1 Residential St John’s
7 Warehouse - Mount Pearl
1 Multi-Unit Residential Building
COST-BENEFIT ANALYSIS OF IMPLEMENTING THE 2011 NATIONAL ENERGY CODE FOR
BUILDINGS IN NEWFOUNDLAND AND LABRADOR
ii
The results of the study determined that:
• From a technology and construction practices perspective, it is possible to achieve the overall
level of energy efficiency required for all four of the NECB climate zones (6, 7a, 7b and 8) in
Newfoundland and Labrador.
• Beyond a certain point, the most cost-effective way of meeting the NECB, is through efficient
mechanical and lighting systems rather than extra insulation (i.e. once a certain amount of
insulation is installed, there are diminishing returns as the energy saved per dollar spent from
extra insulation declines).
• New buildings built to LEED standards already exceeded the level of energy efficiency required by
the NECB, with one exception (the College Campus in Labrador City).
• Building to the NECB is less expensive than building to the standard of the base buildings
included in this study (which are all LEED registered), but building to the level of NECB also
generates less energy savings. There was one exception to this (the College Campus).
• The College Campus is located in a remote northern region (climate zone 8) where construction
costs are high, the NECB requirements are more stringent, and electricity rates are low relative to
other regions of the province (climate zones 6 and 7). This means it is less cost-effective to invest
in energy efficiency in this region up to the same point that it would be in other regions (where
construction costs are lower, NECB requirements are less stringent (zones 6 and 7), and
electricity rates are higher).
The study also identified three additional factors which must also be considered in adopting NECB.
• First, there are higher costs for building materials in Labrador, due to transportation and
distribution issues.
• Second, almost one-half of the province’s population lives in municipalities, local service districts
or unincorporated areas with a population of less than 2,500 people. It is reasonable to expect
that there will be a limited number of commercial buildings being constructed in these areas.
• Third, skills training of all groups (such as designers, construction workers and building
inspectors), as well as the means to ensure compliance, require further consideration. These
factors, while not examined within the parameters of this study, should be considered in a
broader dialogue with stakeholders in considering next steps.
COST-BENEFIT ANALYSIS OF IMPLEMENTING THE 2011 NATIONAL ENERGY CODE FOR
BUILDINGS IN NEWFOUNDLAND AND LABRADOR
i
Abbreviations
ASHRAE: American Society of Heating, Refrigerating and Air Conditioning Engineers
BBB: Build Better Buildings policy
CaGBC Canada Green Building Council
CCEE: Office of Climate Change and Energy Efficiency
HDD: Heating Degree Day
LEED: Leadership in Energy and Environmental Design
NECB: National Energy Code for Buildings
MBC: Manitoba Building Code
MNECB: Model National Energy Code for Buildings
NBC: National Building Code
NFC: National Fire Code
NPC: National Plumbing Code
Limits of Liability
Every effort has been made to ensure the accuracy of the results in this report. Variations in assumptions
and building variables will affect the actual energy that the modelled building may consume. These
variables may include variations in occupancy, building design, operations schedules, weather, energy use
for equipment not included in the simulations or not covered by the applicable energy code, changes in
energy costs from the design of the building to occupancy, and the precision of the simulation and
calculation tools used.
COST-BENEFIT ANALYSIS OF IMPLEMENTING THE 2011 NATIONAL ENERGY CODE FOR
BUILDINGS IN NEWFOUNDLAND AND LABRADOR
1.1
1.0 Introduction
Stantec Consulting Ltd. was engaged by the Government of Newfoundland & Labrador’s Office of Climate
Change and Energy Efficiency (CCEE) to evaluate the costs and benefits of building to the standards in the
National Energy Code of Canada for Buildings 2011 (NECB) for Newfoundland and Labrador.
Energy resource depletion, rising global energy demands, and growing awareness of environmental
issues, all suggest that energy costs will continue to rise. At today’s prices, energy typically represents
more than half of the cost of owning and operating a building. Energy efficiency is about using less energy
to provide the same or better level of service. Improvements in building energy efficiency can result in
significant cost savings over the building’s lifetime and that retrofits and improvements to existing
building systems can also produce substantial savings.
A building’s overall energy efficiency is determined by how well the building is designed, constructed,
maintained, and operated. The benefits of an energy efficient building extend beyond the obvious utility
cost reductions. Other benefits can include: improved occupant comfort (which is proven to result in more
productive occupants and fewer absentee days) and reduced carbon dioxide emissions and local
pollutants. In addition energy exports are an important pillar of economic activity and employment in
Newfoundland and Labrador. By using energy more wisely, energy exporters like Newfoundland and
Labrador will have additional power to sell into global markets and the resulting revenue can be invested
in our schools, hospitals and infrastructure.
1.1 BACKGROUND
In its 2007 Energy Plan, the Government of Newfoundland and Labrador set energy efficiency at the heart
of the province’s energy policy. Recognizing that energy efficiency is fundamental to long-term economic
growth and environmental sustainability, government committed to developing a detailed plan for energy
conservation and efficiency, including priorities and targets. In 2011, government released Moving
Forward: Energy Efficiency Action Plan. The Action Plan set out the province’s vision and goals
alongside 40 commitments for action. It also reaffirmed government’s commitment to pursue the
Conference of New England Governors and Eastern Canadian Premiers target of reducing energy
consumption by 20 per cent by 2020 from business-as-usual projections. In the Action Plan,
government committed to “examine the case for adopting new national energy codes for buildings in
Newfoundland and Labrador in collaboration with key stakeholders” given the pending release of the
NECB.
In order to better understand the NECB and the potential opportunities and challenges associated with it
for Newfoundland and Labrador, the provincial government commissioned this study. It is intended as a
foundational piece to understand the issues and develop the evidence base to inform future discussions
with interested stakeholders and decision-makers on the case for adopting the NECB in the province.
1.2 OBJECTIVES OF PROJECT
The scope of analysis that Stantec was asked to complete includes the following:

COST-BENEFIT ANALYSIS OF IMPLEMENTING THE 2011 NATIONAL ENERGY CODE FOR
BUILDINGS IN NEWFOUNDLAND AND LABRADOR
1.2
1. Determine the baseline energy performance level of new commercial buildings being built in
Newfoundland and Labrador by analyzing the results of existing energy models for a selection of
buildings.
2. Compare the current construction practice and performance levels to those achieved if the
buildings were designed to meet the requirements of the NECB.
3. Identify any barriers to meeting the minimum performance requirements of the NECB.
4. Quantify the expenditure and energy savings that would result by implementing the NECB
as a minimum building energy standard.
5. Conduct life-cycle economic analysis on the measures required to comply with the
performance level required by the NECB.
6. Comment on the appropriateness of the NECB for Newfoundland and Labrador and, if
necessary, identify which provisions may need adapting to local circumstances.
1.3 REPORT STRUCTURE
The remainder of this report is structured into the following sections:
• Section 2.0: Context – A summary of contextual analysis is provided including the magnitude and attributes of the local commercial building sector and the local design environment.
• Section 3.0: 2011 NECB Code Overview – A summary of the NECB.
• Section 4.0: Methodology - The methodology used to complete the study is described.
• Section 5.0: Results – This section summarizes the results of Stantec’s analysis of the seven (7)
buildings including baseline and NECB building energy consumption and the results of the life cycle analysis.
• Section 6.0: Discussion – This section comments on the appropriateness of the NECB for
Newfoundland and Labrador given local circumstances.
• Section 7.0: Conclusion – The key findings of the study are summarized.
• Appendices: Supporting appendices provide more detailed documentation of the inputs and results
of the analysis.
COST-BENEFIT ANALYSIS OF IMPLEMENTING THE 2011 NATIONAL ENERGY CODE FOR
BUILDINGS IN NEWFOUNDLAND AND LABRADOR
2.1
2.0 Context
This section summarizes the policy context at a national and provincial level, including the advantages of
adopting energy codes, and the magnitude and attributes of the local commercial building sector and
design environment in Newfoundland and Labrador.
2.1 NATIONAL MODEL CONSTRUCTION CODES
The National Model Construction Codes comprise the National Building Code of Canada 2010, National
Fire Code of Canada 2010, National Plumbing Code of Canada 2010 and National Energy Code of Canada
for Buildings 2011. They also include the Model National Energy Code of Canada for Houses (which was
last published in 1997 and has now been updated and incorporated in the National Building Code of
Canada 2010) and the National Farm Building Code (last published in 1995).
The Codes are developed and maintained by the Canadian Commission on Building and Fire Codes, an
independent committee of volunteers established by the National Research Council of Canada (NRC).
They are published by the NRC as models for provincial and territorial building and fire regulations. The
development of codes on a national level helps to facilitate the harmonization of construction standards
across Canada, but these codes have no legal status until they are adopted by the province or territory
having jurisdiction. This is because provinces and territories have the responsibility to regulate the
construction of houses and buildings under the Canadian Constitution. Provinces and territories have
the option of adopting these codes as a whole, with province-specific amendments, or they may develop
their own codes.
2.2 PROVINCIAL AND TERRITORIAL REGULATOR AND POLICY FRAMEWORKS
As shown in Figure 1, all provinces and two territories are considering adopting the NECB, but provincial
approaches vary significantly. British Columbia, Ontario and Quebec have building codes that already
include energy requirements. Quebec’s energy requirements have not been updated since 1983, and they
are doing an analysis to determine whether they should amend the NECB to add more stringent
requirements. British Columbia adopted the code in May 2013 and will implement it in December 2013.
Ontario intends to adopt the NECB as a possible compliance option under their existing energy
requirements. Nova Scotia has adopted the code and will implement it in two stages at the end of 2013
and 2014 and Manitoba is poised to adopt it at the end of this year. This level of preparedness for code
adoption differs from a number of other provinces, who intend to explore the adoption of the NECB.
Table 1 summarizes the position of Ontario, Quebec, British Columbia, Nova Scotia and Manitoba.

COST-BENEFIT ANALYSIS OF IMPLEMENTING THE 2011 NATIONAL ENERGY CODE FOR
BUILDINGS IN NEWFOUNDLAND AND LABRADOR
2.2
Figure 1: Status of NECB Adoption/Adaption in Canada
Source: Government of Canada, 2013.
Table 2-1: Summary of Provincial Energy Codes
Provincial Energy Codes
Quebec The Code de construction du Quebec has contained energy requirements since
1983, but they are not based on a specific standard. The requirements are
currently out of date and are being revised.
Ontario
To achieve the energy requirements for buildings contained in the Ontario
Building Code, there are three possible compliance options:
• Achieving MNECB (1997) + 25%
• Achieving ASHRAE 90.1 (2010) +5%
• Achieving ASHRAE 90.1 (2010) + additions and substitutions
contained in the Supplementary Bulletin 10 of the Ontario Building
Code
COST-BENEFIT ANALYSIS OF IMPLEMENTING THE 2011 NATIONAL ENERGY CODE FOR
BUILDINGS IN NEWFOUNDLAND AND LABRADOR
2.3
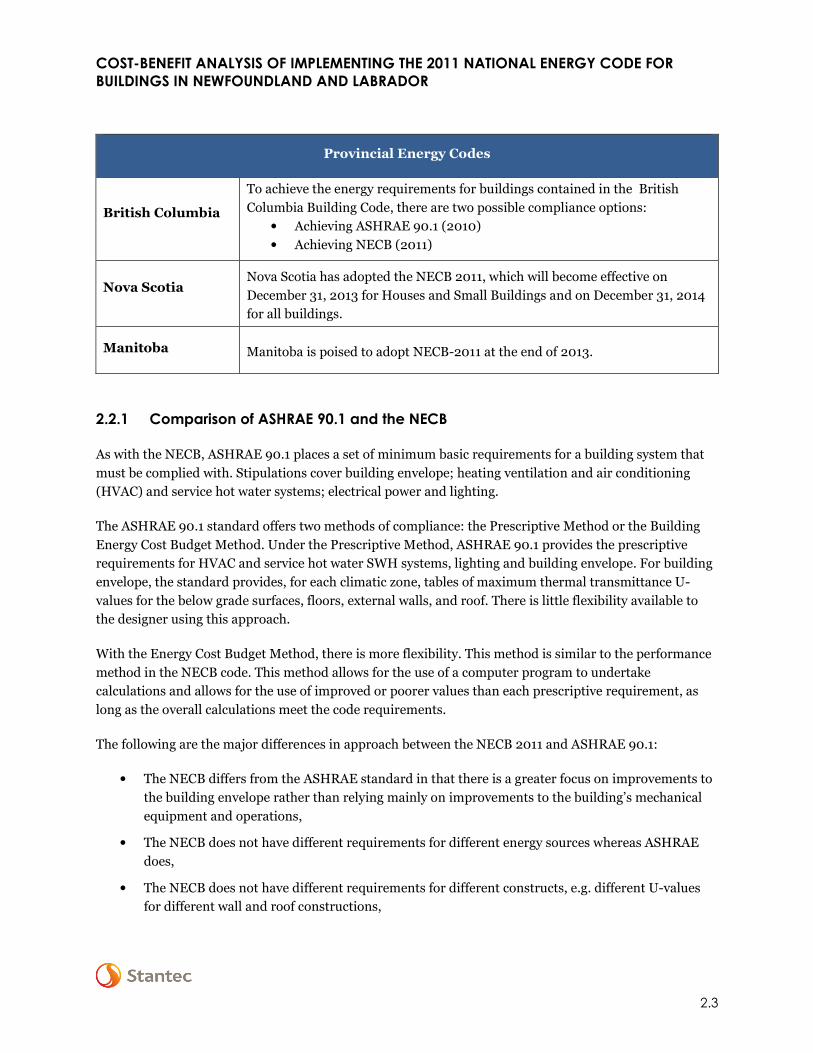
Provincial Energy Codes
British Columbia
To achieve the energy requirements for buildings contained in the British
Columbia Building Code, there are two possible compliance options:
• Achieving ASHRAE 90.1 (2010)
• Achieving NECB (2011)
Nova Scotia Nova Scotia has adopted the NECB 2011, which will become effective on
December 31, 2013 for Houses and Small Buildings and on December 31, 2014
for all buildings.
Manitoba Manitoba is poised to adopt NECB-2011 at the end of 2013.
2.2.1 Comparison of ASHRAE 90.1 and the NECB
As with the NECB, ASHRAE 90.1 places a set of minimum basic requirements for a building system that
must be complied with. Stipulations cover building envelope; heating ventilation and air conditioning
(HVAC) and service hot water systems; electrical power and lighting.
The ASHRAE 90.1 standard offers two methods of compliance: the Prescriptive Method or the Building
Energy Cost Budget Method. Under the Prescriptive Method, ASHRAE 90.1 provides the prescriptive
requirements for HVAC and service hot water SWH systems, lighting and building envelope. For building
envelope, the standard provides, for each climatic zone, tables of maximum thermal transmittance U-
values for the below grade surfaces, floors, external walls, and roof. There is little flexibility available to
the designer using this approach.
With the Energy Cost Budget Method, there is more flexibility. This method is similar to the performance
method in the NECB code. This method allows for the use of a computer program to undertake
calculations and allows for the use of improved or poorer values than each prescriptive requirement, as
long as the overall calculations meet the code requirements.
The following are the major differences in approach between the NECB 2011 and ASHRAE 90.1:
• The NECB differs from the ASHRAE standard in that there is a greater focus on improvements to
the building envelope rather than relying mainly on improvements to the building’s mechanical
equipment and operations,
• The NECB does not have different requirements for different energy sources whereas ASHRAE
does,
• The NECB does not have different requirements for different constructs, e.g. different U-values
for different wall and roof constructions,
COST-BENEFIT ANALYSIS OF IMPLEMENTING THE 2011 NATIONAL ENERGY CODE FOR
BUILDINGS IN NEWFOUNDLAND AND LABRADOR
2.4
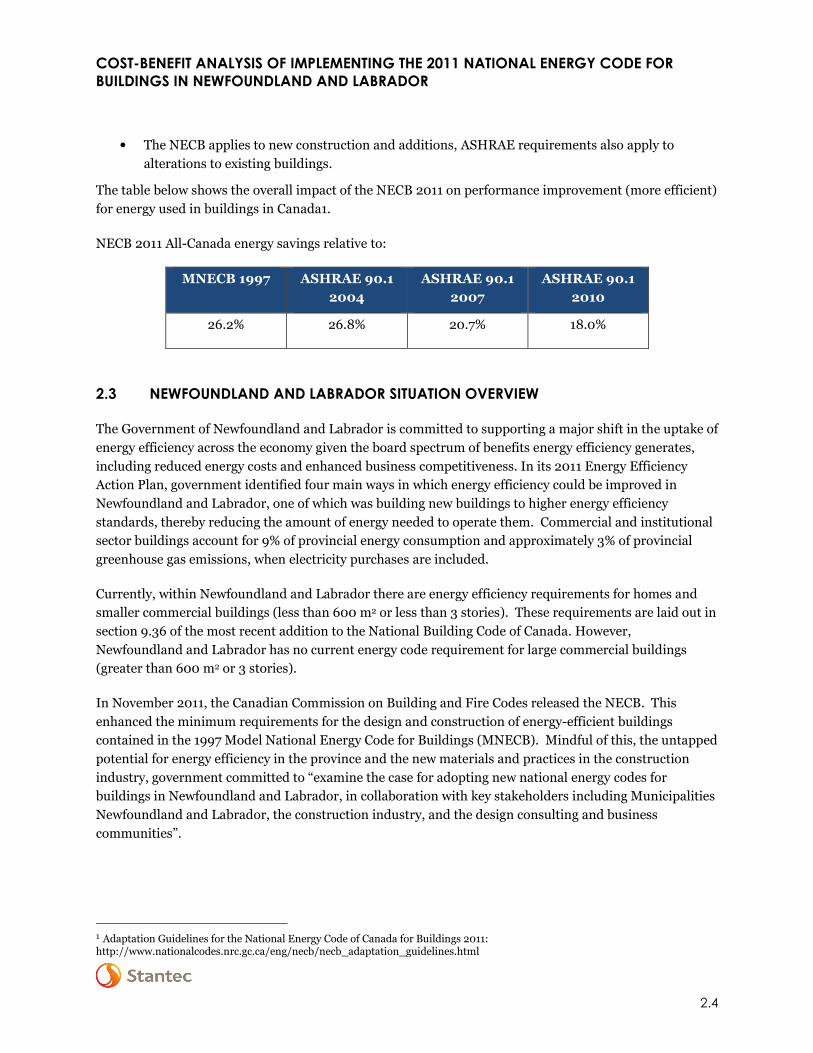
• The NECB applies to new construction and additions, ASHRAE requirements also apply to
alterations to existing buildings.
The table below shows the overall impact of the NECB 2011 on performance improvement (more efficient)
for energy used in buildings in Canada1.
NECB 2011 All-Canada energy savings relative to:
MNECB 1997 ASHRAE 90.1
2004
ASHRAE 90.1
2007
ASHRAE 90.1
2010
26.2% 26.8% 20.7% 18.0%
2.3 NEWFOUNDLAND AND LABRADOR SITUATION OVERVIEW
The Government of Newfoundland and Labrador is committed to supporting a major shift in the uptake of
energy efficiency across the economy given the board spectrum of benefits energy efficiency generates,
including reduced energy costs and enhanced business competitiveness. In its 2011 Energy Efficiency
Action Plan, government identified four main ways in which energy efficiency could be improved in
Newfoundland and Labrador, one of which was building new buildings to higher energy efficiency
standards, thereby reducing the amount of energy needed to operate them. Commercial and institutional
sector buildings account for 9% of provincial energy consumption and approximately 3% of provincial
greenhouse gas emissions, when electricity purchases are included.
Currently, within Newfoundland and Labrador there are energy efficiency requirements for homes and
smaller commercial buildings (less than 600 m2 or less than 3 stories). These requirements are laid out in
section 9.36 of the most recent addition to the National Building Code of Canada. However,
Newfoundland and Labrador has no current energy code requirement for large commercial buildings
(greater than 600 m2 or 3 stories).
In November 2011, the Canadian Commission on Building and Fire Codes released the NECB. This
enhanced the minimum requirements for the design and construction of energy-efficient buildings
contained in the 1997 Model National Energy Code for Buildings (MNECB). Mindful of this, the untapped
potential for energy efficiency in the province and the new materials and practices in the construction
industry, government committed to “examine the case for adopting new national energy codes for
buildings in Newfoundland and Labrador, in collaboration with key stakeholders including Municipalities
Newfoundland and Labrador, the construction industry, and the design consulting and business
communities”.
1 Adaptation Guidelines for the National Energy Code of Canada for Buildings 2011: http://www.nationalcodes.nrc.gc.ca/eng/necb/necb_adaptation_guidelines.html

COST-BENEFIT ANALYSIS OF IMPLEMENTING THE 2011 NATIONAL ENERGY CODE FOR
BUILDINGS IN NEWFOUNDLAND AND LABRADOR
2.5
2.4 TRENDS AND OPPORTUNITIES
2.4.1 Current Building Practices in Newfoundland and Labrador
Statistics Canada is the main source for data on non-residential construction. There is limited data
available regarding the construction of commercial sector and government buildings. This is a function of
three main factors: (i) these data are primarily used to inform projections in economic activity and
therefore focus on investment levels only; (ii) these data can only be captured by examining municipal
building permits, and there is no standardized permitting process across all municipalities in Canada; and
(iii) municipalities capture a limited amount of information for commercial buildings, given their
municipal regulatory needs, and most construction level detail is contained in separate engineering design
documents that may be submitted with permit requests.
Data is available on the value of building permits for the commercial sector (e.g., office buildings,
restaurants and retail outlets) and the institutional and government sector (e.g., schools, long-term care
facilities) in Newfoundland and Labrador. Over the 2010 to 2012 period, these data show that $2.14
billion in building permits have been issued. The data also indicate that:
• The commercial sector accounted for 70% of the value of building permits, and the institutional
and government sector accounted for 30%;
• Within the province, the St. John’s Census Metropolitan Area (CMA) (i.e., the Northeast Avalon
area) accounted for 67% of the value of building permits, large rural service centres (i.e. Corner
Brook, Bay Roberts, and Grand Falls-Windsor) accounted for 12%, and all other rural areas
accounted for 21%.
• Within the commercial sector, the St. John’s CMA accounted for 71% of the value of building
permits. However, for the institutional and government sector, the CMA accounted for 57%. This
difference is, in large part, a function of recent investments in school and health care construction
in rural areas.
• Corner Brook, Grand Falls-Windsor and the Bay Roberts area (i.e., the three largest areas outside
the St. John’s CMA) accounted for 11% of commercial sector buildings permit value, and 13% of
institutional and government sector investment.
• All other towns (which include Gander, Labrador City, Happy Valley-Goose Bay, Carbonear and
Clarenville, as well as all other municipalities) accounted for 18% of commercial sector buildings
permit value, and 29% of institutional and government sector investment.
2.4.2 Build Better Buildings Policy in Newfoundland and Labrador
In 2007 Energy Plan, government recognized that, as buildings have an expected lifespan of several
decades, energy efficiency investments at the time of construction can affect energy use for a long time.
In view of this and the impact that buildings can have on the environment, government committed to lead
by example and undertook that “starting in 2008, where appropriate, all new buildings and major
renovations receiving funding from the Provincial Government or built by Provincial Government
corporations or agencies exceed the current Model National Energy Code by 25 per cent and, where
COST-BENEFIT ANALYSIS OF IMPLEMENTING THE 2011 NATIONAL ENERGY CODE FOR
BUILDINGS IN NEWFOUNDLAND AND LABRADOR
2.6
possible, also qualify for a minimum Silver standard in the Leadership in Energy and Environmental
Design (LEED) program”. In August 2011, government reiterated this commitment in its Energy
Efficiency Action Plan and, separately, released a detailed policy in support of this undertaking.
The Build Better Buildings (BBB) policy, released in 2011, formalizes the Energy Plan commitment and a
guide to implementation is available at www.turnbackthetide.ca. It applies to the construction of new
buildings and major renovations and extensions that receive capital construction funding from the
Provincial Government where:
• The area of a new building or extension to an existing building is 600 sq. m. (6,458 sq. ft.) or
more; or
• The cost of renovations and/or extensions to an existing building (600 sq. m. or more) exceeds 50
per cent of the cost of a new building of equivalent size and function.
Projects within the scope of BBB must register with LEED Canada and strive to achieve a minimum of
LEED Silver certification under the appropriate LEED rating system. Established in 1999 by the US Green
Building Council and adapted for use in Canada in 2003, LEED is a rating tool to assess the
environmental performance of buildings across a spectrum of environmental aspects including:
• Sustainable Sites
• Water efficiency
• Energy and atmosphere
• Materials and resources
• Indoor environmental quality
• Innovation in design
• Regional Priorities
LEED Certification is based on the total point score achieved in these seven areas, following an
independent review. There are four possible levels of certification; certified, silver, gold and platinum.
Under the LEED 2009 ‘New Construction’ rating system, the project must score between 50-59 points
from 100 base points and 10 exceptional/innovative/regional points to achieve a LEED silver designation.
There are five core building types which dictate the type of LEED tool or rating system a project can
choose from, including:
• Homes
• Neighbourhood Development
• Commercial Interiors
• Existing Buildings Operations and Maintenance
• New Construction

COST-BENEFIT ANALYSIS OF IMPLEMENTING THE 2011 NATIONAL ENERGY CODE FOR
BUILDINGS IN NEWFOUNDLAND AND LABRADOR
2.7
o Core and Shell
o New construction and Major Renovation
There are a number of LEED Canada Rating systems available to meet the needs of different building
types, which include:
• LEED Canada NC 2009- New Construction and Major Renovations
• LEED Canada 2009 –Core and Shell LEED Canada for Commercial Interiors – LEED Canada CI
• LEED Canada EB: O&M 2009 – Existing Buildings Operation and Maintenance
• LEED Canada for Homes
• LEED ND 2009 with Canadian Alternative Compliance Path – Neighborhood Development
LEED continues to dominate the market of green building assessment methodologies. As such, the degree
of adoption of LEED is one measure of the degree of market transformation toward more sustainable
building design and construction practices. However, LEED is neither an energy code nor an energy
standard. It does not provide designers with information on how buildings should be designed; rather it
references other bodies’ energy standards.
There are currently two LEED-certified project in Newfoundland and Labrador2; however, there are an
additional 54 registered projects. Of the 56 total projects as shown in Table 2-2, 27 are located in the St.
John’s Census Metropolitan Area, 21 are located elsewhere on the island of Newfoundland and five in
Labrador (three projects do not have an identified location). Registration is only an indication that a
building is striving to attain a LEED certification, not that it has achieved it.
2 Canada Green Building Council, Project Profiles and Stats, Updated April, 2013, duplicate project registration removed. Excludes the St. John’s Target store that is registered by the parent company in Ontario.

COST-BENEFIT ANALYSIS OF IMPLEMENTING THE 2011 NATIONAL ENERGY CODE FOR
BUILDINGS IN NEWFOUNDLAND AND LABRADOR
2.8
Table 2-2: Summary of LEED Registered Projects
LEED Registered Projects
Number of Projects
Project Type1 Share of
Floor Space
Private
Sector2
Provincial
Government3
Federal
Government
Municipal
Government4
Health care and related5 23% 9
Neighbourhood
re-development 19% 1
Office Building 14% 5 1 1 2
K-12 Education 12% 12
Public safety6 8% 2 1
Post-secondary Education 7% 1 4
Sports facilities 6% 5
Retail 5 3
Public transit 2% 1
Other7 3% 7 1
Total 100% 16 27 4 9
1. Project types do not align with the categories assigned by the Canada Green Building Council.
2. Private sector includes non-profit organizations.
3. Provincial Government includes crown corporations and the post-secondary system.
4. Municipal Government includes municipal commissions.
5. Health care and related includes hospitals, clinics, nursing homes, health laboratories and youth treatment centres.
6. Public safety includes national defense.
7. Other includes industrial and manufacturing, hotels/motels, residential and mixed use developments, conservation centres and
unidentified projects. .
2.4.3 Advantages of Adopting an Energy Code
Although several provinces have conducted studies and have announced intentions, as of yet only British
Columbia, Ontario and Nova Scotia has currently adopted the NECB, although Manitoba is poised to
adopt the code at the end of 2013. Understanding the challenges of adopting a new code is critical to
designing an approach that will achieve the expected outcomes.
Adopting an energy code brings many benefits to building tenants and owners and at a provincial level.
Whether the code adopted in NECB, ASHRAE or any other code, the advantages include:

COST-BENEFIT ANALYSIS OF IMPLEMENTING THE 2011 NATIONAL ENERGY CODE FOR
BUILDINGS IN NEWFOUNDLAND AND LABRADOR
2.9
• Economic Savings: A reduction in energy use results in energy cost savings. Over the lifetime
of a building this reduction can be significant.
• Job Creation: The use of improved technology in buildings and the increasing need for energy
code experts will create employment opportunities. New jobs will become available such as
technical experts, duct and air leakage professionals, quality control assessors, building and
system commissioning agents, energy auditors, and compliance officers. In addition, completing
project retrofits and building weatherization will create new employment opportunities as well.
• Improved Grid Reliability: By decreasing the impact and peak loads of buildings, energy
codes help reduce strain on utility electricity transmission and distribution systems.
• Reduced Emissions: Newfoundland and Labrador’s electricity is mostly generated by
hydroelectricity, however on the island interconnected grid there is also a thermal oil facility and
several emergency gas facilities, and isolated communities operate using diesel generators. The
burning of carbon-containing fuels (oil and gas) contributes to the greenhouse effect and climate
change. By reducing the energy consumed by buildings, greenhouse gas emissions will be
reduced.
Adopting a new code will also require that potential barriers be addressed:
• Availability of Current Technology and Skills: One area where availability may be a
challenge is in terms of the capacity of the local design industry. The first LEED project was
registered in 2008; the year after the Energy Plan was released. The policy on LEED will have
helped to build capacity. In addition, enhancing capacity of the local industry may be achieved
through implementation of a grace period wherein designs voluntarily meet the code, before
enforcement comes into effect at a later date.
• Availability of Products: Fabricators and other manufacturers tend to stock the product that is
most demanded by designers. The ability for these market agents to respond to codes or
standards requiring components with improved performance characteristics may require some
lead time. Whilst this is not expected to be a major barrier in the major centres of population,
such as St. John’s, building material and product availability could be an issue in remote areas
where the additional shipping costs could increase payback timelines.
• Affordability: Affordability addresses the financial barriers related to technologies and
processes required to raise the energy standards for commercial buildings relative to current
(baseline) levels. Affordability can be defined on both a first cost and a life cycle cost basis. The
tendency of the design community to base decisions on first cost rather than payback or life cycle
costing poses a significant barrier to the adoption of higher performance requirements.
• Split Incentives: This barrier is particularly evident for building owners / developers that do
not intend to retain ownership of the property beyond completion or intend to cover the
building’s operational costs via its tenants’ lease arrangements. Both situations effectively
achieve the same outcome – the operational costs of the property once completed are not borne
by the principal developer of the property.
COST-BENEFIT ANALYSIS OF IMPLEMENTING THE 2011 NATIONAL ENERGY CODE FOR
BUILDINGS IN NEWFOUNDLAND AND LABRADOR
3.1
3.0 NECB Overview
Canada’s National Energy Code for Buildings details minimum energy performance requirements for new
buildings and additions to existing buildings. The most recent version, published in 2011, significantly
updates the original MNECB which was released in 1997. The NECB is applicable to all new buildings and
additions:
a) Classified as post-disaster buildings,
b) Used for major occupancies classified as
i. Assembly occupancies,
ii. Care, treatment or detention occupancies, or
iii. High-hazard industrial occupancies, or
c) Exceeding 600m2 in building area or exceeding 3 storeys in building height used for major
occupancies classified as
i. Residential occupancies,
ii. Business and personal services occupancies,
iii. Mercantile occupancies, or
iv. Medium and low-hazard industrial occupancies.
The code also applies the alteration, reconstruction, demolition, removal, relocation and occupancy of
existing buildings. The code does not apply to farm buildings.
MNECB was intended to provide a comprehensive standard for building energy efficiency for adoption by
provinces and territories. Since the release of MNECB, only one jurisdiction -- Ontario -- has adopted the
energy standard as a part of its building code. The MNECB adopted a life cycle cost approach to energy
efficiency, evaluating energy efficiency in terms of assumptions about relative energy prices for various
fuels across the provinces and territories. This regional adjustment to the energy cost budget
methodology for evaluating energy efficiency in buildings, caused the MNECB to be considered out of date
within a year or two, as the economic assumptions built into the were not reflective of real-world
conditions over time. The NECB is therefore based on energy performance and energy consumption only,
without regard for fuel type or jurisdiction beyond climate zones. However, MNECB continues to be
extensively used for incentive and green building rating programs such as LEED. The ‘New Construction’
and ‘Core and Shell’ rating systems within LEED requires, as a prerequisite, that the building
demonstrates a 25% reduction in design energy consumption when compared to MNECB3.
The development of MNECB was heavily influenced by the 1975 and 1989 versions of ASHRAE Standard
90.1: Energy Standard for Buildings Except Low-Rise Residential Buildings. ASHRAE 90.1 is a widely
recognized energy code developed by the American Society of Heating, Refrigeration, and Air-
Conditioning Engineers, which provides mandatory and prescriptive requirements for building designs
3 LEED Canada requires projects to demonstrate a 25% reduction in design energy consumption when compared to MNECB or an 18% reduction in design energy cost of compliance when compared with ASHRAE/IESNA Standard 90.1-1999.
COST-BENEFIT ANALYSIS OF IMPLEMENTING THE 2011 NATIONAL ENERGY CODE FOR
BUILDINGS IN NEWFOUNDLAND AND LABRADOR
3.2
which minimize energy consumption. It has been adopted in jurisdictions across Canada and North
America, including the province of British Columbia.
Construction practices, building technologies and materials have evolved significantly since the release of
the MNECB and have informed the development of the NECB. Major developments include the use of
improved insulation in building envelopes and double or triple glazed windows along with improved
glazing coatings which reflect the sun. In addition compact fluorescent lights have replaced incandescent
fixtures and LED lighting has started to be used, particularly in exterior lighting. Mechanical equipment
has become generally more efficient with the extensive use of heat recovery. The next update to the NECB
is anticipated in 2015
Like ASHRAE 90.1 and MNECB, the NECB defines requirements for the performance of five building
elements: (1) the building envelope; (2) lighting systems; (3) heating, ventilation, and air-conditioning
(HVAC) systems and equipment; (4) service water heating systems; and (5) electrical systems and motors.
Also like ASHRAE 90.1, other energy end uses, such as process equipment (e.g. server rooms, commercial
refrigeration systems other than those found in ice areas, or equipment used for industrial production)
and renewable energy systems are not addressed. Within these categories of building systems, specific
design requirements are established based on the climate zone in which the proposed building will be
constructed. For instance, limits on thermal transmittance through walls are more stringent in climates
with a higher number of heating degree days. A heating degree day (HDD) is a technical measure used to
evaluate energy demand and consumption for heating buildings4. Degree days are based on how far the
average daily temperature departs from a human comfort level of a base temperature. The NBC uses a
base temperature of 18°C. Each degree of temperature below 18°C is counted as one heating degree day.
For example, a day with an average temperature of 6 °C will have 12 heating degree days. HDD are added
over periods of time to provide a rough estimate of seasonal heating requirements
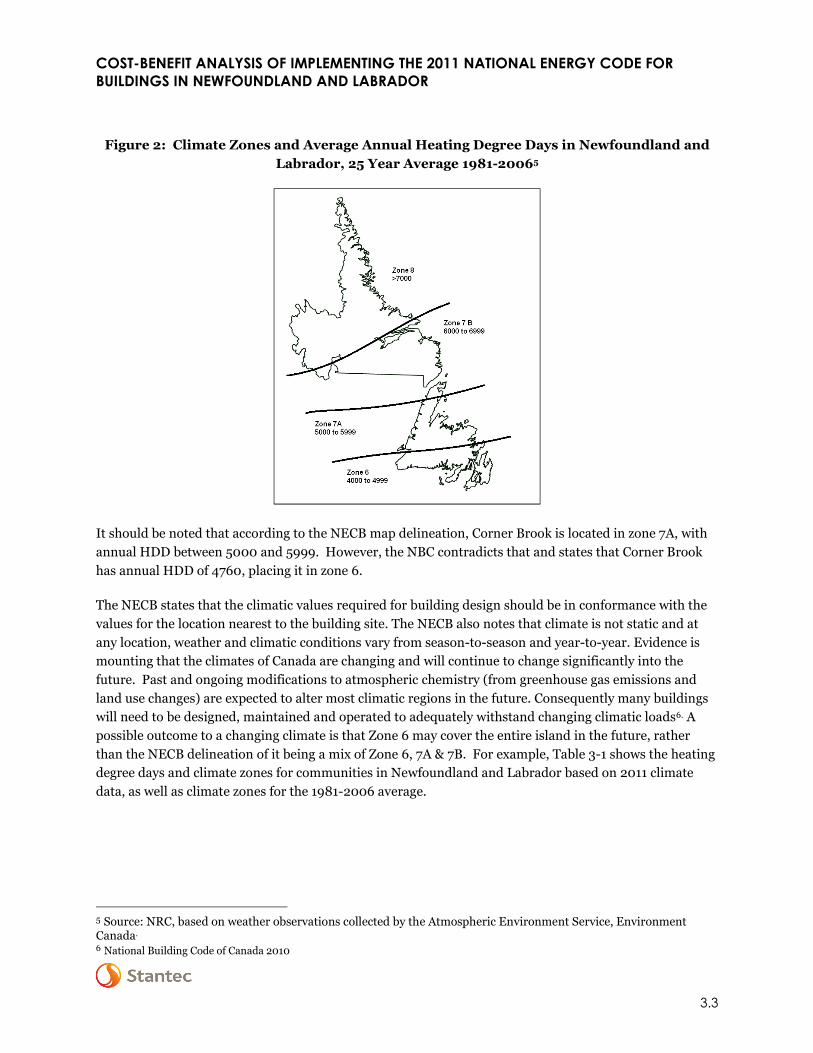
There are four climate zones represented in the province; zone 6 (HDDs of between 4,000 and 4,999
based on a 1981-2006 average), 7A (HDDs between 5,000 and 5,999), 7B (HDDs between 6,000 and
6,999) and 8 (HDDs of at least 7,000). Due to climate variances, there are substantive differences in the
requirements of the NECB between zones 6 and 8. For example Wabush, which is in zone 8, has an
average annual temperature of -3.5°C, whilst the average temperature is 4.7°C in St John’s which is in
zone 6. It is therefore reasonable that the NECB code demands that the thermal transmittance through
walls is more stringent in zone 8. HDD zones cut across the province as shown in Figure 1. Based on this
delineation, 60% of the population lives in Zone 4% in Zone 7B and 3% in Zone 8.
4 The reciprocal of HDD is CDD which are used to evaluate energy demand and consumption for cooling buildings.
COST-BENEFIT ANALYSIS OF IMPLEMENTING THE 2011 NATIONAL ENERGY CODE FOR
BUILDINGS IN NEWFOUNDLAND AND LABRADOR
3.3
Figure 2: Climate Zones and Average Annual Heating Degree Days in Newfoundland and
Labrador, 25 Year Average 1981-20065
It should be noted that according to the NECB map delineation, Corner Brook is located in zone 7A, with
annual HDD between 5000 and 5999. However, the NBC contradicts that and states that Corner Brook
has annual HDD of 4760, placing it in zone 6.
The NECB states that the climatic values required for building design should be in conformance with the
values for the location nearest to the building site. The NECB also notes that climate is not static and at
any location, weather and climatic conditions vary from season-to-season and year-to-year. Evidence is
mounting that the climates of Canada are changing and will continue to change significantly into the
future. Past and ongoing modifications to atmospheric chemistry (from greenhouse gas emissions and
land use changes) are expected to alter most climatic regions in the future. Consequently many buildings
will need to be designed, maintained and operated to adequately withstand changing climatic loads6. A
possible outcome to a changing climate is that Zone 6 may cover the entire island in the future, rather
than the NECB delineation of it being a mix of Zone 6, 7A & 7B. For example, Table 3-1 shows the heating
degree days and climate zones for communities in Newfoundland and Labrador based on 2011 climate
data, as well as climate zones for the 1981-2006 average.
5 Source: NRC, based on weather observations collected by the Atmospheric Environment Service, Environment Canada. 6 National Building Code of Canada 2010

COST-BENEFIT ANALYSIS OF IMPLEMENTING THE 2011 NATIONAL ENERGY CODE FOR
BUILDINGS IN NEWFOUNDLAND AND LABRADOR
3.4
Table 3-1: Heating Degree Days in Newfoundland and Labrador, 2011
Community Heating Degree
Days (2011)
Climate Zone
(2011)
Climate Zone
(NECB based on
1981-2006
average HDDs)
St. John's 4,542 6 6
St. Lawrence 4,459 6 6
Bonavista 4,488 6 6
Gander 4,851 6 7A
Badger 5,145 7A 7A
Corner Brook 4,416 6 7A
Stephenville 4,391 6 7A
Port aux Basques 4,288 6 6
Daniel's Harbour 4,989 6 7A
St. Anthony 5,333 7A 7B
Cartwright 6,203 7B 7B
Happy Valley-Goose Bay 6,236 7B 7B
Wabush 7,413 8 8
Nain 7,290 8 8
Source: Environment Canada
3.1 CODE COMPLIANCE
There are two possible compliance paths that may be selected in order to demonstrate that their building
design complies with the NECB:
• The Prescriptive Path requirements laid out in the code for each of the five building systems
(envelope, HVAC, lighting, service water heating, and electrical systems) may be adopted,
ensuring that the overall system design meets the all of the mandatory efficiency requirements
defined in the code.
o A sub component of the Prescriptive Path is the Tradeoff Path. This option affords some
flexibility in the application of the prescriptive path. The trade-off option presents an easy
way to make small adjustments to the prescriptive path without having to follow the

COST-BENEFIT ANALYSIS OF IMPLEMENTING THE 2011 NATIONAL ENERGY CODE FOR
BUILDINGS IN NEWFOUNDLAND AND LABRADOR
3.5
whole-building performance path. For example the thermal characteristics of one or more
components of the building envelope can be changed, provided it can be shown that the
resultant building envelope will not transfer more energy than it would if all of its
components complied with that section.
• The Performance Path uses the calculation methodologies provided in the NECB to trade off a
limited number of mandatory requirements while still demonstrating that the overall energy
efficiency of the system has not been compromised. Whole building simulation is used for this
compliance path.
Regardless of the compliance path chosen, the NECB establishes a consistent building energy
performance requirement, based on U-value and fenestration-to-wall ratio limits for each climate zone.
In general, a building designed to comply with NECB will need to be 26.2% more efficient than an
MNECB-compliant building.

COST-BENEFIT ANALYSIS OF IMPLEMENTING THE 2011 NATIONAL ENERGY CODE FOR
BUILDINGS IN NEWFOUNDLAND AND LABRADOR
4.1
4.0 Methodology
4.1 APPROACH
In order to assess the benefits and costs of adopting the NECB, it was necessary to understand the current
energy performance of buildings and to assess this against the requirements of the NECB. However, as
explained in Section 2.2.1 there is no information available for the existing stock of buildings in the
province, with the exception of new public buildings, such as schools and medical facilities, and new
private sector buildings that are registered for LEED. Given this, this study was limited to selecting those
buildings for which energy models are available.
4.2 CHOOSING STUDY BUILDINGS
Seven buildings were assessed in this project. The selection of buildings for the project was limited by
three factors.
• First, there was a need to establish a representative sample of buildings. The study includes
buildings with varying construction materials across multiple sectors such as education, office
buildings and warehousing, and across different regions and climate zones in the province. There
were a limited number of buildings that meet this criteria in Climate Zones 7a, 7b and 8 when
considered in combination with the remaining selection factors.
• Second, in order to assess the impacts of the NECB, it was necessary to include buildings for
which an energy model had previously been completed and was available for analysis, as it was
outside the scope of this project to develop a baseline energy model for any building.
• Third, a regional representation of buildings was sought. As there were a limited number of
buildings that had energy models in the province, this was challenging. However, buildings in
Labrador City and Corner Brook were included.
A list of potential buildings was developed by the provincial government in consultation with Stantec for
consideration in the study. Of the seven buildings selected for the project, only two have been operational
for at least one year (i.e., the Torbay School and the Corner Brook Long-term Care Facility).
The owners of the buildings identified were contacted to request permission to use the existing energy
models that had previously been built and release facility information such as building drawings and
specifications. A list of the buildings included in the study is provided in Table 4-1 below.

COST-BENEFIT ANALYSIS OF IMPLEMENTING THE 2011 NATIONAL ENERGY CODE FOR
BUILDINGS IN NEWFOUNDLAND AND LABRADOR
4.2
Table 4-1: Summary of Buildings by Category, Type, Location and Climate Zone
Building No. Category Building Type Town Climate Zone
(NECB)
1 Office
Office St John’s 6
2 Office St John’s 6
3 Education
School Torbay 6
4 College Campus Labrador City 8
5 Health Long-Term Care
Facility Corner Brook 7a
6
Multi-Unit
Residential
Building
Residential St John’s 6
7 Warehouse Warehouse Mount Pearl 6
4.3 DATA COLLECTION
Detailed data was obtained for each of the seven buildings analyzed in this study in order to characterize
each building and collect the necessary information for the energy models updates. The information
described below was included for each building.
• Drawings: For each building “issued for tender”, “issued for construction” or “as-built” drawings
were obtained for architectural, mechanical, and electrical systems.
• Specifications: Where available, project specifications for architectural, mechanical, and electrical
systems were obtained.
• Shop Drawings: On some projects shop drawings of installed equipment were available and
obtained to provide the equipment performance values for the modeling process.
4.4 ENERGY MODELING
This section describes the energy modeling methodology, including modeling each building to meet NECB
requirements.
Part of the criteria for selecting buildings for the analysis was that the study building must have an
existing energy model. The buildings selected were built in two different software, EE4 and eQUEST.
COST-BENEFIT ANALYSIS OF IMPLEMENTING THE 2011 NATIONAL ENERGY CODE FOR
BUILDINGS IN NEWFOUNDLAND AND LABRADOR
4.3
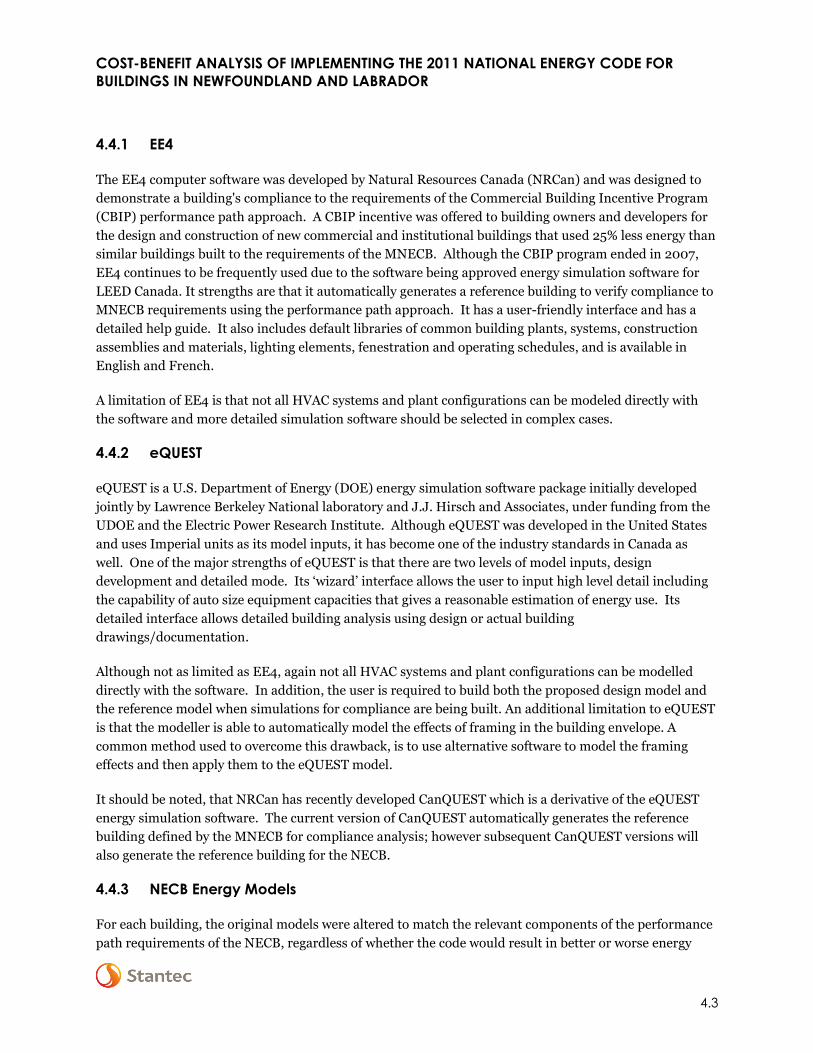
4.4.1 EE4
The EE4 computer software was developed by Natural Resources Canada (NRCan) and was designed to
demonstrate a building's compliance to the requirements of the Commercial Building Incentive Program
(CBIP) performance path approach. A CBIP incentive was offered to building owners and developers for
the design and construction of new commercial and institutional buildings that used 25% less energy than
similar buildings built to the requirements of the MNECB. Although the CBIP program ended in 2007,
EE4 continues to be frequently used due to the software being approved energy simulation software for
LEED Canada. It strengths are that it automatically generates a reference building to verify compliance to
MNECB requirements using the performance path approach. It has a user-friendly interface and has a
detailed help guide. It also includes default libraries of common building plants, systems, construction
assemblies and materials, lighting elements, fenestration and operating schedules, and is available in
English and French.
A limitation of EE4 is that not all HVAC systems and plant configurations can be modeled directly with
the software and more detailed simulation software should be selected in complex cases.
4.4.2 eQUEST
eQUEST is a U.S. Department of Energy (DOE) energy simulation software package initially developed
jointly by Lawrence Berkeley National laboratory and J.J. Hirsch and Associates, under funding from the
UDOE and the Electric Power Research Institute. Although eQUEST was developed in the United States
and uses Imperial units as its model inputs, it has become one of the industry standards in Canada as
well. One of the major strengths of eQUEST is that there are two levels of model inputs, design
development and detailed mode. Its ‘wizard’ interface allows the user to input high level detail including
the capability of auto size equipment capacities that gives a reasonable estimation of energy use. Its
detailed interface allows detailed building analysis using design or actual building
drawings/documentation.
Although not as limited as EE4, again not all HVAC systems and plant configurations can be modelled
directly with the software. In addition, the user is required to build both the proposed design model and
the reference model when simulations for compliance are being built. An additional limitation to eQUEST
is that the modeller is able to automatically model the effects of framing in the building envelope. A
common method used to overcome this drawback, is to use alternative software to model the framing
effects and then apply them to the eQUEST model.
It should be noted, that NRCan has recently developed CanQUEST which is a derivative of the eQUEST
energy simulation software. The current version of CanQUEST automatically generates the reference
building defined by the MNECB for compliance analysis; however subsequent CanQUEST versions will
also generate the reference building for the NECB.
4.4.3 NECB Energy Models
For each building, the original models were altered to match the relevant components of the performance
path requirements of the NECB, regardless of whether the code would result in better or worse energy

COST-BENEFIT ANALYSIS OF IMPLEMENTING THE 2011 NATIONAL ENERGY CODE FOR
BUILDINGS IN NEWFOUNDLAND AND LABRADOR
4.4
consumption performance. The NECB building is architecturally identical to the original, having the
same wall orientations, areas, windows, number of occupants, indoor set-point temperatures, fan
schedule, and process equipment.
The study was completed in two phases. In phase one, the Torbay School and the long-term care facility
were chosen to be the subject of multiple scenarios to better understand the effects of the different
envelope requirements and mechanical/lighting systems and their related costing. These buildings were
selected because they were representative of two different types of construction that are commonly used
in the province. The school used brick facing concrete block, whilst the long-term care facility used a
combination of brick and curtain wall. The scenarios that were run on these two buildings were as follows:
• The baseline building compared against the NECB equivalent building that has the NECB
performance path applied to the mechanical systems, but with air source heat pumps (carried out
for the School analysis only).
• The baseline building compared against the NECB equivalent building.
• The baseline building compared against the NECB equivalent building with Zone 7A (instead of
Zone 6) applied.
• The baseline building is compared against a building that has the baseline envelope and NECB
applied to the mechanical systems and lighting.
• The baseline building is compared against the baseline building with an NECB envelope.
Note that, one building was located in climate zone 6 and one in climate zone 7. Each building was
modeled for each of zone 6 and zone 7 to highlight the difference in impact between the zones. As
discussed previously, specific design requirements are established based on the climate zone in which the
proposed building will be constructed. It was felt that zone 6 building envelope requirements could be
met at present and it would be beneficial to study the impacts of a more stringent zone.
The results from the first phase of work informed the second phase in which the performance of the
remaining buildings was assessed against the NECB’s prescriptive requirements. As phase one of the
study had already answered questions concerning the constructability, costs and benefits of building in
zone 7A, four of the remaining buildings were only assessed for climate zone 7A except the college campus
which was assessed at zone 8, Table 4-2 depicts the zones used within the study.

COST-BENEFIT ANALYSIS OF IMPLEMENTING THE 2011 NATIONAL ENERGY CODE FOR
BUILDINGS IN NEWFOUNDLAND AND LABRADOR
4.5
Table 4-2: Climate Zones used for the cost benefit analysis
Building
No.
Category Town Heating
Degree Days
(HDD) 2011
NECB
Zones
Zones used
for Study
1, 2 Office Buildings St. John’s 4800 6 7A
3 Education Torbay 4800 6 6, 7A
4 Education Labrador City 7710 8 6, 7A, 8
5 Health Corner Brook 4760 6 6, 7A
6 MURB St. John’s 4800 6 7A
7 Warehouse Mount Pearl 4800 6 7A
4.4.4 Building Envelope
The NECB includes a section dedicated to building envelope requirements. Part 3 of the NECB deals with
the transfer of heat and air flow throughout building materials, components and assemblies, as well as the
interfaces between building materials, components and assemblies forming part of the building envelope
and interfaces between building materials.
Part 5, Environmental Separation, applies to heating, ventilating and air-conditioning systems and
equipment. In terms of the building envelope, it deals with air leakage and heat transfer.
The different envelope requirements include the following:
• Continuity of Insulation
• Thermal Characteristics of Above-ground Opaque Building Assemblies
• Thermal Characteristics of Fenestration
• Thermal Characteristics of Doors and Access Hatches
• Building Assemblies in contact with the Ground.
• Heat Transfer
• Air Leakage
Flooring was not changed to NECB requirements due to the limitations of the existing energy models used
within this study.

COST-BENEFIT ANALYSIS OF IMPLEMENTING THE 2011 NATIONAL ENERGY CODE FOR
BUILDINGS IN NEWFOUNDLAND AND LABRADOR
4.6
4.4.5 Mechanical Systems
The NECB building’s heating and cooling plant (if applicable) was dependent on the original building’s
function. In this study, one of seven HVAC building system types were assigned to NECB building
depending on the space types located in the baseline building. A table detailing the HVAC system
selection and description is located in Appendix B, whilst each building summarized model inputs are
detailed in Appendix C.
4.4.6 Lighting
Lighting requirements were covered under Part 4 of the NECB which define the minimum lighting power
density7 (LPD) requirements, which for this study were calculated on a whole building basis. In cases
where there were two distinctive space types within one building, for example the warehouse building had
a well-defined warehouse area and office area, the relevant LPD for each building type was applied.
A comparison table detailing the differences between the lighting power density requirements for both the
MNECB and NECB by building types is located in Appendix B, whilst each building’s summarized model
inputs are detailed in located in Appendix C.
4.5 FINANCIAL IMPACT OF CODE ADOPTION
4.5.1 Baseline Costs
To evaluate the financial impact of adopting NECB in Newfoundland and Labrador, costs for current
construction practice had first to be established. Costs were developed using the RS Means CostWorks
estimating software. This cost estimating software is updated quarterly to reflect the latest market trends
in construction material and labour costs and costs for Q1, 2013 were therefore used. Building type,
construction and floor area were inputted into CostWorks for each archetype to get the basic construction
costs. Please note that CostWorks does not contain a Labrador City location where one of the study
buildings was located, therefore the St John’s location was used and the costs multiplied by 50%, as a
crude estimate, to reflect the increase in construction materials and labour cost. A detailed breakdown of
these costs is available in Appendix E.
4.5.2 NECB Costs
The baseline costs were adjusted to take into account the changes to comply with the NECB. A percentage
increase in the cost of the various envelopes, mechanical and lighting elements was calculated using a
combination of CostWorks and local knowledge.
7 Lighting Power Density (LPD) is a measure of the installed lighting power (wattage) per unit area (typical units are W/m2 and W/ft2).

COST-BENEFIT ANALYSIS OF IMPLEMENTING THE 2011 NATIONAL ENERGY CODE FOR
BUILDINGS IN NEWFOUNDLAND AND LABRADOR
4.7
4.5.3 Operating Cost Savings
Energy savings are combined with energy price data to estimate annual savings. Electricity rates are
assumed to increase by 3.78% per year to 2016 and then 2.65% per year thereafter8, whilst fuel oil rates
are assumed to rise by 3.75% per year.
To simplify the financial analysis, electricity price forecasts have been “levelized” – in other words, an
average energy price was developed over the study period of 25 years, accounting for inflation. The
levelized electricity and fuel oil prices are summarized in Table 4-3.
Table 4-3: Levelized Cost of Electricity and Fuel Oil
Fuel Levelized Cost
Electricity (Newfoundland) $0.1452/kWh
Electricity (Labrador) $0.0365/kWh
Fuel Oil $0.1814/equivalent kWh
4.5.4 Project Life
In general, upgrades were assumed to have the same expected life as the baseline assembly. As such,
changes to maintenance and replacement costs were not considered for this study.
4.6 LIMITATIONS
It is important to recognize the limitations of the study to inform how results are interpreted and used in
decision-making. Table 4-4 summarizes some of the key limitations.
Table 4-4: Summary of Study Limitations
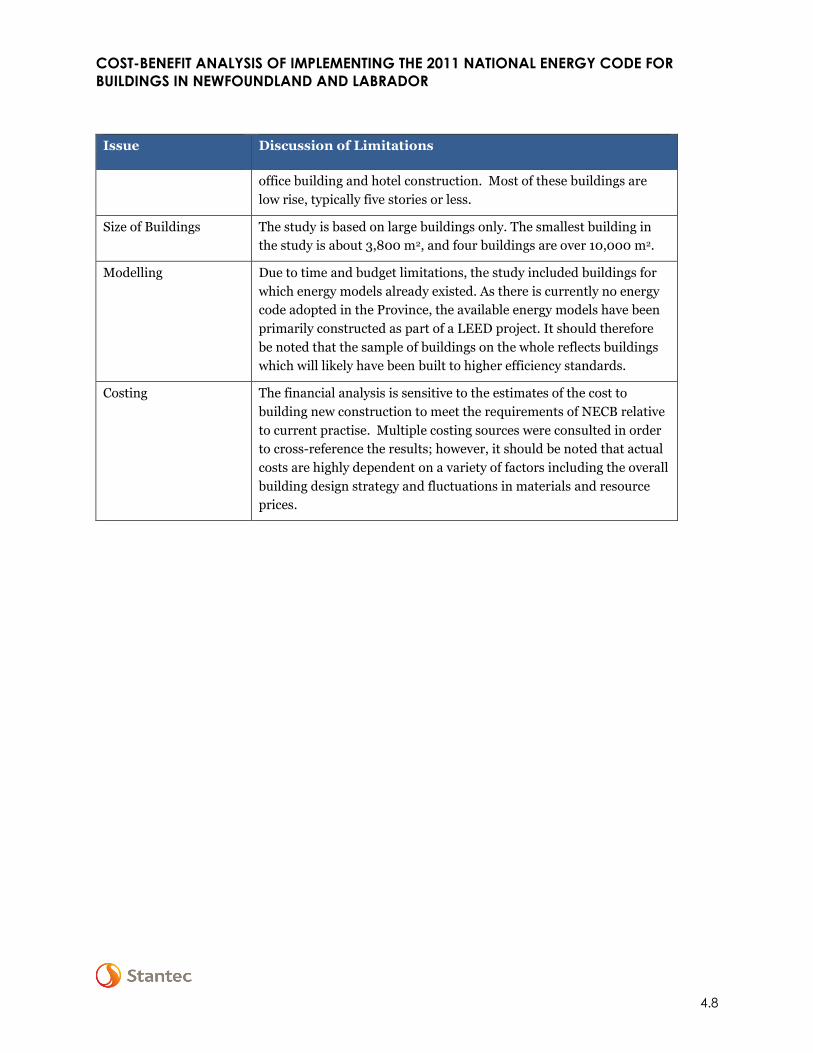
Issue Discussion of Limitations
Sample Size This is a case study approach. Seven buildings were analyzed, but it
must be recognized that there is a wide variation in building design
and associated energy performance across buildings. Some of the
factors attributed to this variation include, but are not limited to: size,
design team, specific space uses and staff who operate the building.
Sample Group There is a narrow profile of buildings recently constructed and
expected to be constructed. The most popular building types include
schools, hospitals, large retail stores and warehouses, with some new
8 Escalation rates calculated from projected rates sited in ‘Electricity Rates Forecasting: Muskrat Falls Will Stabilize Rates for Consumers’ report, released in November 2012: http://www.powerinourhands.ca/pdf/TB_ElectricityRates.pdf
COST-BENEFIT ANALYSIS OF IMPLEMENTING THE 2011 NATIONAL ENERGY CODE FOR
BUILDINGS IN NEWFOUNDLAND AND LABRADOR
4.8
Issue Discussion of Limitations
office building and hotel construction. Most of these buildings are
low rise, typically five stories or less.
Size of Buildings The study is based on large buildings only. The smallest building in
the study is about 3,800 m2, and four buildings are over 10,000 m2.
Modelling Due to time and budget limitations, the study included buildings for
which energy models already existed. As there is currently no energy
code adopted in the Province, the available energy models have been
primarily constructed as part of a LEED project. It should therefore
be noted that the sample of buildings on the whole reflects buildings
which will likely have been built to higher efficiency standards.
Costing The financial analysis is sensitive to the estimates of the cost to
building new construction to meet the requirements of NECB relative
to current practise. Multiple costing sources were consulted in order
to cross-reference the results; however, it should be noted that actual
costs are highly dependent on a variety of factors including the overall
building design strategy and fluctuations in materials and resource
prices.
COST-BENEFIT ANALYSIS OF IMPLEMENTING THE 2011 NATIONAL ENERGY CODE FOR
BUILDINGS IN NEWFOUNDLAND AND LABRADOR
5.1
5.0 Results
The study was approached in phases to understand the impact in terms of energy and cost of the three
elements of the NECB as well as the overall impact.
5.1 SCHOOL AND LONG-TERM CARE FACILITY
The first step of the study was to assess the impact of the different elements of the NECB. The NECB was
divided into three different study areas;
• Envelope
• Lighting
• Mechanical
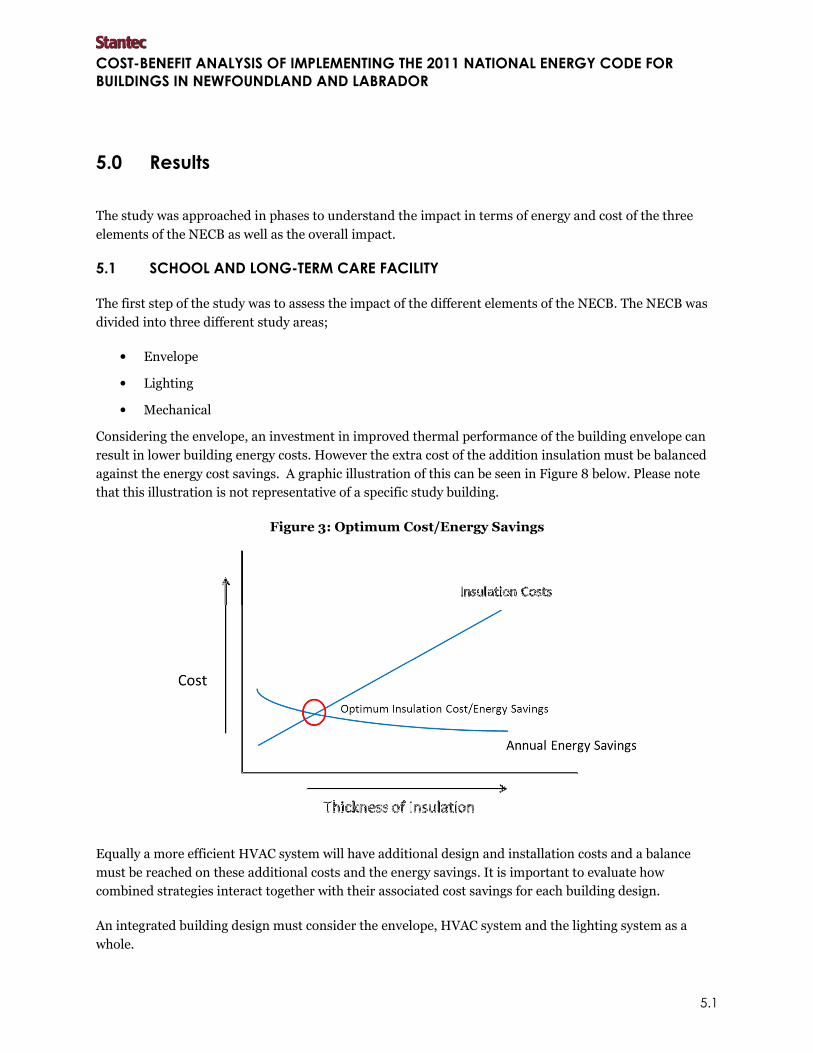
Considering the envelope, an investment in improved thermal performance of the building envelope can
result in lower building energy costs. However the extra cost of the addition insulation must be balanced
against the energy cost savings. A graphic illustration of this can be seen in Figure 8 below. Please note
that this illustration is not representative of a specific study building.
Figure 3: Optimum Cost/Energy Savings
Equally a more efficient HVAC system will have additional design and installation costs and a balance
must be reached on these additional costs and the energy savings. It is important to evaluate how
combined strategies interact together with their associated cost savings for each building design.
An integrated building design must consider the envelope, HVAC system and the lighting system as a
whole.

COST-BENEFIT ANALYSIS OF IMPLEMENTING THE 2011 NATIONAL ENERGY CODE FOR
BUILDINGS IN NEWFOUNDLAND AND LABRADOR
5.2
In the first phase of work, two buildings were chosen from the seven study buildings; the school and long-
term care facility. These two buildings were chosen due to each having different wall construction types
which are detailed in Table 5-1, both of which are commonly used in the province. One of the main
differences in construction between the two buildings is the inclusion of curtain wall in the long-term care
facility whilst the school is mainly brick wall.
Table 5-1: School and Long-Term Care Facilities Constructions
Constructions School Long-Term Care Facility
Roof
Common Roof: 2 ply modified
membrane, RSI 4.0 Continuous
Rigid Insulation, Steel Deck.
Metal Batten Roof: Metal
Covering, 13mm Gypsum Board,
W/Steel Girts, Steel Deck.
Roof construction: Cap Sheet,
3mm Recovery Board, 6mm Glass
Mat Gypsum Board, Tapered
Insulation as Required, 100mm
Polyisocyanurate Insulation, Vapour
Barrier, 13mm Glass Mat Gypsum
Board, Metal Deck, Structural Steel.
Wall
Brick Wall: Brick Facing, 190mm
Concrete Block, 64mm Rigid
Insulation, Brick Facing.
Steel Wall: 190mm Concrete Block,
100mm Rigid Insulation W/Z Bars,
Steel Siding.
Brick Wall: 90mm Concrete Block,
Air Space, 50mm Semi Rigid
Insulation, Masonry Ties, Air Barrier,
13mm Glass Mat Gypsum Board,
152mm Structural Studs(600mm
O.C.), RSI 3.5 Mineral Fiber
Insulation, 0.15mm Polyethylene
Vapor Barrier, 13mm Gypsum Board.
Curtain Wall: Extruded Aluminum,
Thermally Broken, Double Glazed
Curtain Wall Assembly OR Single
Glazed Spandrel Panel;150mm Semi
Rigid Insulation and Metal Back
Pan,64mm Structural Studs (600
O.C.), 2-13mm Gypsum Board.
To study the impact of the different elements of the NECB, multiple scenarios were studied for both the
school and long-term care facility. The scenarios are detailed in Table 5-2. This approach has two
benefits. First, the comparison between the scenarios allows for a detailed breakdown that is not possible
to achieve with doing one simulation where all of the NECB requirements (envelope, mechanical and
lighting system changes) are made. Second, it allows for a comparison between multiple approaches
which highlights the various trade-offs across policy approaches.

COST-BENEFIT ANALYSIS OF IMPLEMENTING THE 2011 NATIONAL ENERGY CODE FOR
BUILDINGS IN NEWFOUNDLAND AND LABRADOR
5.3
Table 5-2: School and Long-Term Care Facility Scenarios
Building
No. Building Study Envelope Mechanical Lighting Description
3
Education:
School
NECB,
ASHPs NECB-2011
NECB-2011
(ASHP) NECB-2011
Baseline building compared against the
NECB performance path applied to the
mechanical systems but with air source
heat pumps (ASHP).
NECB NECB-2011 NECB-2011 NECB-2011
Baseline building compared against the
NECB performance path applied to in its
entirety.
NECB, 7A NECB-2011
(7A)
NECB-2011
(7A)
NECB-2011
(7A)
Baseline building compared against the
NECB performance path with Zone 7A
(instead of Zone 6) applied in its entirety.
NECB,
Base.
Envelope
No Change NECB-2011 NECB-2011
Baseline building compared against the
NECB performance path applied to the
mechanical systems and lighting.
NECB
Envelope NECB-2011 No Change No Change
Baseline building compared against the
baseline building with an NECB envelope.
5
Health:
Long-Term
Care Facility
NECB NECB-2011 NECB-2011 NECB-2011
Baseline building compared against the
NECB performance path applied to it in
its entirety.
NECB, 7A NECB-2011
(7A)
NECB-2011
(7A)
NECB-2011
(7A)
Baseline building compared against the
NECB performance path with Zone 7A
(instead of Zone 6) applied in its entirety.
NECB,
Base.
Envelope
No Change NECB-2011 NECB-2011
Baseline building compared against the
baseline envelope and the NECB
performance path applied to the
mechanical systems and lighting.
NECB
Envelope NECB-2011 No Change No Change
Baseline building is compared against the
baseline building with an NECB envelope.
5.1.1 School Results
Table 5-3 gives the construction cost per m2 for each study scenario, whilst Figure 4 gives the energy use
in kWh/m2. An assessment of payback periods is contained later in Section 5.1.3.

COST-BENEFIT ANALYSIS OF IMPLEMENTING THE 2011 NATIONAL ENERGY CODE FOR
BUILDINGS IN NEWFOUNDLAND AND LABRADOR
5.4
Table 5-3: School: Construction Cost per m2
Building
No. Category Building Study Cost per m2
3 Education School
Baseline $2,101.7
NECB, ASHPs $1,974.2
NECB $1,962.2
NECB, 7A $1,981.1
NECB, Base. Envelope $1,945.9
NECB Envelope* $2,118.0
* The cost per m2 for the NECB envelope is more expensive than the baseline building as more insulation
was required for the NECB envelope. Although other NECB buildings also had more expensive envelopes
the overall costs were balanced by the less costly mechanical and electrical systems.
Figure 4: School: Scenario Results in kWh/m2

COST-BENEFIT ANALYSIS OF IMPLEMENTING THE 2011 NATIONAL ENERGY CODE FOR
BUILDINGS IN NEWFOUNDLAND AND LABRADOR
5.5
The following conclusions can be drawn:
• In four of the five scenarios, the capital construction cost is lower than for the base case. That is,
it would have been less expensive to build the school to meet NECB requirements.
• In four of the five scenarios, however, building to NECB requirements would also have meant
higher annual energy costs than the base building. That is, while capital costs would have been
lower in four scenarios, energy costs on an ongoing basis would have been higher.
• Installing air-source heat pumps (ASHPs) instead of the regular rooftop packaged units as per the
NECB scenario is more expensive overall (total construction costs are $1,974.2/m2 for the ASHP
pathway compared to $1,962.2/m2 for the NECB pathway) but gives more energy savings (it uses
165.98 kwh/m2 compared to 174.05/m2).
• The factor which is having the least impact is changing only the envelope. It is the only scenario
that has reduced energy use relative to the base building but is also the most expensive to
construct. The energy savings are relatively marginal at 2.6% per year per m2.
5.1.2 Long-Term Care Facility Results
Table 5-4 gives the construction cost per m2 for each study scenario, whilst Figure 6 gives the energy use in
kWh/m2.
Table 5-4: Long-Term Care Facility: Cost per m2
Building
No. Category Building Study Cost per m2
5 Health Long-Term Care
Facility
Baseline $2,572
NECB $2,442
NECB, 7A $2,453
NECB, Base. Envelope $2,424
NECB Envelope $2,590

COST-BENEFIT ANALYSIS OF IMPLEMENTING THE 2011 NATIONAL ENERGY CODE FOR
BUILDINGS IN NEWFOUNDLAND AND LABRADOR
5.6
Figure 5: Long-Term Care Facility: Scenario Results in kWh/m2
The Long-Term Care Facility had similar results to the school. That is, to meet NECB requirements,
capital construction costs would decrease in most cases but energy use would increase. The only
exception to this relates to the NECB Envelope scenario in which construction cost increases and energy
use decreases (for the long-term care facility, there is a marginal decline of 0.2% in energy consumption
per year per m2).
In looking at the nine scenarios for both the school and the long-term care facility, the main findings are
that it is less expensive to build to NECB requirements (seven of nine scenarios) but energy use is higher
(seven of nine scenarios).
5.2 OVERALL BUILDING RESULTS
As both the school and long-term care facility gave similar results, the second phase of the study was to
assess the overall impact of the NECB. The school and long-term care facility detailed studies assessed the
impacts of both zone 6 and 7A NECB envelope thermal characteristics (zone 7A has more stringent
requirements). As the study buildings chosen met the requirements of zone 6 and the difference between
Zone 6 and 7A in terms of the savings ratio was minimal, the remaining buildings the remaining buildings
were assessed using Zone 7A requirements to see if they still met the NECB requirements.
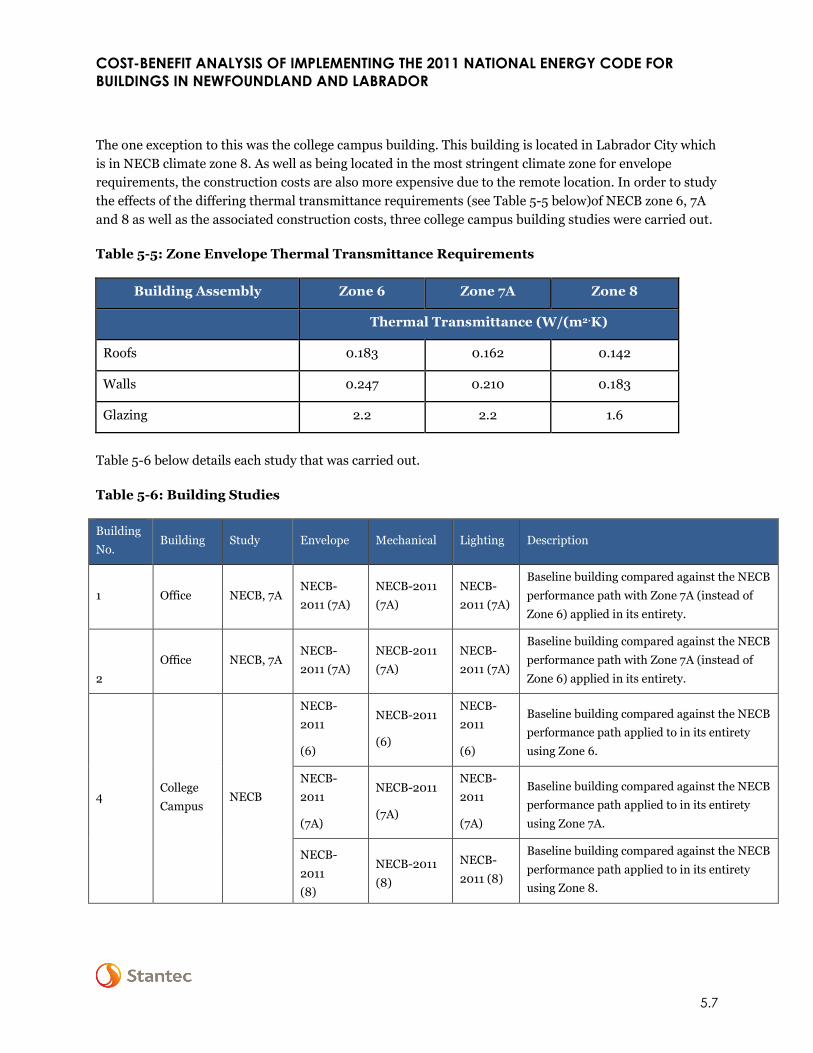
COST-BENEFIT ANALYSIS OF IMPLEMENTING THE 2011 NATIONAL ENERGY CODE FOR
BUILDINGS IN NEWFOUNDLAND AND LABRADOR
5.7
The one exception to this was the college campus building. This building is located in Labrador City which
is in NECB climate zone 8. As well as being located in the most stringent climate zone for envelope
requirements, the construction costs are also more expensive due to the remote location. In order to study
the effects of the differing thermal transmittance requirements (see Table 5-5 below)of NECB zone 6, 7A
and 8 as well as the associated construction costs, three college campus building studies were carried out.
Table 5-5: Zone Envelope Thermal Transmittance Requirements
Building Assembly Zone 6 Zone 7A Zone 8
Thermal Transmittance (W/(m2·K)
Roofs 0.183 0.162 0.142
Walls 0.247 0.210 0.183
Glazing 2.2 2.2 1.6
Table 5-6 below details each study that was carried out.
Table 5-6: Building Studies
Building
No. Building Study Envelope Mechanical Lighting Description
1 Office NECB, 7A NECB-
2011 (7A)
NECB-2011
(7A)
NECB-
2011 (7A)
Baseline building compared against the NECB
performance path with Zone 7A (instead of
Zone 6) applied in its entirety.
2
Office NECB, 7A NECB-
2011 (7A)
NECB-2011
(7A)
NECB-
2011 (7A)
Baseline building compared against the NECB
performance path with Zone 7A (instead of
Zone 6) applied in its entirety.
4 College
Campus NECB
NECB-
2011
(6)
NECB-2011
(6)
NECB-
2011
(6)
Baseline building compared against the NECB
performance path applied to in its entirety
using Zone 6.
NECB-
2011
(7A)
NECB-2011
(7A)
NECB-
2011
(7A)
Baseline building compared against the NECB
performance path applied to in its entirety
using Zone 7A.
NECB-
2011
(8)
NECB-2011
(8)
NECB-
2011 (8)
Baseline building compared against the NECB
performance path applied to in its entirety
using Zone 8.

COST-BENEFIT ANALYSIS OF IMPLEMENTING THE 2011 NATIONAL ENERGY CODE FOR
BUILDINGS IN NEWFOUNDLAND AND LABRADOR
5.8
Building
No. Building Study Envelope Mechanical Lighting Description
6 MURB NECB, 7A NECB-
2011 (7A)
NECB-2011
(7A)
NECB-
2011 (7A)
Baseline building compared against the NECB
performance path with Zone 7A (instead of
Zone 6) applied in its entirety.
7 Warehous
e NECB, 7A
NECB-
2011 (7A)
NECB-2011
(7A)
NECB-
2011 (7A)
Baseline building compared against the NECB
performance path with Zone 7A (instead of
Zone 6) applied in its entirety.
5.2.1 Baseline Energy Results
Current practice energy use intensity by study building is presented in Table 5-7. Results are reported in
equivalent kilowatt hours per square meter per year (kWh/m2/year), a common set of units when
reporting energy intensity.
Table 5-7: Baseline Energy Utilization
kWh/m2/Year
Building
No. Category Building Cooling Heating
Service
Hot
Water
Ventilation Pumps Misc.
Equip. Lights Total
1 Office
- 16 21 7 5 42 31 11 134
2 - 28 33 0 23 34 25 36 179
3
Education
School 5 68 9 9 9 9 17 125
4 College
Campus 19 192 53 70 38 38 37 447
5 Health
Long-
term
Care
Facility
1 27 4 35 19 26 70 183
6 MURB - 0 76 21 96 0 7 15 216
7 Warehouse - 1 58 1 4 0 21 11 97
The college campus, multi-unit residential building and long-term care facility buildings are the most
energy intensive buildings, while the warehouse, school and office buildings are the least energy intensive.
The college campus is a somewhat unique building within the buildings selected, given its location

COST-BENEFIT ANALYSIS OF IMPLEMENTING THE 2011 NATIONAL ENERGY CODE FOR
BUILDINGS IN NEWFOUNDLAND AND LABRADOR
5.9
(climate zone 8) and the fact that, as a post-secondary training campus, it requires ventilation systems
and specialized equipment not normally required in other buildings.
5.2.2 NECB Energy Results
Based on the upgrades, Table 5-8 summarizes the NECB scenario energy utilization intensity. A heat
rejection (heat rejected from a cooling tower) column has been added to the NECB results table which was
not featured in the baseline results. This is due to none of the baseline buildings having a cooling tower.
Table 5-8: NECB Energy Utilization
kWh/m2/Year
Building
No. Category Building Study Cooling
Heat
Reject Heating
Service
Hot
Water
Ventilation Pumps Misc.
Equip Lights Total
1 Office
- NECB, 7A 6 3 86 6 5 11 31 25 176
2 - NECB, 7A 15 0 129 0 33 37 25 28 268
3
Education
School
NECB,
ASHPs 10 0 73 9 46 2 9 17 166
4
NECB 15 0 76 9 41 6 9 19 174
NECB, 7A 15 0 73 9 41 6 9 19 171
NECB, Base.
Envelope 16 0 87 9 42 6 9 19 187
NECB
Envelope 5 0 65 9 8 9 9 17 122
College
Campus
NECB, 6 2 0 204 53 71 35 38 29 432
NECB, 7A 2 0 197 53 70 35 38 29 424
NECB, 8 2 0 191 53 69 35 38 29 416
5 Health
Long-
term
Care
Facility
NECB 1 0 87 4 35 8 26 44 206
NECB, 7A 1 0 86 4 35 8 26 44 205
NECB, Base.
Envelope 1 0 89 4 35 8 26 44 208
NECB
Envelope 1 0 26 4 35 19 26 70 183
6 MURB - NECB, 7A 0 0 138 21 52 0 7 16 235
7 Warehous - NECB, 7A 1 0 47 1 12 1 21 16 98
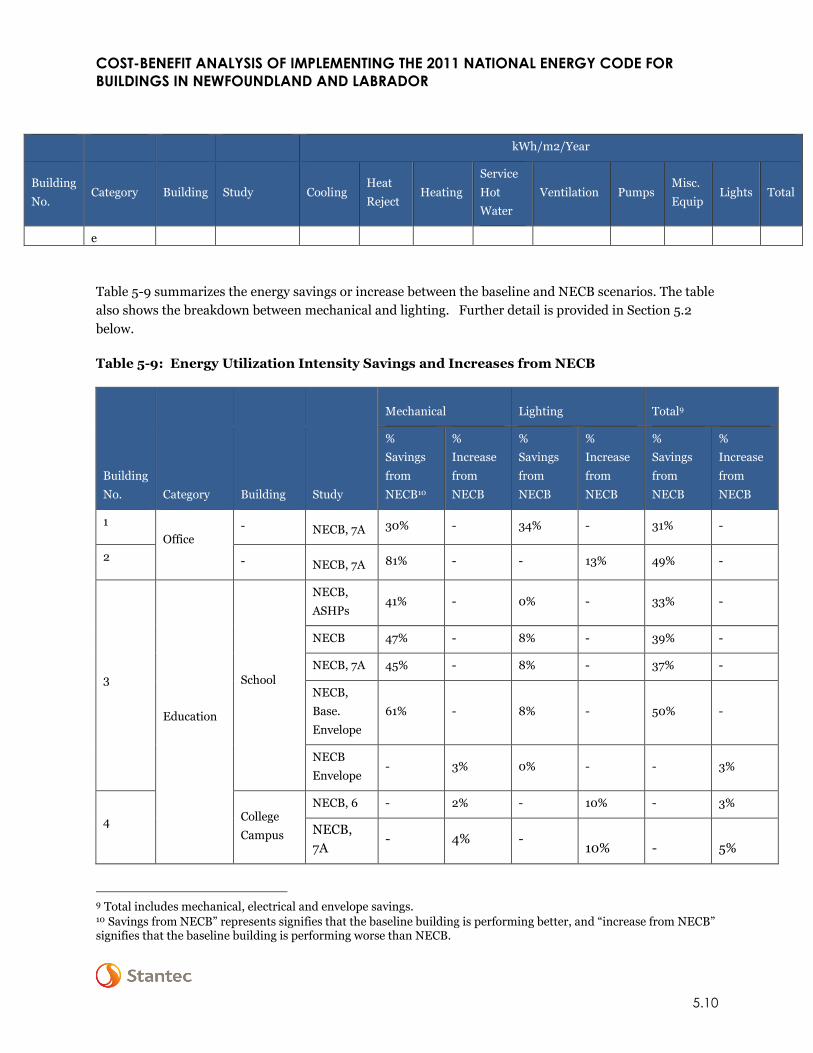
COST-BENEFIT ANALYSIS OF IMPLEMENTING THE 2011 NATIONAL ENERGY CODE FOR
BUILDINGS IN NEWFOUNDLAND AND LABRADOR
5.10
kWh/m2/Year
Building
No. Category Building Study Cooling
Heat
Reject Heating
Service
Hot
Water
Ventilation Pumps Misc.
Equip Lights Total
e
Table 5-9 summarizes the energy savings or increase between the baseline and NECB scenarios. The table
also shows the breakdown between mechanical and lighting. Further detail is provided in Section 5.2
below.
Table 5-9: Energy Utilization Intensity Savings and Increases from NECB
Building
No. Category Building Study
Mechanical Lighting Total9
%
Savings
from
NECB10
%
Increase
from
NECB
%
Savings
from
NECB
%
Increase
from
NECB
%
Savings
from
NECB
%
Increase
from
NECB
1
Office - NECB, 7A 30% - 34% - 31% -
2 - NECB, 7A 81% - - 13% 49% -
3
Education
School
NECB,
ASHPs 41% - 0% - 33% -
NECB 47% - 8% - 39% -
NECB, 7A 45% - 8% - 37% -
NECB,
Base.
Envelope
61% - 8% - 50% -
NECB
Envelope - 3% 0% - - 3%
4 College
Campus
NECB, 6 - 2% - 10% - 3%
NECB,
7A - 4% -
10% - 5%
9 Total includes mechanical, electrical and envelope savings. 10 Savings from NECB” represents signifies that the baseline building is performing better, and “increase from NECB” signifies that the baseline building is performing worse than NECB.

COST-BENEFIT ANALYSIS OF IMPLEMENTING THE 2011 NATIONAL ENERGY CODE FOR
BUILDINGS IN NEWFOUNDLAND AND LABRADOR
5.11
Building
No. Category Building Study
Mechanical Lighting Total9
%
Savings
from
NECB10
%
Increase
from
NECB
%
Savings
from
NECB
%
Increase
from
NECB
%
Savings
from
NECB
%
Increase
from
NECB
NECB, 8 - 6% - 10% - 7%
5 Health
Long-
Term Care
Facility
NECB 57% - - 27% 13% -
NECB, 7A 56% - - 27% 12% -
NECB,
Base.
Envelope
60% - - 27% 14% -
NECB
Envelope 0% - 0% - 0% -
6 MURB - NECB, 7A 9% - 5% - 9% -
7 Warehouse - NECB, 7A - 4% 13% - 1% -
The key points are:
• For the school, the baseline building performed better in four of the five identified scenario, that
is, the energy intensity in the baseline building is lower in four of the five scenarios. The
exception was the NECB envelope scenario.
• For the long-term care facility, the baseline building performed better in three of four scenarios,
and performed equally as well in the remaining scenario (i.e., the NECB Envelope scenario).
• For four of the remaining five buildings, that is, the office buildings, MURB and warehouse, the
baseline building performed better than the NECB-7A scenario. In the case of the warehouse,
however, the difference is marginal at 1 ekWh/m2/year.
• For the remaining building, the college campus, the NECB scenario performed better than the
baseline building. The main drivers of the improvement for the NECB scenario were cooling and
lighting.
• From a component perspective, the baseline buildings perform generally perform better in terms
of mechanical systems and lighting. In 11 of the 16 total scenarios in this study, the mechanical
systems in the base building were better than in the policy scenario. For lighting, the base
building performed as well or better in 9 of 16 scenarios.
As discussed previously in section 4.1, the building selection was limited to those buildings for which
energy models are available. Additionally, a prerequisite of LEED is that the building has to perform at
minimum, 25% better than the MNECB reference building. Buildings striving to achieve LEED Silver, as
COST-BENEFIT ANALYSIS OF IMPLEMENTING THE 2011 NATIONAL ENERGY CODE FOR
BUILDINGS IN NEWFOUNDLAND AND LABRADOR
5.12
required by the Build Better Buildings Policy, would typically be targeting energy savings greater than the
LEED requirements.
Most of the study baseline buildings are showing to be performing better than NECB, as they typically
incorporate a relatively good thermal building envelope, heat recovery ventilation, efficient lighting and
controls.
The percentage savings or increases in Table 5-9 differ from building -to -building. It is important to
remember that the NECB performance path building’s heating and cooling plant (if applicable) and
lighting are dependent on the original building’s function, therefore it is not a one-size-fits-all analysis.
For example, building 1 has mostly office areas and is over two storeys in height; therefore as per the
NECB performance path, system 6 is chosen for the NECB building. This is a multi-zone built up system
with variable volume fan controls, a water cooled screw chiller, electric coils in AHU’s and electric
resistance baseboard. This is different to building 7 which has an office area which is less than 2 storeys
and a non-refrigerated warehouse area. As per the NECB performance path, system 3 is chosen for the
NECB building in the office area, which is a single zone packaged rooftop unit with electric baseboard
heating. System 4 is chosen for the warehouse area, which is a single zone constant volume make-up air
unit with electric baseboard heating. Further details on NECB HVAC System Selection and the system
chosen for each building in this study can be found in Appendix B and C.
5.2.3 Impact by Building
Table 5-10 summarizes the construction cost increase/decrease between the baseline and NECB scenarios
as well as the energy cost difference and, where appropriate, the discounted payback which takes into
account the discount and escalation rates and the savings to ratio investment.
The concept of a payback period is that higher incremental construction costs to achieve an objective are
offset by lower incremental operational costs on an annual basis. At some future point, cumulative
incremental operational savings will exceed incremental construction costs, meaning that the building
owner will be better off after an initial payback period.
A simple payback period is defined as the number of years it would take to recover a project’s costs in
todays’ value of money. It does not incorporate aspects such as the time value of money and the cost of
borrowing money. A discounted payback period is defined as the number of years it would take to recover
a project’s costs taking into account the time value of money and the cost of borrowing money (escalation
and the discount rate). This is expressed in Table 5-10. The discount rate is an investors cost of
borrowing money, and the escalation rate is the annual rate of increase in the price of a specific
commodity such as electricity or fuel oil. Also included in the table is the net present value (NPV) at 25
years for each scenario and for each respective baseline building. The NPV at 25 years is the present value
of total cash inflows from a project over 25 years, less cash outflows over that period, accounting for
inflation and interest.

COST-BENEFIT ANALYSIS OF IMPLEMENTING THE 2011 NATIONAL ENERGY CODE FOR
BUILDINGS IN NEWFOUNDLAND AND LABRADOR
5.13
Table 5-10: Summary of Impacts
Study
Change
in
Energy
Costs
Change in
Construction
Costs
Discount
Payback
Period
Discount
Payback
Period
at which
time
building
owner
will be
worse
off
NPV
At 25 Years
Baseline
Building
NPV
At 25 years
Scenario
Building
Change in NPV
Using base building as
starting point Years
Relative to
Baseline building
Office
Building 1,
NECB 7A
$84,332 -$508,464 6.9 $34,652,697 $35,429,261 $776,564
Office
Building 2 ,
NECB 7A
$206,039 -$962,345 4.5 $35,590,660 $37,767,703 $2,177,043
School,
NECB,
ASHPs
$35,770 -$769,808 34.2 $14,536,365 $14,371,549 -$164,816
School,
NECB $42,843 -$885,652 7.0 $14,536,365 $14,375,299 -$161,066
School ,
NECB 7A $40,563 -$816,637 32.5 $14,536,365 $14,405,759 -$130,606
School,
NECB
Baseline
Envelope
$54,430 -$940,370 19.8 $14,536,365 $14,516,549 -$19,816
School,
NECB
Envelope
-$2,866 $54,717 29.4 $14,536,365 $14,542,606 $6,241
College
Campus,
NECB 6
-$2,491 -$29,639 14.5 $22,452,687 $22,380,924 -$71,763
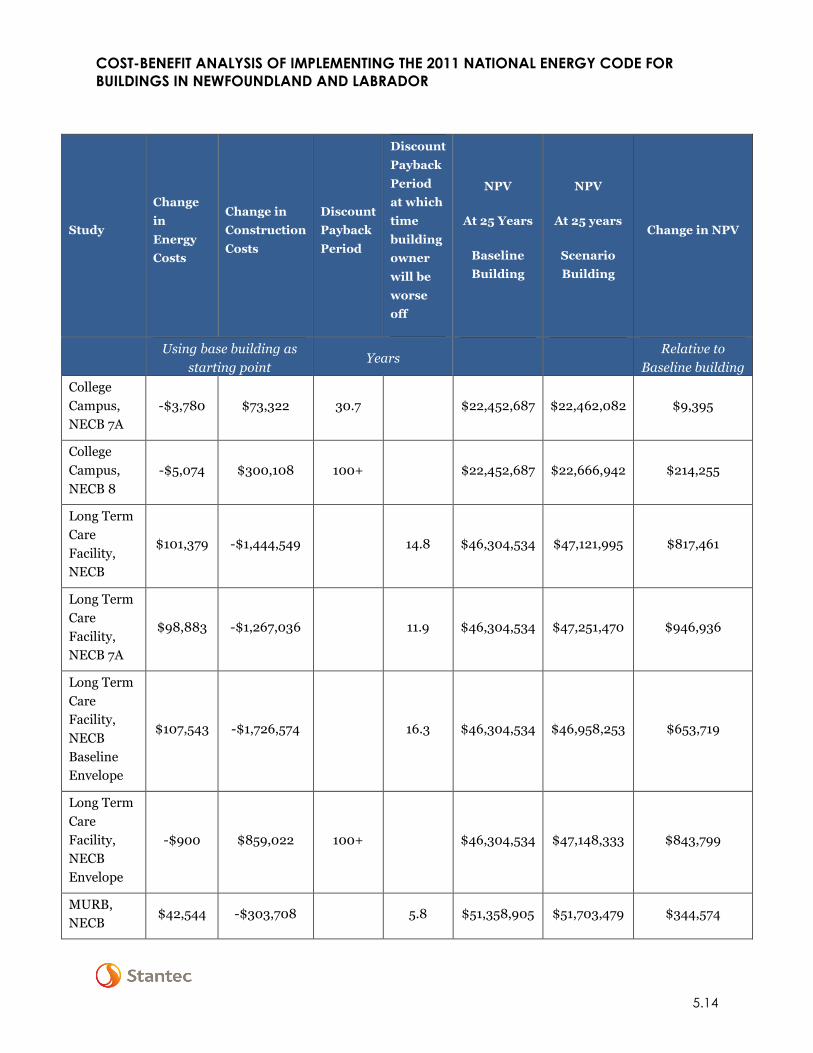
COST-BENEFIT ANALYSIS OF IMPLEMENTING THE 2011 NATIONAL ENERGY CODE FOR
BUILDINGS IN NEWFOUNDLAND AND LABRADOR
5.14
Study
Change
in
Energy
Costs
Change in
Construction
Costs
Discount
Payback
Period
Discount
Payback
Period
at which
time
building
owner
will be
worse
off
NPV
At 25 Years
Baseline
Building
NPV
At 25 years
Scenario
Building
Change in NPV
Using base building as
starting point Years
Relative to
Baseline building
College
Campus,
NECB 7A
-$3,780 $73,322 30.7 $22,452,687 $22,462,082 $9,395
College
Campus,
NECB 8
-$5,074 $300,108 100+ $22,452,687 $22,666,942 $214,255
Long Term
Care
Facility,
NECB
$101,379 -$1,444,549 14.8 $46,304,534 $47,121,995 $817,461
Long Term
Care
Facility,
NECB 7A
$98,883 -$1,267,036 11.9 $46,304,534 $47,251,470 $946,936
Long Term
Care
Facility,
NECB
Baseline
Envelope
$107,543 -$1,726,574 16.3 $46,304,534 $46,958,253 $653,719
Long Term
Care
Facility,
NECB
Envelope
-$900 $859,022 100+ $46,304,534 $47,148,333 $843,799
MURB,
NECB $42,544 -$303,708 5.8 $51,358,905 $51,703,479 $344,574

COST-BENEFIT ANALYSIS OF IMPLEMENTING THE 2011 NATIONAL ENERGY CODE FOR
BUILDINGS IN NEWFOUNDLAND AND LABRADOR
5.15
Study
Change
in
Energy
Costs
Change in
Construction
Costs
Discount
Payback
Period
Discount
Payback
Period
at which
time
building
owner
will be
worse
off
NPV
At 25 Years
Baseline
Building
NPV
At 25 years
Scenario
Building
Change in NPV
Using base building as
starting point Years
Relative to
Baseline building
Warehouse,
NECB 7A $799 -$32,000 100+ $4,949,591 $4,929,760 -$19,831
In this study, the payback period concept applies in five scenarios only; School NECB Envelope, College
Campus NECB 6, 7A & 8, and Long term Care Facility NECB Envelope. For the remaining 11 scenarios,
lower incremental construction costs to meet NECB requirements will result in higher annual energy
costs. This means that the building owners will realize the benefits of the lower construction costs for only
6.9 years before the effect of higher utility costs will start to take over. For example, for building 1, there
will be a positive return for the first 6.9 years only, that is, cumulative incremental energy cost increases
($84,337 per year before escalation) will not offset incremental construction costs savings ($508,464
before discounting) for the first 6.9 years. Therefore, for years 1 to 6.9, the building owner will be better
off, but from year 7 forward, the building owner will be worse off under the NECB policy scenario.
For 12 of the 16 scenarios, the baseline building is more expensive than the policy scenario. This means
that capital construction costs would be lower to construct a building that met the NECB requirements.
These findings show that, generally, while it is less expensive to build to NECB requirements, energy use
is higher.
The college campus is located in Labrador City and for which the NECB climate zones 6, 7A and 8 were
studied. It can be seen that by using the reduced thermal transmittance values of zones 6 and 7A, it does
reduce the discount payback period, however the baseline building is never better in energy or
construction costs than the NECB building, although by using the less stringent climate zones, it is closer
to meeting the NECB standard. This does not mean that no building built in Labrador City will meet the
NECB standard, as due to the study limitations, only one existing building model was available. However,
further investigation is advised, as the increased construction costs (because of the remote location) will
have a greater bearing on the discount payback period than if the building was in a populated area, such
as St. John’s.

COST-BENEFIT ANALYSIS OF IMPLEMENTING THE 2011 NATIONAL ENERGY CODE FOR
BUILDINGS IN NEWFOUNDLAND AND LABRADOR
5.16
5.3 MECHANICAL AND LIGHTING SYSTEMS
The buildings targeted in this study incorporate a wide range of energy efficient HVAC systems. Several
facilities utilize heat recovery to extract heat exhausted from the building from washrooms and kitchens.
In addition, some facilities also incorporate demand control ventilation into their HVAC systems through
the use of CO2 sensors.
Several facilities also incorporate the use of geothermal heat pumps11 to supply heating and cooling to the
building. Some facilities, through the use of heat exchangers, use the heat extracted from the ground
source heat pumps to supply hydronic fluid to infloor heating systems. Other systems use the heat pumps
to supply heating and cooling capabilities to heating coils in the air handling units. In addition, one
building took advantage of the geographical location by using sea water to provide cooling for packaged
Chillers/Heat Pumps via Shell & Tube Exchangers. Summarized model inputs are detailed in located in
Appendix C.
Figure 6: Mechanical Systems Utilization Intensity
The graph above details the energy utilization intensity for the mechanical equipment. Each scenario
depicts the baseline building against the same building that has had the NECB performance path using
Zone 7A (instead of Zone 6) applied to it in its entirety. The lower the utilization intensity in
kwh/m2/year, the better the building is performing. Due to the wide range of energy efficient HVAC
measures described above it can be seen from the above Figure 9, that five of the seven buildings featured
11 A geothermal heat pump or ground source heat pump (GSHP) is a heating and/or cooling system that pumps heat to or from the ground.

COST-BENEFIT ANALYSIS OF IMPLEMENTING THE 2011 NATIONAL ENERGY CODE FOR
BUILDINGS IN NEWFOUNDLAND AND LABRADOR
5.17
in the study are surpassing the requirements of the NECB. That is, in five of seven cases, the utilization of
the baseline building is lower than that for the NECB.
5.3.1 Lighting Systems
The graph below details the energy utilization intensity for the lighting. Each scenario depicts the baseline
building against the same building that has had the NECB performance path using Zone 7A (instead of
Zone 6) applied to it in its entirety. As with the mechanical utilization intensity graph, the lower the
utilization intensity in kwh/m2/year, the better the building is performing. However as Figure 10 shows,
four of the seven buildings featured in the study are surpassing the requirements of the NECB. That is, in
four of seven cases, the lighting utilization of the baseline building is lower than that for the NECB.
Figure 7: Lighting Utilization Intensity

COST-BENEFIT ANALYSIS OF IMPLEMENTING THE 2011 NATIONAL ENERGY CODE FOR
BUILDINGS IN NEWFOUNDLAND AND LABRADOR
Discussion
6.1
6.0 Discussion
6.1 LOCAL CONTEXT
Within the province, there are challenges to be addressed with regards to adopting the NECB:
There are high costs for building materials. Almost all building materials have to be transported to the
province by ship with local distribution by road freight. Given the transportation network in the province,
as well as long distances between towns, particularly in Labrador, building developers in rural areas often
incur higher building costs. Crude estimates suggest, for example, that construction costs in Labrador
City tend to be about 50% higher than for the St. John’s area.
Within the province, about 42% of the population lives in St. John’s and 6 other cities and towns with a
population of 10,000 or more. Conversely, 47% of the population lives in municipalities or
unincorporated areas with a population of less than 2,500 people. It is reasonable to expect that there
will be greater challenges in adopting the NECB faced by these areas of Newfoundland and Labrador with
less densely populated areas because there are a limited number of commercial buildings being
constructed in these areas, and municipal councils may not have sufficient financial capacity to invest in
skills training and active compliance measures.
Newfoundland and Labrador has no current energy code requirement for large commercial buildings
(greater than 600 m2 or 3 stories). Although for the most part, the study buildings had good mechanical
and lighting systems, none of the buildings surpassed the NECB envelope thermal characteristic
requirements under the prescriptive route even though all buildings have been built as part of the LEED
initiative which typically calls for a better performing envelope. If the Province were to adopt the envelope
requirements of the NECB under the prescriptive route only, there would be a leap from very little
thermal requirements in the external wall assemblies to the stringent requirements of the NECB code.
However, the flexibility inherent in the NECB allows the designer to achieve energy savings from an
overall building perspective.
6.2 MECHANICAL AND LIGHTING SYSTEMS AND BUILDING ENVELOPE
The buildings used in this study have been registered with LEED and are therefore typically built to have
good overall energy efficiency due to the LEED energy performance requirements. The buildings are
shown to be mostly performing better than NECB, as the baseline buildings typically incorporate a
relatively good thermal building envelope, heat recovery ventilation, efficient lighting and controls.
Additionally, some buildings have a ground source or air source heat pump, further reducing demand on
the building’s electrical system. However the study can draw conclusions on what elements of the NECB
have the biggest impact in terms of energy and cost reduction and payback, that is, it allows for trade-offs
among various policy options to be identified.
It should be noted that LEED does not have prescriptive envelope requirements, however due the overall
building performance criteria, architects are steered towards designing a better performing envelope.

COST-BENEFIT ANALYSIS OF IMPLEMENTING THE 2011 NATIONAL ENERGY CODE FOR
BUILDINGS IN NEWFOUNDLAND AND LABRADOR
Discussion
6.2
As discussed in the results, section 5, the factors which have the largest impact include the mechanical
and lighting systems. Upgrading these systems can be more expensive overall than upgrading the
envelope; however, it has the potential to have a greater impact on energy reduction.
It must also be understood that having too little insulation will also reach a point that is economical
unviable, i.e. the cost of additional energy needed to heat and cool a space will outweigh the advantages of
the original construction cost savings of reducing the building insulation. However envelope design is not
just about the thermal characteristics. Attention should be paid to building siting and orientation, the use
of shading, solar reflectance, air infiltration and the window to wall ratio. These design elements are
important in reducing energy consumption and an integrated building design must consider the envelope,
HVAC system and the lighting system as a whole.
It is important to understand that a building can still meet the NECB energy requirements by using the
calculation methodologies provided in the NECB to trade off a limited number of mandatory
requirements while still demonstrating that the overall energy efficiency of the system has not been
compromised. For example if it was found that it very costly to install insulation to the NECB standards,
by installing mechanical equipment and lighting that performs considerably better than NECB, the overall
energy efficiency of the building can still meet the NECB requirements. In order to demonstrate
compliance, whole building simulation is used.

COST-BENEFIT ANALYSIS OF IMPLEMENTING THE 2011 NATIONAL ENERGY CODE FOR
BUILDINGS IN NEWFOUNDLAND AND LABRADOR
7.1
7.0 Conclusions
In its 2011 Energy Efficiency Action Plan, the provincial government committed to examine the case for
adopting the 2011 National Energy Code for Buildings in Newfoundland and Labrador. The NECB applies
to larger buildings (those over 600m2 in size) which are typically commercial premises or multi-unit
apartment blocks. The rationale for looking at the case for adopting the NECB for the province is that
better energy efficiency can generate multiple benefits, including lowering energy costs.
In order to assess the appropriateness of the NECB for the province, analysis was needed to determine if it
was technically feasible to build to the levels required in the NECB and what the costs and benefits would
be. This study was focused on these issues. It did not explore in detail what training might be needed to
support adoption of the NECB or issues associated with enforcement including capacity constraints and
cost; these important matters are being separately examined.
Given resource constraints, the buildings selected needed to have energy models already developed on
them. These models determine how the energy efficiency buildings are and allowed this study to compare
their actual level of energy efficiency to that required by the NECB. Efforts were made to try and ensure
the selection of building was as diverse as possible in terms of their function, size and location. One of the
limitations is of this study is that there are only a limited number of buildings in the province that have
energy models and the ones that do are usually striving to achieve LEED certification, which means that
they are already incorporating energy efficient features into their design.
The study concluded that:
• It is possible to build to the standard required by the NECB for the four different climate zones (6,
7a, 7b, and 8) in Newfoundland and Labrador using the ‘performance’ path for compliance. In
other words, the overall performance of the building in terms of energy use is at least as good as
the standard required by the NECB but it is up to the building owner to determine how to achieve
this standard. For example, the owner could choose from a better building envelope, more
efficient mechanical and operating systems, more efficient lighting, or a blend of these measures.
• It would be challenging to build to the standard required by the NECB using the prescriptive path
because of the NECB envelope requirements. The prescriptive path is an alternative means of
compliance to the performance path and involves following the requirements laid out in the code
for each of the five building systems (envelope, HVAC, lighting, service water heating and
electrical systems). The study shows that most buildings would have no problem meeting the
HVAC, lighting, service water heating and electrical systems requirements. However given the
commonly used methods of envelope construction in the province, namely concrete block with
rigid insulation and the use of curtain wall, the challenges of meeting the NECB envelope
requirements, especially in the most stringent zones of 7B and 8 would be difficult. The challenges
of complying with the prescriptive path would be to dispense with the aesthetically pleasing
curtain wall and also to persuade the building owners to spend the additional capital required for
COST-BENEFIT ANALYSIS OF IMPLEMENTING THE 2011 NATIONAL ENERGY CODE FOR
BUILDINGS IN NEWFOUNDLAND AND LABRADOR
7.2
greater insulation requirements without perhaps seeing the equivalent cost savings in reduced
energy costs.
• Evidence from NR Can suggests that building more energy efficient buildings in accordance with
the NECB lowers energy costs. However, as shown by the baseline used in this study, it usually
does not lower energy costs as much as building to the standard required to receive Leadership in
Energy and Environmental Design certification. LEED does not have prescriptive architectural,
mechanical and electrical requirements, however, it does have an overall building energy
performance criteria and therefore it is not surprising that LEED buildings are better than an
average building built in the Province.
• This analysis showed that, in almost all scenarios used, the capital construction cost is lower than
for the base buildings which were striving to attain for LEED certification. However, building to
NECB requirements would also have meant higher annual energy costs than the base building.
That is, while capital costs would have been lower in four scenarios, energy costs on an ongoing
basis would have been higher. The analysis also found that installing air-source heat pumps
instead of the regular rooftop packaged units as per the NECB is more expensive to construct but
gives more energy savings. Last, the analysis found that changing only the envelope is having the
least impact.
• Improving the building envelope is an important way to cost-effectively reduce energy use in a
building. However, improvements to the insulation have diminishing returns beyond a certain
point. After this point, it becomes more cost effective to focus on improved mechanical and
operating systems.
Other points to note are:
• There are higher costs for building materials in Labrador due to transportation and distribution
challenges.
• Almost one-half of the province’s population lives in municipalities or unincorporated areas with
a population of less than 2,500 people. It is reasonable to expect that there will be a limited
number of commercial buildings being constructed in these areas.
• The issues of skills training for all groups (designers, construction workers, building inspectors,
etc.) and how to ensure compliance, require further consideration. These factors were not
examined within the parameters of this study and should be considered in a broader dialogue
with stakeholders when considering next steps.
Stantec
APPENDIX A
MNECB versus NECB Comparison

Component Description
Proposed Design
Relative Influence NECB-2011 Reference
General
Climate Zones and Heating
Degree Days As per 1.1.4.1, the climatic values shall be in accordance with the values in the NBC-2010, Appendix C.
Wall R-Value Weather Select appropriate R value based on NEBC-2011 -Table 3.2.2.2. & 3.2.3.1.
Wall ConstructionSame construction as the proposed, Insulation thickness as required to make wall U value equal to
prescriptive requirements.
Roof R-Value Weather Select appropriate R value based on NEBC-2011 -Table 3.2.2.2. & 3.2.3.1.
Roof ConstructionSame construction as the proposed, Insulation thickness as required to make wall U value equal to
prescriptive requirements.
Infiltration Same as Reference.
3.3.4.9 (6) Air leakage shall be set at a constant value of 0.25L/(s.m2) or (0.05 cfm/ft2) of gross above-
ground wall and roof area (see A-8.4.3.4.(3) in Appendix A). Same as Proposed
Glazing Percentage Glazing Percentage
Table A3.2.1.4(1) Max glazing based on HDD, up to a max of 40%. Max. of 5% skylight area to gross roof
area ratio on all above-ground roofs
Window U-value Weather Select appropriate U value based on applicable region found in Table 3.2.2.3
Window Shading Coefficient No requirement.
Shading Devices (Overhangs
and Fins) No requirement.
Lighting
Lighting power allowance based on building type or space function, from Tables 4.2.1.5 or 4.2.1.6
respectively.
Lighting Control - Occupancy
Sensors
Where occupant sensors are required by subsection 4.2.2., the installed interior lighting power shall be
multiplied by an adjustment factor of 0.9.
Lighting Control - Daylight
Sensors
Daylight Sensors required in enclosed space where primary side lighted area > 1,076 sq.ft. Also required
in enclosed space where daylight area under skylights plus daylight area under rooftop monitors > 4,300
sq.ft
Equipment Density Same as reference. Equipment power density based on building type or space function (NECB tables A-8.4.3.3.(1)A)
Fan Power Same as proposed
Outside Air Same as proposed
Heat Recovery Percent outside air. Minimum of 50% when sensible heat content of exhaust exceeds 150 kW.
Economizer
Proposed building and
HVAC System
If proposed requires an economizer, reference economizer dependent on Reference HVAC system type
(table 8.4.4.13(1))
Demand Control Ventilation No requirement
Boiler
Gas/Oil principal heating
source with hydronic
heating.
8.4.4.10.(6) Fuel source same proposed. If proposed Hydronic system >176kW, single-stage boiler.
Capacity >176kW but less than 352kW then 2 boilers equal size or 2 staged boiler that operates in stages
with a 1:2 ratio. Capacity > 352kW mode a fully modulating boiler down to 25% of its capacity. 83%
thermal efficiency.
Furnace
Natural gas or fuel oil
principal heating source
without hydronic heating.
If capacity <66kW, the furnace has two stages of equal capacity, if capacity >66kW, divide the capacity by
66kW and round up. AFUE ≥ 92.4% for ≤ 400,000 Btu/h, 81% Thermal Efficiency for > 400,000 Btu/h
Heat Pumps
Principal heating source as
heat pump, cooling
capacity and heating
mode.
If the proposed HVAC system includes a WATER LOOP heat pump, the reference HVAC will be selected
from Table 8.4.4.8.A. If Proposed HVAC includes air/water or ground source heat pump, reference HVAC
will be air source heat pump as per Table 8.4.4.14
Chiller Hydronic cooling.
Capacity <2100kW model one water chiller. When capacity is >2100kW model two water chillers of equal
capacity. Efficiency as per appropriate table 5.2.12.1.
Cooling Tower If hydronic cooling applies
Capacity <1750kW shall be modeled with one cell. > 1750kW capacity shall be modeled equals proposed
capacity divided by 1750kW, rounded up.
Direct Expansion (DX) Cooling
Cooling source (i.e.,. If
DX).
If capacity <66kW, the furnace shall be modeled with two stages of equal capacity, and when capacity
>66kW, divide the capacity by 66kW and round up. Efficiency as per appropriate table 5.2.12.1.
Heat Pumps
Principal heating source as
heat pump.
If proposed HVAC system includes a water loop heat pump, the reference HVAC will be selected from
Table 8.4.4.8.A. If Proposed HVAC includes air/water or ground source heat pump, reference HVAC will
be air-source heat pump as per Table 8.4.4.14. Efficiency as per appropriate table 5.2.12.1.
Electric Electric resistance at 100% heating efficiency.
Fossil (Natural Gas, Fuel
Oil). Varies from 77% - 80% (NECB table 6.2.2.1)
Heat Pump EF ≥ 2.1 (EF=energy factor, in %/h)
Key Code Changes
Air Handling, Heating Fuel
Type - Principal Heating
Source & Cooling Source
Fan System
HVAC Control
Heating Plant
Building or Space Type Reference HVAC type will one of 7 different types based on building use type as found in Table 8.4.4.8.A
with descriptions of HVAC types found in Table 8.4.4.8.B
Cooling
DHW Heating Fuel Source
Exterior Surfaces
Electrical - Lighting &
Equipment
HVAC System Type

Stantec
APPENDIX B
NECB Mechanical and Lighting Systems

The type of HVAC system assigned to each thermal block of the NECB performance path
building is determined based on each thermal blocks building space type using table 8.4.4.8.A.
with the corresponding descriptions in Table 8.4.4.8.B.
Table 8.4.4.8.A
HVAC System Selection for the Reference Building
Building or Space Type of the Proposed
Building
Size of Building or
Space(1)(2)
Type of HVAC System
Required(3)
Assembly Area: exhibit space,
conference/meeting/multi-purpose
room, performing arts/motion picture
theatre, courtroom
classroom/lecture/training room, place
of worship, fellowship hall, sports
centre, arena and swimming pool
seating area, waiting room
Maximum 4
storeys
System - 3
More than 4
storeys
System - 6
Automotive Area: repair garage or
parking garage, fire engine room,
indoor truck dock, indoor bus or train
platform
All sizes System - 4
Data Processing Area: control room,
data centre
All sizes Where the proposed building or
space has a cooling capacity
exceeding 20 kW, the reference
building or space shall use
System - 2; otherwise, the
reference building or space shall
use System - 1.
General Area: office, banking, health
care clinic, library, retail/mall
concourse, gymnasium, athletic play
area, swimming pool, exercise centre,
dressing room, lighting control room,
atrium
Maximum 2
storeys
System - 3
More than 2
storeys
System - 6
Historical Collections Area: archival
library, museum and gallery archives
All sizes System - 2
Hospital Area: operating theatre,
emergency room, patient/recovery
room, clean room, hospital
laboratories, forensics laboratory
All sizes System - 3

Building or Space Type of the Proposed
Building
Size of Building or
Space(1)(2)
Type of HVAC System
Required(3)
Indoor Arena: ice rinks, curling rinks All sizes System – 7
Industrial Area: industrial
manufacturing and workshop without
dust exhausting hood
All sizes System - 3
Where the reference building or
space is a single zone, it can be
divided into multiple units as
long as it matches the proposed
building or space's units.
Residential/Accommodation Area:
multi-unit residential, hotel/motel
guest room
All sizes Where the proposed building or
space is room heated only, the
reference building or space shall
use System - 1.
Where the proposed building or
space is heated as well as being
cooled with an air-cooled
unitary, packaged terminal or
room air-conditioner (or heat
pumps), or fan coils, the
reference building or space's
HVAC system shall be modeled
as being identical to that of the
proposed building or space;
otherwise, the reference building
or space shall use through-the-
wall systems.
Sleeping Area: dormitory, detention
cell, sleeping quarters
All sizes System - 3
Supermarket/Food Service Area:
grocery store, bar lounge/leisure,
cafeteria, fast food, family dining food
preparation without kitchen hood or
vented appliance(4)
food preparation with kitchen hood or
vented appliance(4)
All sizes
All sizes
System - 3
System - 4
Warehouse Area: fine, medium and All sizes of non- System - 4

Building or Space Type of the Proposed
Building
Size of Building or
Space(1)(2)
Type of HVAC System
Required(3)
bulky material storage, self-storage,
material handling/sorting/baggage
areas
refrigerated space
All sizes of
refrigerated space
System - 5
Notes to Table 8.4.4.8.A.: (1) Spaces generally located in the same vicinity shall be grouped together for the purpose of selecting the reference building's type of HVAC system. (2) Small individual spaces in the proposed building that are located among larger spaces of another space type shall be considered ancillary to that larger space: for example, a conference room serving office spaces would be grouped with the office spaces as one space type. The HVAC system serving that space in the reference building shall be the same as the one for the larger space type. (3) See Table 8.4.4.8.9. for descriptions of HVAC Systems 1 - 7. (4) Vented appliances include, for example, steam dishwashers.
Table 8.4.4.8.B
Descriptions of HVAC Systems 1 - 7
System
Number
Type of HVAC
System
Fan Control
Type
Type of Cooling
System
Type of Heating System(1)
System-1 Unitary air-
conditioner with
baseboard
heating
Constant-
volume
Air-cooled
direct-expansion
with remote
condenser
Hot water with fuel-fired
water boiler or electric
resistance baseboard.
System-2 Four-pipe fan-
coil
Constant-
volume
Water-cooled
water chiller
Fuel-fired or electric
resistance water boiler.
System-3 Single-zone
packaged
rooftop
Constant-
volume
Air-cooled
direct-expansion
Fuel-fired or electric
resistance furnace for rooftop,
hot water with fuel-fired
boiler, or electric resistance
for baseboards.
System-4 Single-zone
make-up air unit
Constant-
volume
Air-cooled
direct-expansion
Make-up air unit: electric or
indirect fuel-fired furnace.
Baseboards: electric
resistance or hydronic with
fuel-fired boiler.
System-5 Two-pipe fan-
coil(2)
Constant-
volume
Water-cooled
water chiller
None
System-6 Multi-zone built-
up system with
baseboard
Variable-
volume
Water-cooled
water chiller
Baseboards: electric
resistance or hydronic with

heating fuel-fired boiler
System-7 Four-pipe fan-
coil(2)
Constant-
volume
Water-cooled
water chiller
Hydronic with electric
resistance or fuel-fired Boiler
Notes to Table 8.4.4.8.B: (1) Where present, humidification systems shall use the same energy source as the heating system. (2) Except for HVAC systems serving dwelling units, outside air requirements for the thermal blocks served by those systems shall be met by a single ventilation system able to meet all the required outside and exhaust air rates. For HVAC systems serving dwelling units, outside air requirements shall be met by a ventilation system identical to that of the proposed building.

The following table presents a comparison between the lighting power density requirements for
both the MNECB and NECB by building type. For building types not listed in table 4.32.1 of the
MNECB, the space function method lighting power densities from table 4.3.3.4 were used.
Lighting Power Density (W/m2)
Building Type MNECB 1997 NECB 2011 % decrease
Automotive facility 3.2 1 8.8 -175%
Convention centre 19.4 2 11.6 40%
Courthouse 19.4 2 11.3 42%
Dining:
bar lounge/leisure
cafeteria/fast food
family
15.1
14
15.1
10.7
9.7
9.6
29%
31%
36%
Dormitory 15.1 3 6.6 56%
Exercise centre 10.8 4 9.5 12%
Fire station 7.5 5 7.6 -1%
Gymnasium 10.8 4 10.8 0%
Health-care clinic 22.6 9.4 58%
Hospital 22.6 13 42%
Hotel 15.1 7 10.8 28%
Library 17.2 8 12.7 26%
Manufacturing facility 26.9 9 11.9 56%
Motel 15.1 7 9.5 37%
Motion picture theatre 16.2 8.9 45%
Multi-unit residential building
15.1 7 6.5 57%
Museum 20.4 11.4 44%
Office 16.2 9.7 40%
Parking garage 3.2 10 2.7 16%
Penitentiary 8.6 10.4 -21%
Performing arts theatre 16.2 15 7%
Police station 8.6 10.3 -20%
Post office 11.8 9.4 20%
Religious building 26.9 11.3 58%
Retail area 22.6 15.1 33%
School/university 18.3 10.7 42%
Sports arena 14 8.4 40%
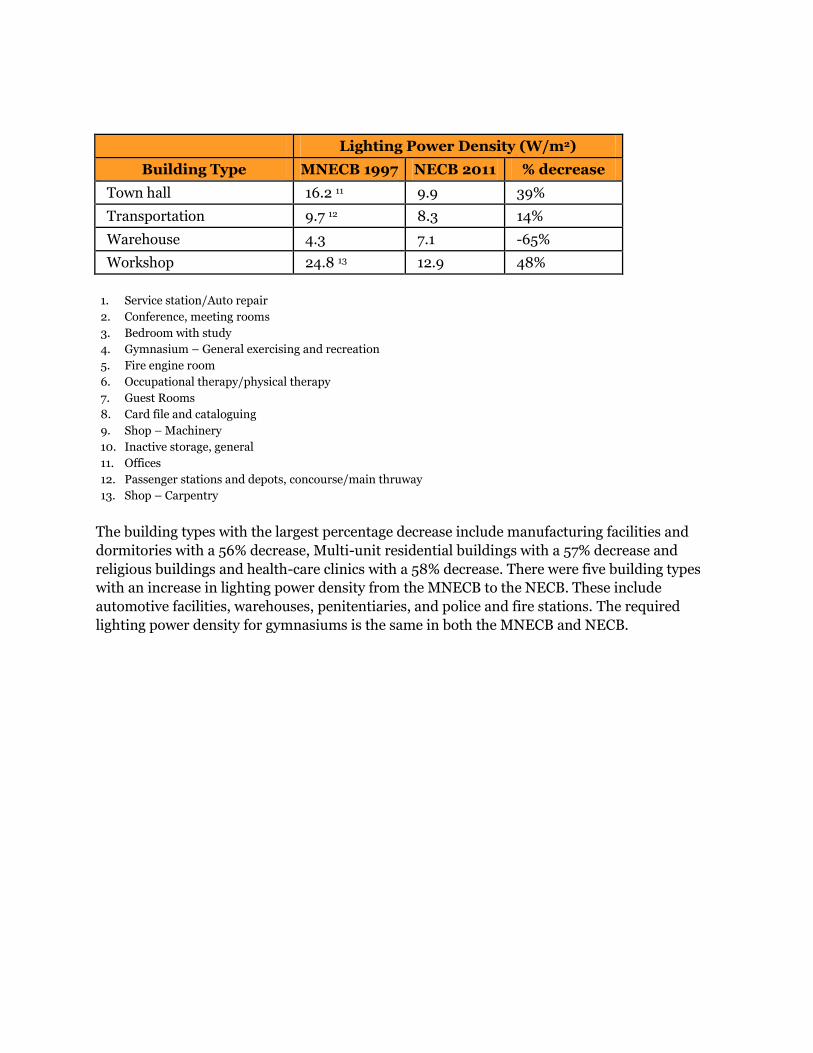
Lighting Power Density (W/m2)
Building Type MNECB 1997 NECB 2011 % decrease
Town hall 16.2 11 9.9 39%
Transportation 9.7 12 8.3 14%
Warehouse 4.3 7.1 -65%
Workshop 24.8 13 12.9 48%
1. Service station/Auto repair
2. Conference, meeting rooms
3. Bedroom with study
4. Gymnasium – General exercising and recreation
5. Fire engine room
6. Occupational therapy/physical therapy
7. Guest Rooms
8. Card file and cataloguing
9. Shop – Machinery
10. Inactive storage, general
11. Offices
12. Passenger stations and depots, concourse/main thruway
13. Shop – Carpentry
The building types with the largest percentage decrease include manufacturing facilities and
dormitories with a 56% decrease, Multi-unit residential buildings with a 57% decrease and
religious buildings and health-care clinics with a 58% decrease. There were five building types
with an increase in lighting power density from the MNECB to the NECB. These include
automotive facilities, warehouses, penitentiaries, and police and fire stations. The required
lighting power density for gymnasiums is the same in both the MNECB and NECB.

Stantec
APPENDIX C
Model Inputs

1. Office
Baseline versus NECB Performance Pathway, Zone 7A
Description of Analysis: The baseline building is compared against a building that has had
the NECB performance path with Zone 7A (instead of Zone 6) applied to it in its entirety.
Parameter Comparison Envelope NECB-2011 (7A) Mechanical NECB-2011 (7A) Lighting NECB-2011 (7A)
Description of Archetype: St. John’s, Avalon, Newfoundland. This facility includes a 12
storey office tower and adjoining parking garage. The parking garage has not been included in
the analysis.
Modelling Software: EE4
Key parameters of archetype:
Model
Parameter
Archetype value
(Baseline)
Archetype Value
(NECB-2011)
Climate Zone and
Heating Degree
Days (HDD 18°C)
Zone 7A, 5000-5999 HDD
Net Floor Area 13,970 m2
Floors 12 above grade
1 below grade
Roof construction
Office Roof Construction: Roofing Membranes, 2 Layers 3mm
Protection Board, 100mm Rigid Insulation, Vapour Retarder, Sloped
Concrete Roof Topping, Concrete Roof Deck.
Mechanical Penthouse Roof Construction: Roofing Membranes, 2
Layers 3mm Protection Board, 100mm Rigid Insulation, Vapour Retarder,
12.5mm Exterior Grade Gypsum Board Sheathing, Metal Deck And Roof
Framing.
Roof U-value
Office Roof Construction: 0.218
W/m²K
Mechanical Penthouse
Construction: 0.226 W/m²K
U= 0.162 W/m²K
Wall construction
Office Wall: Insulated Aluminum Curtain Wall, Minimum 64 kg/m3
Density Mineral Wool Insulation.
Office & Mechanical Penthouse Wall Construction (W5):
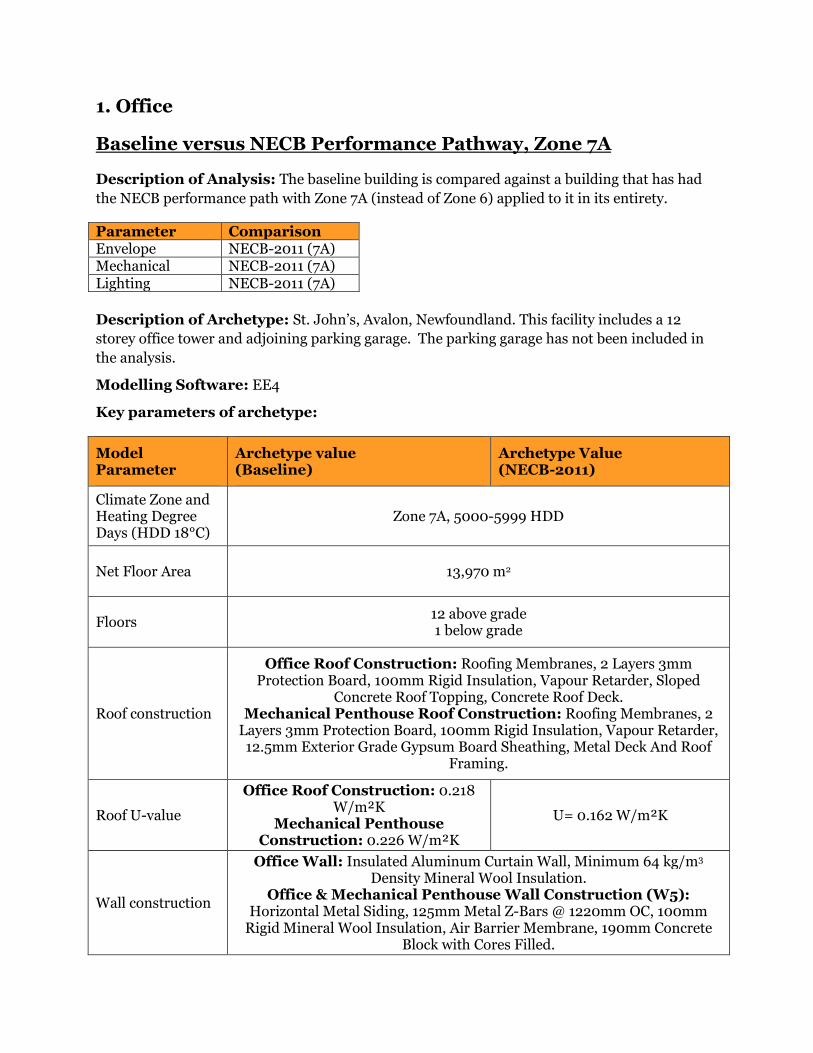
1. Office
Baseline versus NECB Performance Pathway, Zone 7A
Description of Analysis: The baseline building is compared against a building that has had
the NECB performance path with Zone 7A (instead of Zone 6) applied to it in its entirety.
Parameter Comparison Envelope NECB-2011 (7A) Mechanical NECB-2011 (7A) Lighting NECB-2011 (7A)
Description of Archetype: St. John’s, Avalon, Newfoundland. This facility includes a 12
storey office tower and adjoining parking garage. The parking garage has not been included in
the analysis.
Modelling Software: EE4
Key parameters of archetype:
Model Parameter
Archetype value (Baseline)
Archetype Value (NECB-2011)
Climate Zone and Heating Degree Days (HDD 18°C)
Zone 7A, 5000-5999 HDD
Net Floor Area 13,970 m2
Floors 12 above grade 1 below grade
Roof construction
Office Roof Construction: Roofing Membranes, 2 Layers 3mm Protection Board, 100mm Rigid Insulation, Vapour Retarder, Sloped
Concrete Roof Topping, Concrete Roof Deck. Mechanical Penthouse Roof Construction: Roofing Membranes, 2 Layers 3mm Protection Board, 100mm Rigid Insulation, Vapour Retarder, 12.5mm Exterior Grade Gypsum Board Sheathing, Metal Deck And Roof
Framing.
Roof U-value
Office Roof Construction: 0.218 W/m²K
Mechanical Penthouse Construction: 0.226 W/m²K
U= 0.162 W/m²K
Wall construction
Office Wall: Insulated Aluminum Curtain Wall, Minimum 64 kg/m3 Density Mineral Wool Insulation.
Office & Mechanical Penthouse Wall Construction (W5): Horizontal Metal Siding, 125mm Metal Z-Bars @ 1220mm OC, 100mm Rigid Mineral Wool Insulation, Air Barrier Membrane, 190mm Concrete
Block with Cores Filled.

Office & Mechanical Penthouse Wall Construction (W6A&B): Composite Wood Panel, 25mm U-Shape, 100mm Adjustable Metal Z-Bars @ 1220mm OC, 100mm Rigid Mineral Wool Insulation, Air Membrane,
190mm Concrete Block with Cores Filled. Office Exterior Brick Wall: 90mm Face Brick, 25mm Air Space, 100mm Rigid Mineral Wool Insulation, Air/Vapour Barrier, 12.5mm
Exterior Grade Gypsum Board, 152mm Metal Stud Framing (405mm O.C.), 12.5mm Gypsum Board.
Wall U-value
Office Wall: 0.223 W/m²K Office & Mechanical Penthouse Wall Construction (W5): 0.293
W/m²K Office & Mechanical Penthouse Wall Construction (W6A&B):
0.302 W/m²K Office Exterior Brick Wall: 0.274
W/m²K
U= 0.210 W/m²K
Glazing construction
Double Glazing with Thermally Broken Aluminium Frames.
Glazing Properties U-value: 1.41 W/m m²K Shading Coefficient: 0.32
U-value: 2.2 W/m m²K Shading Coefficient: 0.32
Shading No shading (overhangs).
Glazing Percentage 39%
Lighting Power Density
3.7 W/m2 9.7 W/m²
Lighting Controls Occupancy Sensors and Daylight
Sensors in some Areas.
Occupancy Sensors in Office Areas, Conference, Meeting and Training Rooms, Employee Break Rooms, Storage Rooms up to ,
100m2, Enclosed Office Space up to 25m2 and Washrooms/Locker
Rooms.
Plug Loads 7.1 W/m²
Ventilation System AHU #1 (Serves all Levels): Multi-Zone, Variable Air Volume Unit
System - 6: Multi-Zone Built Up System with Variable Volume Fan
Control
Fan Power AHU #1: 1.12 W/l/s
Minimum Outside Air
Per ASHRAE 62.1-2001 Per ASHRAE 62.1-2007

Heat Recovery AHU #1: 0% AHU #1: 50%
Economizers None AHU #1: Dual Enthalpy
Economizer
Demand Control Ventilation
None No Requirement
Heating System Ground Source Water Cooled
Chiller/Heat Pumps with two electric boilers sized for peak heating.
Electric Coils in AHU’s and Electric Resistance Baseboard.
Heating efficiency COP: 3.4 100%
Cooling System Ground Source Water Cooled
Chiller/Heat Pumps
Water Cooled Screw Chiller (modelled as Centrifugal in EE4 due to software limitations)
Cooling efficiency COP: 4.6 COP: 6.1
Domestic Hot Water System
1 Electric Heater, 100% efficient

2. Office
Baseline versus NECB Performance Pathway, Zone 7A
Description of Analysis: The baseline building is compared against a building that has had
the NECB performance path with Zone 7A (instead of Zone 6) applied to it in its entirety.
Parameter Comparison Envelope NECB-2011 (7A) Mechanical NECB-2011 (7A) Lighting NECB-2011 (7A)
Description of archetype: St. John’s, Avalon, Newfoundland. The building consists of six (6)
office floors and six (6) parking levels, with a restaurant and various retail spaces located on the
main street level. The parking levels have not been included in the analysis. The domestic hot
water has also not been included, as there was no domestic hot water modelled in the baseline
building.
Modelling Software: eQUEST
Key parameters of archetype:
Model Parameter
Archetype value (Baseline)
Archetype Value (NECB-2011)
Climate Zone and Heating Degree Days (HDD 18°C)
Zone 7A, 5000-5999 HDD
Net Floor Area 16,096m2
Floors 7 above grade
Roof construction
Roof Construction: 2 Ply SBS Modified Bituminous Membrane Roofing, 2 Layers of Mineral Wool Board Roof Insulation With RSI 0.65/25.4mm, Vapour Retardant, 1 Layer Substrate Board, Structural Metal Deck on
Structural Support Framing.
Roof U-value Roof Construction: 0.183
W/m²K U= 0.162 W/m²K
Wall construction Office Wall Construction: Unitized Curtain Wall System – 60mm Air
Space, 92mm metal studs @406mm OC Max, 13mm Gypsum Board.
Wall U-value Wall Construction: 0.187
W/m²K U = 0.210 W/m²K
Glazing construction
Double Glazing with Thermally Broken Aluminium Frames.

Glazing Properties U-value: 1.39 W/m m²K Shading Coefficient: 0.45
U-value: 2.2 W/m m²K Shading Coefficient: 0.45
Shading No shading (overhangs)
Glazing Percentage 34%
Lighting Power Density
11.80 W/m² 9.7 W/m²
Lighting Controls Occupancy Sensors and Daylight
Sensors in some areas.
Occupancy Sensors in Office Areas, Conference, Meeting and Training Rooms, Employee Break Rooms, Storage Rooms up to , 100m2,
Enclosed Office Space up to 25m2 and Washrooms/Locker Rooms.
Plug Loads 8.93 W/m²
Ventilation System
AHU #1-3 (Level 1, Retail, Lobby & Misc Areas): Multi-Zone Constant
Volume Units. AHU #5-16 (Two per Office Level, Interior & Perimeter): Multi-Zone
Variable Air Volume Units. AHU #17 (Fresh Air Unit for Office
Levels): Multi-Zone Constant Volume Units.
System - 6: Multi-Zone Built Up Systems with Variable Volume Fan
Control.
Fan Power
AHU #1: 2.43 W/l/s AHU #2: 1.91 W/l/s AHU #3: 2.56 W/l/s
AHU #5-16 (Interior): 2.63 W/l/s AHU #5-16 (Exterior): 2.82 W/l/s
AHU #17: 2.24 W/l/s
Minimum Outside Air
Per ASHRAE 62.1-2001 Per ASHRAE 62.1-2007
Heat Recovery
AHU #1: 0% AHU #2: 0% AHU #3: 0%
AHU #5-16 (Interior): 70% AHU #5-16 (Exterior): 70%
AHU #1: 0% AHU #2 : 0% AHU #3 : 0%
AHU #5-16 (Interior): 50% AHU #5-16 (Exterior): 50%
Economizers All AHU’s: Outside Air
Temperature Economizer All AHU’s: Dual Enthalpy
Economizer
Demand Control Ventilation
CO2 Sensors No Requirement

Heating System
Packaged Chiller/Heat Pump connected to Seawater Loop via Shell & Tube Exchangers. Two electric boilers sized for peak
heating.
Electric Coils in AHU’s and Electric Resistance Baseboard.
Heating efficiency COP: 4.35 100%
Cooling System Packaged Chiller/Heat Pump
connected to Seawater Loop via Shell & Tube Exchangers.
Water Cooled Screw Chiller
Cooling efficiency COP: 4.35 COP: 5.67

3: Education – School
Baseline versus Baseline with Air Source Heat Pump (ASHP)
Description of Analysis: The baseline building is compared against the baseline building that
has the NECB-2011 performance path applied to the mechanical systems but with air source
heat pumps.
Parameter Comparison Envelope No Change Mechanical NECB-2011
(ASHP) Lighting No Change
Description of Archetype: Torbay School, Avalon, Newfoundland. This facility includes
classrooms, a library, and a gymnasium/theatre.
Modelling Software: eQUEST
Key parameters of archetype:
Model Parameter
Archetype value (Baseline)
Archetype Value (NECB-2011)
Climate Zone and Heating Degree Days (HDD 18°C)
Zone 6, 4800 HDD
Net Floor Area 6,034 m2
Floors 2 above grade 0 below grade
Roof construction
Common Roof: 2 ply modified membrane, RSI 4.0 Continuous Rigid Insulation, Steel Deck.
Metal Batten Roof: Metal Covering, 13mm Gypsum Board, W/Steel Girts, Steel Deck.
Roof U-value Common Roof: U= 0.22 W/m²K
Metal Batten Roof: U= 0.58 W/m²K
Wall construction
Brick Wall: Brick Facing, 190mm Concrete Block, 64mm Rigid Insulation, Brick Facing.
Steel Wall: 190mm Concrete Block, 100mm Rigid Insulation W/Z Bars, Steel Siding.
Wall U-value Brick Wall: U= 0.33 W/m²K Steel Wall: U= 0.33 W/m²K
Glazing construction
Double Glazing with Thermally Broken Aluminium Frames.
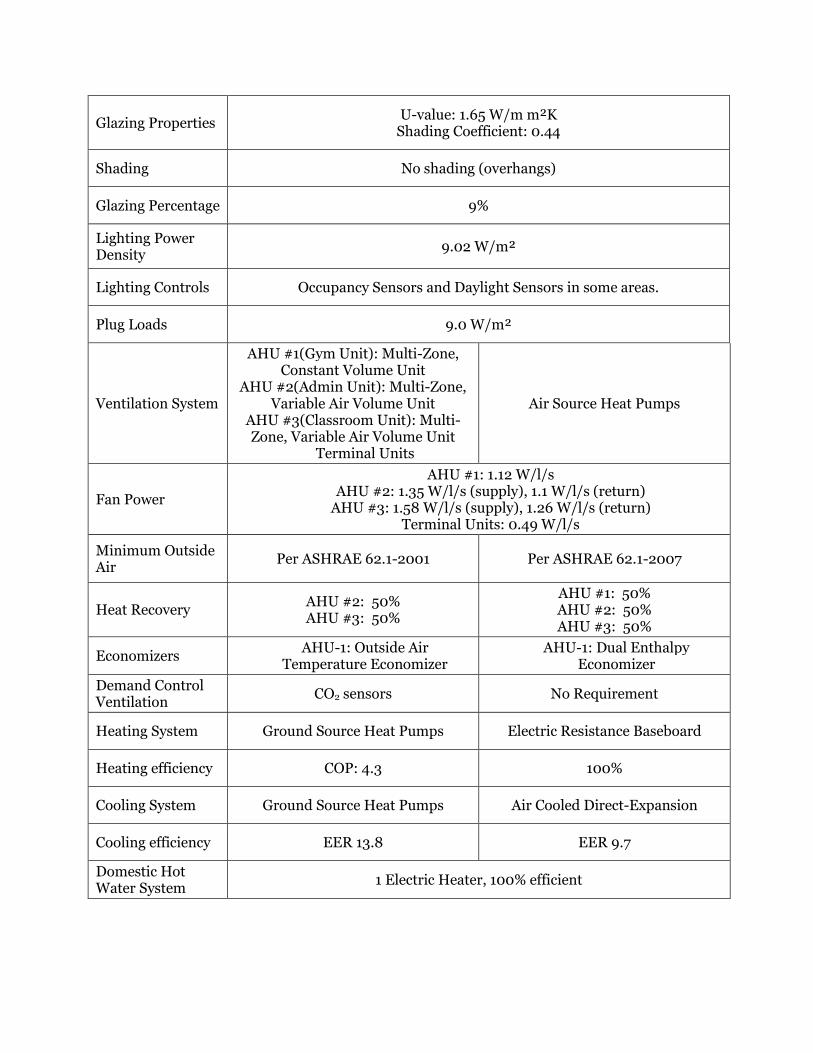
Glazing Properties U-value: 1.65 W/m m²K Shading Coefficient: 0.44
Shading No shading (overhangs)
Glazing Percentage 9%
Lighting Power Density
9.02 W/m²
Lighting Controls Occupancy Sensors and Daylight Sensors in some areas.
Plug Loads 9.0 W/m²
Ventilation System
AHU #1(Gym Unit): Multi-Zone, Constant Volume Unit
AHU #2(Admin Unit): Multi-Zone, Variable Air Volume Unit
AHU #3(Classroom Unit): Multi-Zone, Variable Air Volume Unit
Terminal Units
Air Source Heat Pumps
Fan Power
AHU #1: 1.12 W/l/s AHU #2: 1.35 W/l/s (supply), 1.1 W/l/s (return) AHU #3: 1.58 W/l/s (supply), 1.26 W/l/s (return)
Terminal Units: 0.49 W/l/s
Minimum Outside Air
Per ASHRAE 62.1-2001 Per ASHRAE 62.1-2007
Heat Recovery AHU #2: 50% AHU #3: 50%
AHU #1: 50% AHU #2: 50% AHU #3: 50%
Economizers AHU-1: Outside Air
Temperature Economizer AHU-1: Dual Enthalpy
Economizer
Demand Control Ventilation
CO2 sensors No Requirement
Heating System Ground Source Heat Pumps Electric Resistance Baseboard
Heating efficiency COP: 4.3 100%
Cooling System Ground Source Heat Pumps Air Cooled Direct-Expansion
Cooling efficiency EER 13.8 EER 9.7
Domestic Hot Water System
1 Electric Heater, 100% efficient

3: Education – School
Baseline versus NECB Performance Pathway
Description of Analysis: The baseline building is compared against a building that has had
the NECB performance path applied to it in its entirety.
Parameter Comparison Envelope NECB-2011 Mechanical NECB-2011 Lighting NECB-2011
Description of Archetype: Torbay School, Avalon, Newfoundland. This facility includes
classrooms, a library, and a gymnasium/theatre.
Modelling Software: eQUEST
Key parameters of archetype:
Model Parameter
Archetype value (Baseline)
Archetype Value (NECB-2011)
Climate Zone and Heating Degree Days (HDD 18°C)
Zone 6, 4800 HDD
Net Floor Area 6,034 m2
Floors 2 above grade 0 below grade
Roof construction
Common Roof: 2 ply modified membrane, RSI 4.0 Continuous Rigid Insulation, Steel Deck.
Metal Batten Roof: Metal Covering, 13mm Gypsum Board, W/Steel Girts, Steel Deck.
Roof U-value Common Roof: U= 0.22 W/m²K Metal Batten Roof: U= 0.58
W/m²K U= 0.183 W/m²K
Wall construction
Brick Wall: Brick Facing, 190mm Concrete Block, 64mm Rigid Insulation, Brick Facing.
Steel Wall: 190mm Concrete Block, 100mm Rigid Insulation W/Z Bars, Steel Siding.
Wall U-value Brick Wall: U= 0.33 W/m²K Steel Wall: U= 0.33 W/m²K
U= 0.247 W/m²K
Glazing construction
Double Glazing with Thermally Broken Aluminium Frames.
Glazing Properties U-value: 1.65 W/m m²K Shading Coefficient: 0.44
U-value: 2.2 W/m m²K Shading Coefficient: 0.44

Shading No shading (overhangs)
Glazing Percentage 9%
Lighting Power Density
9.02 W/m² 10.7 W/m²
Lighting Controls Occupancy Sensors and Daylight
Sensors in some areas.
Occupancy Sensors in Classrooms, Employee Break Rooms, Storage Rooms up to , 100m2, Office Space up to 25m2 and Washrooms/Locker
Rooms.
Plug Loads 9.0 W/m²
Ventilation System
AHU #1(Gym Unit): Multi-Zone, Constant Volume Unit
AHU #2(Admin Unit): Multi-Zone, Variable Air Volume Unit
AHU #3(Classroom Unit): Multi-Zone, Variable Air Volume Unit
Terminal Units
System - 3: Single Zone Packaged Rooftop Units
Fan Power
AHU #1: 1.12 W/l/s AHU #2: 1.35 W/l/s (supply), 1.1 W/l/s (return) AHU #3: 1.58 W/l/s (supply), 1.26 W/l/s (return)
Terminal Units: 0.49 W/l/s
Minimum Outside Air
Per ASHRAE 62.1-2001 Per ASHRAE 62.1-2007
Heat Recovery AHU #2: 50% AHU #3: 50%
AHU #1: 50% AHU #2: 50% AHU #3: 50%
Economizers AHU #1: Outside Air
Temperature Economizer AHU #1: Dual Enthalpy
Economizer
Demand Control Ventilation
CO2 sensors No Requirement
Heating System Ground Source Heat Pumps Electric Coils in Rooftop Units and Electric Resistance Baseboard
Heating efficiency COP: 4.3 100%
Cooling System Ground Source Heat Pumps Air Cooled Direct-Expansion
Cooling efficiency EER 13.8 EER 9.7
Domestic Hot Water System
1 Electric Heater, 100% efficient

3: Education – School
Baseline versus NECB Performance Pathway, Zone 7A
Description of Analysis: The baseline building is compared against a building that has had
the NECB performance path with Zone 7A (instead of Zone 6) applied to it in its entirety.
Parameter Comparison Envelope NECB-2011 (7A) Mechanical NECB-2011 (7A) Lighting NECB-2011 (7A)
Description of Archetype: Torbay School, Avalon, Newfoundland. This facility includes
classrooms, a library, and a gymnasium/theatre.
Modelling Software: eQUEST
Key parameters of archetype:
Model Parameter
Archetype value (Baseline)
Archetype Value (NECB-2011)
Climate Zone and Heating Degree Days (HDD 18°C)
Zone 6, 4800 HDD
Net Floor Area 6,034 m2
Floors 2 above grade 0 below grade
Roof construction
Common Roof: 2 ply modified membrane, RSI 4.0 Continuous Rigid Insulation, Steel Deck.
Metal Batten Roof: Metal Covering, 13mm Gypsum Board, W/Steel Girts, Steel Deck.
Roof U-value Common Roof: U= 0.22 W/m²K Metal Batten Roof: U= 0.58
W/m²K U= 0.162 W/m²K
Wall construction
Brick Wall: Brick Facing, 190mm Concrete Block, 64mm Rigid Insulation, Brick Facing.
Steel Wall: 190mm Concrete Block, 100mm Rigid Insulation W/Z Bars, Steel Siding.
Wall U-value Brick Wall: U= 0.33 W/m²K Steel Wall: U= 0.33 W/m²K
U= 0.210 W/m²K
Glazing construction
Double Glazing with Thermally Broken Aluminium Frames.
Glazing Properties U-value: 1.65 W/m m²K Shading Coefficient: 0.44
U-value: 2.2 W/m m²K Shading Coefficient: 0.44
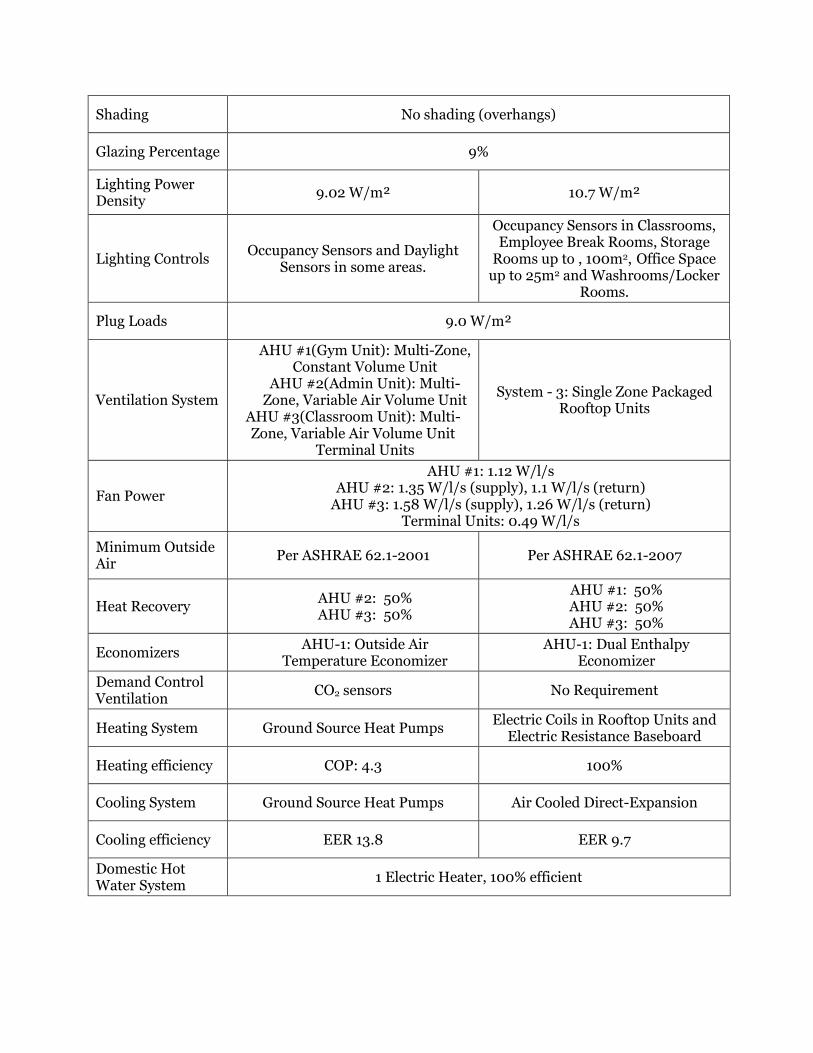
Shading No shading (overhangs)
Glazing Percentage 9%
Lighting Power Density
9.02 W/m² 10.7 W/m²
Lighting Controls Occupancy Sensors and Daylight
Sensors in some areas.
Occupancy Sensors in Classrooms, Employee Break Rooms, Storage Rooms up to , 100m2, Office Space up to 25m2 and Washrooms/Locker
Rooms.
Plug Loads 9.0 W/m²
Ventilation System
AHU #1(Gym Unit): Multi-Zone, Constant Volume Unit
AHU #2(Admin Unit): Multi-Zone, Variable Air Volume Unit
AHU #3(Classroom Unit): Multi-Zone, Variable Air Volume Unit
Terminal Units
System - 3: Single Zone Packaged Rooftop Units
Fan Power
AHU #1: 1.12 W/l/s AHU #2: 1.35 W/l/s (supply), 1.1 W/l/s (return) AHU #3: 1.58 W/l/s (supply), 1.26 W/l/s (return)
Terminal Units: 0.49 W/l/s
Minimum Outside Air
Per ASHRAE 62.1-2001 Per ASHRAE 62.1-2007
Heat Recovery AHU #2: 50% AHU #3: 50%
AHU #1: 50% AHU #2: 50% AHU #3: 50%
Economizers AHU-1: Outside Air
Temperature Economizer AHU-1: Dual Enthalpy
Economizer
Demand Control Ventilation
CO2 sensors No Requirement
Heating System Ground Source Heat Pumps Electric Coils in Rooftop Units and
Electric Resistance Baseboard
Heating efficiency COP: 4.3 100%
Cooling System Ground Source Heat Pumps Air Cooled Direct-Expansion
Cooling efficiency EER 13.8 EER 9.7
Domestic Hot Water System
1 Electric Heater, 100% efficient

3: Education – School
Baseline versus NECB Performance Pathway with Baseline
Envelope
Description of Analysis: The baseline building is compared against a building that has the
baseline envelope and the NECB performance path applied to the mechanical systems and
lighting.
Parameter Comparison Envelope No Change Mechanical NECB-2011 Lighting NECB-2011
Description of Archetype: Torbay School, Avalon, Newfoundland. This facility includes
classrooms, a library, and a gymnasium/theatre.
Modelling Software: eQUEST
Key parameters of archetype:
Model Parameter
Archetype value (Baseline)
Archetype Value (NECB-2011)
Climate Zone and Heating Degree Days (HDD 18°C)
Zone 6, 4800 HDD
Net Floor Area 6,034 m2
Floors 2 above grade 0 below grade
Roof construction
Common Roof: 2 ply modified membrane, RSI 4.0 Continuous Rigid Insulation, Steel Deck.
Metal Batten Roof: Metal Covering, 13mm Gypsum Board, W/Steel Girts, Steel Deck.
Roof U-value Common Roof: U= 0.22 W/m²K Metal Batten Roof: U= 0.58 W/m²K
Wall construction
Brick Wall: Brick Facing, 190mm Concrete Block, 64mm Rigid Insulation, Brick Facing.
Steel Wall: 190mm Concrete Block, 100mm Rigid Insulation W/Z Bars, Steel Siding.
Wall U-value Brick Wall: U= 0.33 W/m²K Steel Wall: U= 0.33 W/m²K
Glazing construction
Double Glazing with Thermally Broken Aluminium Frames.

Glazing Properties U-value: 1.65 W/m m²K Shading Coefficient: 0.44
Shading No shading (overhangs)
Glazing Percentage 9%
Lighting Power Density
9.02 W/m² 10.7 W/m²
Lighting Controls Occupancy Sensors and Daylight
Sensors in some areas.
Occupancy Sensors in Classrooms, Employee Break Rooms, Storage Rooms up to , 100m2, Office Space up to 25m2 and Washrooms/Locker
Rooms.
Plug Loads 9.0 W/m²
Ventilation System
AHU #1(Gym Unit): Multi-Zone, Constant Volume Unit
AHU #2(Admin Unit): Multi-Zone, Variable Air Volume Unit
AHU #3(Classroom Unit): Multi-Zone, Variable Air Volume Unit
Terminal Units
System - 3: Single Zone Packaged Rooftop Units
Fan Power
AHU #1: 1.12 W/l/s AHU #2: 1.35 W/l/s (supply), 1.1 W/l/s (return) AHU #3: 1.58 W/l/s (supply), 1.26 W/l/s (return)
Terminal Units: 0.49 W/l/s
Minimum Outside Air
Per ASHRAE 62.1-2001 Per ASHRAE 62.1-2007
Heat Recovery AHU #2: 50% AHU #3: 50%
AHU #1: 50% AHU #2: 50% AHU #3: 50%
Economizers AHU #1: Outside Air
Temperature Economizer AHU #1: Dual Enthalpy
Economizer
Demand Control Ventilation
CO2 sensors No Requirement
Heating System Ground Source Heat Pumps Electric Coils in Rooftop Units and
Electric Resistance Baseboard
Heating efficiency COP: 4.3 100%
Cooling System Ground Source Heat Pumps Air Cooled Direct-Expansion
Cooling efficiency EER 13.8 EER 9.7
Domestic Hot Water System
1 Electric Heater, 100% efficient
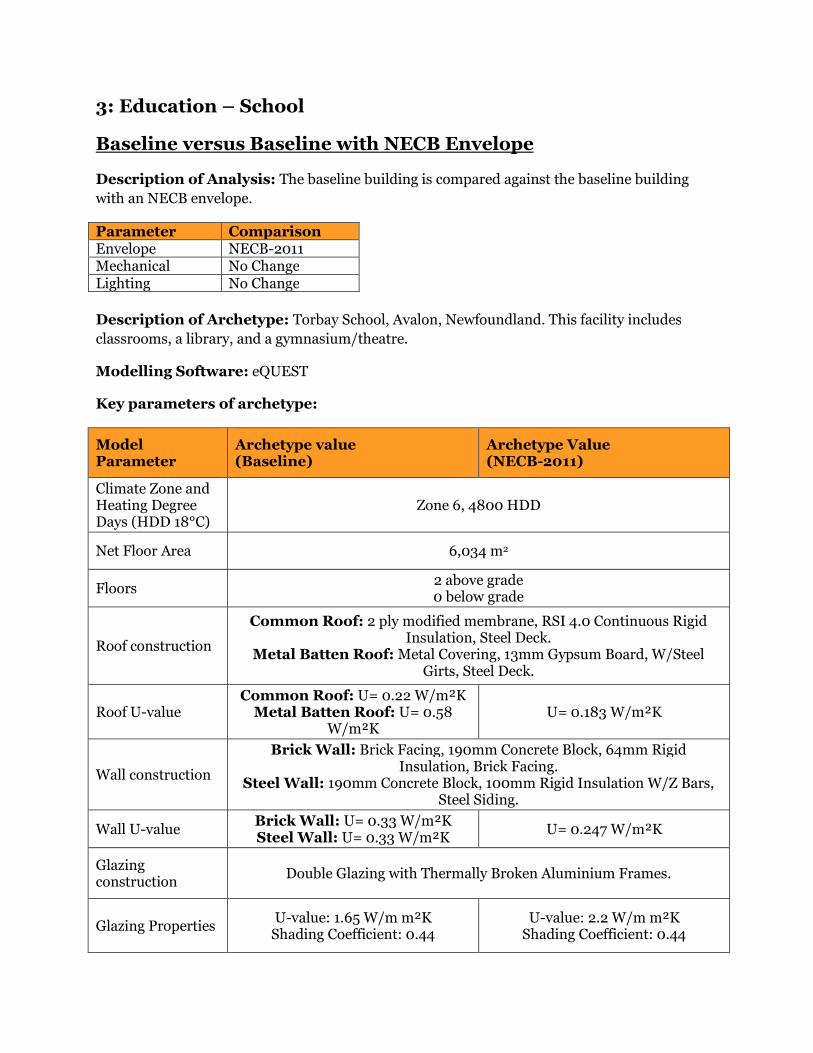
3: Education – School
Baseline versus Baseline with NECB Envelope
Description of Analysis: The baseline building is compared against the baseline building
with an NECB envelope.
Parameter Comparison Envelope NECB-2011 Mechanical No Change Lighting No Change
Description of Archetype: Torbay School, Avalon, Newfoundland. This facility includes
classrooms, a library, and a gymnasium/theatre.
Modelling Software: eQUEST
Key parameters of archetype:
Model Parameter
Archetype value (Baseline)
Archetype Value (NECB-2011)
Climate Zone and Heating Degree Days (HDD 18°C)
Zone 6, 4800 HDD
Net Floor Area 6,034 m2
Floors 2 above grade 0 below grade
Roof construction
Common Roof: 2 ply modified membrane, RSI 4.0 Continuous Rigid Insulation, Steel Deck.
Metal Batten Roof: Metal Covering, 13mm Gypsum Board, W/Steel Girts, Steel Deck.
Roof U-value Common Roof: U= 0.22 W/m²K Metal Batten Roof: U= 0.58
W/m²K U= 0.183 W/m²K
Wall construction
Brick Wall: Brick Facing, 190mm Concrete Block, 64mm Rigid Insulation, Brick Facing.
Steel Wall: 190mm Concrete Block, 100mm Rigid Insulation W/Z Bars, Steel Siding.
Wall U-value Brick Wall: U= 0.33 W/m²K Steel Wall: U= 0.33 W/m²K
U= 0.247 W/m²K
Glazing construction
Double Glazing with Thermally Broken Aluminium Frames.
Glazing Properties U-value: 1.65 W/m m²K Shading Coefficient: 0.44
U-value: 2.2 W/m m²K Shading Coefficient: 0.44
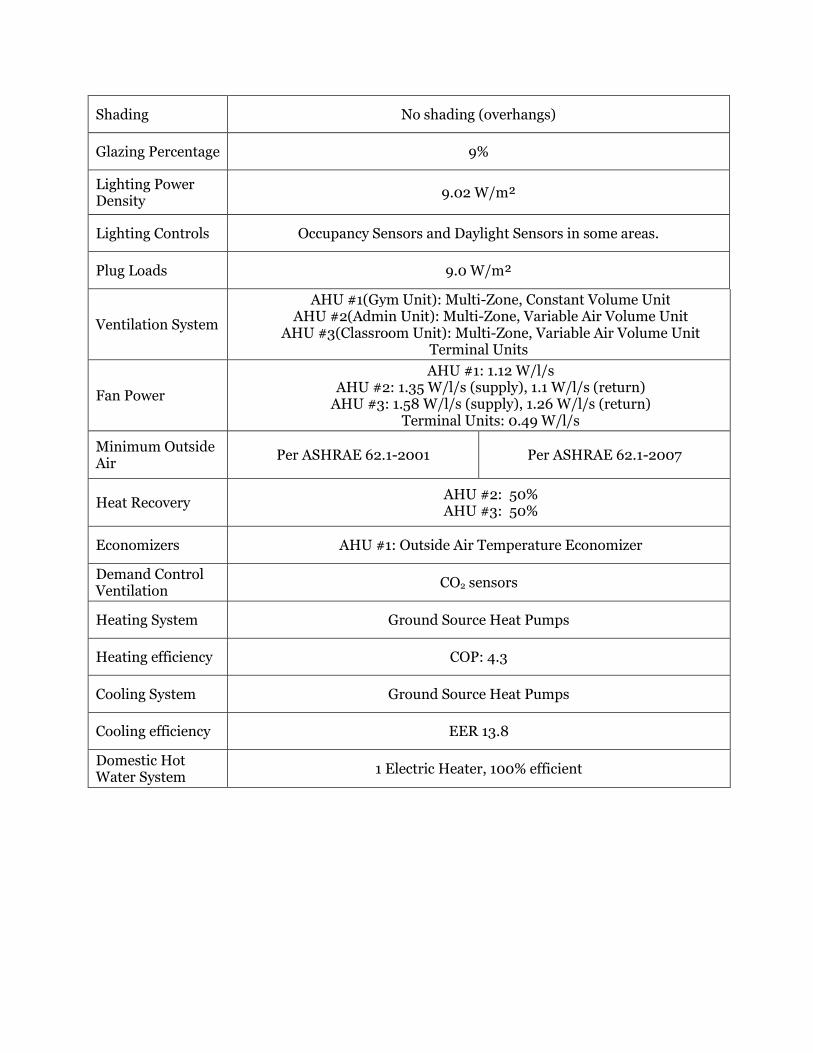
Shading No shading (overhangs)
Glazing Percentage 9%
Lighting Power Density
9.02 W/m²
Lighting Controls Occupancy Sensors and Daylight Sensors in some areas.
Plug Loads 9.0 W/m²
Ventilation System
AHU #1(Gym Unit): Multi-Zone, Constant Volume Unit AHU #2(Admin Unit): Multi-Zone, Variable Air Volume Unit
AHU #3(Classroom Unit): Multi-Zone, Variable Air Volume Unit Terminal Units
Fan Power
AHU #1: 1.12 W/l/s AHU #2: 1.35 W/l/s (supply), 1.1 W/l/s (return) AHU #3: 1.58 W/l/s (supply), 1.26 W/l/s (return)
Terminal Units: 0.49 W/l/s
Minimum Outside Air
Per ASHRAE 62.1-2001 Per ASHRAE 62.1-2007
Heat Recovery AHU #2: 50% AHU #3: 50%
Economizers AHU #1: Outside Air Temperature Economizer
Demand Control Ventilation
CO2 sensors
Heating System Ground Source Heat Pumps
Heating efficiency COP: 4.3
Cooling System Ground Source Heat Pumps
Cooling efficiency EER 13.8
Domestic Hot Water System
1 Electric Heater, 100% efficient
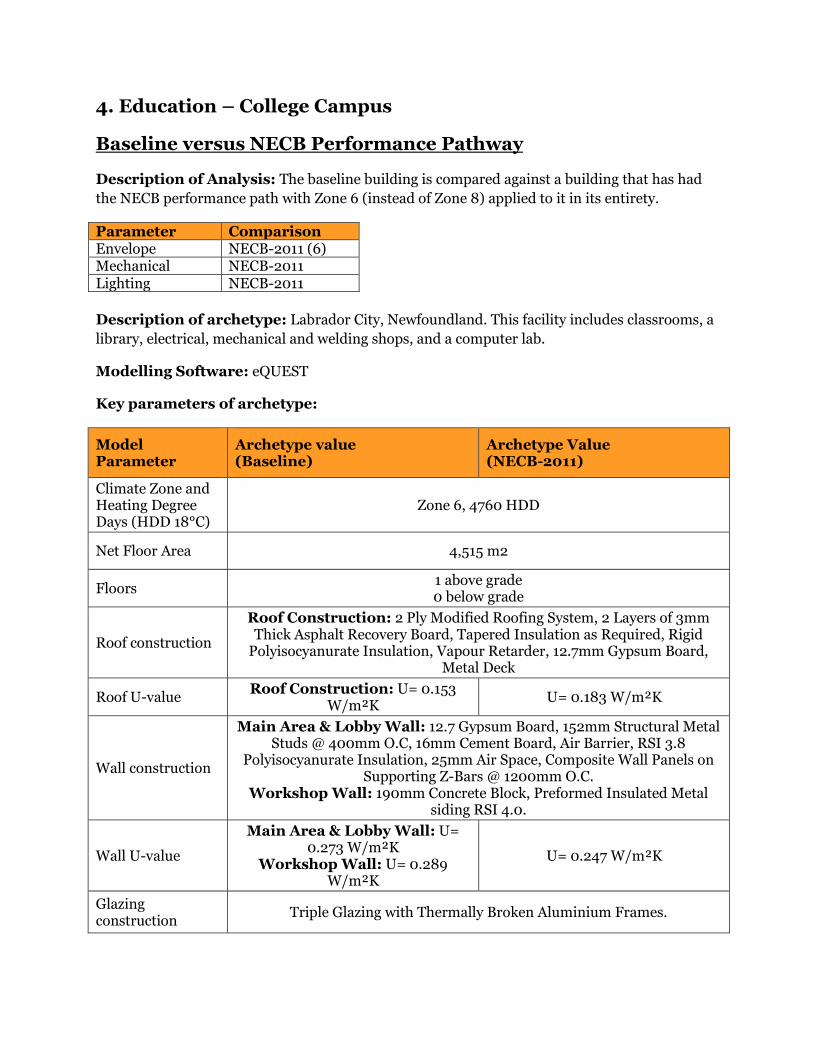
4. Education – College Campus
Baseline versus NECB Performance Pathway
Description of Analysis: The baseline building is compared against a building that has had
the NECB performance path with Zone 6 (instead of Zone 8) applied to it in its entirety.
Parameter Comparison Envelope NECB-2011 (6) Mechanical NECB-2011 Lighting NECB-2011
Description of archetype: Labrador City, Newfoundland. This facility includes classrooms, a
library, electrical, mechanical and welding shops, and a computer lab.
Modelling Software: eQUEST
Key parameters of archetype:
Model Parameter
Archetype value (Baseline)
Archetype Value (NECB-2011)
Climate Zone and Heating Degree Days (HDD 18°C)
Zone 6, 4760 HDD
Net Floor Area 4,515 m2
Floors 1 above grade 0 below grade
Roof construction
Roof Construction: 2 Ply Modified Roofing System, 2 Layers of 3mm Thick Asphalt Recovery Board, Tapered Insulation as Required, Rigid
Polyisocyanurate Insulation, Vapour Retarder, 12.7mm Gypsum Board, Metal Deck
Roof U-value Roof Construction: U= 0.153
W/m²K U= 0.183 W/m²K
Wall construction
Main Area & Lobby Wall: 12.7 Gypsum Board, 152mm Structural Metal Studs @ 400mm O.C, 16mm Cement Board, Air Barrier, RSI 3.8
Polyisocyanurate Insulation, 25mm Air Space, Composite Wall Panels on Supporting Z-Bars @ 1200mm O.C.
Workshop Wall: 190mm Concrete Block, Preformed Insulated Metal siding RSI 4.0.
Wall U-value
Main Area & Lobby Wall: U= 0.273 W/m²K
Workshop Wall: U= 0.289 W/m²K
U= 0.247 W/m²K
Glazing construction
Triple Glazing with Thermally Broken Aluminium Frames.

Glazing Properties
Windows: U-value:2.2 W/m m²K Shading Coefficient: 0.37
Skylight: U-value: 5.7 W/m m²K Shading Coefficient: 0.37
U-value: 2.2 W/m m²K Shading Coefficient: 0.37
Shading No shading (overhangs)
Glazing Percentage Windows: 10% Skylight: 0.4%
Lighting Power Density
School: 9.4 W/m² Shop: 6.8 W/m²
School: 10.7 W/m² Shop: 12.9 W/m²
Lighting Controls Occupancy Sensors and Daylight
Sensors in some Areas.
Occupancy Sensors in Classrooms, Employee Break Rooms, Storage
Rooms up to , 100m2, Office Space up to 25m2 and Washrooms/Locker Rooms. Daylight Sensors in Skylight
Area.
Plug Loads School: 10.3 W/m²
Shop: 4.8 W/m²
Ventilation System
AHU #1(General Area): Variable Air Volume
AHU #2(Shop): Constant Volume
AHU #3(Fresh Air Unit for Shop): Supply & Exhaust
School: System - 3: Single Zone Packaged Rooftop Units with
Baseboard Heating Shop: System - 4: Single Zone Constant Volume Make-Up Air Unit with Baseboard Heating
Fan Power AHU #1: 1.39 W/l/s AHU #2: 1.36 W/l/s
AHU #3: 1.39 W/l/s (supply), 1.26 W/l/s (exhaust)
Minimum Outside Air
Per ASHRAE 62.1-2001 Per ASHRAE 62.1-2007
Heat Recovery AHU #1: 68% AHU #2: 68%
PSZ’s: 50%
Economizers Dual Enthalpy Economizer
Demand Control Ventilation
CO2 sensors (except shop areas) No requirement
Heating System
School: Electric preheat and reheat and electric resistance baseboard. Shop: Electric coils and reheat and
electric resistance baseboard.
System - 3: Electric Resistance for Rooftop and Baseboards
System - 4: Electric Coil Make-up Air Unit
Heating efficiency 100% 100%
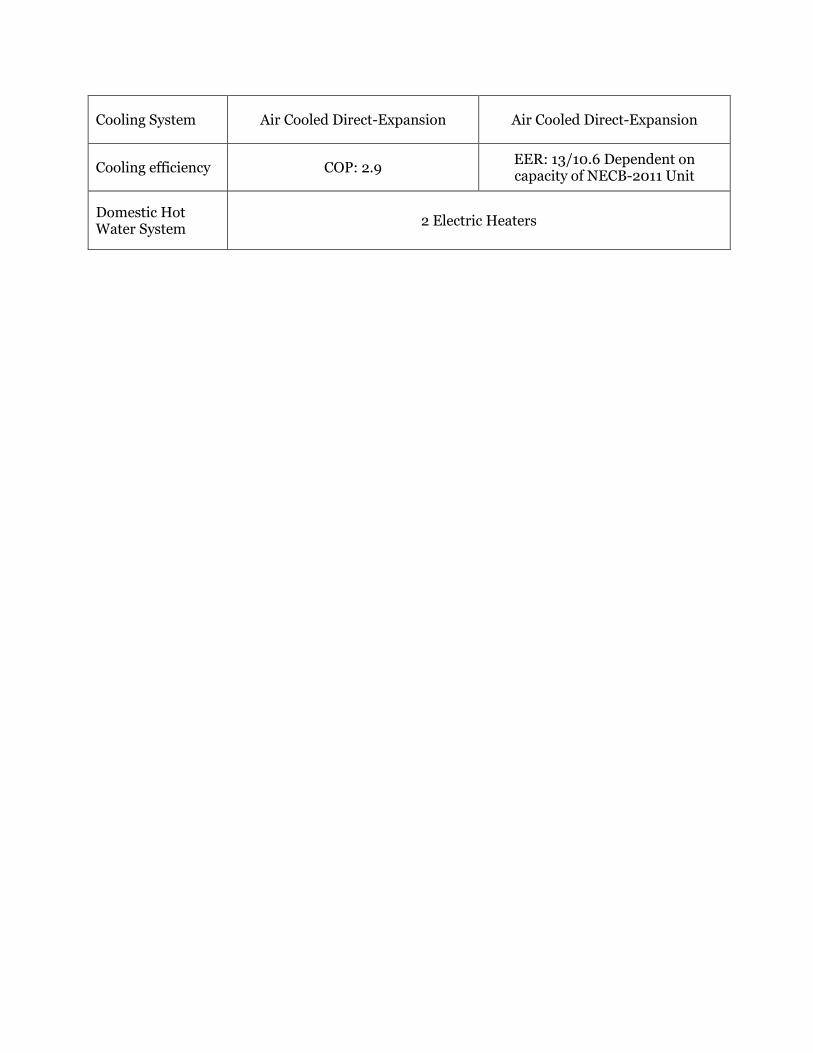
Cooling System Air Cooled Direct-Expansion Air Cooled Direct-Expansion
Cooling efficiency COP: 2.9 EER: 13/10.6 Dependent on capacity of NECB-2011 Unit
Domestic Hot Water System
2 Electric Heaters

4. Education – College Campus
Baseline versus NECB Performance Pathway
Description of Analysis: The baseline building is compared against a building that has had
the NECB performance path with Zone 7A (instead of Zone 8) applied to it in its entirety.
Parameter Comparison Envelope NECB-2011 (7A) Mechanical NECB-2011 Lighting NECB-2011
Description of archetype: Labrador City, Newfoundland. This facility includes classrooms, a
library, electrical, mechanical and welding shops, and a computer lab.
Modelling Software: eQUEST
Key parameters of archetype:
Model Parameter
Archetype value (Baseline)
Archetype Value (NECB-2011)
Climate Zone and Heating Degree Days (HDD 18°C)
Zone 7A, 5000-5999 HDD
Net Floor Area 4,515 m2
Floors 1 above grade 0 below grade
Roof construction
Roof Construction: 2 Ply Modified Roofing System, 2 Layers of 3mm Thick Asphalt Recovery Board, Tapered Insulation as Required, Rigid Polyisocyanurate Insulation, Vapour Retarder, 12.7mm Gypsum Board,
Metal Deck
Roof U-value Roof Construction: U= 0.153
W/m²K U= 0.162 W/m²K
Wall construction
Main Area & Lobby Wall: 12.7 Gypsum Board, 152mm Structural Metal Studs @ 400mm O.C, 16mm Cement Board, Air Barrier, RSI 3.8
Polyisocyanurate Insulation, 25mm Air Space, Composite Wall Panels on Supporting Z-Bars @ 1200mm O.C.
Workshop Wall: 190mm Concrete Block, Preformed Insulated Metal siding RSI 4.0.
Wall U-value
Main Area & Lobby Wall: U= 0.273 W/m²K
Workshop Wall: U= 0.289 W/m²K
U= 0.210 W/m²K
Glazing construction
Triple Glazing with Thermally Broken Aluminium Frames.
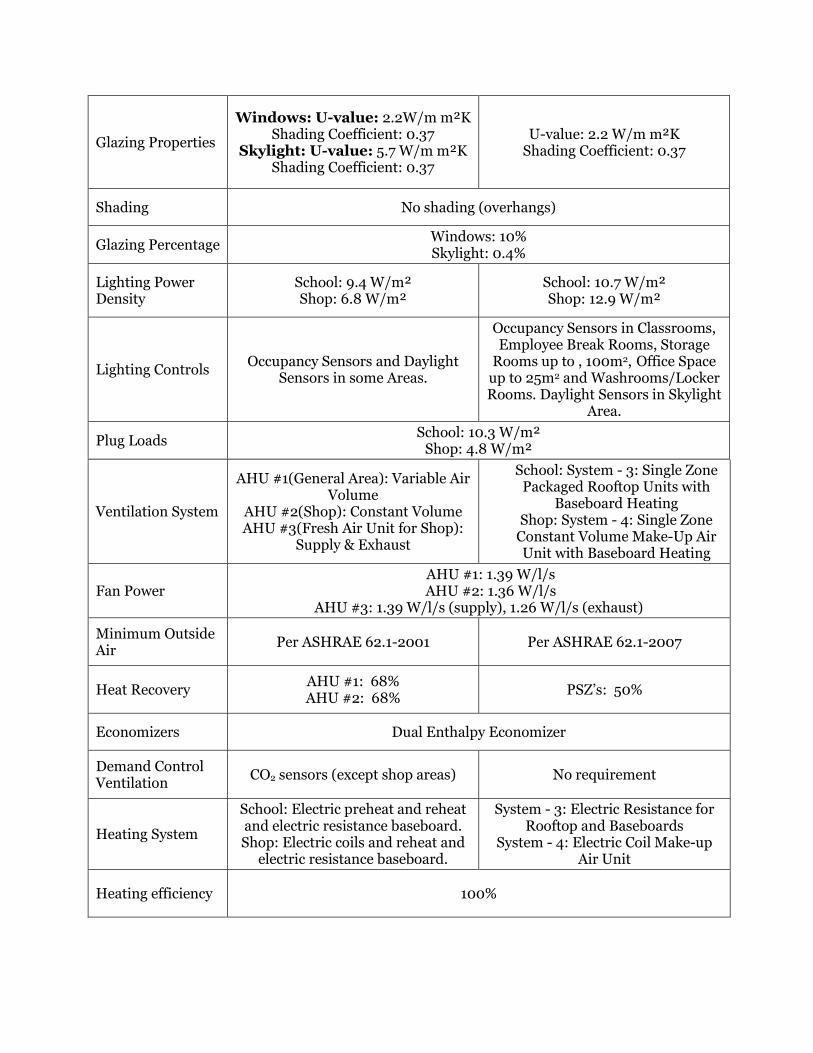
Glazing Properties
Windows: U-value: 2.2W/m m²K Shading Coefficient: 0.37
Skylight: U-value: 5.7 W/m m²K Shading Coefficient: 0.37
U-value: 2.2 W/m m²K Shading Coefficient: 0.37
Shading No shading (overhangs)
Glazing Percentage Windows: 10% Skylight: 0.4%
Lighting Power Density
School: 9.4 W/m² Shop: 6.8 W/m²
School: 10.7 W/m² Shop: 12.9 W/m²
Lighting Controls Occupancy Sensors and Daylight
Sensors in some Areas.
Occupancy Sensors in Classrooms, Employee Break Rooms, Storage Rooms up to , 100m2, Office Space up to 25m2 and Washrooms/Locker Rooms. Daylight Sensors in Skylight
Area.
Plug Loads School: 10.3 W/m² Shop: 4.8 W/m²
Ventilation System
AHU #1(General Area): Variable Air Volume
AHU #2(Shop): Constant Volume AHU #3(Fresh Air Unit for Shop):
Supply & Exhaust
School: System - 3: Single Zone Packaged Rooftop Units with
Baseboard Heating Shop: System - 4: Single Zone Constant Volume Make-Up Air Unit with Baseboard Heating
Fan Power AHU #1: 1.39 W/l/s AHU #2: 1.36 W/l/s
AHU #3: 1.39 W/l/s (supply), 1.26 W/l/s (exhaust)
Minimum Outside Air
Per ASHRAE 62.1-2001 Per ASHRAE 62.1-2007
Heat Recovery AHU #1: 68% AHU #2: 68%
PSZ’s: 50%
Economizers Dual Enthalpy Economizer
Demand Control Ventilation
CO2 sensors (except shop areas) No requirement
Heating System
School: Electric preheat and reheat and electric resistance baseboard. Shop: Electric coils and reheat and
electric resistance baseboard.
System - 3: Electric Resistance for Rooftop and Baseboards
System - 4: Electric Coil Make-up Air Unit
Heating efficiency 100%

Cooling System Air Cooled Direct-Expansion
Cooling efficiency COP: 2.9 EER: 13/10.6 Dependent on capacity of NECB-2011 Unit.
Domestic Hot Water System
2 Electric Heaters
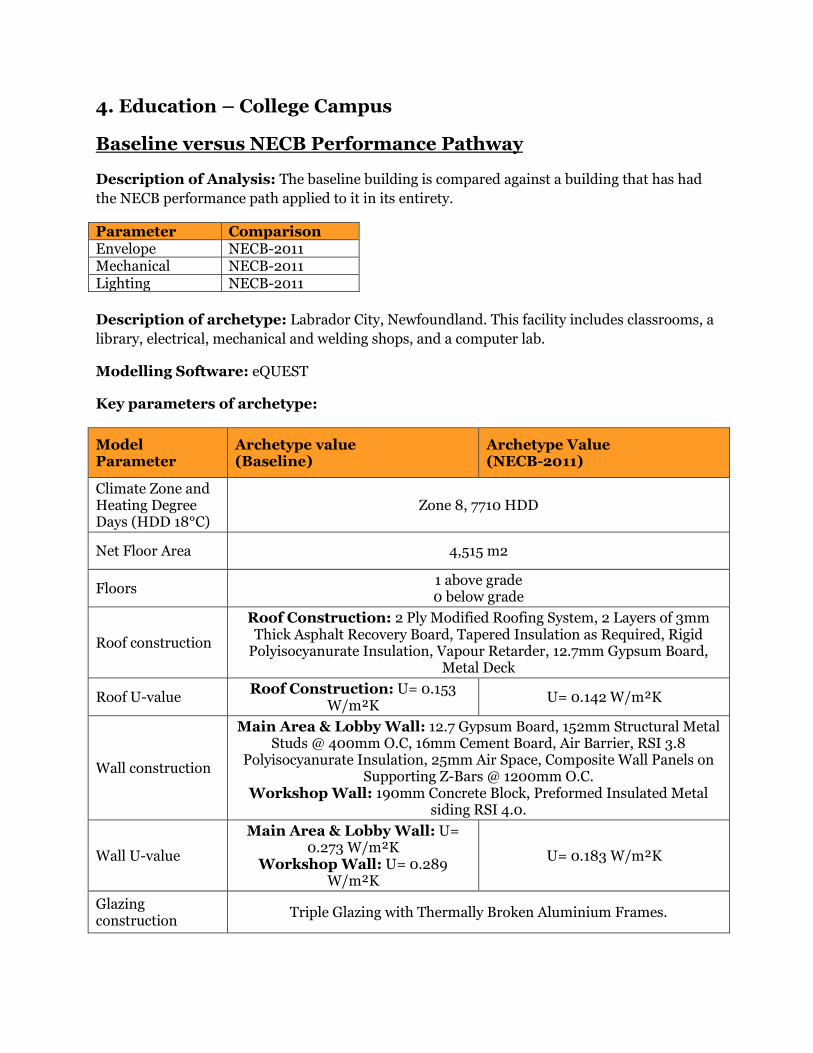
4. Education – College Campus
Baseline versus NECB Performance Pathway
Description of Analysis: The baseline building is compared against a building that has had
the NECB performance path applied to it in its entirety.
Parameter Comparison Envelope NECB-2011 Mechanical NECB-2011 Lighting NECB-2011
Description of archetype: Labrador City, Newfoundland. This facility includes classrooms, a
library, electrical, mechanical and welding shops, and a computer lab.
Modelling Software: eQUEST
Key parameters of archetype:
Model Parameter
Archetype value (Baseline)
Archetype Value (NECB-2011)
Climate Zone and Heating Degree Days (HDD 18°C)
Zone 8, 7710 HDD
Net Floor Area 4,515 m2
Floors 1 above grade 0 below grade
Roof construction
Roof Construction: 2 Ply Modified Roofing System, 2 Layers of 3mm Thick Asphalt Recovery Board, Tapered Insulation as Required, Rigid Polyisocyanurate Insulation, Vapour Retarder, 12.7mm Gypsum Board,
Metal Deck
Roof U-value Roof Construction: U= 0.153
W/m²K U= 0.142 W/m²K
Wall construction
Main Area & Lobby Wall: 12.7 Gypsum Board, 152mm Structural Metal Studs @ 400mm O.C, 16mm Cement Board, Air Barrier, RSI 3.8
Polyisocyanurate Insulation, 25mm Air Space, Composite Wall Panels on Supporting Z-Bars @ 1200mm O.C.
Workshop Wall: 190mm Concrete Block, Preformed Insulated Metal siding RSI 4.0.
Wall U-value
Main Area & Lobby Wall: U= 0.273 W/m²K
Workshop Wall: U= 0.289 W/m²K
U= 0.183 W/m²K
Glazing construction
Triple Glazing with Thermally Broken Aluminium Frames.

Glazing Properties
Windows: U-value: 2.2W/m m²K Shading Coefficient: 0.37
Skylight: U-value: 5.7 W/m m²K Shading Coefficient: 0.37
U-value: 1.6 W/m m²K Shading Coefficient: 0.37
Shading No shading (overhangs)
Glazing Percentage Windows: 10% Skylight: 0.4%
Lighting Power Density
School: 9.4 W/m² Shop: 6.8 W/m²
School: 10.7 W/m² Shop: 12.9 W/m²
Lighting Controls Occupancy Sensors and Daylight
Sensors in some Areas.
Occupancy Sensors in Classrooms, Employee Break Rooms, Storage Rooms up to , 100m2, Office Space up to 25m2 and Washrooms/Locker Rooms. Daylight Sensors in Skylight
Area.
Plug Loads School: 10.3 W/m² Shop: 4.8 W/m²
Ventilation System
AHU #1(General Area): Variable Air Volume
AHU #2(Shop): Constant Volume AHU #3(Fresh Air Unit for Shop):
Supply & Exhaust
School: System - 3: Single Zone Packaged Rooftop Units with
Baseboard Heating Shop: System - 4: Single Zone Constant Volume Make-Up Air Unit with Baseboard Heating
Fan Power AHU #1: 1.39 W/l/s AHU #2: 1.36 W/l/s
AHU #3: 1.39 W/l/s (supply), 1.26 W/l/s (exhaust)
Minimum Outside Air
Per ASHRAE 62.1-2001 Per ASHRAE 62.1-2007
Heat Recovery AHU #1: 68% AHU #2: 68%
PSZ’s: 50%
Economizers Dual Enthalpy Economizer
Demand Control Ventilation
CO2 sensors (except shop areas) No requirement
Heating System
School: Electric preheat and reheat and electric resistance baseboard. Shop: Electric coils and reheat and electric resistance baseboard.
System - 3: Electric Resistance for Rooftop and Baseboards
System - 4: Electric Coil Make-up Air Unit
Heating efficiency 100% 100%

Cooling System Air Cooled Direct-Expansion Air Cooled Direct-Expansion
Cooling efficiency COP: 2.9 EER: 13/10.6 Dependent on capacity of NECB-2011 Unit
Domestic Hot Water System
2 Electric Heaters

5. Health - Long-Term Care Home Facility
Baseline versus NECB Performance Pathway
Description of Analysis: The baseline building is compared against a building that has had
the NECB performance path applied to it in its entirety.
Parameter Comparison Envelope NECB-2011 Mechanical NECB-2011 Lighting NECB-2011
Description of archetype: Corner Brook, Western, Newfoundland. This facility includes
patient rooms, kitchens, a recreation room, lounges, and a gift shop
Modelling Software: EE4
Key parameters of archetype:
Model Parameter
Archetype value (Baseline)
Archetype Value (NECB-2011)
Climate Zone and Heating Degree Days (HDD 18°C)
Zone 6, 4760 HDD
Net Floor Area 15,515 m2
Floors 4 above grade 1 below grade
Roof construction
Roof construction: Cap Sheet, 3mm Recovery Board, 6mm Glass Mat Gypsum Board, Tapered Insulation as Required, 100mm Polyisocyanurate Insulation, Vapour Barrier, 13mm Glass Mat Gypsum Board, Metal Deck,
Structural Steel.
Roof U-value Roof construction: 0.219 W/m²K U= 0.183 W/m²K
Wall construction
Brick Wall: 90mm Concrete Block, Air Space, 50mm Semi Rigid Insulation, Masonry Ties, Air Barrier, 13mm Glass Mat Gypsum Board, 152mm Structural Studs(600mm O.C.), RSI 3.5 Mineral Fiber Insulation,
0.15mm Polyethylene Vapor Barrier, 13mm Gypsum Board. Curtain Wall: Extruded Aluminum, Thermally Broken, Double Glazed Curtain Wall Assembly OR Single Glazed Spandrel Panel;150mm Semi
Rigid Insulation and Metal Back Pan,64mm Structural Studs (600 O.C.), 2-13mm Gypsum Board.
Wall U-value Brick Wall: U= 0.257 W/m²K Curtain Wall: U= 0.643 W/m²K
U= 0.247 W/m²K
Glazing construction
Double Glazing with Thermally Broken Aluminium Frames.

Glazing Properties Operable: U-value: 2.97 W/m m²K Fixed: U-value: 2.15 W/m m²K Shading Coefficient: 0.3
U-value: 2.2 W/m m²K Shading Coefficient: 0.3
Shading Shading Over Main Entrance, Loading Area
Glazing Percentage 10%
Lighting Power Density
13.7 W/m² 9.4 W/m²
Lighting Controls Occupancy Sensors and Daylight
Sensors in some Areas.
Occupancy Sensors in Storage Rooms up to 100m2, Office Space up to 25m2 and Washrooms/Locker Rooms. No occupancy sensors are required where patient care is
rendered.
Plug Loads 26.3 W/m²
Ventilation System
AHU #3(Core 1st ): Supply & Return AHU #4(Core 2nd-4th): Supply &
Return AHU #5/6(Kitchen Hood): Supply
& Return only AHU #7(Laundry): Supply only Fan Coils: North & South Wings
Core Areas: System - 6: Multi-Zone Built Up Systems with Fuel Fired Oil Boiler and Hot Water
Baseboard Heating. Residential Wings: Equal to
baseline.
Fan Power AHU #3: 1.57 W/l/s (supply), 0.85 W/l/s (return) AHU #4: 1.42 W/l/s (supply), 0.87 W/l/s (return) AHU #5/6: 1.70 W/l/s (supply) & 1.71 W/l/s (return)
Minimum Outside Air
Per ASHRAE 62.1-2001 Per ASHRAE 62.1-2007
Heat Recovery
AHU #3: 0% AHU #4: 0% AHU #5/6: 40% AHU #7: 40%
Fan Coils: 67% (North), 59% (South)
AHU #3: 50% AHU #4: 50% AHU #5/6: 50% AHU #7: 0%
Fan Coils: 67% (North), 59% (South)
Economizers
AHU #3: Dual Enthalpy Economizer
AHU #4: Dual Enthalpy Economizer
AHU #5/6: Fixed Enthalpy Economizer
AHU #7: Fixed Enthalpy Economizer
AHU #3: Dual Enthalpy Economizer
AHU #4: Dual Enthalpy Economizer
AHU #5/6: Dual Enthalpy Economizer
AHU #7: Dual Enthalpy Economizer
Demand Control Ventilation
None No Requirement

Heating System Ground Source Heat Pumps with in-
floor radiant heating Two Oil Fuel Fired boilers
Heating efficiency COP: 3.1 83.4%
Cooling System Ground Source Heat Pumps One Water Cooled Chiller
Cooling efficiency COP: 5.7 COP: 4.509 IPLV: 5.582
Domestic Hot Water System
2 Electric Heaters, 75kW each.
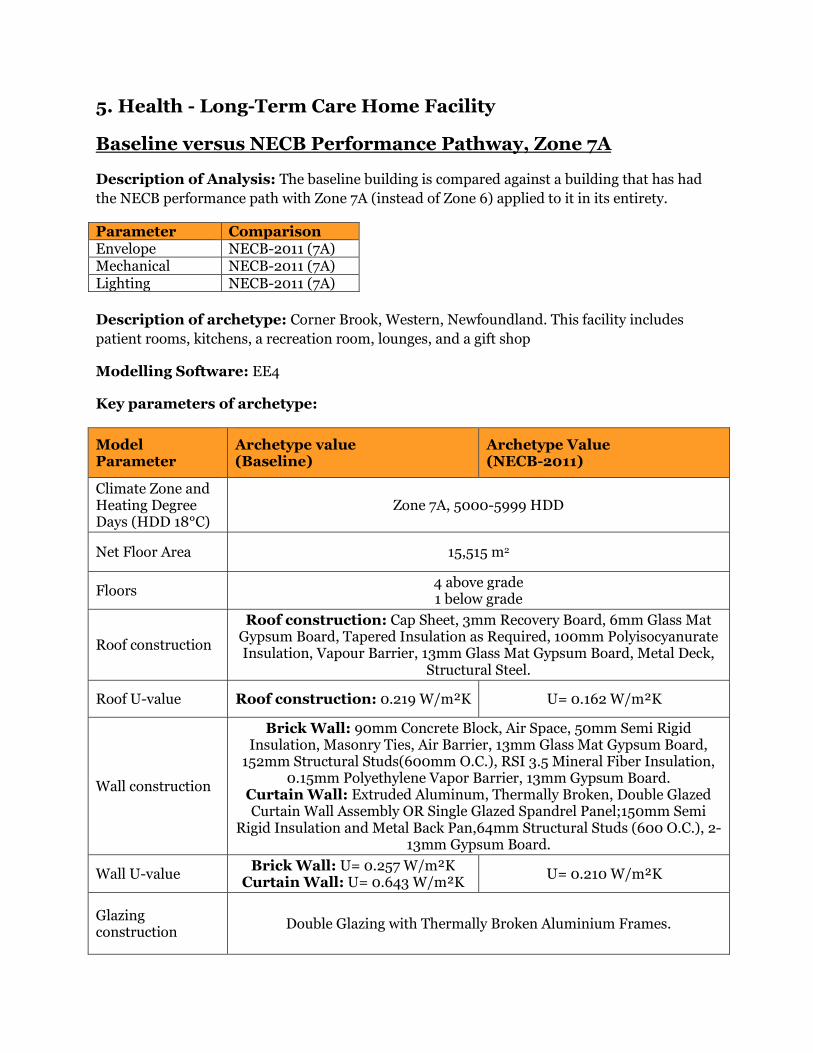
5. Health - Long-Term Care Home Facility
Baseline versus NECB Performance Pathway, Zone 7A
Description of Analysis: The baseline building is compared against a building that has had
the NECB performance path with Zone 7A (instead of Zone 6) applied to it in its entirety.
Parameter Comparison Envelope NECB-2011 (7A) Mechanical NECB-2011 (7A) Lighting NECB-2011 (7A)
Description of archetype: Corner Brook, Western, Newfoundland. This facility includes
patient rooms, kitchens, a recreation room, lounges, and a gift shop
Modelling Software: EE4
Key parameters of archetype:
Model Parameter
Archetype value (Baseline)
Archetype Value (NECB-2011)
Climate Zone and Heating Degree Days (HDD 18°C)
Zone 7A, 5000-5999 HDD
Net Floor Area 15,515 m2
Floors 4 above grade 1 below grade
Roof construction
Roof construction: Cap Sheet, 3mm Recovery Board, 6mm Glass Mat Gypsum Board, Tapered Insulation as Required, 100mm Polyisocyanurate Insulation, Vapour Barrier, 13mm Glass Mat Gypsum Board, Metal Deck,
Structural Steel.
Roof U-value Roof construction: 0.219 W/m²K U= 0.162 W/m²K
Wall construction
Brick Wall: 90mm Concrete Block, Air Space, 50mm Semi Rigid Insulation, Masonry Ties, Air Barrier, 13mm Glass Mat Gypsum Board,
152mm Structural Studs(600mm O.C.), RSI 3.5 Mineral Fiber Insulation, 0.15mm Polyethylene Vapor Barrier, 13mm Gypsum Board.
Curtain Wall: Extruded Aluminum, Thermally Broken, Double Glazed Curtain Wall Assembly OR Single Glazed Spandrel Panel;150mm Semi
Rigid Insulation and Metal Back Pan,64mm Structural Studs (600 O.C.), 2-13mm Gypsum Board.
Wall U-value Brick Wall: U= 0.257 W/m²K
Curtain Wall: U= 0.643 W/m²K U= 0.210 W/m²K
Glazing construction
Double Glazing with Thermally Broken Aluminium Frames.

Glazing Properties Operable: U-value: 2.97 W/m m²K Fixed: U-value: 2.15 W/m m²K
Shading Coefficient: 0.3
U-value: 2.2 W/m m²K Shading Coefficient: 0.3
Shading Shading Over Main Entrance, Loading Area
Glazing Percentage 10%
Lighting Power Density
13.7 W/m² 9.4 W/m²
Lighting Controls Occupancy Sensors and Daylight
Sensors in some Areas.
Occupancy Sensors in Storage Rooms up to 100m2, Office Space up to 25m2 and Washrooms/Locker Rooms. No occupancy sensors are required where patient care is
rendered.
Plug Loads 26.3 W/m²
Ventilation System
AHU #3(Core 1st ): Supply & Return AHU #4(Core 2nd-4th): Supply &
Return AHU #5/6(Kitchen Hood):
Supply & Return only AHU #7(Laundry): Supply only Fan Coils: North & South Wings
Core Areas: System - 6: Multi-Zone Built Up Systems with Fuel Fired Oil Boiler and Hot Water
Baseboard Heating. Residential Wings: Equal to
baseline.
Fan Power AHU #3: 1.57 W/l/s (supply), 0.85 W/l/s (return) AHU #4: 1.42 W/l/s (supply), 0.87 W/l/s (return)
AHU #5/6: 1.70 W/l/s (supply) & 1.71 W/l/s (return)
Minimum Outside Air
Per ASHRAE 62.1-2001 Per ASHRAE 62.1-2007
Heat Recovery
AHU #3: 0% AHU #4: 0%
AHU #5/6: 40% AHU #7: 40%
Fan Coils: 67% (North), 59% (South)
AHU #3: 50% AHU #4: 50%
AHU #5/6: 50% AHU #7: 0%
Fan Coils: 67% (North), 59% (South)
Economizers
AHU #3: Dual Enthalpy Economizer
AHU #4: Dual Enthalpy Economizer
AHU #5/6: Fixed Enthalpy Economizer
AHU #7: Fixed Enthalpy Economizer
AHU #3: Dual Enthalpy Economizer
AHU #4: Dual Enthalpy Economizer
AHU #5/6: Dual Enthalpy Economizer AHU #7: Dual
Enthalpy Economizer
Demand Control Ventilation
None No Requirement

Heating System Ground Source Heat Pumps with in-
floor radiant heating Two Oil Fuel Fired boilers
Heating efficiency COP: 3.1 83.4%
Cooling System Ground Source Heat Pumps One Water Cooled Chiller
Cooling efficiency COP: 5.7 COP: 4.509 IPLV: 5.582
Domestic Hot Water System
2 Electric Heaters, 75kW each.

5. Health - Long-Term Care Home Facility
Baseline versus Performance Pathway with Baseline Envelope
Description of Analysis: The baseline building is compared against a building that has the
baseline envelope and the NECB performance path applied to the mechanical systems and
lighting.
Parameter Comparison Envelope No Change Mechanical NECB-2011 Lighting NECB-2011
Description of archetype: Corner Brook, Western, Newfoundland. This facility includes
patient rooms, kitchens, a recreation room, lounges, and a gift shop
Modelling Software: EE4
Key parameters of archetype:
Model Parameter
Archetype value (Baseline)
Archetype Value (NECB-2011)
Climate Zone and Heating Degree Days (HDD 18°C)
Zone 6, 4760 HDD
Net Floor Area 15,515 m2
Floors 4 above grade 1 below grade
Roof construction
Roof construction: Cap Sheet, 3mm Recovery Board, 6mm Glass Mat Gypsum Board, Tapered Insulation as Required, 100mm Polyisocyanurate Insulation, Vapour Barrier, 13mm Glass Mat Gypsum Board, Metal Deck,
Structural Steel.
Roof U-value Roof construction: 0.219 W/m²K
Wall construction
Brick Wall: 90mm Concrete Block, Air Space, 50mm Semi Rigid Insulation, Masonry Ties, Air Barrier, 13mm Glass Mat Gypsum Board,
152mm Structural Studs(600mm O.C.), RSI 3.5 Mineral Fiber Insulation, 0.15mm Polyethylene Vapor Barrier, 13mm Gypsum Board.
Curtain Wall: Extruded Aluminum, Thermally Broken, Double Glazed Curtain Wall Assembly OR Single Glazed Spandrel Panel;150mm Semi
Rigid Insulation and Metal Back Pan,64mm Structural Studs (600 O.C.), 2-13mm Gypsum Board.
Wall U-value Brick Wall: U= 0.257 W/m²K Curtain Wall: U= 0.643 W/m²K

Glazing construction
Double Glazing with Thermally Broken Aluminium Frames.
Glazing Properties Operable: U-value: 2.97 W/m m²K Fixed: U-value: 2.15 W/m m²K
Shading Coefficient: 0.3
Shading Shading Over Main Entrance, Loading Area
Glazing Percentage 10%
Lighting Power Density
13.7 W/m² 9.4 W/m²
Lighting Controls Occupancy Sensors and Daylight
Sensors in some Areas.
Occupancy Sensors in Storage Rooms up to 100m2, Office Space up to 25m2 and Washrooms/Locker Rooms. No occupancy sensors are
required where patient care is rendered.
Plug Loads 26.3 W/m²
Ventilation System
AHU #3(Core 1st ): Supply & Return AHU #4(Core 2nd-4th): Supply &
Return AHU #5/6(Kitchen Hood): Supply
& Return only AHU #7(Laundry): Supply only Fan Coils: North & South Wings
Core Areas: System - 6: Multi-Zone Built Up Systems with Fuel Fired
Oil Boiler and Hot Water Baseboard Heating.
Residential Wings: Equal to baseline.
Fan Power AHU #3: 1.57 W/l/s (supply), 0.85 W/l/s (return) AHU #4: 1.42 W/l/s (supply), 0.87 W/l/s (return)
AHU #5/6: 1.70 W/l/s (supply) & 1.71 W/l/s (return)
Minimum Outside Air
Per ASHRAE 62.1-2001 Per ASHRAE 62.1-2007
Heat Recovery
AHU #3: 0% AHU #4: 0%
AHU #5/6: 40% AHU #7: 40%
Fan Coils: 67% (North), 59% (South)
AHU #3: 50% AHU #4: 50%
AHU #5/6: 50% AHU #7: 0%
Fan Coils: 67% (North), 59% (South)
Economizers
AHU #3: Dual Enthalpy Economizer
AHU #4: Dual Enthalpy Economizer
AHU #5/6: Fixed Enthalpy Economizer
AHU #7: Fixed Enthalpy Economizer
AHU #3: Dual Enthalpy Economizer
AHU #4: Dual Enthalpy Economizer
AHU #5/6: Dual Enthalpy Economizer
AHU #7: Dual Enthalpy Economizer
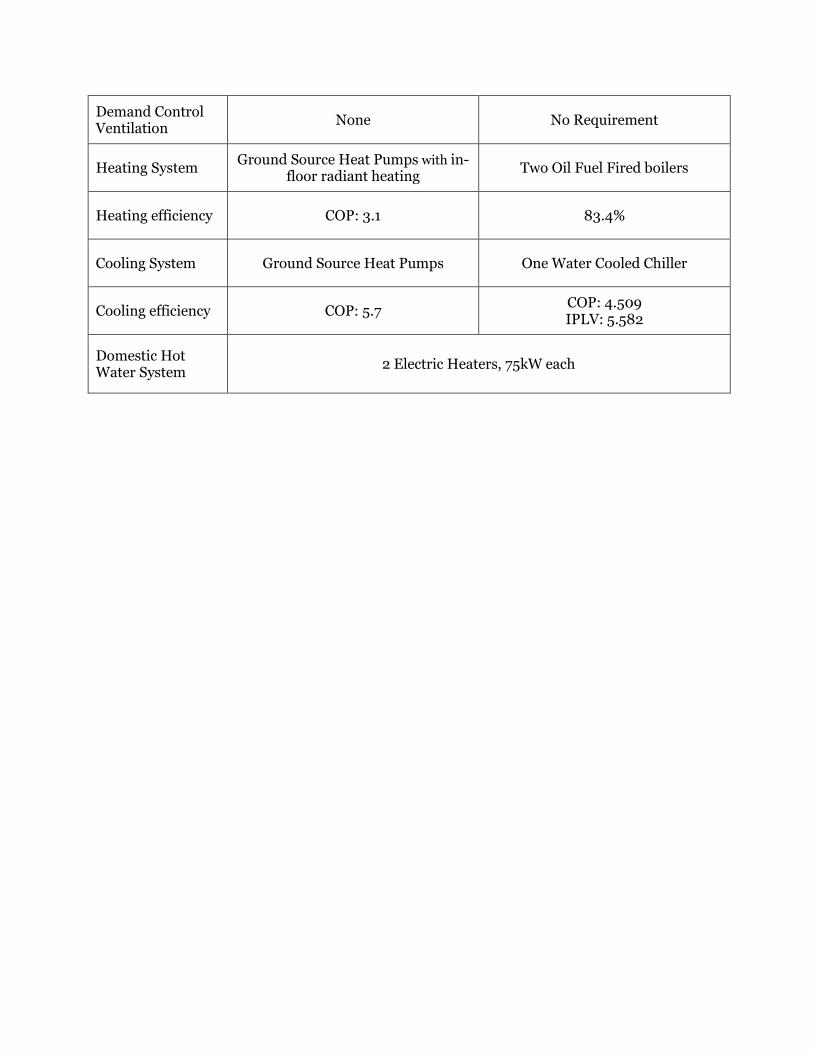
Demand Control Ventilation
None No Requirement
Heating System Ground Source Heat Pumps with in-
floor radiant heating Two Oil Fuel Fired boilers
Heating efficiency COP: 3.1 83.4%
Cooling System Ground Source Heat Pumps One Water Cooled Chiller
Cooling efficiency COP: 5.7 COP: 4.509 IPLV: 5.582
Domestic Hot Water System
2 Electric Heaters, 75kW each

5. Health - Long-Term Care Home Facility
Baseline versus Baseline with NECB Envelope
Description of Analysis: The baseline building is compared against the baseline building
with an NECB envelope.
Parameter Comparison Envelope NECB-2011 Mechanical No Change Lighting No Change
Description of archetype: Corner Brook, Western, Newfoundland. This facility includes
patient rooms, kitchens, a recreation room, lounges, and a gift shop
Modelling Software: EE4
Key parameters of archetype:
Model Parameter
Archetype value (Baseline)
Archetype Value (NECB-2011)
Climate Zone and Heating Degree Days (HDD 18°C)
Zone 6, 4760 HDD
Net Floor Area 15,515 m2
Floors 4 above grade 1 below grade
Roof construction
Roof construction: Cap Sheet, 3mm Recovery Board, 6mm Glass Mat Gypsum Board, Tapered Insulation as Required, 100mm Polyisocyanurate Insulation, Vapour Barrier, 13mm Glass Mat Gypsum Board, Metal Deck,
Structural Steel.
Roof U-value Roof construction: 0.219 W/m²K U= 0.183 W/m²K
Wall construction
Brick Wall: 90mm Concrete Block, Air Space, 50mm Semi Rigid Insulation, Masonry Ties, Air Barrier, 13mm Glass Mat Gypsum Board, 152mm Structural Studs(600mm O.C.), RSI 3.5 Mineral Fiber Insulation,
0.15mm Polyethylene Vapor Barrier, 13mm Gypsum Board. Curtain Wall: Extruded Aluminum, Thermally Broken, Double Glazed Curtain Wall Assembly OR Single Glazed Spandrel Panel;150mm Semi
Rigid Insulation and Metal Back Pan,64mm Structural Studs (600 O.C.), 2-13mm Gypsum Board.
Wall U-value Brick Wall: U= 0.257 W/m²K
Curtain Wall: U= 0.643 W/m²K U= 0.247 W/m²K
Glazing construction
Double Glazing with Thermally Broken Aluminium Frames.

Glazing Properties Operable: U-value: 2.97 W/m m²K Fixed: U-value: 2.15 W/m m²K
Shading Coefficient: 0.3
U-value: 2.2 W/m m²K Shading Coefficient: 0.3
Shading Shading Over Main Entrance, Loading Area
Glazing Percentage 10%
Lighting Power Density
13.7 W/m²
Lighting Controls Occupancy Sensors and Daylight Sensors in some Areas.
Plug Loads 26.3 W/m²
Ventilation System
AHU #3(Core 1st ): Supply & Return AHU #4(Core 2nd-4th): Supply & Return
AHU #5/6(Kitchen Hood): Supply & Return AHU #7(Laundry): Supply only Fan Coils: North & South Wings
Fan Power AHU #3: 1.57 W/l/s (supply), 0.85 W/l/s (return) AHU #4: 1.42 W/l/s (supply), 0.87 W/l/s (return)
AHU #5/6: 1.70 W/l/s (supply) & 1.71 W/l/s (return)
Minimum Outside Air
Per ASHRAE 62.1-2001
Heat Recovery
AHU #3: 0% AHU #4: 0%
AHU #5/6: 40% AHU #7: 40%
Fan Coils: 67% (North), 59% (South)
Economizers
AHU #3: Dual Enthalpy Economizer AHU #4: Dual Enthalpy Economizer
AHU #5/6: Fixed Enthalpy Economizer AHU #7: Fixed Enthalpy Economizer
Demand Control Ventilation
None
Heating System Ground Source Heat Pumps with in-floor radiant heating
Heating efficiency COP: 3.1
Cooling System Ground Source Heat Pumps

Cooling efficiency COP: 5.7
Domestic Hot Water System
2 Electric Heaters, 75kW each

6. Multi-Unit Residential Building
Baseline versus NECB Performance Pathway, Zone 7A
Description of Analysis: The baseline building is compared against a building that has had
the NECB performance path with Zone 7A (instead of Zone 6) applied to it in its entirety.
Parameter Comparison Envelope NECB-2011 (7A) Mechanical NECB-2011 (7A) Lighting NECB-2011 (7A)
Description of archetype: St. John’s, Avalon, Newfoundland. The Memorial University
Residences (MUN Residences) at the St. John’s Campus comprises of two 7-storey wings and a
2-storey central hub.
Modelling Software: EE4
Key parameters of archetype:
Model Parameter
Archetype value (Baseline)
Archetype Value (NECB-2011)
Climate Zone and Heating Degree Days (HDD 18°C)
Zone 7A, 5000-5999 HDD
Net Floor Area 15,694m2
Floors 7 above grade
Roof construction
Common Roof: Cap Sheet, Base Sheet, 3mm Recover Board, 6mm Glass Mat Gypsum board, Tapered EPS, 100mm Polyiso Rigid Insulation, Vapour
Barrier Membrane, Metal deck. Penthouse & Hub Roof: Cap Sheet, Base Sheet, 3mm Recover Board, 6mm Glass Mat Gypsum board, 100mm Polyiso Rigid Insulation, Vapour
Barrier Membrane, 13mm Glass Mat Board, Metal deck.
Roof U-value Common Roof: 0.183 W/m²K
Penthouse & Hub Roof:: 0.225 W/m²K
U= 0.162 W/m²K
Wall construction
Common Wall: 90mm CMU, 25mm Air Space, 50mm Semi-Rigid Fibrous Rock Insulation, Masonry Ties, Air Barrier Membrane, 13mm
Glass Mat Gypsum Board, 152mm Structural Metal Studs @ 600mm O.C, RSI 3.5 Batt Insulation, 0.15mm Polyethylene Vapour Barrier, 16mm VHI
Gypsum Board. Stairwell Wall: 90mm CMU, 25mm Air Space, 75mm Semi-Rigid
Fibrous Rock Insulation, Masonry Ties, Air Barrier Membrane, Reinforced Concrete Wall.
Penthouse Wall: Standing Seam Metal Roof, 75mm Z-Bars @ 600mm

O.C, 50mm semi-rigid Fibrous Rock Insulation, 13mm Glass Mat Gypsum board, 152mm Structural Metal Studs @ 600mm O.C, RSI 3.5 Batt Insulation, 0.15mm Polyethylene Vapour Barrier, Metal Liner Panel.
First Floor, Lower Wall: Existing Reinforced Concrete, 50mm XPS Rigid Insulation, 0.15mm Polyethylene Vapour Barrier, 150mm Reinforced
Concrete. Curtain Wall (Spandrel): Insulated Spandrel Panel, 152 Structural
Metal Studs @ 600mm O.C, 16mm VHI Gypsum Board.
Wall U-value
Common Wall: 0.275 W/m²K Stairwell Wall: 0.390 W/m²K
Penthouse Wall: 0.283 W/m²K First Floor, Lower Wall: 0.481
W/m²K Curtain Wall (Spandrel): 0.729
W/m²K
U=0.210 W/m²K
Glazing construction
Double Glazing with Thermally Broken Aluminium Frames.
Glazing Properties U-value: 1.76 W/m m²K Shading Coefficient: 0.44
U-value: 2.2 W/m m²K Shading Coefficient: 0.44
Shading No shading (overhangs)
Glazing Percentage 17%
Lighting Power Density
Common Areas: 6.9 W/m² Bedrooms: 7.4 W/m²
Common Areas: 6.9 W/m² Bedrooms: 7.4 W/m²
Lighting Controls Occupancy Sensors and Daylight
Sensors in some areas.
Occupancy Sensors in Conference, Meeting and Training Rooms, Storage Rooms up to 100m2 and
Washrooms.
Plug Loads Common Areas: 1.1 W/m²
Bedrooms: 2.5 W/m²
Ventilation System
HRV #1 & 2, East & West, HRV #3, East & West: Heat recovery
ventilators, 100% fresh air. Electric Baseboard heating.
System - 6 (Common Areas): Multi-Zone Built Up Systems with
Variable Volume Fan Control, Water Cooled Chiller, and Electric
Resistance Baseboard Heating. System 1 (Bedrooms): Unitary Air Conditioner with Electric Resistance
Baseboard.
Fan Power HRV #1 & 2, East & West: 2.96 W/l/s HRV #3, East & West: 3.16 W/l/s
Minimum Outside Air
Per ASHRAE 62.1-2001 Per ASHRAE 62.1-2007
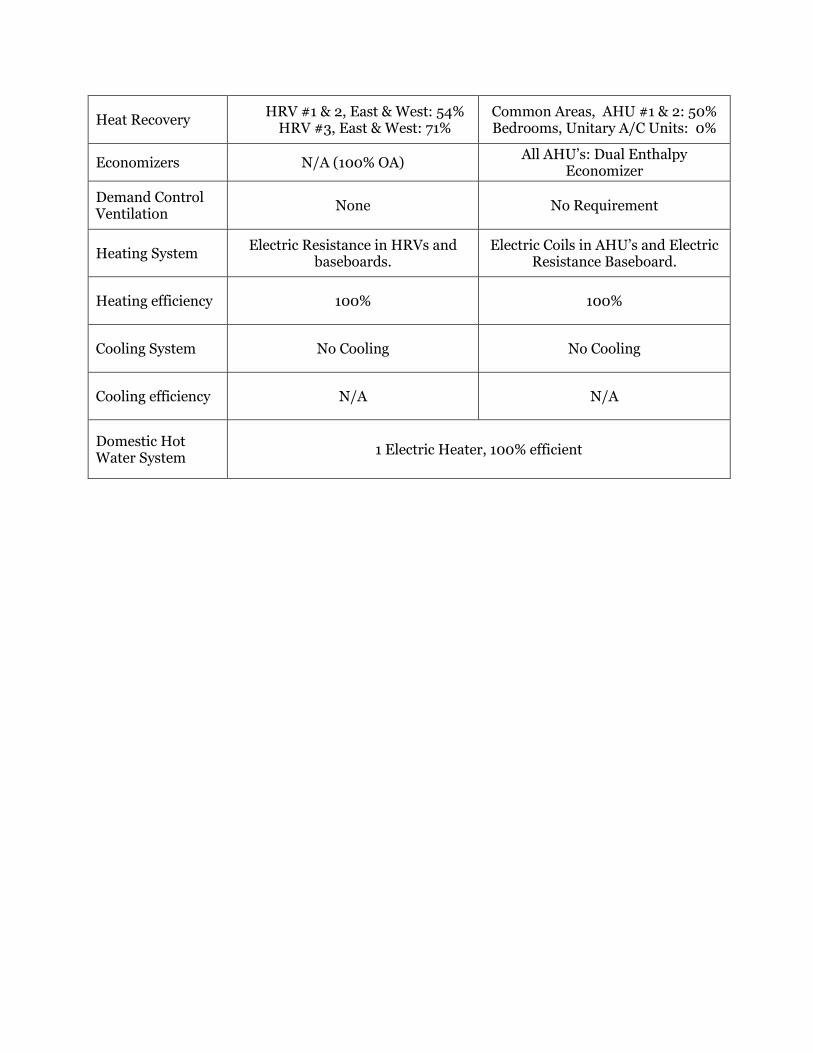
Heat Recovery HRV #1 & 2, East & West: 54% HRV #3, East & West: 71%
Common Areas, AHU #1 & 2: 50% Bedrooms, Unitary A/C Units: 0%
Economizers N/A (100% OA) All AHU’s: Dual Enthalpy
Economizer
Demand Control Ventilation
None No Requirement
Heating System Electric Resistance in HRVs and
baseboards. Electric Coils in AHU’s and Electric
Resistance Baseboard.
Heating efficiency 100% 100%
Cooling System No Cooling No Cooling
Cooling efficiency N/A N/A
Domestic Hot Water System
1 Electric Heater, 100% efficient

7. Warehouse
Baseline versus NECB Performance Pathway, Zone 7A
Description of Analysis: The baseline building is compared against a building that has had
the NECB performance path with Zone 7A (instead of Zone 6) applied to it in its entirety.
Parameter Comparison Envelope NECB-2011 (7A) Mechanical NECB-2011 (7A) Lighting NECB-2011 (7A)
Description of archetype: Mount Pearl, Avalon, Newfoundland. This facility includes a
Warehouse, with an Electrical Room, Storage room and Sprinkler room.
Modelling Software: eQUEST
Key parameters of archetype:
Model Parameter
Archetype value (Baseline)
Archetype Value (NECB-2011)
Climate Zone and Heating Degree Days (HDD 18°C)
Zone 7A, 5000-5999 HDD
Net Floor Area 3,808 m2
Floors 1 above grade
Roof construction Roof Construction: 2 Ply Modified Roofing membrane, 5mm Semi Rigid
Protection Board, R40 (7”) Polyiso Insulation, Self-Adhered Roof Membrane, Metal Roof Deck, O.W.S.J.
Roof U-value Roof Construction: 0.142
W/m²K U= 0.162 W/m²K
Wall construction Wall Construction: 13mm GWB, 64mm Steel Stud (406mm O.C), 13mm
Air Space, Vapour Barrier, 100mm Insulation, 152mm Tilt Up Wall
Wall U-value Wall Construction: 0.284
W/m²K U= 0.210 W/m²K
Glazing construction
Double Glazing with Thermally Broken Aluminium Frames. Aluminium framed skylight

Glazing Properties
Windows: U-value: 2.6 W/m m²K Shading Coefficient: 0.42
Skylight: U-value: 2.2 W/m m²K Shading Coefficient: 0.42
U-value: 2.2 W/m m²K Shading Coefficient: 0.42
Shading No shading (overhangs)
Glazing Percentage Windows: 0.9% Skylight: 1.5%
Lighting Power Density
Office: 5.8 W/m² Warehouse: 5.8 W/m²
Office: 9.7 W/m² Warehouse: 7.1 W/m²
Lighting Controls Toggle Switches, Occupancy Sensors
in Smaller Rooms
Occupancy Sensors in Office Areas and Washrooms/Locker Rooms. Daylight Sensors in Skylight Area.
Plug Loads Office: 7.0 W/m²
Warehouse: 16.1 W/m²
Ventilation System Five Identical HRV units
Office: System - 3: Single Zone Packaged Rooftop Units with
Baseboard Heating System - 4: Single Zone
Constant Volume Make-Up Air Unit with Baseboard Heating
Fan Power 0.877 W/l/s (5 identical units)
Minimum Outside Air
Per ASHRAE 62.1-2001 Per ASHRAE 62.1-2007
Heat Recovery HRV’s: 70% PSZ: 50%
Economizers HRV’s: Outside Air Temperature
Economizer PSZ: Dual Enthalpy Economizer
Demand Control Ventilation
CO2 sensors No Requirement
Heating System Electric Heaters
System - 3: Electric Resistance for Rooftop and Baseboards
System - 4: Electric Coil Make-up Air Unit
Heating efficiency 100%
Cooling System Air Cooled Direct-Expansion

Cooling efficiency COP: 2.9 EER: 13/10.7/10.6 Dependent on
capacity of NECB-2011 Unit
Domestic Hot Water System
1 Electric Heater, 100% efficient

Stantec
APPENDIX D
Energy Results
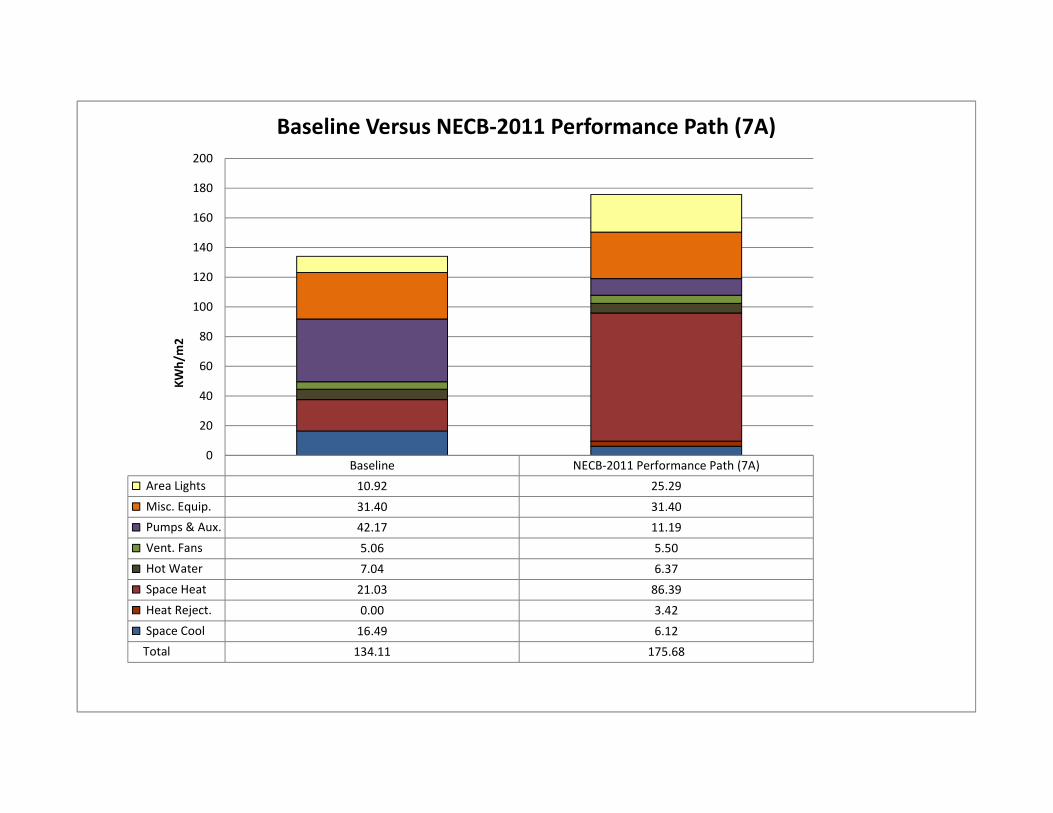
Baseline NECB-2011 Performance Path (7A)
Area Lights 10.92 25.29
Misc. Equip. 31.40 31.40
Pumps & Aux. 42.17 11.19
Vent. Fans 5.06 5.50
Hot Water 7.04 6.37
Space Heat 21.03 86.39
Heat Reject. 0.00 3.42
Space Cool 16.49 6.12
Total 134.11 175.68
0
20
40
60
80
100
120
140
160
180
200
KW
h/m
2
Baseline Versus NECB-2011 Performance Path (7A)

Baseline NECB-2011 Performance Path (7A)
Area Lights 35.87 28.21
Misc. Equip. 25.24 25.24
Pumps & Aux. 34.12 72.17
Vent. Fans 22.99 33.05
Space Heat 32.70 128.86
Heat Reject. 0.00 0.28
Space Cool 28.45 15.13
Total 179.37 302.93
0
50
100
150
200
250
300
350
KW
h/m
2
Baseline Versus NECB-2011 Performance Path (7A)

Baseline Baseline, ASHP
NECB-2011
Performance
Path
NECB-2011
Performance
Path, 7A
NECB-2011
Performance
Path, Baseline
Envelope
NECB-2011
Envelope
Area Lights 17.23 17.22 19.27 19.27 19.27 17.23
Misc. Equip. 8.96 8.97 8.97 8.97 8.97 8.96
Pumps & Aux. 9.21 2.22 5.54 5.52 5.57 8.98
Vent. Fans 8.71 45.97 40.87 40.57 42.06 8.29
Hot Water 8.59 8.85 8.55 8.55 8.55 8.59
Space Heat 67.66 72.52 75.62 73.48 86.74 64.67
Space Cool 4.79 10.23 15.23 15.06 16.09 5.16
Total 125.15 165.98 174.05 171.45 187.27 121.88
0
20
40
60
80
100
120
140
160
180
200
KW
h/m
2
Baseline Versus NECB-2011 Performance Path

Baseline
NECB-2011
Performance Path
(Zone 8)
NECB-2011
Performance Path
(Zone 7A)
NECB-2011
Performance Path
(Zone 6)
Area Lights 36.50 29.13 29.13 29.13
Misc. Equip. 38.45 38.45 38.45 38.45
Pumps & Aux. 37.76 34.51 34.62 34.75
Vent. Fans 70.17 68.62 69.81 70.65
Hot Water 53.11 53.09 53.09 53.09
Space Heat 191.76 190.79 197.34 204.21
Space Cool 19.16 1.51 1.51 1.51
Total 446.91 416.10 423.96 431.78
0
50
100
150
200
250
300
350
400
450
500
KW
h/m
2
Education, College Campus: Baseline Versus NECB-2011 Performance Path
36.50 (8%)
38.45 (9%)
37.76 (8%)
70.17 (16%)
53.11 (12%)
191.76 (43%)
19.16 (4%)
29.13 (7%)
38.45 (9%)
34.51 (8%)
68.62 (16%)
53.09 (13%)
190.79 (46%)
1.51 (0%)
29.13 (7%)
38.45 (9%)
34.62 (8%)
69.81 (16%)
53.09 (13%)
197.34 (47%)
1.51 (0%)
29.13 (7%)
38.45 (9%)
34.75 (8%)
70.65 (16%)
53.09 (12%)
204.21 (47%)
1.51 (0%)

BaselineNECB-2011
Performance Path
NECB-2011
Performance Path,
7A
NECB-2011
Performance Path,
Baseline Envelope
NECB-2011
Envelope
Area Lights 70.14 43.83 43.83 43.83 70.14
Misc. Equip. 26.29 26.29 26.29 26.29 26.29
Pumps & Aux. 19.40 8.21 8.25 8.16 19.47
Vent. Fans 35.45 34.83 34.84 34.82 35.47
Hot Water 4.22 4.22 4.22 4.22 4.22
Space Heat 26.53 87.24 86.31 89.47 26.04
Heat Reject. 0.00 0.45 0.45 0.45 0.00
Space Cool 1.05 1.25 1.25 1.25 1.05
Total 183.07 206.32 205.45 208.50 182.67
0
50
100
150
200
250
KW
h/m
2
Baseline Versus NECB-2011 Performance Path

Baseline NECB-2011 Performance Path (7A)
Area Lights 14.62 15.63
Misc. Equip. 7.39 7.39
Vent. Fans 96.00 52.13
Hot Water 21.47 21.47
Space Heat 76.49 138.07
Space Cool 0.06 0.01
Total 216.03 234.70
0
50
100
150
200
250
KW
h/m
2
Baseline Versus NECB-2011 Performance Path (7A)

Baseline NECB-2011 Performance Path (7A)
Area Lights 11.40 15.68
Misc. Equip. 21.05 21.05
Pumps & Aux. 0.08 0.58
Vent. Fans 3.56 11.61
Hot Water 1.26 1.26
Space Heat 57.87 47.04
Space Cool 1.50 0.97
Total 96.73 98.18
0
20
40
60
80
100
120
KW
h/m
2
Baseline Versus NECB-2011 Performance Path(7A)

Stantec
APPENDIX E
Costings
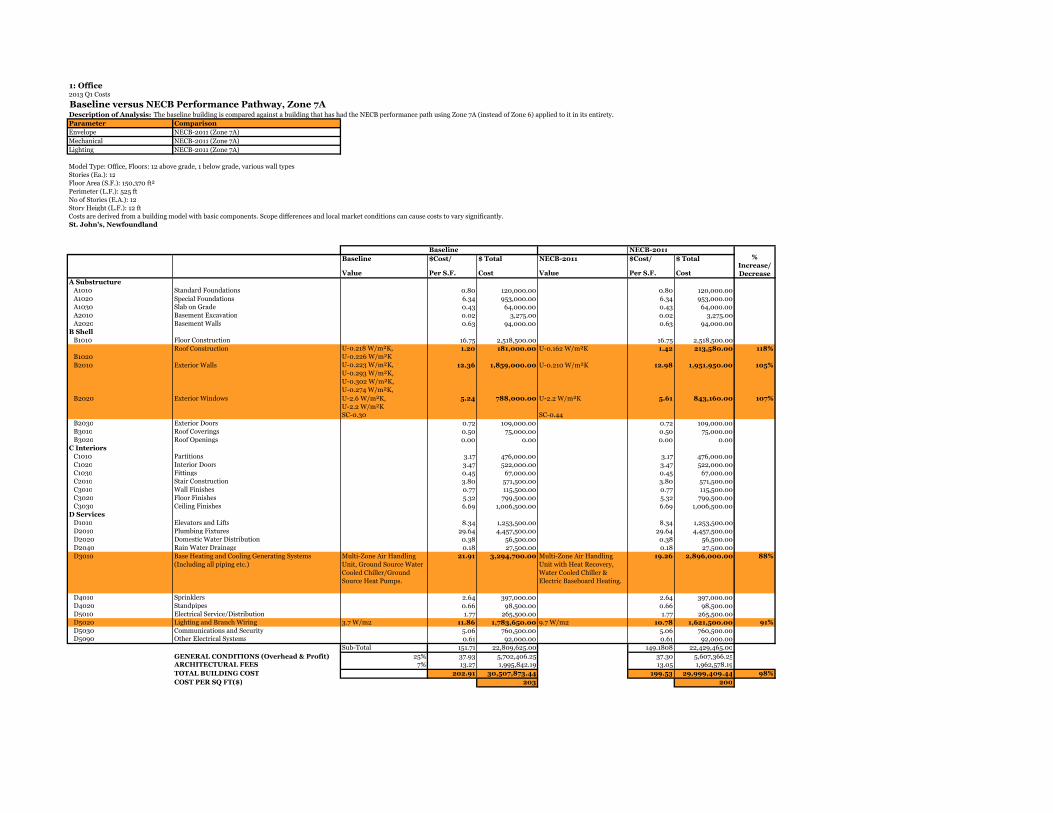
1: Office2013 Q1 Costs
Baseline versus NECB Performance Pathway, Zone 7A Description of Analysis: The baseline building is compared against a building that has had the NECB performance path using Zone 7A (instead of Zone 6) applied to it in its entirety.
Parameter Comparison
Envelope NECB-2011 (Zone 7A)
Mechanical NECB-2011 (Zone 7A)
Lighting NECB-2011 (Zone 7A)
Model Type: Office, Floors: 12 above grade, 1 below grade, various wall types.
Stories (Ea.): 12
Floor Area (S.F.): 150,370 ft²
Perimeter (L.F.): 525 ft
No of Stories (E.A.): 12
Story Height (L.F.): 12 ft
Costs are derived from a building model with basic components. Scope differences and local market conditions can cause costs to vary significantly.
St. John's, Newfoundland
Baseline NECB-2011
Baseline $Cost/ $ Total NECB-2011 $Cost/ $ Total
Value Per S.F. Cost Value Per S.F. Cost
A Substructure
A1010 Standard Foundations 0.80 120,000.00 0.80 120,000.00
A1020 Special Foundations 6.34 953,000.00 6.34 953,000.00
A1030 Slab on Grade 0.43 64,000.00 0.43 64,000.00
A2010 Basement Excavation 0.02 3,275.00 0.02 3,275.00
A2020 Basement Walls 0.63 94,000.00 0.63 94,000.00
B Shell
B1010 Floor Construction 16.75 2,518,500.00 16.75 2,518,500.00
B1020
Roof Construction U-0.218 W/m²K,
U-0.226 W/m²K1.20 181,000.00 U-0.162 W/m²K 1.42 213,580.00 118%
B2010 Exterior Walls U-0.223 W/m²K,
U-0.293 W/m²K,
U-0.302 W/m²K,
U-0.274 W/m²K,
12.36 1,859,000.00 U-0.210 W/m²K 12.98 1,951,950.00 105%
B2020 Exterior Windows U-2.6 W/m²K,
U-2.2 W/m²K
5.24 788,000.00 U-2.2 W/m²K 5.61 843,160.00 107%
SC-0.30 SC-0.44
B2030 Exterior Doors 0.72 109,000.00 0.72 109,000.00
B3010 Roof Coverings 0.50 75,000.00 0.50 75,000.00
B3020 Roof Openings 0.00 0.00 0.00 0.00
C Interiors
C1010 Partitions 3.17 476,000.00 3.17 476,000.00
C1020 Interior Doors 3.47 522,000.00 3.47 522,000.00
C1030 Fittings 0.45 67,000.00 0.45 67,000.00
C2010 Stair Construction 3.80 571,500.00 3.80 571,500.00
C3010 Wall Finishes 0.77 115,500.00 0.77 115,500.00
C3020 Floor Finishes 5.32 799,500.00 5.32 799,500.00
C3030 Ceiling Finishes 6.69 1,006,500.00 6.69 1,006,500.00
D Services
D1010 Elevators and Lifts 8.34 1,253,500.00 8.34 1,253,500.00
D2010 Plumbing Fixtures 29.64 4,457,500.00 29.64 4,457,500.00
D2020 Domestic Water Distribution 0.38 56,500.00 0.38 56,500.00
D2040 Rain Water Drainage 0.18 27,500.00 0.18 27,500.00
D3010 Base Heating and Cooling Generating Systems
(Including all piping etc.)
Multi-Zone Air Handling
Unit, Ground Source Water
Cooled Chiller/Ground
Source Heat Pumps.
21.91 3,294,700.00 Multi-Zone Air Handling
Unit with Heat Recovery,
Water Cooled Chiller &
Electric Baseboard Heating.
19.26 2,896,000.00 88%
D4010 Sprinklers 2.64 397,000.00 2.64 397,000.00
D4020 Standpipes 0.66 98,500.00 0.66 98,500.00
D5010 Electrical Service/Distribution 1.77 265,500.00 1.77 265,500.00
D5020 Lighting and Branch Wiring 3.7 W/m2 11.86 1,783,650.00 9.7 W/m2 10.78 1,621,500.00 91%
D5030 Communications and Security 5.06 760,500.00 5.06 760,500.00 D5090 Other Electrical Systems 0.61 92,000.00 0.61 92,000.00
Sub-Total 151.71 22,809,625.00 149.1808 22,429,465.00
GENERAL CONDITIONS (Overhead & Profit) 25% 37.93 5,702,406.25 37.30 5,607,366.25
ARCHITECTURAL FEES 7% 13.27 1,995,842.19 13.05 1,962,578.19
TOTAL BUILDING COST 202.91 30,507,873.44 199.53 29,999,409.44 98%
COST PER SQ FT($) 203 200
%
Increase/
Decrease

2: Office2013 Q1 Costs
Baseline versus NECB Performance Pathway, Zone 7A Description of Analysis: The baseline building is compared against a building that has had the NECB performance path using Zone 7A (instead of Zone 6) applied to it in its entirety.
Parameter Comparison
Envelope NECB-2011 (Zone 7A)
Mechanical NECB-2011 (Zone 7A)
Lighting NECB-2011 (Zone 7A)
Model Type: Office, Floors: 7 above grade, unitized curtain wall system (this building has 6 levels of parking below the office levels which are not included in the costing below)
Stories (Ea.): 7
Floor Area (S.F.): 173,256 ft²
Perimeter (L.F.): 709 ft
No of Stories (E.A.): 7
Story Height (L.F.): 13 ft
Costs are derived from a building model with basic components. Scope differences and local market conditions can cause costs to vary significantly.
St. John's, Newfoundland
Baseline NECB-2011
Baseline $Cost/ $ Total NECB-2011 $Cost/ $ Total
Value Per S.F. Cost Value Per S.F. Cost
A Substructure
A1010 Standard Foundations 1.95 337,500.00 1.95 337,500.00
A1030 Slab on Grade 0.73 126,500.00 0.73 126,500.00
A2010 Basement Excavation 0.04 6,475.00 0.04 6,475.00
A2020 Basement Walls 0.39 67,500.00 0.39 67,500.00
B Shell
B1010 Floor Construction 16.90 2,928,500.00 16.90 2,928,500.00
B1020 Roof Construction U-0.183 W/m²K 2.02 350,500.00 U-0.162 W/m²K 2.32 403,075.00 115%
B2010 Exterior Walls U-0.187 W/m²K 9.16 1,586,500.00 U-0.210 W/m²K 8.98 1,554,770.00 98%
B2020 Exterior Windows U-1.39 W/m²K 3.21 557,000.00 U-2.2 W/m²K 3.02 523,580.00 94%
SC-0.30 SC-0.44
B2030 Exterior Doors 0.28 48,800.00 0.28 48,800.00
B3010 Roof Coverings 0.81 140,500.00 0.81 140,500.00
B3020 Roof Openings 0.00 0.00 0.00 0.00
C Interiors
C1010 Partitions 2.51 435,000.00 2.51 435,000.00
C1020 Interior Doors 3.47 601,500.00 3.47 601,500.00
C1030 Fittings 0.77 133,500.00 0.77 133,500.00
C2010 Stair Construction 3.47 601,000.00 3.47 601,000.00
C3010 Wall Finishes 0.96 166,500.00 0.96 166,500.00
C3020 Floor Finishes 9.68 1,677,500.00 9.68 1,677,500.00
C3030 Ceiling Finishes 6.69 1,159,500.00 6.69 1,159,500.00
D Services
D1010 Elevators and Lifts 16.79 2,908,500.00 16.79 2,908,500.00
D2010 Plumbing Fixtures 2.89 500,000.00 2.89 500,000.00
D2020 Domestic Water Distribution 0.63 109,500.00 0.63 109,500.00
D2040 Rain Water Drainage 0.30 51,500.00 0.30 51,500.00
D3010 Base Heating and Cooling Generating Systems
(Including all piping etc.)
Multi-Zone Air Handling
Units with Packaged
Chiller/Heat Pump
connected to Seawater
Loop.
23.75 4,114,905.22 Multi-Zone Air Handling
Units with Water Cooled
Chiller & Electric Baseboard
Heating.
17.73 3,072,000.00 75%
D4010 Sprinklers 2.75 476,000.00 2.75 476,000.00
D4020 Standpipes 0.86 148,500.00 0.86 148,500.00
D5010 Electrical Service/Distribution 0.78 136,000.00 0.78 136,000.00
D5020 Lighting and Branch Wiring 11.8 W/m2 8.83 1,530,530.00 9.7 W/m2 10.77 1,866,500.00 122%
D5030 Communications and Security 4.20 727,500.00 4.20 727,500.00
D5090 Other Electrical Systems 1.19 207,000.00 1.19 207,000.00
E Equipment & Furnishings
E1020 Institutional Equipment 0 0.00 0 0.00
E1090 Other Equipment 0.00 0.00 0.00 0.00
Sub-Total 126.01 21,834,210.22 121.8572 21,114,700.00
GENERAL CONDITIONS (Overhead & Profit) 25% 31.50 5,458,552.56 30.46 5,278,675.00
ARCHITECTURAL FEES 7% 11.03 1,910,493.39 10.66 1,847,536.25
TOTAL BUILDING COST 168.54 29,203,256.17 162.98 28,240,911.25 97%
COST PER SQ FT($) 169 163
%
Increase/
Decrease

3: Education -School2013 Q1 Costs
NECB versus NECB with Air Source Heat Pump (ASHP)Description of Analysis: The NECB building is compared against the NECB building with air source heat pumps.
Parameter Comparison
Envelope NECB-2011
Mechanical ASHP
Lighting NECB-2011
Model Type: School, High, 2-3 Story, Face Brick with Concrete Block Back-up / Steel Frame
Stories (Ea.): 2
Floor Area (S.F.): 64,950 ft²
Perimeter (L.F.): 1,273 ft
No of Stories (E.A.): 2
Story Height (L.F.): 14.2 ft
Costs are derived from a building model with basic components. Scope differences and local market conditions can cause costs to vary significantly.
St. John's, Newfoundland
Baseline NECB-2011
Baseline $Cost/ $ Total NECB-2011 $Cost/ $ Total
Value Per S.F. Cost Value Per S.F. Cost
A Substructure
A1010 Standard Foundations 1.37 89,000.00 1.37 89,000.00
A1030 Slab on Grade 2.56 166,000.00 2.56 166,000.00
A2010 Basement Excavation 0.07 4,775.00 0.07 4,775.00
A2020 Basement Walls 1.46 95,000.00 1.46 95,000.00
B Shell
B1010 Floor Construction 15.39 999,500.00 15.39 999,500.00
B1020 Roof Construction U-0.22 W/m²K,
U-0.58 W/m²K
6.62 430,000.00 U-0.22 W/m²K,
U-0.58 W/m²K
6.62 430,000.00
B2010 Exterior Walls U-0.33 W/m²K 12.83 833,500.00 U-0.33 W/m²K 12.83 833,500.00
B2020 Exterior Windows U-1.65 W/m²K 7.85 510,000.00 U-1.65 W/m²K 7.85 510,000.00
SC-0.44 SC-0.44
B2030 Exterior Doors 0.71 46,200.00 0.71 46,200.00
B3010 Roof Coverings 6.05 393,000.00 6.05 393,000.00
B3020 Roof Openings 0.03 1,975.00 0.03 1,975.00
C Interiors
C1010 Partitions 5.15 334,500.00 5.15 334,500.00
C1020 Interior Doors 1.86 120,500.00 1.86 120,500.00
C1030 Fittings 1.51 98,000.00 1.51 98,000.00
C2010 Stair Construction 0.89 58,000.00 0.89 58,000.00
C3010 Wall Finishes 4.75 308,500.00 4.75 308,500.00
C3020 Floor Finishes 7.96 517,000.00 7.96 517,000.00
C3030 Ceiling Finishes 6.69 434,500.00 6.69 434,500.00
D Services
D1010 Elevators and Lifts 0.85 55,000.00 0.85 55,000.00
D2010 Plumbing Fixtures 5.89 382,500.00 5.89 382,500.00
D2020 Domestic Water Distribution 1.25 81,000.00 1.25 81,000.00
D2040 Rain Water Drainage 1.24 80,500.00 1.24 80,500.00
D3010 Base Heating and Cooling Generating Systems
(Including all piping etc.)
Multi-Zone Air Handling
Units with Zone Heat
Pumps, Ground Source
Heat Pump System.
30.56 1,984,680.00 Single-Zone Air Source Heat
Pumps, Electric Baseboard
Heating.
21.70 1,409,122.80 71%
D4010 Sprinklers 2.41 156,500.00 2.41 156,500.00
D4020 Standpipes 0.39 25,400.00 0.39 25,400.00
D5010 Electrical Service/Distribution 1.17 76,000.00 1.17 76,000.00
D5020 Lighting and Branch Wiring 9.0 W/m2
10.07 653,400.00 9.0 W/m2
10.07 653,400.00
D5030 Communications and Security 4.15 269,500.00 4.15 269,500.00
D5090 Other Electrical Systems 0.44 28,900.00 0.44 28,900.00
E Equipment & Furnishings
E1020 Institutional Equipment 2.59 168,000.00 2.59 168,000.00 E1090 Other Equipment 1.24 80,500.00 1.24 80,500.00
Sub-Total 146.00 9,481,830.00 137.13402 8,906,272.80
GENERAL CONDITIONS (Overhead & Profit) 25% 36.50 2,370,457.50 34.28 2,226,568.20
ARCHITECTURAL FEES 7% 12.77 829,660.13 12.00 779,298.87
TOTAL BUILDING COST 195.27 12,681,947.63 183.42 11,912,139.87 94%
COST PER SQ FT($) 195 183
%
Increase/
Decrease

3: Education -School2013 Q1 Costs
Baseline versus NECB Performance PathwayDescription of Analysis: The baseline building is compared against a building that has had the NECB performance path applied to it in its entirety.
Parameter Comparison
Envelope NECB-2011
Mechanical NECB-2011
Lighting NECB-2011
Model Type: School, High, 2-3 Story, Face Brick with Concrete Block Back-up / Steel Frame
Stories (Ea.): 2
Floor Area (S.F.): 64,950 ft²
Perimeter (L.F.): 1,273 ft
No of Stories (E.A.): 2
Story Height (L.F.): 14.2 ft
Costs are derived from a building model with basic components. Scope differences and local market conditions can cause costs to vary significantly.
St. John's, Newfoundland
Baseline NECB-2011
Baseline $Cost/ $ Total NECB-2011 $Cost/ $ Total
Value Per S.F. Cost Value Per S.F. Cost
A Substructure
A1010 Standard Foundations 1.37 89,000.00 1.37 89,000.00
A1030 Slab on Grade 2.56 166,000.00 2.56 166,000.00
A2010 Basement Excavation 0.07 4,775.00 0.07 4,775.00
A2020 Basement Walls 1.46 95,000.00 1.46 95,000.00
B Shell
B1010 Floor Construction 15.39 999,500.00 15.39 999,500.00
B1020 Roof Construction U-0.22 W/m²K,
U-0.58 W/m²K
6.62 430,000.00 U-0.183 W/m²K 6.95 451,500.00 105%
B2010 Exterior Walls U-0.33 W/m²K 12.83 833,500.00 U-0.247 W/m²K 13.60 883,510.00 106%
B2020 Exterior Windows U-1.65 W/m²K 7.85 510,000.00 U-2.2 W/m²K 7.38 479,400.00 94%
SC-0.44 SC-0.44
B2030 Exterior Doors 0.71 46,200.00 0.71 46,200.00
B3010 Roof Coverings 6.05 393,000.00 6.05 393,000.00
B3020 Roof Openings 0.03 1,975.00 0.03 1,975.00
C Interiors
C1010 Partitions 5.15 334,500.00 5.15 334,500.00
C1020 Interior Doors 1.86 120,500.00 1.86 120,500.00
C1030 Fittings 1.51 98,000.00 1.51 98,000.00
C2010 Stair Construction 0.89 58,000.00 0.89 58,000.00
C3010 Wall Finishes 4.75 308,500.00 4.75 308,500.00
C3020 Floor Finishes 7.96 517,000.00 7.96 517,000.00
C3030 Ceiling Finishes 6.69 434,500.00 6.69 434,500.00
D Services
D1010 Elevators and Lifts 0.85 55,000.00 0.85 55,000.00
D2010 Plumbing Fixtures 5.89 382,500.00 5.89 382,500.00
D2020 Domestic Water Distribution 1.25 81,000.00 1.25 81,000.00
D2040 Rain Water Drainage 1.24 80,500.00 1.24 80,500.00
D3010 Base Heating and Cooling Generating Systems
(Including all piping etc.)
Multi-Zone Air Handling
Units, Ground Source Heat
Pump System.
30.56 1,984,680.00 Single-Zone Packaged
Rooftop Units, Electric
Baseboard Heating.
20.65 1,341,000.00 67%
D4010 Sprinklers 2.41 156,500.00 2.41 156,500.00
D4020 Standpipes 0.39 25,400.00 0.39 25,400.00
D5010 Electrical Service/Distribution 1.17 76,000.00 1.17 76,000.00
D5020 Lighting and Branch Wiring 9.0 W/m2
10.07 653,400.00 10.7 W/m2
9.15 594,000.00 91%
D5030 Communications and Security 4.15 269,500.00 4.15 269,500.00
D5090 Other Electrical Systems 0.44 28,900.00 0.44 28,900.00
E Equipment & Furnishings
E1020 Institutional Equipment 2.59 168,000.00 2.59 168,000.00 E1090 Other Equipment 1.24 80,500.00 1.24 80,500.00
Sub-Total 146.00 9,481,830.00 135.7998 8,819,660.00
GENERAL CONDITIONS (Overhead & Profit) 25% 36.50 2,370,457.50 33.95 2,204,915.00
ARCHITECTURAL FEES 7% 12.77 829,660.13 11.88 771,720.25
TOTAL BUILDING COST 195.27 12,681,947.63 181.63 11,796,295.25 93%
COST PER SQ FT($) 195 182
%
Increase/
Decrease

3: Education -School2013 Q1 Costs
Baseline versus NECB Performance Pathway, Zone 7ADescription of Analysis: The baseline building is compared against a building that has had the NECB performance path using Zone 7A (instead of Zone 6) applied to it in its entirety.
Parameter Comparison
Envelope NECB-2011 (7A)
Mechanical NECB-2011 (7A)
Lighting NECB-2011 (7A)
Model Type: School, High, 2-3 Story, Face Brick with Concrete Block Back-up / Steel Frame
Stories (Ea.): 2
Floor Area (S.F.): 64,950 ft²
Perimeter (L.F.): 1,273 ft
No of Stories (E.A.): 2
Story Height (L.F.): 14.2 ft
Costs are derived from a building model with basic components. Scope differences and local market conditions can cause costs to vary significantly.
St. John's, Newfoundland
Baseline NECB-2011
Baseline $Cost/ $ Total NECB-2011 $Cost/ $ Total
Value Per S.F. Cost Value Per S.F. Cost
A Substructure
A1010 Standard Foundations 1.37 89,000.00 1.37 89,000.00
A1030 Slab on Grade 2.56 166,000.00 2.56 166,000.00
A2010 Basement Excavation 0.07 4,775.00 0.07 4,775.00
A2020 Basement Walls 1.46 95,000.00 1.46 95,000.00
B Shell
B1010 Floor Construction 15.39 999,500.00 15.39 999,500.00
B1020 Roof Construction U-0.22 W/m²K,
U-0.58 W/m²K
6.62 430,000.00 U-0.162 W/m²K 7.75 503,100.00 117%
B2010 Exterior Walls U-0.33 W/m²K 12.83 833,500.00 U-0.210 W/m²K 13.60 883,510.00 106%
B2020 Exterior Windows U-1.65 W/m²K 7.85 510,000.00 U-2.2 W/m²K 7.38 479,400.00 94%
SC-0.44 SC-0.44
B2030 Exterior Doors 0.71 46,200.00 0.71 46,200.00
B3010 Roof Coverings 6.05 393,000.00 6.05 393,000.00
B3020 Roof Openings 0.03 1,975.00 0.03 1,975.00
C Interiors
C1010 Partitions 5.15 334,500.00 5.15 334,500.00
C1020 Interior Doors 1.86 120,500.00 1.86 120,500.00
C1030 Fittings 1.51 98,000.00 1.51 98,000.00
C2010 Stair Construction 0.89 58,000.00 0.89 58,000.00
C3010 Wall Finishes 4.75 308,500.00 4.75 308,500.00
C3020 Floor Finishes 7.96 517,000.00 7.96 517,000.00
C3030 Ceiling Finishes 6.69 434,500.00 6.69 434,500.00
D Services
D1010 Elevators and Lifts 0.85 55,000.00 0.85 55,000.00
D2010 Plumbing Fixtures 5.89 382,500.00 5.89 382,500.00
D2020 Domestic Water Distribution 1.25 81,000.00 1.25 81,000.00
D2040 Rain Water Drainage 1.24 80,500.00 1.24 80,500.00
D3010 Base Heating and Cooling Generating Systems
(Including all piping etc.)
Multi-Zone Air Handling
Units, Ground Source Heat
Pump System.
30.56 1,984,680.00 Single-Zone Packaged
Rooftop Units, Electric
Baseboard Heating.
20.65 1,341,000.00 67%
D4010 Sprinklers 2.41 156,500.00 2.41 156,500.00
D4020 Standpipes 0.39 25,400.00 0.39 25,400.00
D5010 Electrical Service/Distribution 1.17 76,000.00 1.17 76,000.00
D5020 Lighting and Branch Wiring 9.0 W/m2
10.07 653,400.00 10.7 W/m2
9.15 594,000.00 91%
D5030 Communications and Security 4.15 269,500.00 4.15 269,500.00
D5090 Other Electrical Systems 0.44 28,900.00 0.44 28,900.00
E Equipment & Furnishings
E1020 Institutional Equipment 2.59 168,000.00 2.59 168,000.00 E1090 Other Equipment 1.24 80,500.00 1.24 80,500.00
Sub-Total 146.00 9,481,830.00 136.5942 8,871,260.00
GENERAL CONDITIONS (Overhead & Profit) 25% 36.50 2,370,457.50 34.15 2,217,815.00
ARCHITECTURAL FEES 7% 12.77 829,660.13 11.95 776,235.25
TOTAL BUILDING COST 195.27 12,681,947.63 182.69 11,865,310.25 94%
COST PER SQ FT($) 195 183
%
Increase/
Decrease
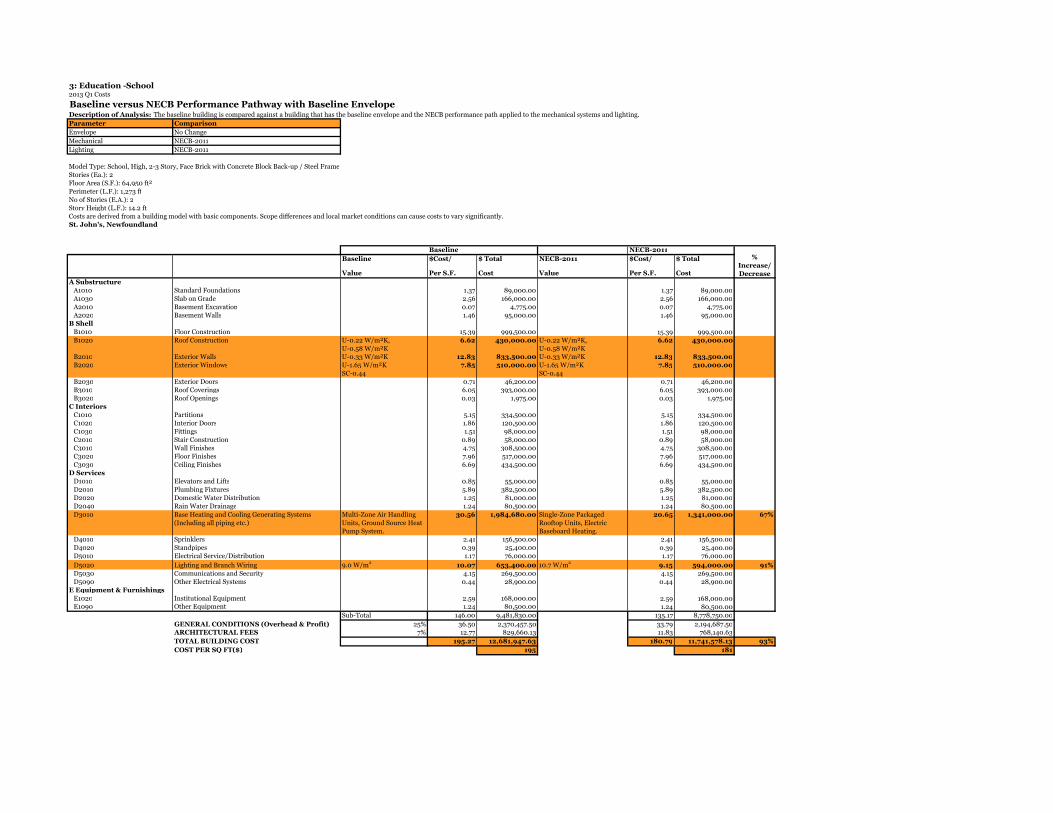
3: Education -School2013 Q1 Costs
Baseline versus NECB Performance Pathway with Baseline EnvelopeDescription of Analysis: The baseline building is compared against a building that has the baseline envelope and the NECB performance path applied to the mechanical systems and lighting.
Parameter Comparison
Envelope No Change
Mechanical NECB-2011
Lighting NECB-2011
Model Type: School, High, 2-3 Story, Face Brick with Concrete Block Back-up / Steel Frame
Stories (Ea.): 2
Floor Area (S.F.): 64,950 ft²
Perimeter (L.F.): 1,273 ft
No of Stories (E.A.): 2
Story Height (L.F.): 14.2 ft
Costs are derived from a building model with basic components. Scope differences and local market conditions can cause costs to vary significantly.
St. John's, Newfoundland
Baseline NECB-2011
Baseline $Cost/ $ Total NECB-2011 $Cost/ $ Total
Value Per S.F. Cost Value Per S.F. Cost
A Substructure
A1010 Standard Foundations 1.37 89,000.00 1.37 89,000.00
A1030 Slab on Grade 2.56 166,000.00 2.56 166,000.00
A2010 Basement Excavation 0.07 4,775.00 0.07 4,775.00
A2020 Basement Walls 1.46 95,000.00 1.46 95,000.00
B Shell
B1010 Floor Construction 15.39 999,500.00 15.39 999,500.00
B1020 Roof Construction U-0.22 W/m²K,
U-0.58 W/m²K
6.62 430,000.00 U-0.22 W/m²K,
U-0.58 W/m²K
6.62 430,000.00
B2010 Exterior Walls U-0.33 W/m²K 12.83 833,500.00 U-0.33 W/m²K 12.83 833,500.00
B2020 Exterior Windows U-1.65 W/m²K 7.85 510,000.00 U-1.65 W/m²K 7.85 510,000.00
SC-0.44 SC-0.44
B2030 Exterior Doors 0.71 46,200.00 0.71 46,200.00
B3010 Roof Coverings 6.05 393,000.00 6.05 393,000.00
B3020 Roof Openings 0.03 1,975.00 0.03 1,975.00
C Interiors
C1010 Partitions 5.15 334,500.00 5.15 334,500.00
C1020 Interior Doors 1.86 120,500.00 1.86 120,500.00
C1030 Fittings 1.51 98,000.00 1.51 98,000.00
C2010 Stair Construction 0.89 58,000.00 0.89 58,000.00
C3010 Wall Finishes 4.75 308,500.00 4.75 308,500.00
C3020 Floor Finishes 7.96 517,000.00 7.96 517,000.00
C3030 Ceiling Finishes 6.69 434,500.00 6.69 434,500.00
D Services
D1010 Elevators and Lifts 0.85 55,000.00 0.85 55,000.00
D2010 Plumbing Fixtures 5.89 382,500.00 5.89 382,500.00
D2020 Domestic Water Distribution 1.25 81,000.00 1.25 81,000.00
D2040 Rain Water Drainage 1.24 80,500.00 1.24 80,500.00
D3010 Base Heating and Cooling Generating Systems
(Including all piping etc.)
Multi-Zone Air Handling
Units, Ground Source Heat
Pump System.
30.56 1,984,680.00 Single-Zone Packaged
Rooftop Units, Electric
Baseboard Heating.
20.65 1,341,000.00 67%
D4010 Sprinklers 2.41 156,500.00 2.41 156,500.00
D4020 Standpipes 0.39 25,400.00 0.39 25,400.00
D5010 Electrical Service/Distribution 1.17 76,000.00 1.17 76,000.00
D5020 Lighting and Branch Wiring 9.0 W/m2
10.07 653,400.00 10.7 W/m2
9.15 594,000.00 91%
D5030 Communications and Security 4.15 269,500.00 4.15 269,500.00
D5090 Other Electrical Systems 0.44 28,900.00 0.44 28,900.00
E Equipment & Furnishings
E1020 Institutional Equipment 2.59 168,000.00 2.59 168,000.00 E1090 Other Equipment 1.24 80,500.00 1.24 80,500.00
Sub-Total 146.00 9,481,830.00 135.17 8,778,750.00
GENERAL CONDITIONS (Overhead & Profit) 25% 36.50 2,370,457.50 33.79 2,194,687.50
ARCHITECTURAL FEES 7% 12.77 829,660.13 11.83 768,140.63
TOTAL BUILDING COST 195.27 12,681,947.63 180.79 11,741,578.13 93%
COST PER SQ FT($) 195 181
%
Increase/
Decrease
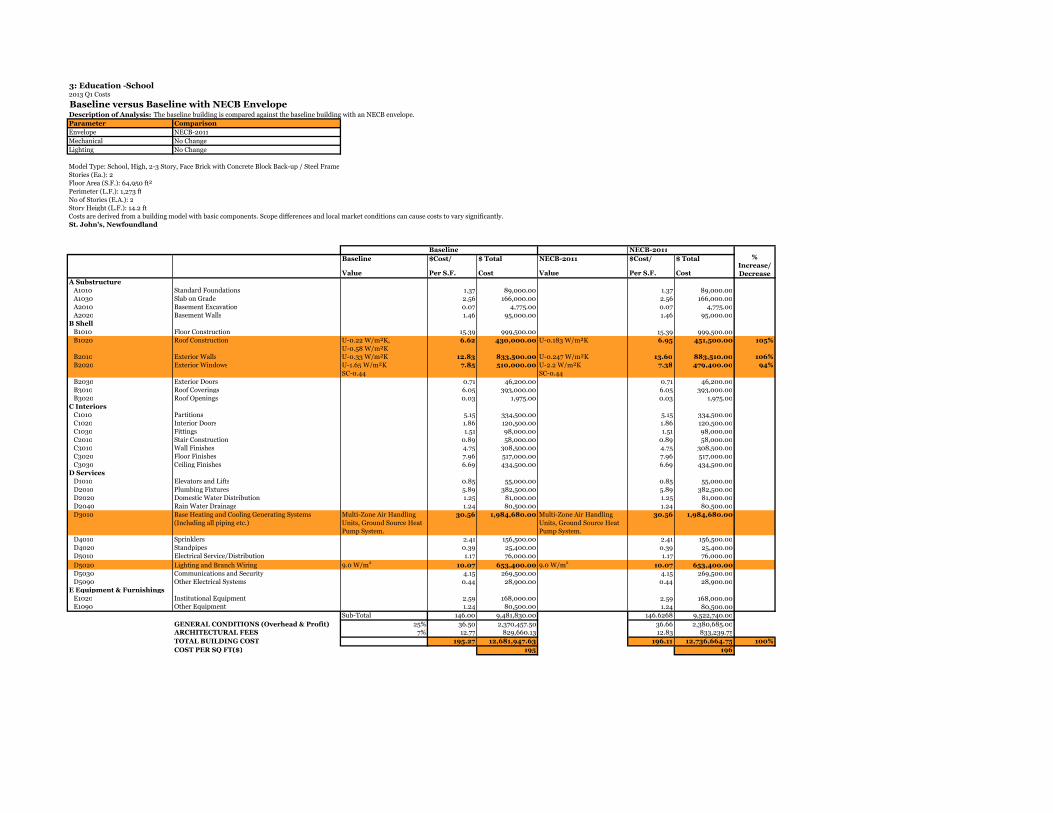
3: Education -School2013 Q1 Costs
Baseline versus Baseline with NECB EnvelopeDescription of Analysis: The baseline building is compared against the baseline building with an NECB envelope.
Parameter Comparison
Envelope NECB-2011
Mechanical No Change
Lighting No Change
Model Type: School, High, 2-3 Story, Face Brick with Concrete Block Back-up / Steel Frame
Stories (Ea.): 2
Floor Area (S.F.): 64,950 ft²
Perimeter (L.F.): 1,273 ft
No of Stories (E.A.): 2
Story Height (L.F.): 14.2 ft
Costs are derived from a building model with basic components. Scope differences and local market conditions can cause costs to vary significantly.
St. John's, Newfoundland
Baseline NECB-2011
Baseline $Cost/ $ Total NECB-2011 $Cost/ $ Total
Value Per S.F. Cost Value Per S.F. Cost
A Substructure
A1010 Standard Foundations 1.37 89,000.00 1.37 89,000.00
A1030 Slab on Grade 2.56 166,000.00 2.56 166,000.00
A2010 Basement Excavation 0.07 4,775.00 0.07 4,775.00
A2020 Basement Walls 1.46 95,000.00 1.46 95,000.00
B Shell
B1010 Floor Construction 15.39 999,500.00 15.39 999,500.00
B1020 Roof Construction U-0.22 W/m²K,
U-0.58 W/m²K
6.62 430,000.00 U-0.183 W/m²K 6.95 451,500.00 105%
B2010 Exterior Walls U-0.33 W/m²K 12.83 833,500.00 U-0.247 W/m²K 13.60 883,510.00 106%
B2020 Exterior Windows U-1.65 W/m²K 7.85 510,000.00 U-2.2 W/m²K 7.38 479,400.00 94%
SC-0.44 SC-0.44
B2030 Exterior Doors 0.71 46,200.00 0.71 46,200.00
B3010 Roof Coverings 6.05 393,000.00 6.05 393,000.00
B3020 Roof Openings 0.03 1,975.00 0.03 1,975.00
C Interiors
C1010 Partitions 5.15 334,500.00 5.15 334,500.00
C1020 Interior Doors 1.86 120,500.00 1.86 120,500.00
C1030 Fittings 1.51 98,000.00 1.51 98,000.00
C2010 Stair Construction 0.89 58,000.00 0.89 58,000.00
C3010 Wall Finishes 4.75 308,500.00 4.75 308,500.00
C3020 Floor Finishes 7.96 517,000.00 7.96 517,000.00
C3030 Ceiling Finishes 6.69 434,500.00 6.69 434,500.00
D Services
D1010 Elevators and Lifts 0.85 55,000.00 0.85 55,000.00
D2010 Plumbing Fixtures 5.89 382,500.00 5.89 382,500.00
D2020 Domestic Water Distribution 1.25 81,000.00 1.25 81,000.00
D2040 Rain Water Drainage 1.24 80,500.00 1.24 80,500.00
D3010 Base Heating and Cooling Generating Systems
(Including all piping etc.)
Multi-Zone Air Handling
Units, Ground Source Heat
Pump System.
30.56 1,984,680.00 Multi-Zone Air Handling
Units, Ground Source Heat
Pump System.
30.56 1,984,680.00
D4010 Sprinklers 2.41 156,500.00 2.41 156,500.00
D4020 Standpipes 0.39 25,400.00 0.39 25,400.00
D5010 Electrical Service/Distribution 1.17 76,000.00 1.17 76,000.00
D5020 Lighting and Branch Wiring 9.0 W/m2
10.07 653,400.00 9.0 W/m2
10.07 653,400.00
D5030 Communications and Security 4.15 269,500.00 4.15 269,500.00
D5090 Other Electrical Systems 0.44 28,900.00 0.44 28,900.00
E Equipment & Furnishings
E1020 Institutional Equipment 2.59 168,000.00 2.59 168,000.00 E1090 Other Equipment 1.24 80,500.00 1.24 80,500.00
Sub-Total 146.00 9,481,830.00 146.6268 9,522,740.00
GENERAL CONDITIONS (Overhead & Profit) 25% 36.50 2,370,457.50 36.66 2,380,685.00
ARCHITECTURAL FEES 7% 12.77 829,660.13 12.83 833,239.75
TOTAL BUILDING COST 195.27 12,681,947.63 196.11 12,736,664.75 100%
COST PER SQ FT($) 195 196
%
Increase/
Decrease
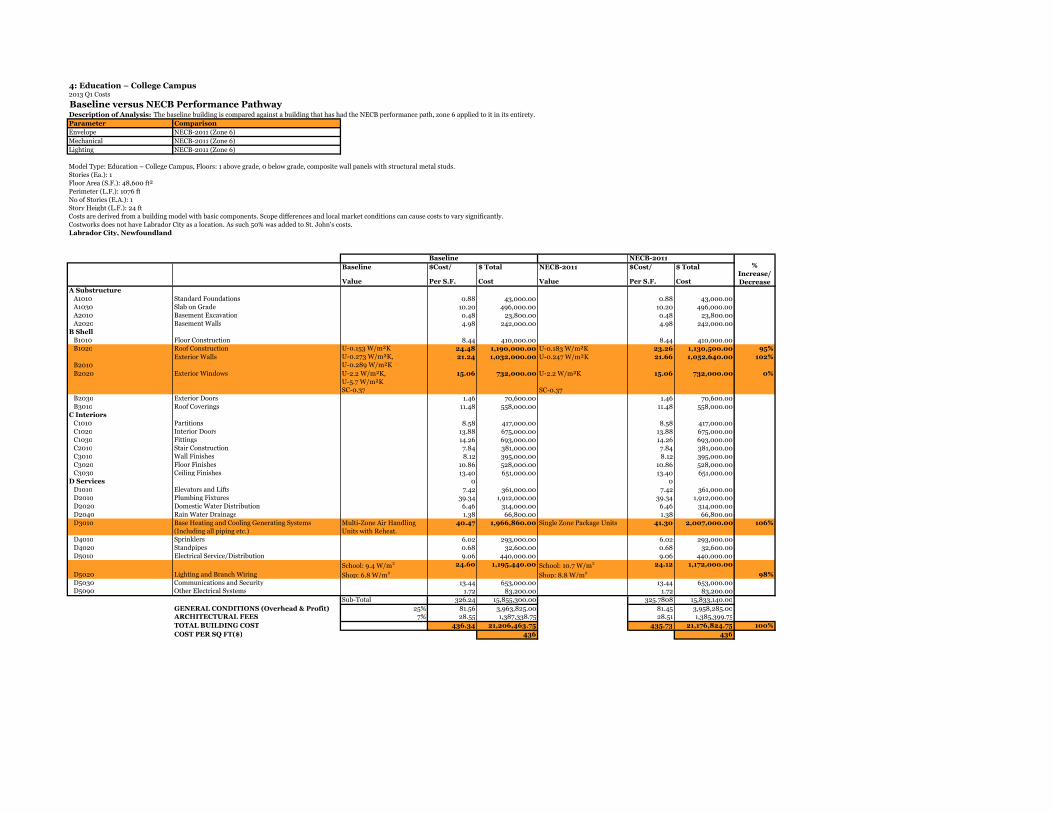
4: Education – College Campus2013 Q1 Costs
Baseline versus NECB Performance PathwayDescription of Analysis: The baseline building is compared against a building that has had the NECB performance path, zone 6 applied to it in its entirety.
Parameter Comparison
Envelope NECB-2011 (Zone 6)
Mechanical NECB-2011 (Zone 6)
Lighting NECB-2011 (Zone 6)
Model Type: Education – College Campus, Floors: 1 above grade, 0 below grade, composite wall panels with structural metal studs.
Stories (Ea.): 1
Floor Area (S.F.): 48,600 ft²
Perimeter (L.F.): 1076 ft
No of Stories (E.A.): 1
Story Height (L.F.): 24 ft
Costs are derived from a building model with basic components. Scope differences and local market conditions can cause costs to vary significantly.
Costworks does not have Labrador City as a location. As such 50% was added to St. John's costs.
Labrador City, Newfoundland
Baseline NECB-2011
Baseline $Cost/ $ Total NECB-2011 $Cost/ $ Total
Value Per S.F. Cost Value Per S.F. Cost
A Substructure
A1010 Standard Foundations 0.88 43,000.00 0.88 43,000.00
A1030 Slab on Grade 10.20 496,000.00 10.20 496,000.00
A2010 Basement Excavation 0.48 23,800.00 0.48 23,800.00
A2020 Basement Walls 4.98 242,000.00 4.98 242,000.00
B Shell
B1010 Floor Construction 8.44 410,000.00 8.44 410,000.00
B1020 Roof Construction U-0.153 W/m²K 24.48 1,190,000.00 U-0.183 W/m²K 23.26 1,130,500.00 95%
B2010
Exterior Walls U-0.273 W/m²K,
U-0.289 W/m²K21.24 1,032,000.00 U-0.247 W/m²K 21.66 1,052,640.00 102%
B2020 Exterior Windows U-2.2 W/m²K,
U-5.7 W/m²K
15.06 732,000.00 U-2.2 W/m²K 15.06 732,000.00 0%
SC-0.37 SC-0.37
B2030 Exterior Doors 1.46 70,600.00 1.46 70,600.00
B3010 Roof Coverings 11.48 558,000.00 11.48 558,000.00
C Interiors
C1010 Partitions 8.58 417,000.00 8.58 417,000.00
C1020 Interior Doors 13.88 675,000.00 13.88 675,000.00
C1030 Fittings 14.26 693,000.00 14.26 693,000.00
C2010 Stair Construction 7.84 381,000.00 7.84 381,000.00
C3010 Wall Finishes 8.12 395,000.00 8.12 395,000.00
C3020 Floor Finishes 10.86 528,000.00 10.86 528,000.00
C3030 Ceiling Finishes 13.40 651,000.00 13.40 651,000.00
D Services 0 0
D1010 Elevators and Lifts 7.42 361,000.00 7.42 361,000.00
D2010 Plumbing Fixtures 39.34 1,912,000.00 39.34 1,912,000.00
D2020 Domestic Water Distribution 6.46 314,000.00 6.46 314,000.00
D2040 Rain Water Drainage 1.38 66,800.00 1.38 66,800.00
D3010 Base Heating and Cooling Generating Systems
(Including all piping etc.)
Multi-Zone Air Handling
Units with Reheat.
40.47 1,966,860.00 Single Zone Package Units 41.30 2,007,000.00 106%
D4010 Sprinklers 6.02 293,000.00 6.02 293,000.00
D4020 Standpipes 0.68 32,600.00 0.68 32,600.00
D5010 Electrical Service/Distribution 9.06 440,000.00 9.06 440,000.00
D5020 Lighting and Branch Wiring
School: 9.4 W/m2
Shop: 6.8 W/m2
24.60 1,195,440.00 School: 10.7 W/m2
Shop: 8.8 W/m2
24.12 1,172,000.00
98%
D5030 Communications and Security 13.44 653,000.00 13.44 653,000.00 D5090 Other Electrical Systems 1.72 83,200.00 1.72 83,200.00
Sub-Total 326.24 15,855,300.00 325.7808 15,833,140.00
GENERAL CONDITIONS (Overhead & Profit) 25% 81.56 3,963,825.00 81.45 3,958,285.00
ARCHITECTURAL FEES 7% 28.55 1,387,338.75 28.51 1,385,399.75
TOTAL BUILDING COST 436.34 21,206,463.75 435.73 21,176,824.75 100%
COST PER SQ FT($) 436 436
%
Increase/
Decrease

4: Education – College Campus2013 Q1 Costs
Baseline versus NECB Performance PathwayDescription of Analysis: The baseline building is compared against a building that has had the NECB performance path, zone 7A applied to it in its entirety.
Parameter Comparison
Envelope NECB-2011 (Zone 7A)
Mechanical NECB-2011 (Zone 7A)
Lighting NECB-2011 (Zone 7A)
Model Type: Education – College Campus, Floors: 1 above grade, 0 below grade, composite wall panels with structural metal studs.
Stories (Ea.): 1
Floor Area (S.F.): 48,600 ft²
Perimeter (L.F.): 1076 ft
No of Stories (E.A.): 1
Story Height (L.F.): 24 ft
Costs are derived from a building model with basic components. Scope differences and local market conditions can cause costs to vary significantly.
Costworks does not have Labrador City as a location. As such 50% was added to St. John's costs.
Labrador City, Newfoundland
Baseline NECB-2011
Baseline $Cost/ $ Total NECB-2011 $Cost/ $ Total
Value Per S.F. Cost Value Per S.F. Cost
A Substructure
A1010 Standard Foundations 0.88 43,000.00 0.88 43,000.00
A1030 Slab on Grade 10.20 496,000.00 10.20 496,000.00
A2010 Basement Excavation 0.48 23,800.00 0.48 23,800.00
A2020 Basement Walls 4.98 242,000.00 4.98 242,000.00
B Shell
B1010 Floor Construction 8.44 410,000.00 8.44 410,000.00
B1020 Roof Construction U-0.153 W/m²K 24.48 1,190,000.00 U-0.162 W/m²K 23.99 1,166,200.00 98%
B2010
Exterior Walls U-0.273 W/m²K,
U-0.289 W/m²K21.24 1,032,000.00 U-0.210 W/m²K 22.51 1,093,920.00 106%
B2020 Exterior Windows U-2.2 W/m²K,
U-5.7 W/m²K
15.06 732,000.00 U-2.2 W/m²K 15.06 732,000.00 0%
SC-0.37 SC-0.37
B2030 Exterior Doors 1.46 70,600.00 1.46 70,600.00
B3010 Roof Coverings 11.48 558,000.00 11.48 558,000.00
C Interiors
C1010 Partitions 8.58 417,000.00 8.58 417,000.00
C1020 Interior Doors 13.88 675,000.00 13.88 675,000.00
C1030 Fittings 14.26 693,000.00 14.26 693,000.00
C2010 Stair Construction 7.84 381,000.00 7.84 381,000.00
C3010 Wall Finishes 8.12 395,000.00 8.12 395,000.00
C3020 Floor Finishes 10.86 528,000.00 10.86 528,000.00
C3030 Ceiling Finishes 13.40 651,000.00 13.40 651,000.00
D Services 0 0
D1010 Elevators and Lifts 7.42 361,000.00 7.42 361,000.00
D2010 Plumbing Fixtures 39.34 1,912,000.00 39.34 1,912,000.00
D2020 Domestic Water Distribution 6.46 314,000.00 6.46 314,000.00
D2040 Rain Water Drainage 1.38 66,800.00 1.38 66,800.00
D3010 Base Heating and Cooling Generating Systems
(Including all piping etc.)
Multi-Zone Air Handling
Units with Reheat.
40.47 1,966,860.00 Single Zone Package Units 41.30 2,007,000.00 106%
D4010 Sprinklers 6.02 293,000.00 6.02 293,000.00
D4020 Standpipes 0.68 32,600.00 0.68 32,600.00
D5010 Electrical Service/Distribution 9.06 440,000.00 9.06 440,000.00
D5020 Lighting and Branch Wiring
School: 9.4 W/m2
Shop: 6.8 W/m2
24.60 1,195,440.00 School: 10.7 W/m2
Shop: 8.8 W/m2
24.12 1,172,000.00
98%
D5030 Communications and Security 13.44 653,000.00 13.44 653,000.00 D5090 Other Electrical Systems 1.72 83,200.00 1.72 83,200.00
Sub-Total 326.24 15,855,300.00 327.3648 15,910,120.00
GENERAL CONDITIONS (Overhead & Profit) 25% 81.56 3,963,825.00 81.84 3,977,530.00
ARCHITECTURAL FEES 7% 28.55 1,387,338.75 28.64 1,392,135.50
TOTAL BUILDING COST 436.34 21,206,463.75 437.85 21,279,785.50 100%
COST PER SQ FT($) 436 438
%
Increase/
Decrease

4: Education – College Campus2013 Q1 Costs
Baseline versus NECB Performance PathwayDescription of Analysis: The baseline building is compared against a building that has had the NECB performance path (Zone 8) applied to it in its entirety.
Parameter Comparison
Envelope NECB-2011 (Zone 8)
Mechanical NECB-2011 (Zone 8)
Lighting NECB-2011 (Zone 8)
Model Type: Education – College Campus, Floors: 1 above grade, 0 below grade, composite wall panels with structural metal studs.
Stories (Ea.): 1
Floor Area (S.F.): 48,600 ft²
Perimeter (L.F.): 1076 ft
No of Stories (E.A.): 1
Story Height (L.F.): 24 ft
Costs are derived from a building model with basic components. Scope differences and local market conditions can cause costs to vary significantly.
Costworks does not have Labrador City as a location. As such 50% was added to St. John's costs.
Labrador City, Newfoundland
Baseline NECB-2011
Baseline $Cost/ $ Total NECB-2011 $Cost/ $ Total
Value Per S.F. Cost Value Per S.F. Cost
A Substructure
A1010 Standard Foundations 0.88 43,000.00 0.88 43,000.00
A1030 Slab on Grade 10.20 496,000.00 10.20 496,000.00
A2010 Basement Excavation 0.48 23,800.00 0.48 23,800.00
A2020 Basement Walls 4.98 242,000.00 4.98 242,000.00
B Shell
B1010 Floor Construction 8.44 410,000.00 8.44 410,000.00
B1020 Roof Construction U-0.153 W/m²K 24.48 1,190,000.00 U-0.142 W/m²K 25.46 1,237,600.00 104%
B2010
Exterior Walls U-0.273 W/m²K,
U-0.289 W/m²K21.24 1,032,000.00 U-0.183 W/m²K 22.73 1,104,240.00 107%
B2020 Exterior Windows U-2.2 W/m²K,
U-5.7 W/m²K
15.06 732,000.00 U-1.6 W/m²K 16.87 819,840.00 112%
SC-0.37 SC-0.37
B2030 Exterior Doors 1.46 70,600.00 1.46 70,600.00
B3010 Roof Coverings 11.48 558,000.00 11.48 558,000.00
C Interiors
C1010 Partitions 8.58 417,000.00 8.58 417,000.00
C1020 Interior Doors 13.88 675,000.00 13.88 675,000.00
C1030 Fittings 14.26 693,000.00 14.26 693,000.00
C2010 Stair Construction 7.84 381,000.00 7.84 381,000.00
C3010 Wall Finishes 8.12 395,000.00 8.12 395,000.00
C3020 Floor Finishes 10.86 528,000.00 10.86 528,000.00
C3030 Ceiling Finishes 13.40 651,000.00 13.40 651,000.00
D Services 0 0
D1010 Elevators and Lifts 7.42 361,000.00 7.42 361,000.00
D2010 Plumbing Fixtures 39.34 1,912,000.00 39.34 1,912,000.00
D2020 Domestic Water Distribution 6.46 314,000.00 6.46 314,000.00
D2040 Rain Water Drainage 1.38 66,800.00 1.38 66,800.00
D3010 Base Heating and Cooling Generating Systems
(Including all piping etc.)
Multi-Zone Air Handling
Units with Reheat.
40.47 1,966,860.00 Single Zone Package Units 41.30 2,007,000.00 106%
D4010 Sprinklers 6.02 293,000.00 6.02 293,000.00
D4020 Standpipes 0.68 32,600.00 0.68 32,600.00
D5010 Electrical Service/Distribution 9.06 440,000.00 9.06 440,000.00
D5020 Lighting and Branch Wiring
School: 9.4 W/m2
Shop: 6.8 W/m2
24.60 1,195,440.00 School: 10.7 W/m2
Shop: 8.8 W/m2
24.12 1,172,000.00
98%
D5030 Communications and Security 13.44 653,000.00 13.44 653,000.00 D5090 Other Electrical Systems 1.72 83,200.00 1.72 83,200.00
Sub-Total 326.24 15,855,300.00 330.8532 16,079,680.00
GENERAL CONDITIONS (Overhead & Profit) 25% 81.56 3,963,825.00 82.71 4,019,920.00
ARCHITECTURAL FEES 7% 28.55 1,387,338.75 28.95 1,406,972.00
TOTAL BUILDING COST 436.34 21,206,463.75 442.52 21,506,572.00 101%
COST PER SQ FT($) 436 443
%
Increase/
Decrease

5: Health,Long-Term Care Facility2013 Q1 Costs
Baseline versus NECB Performance PathwayDescription of Analysis: The baseline building is compared against a building that has had the NECB performance path applied to it in it's entirety.
Parameter Comparison
Envelope NECB-2011
Mechanical NECB-2011
Lighting NECB-2011
Model Type: Health - Long-Term Care Facility, Floors: 4 above grade, 1 below grade, Concrete Block with Steel Frame
Stories (Ea.): 4
Floor Area (S.F.): 167,002 ft²
Perimeter (L.F.): 1,684 ft
No of Stories (E.A.): 5
Story Height (L.F.): 13.5 ft
Costs are derived from a building model with basic components. Scope differences and local market conditions can cause costs to vary significantly.
Corner Brook, Newfoundland
Baseline NECB-2011
Baseline $Cost/ $ Total NECB-2011 $Cost/ $ Total
Value Per S.F. Cost Value Per S.F. Cost
A Substructure
A1010 Standard Foundations 3.78 631,500.00 3.78 631,500.00
A1030 Slab on Grade 1.16 194,500.00 1.16 194,500.00
A2010 Basement Excavation 0.66 110,500.00 0.66 110,500.00
A2020 Basement Walls 2.09 349,000.00 2.09 349,000.00
B Shell
B1010 Floor Construction 22.89 3,822,500.00 22.89 3,822,500.00
B1020 Roof Construction U-0.22 W/m²K 2.60 435,000.00 U-0.183 W/m²K 2.89 482,850.00 111%
B2010
Exterior Walls U-0.257 W/m²K,
U-0.643 W/m²K,24.75 4,134,000.00 U-0.247 W/m²K 25.49 4,258,020.00 103%
B2020
Exterior Windows U-2.15 W/m²K,
U-2.97 W/m²K3.34 557,000.00 U-2.2 W/m²K 3.57 595,990.00 107%
SC-0.30 SC-0.30
B2030 Exterior Doors 0.47 79,000.00 0.47 79,000.00
B3010 Roof Coverings 1.57 261,500.00 1.57 261,500.00
B3020 Roof Openings 0.01 985.00 0.01 985.00
C Interiors
C1010 Partitions 6.39 1,066,500.00 6.39 1,066,500.00
C1020 Interior Doors 7.93 1,324,000.00 7.93 1,324,000.00
C2010 Stair Construction 3.75 626,500.00 3.75 626,500.00
C3010 Wall Finishes 2.96 494,000.00 2.96 494,000.00
C3020 Floor Finishes 2.36 394,500.00 2.36 394,500.00
C3030 Ceiling Finishes 3.09 516,500.00 3.09 516,500.00
D Services
D1010 Elevators and Lifts 4.30 717,500.00 4.30 717,500.00
D2010 Plumbing Fixtures 41.74 6,971,000.00 41.74 6,971,000.00
D2020 Domestic Water Distribution 1.41 235,500.00 1.41 235,500.00
D2040 Rain Water Drainage 0.54 89,500.00 0.54 89,500.00
D3010 Base Heating and Cooling Generating Systems
(Including all piping etc.)
Multi-Zone Air Handling
Units in Core Areas, Fan
Coil Units in Residential
Areas, Ground Source Heat
Pump System.
19.99 3,338,125.00 Multi-Zone Air Handling
Units in Core Areas, Fan Coil
Units in Residential Areas,
Oil Fired Boilers with Hot
Water Baseboard.
15.99 2,670,500.00 71%
D4010 Sprinklers 2.74 458,000.00 2.74 458,000.00
D4020 Standpipes 0.41 68,000.00 0.41 68,000.00
D5010 Electrical Service/Distribution 0.26 43,800.00 0.26 43,800.00
D5020 Lighting and Branch Wiring 13.7 W/m2 11.89 1,985,771.28 9.4 W/m
2 8.16 1,362,500.00 69%
D5030 Communications and Security 0.90 149,500.00 0.90 149,500.00
D5090 Other Electrical Systems 0.61 102,500.00 0.61 102,500.00
E Equipment & Furnishings
E1020 Institutional Equipment 2.59 168,000.00 2.59 168,000.00
E1090 Other Equipment 1.24 80,500.00 1.24 80,500.00
Sub-Total 178.42 29,405,181.28 171.9523 28,325,145.00
GENERAL CONDITIONS (Overhead & Profit) 25% 44.61 7,351,295.32 42.99 7,081,286.25
ARCHITECTURAL FEES 7% 15.61 2,572,953.36 15.05 2,478,450.19
TOTAL BUILDING COST 238.64 39,329,429.96 229.99 37,884,881.44 96%
COST PER SQ FT($) 236 227
%
Increase/
Decrease
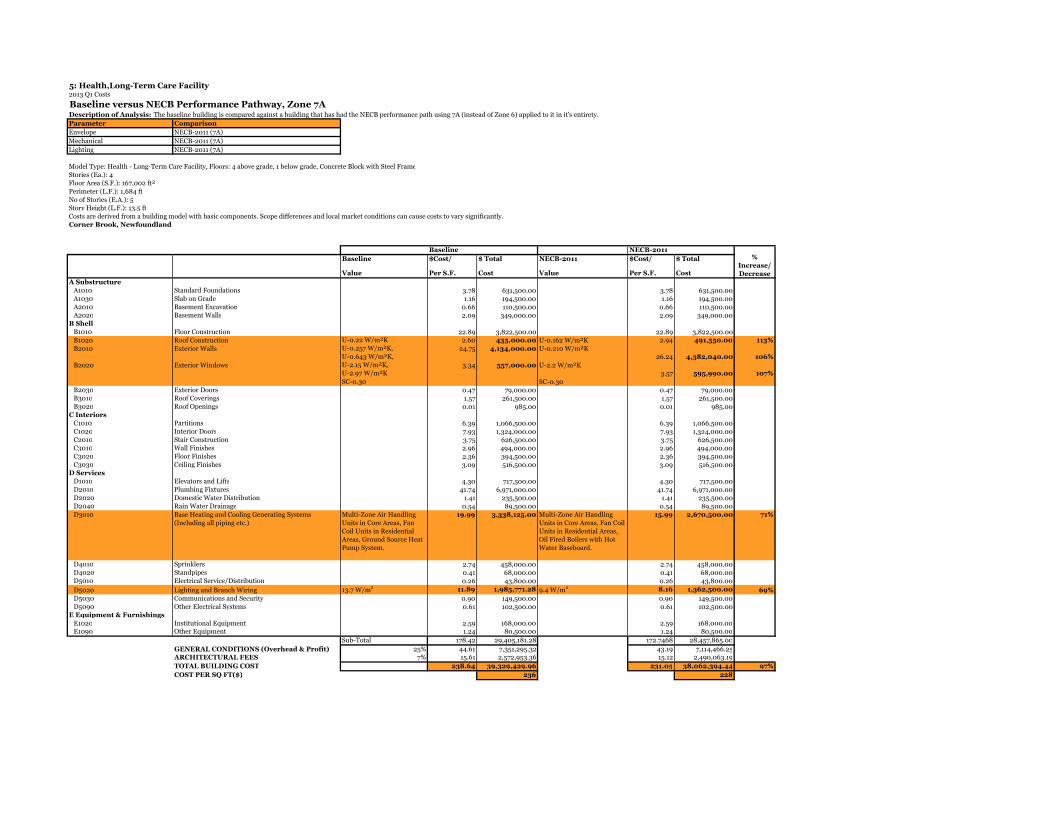
5: Health,Long-Term Care Facility2013 Q1 Costs
Baseline versus NECB Performance Pathway, Zone 7ADescription of Analysis: The baseline building is compared against a building that has had the NECB performance path using 7A (instead of Zone 6) applied to it in it's entirety.
Parameter Comparison
Envelope NECB-2011 (7A)
Mechanical NECB-2011 (7A)
Lighting NECB-2011 (7A)
Model Type: Health - Long-Term Care Facility, Floors: 4 above grade, 1 below grade, Concrete Block with Steel Frame
Stories (Ea.): 4
Floor Area (S.F.): 167,002 ft²
Perimeter (L.F.): 1,684 ft
No of Stories (E.A.): 5
Story Height (L.F.): 13.5 ft
Costs are derived from a building model with basic components. Scope differences and local market conditions can cause costs to vary significantly.
Corner Brook, Newfoundland
Baseline NECB-2011
Baseline $Cost/ $ Total NECB-2011 $Cost/ $ Total
Value Per S.F. Cost Value Per S.F. Cost
A Substructure
A1010 Standard Foundations 3.78 631,500.00 3.78 631,500.00
A1030 Slab on Grade 1.16 194,500.00 1.16 194,500.00
A2010 Basement Excavation 0.66 110,500.00 0.66 110,500.00
A2020 Basement Walls 2.09 349,000.00 2.09 349,000.00
B Shell
B1010 Floor Construction 22.89 3,822,500.00 22.89 3,822,500.00
B1020 Roof Construction U-0.22 W/m²K 2.60 435,000.00 U-0.162 W/m²K 2.94 491,550.00 113%
B2010 Exterior Walls U-0.257 W/m²K,
U-0.643 W/m²K,24.75 4,134,000.00 U-0.210 W/m²K
26.24 4,382,040.00 106%
B2020 Exterior Windows U-2.15 W/m²K,
U-2.97 W/m²K3.34 557,000.00 U-2.2 W/m²K
3.57 595,990.00 107%
SC-0.30 SC-0.30
B2030 Exterior Doors 0.47 79,000.00 0.47 79,000.00
B3010 Roof Coverings 1.57 261,500.00 1.57 261,500.00
B3020 Roof Openings 0.01 985.00 0.01 985.00
C Interiors
C1010 Partitions 6.39 1,066,500.00 6.39 1,066,500.00
C1020 Interior Doors 7.93 1,324,000.00 7.93 1,324,000.00
C2010 Stair Construction 3.75 626,500.00 3.75 626,500.00
C3010 Wall Finishes 2.96 494,000.00 2.96 494,000.00
C3020 Floor Finishes 2.36 394,500.00 2.36 394,500.00
C3030 Ceiling Finishes 3.09 516,500.00 3.09 516,500.00
D Services
D1010 Elevators and Lifts 4.30 717,500.00 4.30 717,500.00
D2010 Plumbing Fixtures 41.74 6,971,000.00 41.74 6,971,000.00
D2020 Domestic Water Distribution 1.41 235,500.00 1.41 235,500.00
D2040 Rain Water Drainage 0.54 89,500.00 0.54 89,500.00
D3010 Base Heating and Cooling Generating Systems
(Including all piping etc.)
Multi-Zone Air Handling
Units in Core Areas, Fan
Coil Units in Residential
Areas, Ground Source Heat
Pump System.
19.99 3,338,125.00 Multi-Zone Air Handling
Units in Core Areas, Fan Coil
Units in Residential Areas,
Oil Fired Boilers with Hot
Water Baseboard.
15.99 2,670,500.00 71%
D4010 Sprinklers 2.74 458,000.00 2.74 458,000.00
D4020 Standpipes 0.41 68,000.00 0.41 68,000.00
D5010 Electrical Service/Distribution 0.26 43,800.00 0.26 43,800.00
D5020 Lighting and Branch Wiring 13.7 W/m2 11.89 1,985,771.28 9.4 W/m
2 8.16 1,362,500.00 69%
D5030 Communications and Security 0.90 149,500.00 0.90 149,500.00
D5090 Other Electrical Systems 0.61 102,500.00 0.61 102,500.00
E Equipment & Furnishings
E1020 Institutional Equipment 2.59 168,000.00 2.59 168,000.00
E1090 Other Equipment 1.24 80,500.00 1.24 80,500.00
Sub-Total 178.42 29,405,181.28 172.7468 28,457,865.00
GENERAL CONDITIONS (Overhead & Profit) 25% 44.61 7,351,295.32 43.19 7,114,466.25
ARCHITECTURAL FEES 7% 15.61 2,572,953.36 15.12 2,490,063.19
TOTAL BUILDING COST 238.64 39,329,429.96 231.05 38,062,394.44 97%
COST PER SQ FT($) 236 228
%
Increase/
Decrease
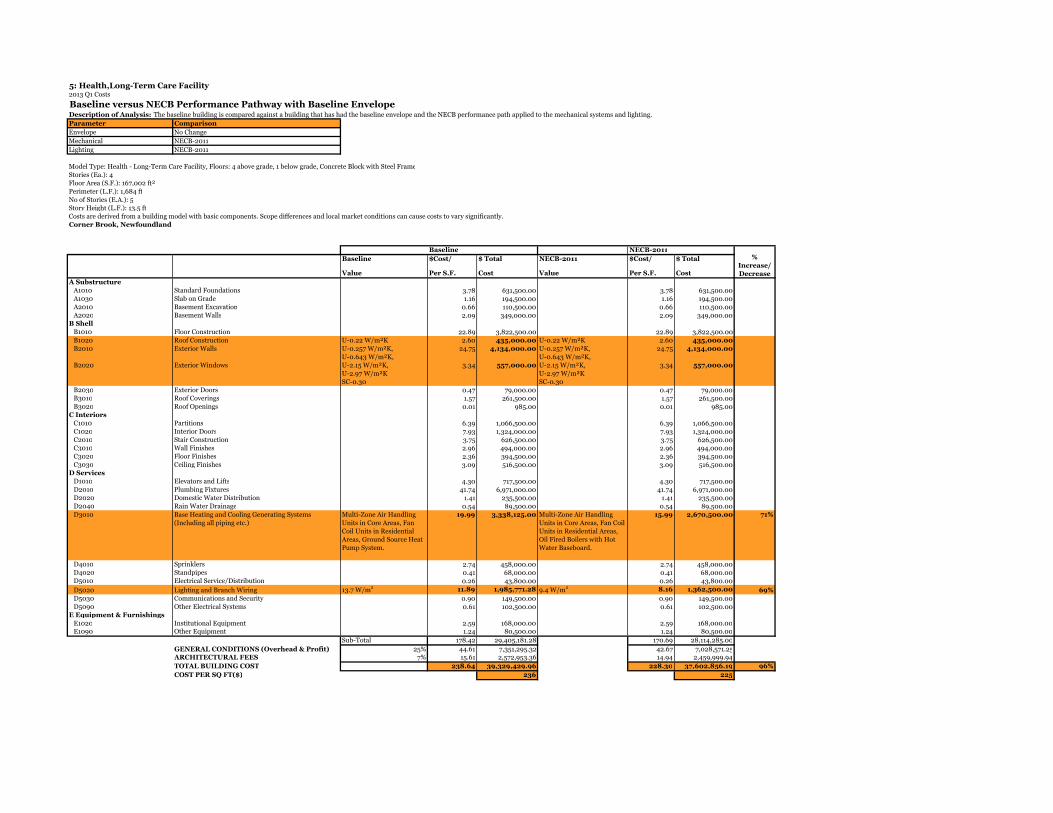
5: Health,Long-Term Care Facility2013 Q1 Costs
Baseline versus NECB Performance Pathway with Baseline EnvelopeDescription of Analysis: The baseline building is compared against a building that has had the baseline envelope and the NECB performance path applied to the mechanical systems and lighting.
Parameter Comparison
Envelope No Change
Mechanical NECB-2011
Lighting NECB-2011
Model Type: Health - Long-Term Care Facility, Floors: 4 above grade, 1 below grade, Concrete Block with Steel Frame
Stories (Ea.): 4
Floor Area (S.F.): 167,002 ft²
Perimeter (L.F.): 1,684 ft
No of Stories (E.A.): 5
Story Height (L.F.): 13.5 ft
Costs are derived from a building model with basic components. Scope differences and local market conditions can cause costs to vary significantly.
Corner Brook, Newfoundland
Baseline NECB-2011
Baseline $Cost/ $ Total NECB-2011 $Cost/ $ Total
Value Per S.F. Cost Value Per S.F. Cost
A Substructure
A1010 Standard Foundations 3.78 631,500.00 3.78 631,500.00
A1030 Slab on Grade 1.16 194,500.00 1.16 194,500.00
A2010 Basement Excavation 0.66 110,500.00 0.66 110,500.00
A2020 Basement Walls 2.09 349,000.00 2.09 349,000.00
B Shell
B1010 Floor Construction 22.89 3,822,500.00 22.89 3,822,500.00
B1020 Roof Construction U-0.22 W/m²K 2.60 435,000.00 U-0.22 W/m²K 2.60 435,000.00
B2010 Exterior Walls U-0.257 W/m²K,
U-0.643 W/m²K,
24.75 4,134,000.00 U-0.257 W/m²K,
U-0.643 W/m²K,
24.75 4,134,000.00
B2020 Exterior Windows U-2.15 W/m²K,
U-2.97 W/m²K
3.34 557,000.00 U-2.15 W/m²K,
U-2.97 W/m²K
3.34 557,000.00
SC-0.30 SC-0.30
B2030 Exterior Doors 0.47 79,000.00 0.47 79,000.00
B3010 Roof Coverings 1.57 261,500.00 1.57 261,500.00
B3020 Roof Openings 0.01 985.00 0.01 985.00
C Interiors
C1010 Partitions 6.39 1,066,500.00 6.39 1,066,500.00
C1020 Interior Doors 7.93 1,324,000.00 7.93 1,324,000.00
C2010 Stair Construction 3.75 626,500.00 3.75 626,500.00
C3010 Wall Finishes 2.96 494,000.00 2.96 494,000.00
C3020 Floor Finishes 2.36 394,500.00 2.36 394,500.00
C3030 Ceiling Finishes 3.09 516,500.00 3.09 516,500.00
D Services
D1010 Elevators and Lifts 4.30 717,500.00 4.30 717,500.00
D2010 Plumbing Fixtures 41.74 6,971,000.00 41.74 6,971,000.00
D2020 Domestic Water Distribution 1.41 235,500.00 1.41 235,500.00
D2040 Rain Water Drainage 0.54 89,500.00 0.54 89,500.00
D3010 Base Heating and Cooling Generating Systems
(Including all piping etc.)
Multi-Zone Air Handling
Units in Core Areas, Fan
Coil Units in Residential
Areas, Ground Source Heat
Pump System.
19.99 3,338,125.00 Multi-Zone Air Handling
Units in Core Areas, Fan Coil
Units in Residential Areas,
Oil Fired Boilers with Hot
Water Baseboard.
15.99 2,670,500.00 71%
D4010 Sprinklers 2.74 458,000.00 2.74 458,000.00
D4020 Standpipes 0.41 68,000.00 0.41 68,000.00
D5010 Electrical Service/Distribution 0.26 43,800.00 0.26 43,800.00
D5020 Lighting and Branch Wiring 13.7 W/m2 11.89 1,985,771.28 9.4 W/m
2 8.16 1,362,500.00 69%
D5030 Communications and Security 0.90 149,500.00 0.90 149,500.00
D5090 Other Electrical Systems 0.61 102,500.00 0.61 102,500.00
E Equipment & Furnishings
E1020 Institutional Equipment 2.59 168,000.00 2.59 168,000.00
E1090 Other Equipment 1.24 80,500.00 1.24 80,500.00
Sub-Total 178.42 29,405,181.28 170.69 28,114,285.00
GENERAL CONDITIONS (Overhead & Profit) 25% 44.61 7,351,295.32 42.67 7,028,571.25
ARCHITECTURAL FEES 7% 15.61 2,572,953.36 14.94 2,459,999.94
TOTAL BUILDING COST 238.64 39,329,429.96 228.30 37,602,856.19 96%
COST PER SQ FT($) 236 225
%
Increase/
Decrease

5: Health,Long-Term Care Facility2013 Q1 Costs
Baseline versus Baseline with NECB EnvelopeDescription of Analysis: The baseline building is compared against the baseline building with an NECB envelope.
Parameter Comparison
Envelope NECB-2011
Mechanical No Change
Lighting No Change
Model Type: Health - Long-Term Care Facility, Floors: 4 above grade, 1 below grade, Concrete Block with Steel Frame
Stories (Ea.): 4
Floor Area (S.F.): 167,002 ft²
Perimeter (L.F.): 1,684 ft
No of Stories (E.A.): 5
Story Height (L.F.): 13.5 ft
Costs are derived from a building model with basic components. Scope differences and local market conditions can cause costs to vary significantly.
Corner Brook, Newfoundland
Baseline NECB-2011
Baseline $Cost/ $ Total NECB-2011 $Cost/ $ Total
Value Per S.F. Cost Value Per S.F. Cost
A Substructure
A1010 Standard Foundations 3.78 631,500.00 3.78 631,500.00
A1030 Slab on Grade 1.16 194,500.00 1.16 194,500.00
A2010 Basement Excavation 0.66 110,500.00 0.66 110,500.00
A2020 Basement Walls 2.09 349,000.00 2.09 349,000.00
B Shell
B1010 Floor Construction 22.89 3,822,500.00 22.89 3,822,500.00
B1020 Roof Construction U-0.22 W/m²K 2.60 435,000.00 U-0.183 W/m²K 2.89 482,850.00 111%
B2010 Exterior Walls U-0.257 W/m²K,
U-0.643 W/m²K,
24.75 4,134,000.00 U-0.247 W/m²K 25.49 4,258,020.00 103%
B2020 Exterior Windows U-2.15 W/m²K,
U-2.97 W/m²K
3.34 557,000.00 U-2.2 W/m²K 3.57 595,990.00 107%
SC-0.30 SC-0.30
B2030 Exterior Doors 0.47 79,000.00 0.47 79,000.00
B3010 Roof Coverings 1.57 261,500.00 1.57 261,500.00
B3020 Roof Openings 0.01 985.00 0.01 985.00
C Interiors
C1010 Partitions 6.39 1,066,500.00 6.39 1,066,500.00
C1020 Interior Doors 7.93 1,324,000.00 7.93 1,324,000.00
C2010 Stair Construction 3.75 626,500.00 3.75 626,500.00
C3010 Wall Finishes 2.96 494,000.00 2.96 494,000.00
C3020 Floor Finishes 2.36 394,500.00 2.36 394,500.00
C3030 Ceiling Finishes 3.09 516,500.00 3.09 516,500.00
D Services
D1010 Elevators and Lifts 4.30 717,500.00 4.30 717,500.00
D2010 Plumbing Fixtures 41.74 6,971,000.00 41.74 6,971,000.00
D2020 Domestic Water Distribution 1.41 235,500.00 1.41 235,500.00
D2040 Rain Water Drainage 0.54 89,500.00 0.54 89,500.00
D3010 Base Heating and Cooling Generating Systems
(Including all piping etc.)
Multi-Zone Air Handling
Units in Core Areas, Fan
Coil Units in Residential
Areas, Ground Source Heat
Pump System.
22.57 3,769,524.08 Multi-Zone Air Handling
Units in Core Areas, Fan Coil
Units in Residential Areas,
Ground Source Heat Pump
System.
22.57 3,769,524.08
D4010 Sprinklers 2.74 458,000.00 2.74 458,000.00
D4020 Standpipes 0.41 68,000.00 0.41 68,000.00
D5010 Electrical Service/Distribution 0.26 43,800.00 0.26 43,800.00
D5020 Lighting and Branch Wiring 13.7 W/m2 11.89 1,985,771.28 13.7 W/m
2 11.89 1,985,771.28
D5030 Communications and Security 0.90 149,500.00 0.90 149,500.00
D5090 Other Electrical Systems 0.61 102,500.00 0.61 102,500.00
E Equipment & Furnishings
E1020 Institutional Equipment 2.59 168,000.00 2.59 168,000.00
E1090 Other Equipment 1.24 80,500.00 1.24 80,500.00
Sub-Total 181.00 29,836,580.36 182.26563 30,047,440.36
GENERAL CONDITIONS (Overhead & Profit) 25% 45.25 7,459,145.09 45.57 7,511,860.09
ARCHITECTURAL FEES 7% 15.84 2,610,700.78 15.95 2,629,151.03
TOTAL BUILDING COST 242.09 39,906,426.23 243.78 40,188,451.48 101%
COST PER SQ FT($) 239 241
%
Increase/
Decrease

6: Multi-Unit Residence Building (MURB)2013 Q1 Costs
Baseline versus NECB Performance Pathway, Zone 7ADescription of Analysis: The baseline building is compared against a building that has had the NECB performance path using Zone 7A (instead of Zone 6) applied to it in its entirety.
Parameter Comparison
Envelope NECB-2011 (Zone 7A)
Mechanical NECB-2011 (Zone 7A)
Lighting NECB-2011 (Zone 7A)
Model Type: MURB, Floors: 7 above grade, 0 below, various wall types
Stories (Ea.): 7
Floor Area (S.F.): 168,930 ft²
Perimeter (L.F.): 3617 ft
No of Stories (E.A.): 7
Story Height (L.F.): 11 ft
Costs are derived from a building model with basic components. Scope differences and local market conditions can cause costs to vary significantly.
St. John's, Newfoundland
Baseline NECB-2011
Baseline $Cost/ $ Total NECB-2011 $Cost/ $ Total
Value Per S.F. Cost Value Per S.F. Cost
A Substructure
A1010 Standard Foundations 2.26 381,500.00 2.26 381,500.00
A1030 Slab on Grade 0.73 123,000.00 0.73 123,000.00
A2010 Basement Excavation 0.04 5,925.00 0.04 5,925.00
A2020 Basement Walls 2.22 374,500.00 2.22 374,500.00
B Shell
B1010 Floor Construction 27.25 4,602,500.00 27.25 4,602,500.00
B1020 Roof Construction U-0.183 W/m²K,
U-0.225 W/m²K,
3.35 566,500.00 U-0.162 W/m²K 3.72 628,815.00 111%
B2010 Exterior Walls U-0.275 W/m²K,
U-0.390 W/m²K,
U-0.238 W/m²K,
U-0.481 W/m²K,
U-0.729 W/m²K,
22.31 3,769,500.00 U-0.210 W/m²K 23.43 3,957,975.00 105%
B2020 Exterior Windows U-1.76 W/m²K 12.63 2,133,000.00 U-2.2 W/m²K 11.87 2,005,020.00 94%
SC-0.44 SC-0.44
B2030 Exterior Doors 0.37 62,000.00 0.37 62,000.00
B3010 Roof Coverings 1.44 242,500.00 1.44 242,500.00
B3020 Roof Openings 0.00 0.00 0.00 0.00
C Interiors
C1010 Partitions 10.71 1,809,500.00 10.71 1,809,500.00
C1020 Interior Doors 7.49 1,266,000.00 7.49 1,266,000.00
C1030 Fittings 1.80 303,500.00 1.80 303,500.00
C2010 Stair Construction 4.14 700,000.00 4.14 700,000.00
C3010 Wall Finishes 7.97 1,347,000.00 7.97 1,347,000.00
C3020 Floor Finishes 11.90 2,009,500.00 11.90 2,009,500.00
C3030 Ceiling Finishes 0.96 162,000.00 0.96 162,000.00
D Services
D1010 Elevators and Lifts 12.80 2,161,500.00 12.80 2,161,500.00
D2010 Plumbing Fixtures 23.15 3,910,500.00 23.15 3,910,500.00
D2020 Domestic Water Distribution 2.11 357,000.00 2.11 357,000.00
D2040 Rain Water Drainage 0.16 27,700.00 0.16 27,700.00
D3010 Base Heating and Cooling Generating Systems
(Including all piping etc.)
Multi-Zone, Heat Recovery
Air Handling Units in
Common Areas & Bedroom
Areas, Electric Baseboard
Heating.
15.56 2,629,186.78 Multi-Zone Air Handling
Units in Common Areas,
Water Cooled Chiller &
Electric Baseboard Heating,
Unitary Units in Bedroom
Areas, Electric Baseboard
Heating.
14.45 2,441,500.00 93%
D4010 Sprinklers 2.76 466,000.00 2.76 466,000.00
D4020 Standpipes 0.67 113,000.00 0.67 113,000.00
D5010 Electrical Service/Distribution 0.57 97,000.00 0.57 97,000.00
D5020 Lighting and Branch Wiring Common Area: 6.9 W/m2
Bedrooms: 7.4 W/m2
9.69 1,636,695.00 Common Area: 10.7 W/m2
Bedrooms: 6.5 W/m2
8.73 1,474,500.00 90%
D5030 Communications and Security 5.87 991,500.00 5.87 991,500.00
D5090 Other Electrical Systems 0.27 45,000.00 0.27 45,000.00
E Equipment & Furnishings
E1090 Other Equipment 2.95 497,500.00 2.95 497,500.00
Sub-Total 194.13 32,791,006.78 192.7862 32,563,935.00
GENERAL CONDITIONS (Overhead & Profit) 25% 48.53 8,197,751.69 48.20 8,140,983.75
ARCHITECTURAL FEES 7% 16.99 2,869,213.09 16.87 2,849,344.31
TOTAL BUILDING COST 259.65 43,857,971.56 257.85 43,554,263.06 99%
%
Increase/
Decrease

7: Warehouse2013 Q1 Costs
Baseline versus NECB Performance Pathway, Zone 7ADescription of Analysis: The baseline building is compared against a building that has had the NECB performance path using Zone 7A (instead of Zone 6) applied to it in its entirety.
Parameter Comparison
Envelope NECB-2011 (Zone 7A)
Mechanical NECB-2011 (Zone 7A)
Lighting NECB-2011 (Zone 7A)
Model Type: Warehouse, Floors: 1 above grade, 0 below grade, Tilt-up Wall with Steel Frame
Stories (Ea.): 1
Floor Area (S.F.): 41,000 ft²
Perimeter (L.F.): 862 ft
No of Stories (E.A.): 1
Story Height (L.F.): 24 ft
Costs are derived from a building model with basic components. Scope differences and local market conditions can cause costs to vary significantly.
St. John's, Newfoundland
Baseline NECB-2011
Baseline $Cost/ $ Total NECB-2011 $Cost/ $ Total
Value Per S.F. Cost Value Per S.F. Cost
A Substructure
A1010 Standard Foundations 1.27 52,000.00 1.27 52,000.00
A1030 Slab on Grade 12.22 501,000.00 12.22 501,000.00
A2010 Basement Excavation 0.15 6,050.00 0.15 6,050.00
A2020 Basement Walls 2.04 83,500.00 2.04 83,500.00
B Shell
B1010 Floor Construction 2.30 94,500.00 2.30 94,500.00
B1020 Roof Construction U-0.142 W/m²K 8.08 331,500.00 U-0.162 W/m²K 7.11 291,720.00 88%
B2010 Exterior Walls U-0.284 W/m²K 5.69 233,500.00 U-0.210 W/m²K 6.15 252,180.00 108%
B2020 Exterior Windows U-2.6 W/m²K,
U-2.2 W/m²K3.74 153,500.00 U-2.2 W/m²K 3.89 159,640.00 104%
SC-0.42 SC-0.42
B2030 Exterior Doors 1.27 52,000.00 1.27 52,000.00
B3010 Roof Coverings 5.60 229,500.00 5.60 229,500.00
B3020 Roof Openings 0.27 11,100.00 0.27 11,100.00
C Interiors
C1010 Partitions 0.69 28,100.00 0.69 28,100.00
C1020 Interior Doors 0.28 11,400.00 0.28 11,400.00
C1030 Fittings 0 0.00 0 0.00
C2010 Stair Construction 0.75 30,600.00 0.75 30,600.00
C3010 Wall Finishes 1.84 75,500.00 1.84 75,500.00
C3020 Floor Finishes 1.96 80,500.00 1.96 80,500.00
C3030 Ceiling Finishes 0.67 27,400.00 0.67 27,400.00
D Services
D1010 Elevators and Lifts 0.00 0.00 0.00 0.00
D2010 Plumbing Fixtures 1.56 64,000.00 1.56 64,000.00
D2020 Domestic Water Distribution 0.43 17,500.00 0.43 17,500.00
D2040 Rain Water Drainage 1.83 75,000.00 1.83 75,000.00
D3010 Base Heating and Cooling Generating Systems
(Including all piping etc.)
Single Zone Heat Recovery
Units
5.35 181,815.00 Single Zone Package Units 5.75 195,500.00 108%
D4010 Sprinklers 3.85 158,000.00 3.85 158,000.00
D4020 Standpipes 2.18 89,500.00 2.18 89,500.00
D5010 Electrical Service/Distribution 0.44 18,200.00 0.44 18,200.00
D5020 Lighting and Branch Wiring Office: 5.8 W/m2
Warehouse: 5.8 W/m2
6.07 249,150.00 Office: 9.7 W/m2
Warehouse: 7.1W/m2
5.52 226,500.00 91%
D5030 Communications and Security 2.69 110,500.00 2.69 110,500.00
D5090 Other Electrical Systems 0.00 0.00 0.00 0.00
E Equipment & Furnishings
E1020 Institutional Equipment 0 0.00 0 0.00
E1090 Other Equipment 3.07 126,000.00 3.07 126,000.00
Sub-Total 76.29 3,091,315.00 75.7752 3,067,390.00
GENERAL CONDITIONS (Overhead & Profit) 25% 19.07 772,828.75 18.94 766,847.50
ARCHITECTURAL FEES 7% 6.68 270,490.06 6.63 268,396.63
TOTAL BUILDING COST 102.04 4,134,633.81 101.35 4,102,634.13 99%
COST PER SQ FT($) 101 100
%
Increase/
Decrease

Stantec
APPENDIX F
Contributors

This appendix provides contact information for the various contributors to the study.
THE PROVINCE
Jackie Janes Assistant Deputy Minister Office of Climate Change, Energy Efficiency & Emissions Trading Executive Council, Government of Newfoundland & Labrador Ph: (709) 729-7971 [email protected] Gunar Leja Director-Special Projects, Health Infrastructure NL Dept. of Transportation & Works Ph: (709) 729-1359 Cell: (709) 697-4590 [email protected] Gerald Crane Director of Research and Analysis Office of Climate Change, Energy Efficiency & Emissions Trading Executive Council, Government of Newfoundland & Labrador Ph: 709-729-0379 Cell: 709-691-0275 [email protected] Vanessa Pennell Mercer Senior Engineer Office of Climate Change, Energy Efficiency & Emissions Trading Executive Council, Government of Newfoundland & Labrador Tel: 709-729-1394 [email protected]
STANTEC TEAM
Melanie Chatfield Roles: Project Manager, Energy Modeller, Peer Review Stantec 102 – 40 Highfield Park Drive Dartmouth NS B3A 0A3 [email protected]
Bryce Oliver Role: NECB Code Analyser Stantec 49 Frederick Street Kitchener, Ontario N2H 6M7 [email protected] Carolyn Johanson Role: NECB Code Analyser Stantec 2781 Lancaster Road, Suite 200 Ottawa, Ontario K1B 1A7 [email protected] Nicholas Lashambe-Smith Role: Analysis of Upgrades Required Stantec 102 – 40 Highfield Park Drive Dartmouth NS B3A 0A3 [email protected] Tim Howe Role: Senior Energy Modeller Stantec 61 Commercial Street Rochester, New York, 14614 [email protected] Paul LaPointe Role: Costing Engineer Stantec 102 – 40 Highfield Park Drive Dartmouth NS B3A 0A3 [email protected] Andrew Hurst Role: Mechanical Engineer Stantec 102 – 40 Highfield Park Drive Dartmouth NS B3A 0A3 [email protected] Charline Cormier Role: Building Science Professional Stantec 102 – 40 Highfield Park Drive Dartmouth NS B3A 0A3 [email protected]

David Coole Role: Building Science Professional Stantec 102 – 40 Highfield Park Drive Dartmouth NS B3A 0A3 [email protected] Lyndsey Lewis Role: Sustainable Buildings Consultant Stantec 401 Wellington Street West, Suite 100 Toronto, Ontario M5V 1E7 [email protected] Emily Jones Role: Building Science Technologist Stantec 102 – 40 Highfield Park Drive Dartmouth NS B3A 0A3 [email protected] Amanda Wiseman Role: Sustainable Buildings Consultant Stantec 102 – 40 Highfield Park Drive Dartmouth NS B3A 0A3 [email protected] Brad Dawe Role: Existing Building Engineer Stantec 430 – 434 Water Street, Suite 230 St. John’s, NL A1C 1E2 [email protected] William Lacey Role: Existing Building Engineer Stantec 430 – 434 Water Street, Suite 230 St. John’s, NL A1C 1E2 [email protected]