correlations of specimens and species explored with dna sequence vectors lawrence sirovich *†,...
TRANSCRIPT

Correlations of Specimens and SpeciesExplored with DNA Sequence Vectors
Lawrence Sirovich*†, Mark Stoeckle† & Yu Zhang*
*Mt. Sinai School of Medicine & †Rockefeller University
Barcodes through a Macroscope
Work in Progress, presented by Jesse AusubelMARBOL, WHOI 1 May 2009

Diagnostic Nucleotide Characters between Eastern & Western Marsh WrenImagine exploring alignments in 10 million sequences!
Thymine Cytosine Adenine Guanine
Source:U. of GuelphBarcode group

Background
• Genomics provides both a new tool and a new perspective for this program.
• Good news: Sufficient data now exist to explore application of mathematically based algorithmic approaches for exploring taxonomic objectives in broad terms.

Traditional hierarchical classifications of forms of life:
Much development, strengths & weaknesses well-known. Are there complementary approaches?
Strengths of Tree: Evolutionary metaphor, time dimension, etc.Weaknesses: Mesh of microbes, horizontal transfer, not visually compact,
computationally demanding, etc.

Macroscopic Uses of Barcode of Life Data Sets
Region of COI gene furnishes barcode sequences for most animalsBOLD contains >54,000 species & >570,000 sequences, more to come.
NB: Method could be applied to any aligned sequence
How to extract patterns & hypotheses from immense databases too large to see panoramically with traditional tools?
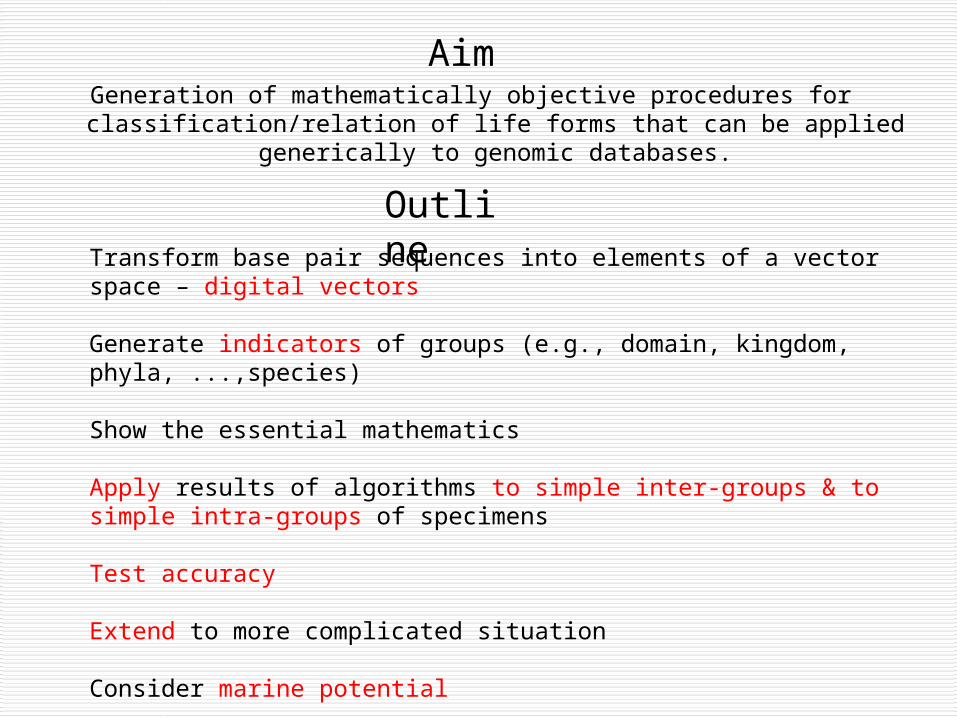
OutlineTransform base pair sequences into elements of a vector space – digital vectors
Generate indicators of groups (e.g., domain, kingdom, phyla, ...,species)
Show the essential mathematics
Apply results of algorithms to simple inter-groups & to simple intra-groups of specimens
Test accuracy
Extend to more complicated situation
Consider marine potential
Aim Generation of mathematically objective procedures for classification/relation of life
forms that can be applied generically to genomic databases.

Data Transformation
A 1000
C 0100
G 0010
T 0001
TCCTCATCCGCGCAG …
s=[0001,0100,0100,0001,0100,1000,
0001,0100,0100,0010,0100,0010,0100,1000,0010, …..]
Translate Nucleotide Sequences Numbers
Roughly 500 bp because frayed ends excluded
Thus s has ~2000 entries

A Little MathematicsBase ConstructionConsider M groups, G1,G2,…, GM, (domain, kingdom, … , species)
Each group contains a collection of N sequences, which we consider as a matrix
1
2
k
k
k
kN
s
s
s
G
Each G should have the same number of sequences, N, and all sequences should have the same length, L
An indicator vector vk generated for each group, i.e., specific to each group, under the condition that it correlates optimally with that group, and correlates minimally with all other groups.
The kth indicator, a unit vector is such that
is a maximum. A similar framework was used to unravel functional images of the mammalian primary visual cortex (Sirovich, L. Everson, R. Kaplan, E., Knight, B.W., O'Brien, E. and Orbach, D. Modeling the functional organization of the visual cortex, Physica D, 96:355-366, 1996; Sirovich, L. and Uglesich, R. The organization of orientation and spatial frequency in primary visual cortex. PNAS, 101:16941-16946, 2004. )
21k v
kG
, 1,...,kjs j N
22k kk l
l k v vC G G

Mathematics - continued
This procedure is well–posed and leads to a collection of indicator vectors , where refers to the M groupings under consideration.
Because each vj is a unit vector, the inner product
is just the correlation between the jth and kth groupings and the collection of all correlations
.
This is referred to as the structure matrix. The diagonal elements of C are all unity. It is reasonable to define
as the degree of relationship that the jth group has with all other groupings.
jv1,..,j M
,j kjkCv v
1 1 1 2 1
2 1 2 2
, , ,
, ,
,
M
M M
v v v v v v
C v v v v
v v
j iji jCr

Trial Simulation (Inter)
1. Consider three Groups: North American Birds Canadian Fresh Water Fish Hesperiidae (Butterflies)
2. Pick a large number of sequences from each species randomly and construct the structure matrix C.
3. 500 sequences are adequate for stable results. 4. Use the remaining sequences in each taxon set as
the Test data (1632 sequences total).

Trial Results
Structure Matrix Correlation with the test sequences
Correct Assignment Rate = 100%
1632 actual sequences
(Color bar indicates relative correlation.)
Indicator vectors

Trial Simulation (Intra N=3)
1. Consider 262 species of North American Birds in BOLD
including ≥ 3 sequences
Input order (Alphabetical order by species name)
Species arranged in descending correlation

Blow-up of upper left (young!) birds
Note the vector method is scalable, zoomable

N American Bird Test Results (N=3)
Test set composed of 471 sequences:
Correct Assignment Rate = 98.5% (issues with 7 sets of sequences or specimens)

Trial Simulation (Intra N=5)
2. Consider 122 species of North American Birds in BOLD including ≥ 5 sequences
Input Order(Alphabetical order by species name) Species arranged in
descending correlation

N American Bird Test Results (N=5)
Test set composed of 173 sequences:
Correct Assignment Rate = 100%

Structure Matrix Prediction Matrix
Vector Correlation Analysis for 12 groupingsUsing indicator vectors (left) & >10,000 actual barcode records (right)
Infinitely scalable….computationally cheap

Barcode Analysis of Test set for 12 groups
Correct Assignment Rate = 99.84% The errors (in red) are all lampreys.
533-500=33 Amphibians
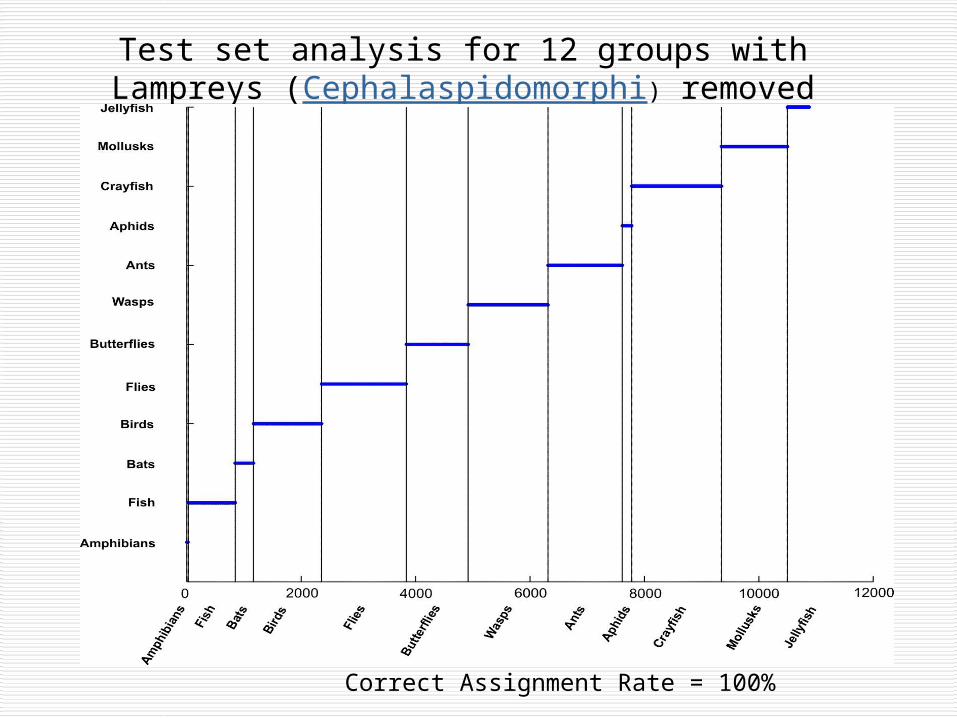
Correct Assignment Rate = 100%
Test set analysis for 12 groups with Lampreys (Cephalaspidomorphi) removed from Fish (
Actinopterygii)

Test of 33 Lamprey sequences
Correlation with mode vectors
Comparison of lamprey sequences with mode sequences for fish & amphibians revealed that fish were roughly 8 substitutions more distant than amphibians and
as indicated below there is good qualitative agreement in both measures.
Correlation with indicator vectors
Conventional metric for sequence comparison is number of bp substitutions needed for identification. A convenient representation of a group is obtained by chosing mode of group at each bp location. This is termed modal sequence.
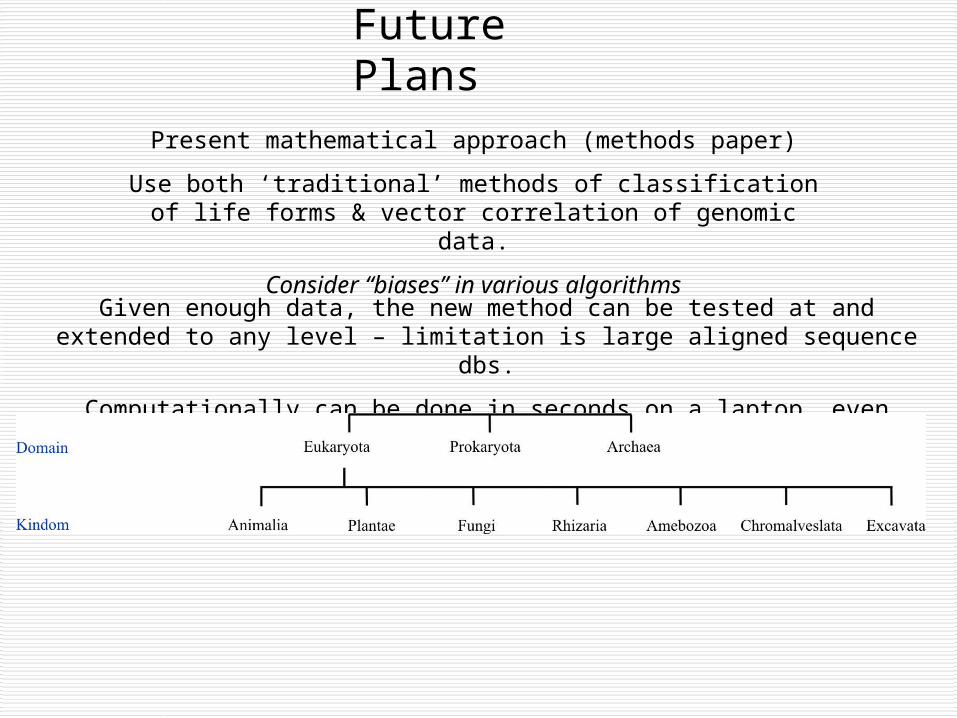
Future Plans Present mathematical approach (methods paper)
Use both ‘traditional’ methods of classification of life forms & vector correlation of genomic data.
Consider “biases” in various algorithms
Given enough data, the new method can be tested at and extended to any level – limitation is large aligned sequence dbs.
Computationally can be done in seconds on a laptop, even with huge datasets
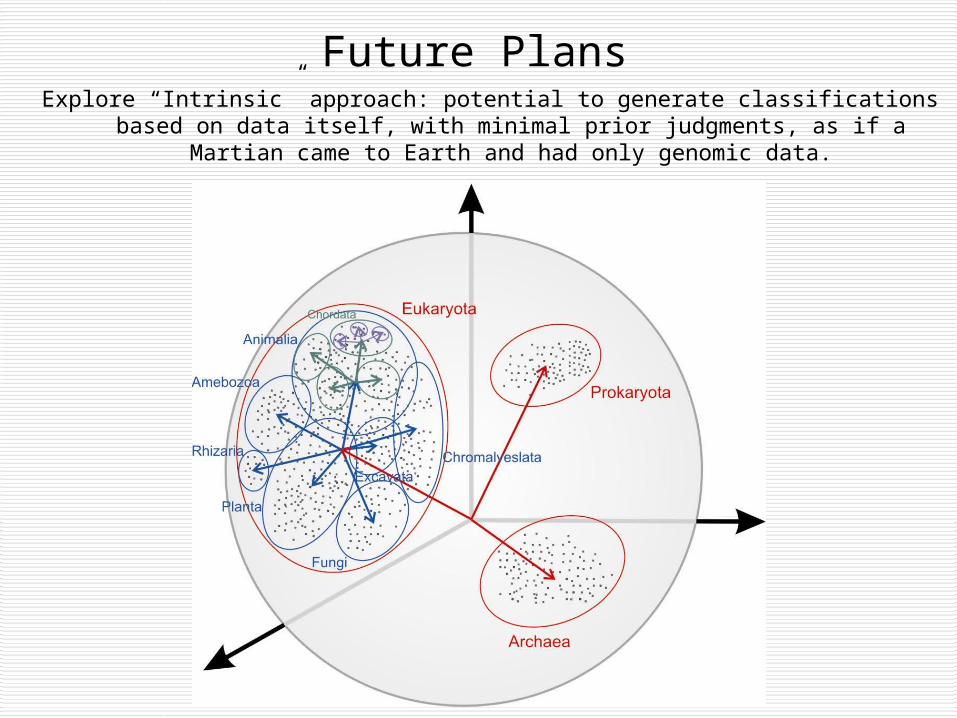
Future PlansExplore “Intrinsic” approach: potential to generate classifications based on
data itself, with minimal prior judgments, as if a Martian came to Earth and had only genomic data.

How close are we to having enough marine sequences and taxa to experiment with this approach?

Macroscopic Opportunity
Imagine scientific questions in molecular evolution, evolutionary biology, and comparative biology that we might answer once we have 2 million barcodes from 200,000 known marine species and newly discovered ones or, for example, barcodes of all cephalopods.