correlations between the eegs of two spatially separated ... · grinberg-zylberbaum et al. (1994)...
TRANSCRIPT

European Journal of Parapsychology © 2008 European Journal of ParapsychologyVolume 23.2, pages 131-146 ISSN: 0168-7263
Correlations between the EEGs of two spatially separated subjects − a replication study
Wolfgang Ambach Institute for Frontier Areas of Psychology and Mental Health, Freiburg, Germany
Abstract
Previous studies have reported correlations between the EEGs of two spatially separated subjects. These correlations could not be explained by means of conventional physiological or physical mechanisms. Results by Wackermann (2003, 2004; Wackermann et al, 2004) suggest such unexplained correlations, with the direction (increase or decrease of EEG power) as well as the localization (electrode position) of the supposed effects varying between studies. The present replication study, performed in another laboratory, yet other experimental changes kept at a minimum, aimed at clarifying this effect. Seventeen pairs of subjects were examined. One subject of each pair was visually stimulated by one-second periods of checkerboard reversals while the other sat in a dimly lit separate room without stimulation. The latter subject’s EEG power in the paired subject’s stimulation and interstimulus periods was compared; separate analyses were performed for two different time windows. In this study, the previously used mode of EEG segment sampling turned out to systematically overestimate effects. Therefore, the non-parametric statistical method was modified. Also, the results for the nineteen EEG channels were corrected for their degrees of freedom using a Monte-Carlo simulation. Results did not show a significant deviation from random expectation; the EEG power of the non-stimulated subject was not linked to the stimulation of the other subject.
Correspondence details: Wolfgang Ambach, Institut für Grenzgebiete der Psychologie und Psychohygiene, Wilhelmstr. 3A, D-79098 Freiburg, Germany. Email: [email protected]
131

EEG correlations between separated subjects
Introduction
Since 1965, a series of studies have reported correlations between the EEGs of spatially separated subjects. In these experiments, pairs of subjects were prevented from interacting via known physiological or physical mechanisms; consequently, the findings have often been discussed in terms of direct brain-to-brain communication (Charman, 2006).
Grinberg-Zylberbaum et al. (1994) coined the term 'transferred potentials' for the observation of correlations between the EEGs of two spatially separated subjects of whom only one was visually stimulated. They found statistical correlations between certain parts of the two time series of the averaged event-related EEG segments obtained from both subjects. From there on, event-related EEG correlations between distant human subjects were mostly investigated on the basis of averaged EEG segments. A critical analysis of the Grinberg-Zylberbaum et al. (1994) study has been provided by May et al. (2001). They provided evidence for the claim that violations of the underlying assumptions concerning hypothesis testing had led to an overestimation of the effects in this study. Several subsequent experiments searching for EEG correlations which could not be explained by a known mechanism, yielded positive results (e.g. Fenwick et al., 1998), while other replication studies (e.g. Sabell et al., 2001) failed to confirm the effect. Recently, correlations between brain electrical activities of distant human brains were found by Standish (2004) and Radin (2003, 2004).
Two studies by Wackermann et al. (2003, 2004) aimed at examining if correlations in the EEG between a visually stimulated subject and a second, non-stimulated subject were replicable when communication between both participants was prevented by spatial separation of subjects in shielded rooms. One subject ('subject A') was visually stimulated with repeated series of checkerboard reversals while the other subject ('subject B'), sitting in a dimly lit room, was not stimulated. In the control condition, stimulation of the first subject was prevented by covering the monitor with an opaque shield. From the first to the second study, several methodological refinements had been introduced. In both studies, the authors found significant fluctuations of the EEG power of subject B according to the stimulation or interstimulus periods of subject A. Remarkably, the effect of subject A’s
132

Ambach
stimulation on the EEG power of the non-stimulated subject B varied between studies in direction (increase, decrease) as well as location (electrode position). Furthermore, deviations from random expectation were not only observed in the experimental condition (stimulation), but partially also in the control condition (no stimulation). Thus, significant results were generally replicated, but not the specific finding of the direction of the effect or the location of its maximum; results of the repeated studies were inconsistent but still striking.
Our replication study aimed at validating the existence of the effect and, if possible, shedding light upon its specifications. In relation to the preceding studies, it was conducted in a different laboratory and guided by a different experimenter. All other experimental conditions were kept unchanged as far as possible. The statistical methods applied in the precedent studies were reconsidered in detail.
MethodSubjects
Seventeen pairs of related subjects (friends, relatives, or partners; 12 male, 22 female; age 23.2 ± 1.9 years; mean duration of relationship 4.8 ± 5.3 years) were recruited via announcement in the local students' job agency. They were of reportedly good health, unmedicated, and voluntarily participated in the study for the payment of 17 Euros. Informed consent was obtained from all subjects.
Stimuli
As visual stimulus, a checkerboard pattern with 64 x 48 black and white squares (angular size ≈ 0.25° x 0.25°) was presented on a 19'' LCD monitor. The stimulated subject observed the monitor from ≈ 125 cm distance (visual angle 16° x 12°). Duration of each stimulation period was one second, consisting of four 250 ms periods with reversed pattern presentations (see Figure 1).
interstim. int. --- 250 ms --- 250 ms --- 250 ms --- 250 ms --- interstim. int.Figure 1. Visual stimulation using checkerboard reversals
133
EEG correlations between separated subjects
168 stimuli were presented within each of the two runs of the experiment according to Wackermann et al. (2004). Interstimulus intervals were 1.5−7.5 seconds; the sequence of intervals was pseudo-randomized. During interstimulus intervals, the screen was uniformly grey with the brightness adjusted to the overall brightness of the checkerboard stimuli.
Physiological Recording
EEG data were recorded from nineteen electrodes according to the standard 10-20 positions (Jasper, 1958), against linked mastoids as reference. Impedances were kept below 5 kΩ; Ag-AgCl electrodes were attached to the scalp with use of Easy Caps and abrasive gel (both by Falk Minow, München, Germany). Vertical and horizontal oculogram was recorded for artifact control. Two Synamps amplifiers (NeuroScan, Inc.) of the same type were used. EEG was band-pass filtered at 0.15 - 70 Hz, A/D-converted, sampled at 1000 Hz and saved to disc using the software Acquire, Version 4.3.1 (Neurosoft, Inc.).
Procedure
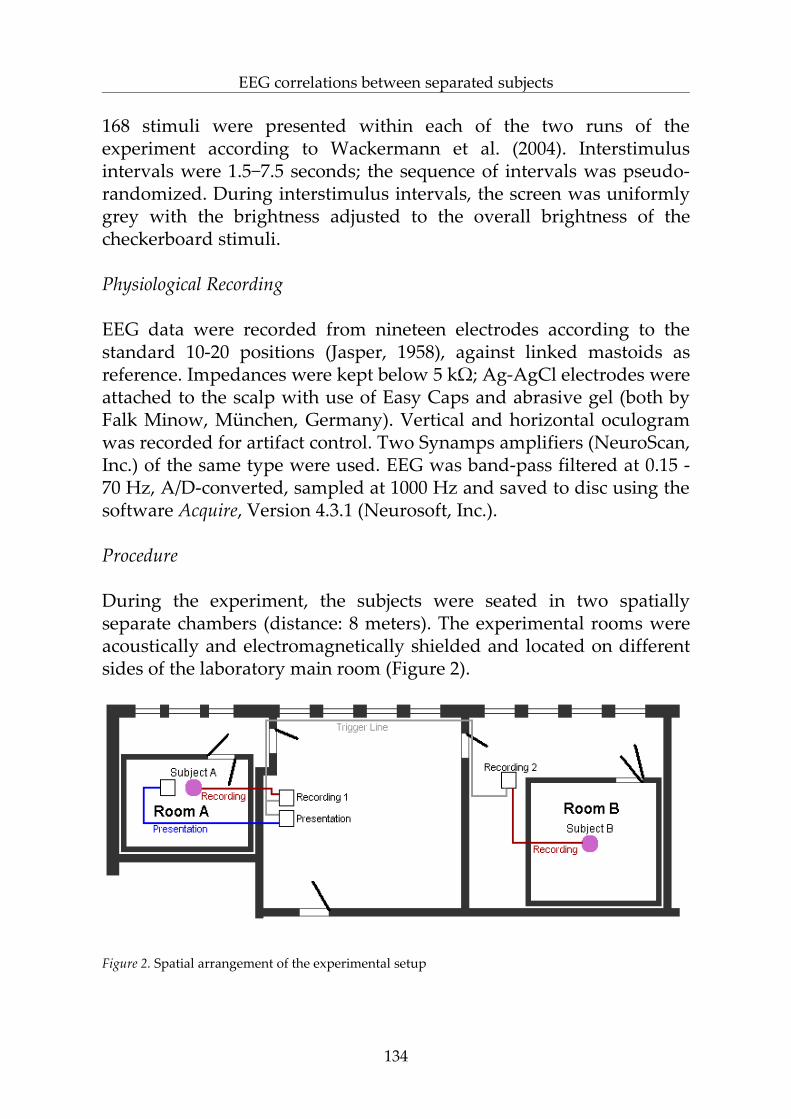
During the experiment, the subjects were seated in two spatially separate chambers (distance: 8 meters). The experimental rooms were acoustically and electromagnetically shielded and located on different sides of the laboratory main room (Figure 2).
Figure 2. Spatial arrangement of the experimental setup
134

Ambach
Each subject was observed via a video-camera by one of the two experimenters. While one subject of each pair, randomly assigned, was stimulated visually in room A, the second was instructed to relax with eyes open in the dimly lit room B. The whole experiment consisted of two runs, the 'uncovered' (experimental) and the 'covered' (control) condition; the sequence of both was balanced over the study. Between both runs, the experimenter responsible for the subject in room A entered the chamber and either covered or uncovered the monitor. The break between both runs was kept between three and five minutes. The non-stimulated subject was not informed about the change of conditions.
Data analysis
For the analysis, offline EEG data were filtered to 0.15 - 30 Hz and visually inspected for artifacts. Data from both stimulated (A) and non-stimulated (B) subjects were segmented into stimulation and interstimulus epochs of one second duration, according to subject A’s stimulation procedure. Segments contaminated with artifacts were discarded from further evaluation; the average loss rate was 34%. For subsequent analyses, the valid segments were detrended by subtracting each segment’s third-order polynomial approximation from the data.
In order to compare subject B's average EEG power between subject A's stimulation and interstimulus epochs, a distribution-free boot-strapping procedure was developed and applied
135
Figure 3. Flow chart of EEG data processing (from Wackermann et al., 2004)

EEG correlations between separated subjects
by Wackermann et al (2004). Figure 3 illustrates the procedure as a flow chart (from Wackermann, 2004).
For each non-stimulated subject, valid stimulation (S) and interstimulus (I) EEG epochs were collected in two pools. All NS
stimulation epochs were averaged; the EEG power Veff was calculated for the averaged signal as theroot mean square of voltage ui of the n
single data points: ∑=
=n
iieff u
nV
1
21 . From the NI interstimulus epochs,
10000 subsets were drawn randomly, each comprising NS segments. Within each subset, the EEG power was computed for the averaged signal. The rank R of the stimulation epochs EEG power was determined within the cumulative distribution function of the interstimulus EEG power values for the 10000 subsets. The procedure was performed separately for each non-stimulated subject and for each EEG channel. Ranks R, after division by the number of subsets, were within the interval [0,1] and reflected the probability of receiving a smaller value than the actual EEG power value out of an arbitrary subset of segments by the law of chance. Under the null-hypothesis, these ranks were assumed to be uniformly distributed between 0 and 1].
The further evaluation steps were adopted from the precedent study (Wackermann et al., 2004). These comprised the transformation of ranks into z-values, the collapsing of data over subjects, the collapsing of data over channels using a chi-square statistic, and the overall assessment of significance for the study. Two different evaluations were performed, based on different time windows: The EEG power was calculated for two different time windows: a) for whole stimulation epochs of one second and b) for a time window of 136ms around the stimulated subject's maximum EEG response (which had been determined individually for each stimulated subject and for each channel electrode position).
For the present analysis, the statistical method was reconsidered in detail, and certain modifications appeared necessary. These are described in the following paragraph.
Modification 1: Sampling for the bootstrap
In what follows, the previous sampling procedure turns out to systematically overestimate effects. From a theoretical point of view,
136

Ambach
this is due to the fact that the method compared one sample ('stimulation' epochs) drawn out of the data population with a second sample ('interstimulus' epochs) drawn out of the data population by bootstrapping. This violates the premise of exchangeability of epochs between sample and reference (Edgington, 1987). As a consequence of this violation, the second sample, which was used as a reference for the first, does not adequately reflect the possible variability of the first but underestimates it. Therefore, the rank of the first mean within the distribution of means of all subsets is not equally distributed within the interval [0,1] but tends towards the extremes of the interval. This inevitably leads to an overestimation of significance of any observed deviations from randomness in either direction. A simplifying model simulation which uses numeric surrogate data instead of EEG epochs and which calculates t-tests for a control of the bootstrap, can illustrate this phenomenon:
A pool of 1,000,000 standard-Gaussian distributed random real numbers served as data population. Out of this pool, a first random sample (sample 1) of N1 = 100 numbers was drawn, for which the mean μ1 was computed. This was to represent the pool of stimulation period values, but instead of sets of whole EEG segments (for later averaging and calculation of EEG power) only one single value μ1 for the mean of the drawn numbers was obtained.
Then, a second random sample (sample 2) with N2 = 300 numbers was drawn out of the data population, representing the non-stimulation segments pool (which is larger, about three to one in relation, than the stimulation segments pool). Out of this second sample, 10,000 subsets of numbers were drawn, each as large as sample 1, thus comprising N1 = 100 numbers each. For each subset, the mean was computed, resulting in 10,000 mean values. The cumulative distribution function of these mean values allowed determining the rank R of μ1 (mean of sample 1) within all of the 10,000 subset means.
According to the pre-assumptions of the applied evaluation method, the rank R should become any value between 0 and 1 with the same probability (even independently from the distribution of values within the data population). After transformation of each rank R into a z-value by the inverse Gaussian function, z-values of multiple repetitions should be distributed standard-Gaussian.
In order to test this, the procedure of drawing samples as described above and calculating a rank R for μ1 was done repeatedly
137

EEG correlations between separated subjects
100,000 times. Fulfillment of the null hypothesis, meaning that sample 1 and sample 2 were drawn out of the same data population, was guaranteed by the model.
In parallel to the bootstrap-like method, the first (N1 = 100) and the second random sample (N2 = 300) were compared for mean difference by using a t-test as a conventional reference method. Performing a t-test was regarded as permissible, even with different sizes of sample 1 and sample 2, since the data were distributed Gaussian.
Every correct method of testing for mean difference should yield the same value p, which is the probability that the first sample is drawn out of a data population with a smaller mean value than the second sample. Given the correctness of the pre-assumptions, the results of the bootstrap and the t-test should be identical. The results are depicted in Figure 4. First, the results obtained by both methods (ranks R obtained from the bootstrap; p-values obtained by the t-test) are compared in a scatterplot (Figure 4a); second, the distribution of these values in the interval [0;1] (pre-assumed to be uniform) is plotted (Figure 4b), and third, the distribution of the z-transformed values (pre-assumed to be distributed standard-Gaussian) is plotted (Figure 4c). For the bootstrap, the pre-assumption is clearly violated, while it is obviously fulfilled for the t-test. Distribution plots for the bootstrap, but not for the t-test, show an increased standard deviation (which, according to pre-assumptions, should be 1.0) and a tendency of results towards the extremes.
To rectify the observed bias, the sampling procedure has been modified: the rank R of the stimulation epochs EEG power is now calculated within multiple subsets drawn from a reference pool comprising all stimulation and interstimulus epochs of the subject. This modification accomplishes that the reference pool, now comprising all epochs, adequately represents the possible variability of EEG measures obtained from the stimulation epochs. In terms of preassumptions for the bootstrapping procedure, segments are now exchangeable. The effect of this modification has been tested with the aforementioned numeric surrogate data. The results are depicted in Figure 5 (with an arrangement corresponding to Figure 4). The ranks R obtained from the bootstrap were now found to be scattered within a small range around the p-value obtained from the t-test. (Additional
138

Ambach
139
Figure 4. Original method of the bootstrap vs. t-test: comparison of results from the numeric simulation. (a) Scatterplot of ranks R (from the bootstrap) versus p-values (from the t-test). (b) Distribution of the 100,000 obtained ranks R and the corresponding p-values yielded by the t-test. (c) Distribution of the ranks R (from the bootstrap) versus p-values (from the t-test) after z-transformation, compared with the standard Gaussian distribution. (Note: the two spikes around 4.0 and -4.0 represent cases in which the mean of sample 1 was outside the range of all subset means; instead of using infinite values; they were summarized at the edge of the plotted range for illustration)
Figure 5. Modified method of the bootstrap vs. t-test: Comparison of results from the numeric simulation. (a) Scatterplot of ranks R (from the bootstrap) versus p-values (from the t-test).(b) Distribution of the 100,000 obtained ranks R and the corresponding p-values yielded by the t-test. (c) Distribution of the ranks R (from the bootstrap) versus p-values (from the t-test) after z-transformation, compared with the standard Gaussian distribution

EEG correlations between separated subjects
analyses revealed that with an increased number of subsets this range converged to zero.)
Furthermore, in order to rule out a weakness in test power, an 'effect' of a known size (e.g. 0.1 standard deviations) was simulated. For this purpose, samples 1 and 2 were drawn out of two different data populations with the means μ1 and μ2. The difference between μ1 and µ2 was varied in order to simulate different effect sizes. The results showed that bootstrap and t-test yielded the same p values, which suggests that the modified sampling procedure does not bias results in the case of an existing effect.
Modification 2: Correction for degrees of freedom
A second concern refers to the collapsing of results over EEG channels. The z-values from the nineteen EEG channels are not independent from each other; the columns of z-values, each comprising the results from a single EEG channel for all subjects, are considerably intercorrelated. This implies that the chi-square resulting from these z-values has less than nineteen degrees of freedom. Accordingly, the application of a chi-square test according to the preassumption of nineteen degrees of freedom (which would be appropriate in the case of independent channel results) will overestimate the significance of any observed deviation from randomness. A correction for the degrees of freedom was achieved by using a Monte-Carlo simulation.
In multiple (5000) permutations of all EEG segments of a subject, segments were assigned randomly to either the 'stimulation' or the 'interstimulus' epoch pool; pool sizes NS and NI were adopted from the real study data. This assignment was performed once per subject and kept constant over the nineteen EEG channels (in order to adopt the degree of interdependence of the channelwise results from the study data). For each such permutation, data were analyzed as described above, which, after collapsing over subjects and over channels, resulted in a chi-square value for each time window (136 ms, 1000 ms) and each condition (uncovered, covered, and difference). The cumulative distribution function for the 5000 collected chi-square values was plotted. From this curve, for any chi-square value, a corresponding p value can be determined, which indicates the probability of not exceeding the according chi-square value by randomness.
140

Ambach
For the chi-square values obtained as study results, the corresponding p values were readable from the cumulative distribution functions that resulted from the simulation. This allowed an assessment of significance which was corrected for the degrees of freedom of the EEG channels.
Results
All analyses have been performed for two different time windows, 136 ms and 1000 ms; the results are described for both 'uncovered' and 'covered' conditions, as well as for the difference between conditions. Channelwise results after collapsing z-values over subjects are summarized in Figure 6. Chi-square values, resulting from collapsing data over channels, are included for each time window and condition.
Figure 6. Results after collapsing over subjects: Channelwise z-values for the 136 ms and the 1000 ms time window: 'uncovered' and 'covered' condition, and 'difference between conditions'. Chi-square results after collapsing results over channels are included.
141

EEG correlations between separated subjects
Figure 7. Cumulative chi-square distributions from the Monte-Carlo simulations; A: 136 ms window, B: 1000 ms window. Vertical, dashed lines denote the chi-square values obtained from the study for uncovered and covered conditions and the difference between them. Corresponding p values for any chi-squares are read from these distributions; vertical, solid lines mark the lower and upper cutoff chi-squares according to the significance level of 0.05 (two-tailed test). The dotted curve reflects the cumulative chi-square distribution for nineteen degrees of freedom (reflecting the evaluation without correction for degrees of freedom)
Monte-Carlo simulations for both time windows were performed in order to estimate the statistical significance of the chi-squares (i.e. the probability with which pure randomness would produce larger effects than the study data). The results from the Monte-Carlo simulations serve as a reference for the chi-squares obtained from the
142

Ambach
study data, as depicted in Figure 7. It can also be read from the figure, which excessive significance levels would correspond to the obtained chi-squares without correction for the degrees of freedom (dotted lines).
Comparison with the previous method
In order to estimate the effect of the methodological modifications on the study results, the study data were also analyzed using a) the previous method without modifications ('original method'), b) the previous method with change of only the sampling for the bootstrap, but without correction for degrees of freedom ('new sampling'), and c) the modified method ('new method'). Chi-squares and significance levels obtained from a), b), and c) are compared in Table 1. Note that 'new sampling' and 'new method' do not differ with respect to chi squares but with respect to significance levels.
Table 1: Dependence of study results on the evaluation method: Chi-squares and significancelevels (p values for two-tailed testing, in brackets) obtained from the original method, obtained
after the modification of only the sampling procedure ('new sampling'), and obtained afterboth modifications of the method ('new method')
136 ms 1000 msOriginal method
New sampling
New method
Original method
New sampling
New method
Uncovered (u) 21.43 (.627)
17.05 (.827)
17.05 (.898)
33.91 (.038)
23.31 (.448)
23.31 (.511)
Covered (c) 15.45 (.623)
11.94 (.224)
11.94 (.303)
29.00 (.132)
27.98 (.168)
27.98 (.297)
Difference (u-c) 30.69 (.087)
23.21 (.456)
23.21 (.492)
49.66 (.0003)
40.99 (.0048)
40.99 (.067)
A further Monte-Carlo simulation was performed to investigate the proportion of positive study outcomes with the previous method under fulfillment of the null-hypothesis. The latter was achieved by multiple random permutations of all 'stimulation' and 'interstimulus' EEG epochs of a subject. Strikingly, the evaluation using the previous method without modification falsely led to 20.1% (26.2%) significant
143

EEG correlations between separated subjects
results per condition for the 136 ms (1000 ms) time window, when the significance level α was actually set to 0.05.
Discussion
The present study on correlations in the EEG of spatially separated subjects aimed at a replication and possible clarification of the effects described by Wackermann et al. (2004). The research paradigm was adopted from there.
The EEG power of the non-stimulated subject did not significantly differ between stimulation and interstimulus periods of the stimulated subject. This overall result was obtained after two modifications of the statistical method: A change in the sampling procedure for the bootstrapping, and a correction of the chi-square test for the degrees of freedom of the nineteen EEG channels.
It has to be noted that the chi-square for the 1000 ms time window and 'difference between conditions' just missed the significance level and therefore might remain an object of discussion. On the other hand, a correction of the significance levels for multiple testing has to be considered, because a number of separate evaluations and significance assessments were performed a) for two different time windows and b) for the 'uncovered' and the 'covered' condition and for the difference between conditions. However, even without a correction for multiple testing, none of the six chi-squares exceeded the significance level of 0.05.
The overall result is seen as a negative outcome of the attempt to replicate prior findings of EEG correlations in this specific experimental paradigm. Of course, it may not be interpreted as a proof of the absence of the phenomenon under question; firstly and trivially, the absence of an effect cannot be proven by an unsuccessful replication attempt; secondly, the outcome refers to the specific constellation of EEG correlations if one subject is visually stimulated by checkerboard reversal, which is an abstract pattern.
It is further suggested that the results presented here should not be discussed in terms of 'telepathy', which was the motivational origin of some early studies on EEG correlations between separated subjects (e.g. Grinberg-Zylberbaum et al., 1994). The recent discussion in the field rather refers to 'non-local correlations between distant brains' which is a broader concept than the assumption of a directed
144

Ambach
transmission of information by means of telepathy. Regardless of the viewpoint however, the present study does not contribute to substantiate the assumption of unexplainable non-local correlations.
Besides the failed replication, the study critically revised the statistical procedure applied in previous studies. It revealed the necessity to introduce two important changes.
With the previous method being applied without modification, results for the 1000 ms (whole-epochs) evaluation suggested a significant change in the non-stimulated subject's EEG power in the 'uncovered' condition, with a highly significant difference between 'uncovered' and 'covered' conditions. The change consisted of an increase in EEG power in parietal, predominantly left-hemispheric regions and a decrease in bilateral temporal regions, which is quite different from the topography of the effects reported by Wackermann (2004). However, using the modified analysis, all observed changes in EEG power were below significance level. Therefore, the results obtained from the previous method are likely due to inadequate statistical analyses.
It is expected that the results of those preceding studies, which used the statistical method discussed here without the two proposed modifications, and which claimed effects unexplainable by conventional physiology and physics, will undergo a decrease in effect size and significance when the revised method is applied on these data. From here, it cannot be estimated with precision, to what extent the previous results have been biased by the statistical method, and to what extent either of the modifications would affect these previous results. However, both of the methodological annotations must have led into the same direction, namely to overestimate the effects under investigation.
References
Charman, R.A. (2006). Has direct brain to brain communication been demonstrated by electroencephalographic monitoring of paired or group subjects? The Journal of the Society for Psychical Research 70, 1-24.
Edgington, E.S. (1987). Randomization Tests. New York, NY: Marcel Dekker Inc.Fenwick, P., Vigus, N., and Sanders, S. (1998). The transferred potential. Unpublished
manuscript, London.
145
EEG correlations between separated subjects
Grinberg-Zylberbaum, J., Delaflor, M., Attie, L., and Goswami, A. (1994). The Einstein-Podolsky-Rosen Paradox in the brain: the transferred potential. Phys Essays, 7, 422-427.
Jasper, J.J. (1958). The 10/20 international electrode system. Electroencephalogr. Clin. Neurophysiol., 10, 371-375.
May, E. C., Spottiswoode, S. J. P., and Faith, L. V. (2001). A methodological issue in the study of correlation between psychophysiological variables. Proceedings of the 44th Annual Convention of the Parapsychological Association, 166-178.
Sabell, A., Clarke, C., and Fenwick, P. (2001). Inter-subject EEG correlations at a distance - the transferred potential. Proceedings of the 44th Annual Convention of the Parapsychological Association, 419-422.
Standish, L. J., Kozak, L., Johnson, L. C., and Richards, T. (2004). Electroencephalographic evidence of correlated event-related signals between the brains of spatially and sensory isolated human subjects. The Journal of Alternative and Complementary Medicine, 10, 307-314.
Radin, D.I. (2003). Thinking outside the box: EEG correlations between isolated human subjects. Proceedings of the 43th Annual Convention of the Parapsychological Association, 184-199.
Radin, D. I., (2004). Event-related electroencephalographic correlations between isolated human subjects. The Journal of Alternative and Complementary Medicine, 10, 315-323.
Wackermann, J., Seiter, C., Keibel, H., and Walach, H. (2003). Correlations between brain electrical activities of two spatially separated human subjects. Neuroscience Letters, 336, 60-64.
Wackermann, J. (2004). Dyadic Correlations between Brain Functional States: Present Facts and Future Perspectives. Mind and Matter, 2, 105-122.
Wackermann, J., Naranjo Muradás, J.R., and Pütz, P. (2004). Event-Related Correlations between Brain Electrical Acitivites of Separated Human Subjects: Preleminary Results of a Replication Study. Proceedings of the 47th Annual Convention of the Parapsychological Association, 465-468.
146