corporations: the financial statements … chapters/nait ch 16 te.pdf · chapter 16 corporations:...
TRANSCRIPT

115
Assessment Questions
AS-1 ( 1 )
How are income taxes recorded for accounting purposes (cash basis vs accrual basis)?
______________________________________________________________________________
______________________________________________________________________________
______________________________________________________________________________
______________________________________________________________________________
AS-2 ( 1 )
Define accounting income and taxable income.
______________________________________________________________________________
______________________________________________________________________________
______________________________________________________________________________
______________________________________________________________________________
AS-3 ( 1 )
What does “deferred income taxes” refer to?
______________________________________________________________________________
______________________________________________________________________________
______________________________________________________________________________
CORPORATIONS: THE FINANCIAL STATEMENTS
Chapter 16
Income taxes are recorded in the financial statements using the accrual basis of accounting.
Accounting income represents the amount of profit (per accounting policies) a company
makes during a specific period of time (revenues less expenses). Taxable income is the portion
of income subject to taxation law.
The difference between income taxes payable (calculated using taxable income) and income
tax expense (calculated from accounting income) is known as deferred income tax.

Chapter 16 Corporations: The Financial Statements
116
AS-4 ( 2 )
Describe the steps in preparing closing entries for corporations (assuming the income summary account is used).
______________________________________________________________________________
______________________________________________________________________________
______________________________________________________________________________
AS-5 ( 3 )
Define discontinued operations.
______________________________________________________________________________
______________________________________________________________________________
______________________________________________________________________________
______________________________________________________________________________
AS-6 ( 3 )
Define other comprehensive income.
______________________________________________________________________________
______________________________________________________________________________
______________________________________________________________________________
______________________________________________________________________________
AS-7 ( 4 )
What information must a corporation disclose relative to income and retained earnings?
______________________________________________________________________________
______________________________________________________________________________
______________________________________________________________________________
______________________________________________________________________________
______________________________________________________________________________
The first step is to close the revenue and expense accounts to the income summary account.
Then, the income summary account is closed to retained earnings.
A discontinued operation is a segment of business that is no longer part of regular operating
activities. Cash flows relating to such operations should be presented separately on the
income statement.
A corporation should show:
• net income for the year
• changes in retained earnings
• basic net income (earnings) per share
• diluted net income per share
Other Comprehensive income includes net income and other changes in equity as a result
of events from non-owner sources. This term is listed below net income on the income
statement.

Chapter 16Corporations: The Financial Statements
117
AS-8 ( 7 )
Define and discuss book value per share.
______________________________________________________________________________
______________________________________________________________________________
______________________________________________________________________________
______________________________________________________________________________
______________________________________________________________________________
______________________________________________________________________________
______________________________________________________________________________
______________________________________________________________________________
______________________________________________________________________________
______________________________________________________________________________
______________________________________________________________________________
______________________________________________________________________________
AS-9 ( 7 )
What ratio is used to assess debt relative to the amount of equity? Discuss.
______________________________________________________________________________
______________________________________________________________________________
______________________________________________________________________________
______________________________________________________________________________
______________________________________________________________________________
______________________________________________________________________________
______________________________________________________________________________
______________________________________________________________________________
______________________________________________________________________________
______________________________________________________________________________
Book value per share is a ratio used by investors and analysts to assess shares. To calculate the
book value per share, divide the shareholder’s equity minus preferred shares by the number
of common shares outstanding. The larger the book value per share, the more valuable
the share. The amounts (shareholder’s equity, preferred shares, and number of shares) are
all available from the financial statements. Note that the book value of shares does not
necessarily determine the value at which the shares can be sold (i.e. market value). Market
value is dependent on a number of factors such as industry mechanics, analyst predictions
and overall macroeconomic factors. Market value can vary greatly from book value.
The Debt-to-Equity ratio measures the amount of debt to equity for a business. When the
debt-to-equity ratio is 1:1, it means that lenders have the same investment in a business, as do
owners. When the debt to equity ratio is above 1:1, at say 1.5:1, it means that lenders have a
larger investment in the business than the owners. A debt to equity ratio of 1.5:1 means that
for every dollar that owners have invested in a business, lenders have $1.50 invested. A ratio
greater than 1:1 tends to make lenders “nervous” because the lenders have more of an interest
in the success of the business than the owners, because the lenders stand to lose more if the
business becomes bankrupt. The preferred ratio would be less than 1:1, say 0.6:1. That means
that for every dollar that owners have invested, there is only $0.60 for lenders. It is usually
better for the owners to have a greater investment in the company than lenders.

Chapter 16 Corporations: The Financial Statements
118
AS-10 ( 7 )
What ratio is used to determine what amount of a company’s earnings is paid out in dividends?
______________________________________________________________________________
AS-11 ( 7 )
How do you calculate earnings per share?
______________________________________________________________________________
=Net Income - Preferred Dividends
Earnings per shareAverage Number of Common Shares Outstanding
The dividend payout ratio:
Dividends Paid in a YearNet Income after Tax

Chapter 16Corporations: The Financial Statements
119
Application Questions
AP-1 ( 1 )
At year end, Shuster Home Decor Inc. (a small home furnishings retail store run by Terri) has accounting income (before income tax expense calculation) of $102,000. Write the journal entry to record the income tax expense. Assume the tax rate is 30%.
Date Account Title and Explanation Debit Credit
Income Tax Expense 30,600
Income Tax Payable 30,600
To record the income tax expense for the year
30% x $102,000 = $30,600
AP-2 ( 1 )
At year end, F’Brae Cheerleading Inc. (a medium sized distributor of cheerleading outfits) has accounting income of $210,000. Write the journal entry to record the income tax expense. Assume the tax rate is 30%.
Date Account Title and Explanation Debit Credit
Income Tax Expense 63,000
Income Tax Payable 63,000
To record the income tax expense for the year
30% x $210,000 = $63,000
AP-3 ( 1 )
CoreeMonTeeth Dental Inc. is a manufacturer of high quality dental equipment. In the current year it had accounting income of $300,000 which included $40,000 of warranty expenses. Per income taxation law, however, the warranty expenses are not deductible until they are actually paid. Write the journal entry to record income tax payable. Assume the tax rate is 30%.
Date Account Title and Explanation Debit Credit
Income Tax Expense 90,000
Deferred Tax Asset 12,000
Income Tax Payable 102,000
To record the income tax expense for the year
30% x $300,000 = $90,000
30% x $40,000 = $12,000
30% x $340,000 = $102,000

Chapter 16 Corporations: The Financial Statements
120
AP-4 ( 3 )
Green Light Emissions Everyday (otherwise known as GLEE Inc.) has sales of $400,000 and expenses of $120,000 (before calculation of income tax expense). Prepare a basic income statement for GLEE taking into account income tax expense. Assume a tax rate of 30%.
GLEE Inc.Income Statement
For the Year Ended December 31, 20x2
Sales $400,000
Expenses 120,000
Income Tax Expense 84,000 204,000
Income from Continuing Operations $196,000
AP-5 ( 1 )
Born off the coast of Mykonos, Gregory displayed an aptitude for singing at a very early age. In high school, he joined a musical club that participated in numerous singing competitions. His stage name was “Gleek the Greek.” Gregory decided that one day he would like to start his own singing school and is now taking an accounting course to help him become financially literate. He is posed with the following question on his test. Help him solve this question.
“Nacho Libray Inc. has income from continuing operations of $200,000. Their total expenses amounted to $100,000 and, of that, $50,000 pertained to income tax expense. Calculate the income tax rate used.”
______________________________________________________________________________
AP-6 ( 5 )
The bookkeeper for GIFT Inc. noticed that she made an error when recording a $44,000 expenditure in the prior fiscal year. She booked the amount to the Repairs and Maintenance expense account instead of posting to the Equipment account. Write the journal entry that should be recorded to correct the Equipment account. Ignore the impact of depreciation. Assume the tax rate is 30%.
Date Account Title and Explanation Debit Credit
Equipment 44,000
Retained Earnings 30,800
Income Tax Payable ($44,000 x 30%) 13,200
To correct amounts for error recorded in
prior fiscal year
30% x $44,000 = $13,200
Income tax rate is: = 50,000 ÷ [200,000 + 50,000] = 20%

Chapter 16Corporations: The Financial Statements
121
AP-7 ( 5 )
An auditor noticed that TFK Inc. accidently recorded an insurance expenditure of $50,000 as an expense instead of properly recording it as a prepaid. The purchase was made on the last day of the fiscal period. Write the journal entry that should be recorded in the next fiscal period to correct the Prepaid Insurance account. Assume the tax rate is 30%.
Date Account Title and Explanation Debit Credit
Prepaid Insurance 50,000
Retained Earnings 35,000
Income Tax Payable ($50,000 x 30%) 15,000
To correct amounts for error recorded in
prior fiscal year
30% x $50,000 = $15,000
AP-8 ( 7 )
Shown below are sections of the financial statements of Research in Motion. Calculate the book value per share for 2014.
Shareholders’ Equity
Contributed Capital
Authorized – unlimited number of non-voting, cumulative, redeemable, retractable preferred shares; unlimited number of non-voting, redeemable, retractable Class A common shares and an unlimited number of voting common shares; Issued – 562,652 voting common shares (March 3, 2013 – 557,613)
2,169,856
Retained Earnings 1,653,094
Paid-in Capital 80,333
Accumulated other comprehensive income (loss) 30,283
Total Shareholders’ Equity 3,933,566
Total Liabilities and Shareholders’ Equity 5,511,187
Information regarding number of shares:
Balance as at March 3, 2013 557,613
Exercise of stock option 5,039
Balance at March 1, 2014 562,652

Chapter 16 Corporations: The Financial Statements
122
Shareholders’ equity $3,933,566
Shares – end of year 562,652
Book value per share $6.99
AP-9 ( 7 )
Refer to AP-8 above. The RIM income statement shows the following:
Net income $1,293,897
Earnings per share
Basic $2.31
Diluted $2.26
Calculate the earnings per share. Your calculation of EPS may not agree with the numbers shown above. See the Critical Thinking Exercise at the end of this chapter for further discussion.
______________________________________________________________________________
AP-10 ( 7 )
Research in Motion’s balance sheet shows total liabilities of $1,577,621. Refer to the equity section of the statements shown in AP-8 above, and calculate the debt-to-equity ratio. Note your comments on the ratio.
______________________________________________________________________________
______________________________________________________________________________
______________________________________________________________________________
______________________________________________________________________________
______________________________________________________________________________
______________________________________________________________________________
Earnings per share = ($1,293,897) ÷ [(557,613 + 562,652) ÷ 2] = $2.31 per share
Total Liabilities = 1,577,621
Total Equity = 3,933,566
Debt to Equity ratio = 1,577,621 ÷ 3,933,566 = 0.40:1
The ratio is “good” since it is below 1:1
For every $1 invested by owners, lenders have invested 40 cents. The ownership is essentially
more responsible for financing the company.

Chapter 16Corporations: The Financial Statements
123
AP-11 ( 7 )
Part of the financial statements of Toromont Industries is shown below:
Consolidated Statements of Retained EarningsFor the Year Ended December 31, 2007 ($ thousands)
Retained Earnings, beginning of year $477,820
Net Earnings 122,280
Dividends (31,061)
Retained Earnings, end of year $539,039
Calculate the dividend payout ratio and discuss.
______________________________________________________________________________
______________________________________________________________________________
______________________________________________________________________________
______________________________________________________________________________
______________________________________________________________________________
AP-12 ( 3 , 4 )
The following information was taken from the accounting records of Cutler Inc. at December 31, 2014. Cutler Inc. is a private corporation and follows GAAP.
Line Item AmountPrior-year error – debit to Retained Earnings 15,000Income tax expense on operating income from discontinued operations 19,600Total dividends 67,000Common shares, 75,000 shares issued 201,000Sales revenue 605,000Interest expense 17,000Operating income, discontinued operations 56,000Loss due to lawsuit 16,000Sales discounts 30,000Income tax savings on sale of discontinued operations (sold at a loss) 8,750General expenses 23,000Income tax expense on continuing operations 73,150Preferred shares, $7.00, 1,000 shares issued 60,000Retained earnings, January 1, 2014 (prior to adjustment) 135,000Loss on sale of discontinued operations 25,000Cost of goods sold 310,000
The dividend payout ratio = dividends ÷ net income = 31,061 ÷ 122,280 = 25%
A dividend payout ratio of 25% may be considered to be reasonable. It leaves 75% of net
income in the company for re-investment. Recall that a high net income does not mean that a
corporation has sufficient cash to pay dividends. In any case paying a dividend equal to 100%
of net income would be unwise.

Chapter 16 Corporations: The Financial Statements
124
Required:
a) Prepare an income statement for the year ended December 31, 2014.
b) Prepare a statement of retained earnings for Cutler Inc. for the year ended December 31, 2014.
c) Calculated the EPS ratio.
Assume a tax rate of 35%. During the year, no new shares were issued or redeemed.
a) Cutler Inc.Income Statement
For the Year Ended December 31, 2014
Sales Revenue $605,000
Less: Sales Discounts (30,000)
Net Sales 575,000
Cost of Goods Sold (310,000)
Gross Profit 265,000
Expenses
General Expenses $23,000
Operating Income 242,000
Other Revenue and Expenses
Interest Expense 17,000
Loss Due to Lawsuit 16,000 33,000
Net Income Before Taxes 209,000
Income Tax Expense 73,150
Income from Continuing Operations 135,850
Discontinued Operations
Operating Income 56,000
Less Income Tax (19,600) 36,400
Loss on Sale of Discontinued Operations (25,000)
Less Income Tax Saving 8,750 (16,250)
Net Income $156,000

Chapter 16Corporations: The Financial Statements
125
b)
Cutler Inc.Statement of Retained Earnings
For the Year Ended, December 31, 2014
Retained earnings, January 1, 2014 (as originally reported) $135,000
Correction to prior-year error - debit (15,000)
Retained earnings, January 1, 2014, as adjusted 120,000
Net Income for current year 156,000
276,000
Dividends for 2014 (67,000)
Retained earnings, December 31, 2014 $209,000
c)
______________________________________________________________________________
______________________________________________________________________________
______________________________________________________________________________
AP-13 ( 2 )
For the year that just passed, a company experienced a net loss of $140,000. The revenues and expenses have already been closed to the income summary account. Prepare the final entry to complete the closing process.
Date Account Title and Explanation Debit Credit
Dec 31 Retained Earnings 140,000
Income Summary 140,000
To close net loss for the year to
retained earnings
Since Preferred Dividends = $7.00 x 1,000 = $7,000 and assuming the same number of shares
have been outstanding throughout the year:
EPS = (156,000 – 7,000) ÷ 75,000 = $1.99

Chapter 16 Corporations: The Financial Statements
126
AP-14 ( 2 )
An extract from MC Consulting’s pre-closing trial balance for the year ended December 31, 2014 is shown below. The company’s net income for the year was $82,000.
MC ConsultingTrial Balance (Extract)
December 31, 2014Account Debit Credit
Sales Revenue 240,000Cost of Goods Sold 85,000Salaries Expense 50,000Rent Expense 10,000Income Tax Expense 13,000
Prepare the closing entries for MC Consulting assuming the company uses the income summary account.
Date Account Title and Explanation Debit CreditDec 31 Sales Revenue 240,000
Income Summary 240,000
To close the revenue account
Dec 31 Income Summary 158,000
Cost of Goods Sold 85,000
Salaries Expense 50,000
Rent Expense 10,000
Income Tax Expense 13,000
To close expense accounts
Dec 31 Income Summary 82,000
Retained Earnings 82,000
To close net income for the year
to retained earnings
Chapter 16Corporations: The Financial Statements
127
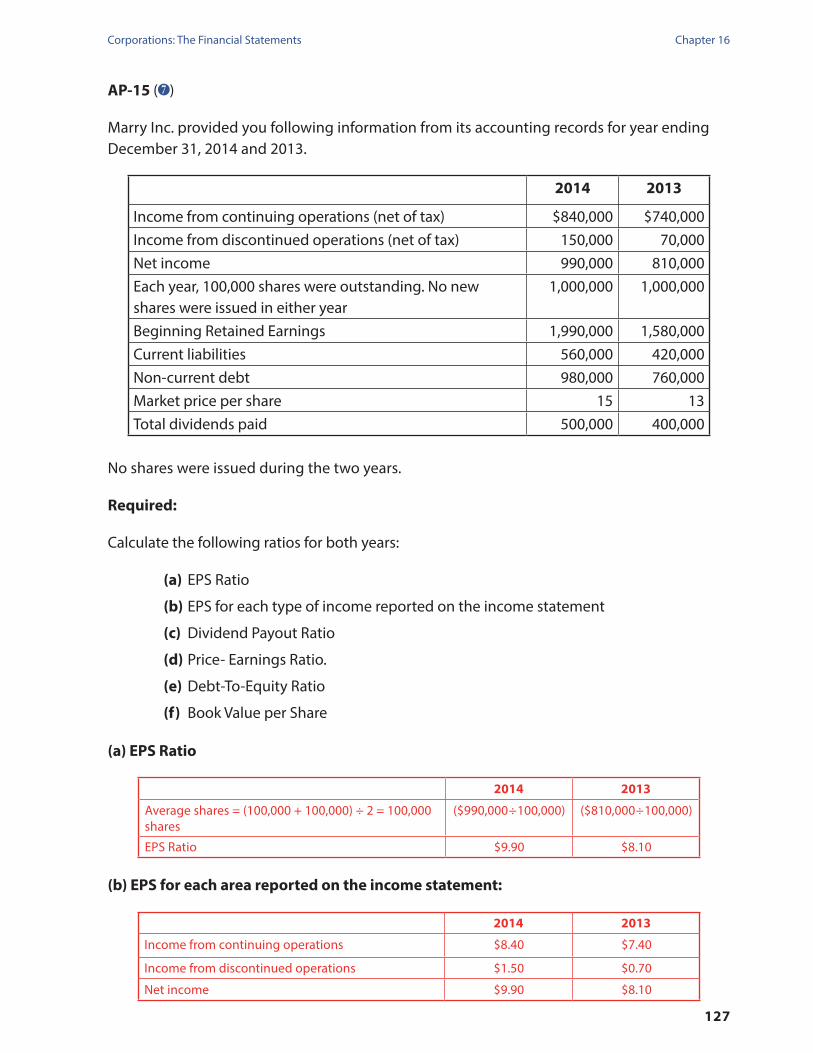
AP-15 ( 7 )
Marry Inc. provided you following information from its accounting records for year ending December 31, 2014 and 2013.
2014 2013
Income from continuing operations (net of tax) $840,000 $740,000Income from discontinued operations (net of tax) 150,000 70,000Net income 990,000 810,000Each year, 100,000 shares were outstanding. No new shares were issued in either year
1,000,000 1,000,000
Beginning Retained Earnings 1,990,000 1,580,000Current liabilities 560,000 420,000Non-current debt 980,000 760,000Market price per share 15 13Total dividends paid 500,000 400,000
No shares were issued during the two years.
Required:
Calculate the following ratios for both years:
(a) EPS Ratio
(b) EPS for each type of income reported on the income statement
(c) Dividend Payout Ratio
(d) Price- Earnings Ratio.
(e) Debt-To-Equity Ratio
(f) Book Value per Share
(a) EPS Ratio
2014 2013
Average shares = (100,000 + 100,000) ÷ 2 = 100,000 shares
($990,000 ÷ 100,000) ($810,000 ÷ 100,000)
EPS Ratio $9.90 $8.10
(b) EPS for each area reported on the income statement:
2014 2013
Income from continuing operations $8.40 $7.40
Income from discontinued operations $1.50 $0.70
Net income $9.90 $8.10

Chapter 16 Corporations: The Financial Statements
128
(c) Dividend Payout Ratio
Dividend Payout Ratio =Dividends paid in year
Net income after tax (NAT)
2014 2013
Dividend Payout Ratio = $500,000 ÷ 990,000 =$400,000 ÷ 810,000
=51% =49%
(d) Price - Earnings Ratio
2014 2013
Market price per share $15 $13
EPS 9.90 8.10
P/E ($15 ÷ 9.90) 1.52 1.60
(e) Debt-to-Equity Ratio
Sample Calculation for 2014 2014 2013
Total debt = $560,000+980,000 1,540,000 1,180,000
Shareholder’s Equity =$1,990,000+1,000,000+990,000- 500,000
3,480,000 2,990,000
0.44 0.39
(f) Book Value per Share
2014 2013
Shareholders’ Equity $3,480,000 $2,990,000
# of Common Shares 100,000 100,000
34.80 29.90

Chapter 16Corporations: The Financial Statements
129
AP-16 ( 7 )
The following data is available for two companies, Sam Corporation and Tally Corporation for the year ended December 31, 2014.
Sam Corporation
Tally Corporation
Income from continuing operations (net of tax) $710,000 $510,000Income from discontinued operations (net of tax) 120,000 60,000Net income 830,000 570,000Average number of shares outstanding during the year: 100,000 issued by Sam and 50,000 by Tally
800,000 450,000
Beginning Retained Earnings 2,070,000 1,580,000Current liabilities 560,000 420,000Non-current debt 980,000 760,000Market price per share 14 11Total dividends paid 200,000 120,000
Required:
a) Calculate the following ratios for both companies:
1. EPS Ratio2. EPS for each area reported on the income statement3. Dividend Payout Ratio4. Price - Earnings Ratio5. Debt-to-Equity Ratio
1. EPS Ratio
Sam Corporation
Tally Corporation
EPS Ratio $8.30 $11.40
2. EPS for each area reported on the income statement:
Sam Corporation
Tally Corporation
Income from continuing operations $7.10 $10.20
Income from discontinued operations 1.20 1.20
Net income $8.30 $11.40
Chapter 16 Corporations: The Financial Statements
130
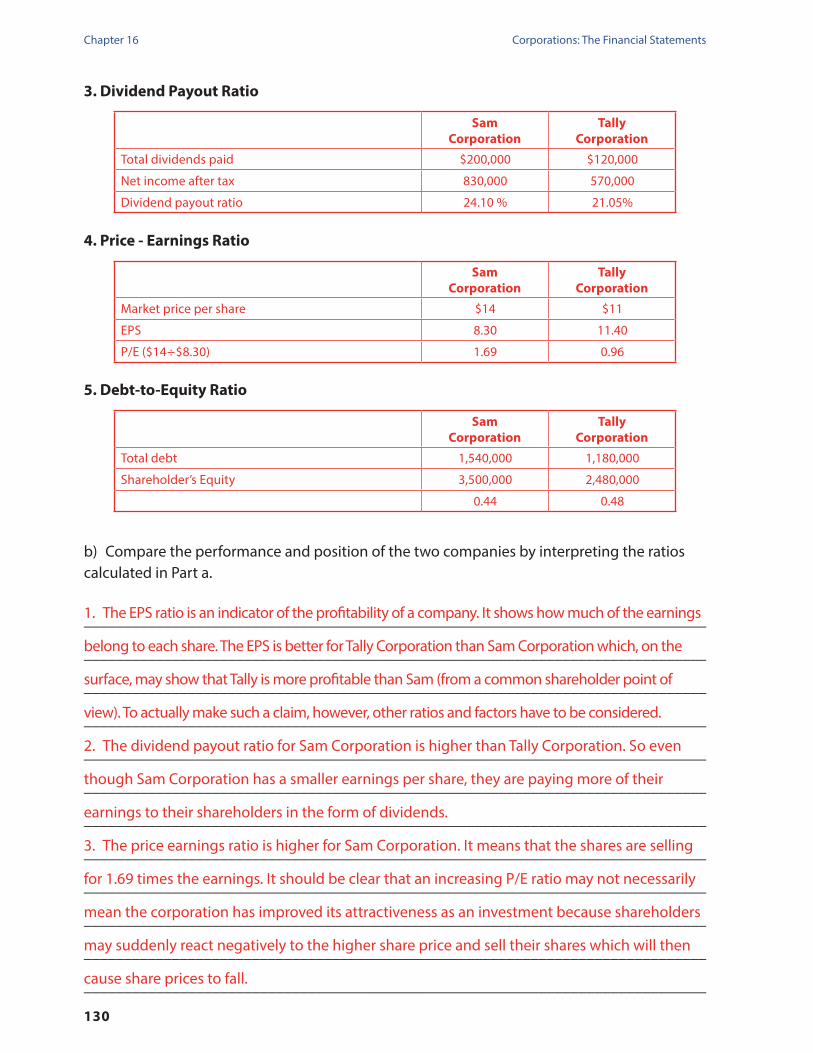
3. Dividend Payout Ratio
Sam Corporation
Tally Corporation
Total dividends paid $200,000 $120,000
Net income after tax 830,000 570,000
Dividend payout ratio 24.10 % 21.05%
4. Price - Earnings Ratio
Sam Corporation
Tally Corporation
Market price per share $14 $11
EPS 8.30 11.40
P/E ($14 ÷ $8.30) 1.69 0.96
5. Debt-to-Equity Ratio
Sam Corporation
Tally Corporation
Total debt 1,540,000 1,180,000
Shareholder’s Equity 3,500,000 2,480,000
0.44 0.48
b) Compare the performance and position of the two companies by interpreting the ratios calculated in Part a.
______________________________________________________________________________
______________________________________________________________________________
______________________________________________________________________________
______________________________________________________________________________
______________________________________________________________________________
______________________________________________________________________________
______________________________________________________________________________
______________________________________________________________________________
______________________________________________________________________________
______________________________________________________________________________
______________________________________________________________________________
______________________________________________________________________________
1. The EPS ratio is an indicator of the profitability of a company. It shows how much of the earnings
belong to each share. The EPS is better for Tally Corporation than Sam Corporation which, on the
surface, may show that Tally is more profitable than Sam (from a common shareholder point of
view). To actually make such a claim, however, other ratios and factors have to be considered.
2. The dividend payout ratio for Sam Corporation is higher than Tally Corporation. So even
though Sam Corporation has a smaller earnings per share, they are paying more of their
earnings to their shareholders in the form of dividends.
3. The price earnings ratio is higher for Sam Corporation. It means that the shares are selling
for 1.69 times the earnings. It should be clear that an increasing P/E ratio may not necessarily
mean the corporation has improved its attractiveness as an investment because shareholders
may suddenly react negatively to the higher share price and sell their shares which will then
cause share prices to fall.

Chapter 16Corporations: The Financial Statements
131
AP-17 ( 3 , 4 )
Below is a list of accounts and balances for FlipFlop Inc. for the year ending June 30, 2014. Based on the information provided, answer the required questions.
Account Title BalanceAccounts Payable $8,900Accounts Receivable 6,100Accumulated Depreciation 1,200Bank Loan 21,000Cash 19,000Common Shares 10,000Cost of Goods Sold 13,500Depreciation Expense 700Dividends 3,500Gain on Sale of Assets from Discontinued Operations 2,000Insurance Expense 600Interest Expense 120Interest Revenue 280Income Tax Expense (Continuing Operations) 1,516Income Tax Expense (Discontinued Operations) 2,000Inventory 18,000Maintenance Expense 590Operating Income from Discontinued Operations 8,000Prepaid Insurance 3,250Professional Fees Expense 260Property, Plant & Equipment 25,000Rent Expense 1,000Retained Earnings (beginning balance) 17,986Salaries Expense 2,500Sales Discounts 1,100Sales Returns and Allowances 840Sales Revenue 30,000Telephone Expense 90Travel Expense 1,400Unearned Revenue 1,700
Notes:
Unlimited common shares are authorized and 2,000 have been issued.The bank loan is payable over 5 years and $4,200 will be paid by June 30, 2015.

Chapter 16 Corporations: The Financial Statements
132
Required:
a) Prepare a multistep income statement for the year ending June 30, 2014.b) Prepare a statement of retained earnings at June 30, 2014.c) Prepare a Classified Balance Sheet at June 30, 2014.
a)FlipFlop Inc.
Income StatementFor the Year Ended June 30, 2014
Sales Revenue $30,000
Less Sales Discounts (1,100)
Less Sales Returns and Allowances (840) (1,940)
Net Sales 28,060
Less Cost of Goods Sold (13,500)
Gross Profit 14,560
Operating Expenses
Insurance Expense $600
Maintenance Expense 590
Rent Expense 1,000
Professional Fees Expense 260
Salaries Expense 2,500
Telephone Expense 90
Travel Expense 1,400
Depreciation Expense 700
Total Operating Expenses (7,140)
Income from Operations 7,420
Other Revenue and Expenses
Interest Revenue 280
Interest Expense (120) 160
Income before Tax 7,580
Income Tax Expense 1,516
Income from Continuing Operations 6,064
Discontinued Operations
Operating Income from Discontinued Operations 8,000
Gain on Sale of Assets from Discontinued Operations 2,000
Income Tax Expense (2,000) 8,000
Net Income 14,064

Chapter 16Corporations: The Financial Statements
133
b)
FlipFlop Inc.Statement of Retained Earnings
For the Year Ended June 30, 2014
Beginning Retained Earnings $17,986
Add: Net Income 14,064
Less: Dividends (3,500)
Ending Retained Earnings $28,550
c)
FlipFlop Inc.Balance Sheet
As at June 30, 2014
Assets
Current Assets
Cash $19,000
Accounts Receivable 6,100
Prepaid Insurance 3,250
Inventory 18,000
Total Current Assets $46,350
Non-Current Assets
Property, Plant & Equipment 25,000
Accumulated Depreciation (1,200)
Total Non-Current Assets 23,800
Total Assets $70,150
Liabilities
Current Liabilities
Accounts Payable $8,900
Unearned Revenue 1,700
Bank Loan - Current Portion 4,200
Total Current Liabilities $14,800
Non-Current Liabilities
Bank Loan - Non-Current Portion 16,800
Total Non-Current Liabilities 16,800
Total Liabilities 31,600
Shareholders' Equity
Common Shares 10,000
Retained Earnings 28,550
Total Shareholders’ Equity 38,550
Liabilities & Shareholders’ Equity $70,150
Chapter 16 Corporations: The Financial Statements
134
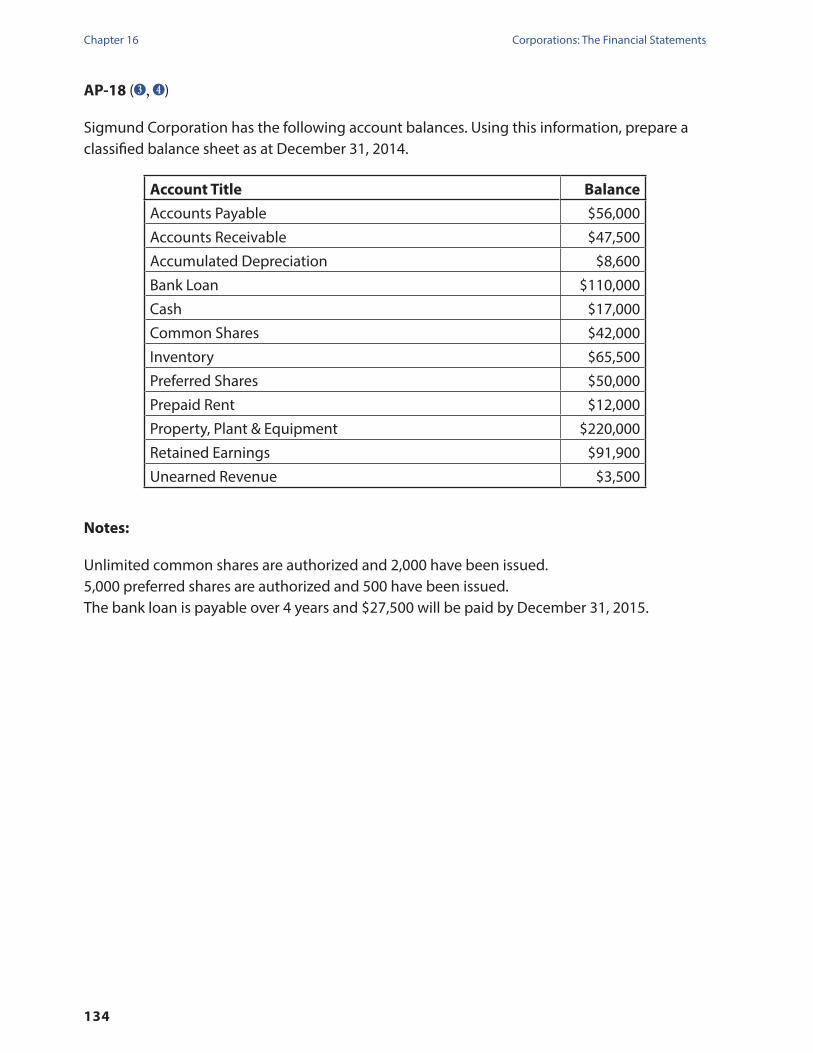
AP-18 ( 3 , 4 )
Sigmund Corporation has the following account balances. Using this information, prepare a classified balance sheet as at December 31, 2014.
Account Title BalanceAccounts Payable $56,000Accounts Receivable $47,500Accumulated Depreciation $8,600Bank Loan $110,000Cash $17,000Common Shares $42,000Inventory $65,500Preferred Shares $50,000Prepaid Rent $12,000Property, Plant & Equipment $220,000Retained Earnings $91,900Unearned Revenue $3,500
Notes:
Unlimited common shares are authorized and 2,000 have been issued.5,000 preferred shares are authorized and 500 have been issued.The bank loan is payable over 4 years and $27,500 will be paid by December 31, 2015.

Chapter 16Corporations: The Financial Statements
135
Sigmund CorporationBalance Sheet
As at December 31, 2014
Assets
Current Assets
Cash $17,000
Accounts Receivable 47,500
Prepaid Rent 12,000
Inventory 65,500
Total Current Assets $142,000
Non-Current Assets
Property, Plant & Equipment 220,000
Accumulated Depreciation (8,600)
Total Non-Current Assets 211,400
Total Assets $353,400
Liabilities
Current Liabilities
Accounts Payable $56,000
Unearned Revenue 3,500
Bank Loan - Current Portion 27,500
Total Current Liabilities $87,000
Non-Current Liabilities
Bank Loan - Non-Current Portion 82,500
Total Non-Current Liabilities 82,500
Total Liabilities 169,500
Shareholders' Equity
Common Shares 42,000
Preferred Shares 50,000
Retained Earnings 91,900
Total Shareholders' Equity 183,900
Liabilities & Shareholders’ Equity $353,400

Chapter 16 Corporations: The Financial Statements
136
AP-19 ( 3 , 4 )
Spader Inc. had the following account balances at the end of the year. Prepare a multistep income statement for December 31, 2014.
Account Title Balance
Cost of Goods Sold 234,000
Depreciation Expense 6,200
Loss on Sale of Assets from Discontinued Operations 5,700
Insurance Expense 2,700
Interest Expense 600
Income Tax Expense (Continuing Operations) 27,780
Income Tax Expense (Discontinued Operations) 2,220
Maintenance Expense 3,800
Operating Income from Discontinued Operations 16,800
Rent Expense 32,000
Salaries Expense 87,500
Sales Returns and Allowances 3,900
Sales Revenue 520,000
Telephone Expense 4,100
Travel Expense 6,300

Chapter 16Corporations: The Financial Statements
137
Spader Inc. Income Statement
For the Year Ended December 31, 2014
Sales Revenue $520,000
Less Sales Returns and Allowances (3,900)
Net Sales 516,100
Less Cost of Goods Sold (234,000)
Gross Profit 282,100
Operating Expenses
Insurance Expense $2,700
Maintenance Expense 3,800
Rent Expense 32,000
Salaries Expense 87,500
Telephone Expense 4,100
Travel Expense 6,300
Depreciation Expense 6,200
Total Operating Expenses (142,600)
Income from Operations 139,500
Other Revenue and Expenses
Interest Expense (600)
Income before Tax 138,900
Income Tax Expense 27,780
Income from Continuing Operations 111,120
Discontinued Operations
Operating Income from Discontinued Operations 16,800
Loss on Sale of Assets from Discontinued Operations (5,700)
Income Tax Expense (2,220) 8,880
Net Income 120,000
Chapter 16 Corporations: The Financial Statements
138
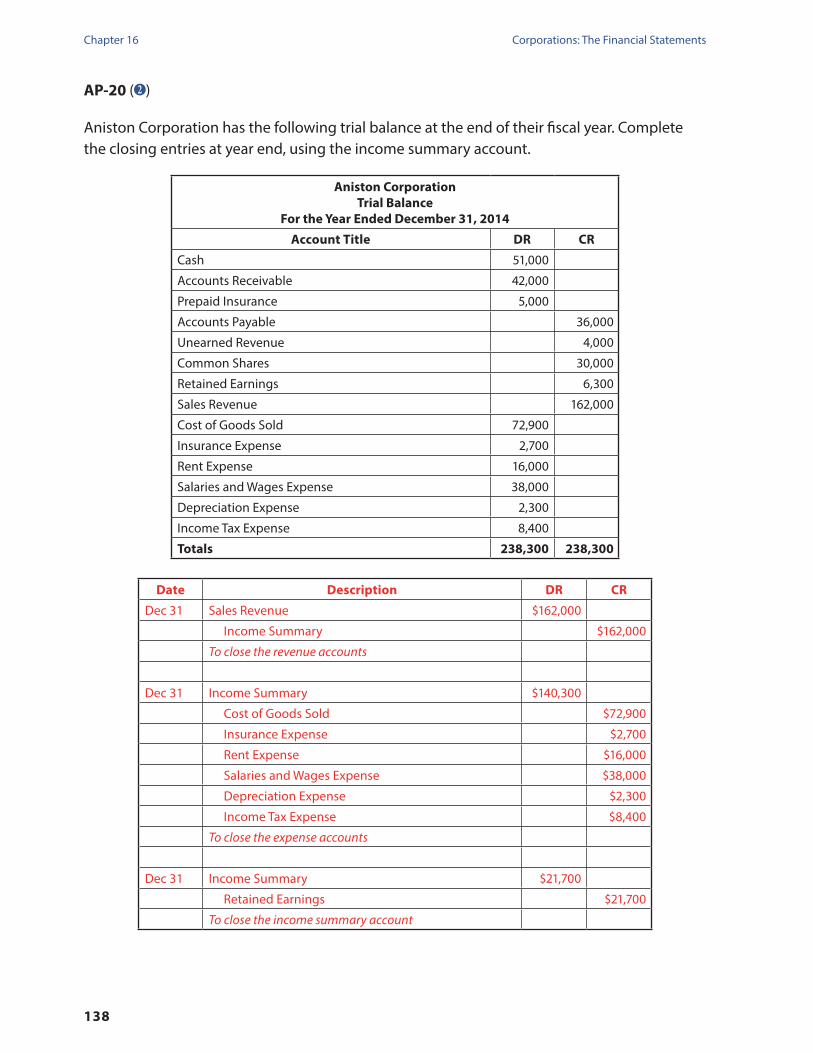
AP-20 ( 2 )
Aniston Corporation has the following trial balance at the end of their fiscal year. Complete the closing entries at year end, using the income summary account.
Aniston CorporationTrial Balance
For the Year Ended December 31, 2014
Account Title DR CR
Cash 51,000
Accounts Receivable 42,000
Prepaid Insurance 5,000
Accounts Payable 36,000
Unearned Revenue 4,000
Common Shares 30,000
Retained Earnings 6,300
Sales Revenue 162,000
Cost of Goods Sold 72,900
Insurance Expense 2,700
Rent Expense 16,000
Salaries and Wages Expense 38,000
Depreciation Expense 2,300
Income Tax Expense 8,400
Totals 238,300 238,300
Date Description DR CR
Dec 31 Sales Revenue $162,000
Income Summary $162,000
To close the revenue accounts
Dec 31 Income Summary $140,300
Cost of Goods Sold $72,900
Insurance Expense $2,700
Rent Expense $16,000
Salaries and Wages Expense $38,000
Depreciation Expense $2,300
Income Tax Expense $8,400
To close the expense accounts
Dec 31 Income Summary $21,700
Retained Earnings $21,700
To close the income summary account

Chapter 16Corporations: The Financial Statements
139
Exercise Questions
EX-1 ( 3 )
Black Light Environment Everyday (otherwise known as BLEE Inc.) has sales of $370,000 and expenses of $120,000 (before calculation of income tax expense). Prepare a basic income statement on June 30, 2010 for BLEE, taking into account income tax expense. Assume a tax rate of 31%.
BLEE Inc.Income Statement
For the Year Ended June 30, 2010
Sales $370,000
Expenses 120,000
Income Tax Expense 77,500 197,500
Income from Operations $172,500
EX-2 ( 3 , 4 )
The following information was taken from the accounting records of Montana Inc. at May 31, 2011. Montana Inc. is a private corporation and follows GAAP.
Assume a tax rate of 37%. During the year, no new shares were issued or redeemed.
Line Item Amount
Total dividends paid $61,000
Retained earnings, June 1, 2010 (prior to adjustment) $110,000
Net Income $156,000
Prepare a statement of retained earnings for Montana Inc. for the year ended May 31, 2011.
Montana Inc.Statement of Retained EarningsFor the Year Ended May 31, 2011
Retained Earnings, June 1, 2010 $110,000
Net Income $156,000
Dividends ‐$61,000
Retained Earnings, May 31, 2011 $205,000

Chapter 16 Corporations: The Financial Statements
140
EX-3 ( 2 )
On February 1st, Adam Enterprises declares a dividend of $4,800 to common shareholders to be paid on February 4th. Record the journal entry associated with this transaction.
Date Account Title and Explanation Debit Credit
Feb 1 Retained Earnings 4,800
Dividends Payable 4,800
Record dividend payable of $4,800
EX-4 ( 2 )
Information taken from OE Merchandising’s trial balance is shown below:
OE MerchandisingTrial Balance (Extract) September 30, 2010
Debit Credit
Sales Revenue 247,000
Cost of Goods Sold 148,200
Income Tax Expense 20,000
Rent Expense 11,000
Salaries Expense 52,000
Prepare the closing entries for OE Merchandising assuming the company uses the income summary account.
Date Account Title and Explanation Debit CreditSep 30 Sales Revenue 247,000
Income Summary 247,000To close the revenue account
Sep 30 Income Summary 231,200Cost of Goods Sold 148,200Income Tax Expense 20,000Rent Expense 11,000Salaries Expense 52,000
To close expense accounts
Sep 30 Income Summary 15,800Retained Earnings 15,800
To close income summary

Chapter 16Corporations: The Financial Statements
141
EX-5 ( 3 , 4 )
Below is the adjusted trial balance for Simple Town Corp. The balance of retained earnings represents the balance at the beginning of the fiscal year. The company decided not to pay dividends this year.
Simple Town Corp.Adjusted Trial Balance
June 30, 2014
Debit Credit
Cash $78,000
Accounts Receivable 93,000
Prepaid Rent 7,800
Inventory 195,000
Notes Receivable 35,000
Property, Plant & Equipment 120,000
Accumulated Depreciation $42,000
Accounts Payable 24,000
Unearned Revenue 22,500
Interest Payable 6,800
Salary Payable 18,000
Loan Payable 80,000
Preferred Shares 25,800
Common Shares 105,000
Retained Earnings (beginning balance) 171,290
Sales Revenue 300,000
Interest Revenue 2,800
Sales Returns and Allowances 12,000
Cost of Goods Sold 60,000
Depreciation Expense 12,600
Salary Expense 69,000
Rent Expense 16,500
Utilities Expense 19,500
Insurance Expense 23,400
Supplies Expense 36,000
Income Tax Expense 17,990
Loss on Disposal of Equipment 2,400
Total $798,190 $798,190

Chapter 16 Corporations: The Financial Statements
142
a) Prepare an income statement for the year ended June 30, 2014.
Simple Town Corp.Income Statement
For the year ended June 30, 2014
Sales Revenue $300,000
Less: Sales Returns and Allowances $12,000
Net Sales 288,000
Cost of Goods Sold 60,000
Gross Profit 228,000
Operating Expenses
Depreciation Expense 12,600
Salary Expense 69,000
Rent Expense 16,500
Utilities Expense 19,500
Insurance Expense 23,400
Supplies Expense 36,000 177,000
Income from Operations 51,000
Other Revenue and Expenses
Interest Revenue 2,800
Loss on Disposal of Equipment (2,400) 400
Income Before Tax 51,400
Income Tax Expense 17,990
Net Income $33,410
b) Prepare the statement of retained earnings for Simple Town Corp.
Simple Town Corp.Statement of Retained Earnings
For the year ended June 30, 2014
Retained Earnings, July 1, 2013 $171,290
Add: Net income 33,410
Less: Dividends 0
Retained Earnings, June 30, 2014 $204,700

Chapter 16Corporations: The Financial Statements
143
EX-6 ( 3 , 4 )
Below is the adjusted trial balance for Del Ray Inc. Dividends paid during the year was $7,800.
Del Ray Inc.Adjusted Trial Balance
March 31, 2014
Debit Credit
Cash $33,800
Accounts Receivable 40,300
Prepaid Insurance 5,070
Supplies 84,500
Property, Plant & Equipment 65,000
Accumulated Depreciation $22,750
Accounts Payable 10,400
Unearned Revenue 9,750
Interest Payable 2,250
Loan Payable 25,000
Preferred Shares 14,500
Common Shares 21,700
Retained Earnings (after dividends) 116,110
Sales Revenue 130,000
Gain on Disposal of Equipment 5,200
Sales Discounts 650
Sales Returns and Allowances 1,950
Cost of Goods Sold 26,000
Depreciation Expense 7,150
Salary Expense 29,900
Rent Expense 7,150
Utilities Expense 8,450
Insurance Expense 10,400
Supplies Expense 15,600
Interest Expense 1,250
Income Tax Expense (Continuing Operations) 8,010
Income Tax Expense (Discontinued Operations) 2,880
Income from Discontinued Operations 8,100
Gain on Sale of Assets from Discontinued Operations 1,500
Total $357,660 $357,660

Chapter 16 Corporations: The Financial Statements
144
a) Prepare a multi-step income statement for the year ended March 31, 2014.
Del Ray Inc.Income Statement
For the year ended March 31, 2014
Sales Revenue $130,000
Sales Discounts $650
Sales Returns and Allowances 1,950 2,600
Net Sales 127,400
Cost of Goods Sold 26,000
Gross Profit 101,400
Operating Expenses
Depreciation Expense 7,150
Salary Expense 29,900
Rent Expense 7,150
Utilities Expense 8,450
Insurance Expense 10,400
Supplies Expense 15,600 78,650
Income from Operations 22,750
Other Revenue and Expenses
Gain on Disposal of Equipment 5,200
Interest Expense 1,250 3,950
Income Before Tax 26,700
Income Tax Expense 8,010
Income from Continuing Operations 18,690
Discontinued Operations
Income from Discontinued Operations 8,100
Gain on Sale of Assets from Discontinued Operations 1,500
Income Tax Expense (2,880) 6,720
Net Income $25,410
b) Prepare the statement of retained earnings for Simple Town Corp.
Del Ray Inc.Statement of Retained Earnings
For the year ended March 31, 2014
Retained Earnings, April 1, 2013 $123,910
Add: Net income 25,410
Less: Dividends (7,800)
Retained Earnings, March 31, 2014 $141,520

Chapter 16Corporations: The Financial Statements
145
EX-7 ( 4 )
Below is the adjusted trial balance for Connection Communications Inc. for the month of September 2014. Dividends of $5,800 were declared and paid in the month.
Connection Communications Inc.Adjusted Trial Balance
September 30, 2014
Debit Credit
Accounts Payable $5,176
Accounts Receivable $20,057
Accumulated Depreciation 11,325
Cash 16,822
Common Shares 11,600
Cost of Goods Sold 12,940
Depreciation Expense 3,395
Insurance Expense 1,545
Interest Expense 1,225
Interest Payable 2,083
Loan Payable 24,500
Preferred Shares 4,500
Prepaid Insurance 1,850
Property, Plant & Equipment 32,350
Rent Expense 3,550
Retained Earnings (after dividends) 23,300
Salary Expense 8,160
Salary Payable 3,882
Sales Revenue 64,700
Supplies 42,055
Supplies Expense 7,764
Unearned Revenue 4,852
Utilities Expense 4,205
Total $155,918 $155,918
Prepare a statement of retained earnings for the month ended September 30, 2014.
Connection Communications Inc.Statement of Retained Earnings
For the month ended September 30, 2014
Retained Earnings, September 1, 2014 $29,100
Add: Net income 21,916
Less: Dividends (5,800)
Retained Earnings, September 30, 2014 $45,216

Chapter 16 Corporations: The Financial Statements
146
EX-8 ( 4 )
Top Cuisine Inc. has a March 31 year end. Retained earnings at March 31, 2012 had a credit balance of $54,700. During the 2013 fiscal year net income was $24,615 and dividends of $12,600 were declared and paid. During the 2014 fiscal year Top Cuisine had a net loss of $16,680 and dividends of $10,400 were declared but not yet paid.
Calculate Top Cuisine’s retained earnings as at March 31, 2014 by completing the following statements:
Top Cuisine Inc.Statement of Retained Earnings
For the year ended March 31, 2013
Retained Earnings, March 31, 2012 $54,700
Add: Net Income 24,615
Less: Dividends (12,600)
Retained Earnings, March 31, 2013 $66,715
Top Cuisine Inc.Statement of Retained Earnings
For the year ended March 31, 2014
Retained Earnings, March 31, 2013 $66,715
Less: Net Loss (16,680)
Less: Dividends (10,400)
Retained Earnings, March 31, 2014 $39,635
EX-9 ( 4 , 5 )
Kensington Inc. has a December 31 year end. Retained earnings as at December 31, 2012 had a debit balance of $15,450. During the 2013 fiscal year net income was $91,550 and dividends of $34,500 were declared and paid.
Complete Kensington Corp.’s statement of retained earnings for 2013.
Kensington Inc.Statement of Retained Earnings
For the year ended December 31, 2013
Retained Earnings, December 31, 2012 ($15,450)
Add: Net income 91,550
Less: Dividends (34,500)
Retained Earnings, December 31, 2013 $41,600
During the 2014 fiscal year Kensington had a net income of $32,100 and dividends of $28,000 were declared and paid. An audit revealed that the 2013 net income was understated by a net value of $5,200. A new engine was recorded as an expense when it should have been recorded as an asset.
Chapter 16Corporations: The Financial Statements
147
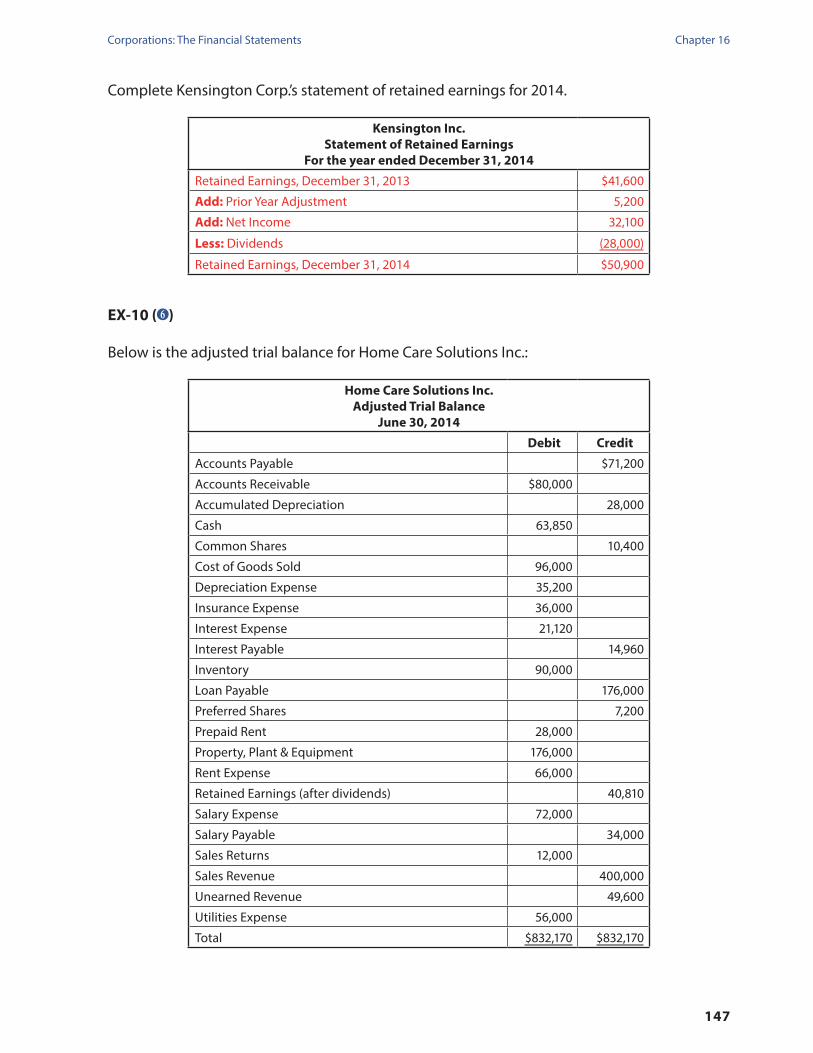
Complete Kensington Corp.’s statement of retained earnings for 2014.
Kensington Inc.Statement of Retained Earnings
For the year ended December 31, 2014
Retained Earnings, December 31, 2013 $41,600
Add: Prior Year Adjustment 5,200
Add: Net Income 32,100
Less: Dividends (28,000)
Retained Earnings, December 31, 2014 $50,900
EX-10 ( 6 )
Below is the adjusted trial balance for Home Care Solutions Inc.:
Home Care Solutions Inc.Adjusted Trial Balance
June 30, 2014
Debit Credit
Accounts Payable $71,200
Accounts Receivable $80,000
Accumulated Depreciation 28,000
Cash 63,850
Common Shares 10,400
Cost of Goods Sold 96,000
Depreciation Expense 35,200
Insurance Expense 36,000
Interest Expense 21,120
Interest Payable 14,960
Inventory 90,000
Loan Payable 176,000
Preferred Shares 7,200
Prepaid Rent 28,000
Property, Plant & Equipment 176,000
Rent Expense 66,000
Retained Earnings (after dividends) 40,810
Salary Expense 72,000
Salary Payable 34,000
Sales Returns 12,000
Sales Revenue 400,000
Unearned Revenue 49,600
Utilities Expense 56,000
Total $832,170 $832,170

Chapter 16 Corporations: The Financial Statements
148
Additional information:• Netincomefortheyearwas$5,680andtheretainedearningsatJuly1,2013was
$44,960. Dividends of $4,150 were declared and paid in the year. • HomeCareSolutionshasaloanpayableduein8years.Theprincipalpaymentsare
$2,800 per month. • 1,440$2,cumulativepreferredshareshavebeenissuedand15,000havebeen
authorized. 3,000 common shares have been issued and 45,000 have been authorized.
Prepare a classified balance sheet as at June 30, 2014.
Home Care Solutions Inc.Balance Sheet
As at June 30, 2014Assets Current Assets
Cash $63,850 Accounts Receivable 80,000 Prepaid Rent 28,000 Inventory 90,000
Total Current Assets $261,850 Non-Current Assets
Property, Plant & Equipment 176,000 Less: Accumulated Depreciation (28,000) 148,000
Total Assets $409,850 Liabilities Current Liabilities
Accounts Payable $71,200 Unearned Revenue 49,600 Interest Payable 14,960 Salary Payable 34,000 Current portion of Bank Loan 33,600
Total Current Liabilities $203,360 Non-Current Liabilities
Long-term portion of Bank Loan 142,400 Total Liabilities 345,760 Shareholders’ Equity Contributed Capital
Preferred shares, $2, cumulative, 15,000 shares authorized, 1,440 shares issued and outstanding 7,200
Common shares, 45,000 shares authorized, 3,000 shares issued and outstanding 10,400
Total Contributed Capital 17,600 Retained Earnings 46,490 Total Shareholders’ Equity 64,090 Total Liabilities and Shareholders’ Equity $409,850

Chapter 16Corporations: The Financial Statements
149
EX-11 ( 6 )
Below is the adjusted trial balance for Busy Town Inc.:
Busy Town Inc.Adjusted Trial Balance
December 31, 2014
Debit Credit
Accounts Payable $69,420
Accounts Receivable $78,000
Accumulated Depreciation 27,300
Cash 66,300
Common Shares 147,500
Cost of Goods Sold 93,600
Depreciation Expense 34,320
Insurance Expense 35,100
Interest Payable 936
Interest Receivable 1,560
Interest Revenue 10,400
Inventory 87,750
Long term Debt 46,800
Loss on Sale of Equipment 1,800
Notes Receivable 130,000
Preferred Shares 148,530
Prepaid Insurance 27,300
Property, Plant & Equipment 171,600
Rent Expense 64,350
Retained Earnings 5,784
Salary Expense 70,200
Salary Payable 33,150
Sales Returns 11,700
Sales Revenue 390,000
Unearned Revenue 48,360
Utilities Expense 54,600
Total $928,180 $928,180
Additional information:• Net income for the year was $34,730 and retained earnings at January 1, 2014 was
$70,484. Dividends of $64,700 were declared and paid in the year.• BusyTownhasanotereceivablethatmaturesinDecember2017,withno
installment payments received until maturity. Busy Town also has long term debt that is due in 4 years. The principal payments are $975 per month.
• Preferredsharesare$1,non-cumulative,95,000shareshavebeenauthorizedand24,700 shares are issued and outstanding. For common shares, 200,000 shares have been authorized and 29,800 shares have been issued.

Chapter 16 Corporations: The Financial Statements
150
Prepare a classified balance sheet as at December 31, 2014.
Busy Town Inc.Balance Sheet
As at December 31, 2014
Assets
Current Assets
Cash $66,300
Accounts Receivable 78,000
Interest Receivable 1,560
Prepaid Insurance 27,300
Inventory 87,750
Total Current Assets $260,910
Non-Current Assets
Notes Receivable 130,000
Property, Plant & Equipment 171,600
Less: Accumulated Depreciation (27,300)
Total Non-Current Assets 274,300
Total Assets $535,210
Liabilities
Current Liabilities
Accounts Payable $69,420
Unearned Revenue 48,360
Interest Payable 936
Salary Payable 33,150
Current Portion of Long Term Debt 11,700
Total Current Liabilities $163,566
Non-Current Liabilities
Long Term Debt 35,100
Total Liabilities 198,666
Shareholders’ Equity
Contributed Capital
Preferred shares, $1, non-cumulative, 95,000 shares
authorized, 24,700 shares issued and outstanding 148,530
Common shares, 200,000 shares authorized, 29,800
shares issued and outstanding 147,500
Total Contributed Capital 296,030
Retained Earnings 40,514
Total Shareholders’ Equity 336,544
Total Liabilities and Shareholders’ Equity $535,210

Chapter 16Corporations: The Financial Statements
151
EX-12 ( 3 , 4 , 6 )
Below is the adjusted trial balance for Excel Network Inc. as at December 31, 2014:
Excel Network Inc.Adjusted Trial Balance
December 31, 2014
Debit Credit
Cash $84,000
Accounts Receivable 189,000
Prepaid Rent 9,240
Inventory 210,000
Property, Plant & Equipment 43,000
Accumulated Depreciation $15,050
Accounts Payable 38,000
Unearned Revenue 35,625
Interest Payable 8,925
Salary Payable 28,500
Loan Payable 105,000
Preferred Shares 75,000
Common Shares 105,000
Retained Earnings (after dividends) 111,805
Sales Revenue 475,000
Sales Returns 19,000
Cost of Goods Sold 166,250
Depreciation Expense 4,515
Salary Expense 109,250
Rent Expense 26,125
Interest Expense 12,600
Utilities Expense 30,875
Insurance Expense 37,050
Supplies Expense 57,000
Total $997,905 $997,905

Chapter 16 Corporations: The Financial Statements
152
a) Prepare a multi-step income statement for the year ended December 31, 2014. Ignore income taxes.
Excel Network Inc.Income Statement
For the year ended December 31, 2014
Sales Revenue $475,000
Less: Sales Returns (19,000)
Net Sales 456,000
Cost of Goods Sold 166,250
Gross Profit 289,750
Operating Expenses
Depreciation Expense $4,515
Salary Expense 109,250
Rent Expense 26,125
Utilities Expense 30,875
Insurance Expense 37,050
Supplies Expense 57,000 264,815
Income from Operations 24,935
Other Revenue and Expenses
Interest Expense 12,600
Total Other Revenue and Expenses 12,600
Net Income $12,335
b) The retained earnings at January 1, 2014 were $160,305 and dividends of $48,500 were declared in the year. Prepare a statement of retained earnings for the year ended December 31, 2014.
Excel Network Inc.Statement of Retained Earnings
For the year ended December 31, 2014
Retained Earnings, January 1, 2014 $160,305
Add: Net income 12,335
Less: Dividends (48,500)
Retained Earnings, December 31, 2014 $124,140
c) Prepare a classified balance sheet as at December 31, 2014. Additional information as of December 31, 2014 is as follows:
• The loan payable is due over 5 years. The principal payments are $1,000 for each month.
• Preferredshares:$8,cumulative,100,000sharesauthorizedand25,000havebeenissued and are outstanding.
• Commonshares:unlimitednumberofsharesauthorized,46,000shareshavebeenissue and are outstanding.
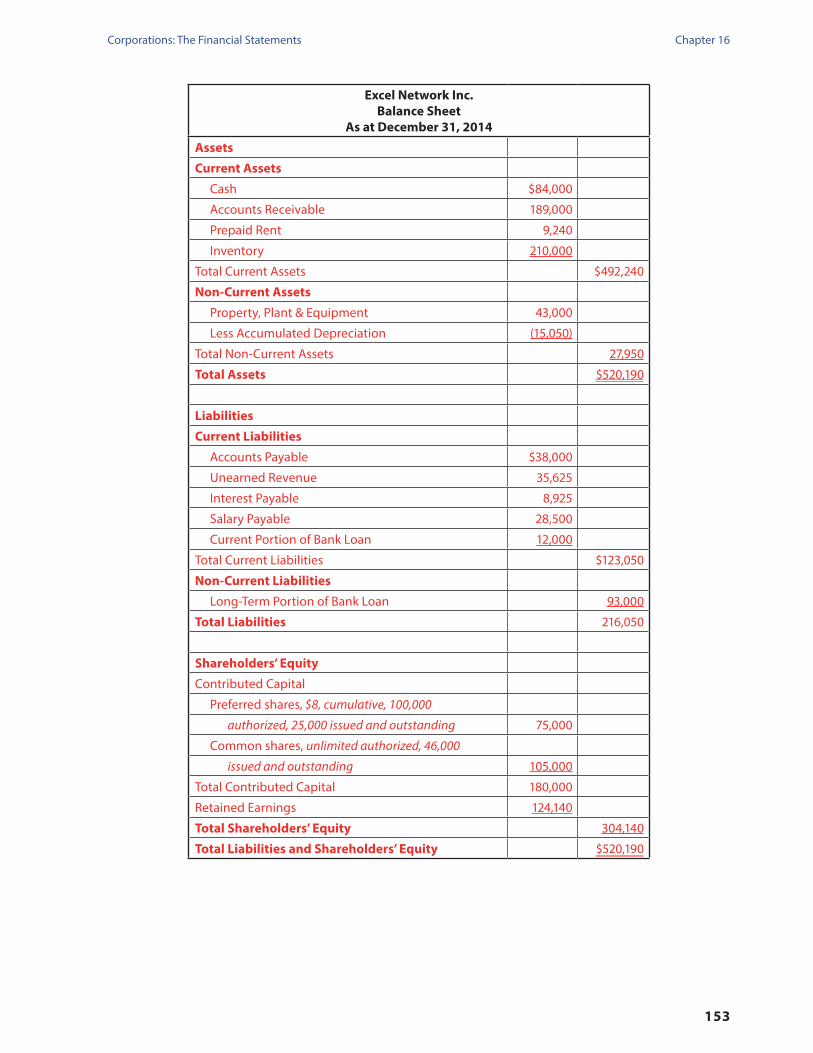
Chapter 16Corporations: The Financial Statements
153
Excel Network Inc.Balance Sheet
As at December 31, 2014
Assets
Current Assets
Cash $84,000
Accounts Receivable 189,000
Prepaid Rent 9,240
Inventory 210,000
Total Current Assets $492,240
Non-Current Assets
Property, Plant & Equipment 43,000
Less Accumulated Depreciation (15,050)
Total Non-Current Assets 27,950
Total Assets $520,190
Liabilities
Current Liabilities
Accounts Payable $38,000
Unearned Revenue 35,625
Interest Payable 8,925
Salary Payable 28,500
Current Portion of Bank Loan 12,000
Total Current Liabilities $123,050
Non-Current Liabilities
Long-Term Portion of Bank Loan 93,000
Total Liabilities 216,050
Shareholders’ Equity
Contributed Capital
Preferred shares, $8, cumulative, 100,000
authorized, 25,000 issued and outstanding 75,000
Common shares, unlimited authorized, 46,000
issued and outstanding 105,000
Total Contributed Capital 180,000
Retained Earnings 124,140
Total Shareholders’ Equity 304,140
Total Liabilities and Shareholders’ Equity $520,190

Chapter 16 Corporations: The Financial Statements
154
EX-13 ( 3 , 4 , 6 )
Below is the adjusted trial balance for SandStone Corp. as at September 30, 2014:
SandStone Corp.Adjusted Trial Balance
September 30, 2014
Debit Credit
Accounts Payable $20,470
Accounts Receivable $23,000
Accumulated Depreciation 8,050
Cash 19,550
Common Shares 8,750
Cost of Goods Sold 40,250
Depreciation Expense 10,120
Gain on Disposal of Equipment 2,530
Gain on Sale of Assets from Discontinued Operations 13,400
Income Tax Benefit (Continuing Operations) 10,788
Income Tax Benefit (Discontinued Operations) 6,240
Insurance Expense 10,350
Interest Expense 5,520
Interest Payable 3,910
Inventory 25,875
Loan Payable 46,000
Loss from Discontinued Operations 29,000
Preferred Shares 5,890
Prepaid Insurance 8,050
Property, Plant & Equipment 50,600
Rent Expense 19,550
Retained Earnings 35,512
Sales Discounts 11,060
Salary Expense 20,700
Salary Payable 9,775
Sales Returns and Allowances 3,450
Sales Revenue 115,000
Supplies Expense 7,400
Unearned Revenue 14,260
Utilities Expense 16,100
Total $300,575 $300,575

Chapter 16Corporations: The Financial Statements
155
a) Prepare a multi-step income statement for the year ended September 30, 2014.
SandStone Corp.Income Statement
For the year ended September 30, 2014
Sales Revenue $115,000
Sales Discounts $11,060
Sales Returns and Allowances 3,450 14,510
Net Sales 100,490
Cost of Goods Sold 40,250
Gross Profit 60,240
Operating Expenses
Depreciation Expense 10,120
Salary Expense 20,700
Rent Expense 19,550
Supplies Expense 7,400
Utilities Expense 16,100
Insurance Expense 10,350 84,220
Income (Loss) from Operations (23,980)
Other Revenue and Expenses
Gain on disposal of equipment 2,530
Interest Expense (5,520) (2,990)
Income (Loss) Before Tax (26,970)
Income Tax Benefit 10,788
Income from Continuing Operations (16,182)
Discontinued Operations
Gain on Sale of Assets from Discontinued Operations 13,400
Loss from Discontinued Operations (29,000)
Income Tax Benefit 6,240 (9,360)
Net Income (Loss) ($25,542)
b) The balance of retained earnings in the adjusted trial balance represents the beginning balance at October 1, 2013. No dividends were declared during the year. Prepare a statement of retained earnings for the year ended September 30, 2014.
SandStone Corp.Statement of Retained Earnings
September 30, 2014
Retained Earnings, October 1, 2013 $35,512
Less: Net Loss (25,542)
Less: Dividends 0
Retained Earnings, September 30, 2014 $9,970

Chapter 16 Corporations: The Financial Statements
156
c) Prepare a classified balance sheet as at September 30, 2013. Additional information is as follows:
• Theloanpayableisdueover4years.Theprincipalpaymentsare$1,050eachmonth• Preferredshares:$1,cumulative,55,000authorized,7,800issuedandoutstanding• Commonshares:100,000authorized,15,900issuedandoutstanding
SandStone Corp.Balance Sheet
As at September 30, 2014
Assets
Current Assets
Cash $19,550
Accounts Receivable 23,000
Prepaid Insurance 8,050
Inventory 25,875
Total Current Assets $76,475
Non-Current Assets
Property, Plant & Equipment 50,600
Less Accumulated Depreciation (8,050)
Total Non-Current Assets 42,550
Total Assets $119,025
Liabilities
Current Liabilities
Accounts Payable $20,470
Unearned Revenue 14,260
Interest Payable 3,910
Salary Payable 9,775
Current portion of Bank Loan 12,600
Total Current Liabilities $61,015
Non-Current Liabilities
Long-term portion of Bank Loan 33,400
Total Liabilities 94,415
Shareholders’ Equity
Contributed Capital
Preferred shares, $1, cumulative, 55,000 shares
authorized, 7,800 shares issued and outstanding 5,890
Common shares, 100,000 shares authorized, 15,900
shares issued and outstanding 8,750
Total Contributed Capital 14,640
Retained Earnings 9,970
Total Shareholders’ Equity 24,610
Total Liabilities and Shareholders’ Equity $119,025

Chapter 16Corporations: The Financial Statements
157
EX-14 ( 3 , 4 , 6 )
Below is the adjusted trial balance for Elements Inc. as at March 31, 2014:
Elements Inc.Adjusted Trial Balance
March 31, 2014
Debit Credit
Accounts Payable $19,580
Accounts Receivable $22,000
Accumulated Depreciation 7,700
Cash 18,700
Common Shares 21,500
Cost of Goods Sold 37,400
Depreciation Expense 9,900
Insurance Expense 9,900
Interest Payable 660
Interest Receivable 1,320
Interest Revenue 2,640
Inventory 24,750
Long Term Debt 13,200
Loss on Disposal of Machinery 1,485
Notes Receivable 33,000
Preferred Shares 19,850
Prepaid Insurance 7,700
Property, Plant & Equipment 49,500
Rent Expense 18,150
Retained Earnings (after dividends) 54,185
Salary Expense 19,800
Salary Payable 9,350
Sales Returns and Allowances 3,300
Sales Revenue 110,000
Unearned Revenue 13,640
Utilities Expense 15,400
Total $272,305 $272,305

Chapter 16 Corporations: The Financial Statements
158
a) Prepare a multi-step income statement for the year ended March 31, 2014. Ignore taxes for this question.
Elements Inc.Income Statement
For the Year Ended March 31, 2014
Sales Revenue $110,000
Less: Sales Returns and Allowances 3,300
Net Sales 106,700
Cost of Goods Sold 37,400
Gross Profit 69,300
Operating Expenses
Depreciation Expense 9,900
Salary Expense 19,800
Rent Expense 18,150
Utilities Expense 15,400
Insurance Expense 9,900
Total Operating Expenses 73,150
Income (Loss) from Operations (3,850)
Other Revenue and Expenses
Interest Revenue 2,640
Loss on Disposal of Equipment 1,485
Total Other Revenue and Expenses 1,155
Net Loss ($2,695)
b) Retained earnings at April 1, 2013 had a credit balance of $68,335 and dividends of $14,150 were declared and paid in the year. Prepare a statement of retained earnings for the year ended March 31, 2014.
Elements Corp.Statement of Retained Earnings
For the Year Ended March 31, 2014
Retained Earnings, April 1, 2013 $68,335
Less: Net Loss (2,695)
Less: Dividends (14,150)
Retained Earnings, March 31, 2014 $51,490
c) Prepare a classified balance sheet as at March 31, 2014. Additional information as of March 31, 2014 is as follows:
• Thelongtermdebtisdueover4years.Theprincipalpaymentsare$275eachmonth.
• Preferredshares:$0.50,non-cumulative,15,000sharesauthorized,13,233sharesissued and outstanding.
• Commonshares:21,000sharesauthorized,19,550sharesissuedandoutstanding.• The note receivable will not be paid until December 2015.

Chapter 16Corporations: The Financial Statements
159
Elements Inc.Balance Sheet
As at March 31, 2014
Assets
Current Assets
Cash $18,700
Accounts Receivable 22,000
Interest Receivable 1,320
Prepaid Insurance 7,700
Inventory 24,750
Total Current Assets $74,470
Non-Current Assets
Notes Receivable 33,000
Property, Plant & Equipment 49,500
Less: Accumulated Depreciation (7,700)
Total Non-Current Assets 74,800
Total Assets $149,270
Liabilities
Current Liabilities
Accounts Payable $19,580
Unearned Revenue 13,640
Interest Payable 660
Salary Payable 9,350
Current Portion of Long Term Debt 3,300
Total Current Liabilities $46,530
Non-Current Liabilities
Long Term Debt 9,900
Total Liabilities 56,430
Shareholders’ Equity
Contributed Capital
Preferred shares, $0.50, non-cumulative, 15,000
authorized, 13,233 issued and outstanding 19,850
Common shares, 20,000 authorized, 19,550
issued and outstanding 21,500
Total Contributed Capital 41,350
Retained Earnings 51,490
Total Shareholders’ Equity 92,840
Total Liabilities and Shareholders’ Equity $149,270

Chapter 16 Corporations: The Financial Statements
160
Case Study
CS-1 ( 7 )
Obtain the current financial statements of a large capitalization company (i.e. > $5 Billion), and answer the following questions.
The details for Kroger’s January 31, 2009 financial statements have been included as an example.
a) Name of company Kroger Co.
b) Capitalization of the company $14.85B
c) Industry in which the company is engaged Food Market
d) Contributed capital amount $955m
e) Retained earnings amount $7,489m
f ) Total Liabilities $17,940m
g) Total shareholders' equity $5,176m
h) Debt-to-Equity Ratio 17,940 ÷ 5,176 = 3.47
i) Earnings per share (basic) $1.92
j) Dividend per share $0.36
k) Dividend payout ratio 0.19
l) Book value per share (show calculation) 5176 ÷ [(955 + 947) ÷ 2] = $5.44
m) Current market price per share (note the date) $22.82 (Nov 19, 2009)

Chapter 16Corporations: The Financial Statements
161
Critical Thinking
CT-1 ( 7 )
In this chapter, you have learned how to calculate earnings per share. Often, a corporation’s annual report will report earnings per share as calculated by the corporation. Rarely do the corporation’s reported earnings per share agree with a financial analyst’s calculation of this number. Discuss why these two calculations may differ.
______________________________________________________________________________
______________________________________________________________________________
______________________________________________________________________________
______________________________________________________________________________
______________________________________________________________________________
______________________________________________________________________________
______________________________________________________________________________
______________________________________________________________________________
______________________________________________________________________________
______________________________________________________________________________
______________________________________________________________________________
______________________________________________________________________________
Since these calculations per share involve only two numbers, the earnings and average
number of shares, the difference in the values must result from a difference in either of the
two numbers involved in the calculations. Since earnings are fixed, the differences arise from
the calculation of average number of shares. The average number of shares can be calculated
in several ways – daily, weekly, month-end or year-end. The calculation described in this
chapter uses year-end figures to calculate EPS. The corporation may use one of the other
methods in order to increase the accuracy of the calculations. This is easy for the corporation
because it has access to detailed share holding records. Financial analysts, however, only have
access to the year-end numbers.

Chapter 16 Corporations: The Financial Statements
162
CT-2 ( 3 , 4 )
The following information was taken from the accounting records of Splinter Inc. at December 31, 2014. Splinter Inc. is a public corporation and follows IFRS.
Line Item Amount
Common shares, 50,000 outstanding on January 1, 2014 $350,000
Common shares, 70,000 outstanding on December 31, 2014 120,000
Cost of Goods Sold 468,000
Dividends paid 50,000
Gain on Sale of Assets 6,200
General operating expenses 210,000
Income tax expense on continuing operations 29,850
Income tax expense on operating income from discontinued operations 18,600
Interest Expense 8,700
Operating income from discontinued operations 62,000
Prior year error – debit to Retained Earnings 6,000
Retained Earnings, January 1, 2014 (prior to adjustment) 410,000
Sales revenue 780,000
Required:
a) Prepare the statement of comprehensive income for the year ended December 31, 2014.
b) Prepare the statement of changes in equity for the year ended December 31, 2014 showing the changes in contributed capital and retained earnings.

Chapter 16Corporations: The Financial Statements
163
a) Statement of Comprehensive Income
Splinter Inc.Statement of Comprehensive Income
For the Year Ended December 31, 2014
Sales Revenue $780,000
Cost of Goods Sold 468,000
Gross Profit 312,000
Operating Expenses
General Operating Expense 210,000
Results from Operating Activities 102,000
Other Revenue and Expenses
Gain on Sale of Assets 6,200
Interest Expense (8,700) (2,500)
Income before Tax 99,500
Income Tax Expense 29,850
Income from Continuing Operations 69,650
Discontinued Operations
Operating Income from Discontinued Operations 62,000
Less: Income Tax Expense (18,600) 43,400
Total Comprehensive Income for the Period $113,050
b) Statement of Changes in Equity
Splinter Inc.Statement of Changes in Equity
For the Year Ended December 31, 2014
Contributed
CapitalRetained Earnings Total
Balance at January 1, 2014 350,000 410,000 760,000
Adjustment to Correct Error from 2013 (6,000)
Total Comprehensive Income for the Period 113,050 113,050
Contributions by and Distributions to Owners
Issued Common Shares 120,000 120,000
Dividends to Shareholders (50,000) (50,000)
Total Contributions by and Distributions to Owners 120,000 (50,000) 70,000
Balance at December 31, 2014 470,000 467,050 937,050

164
Notes
Chapter 16 Corporations: The Financial Statements