corporate governance of dual class firms - ifs.swufe.edu.cn · pdf filethis paper explores the...
TRANSCRIPT

Corporate Governance of Dual Class Firms
Ting Li and Nataliya Zaiats∗
This Version: June 2012
∗Li is from Sheldon B. Lubar School of Business, University of Wisconsin-Milwaukee, Milwaukee, WI53201, [email protected], 414-229-6337. Zaiats is from School of Management, Simmons College, Boston,MA 02115, [email protected], (617) 521-2397. We are grateful for the insightful suggestionsand comments from Lilian Ng, James G. Tompkins, Timothy K Mooney and Ujjal Chatterjee, as well asparticipants of 2011 Annual Meeting of Southern Finance Association in Key West. All remaining errors aremy responsibility.
Corporate Governance of Dual Class Firms
Abstract
This paper explores the specific corporate governance structure of dual-class firms over the sample
period of 1996-2006. Firms with more takeover attributes but fewer board-related attributes tend to
be dual-class firms. Results show that such firms are associated with higher firm value, suggesting
that the takeover attributes of dual-class firms are able to help offset the weak board-related
corporate governance. Dual-class firms with strictly more takeover provisions have a lower cost of
equity and a lower cost of debt. The results also indicate that corporate governance of dual-class
firms changes around unification. Following the unification, we find that firms are inclined to have
fewer takeover and more board-related provisions.
Keywords: Dual class; corporate governance; firm value; cost of equity; cost of debt
JEL Classification Number: G32; G34

1. Introduction
Dual-class firm, as a special ownership structure, has gained a great deal of attention in empirical
research in finance and economics. According to Gompers, Ishii and Metrick (2009) (GIM (2009)),
from 1995 to 2002 about 6% of public companies in the United States have more than one class
of common stock, and these companies are virtually immune to a hostile takeover. The unique
structure of dual class firms allows the separation of cash flow rights and voting rights. Research
shows that firm values increases with cash flow rights and decreases with voting rights (GIM
(2009)). This divergence also aggravates the agency conflicts between managers and shareholders,
thus manages are more prone to pursue private benefits at shareholders’ expense (Masulis, Wang
and Xie (2009)).
Prior research only takes dual-class structure as a strong anti-takeover feature of corporate gov-
ernance. Studies regarding dual-class firms compare the agency problem, firm value, stock return,
and institutional ownership between dual-class firms and single-class firms. However, few studies
look at the specific corporate governance structures of dual-class firms, which effectively insulate
from the market for control. On the other hand, studies pertaining to corporate governance look
at the governance attributes of all the firms (DeAngelo and Rice 1983; Linn and McConnell 1983,
Shleifer and Vishny (1997), Gompers, Ishii, and Metrick (2003) (GIM (2003)). It is possible that
dual-class firm with such strong anti-takeover feature itself may have different corporate gover-
nance structure compared with single-class firms. The motivation of this paper is to investigate
the specific corporate governance structure of dual-class firms.
We employ a comprehensive dual-class firm database to investigate the specific corporate gov-
ernance structure of such firms over the sample period of 1996-2006. Our results show that dual-
class firms have different corporate governance compared with single-class firms. Firms with more
takeover attributes but fewer board-related attributes are inclined to be dual-class firms. Dual-class
firms with more takeover attributes and weak board-related governance tend to have larger firm
value. Takeover provisions are important to firm value only if the firm’s board quality is poor. The
takeover attributes dual class firms are taking help to offset the effect caused by weak board-related
1
corporate governance. Dual-class firms with strictly more takeover provisions have lower cost of
equity and lower cost of debt.
A great number of studies have been conducted on the impacts of such discrepancy on dual-
class firms. Early research has shown the advantages and benefits that the dual-class structure
can bring to firms. DeAngelo and DeAngelo (1985) suggest that dual-class firms may best be
viewed as an intermediate organizational form between the dispersed-ownership public corporation
and the closed-held firm. They argue that such intermediate structure is more likely to be used
when managerial voting ownership yields benefits by investigating four case studies. Harris and
Raviv (1988) argue that separating cash flow and voting rights can maximize firm value at social
optimality. Their result implies that security value is maximized by issuing dual-classes of shares.
The aggregate value of existing equity increases if the firm announces a switch of single class to
multiple-classes. Smart and Zutter (2003) and Smart, Thirumalai, and Zutter (2008) demonstrate
that the dual-class firms experience less underpricing than single-class firms by comparison of dual
and single-class IPOs. Dual-class shares substantially reduce the dilution effect and mitigate under-
investment problem. Also, many empirical studies on the effects of dual-class shares on shareholder
wealth examine the dual-class recapitalizations. Cornett and Vetsuypens (1989) document that
dual-class recapitalization leads to the increase of abnormal stock prices. Dimitrov and Jain (2006)
also find that dual-class recapitalizations are associated with positive abnormal stock return and
enhance the shareholders’ value.
Although the advantages of dual-class firms have been discussed by many studies, most recent
research illustrates that the disadvantages of dual-class firms are associated with negative abnormal
stock returns, lower firm value, agency problems and value-destroying acquisitions. Jarrell and
Poulsen (1988) report that negative abnormal stock return occurs with the announcement of dual-
class recapitalization. GIM (2009) consider the dual-class structure as extreme governance and
analyze the determinants of dual-class status. Based on this, they find that firm value is increasing
in insiders’ cash-flow rights and decreasing in insiders’ voting rights. Masulis, Wang, and Xie (2009)
examine the agency problem of dual-class firms. They find that as the divergence between insiders’
voting rights and cash flow rights widens, managers are more likely to pursue private benefits at
2

shareholders’ expense. They conclude such agency problems help explain the lower firm value with
insider excess control rights.
Hanson and Song (1996) investigate the acquisitions of dual-class firms and find that managers
are likely to make value reducing acquisitions. They interpret the evidence that managers who have
high control rights are more likely to make acquisitions to pursue private benefits while harm outside
shareholders. Li, Ortiz-Molina and Zhao (2008) examine the shareholder voting rights effects on
institution investment decisions. They document that voting rights are critical to institutional
investment decisions and the institutional ownership is significantly lower in dual-class firms than
in single class firms.
Dual-class structure is considered as an extreme anti-takeover feature of corporate governance.
The role of corporate governance has received growing interests, from academic and industry,
with recognition of its importance. Corporate governance is defined as a set of processes, policies
and laws, which affect the way a corporation is directed, administered and controlled. Shleifer and
Vishny (1997) refer corporate governance as the way in which suppliers of finance assure themselves
a return on their investment.
Whether the corporate governance provisions affect firm value and harm the shareholders has
been a subject of controversy among the researchers and practitioners over the past decades. Some
research documents a positive value effect associated with antitakeover provisions (DeAngelo and
Rice 1983; Linn and McConnell 1983), while others argues a negative value effect (Malatesta and
Wakling 1988; Lins 2003). GIM (2003) first construct a “Governance Index” to proxy for the balance
of power between shareholders and managers. They find that firms with stronger shareholder rights
have higher firm value, higher profits, higher sales growth, and lower capital expenditures and make
fewer corporate acquisitions. Bebchuk, Cohen and Ferrell (2009) further build an entrench index
and argue that the increase of index is associated with significant reduction in firm valuation and
large negative stock returns.
Straska and Waller (2010) reexamine the negative relationship between firm value and the
number of antitakeover provisions a firm is adopting. They find that firms with low bargaining
3

power adopting more antitakeover provisions can enhance the firm value. Such finding challenges the
prevailing view and suggests the negative relations between firm value and antitakeover provisions
are not universal. Classens, Djankov, Fan and Lang (2002) analyze the incentive and entrenchment
of large ownership. They find that firm value increases with cash-flow ownership of large shareholder
and decreases when control rights of large shareholder exceed its cash-flow ownership.
Corporate board structure as a component of corporate governance has been debated for its
impact on firm value and firm behavior as well. Adams and Ferreira (2007) and Harris and Raviv
(2008) build the theoretical determinants of board structure. Boone, Field, Karpoff and Raheja
(2007) track corporate board development from firms’ IPO through 10 years and conclude that
board structure demonstrates the firm’s competitive environment and managerial team. Coles,
Daniel and Naveen (2008) examine the firm value and board structure. They argue that restrictions
on board size and management representation on the board do not necessarily enhance the firm
value. Linck, Netter and Yang (2008) examine the board structure, trends and determinants by
analyzing nearly 7,000 from 1990 to 2004. They find strong associations between board structure
and firm size and ownership. Jiang (2010) evaluates the treatment effect of dual-class ownership
on board structure by analyzing the dual-class firm from 1998 to 2002. The results indicate that
dual-class ownership has a significant effect on board structure and on average dual-class firms have
a slightly bigger and less independent board.
Our study advances the literature in two ways. First, it contributes to the understanding
of the specific corporate governance structure of dual-class firms. We compare the difference of
corporate governance between dual-class firms and single-class firms. We hypothesize that firms
with certain corporate governance attributes are more likely to be dual-class firms after GIM (2009)
determinants of dual status at the time of IPO are controlled. We look at five takeover attributes
and seven board-related attributes used mostly by previous corporate governance studies, which
will be discussed in section 2. We identify governance features with which firms are more likely to
be dual class firms.
Second, our study shows that among all dual-class firms, those with certain corporate governance
attributes have higher firm values and dual class is not value destructive for all the firms. Prior
4

studies argue that dual class structure is related to agency problems and low firm value (GIM
(2009); Masulis, Wang and Xie (2009)). Since dual class firms have their own governance feature,
regular governance provisions may have no effects on firm value of dual class firms. We investigate
the relationship between firm value, cost of equity and cost of debt and corporate governance
structures within dual class firms.
The remainder of this paper is organized as follows. Section 2 describes our data, measures
of corporate governance, and summarizes the distribution of corporate governance. Section 3
summarizes the distribution of corporate governance, and shows the association among dual class
structure, corporate governance and firm value. Section 4 conducts the robustness tests. Section 5
concludes the paper.
2. Sample and Data Description
2.1. Data
To investigate the corporate governance structures of dual class firms, we use several data sets. GIM
(2009) construct a comprehensive set of dual-class firms over the period 1994-2002 with data from
the Security Data Company, S&P’s Compustat, the Center for Research in Security Prices, and
the Investor Responsibility Research Center. For each dual class firm, they collect information on
voting rights per share for different classes of stock, dividends per share for different classes of stock,
number of shares of different stock classes owned by insiders and shares outstanding of different
classes. Nguyen and Xu (2010) extend the dual class sample to 2006 with the same methodology
used by GIM (2009).1 Thus, the sample period of dual class firms is from 1994-2006.
We obtain corporate governance data from the Investor Responsibility Research Center (IRRC).
IRRC publishes the directors data including a range of variables related to individual board directors
collected since 1996 and updated annually. IRRC also publishes detailed listings of corporate
governance for individual firms in Takeover Defense in years 1990, 1993, 1995, 1998, 2000, 2002,
2004 and 2006. Since IRRC does not publish takeover defense volumes annually and corporate
1We thank Paul Gompers, Joy Ishii and Andrew Metrick for their generosity in providing the dual class data from1994-2002. We also thank Li Xu for their generosity in providing the extended dual class data to 2006.
5

governance provisions are stable, we assume takeover defenses are same as the nearest prior IRRC
volume if they are not published in certain year. Following Cremers and Nair (2005), we regard
provisions from takeover defense data as takeover provisions. More takeover provisions means
“lower management power” or “stronger shareholder rights. Directors data provides information of
each individual director in different firms. We construct board-related attribute dummies for each
firm based on the continuous variables for individual directors. Since directors data were collected
from 1996 and the sample period of dual class firms is from 1994-2006, the sample period of our
study is from 1996-2006. There are 1452 firm-year observations for dual class firms and 19802
firm-year observations for single class firms.
We get financial data for all firms from Compustat. We drop firms in utilities or financial
industries. When we restrict our sample to firms having both corporate governance and financial
data to conduct regressions, the sample size reduces to 4651 firm-year observations.
2.2. Corporate Governance
Based on previous academic literature, we focus on the following 12 attributes in takeover defense
data and directors data. We use five takeover provisions: shareholders may call special meetings;
shareholders may act by written consent; company has no poison pill; company has no staggered
board; and shareholders have cumulative voting rights. Besides, we use seven attributes associated
with board quality: all directors attended 75% of board meetings; CEO serves on two or fewer
boards of other firms; the outside directors are more than 50%; board size is greater than 5 but
less than 16; nominating committee is composed solely of independent outsiders; chairman and
CEO are separated; compensation committee is composed solely of independent outsiders. We use
12 dummy variables indicating whether a firm has the above 12 corporate governance attributes,
respectively. If the firm meets the threshold level for certain standard above, that dummy variable
takes the value of 1, and 0 otherwise.
Since board attribute dummies are constructed with continuous data from directors data, there
are missing values for some firms. To ensure the corporate governance indices reflect more accurate
information, following Aggarwal et al. (2008), we express the corporate governance indices as
6

percentage of non-missing attributes for each firm. We construct 3 indices for each firm: Takeover
sub-index (TSI), Board-related sub-index (BSI) and Total index (TI). TSI is computed as the
percentage of non-missing takeover attributes that a firm satisfies. If a firm meets the threshold
level for all the 5 anti-takeover attributes, TSI of the firm is 100%. If there is a missing attribute,
we eliminate the missing attribute and compute the percentage of satisfied takeover attributes to
non-missing takeover attributes. Higher TSI indicates stronger shareholder rights. BSI is computed
as the percentage of satisfied board-related attributes to non-missing board-related attributes. TI is
computed as the percentage of all non-missing corporate governance attributes (including takeover
attributes and board-related attributes) that the firm satisfies. Each of the takeover attributes and
board-related attributes is associated with stronger governance. Higher index indicates that the
firm satisfies more corporate governance (or takeover or board-related) attributes.
The readers may concern why we focus on these 12 attributes, instead of using more corporate
governance attributes. The reasons are as follows. First, according to prior literature, these 12
attributes are mostly used and they are critical to corporate governance. Besides, certain attributes
are required by SEC for all the firms, so there will be no significant differences between dual-class
firms and single-class firms for these attributes.
2.3. Distribution of Corporate Governance Provisions
Table 1 shows the distribution of corporate governance attributes and indices for dual-class firms
and single-class firms. Panel A provides the distribution of the pooled sample. GIM (2009) report
that, in about 33% of all dual class firms, the insiders have voting rights greater than 50% while
their cash flow rights are less than 50%. They classify these firms as the “separation sample”. We
also compare the corporate governance between single-class firms and firms in separation sample.
TSI and TI of dual class firms are greater than TSI and TI of single class firms, while BSI of dual
class firms is less than that of single class firms. The differences are significant at 1% level. The
differences between single class firms and separation sample are greater. Since insiders of firms in
the separation sample have effective control over the firm, the boards are more entrenched and the
board-related corporate governance is relatively weak. On the other hand, since dual class structure
7
itself is an extremely strong anti-takeover feature, dual class firms are well protected from M&A,
especially for the separation sample. It is unnecessary for them to restrict shareholder rights tightly.
TSI of separation sample is greater than that of single class firms, while BSI of separation sample
is less than that of single class firms.
From the distribution of individual attributes, we can see that more dual-class firms adopt
takeover attributes relative to single-class firms. For example, more dual-class firms allow share-
holders to call special meeting and act by written consent, have no poison pill, have no staggered
board and offer shareholders cumulative voting rights. We also can see that dual-class firms are less
independent. Fewer dual-class firms have board with more than 50% independent outside direc-
tors, with nominating committee composed solely of independent outsiders and with compensation
committee composed solely of independent outsiders. However, more dual-class firms have optimal
board size (board size is greater than 5 but less than 16), have CEO serving 2 or fewer outsider
boards, and have separated chairman and CEO. Jensen (1993), Yermack (1996), and Core et al.
(1999) suggest that large board size is expected to be associated with less effective board moni-
toring. Our results indicate more dual class firms have optimal board size, and they should have
effective board monitoring. Unreported Chi-square test indicates that the individual governance
attributes are significantly different between dual class firms and single class firms.
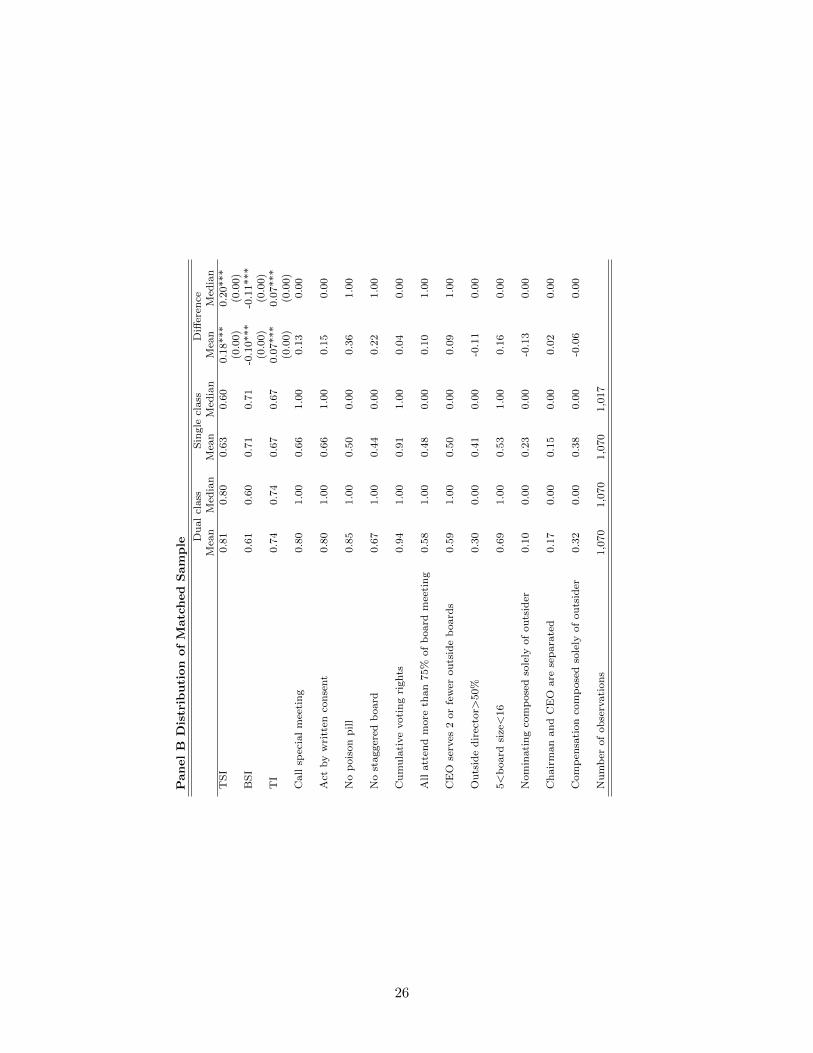
Panel B provides the distribution of matched sample. We match dual-class firms with single-
class firms by propensity score, which can control for the differences between them. We estimate a
probit model with GIM (2009) determinants to get the propensity score. The determinants include
Fama-French industry classification, dummy variables indicating whether the firm was a “media”
company in its IPO year, indicating whether the firm is named for a founder, and indicating whether
the firm was incorporated in states with anti-takeover laws, the percentile ranking of the IPO-year
sales and profit of the firm relative to other firms with the same IPO year, the percentage of all
Compustat firms located in the same area in the year before IPO, the percentage of all Compustat
sales by firms located in the same area in the year prior to IPO.2 The values of difference decrease
a little in the matched sample. But they are still significant.
2Please refer to GIM (2009) for more detailed description of the determinants of dual-class structures.
8

3. Empirical Results
We conduct the empirical analysis as follows. First, we investigate the association between corporate
governance and dual-class structure by probit regressions. Second, we examine whether dual-class
firms with specific corporate governance features have higher firm value. Third, we compare the
cost of equity of dual-class firms and that of single-class firms with similar corporate governance
level.
3.1. The Association between Corporate Governance and Dual-Class Structure
GIM (2009) state that firm, industry, or market characteristics at the time of a firm’s IPO will
determine the dual-class status of that firm, since the decision to go public involves negotiation
between insiders and shareholders. The insiders are more likely to have the ability to argue with
the shareholders and obtain a dual-class structure upon the IPO if the aggregate reduction in share
value is less than the private benefits of control. The summary statistics indicate that corporate
governance is different between dual-class firms and single-class firms. It is possible that the
corporate governance structure changes gradually after a firm listed its share on a public exchange,
which may lead to the change of voting and ownership structure. We conjecture that with certain
corporate attributes, a firm is more inclined to adopt the dual-class structure.
After controlling for GIM (2009) determinants, we employ probit regressions to show the rela-
tionship between corporate governance and dual-class status. Table 2 displays the results of probit
estimations on individual corporate attributes. The dependent variable is a dummy variable indi-
cating if a company is a dual-class firm. The independent variables are governance attribute dummy
variables, which indicate whether a firm meets the threshold level for certain corporate governance
standards. Column 1 presents coefficient estimates from the probit regression with GIM (2009)
dual-class status determinants only as controlled variables. The results suggest that firms adopting
the 5 takeover attributes and having optimal board size are more inclined to be dual class firms.
But independent board and high attendance of board meetings reduce the probability of being
dual-class firms. The effects of board-related attributes on the probability are mixed. Column
9

2 presents coefficient estimates from the probit regression including GIM (2009) dual-class status
determinants and control variables used by other studies related to dual class firms. Most of the
coefficient estimates are similar to those reported in column 1. Coefficients of dummy variable “All
attend more than 75% of board meetings” is not significant in column 2. Overall, table 2 illustrates
that dual-class structure is related to certain corporate governance attributes. Firms with more
takeover attributes and fewer attributes associated with board quality are inclined to be dual-class
firms.
Table 2 reports the results of probit estimations on corporate governance indices TSI, BSI and
TI, where the dependent variable is a dual class dummy. We control GIM (2009) determinants of
dual-class status and variables used by other studies related to dual class firms. In these regressions
we cluster the standard errors by each firm. In column 1 and 2 we test the relationship between
dual-class status and TSI, and between dual-class status and BSI, respectively. The coefficients
of TSI and BSI are significantly positive at 1% level. The probability of being dual class firms is
increasing with adopting more of the five takeover attributes and adopting fewer of the seven board-
related attributes. In column 3, we include both TSI and BSI in the regression. The coefficients
of TSI and BSI are consistent with previous two regressions and significant at 1%. The economic
significance increases for both coefficients. In Table 2, some of coefficients of the individual board
attributes are insignificant. The influences of individual board-related attributes on the probability
of being dual class firms are not the same. But here the overall BSI is strongly negative.
In column 4, we test how the overall corporate governance of a firm determinates the dual
class structure. The result implies that firms adopting more governance attributes are more likely
to be dual-class firms. Though adopting some board-related attributes reduces the probability of
being dual class firms, the countervailing effect of takeover attributes and board-related attributes
increases the probability of being dual class firms.
In sum, the results in Table 2 and 3 provide support for our hypothesis that dual-class firms
possess specific corporate governance compared with single-class firms. Firms taking more takeover
attributes and fewer board-related attributes are more likely to choose dual-class structure.
10

3.2. Firm Values of Dual Class Firms
Prior literature suggests that firm valuation is related to cash flow ownership and voting structure.
Claessens et al. (2002) find firm valuation increases with cash flow ownership in the hands of the
largest shareholders and decreases with the increases in control rights by the largest shareholder.
GIM (2009) show that firm value is increasing in insiders’ cash flow rights and decreasing in insiders’
voting rights. There is no research related to dual-class firms testing the relationship between
firm values and corporate governance in dual-class firms. We want to investigate the association
between firm value and corporate governance structure of dual-class firms. We hypothesize that
dual-class firms with certain corporate governance feature have higher firm value compared with
the counterpart dual-class firms, since the governance structure of this kind of dual-class firms
countervail the effect of entrenchment.
We use Tobin’s Q to measure firm value. Following Kaplan and Zingales (1997), we compute
Tobin’s Q as the market value of assets divided by the book value of assets, where the market value
of assets is the book value of assets plus the market value of common stock less the book value of
common stock less balance sheet deferred taxes. Following GIM (2009), to reduce the measurement
error of Tobin’s Q, we compute industry-adjusted Tobin’s Q, industry-adjusted ln Q, and inverse
industry-adjusted Q as −[1/Q− 1/(industryQ)].
3.2.1. Distribution of Firm Values
To look at the distribution of firm values among dual-class firms with different corporate governance
and discrepancy between cash flow rights and voting rights, we create different portfolios based on
TSI and voting rights, TSI and cash flow rights, BSI and voting rights, and BSI and cash flow
rights, respectively. Voting rights are computed as the total percentage of votes owned by officers
and directors across classes. Cash flow rights are computed as the total percentage of cash flow
ownership by officers and directors (GIM, 2009). First, we create 3 portfolios among the dual
class firms by the value of TSI. Dual class firms in portfolio 1 have the lowest TSI, while firms in
portfolio 3 have the highest TSI. Second, within each TSI portfolio, we create 3 portfolios based
on the voting rights of the dual class firms. Portfolio 1 includes firms with the lowest voting rights
11
while portfolio 3 includes firms with the highest voting rights. Finally, there are 9 portfolios. We
use the same method to create other portfolios.
Table 4 reports the distribution of industry-adjusted Tobin’s, industry-adjusted ln Q, and inverse
industry-adjusted Q among different portfolios. In panel A we create the 9 portfolios based on dual-
class firms’ TSI and voting rights. GIM (2009) argue that firm value is decreasing in insider voting
rights and increasing in insider cash flow rights. When we look at firm values within each TSI
portfolio, the different forms of Tobin’s Q are not always decreasing in insider voting rights. In
panel B we create the 9 portfolios based on dual class firms’ TSI and cash flow rights. Within each
TSI portfolio, the different forms of Tobin’s Q are not always increasing with cash flow rights. On
average, values of Tobin’s Q are relatively greater for dual class firms with more takeover attributes.
When we take corporate governance into consideration, firm value is neither increasing with cash
flow rights nor decreasing with voting rights, which is not consistent with GIM (2009). Adopting
more of the 5 takeover attributes increases the firm values.
Panel C presents the value distribution of the 9 portfolios created by the value of BSI and
voting rights. Within each BSI portfolio, firm value is not decreasing with the voting rights. Panel
D demonstrates the value distribution of the 9 BSI-cash flow rights portfolios. Within each BSI
portfolio, firm value is not increasing with the cash flow rights all the time. Above all, when
corporate governance is controlled, firm value is not changing with the cash flow rights and the
voting rights. Firm value changes with the adoption of corporate governance.
3.2.2. Firm value and corporate governance of dual class firms
Prior studies illustrate that good corporate governance is associated with higher firm value, higher
profits, positive abnormal returns and lower capital expenditures (GIM, 2003; Bebchuk, Cohen, and
Ferrell, 2008). The analysis in the preceding section shows that the corporate governance structure
is different between dual-class firms and single-class firms. Firms with more takeover attributes
and fewer board-related are more likely to be dual-class firms. We will investigate if this specific
governance structure will influence the firm value of dual-class firms.
We assign 3 ranks to all dual class firms according to their TSI and BSI, respectively. Firms
12

in rank 1 have the lowest TSI or BSI, while firms in rank 3 have the highest TSI or BSI. We
create dummy variables indicating if a dual class firm is in the lowest rank or in the highest rank
of governance indices. The indicator variable High TSI equals 1 if a dual class firm falls in rank 3
based on TSI, and 0 otherwise. The indicator variable Low BSI equals 1 if dual class firms are in
rank 1 based on BSI, and 0 otherwise. HighTSI ×LowBSI is an interaction variable of High TSI
and Low BSI. We run OLS regressions of Tobin’s Q on the corporate governance indicators.
Table 5 provides OLS estimations of firm value. The coefficients of High TSI are not signif-
icant. But coefficients of Low BSI are significantly negative and coefficients of the interaction
are significantly positive. High TSI shows the influence of high TSI on non-Low BSI firms, while
HighTSI × LowBSI shows incremental effect of High TSI on Low BSI firms. If a dual class
firm adopts the fewest board-related attributes and does not adopt most takeover attributes, the
industry-adjusted Q will decrease about 0.7. But if this firm also adopts most takeover attributes,
the industry-adjusted Q will increase about 0.6. Based on these results, we can see that takeover
provisions are important to firm value only if the firm’s board quality is low.
We also run regressions of firm value on other indicator variables and interaction variables
respectively, such as HighTSI ×HighBSI, LowTSI ×HighBSI, and LowTSI × LowBSI. But
none of them is significant. It demonstrates that dual-class firms with fewer board-related attributes
and more takeover attributes simultaneously have higher firm values. The takeover attributes dual
class firms are taking help to protect shareholder wealth and offset the effect caused by weak board-
related corporate governance. The unique corporate governance structure of such dual class firms
increases the firm value.
4. Robustness Tests
4.1. Cost of Equity
Besides firm value, we want to further investigate if dual-class firms benefit from their specific
corporate governance features by conducting analyses of cost of equity and cost of debt. Following
Gebhardt, Lee, and Swaminathan (2001) (GLS (2001)), we employ implied cost of capital (ICOC)
13

to proxy for cost of equity. It is computed as the internal rate of return that equals the present value
of expected future cash flows to the current stock price. Besides, following Hail and Leuz (2006)
(HL (2006)), we also use the average of four different ICOC estimates as an alternative proxy for a
firm’s cost of capital. The four estimates are GLS (2001) internal rate of return; Claus and Thomas
(2001) residual income valuation model; Ohlson and Juettner-Nauroth (2005) abnormal earnings
growth valuation model; and Easton (2004) MPEG ratio, which is computed as price-to-earnings
ratios divided by growth rate. We explain the four ICOC models in Appendix B.
Table 6 presents OLS regression estimations of cost of equity on corporate governance index.
GLS and HL are dependent variables. Cash flow rights and voting rights are controlled in all models.
In Panel A, Models 1, 3, 4 and 6 show that TSI is significantly negatively related to cost of equity.
More takeover provisions help dual-class firms reduce cost of equity. However, the coefficients of
BSI are not significant in any case. In proceeding sections, we show that more dual-class firms
have optimal board size and dual-class firms are less independent. The effects of board related
provisions are mixed. Thus, we hypothesize that individual board-related attributes have different
effects on cost of equity. We run regressions of cost of equity on TSI and board-related attributes.
Panel B shows the results. The signs of coefficients are mixed, but they are insignificant. Only
dummy variable indicating “nominating committee is composed solely of independent outsiders” is
significantly positively related to HL.
Dual-class status is the ultimate takeover protection and dual-class firms are well immune from
hostile takeovers, so naturally these firms will have a reduced need for restricting shareholder rights
tightly. Dual-class firms adopting more takeover provisions have lower cost of equity. Though dual-
class status effectively insulates the firm from the market for corporate control, takeover provisions
still affect cost of equity at all. But since board-related attributes have mixed effects on dual class
firms, the attributes associated with board quantity do not reduce cost of equity for dual-class
firms.
14

4.2. Cost of Debt
Billett and Liu (2008) find that the cost of debt financing increases in managerial voting rights and
decreases in cash flow rights. We test if corporate governance provisions are associated with cost of
debt of dual-class firms after cash flow rights and voting rights are controlled. Following Francis,
Khurana, and Pereira (2005), we compute the interest rate on firm’s debt as a proxy for cost of
debt. It is calculated as the interest expense for the year divided by average short- and long-term
debt during the year. Klock, Mansi and Maxwell (2005) assign a value of 22 to AAA-rated bonds
and a value of one to D-rated bonds. We apply the same method and use the S&P credit rating as
control variable.
Table 7 reports the OLS estimations of cost of debt on corporate governance provisions of dual-
class firms. Model 3 includes both TSI and BSI. The coefficients of TSI are significantly positive at
10%. In dual-class firms, cost of debt decreases with takeover provisions after cash flow rights and
voting rights are controlled. The coefficients of cash flow rights and voting rights are not significant,
which is not consistent with Billett and Liu (2008). BSI is neither significant in Model 2 nor in
Model 3. We run regressions of cost of debt on TSI and individual board related provisions, which
is shown in Panel B. It indicates that outside directors greater than 50% and separation of chairman
and CEO reduce the cost of debt. If nominating committee is composed solely of outside directors,
cost of debt is increasing.
In all, these results indicate that dual-class firms with more takeover provisions have lower
cost of debt. Though dual-class status effectively insulates the firm from the market for corporate
control, takeover provisions still affect cost of debt of dual-class firms. Board-related attributes
have mixed effects on dual-class firms, so the overall attributes associated with board quantity do
not reduce cost of equity for dual-class firms.
4.3. Corporate Governance Indices
In our study, we use percentage of non-missing attributes that the firm satisfies as a proxy for
corporate governance. Some researchers use the number of attributes that the firm satisfies to
15

proxy for it (e.g., GIM, 2003; Bebchuk, Cohen, and Ferrell, 2008). We also conduct all the tests
with the additive indices. We get qualitatively similar results. Our results are not sensitive to the
corporate governance measures.
4.4. Endogeneity
Existence of endogeneity may prevent us from concluding that corporate governance leads to dual-
class structure, since the causality can be reversed or the corporate governance and stock class
structure can be determined simultaneously. We need to check the endogeneity problem. In Table
8, we show the changes of corporate governance provisions around unifications. Unification is
a procedure that dual class firms change the stock structure from dual class to single class. It
is an intra-firm transaction of voting rights. Studies show that abnormal returns are associated
with the announcement of dual-class unification (Ehrhardt, Kuklinski, and Nowak, 2005), and the
institutional ownership increases largely after unification (Li, Ortiz-Molina, and Zhao, 2008). The
event of unification provides a good timing for us to investigate the corporate governance between
dual-class structure and single-class structure on one firm with other things constant.
We use 1-year window, 3-year window and 5-year window. Corporate governance is stable for
a firm and it takes time for corporate governance to change, so we do not find significant changes
between 1-year average before unification and 1-year average after unification. We only report
the results of 3-year window and 5-year window. Panel A shows the 3-year average corporate
governance provisions before unification and the 3-year average corporate governance provisions
after it. Panel B shows the 5-year average corporate governance before unification and the 5-year
average corporate governance after it. Both panels show that firms take less takeover attributes and
more board-related attributes after unification. The percentage of boards with optimal size drops
and the boards are more independent when the firms unify. The corporate governance structure
changes significantly after the unification. The differences are significant around unification. We
argue that the corporate governance and stock class structure are not determined simultaneously.
Besides, we also use corporate governance attributes and indices in the first year a firm appears
in our sample instead of annual values. We get qualitatively similar results.
16

5. Conclusion
In this paper, we investigate the corporate governance structure of dual-class firms using dual-
class sample data from 1996-2006. Prior literature focuses on the agency problems, abnormal
returns and firm values of such firms. Since dual-class structure is a strong anti-takeover provision,
we want to examine the corporate governance of firms with this feature. We hypothesize that
dual-class firms have different corporate governance relative to single-class firms and the special
corporate governance structure will benefit dual-class firms under certain circumstance. We test
the hypothesis on five takeover attributes and seven board-related attributes.
We find that the corporate governance structure of dual-class firms is significantly different from
that of single-class firms. More dual-class firms allow shareholders to call special meetings and act
by written consent, has no poison pill, has no staggered board and offer shareholders cumulative
voting rights. But the boards of dual-class firms are less independent while more such firms have
optimal board size and separated CEO and chairman. We further show that, among all the firms
in our sample, firms with the above governance features are more likely to be dual-class firms. Our
results also indicate that firm value is not changing with voting rights and cash flow rights when
the corporate governance of dual-class firms is controlled. Dual-class firms with more takeover
attributes and weak board-related governance have higher firm value compared with other dual-
class firms. The takeover attributes dual-class firms are taking help to protect shareholder wealth
and eliminate the effect caused by weak board-related corporate governance.
Our study documents the specific corporate governance structure of dual-class firms and such
firms with certain governance feature tend to have higher firm value. But overall board-related
attributes neither increase dual-class firm value, nor reduce the cost of equity and cost of debt.
Besides, dual-class status is a strong anti-takeover feature. But we still find that takeover provisions
actually affect dual class firm value, cost of equity, and cost of debt. In future, we need to explain
why takeover provisions affect firm value though dual-class status effectively insulates the firm
from the market for corporate control and how dual-class structure fits in with other governance
provisions.
17
References
Adams, R.B., Ferreira, D., 2007. A Theory of Friendly Boards. The Journal of Finance 62,
217-250
Aggarwal, R., Erel, I., Stulz, R., Williamson, R., 2009. Differences in Governance Practices be-
tween U.S. and Foreign Firms: Measurement, Causes, and Consequences. Review of Financial
Studies 22, 3131-3169
Bebchuk, L., Cohen, A., Ferrell, A., 2009. What Matters in Corporate Governance? The Review
of Financial Studies 22, 783-827
Billett, M.T., Liu, Y., 2008. Shareholder-Manager Alignment and the Cost of Debt. Working
Paper
Boone, A.L., Casares Field, L., Karpoff, J.M., Raheja, C.G., 2007. The Determinants of Corporate
Board Size and Composition: An Empirical Analysis. Journal of Financial Economics 85,
66-101
Claessens, S., Simeon, D., Fan, J.P.H., Lang, L.H.P., 2002. Disentangling the Incentive and
Entrenchment Effects of Large Shareholdings. The Journal of Finance 57, 2741-2771
Claus, J., Thomas, J., 2001. Equity Premia as Low as Three Percent? Evidence from Analysts’
Earnings Forecasts for Domestic and International Stock Markets. The Journal of Finance
56, 1629-1666
Coles, J.L., Daniel, N.D., Naveen, L., 2008. Boards: Does One Size Fit All? . Journal of Financial
Economics 87, 329-356
Core, J.E., Guay, W.R., Rusticus, T.O., 2006. Does Weak Governance Cause Weak Stock Returns?
An Examination of Firm Operating Performance and Investors’ Expectations. The Journal
of Finance 61, 655-687
Cornett, M., Vetsuypens, M.R., 1989. Voting Rights and Shareholder Wealth. The Issuance of
Limited Voting Common Stock. Managerial and Decision Economics 10, 175-188
18
Cremers, K.J.M., Nair, V.B., 2005. Governance Mechanisms and Equity Prices. Journal of
Finance LX, 2859-2894
DeAngelo, H., DeAngelo, L., 1985. Managerial Ownership of Voting Rights : A Study of Public
Corporations with Dual Classes of Common Stock. Journal of Financial Economics 14, 33-69
DeAngelo, H., Rice, E.M., 1983. Antitakeover Charter Amendments and Stockholder Wealth.
Journal of Financial Economics 11, 329-359
Dimitrov, V., Jain, P.C., 2006. Recapitalization of One Class of Common Stock into Dual-class:
Growth and Long-run Stock returns. Journal of Corporate Finance 12, 342-366
Easton, P.D., 2004. PE Ratios, PEG Ratios, and Estimating the Implied Expected Rate of Return
on Equity Capital. The Accounting Review 79, 73-95
Francis, J.R., Khurana, I.K., Pereira, R., 2005. Disclosure Incentives and Effects on Cost of
Capital around the World. The Accounting Review 80, 1125-1162
Gebhardt, W.R., Lee, C.M.C., Swaminathan, B., 2001. Toward an Implied Cost of Capital.
Journal of Accounting Research 39, 135-176
Gompers, P., Ishii, J., Metrick, A., 2003. Corporate Governance and Equity Prices. The Quarterly
Journal of Economics 118, 107-155
Gompers, P.A., Ishii, J., Metrick, A., 2009. Extreme Governance: An Analysis of Dual-Class
Firms in the United States. Review of Financial Studies 23, 1051-1088
Ehrhardt, O., Kuklinski, J., Nowak, E., 2005. Unifications of Dual-Class Shares in Germany
Empirical Evidence on the Effects of Related Changes in Ownership Structure, Market Value,
and Bid-ask Spreads. Swiss Finance Institute Research Paper Series
Hail, L., Leuz, C., 2006. International Differences in the Cost of Equity Capital: Do Legal
Institutions and Securities Regulation Matter? Journal of Accounting Research 44, 485-531
19

Hanson, R.C., Song, M.H., 1996. Ownership Structure and Managerial Incentives: The Evidence
from Acquisitions by Dual Class Firms. Journal of Business Finance & Accounting 23, 831-
849
Harris, M., Raviv, A., 1988. Corporate governance: Voting Rights and Majority Rules. Journal
of Financial Economics 20, 203-235
Harris, M., Raviv, A., 2008. A Theory of Board Control and Size. The Review of Financial
Studies 21, 1797-1832
Jarrell, G.A., Poulsen, A.B., 1988. Dual-class Recapitalizations as Antitakeover Mechanisms: The
Recent Evidence. Journal of Financial Economics 20, 129-152
Jensen, M.C., 1993. The Modern Industrial Revolution, Exit, and the Failure of Internal Control
Systems. Journal of Finance XLVIII, 831-880
Jiang, J., 2010. Board Structure in Dual-class Firms. Working Paper
Kaplan, S.N., Zingales, L., 1997. Do Investment-Cash Flow Sensitivities Provide Useful Measures
of Financing Constraints? The Quarterly Journal of Economics 112, 169-215
Li, K., Ortiz-Molina, H., Zhao, X., 2008. Do Voting Rights Affect Institutional Investment Deci-
sions? Evidence from Dual-Class Firms. Financial Management 37, 713-745
Linck, J.S., Netter, J.M., Yang, T., 2008. The Determinants of Board Structure. Journal of
Financial Economics 87, 308-328
Linn, S.C., McConnell, J.J., 1983. An Empirical Investigation of the Impact of ’Antitakeover’
Amendments on Common Stock Prices. Journal of Financial Economics 11, 361-399
Lins, K.V., 2003. Equity Ownership and Firm Value in Emerging Markets. The Journal of
Financial and Quantitative Analysis 38, 159-184
Malatesta, P.H., Walkling, R.A., 1988. Poison Pill Securities: Stockholder Wealth, Profitability,
and Ownership Structure. Journal of Financial Economics 20, 347-376
20

Masulis, R.W., Wang, C., Xie, F., 2009. Agency Problems at Dual-Class Companies. The Journal
of Finance 64, 1697-1727
Nguyen, V.T., Li, X., 2010. The Impact of Dual Class Structure on Earnings Management
Activities. Journal of Business Finance & Accounting 37, 456-485
Ohlson, J., Juettner-Nauroth, B., 2005. Expected EPS and EPS Growth as Determinantsof Value.
Review of Accounting Studies 10, 349-365
Ortiz-Molina, H., Phillips, G.M., 2009. Asset Liquidity and the Cost of Capital. Working Paper
Shleifer, A., Vishny, R.W., 1997. A Survey of Corporate Governance. The Journal of Finance 52,
737-783
Smart, S.B., Thirumalai, R.S., Zutter, C.J., 2008. What’s in a Vote the Short- and Long-run
Impact of Dual-class Equity on IPO Firm Values. Journal of Accounting and Economics 45,
94-115
Smart, S.B., Zutter, C.J., 2003. Control as a Motivation for Underpricing: A Comparison of Dual
and Single-class IPOs. Journal of Financial Economics 69, 85-110
Straska, M., Waller, G., 2010. Do Antitakeover Provisions Harm Shareholders? Journal of Cor-
porate Finance 16, 487-497
Yermack, D., 1996. Higher Market Valuation of Companies with a Small Board of Directors.
Journal of Financial Economics 40, 185-211
21

Appendix A Variable Definitions
Variable DefinitionTakeover attributesCall special meeting It equals 1 if shareholders may call special meetings, and 0 otherwiseAct by written consent It equals 1 if shareholders may act by written consent, and 0 otherwiseNo poison pill It equals 1 if company has no poison pill, and 0 otherwiseNo staggered board It equals 1 if company has no staggered board, and 0 otherwiseCumulative voting rights It equals 1 if shareholders have cumulative voting rights,
and 0 otherwiseBoard-related attributesAll attend more than It equals 1 if all directors attended 75% of board meetings,75% of board meetings and 0 otherwise
CEO serves 2 or fewer It equals 1 if CEO serves on two or fewer boards of other firms,outside boards and 0 otherwise
Outside director>50% It equals 1 if the outside directors are more than 50%, and 0 otherwise5<Board size<16 It equals 1 if board size is greater than 5 but less than 16,
and 0 otherwiseNominating composed It equals 1 if nominating committee is composed solely of independentsolely of outsider outsiders, and 0 otherwise
Chairman and CEO are separated It equals 1 if chairman and CEO are separated, and 0 otherwiseCompensation composed It equals 1 if compensation committee is composed solely of independentsolely of outsider outsiders, and 0 otherwiseGovernance indicesTSI The percentage of non-missing takeover attributes that a firm satisfiesBSI The percentage of satisfied board-related attributes to non-missing
board-related attributesTI The percentage of all the non-missing corporate governance attributes
(including takeover attributes and board-related attributes) that the
firm satisfiesGIM (2009) determinantsIPOname It equals 1 if the firm’s name at IPO includes a person’s name,
and 0 otherwiseMedia It equals 1 if the firm was a “media” company in its IPO year,
and 0 otherwiseStateLaw It equals 1 if the firm was incorporated in states with anti-takeover laws,
and 0 otherwiseSalesRank Percentile ranking of the IPO year sales of the firm relative to other firms
with the same IPO yearProfitRank Percentile ranking in the IPO year profit of the firm relative to other firms
with the same IPO year%Firms Percentage of all Compustat firms located in the same metropolitan or
micropolitan statistical area (MSA) as firm i in the year before firm i’s IPO%Sales Percentage of all Compustat sales by firms located in the same micropolitan
statistical area (MSA) as firm i in the year before firm i’s IPOSales/RegionSales Ratio of a firm’s sales to the sales of all firms in the same region
22

Variable Definitions (Continued)Variable DefinitionTobin’s Q and cost of equityTobin’s Q The market value of assets divided by the book value of assets,
where the market value of assets is the book value of assets plus the marketvalue of common stock less the book value of common stock less balancesheet deferred taxes
Inverse industry-adjusted Q −[1/Q− 1/(industryQ)]Implied cost of equity (GLS(2001)) The present value of expected future cash flows to the current stock priceImplied cost of equity (HL(2006)) The average of four different ICOC estimates:
GLS (2001) internal rate of return; Claus and Thomas (2001) residualincome valuation model; Ohlson and Juettner-Nauroth (2005) abnormalearnings growth valuation model; and Easton (2004) MPEG ratio,which is computed as price-to-earnings ratios divided by growth rate.
Cost of debt Interest expense for the year divided by average short- and long-term debtduring the year
Other control variablesBeta Computed with CAPM over the past five yearsTurn Stock turnover ratioVar The past-year’s monthly return variance of a stockRett−1 The average monthly return over the past yearCFR Cash flow rights: computed as the total percentage of cash flow ownership
by officers and directorsCFR2 Squared cash flow rightsVR Voting rights: computed as the total percentage of votes owned by officers
and directors across classesV R2 Squared voting rightsRate S&P credit rating: AAA-rated bonds receive a value of 22 and D-rated
bonds receive a value of oneInsider ownership Fraction of shares owned officers and directorsR&D/Sales The ratio of R&D over salesAd expenditures dummy It equals 1 if the advertisement expenditures are greater than 0, and 0 otherwiseM/B Market to book ratioCapex/Assets Capital expenditures over total assetsLog Asset Log of the book value of total assetsMarket cap Market price times number of outstanding sharesLeverage All debt over market value of total assetsAge The number of years since a firms first appearance in CRSPExternal financing The difference between required investment and internally available capital
for investmentAssetintangible (1 − PPE + Inventories)/TotalAssetsSales growth rate Average annual sales growth over past 3 yearsDelaware incorporation It equals 1 if the firm is incorporated in Delaware, and 0 otherwiseROA Net income over book value of total assets
23
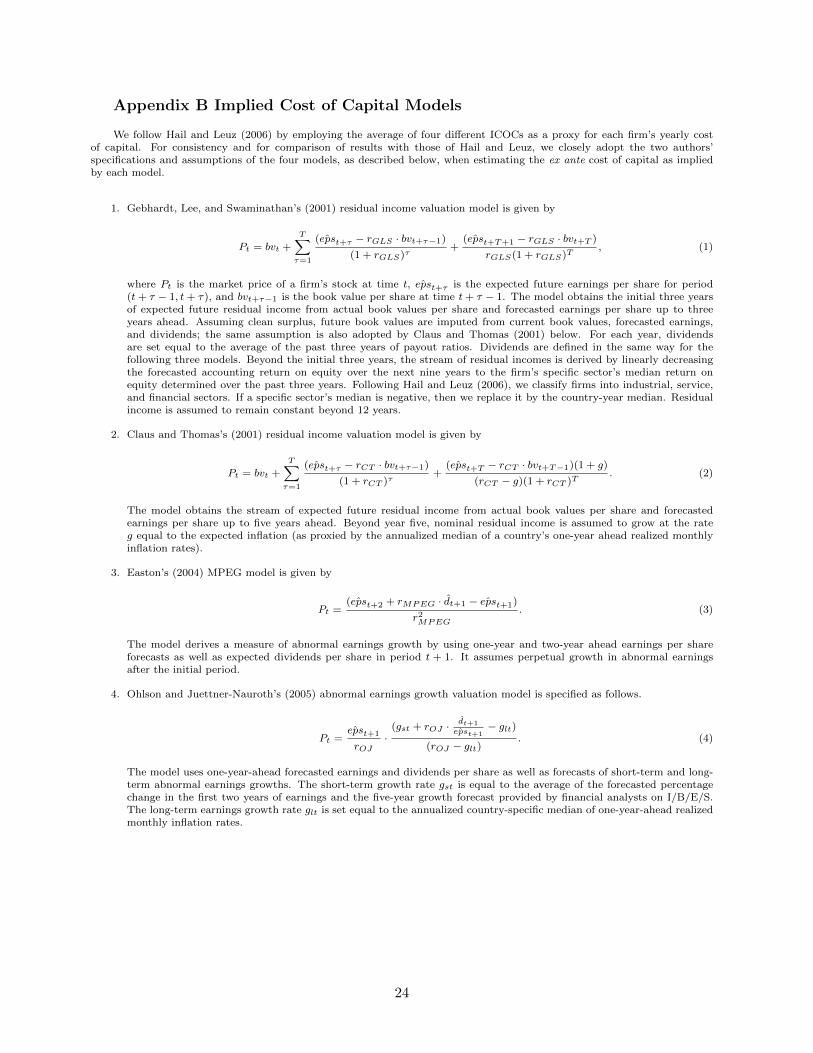
Appendix B Implied Cost of Capital Models
We follow Hail and Leuz (2006) by employing the average of four different ICOCs as a proxy for each firm’s yearly costof capital. For consistency and for comparison of results with those of Hail and Leuz, we closely adopt the two authors’specifications and assumptions of the four models, as described below, when estimating the ex ante cost of capital as impliedby each model.
1. Gebhardt, Lee, and Swaminathan’s (2001) residual income valuation model is given by
Pt = bvt +
T∑τ=1
( ˆepst+τ − rGLS · bvt+τ−1)
(1 + rGLS)τ+
( ˆepst+T+1 − rGLS · bvt+T )
rGLS(1 + rGLS)T, (1)
where Pt is the market price of a firm’s stock at time t, ˆepst+τ is the expected future earnings per share for period(t+ τ − 1, t+ τ), and bvt+τ−1 is the book value per share at time t+ τ − 1. The model obtains the initial three yearsof expected future residual income from actual book values per share and forecasted earnings per share up to threeyears ahead. Assuming clean surplus, future book values are imputed from current book values, forecasted earnings,and dividends; the same assumption is also adopted by Claus and Thomas (2001) below. For each year, dividendsare set equal to the average of the past three years of payout ratios. Dividends are defined in the same way for thefollowing three models. Beyond the initial three years, the stream of residual incomes is derived by linearly decreasingthe forecasted accounting return on equity over the next nine years to the firm’s specific sector’s median return onequity determined over the past three years. Following Hail and Leuz (2006), we classify firms into industrial, service,and financial sectors. If a specific sector’s median is negative, then we replace it by the country-year median. Residualincome is assumed to remain constant beyond 12 years.
2. Claus and Thomas’s (2001) residual income valuation model is given by
Pt = bvt +T∑τ=1
( ˆepst+τ − rCT · bvt+τ−1)
(1 + rCT )τ+
( ˆepst+T − rCT · bvt+T−1)(1 + g)
(rCT − g)(1 + rCT )T. (2)
The model obtains the stream of expected future residual income from actual book values per share and forecastedearnings per share up to five years ahead. Beyond year five, nominal residual income is assumed to grow at the rateg equal to the expected inflation (as proxied by the annualized median of a country’s one-year ahead realized monthlyinflation rates).
3. Easton’s (2004) MPEG model is given by
Pt =( ˆepst+2 + rMPEG · d̂t+1 − ˆepst+1)
r2MPEG
. (3)
The model derives a measure of abnormal earnings growth by using one-year and two-year ahead earnings per shareforecasts as well as expected dividends per share in period t + 1. It assumes perpetual growth in abnormal earningsafter the initial period.
4. Ohlson and Juettner-Nauroth’s (2005) abnormal earnings growth valuation model is specified as follows.
Pt =ˆepst+1
rOJ·
(gst + rOJ · d̂t+1
ˆepst+1− glt)
(rOJ − glt). (4)
The model uses one-year-ahead forecasted earnings and dividends per share as well as forecasts of short-term and long-term abnormal earnings growths. The short-term growth rate gst is equal to the average of the forecasted percentagechange in the first two years of earnings and the five-year growth forecast provided by financial analysts on I/B/E/S.The long-term earnings growth rate glt is set equal to the annualized country-specific median of one-year-ahead realizedmonthly inflation rates.
24

Tab
le1
Dis
trib
uti
on
of
Corp
ora
teG
overn
ance
This
table
show
sth
euniv
ari
ate
dis
trib
uti
on
of
corp
ora
tegov
ernance
for
dual-
class
firm
sand
single
-cla
ssfirm
s.P
anel
Apro
vid
esth
edis
trib
uti
on
of
the
poole
dsa
mple
.P
anel
Bpro
vid
esth
edis
trib
uti
on
of
the
matc
hed
sam
ple
.T
he
table
pre
sents
mea
ns
and
med
ians
of
gov
ernance
indic
esand
att
ribute
s.P−
valu
esoft−
test
sfo
rth
em
eans
of
diff
eren
ces
andp−
valu
esof
Wilco
xon
rank-s
um
test
for
the
med
ians
of
diff
eren
ces
are
show
nin
the
pare
nth
eses
ben
eath
the
diff
eren
ces.
TSI
isth
ep
erce
nta
ge
of
non-m
issi
ng
takeo
ver
att
ribute
sth
at
afirm
sati
sfies
.B
SI
isth
ep
erce
nta
ge
of
sati
sfied
board
-rel
ate
datt
ribute
sto
non-m
issi
ng
board
-rel
ate
datt
ribute
s.T
Iis
the
per
centa
ge
of
all
the
non-m
issi
ng
corp
ora
tegov
ernance
att
ribute
s(i
ncl
udin
gta
keo
ver
att
ribute
sand
board
-rel
ate
datt
ribute
s)th
at
the
firm
sati
sfies
.***,
**
and
*den
ote
stati
stic
al
signifi
cance
at
the
level
of
1%
,5%
and
10%
,re
spec
tivel
y.
PanelA
Distribution
ofPooled
Sample
Du
al
class
Sin
gle
class
Sep
ara
tion
Du
al-
Sin
gle
Sep
ara
tion
-Sin
gle
Mea
nM
edia
nM
ean
Med
ian
Mea
nM
edia
nM
ean
Med
ian
Mea
nM
edia
nT
SI
0.7
90.8
00.5
90.6
00.8
71.0
00.2
0***
0.2
0***
0.2
8***
0.4
0***
(0.0
0)
(0.0
0)
(0.0
0)
(0.0
0)
BS
I0.6
10.6
00.7
00.7
10.6
10.6
0-0
.09***
-0.1
1***
-0.0
9***
-0.1
1***
(0.0
0)
(0.0
0)
(0.0
0)
(0.0
0)
TI
0.7
20.7
30.6
40.6
40.7
60.7
50.0
8***
0.0
9***
0.1
2***
0.1
1***
(0.0
0)
(0.0
0)
(0.0
0)
(0.0
0)
Call
spec
ial
mee
tin
g0.6
91.0
00.5
71.0
00.7
81.0
00.1
20.0
00.2
10.0
0
Act
by
wri
tten
con
sent
0.7
11.0
00.5
91.0
00.7
71.0
00.1
30.0
00.1
90.0
0
No
pois
on
pill
0.7
61.0
00.3
90.0
00.8
61.0
00.3
71.0
00.4
71.0
0
No
stagger
edb
oard
0.5
91.0
00.3
80.0
00.6
81.0
00.2
11.0
00.3
01.0
0
Cu
mu
lati
ve
voti
ng
rights
0.8
41.0
00.8
31.0
00.8
41.0
00.0
10.0
00.0
20.0
0
All
att
end
more
than
75%
of
board
mee
tin
gs
0.5
81.0
00.5
31.0
00.5
71.0
00.0
60.0
00.0
50.0
0
CE
Ose
rves
2or
few
erou
tsid
eb
oard
s0.6
01.0
00.5
01.0
00.5
91.0
00.0
90.0
00.0
90.0
0
Ou
tsid
ed
irec
tor>
50%
0.3
30.0
00.4
70.0
00.3
20.0
0-0
.14
0.0
0-0
.15
0.0
0
5<
Board
size<
16
0.6
91.0
00.5
81.0
00.6
61.0
00.1
10.0
00.0
80.0
0
Nom
inati
ng
com
pose
dso
lely
of
ou
tsid
er0.1
00.0
00.2
30.0
00.1
20.0
0-0
.13
0.0
0-0
.12
0.0
0
Ch
air
man
an
dC
EO
are
sep
ara
ted
0.1
90.0
00.1
40.0
00.1
70.0
00.0
50.0
00.0
30.0
0
Com
pen
sati
on
com
pose
dso
lely
of
ou
tsid
er0.3
30.0
00.3
90.0
00.3
00.0
0-0
.06
0.0
0-0
.08
0.0
0
Nu
mb
erof
ob
serv
ati
on
s1,4
52
1,4
52
19,8
02
19,8
02
534
534
25
PanelB
Distribution
ofM
atched
Sample D
ual
class
Sin
gle
class
Diff
eren
ceM
ean
Med
ian
Mea
nM
edia
nM
ean
Med
ian
TS
I0.8
10.8
00.6
30.6
00.1
8***
0.2
0***
(0.0
0)
(0.0
0)
BS
I0.6
10.6
00.7
10.7
1-0
.10***
-0.1
1***
(0.0
0)
(0.0
0)
TI
0.7
40.7
40.6
70.6
70.0
7***
0.0
7***
(0.0
0)
(0.0
0)
Call
spec
ial
mee
tin
g0.8
01.0
00.6
61.0
00.1
30.0
0
Act
by
wri
tten
con
sent
0.8
01.0
00.6
61.0
00.1
50.0
0
No
pois
on
pill
0.8
51.0
00.5
00.0
00.3
61.0
0
No
stagger
edb
oard
0.6
71.0
00.4
40.0
00.2
21.0
0
Cu
mu
lati
ve
voti
ng
rights
0.9
41.0
00.9
11.0
00.0
40.0
0
All
att
end
more
than
75%
of
board
mee
tin
g0.5
81.0
00.4
80.0
00.1
01.0
0
CE
Ose
rves
2or
few
erou
tsid
eb
oard
s0.5
91.0
00.5
00.0
00.0
91.0
0
Ou
tsid
ed
irec
tor>
50%
0.3
00.0
00.4
10.0
0-0
.11
0.0
0
5<
board
size<
16
0.6
91.0
00.5
31.0
00.1
60.0
0
Nom
inati
ng
com
pose
dso
lely
of
ou
tsid
er0.1
00.0
00.2
30.0
0-0
.13
0.0
0
Ch
air
man
an
dC
EO
are
sep
ara
ted
0.1
70.0
00.1
50.0
00.0
20.0
0
Com
pen
sati
on
com
pose
dso
lely
of
ou
tsid
er0.3
20.0
00.3
80.0
0-0
.06
0.0
0
Nu
mb
erof
ob
serv
ati
on
s1,0
70
1,0
70
1,0
70
1,0
17
26

Table 2 Probit Regressions on Individual Governance Attributes
This table shows the results of probit regressions on individual corporate governance attributes. The dependent
variable is a dummy variable indicating if a company is a dual-class firm. The dummy variable takes the value of 1 if
it is a dual-class firm, and 0 otherwise. The independent variables are governance attribute dummy variables, which
indicate whether a firm meets the threshold level for certain corporate governance standards. Variable definitions
are given in the Appendix. P−values are shown in the parentheses. We drop firms in utilities or financial industries
and control for year and Fama-French industry fixed effects in all the regressions. ***, ** and * denote statistical
significance at the level of 1%, 5% and 10%, respectively.
27

1 2Takeover attributesCall special meeting 0.213*** 0.296***
(0.000) (0.009)Act by written consent 0.285*** 0.478***
(0.000) (0.000)No poison pill 0.691*** 0.588***
(0.000) (0.000)No staggered board 0.308*** 0.312***
(0.000) (0.001)Cumulative voting rights 0.197** 0.506***
(0.031) (0.000)Board-related attributesAll attend more than 75% of board meetings -0.139** 0.028
(0.025) (0.812)CEO serves 2 or fewer outside boards 0.065 -0.227
(0.587) (0.335)Outside director>50% -0.426*** -0.403***
(0.000) (0.000)5<Board size<16 0.448*** 0.182
(0.000) 0.386Nominating composed solely of outsider -0.315*** -0.214*
(0.000) (0.059)Chairman and CEO are separated -0.062 -0.105
(0.276) (0.278)Compensation composed solely of outsider -0.010 -0.178**
(0.866) (0.050)Control variablesIPOname 0.252*** 0.025
(0.000) 0.808Media 0.686*** 3.329***
(0.000) (0.000)StateLaw -0.004 -0.004
0.819 0.885SalesRank 0.009*** 0.020***
(0.000) (0.000)ProfitRank 0.002** 0.005**
(0.020) (0.028)%Firms -0.074*** -0.055
(0.005) (0.262)%Sales 0.023 0.026
(0.148) (0.351)Sales/RegionSales -0.021*** -0.073***
(0.000) (0.000)Insider ownership 0.618***
(0.004)R&D/Sales -0.005*
(0.083)Ad expenditures dummy 0.339***
(0.001)M/B -0.001
(0.715)Capex/Assets 2.952***
(0.002)Log Asset 0.041
(0.400)Market cap -0.045**
(0.023)Leverage 0.037
(0.885)Age 0.029***
(0.000)External financing -0.002
0.287Assetintangible 1.603***
(0.000)Sales growth rate 0.105
(0.261)
Industry Yes YesYear Yes Yes
Intercept -6.578*** -12.076***(0.000) (0.000)
Number of Obs. 10,337 4,651
28
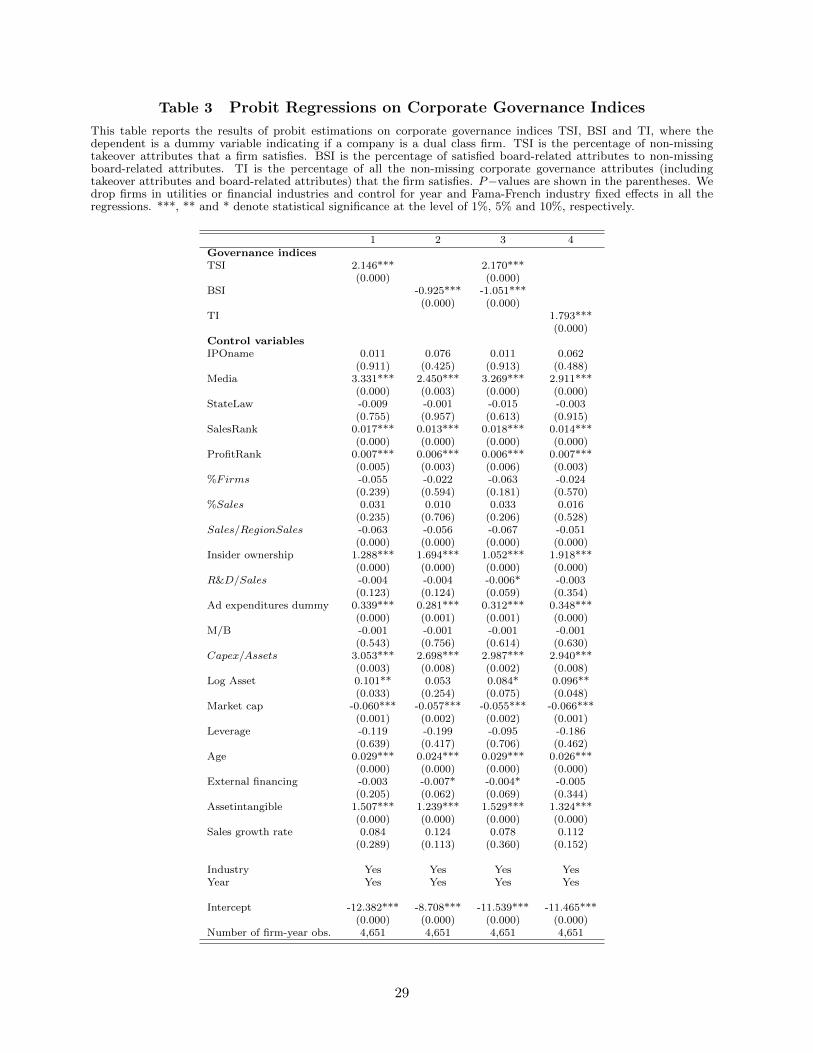
Table 3 Probit Regressions on Corporate Governance Indices
This table reports the results of probit estimations on corporate governance indices TSI, BSI and TI, where thedependent is a dummy variable indicating if a company is a dual class firm. TSI is the percentage of non-missingtakeover attributes that a firm satisfies. BSI is the percentage of satisfied board-related attributes to non-missingboard-related attributes. TI is the percentage of all the non-missing corporate governance attributes (includingtakeover attributes and board-related attributes) that the firm satisfies. P−values are shown in the parentheses. Wedrop firms in utilities or financial industries and control for year and Fama-French industry fixed effects in all theregressions. ***, ** and * denote statistical significance at the level of 1%, 5% and 10%, respectively.
1 2 3 4Governance indicesTSI 2.146*** 2.170***
(0.000) (0.000)BSI -0.925*** -1.051***
(0.000) (0.000)TI 1.793***
(0.000)Control variablesIPOname 0.011 0.076 0.011 0.062
(0.911) (0.425) (0.913) (0.488)Media 3.331*** 2.450*** 3.269*** 2.911***
(0.000) (0.003) (0.000) (0.000)StateLaw -0.009 -0.001 -0.015 -0.003
(0.755) (0.957) (0.613) (0.915)SalesRank 0.017*** 0.013*** 0.018*** 0.014***
(0.000) (0.000) (0.000) (0.000)ProfitRank 0.007*** 0.006*** 0.006*** 0.007***
(0.005) (0.003) (0.006) (0.003)%Firms -0.055 -0.022 -0.063 -0.024
(0.239) (0.594) (0.181) (0.570)%Sales 0.031 0.010 0.033 0.016
(0.235) (0.706) (0.206) (0.528)Sales/RegionSales -0.063 -0.056 -0.067 -0.051
(0.000) (0.000) (0.000) (0.000)Insider ownership 1.288*** 1.694*** 1.052*** 1.918***
(0.000) (0.000) (0.000) (0.000)R&D/Sales -0.004 -0.004 -0.006* -0.003
(0.123) (0.124) (0.059) (0.354)Ad expenditures dummy 0.339*** 0.281*** 0.312*** 0.348***
(0.000) (0.001) (0.001) (0.000)M/B -0.001 -0.001 -0.001 -0.001
(0.543) (0.756) (0.614) (0.630)Capex/Assets 3.053*** 2.698*** 2.987*** 2.940***
(0.003) (0.008) (0.002) (0.008)Log Asset 0.101** 0.053 0.084* 0.096**
(0.033) (0.254) (0.075) (0.048)Market cap -0.060*** -0.057*** -0.055*** -0.066***
(0.001) (0.002) (0.002) (0.001)Leverage -0.119 -0.199 -0.095 -0.186
(0.639) (0.417) (0.706) (0.462)Age 0.029*** 0.024*** 0.029*** 0.026***
(0.000) (0.000) (0.000) (0.000)External financing -0.003 -0.007* -0.004* -0.005
(0.205) (0.062) (0.069) (0.344)Assetintangible 1.507*** 1.239*** 1.529*** 1.324***
(0.000) (0.000) (0.000) (0.000)Sales growth rate 0.084 0.124 0.078 0.112
(0.289) (0.113) (0.360) (0.152)
Industry Yes Yes Yes YesYear Yes Yes Yes Yes
Intercept -12.382*** -8.708*** -11.539*** -11.465***(0.000) (0.000) (0.000) (0.000)
Number of firm-year obs. 4,651 4,651 4,651 4,651
29

Table 4 Distribution of Firm Values in Different Portfolios
This table shows the distribution of industry-adjusted Tobins, industry-adjusted ln Q, and inverse industry-adjustedQ across different portfolios. The portfolios are created based on TSI and voting rights, TSI and cash flow rights,BSI and voting rights, and BSI and cash flow rights, respectively. The table provide both means and medians. Thep−values of t−test for means and p−values of Wilcoxon rank-sum test for medians are shown in parentheses beneaththe means and medians. ***, ** and * denote statistical significance at the level of 1%, 5% and 10%, respectively.
Panel A Portfolios Created on TSI and Voting Rights
TSI Voting rights Industry-adjusted Q Industry-adjusted LnQ −[1/Q− 1/(industryQ)]mean median N mean median N mean median N
1 1 0.112 0.000 169 0.004 0.000 169 -0.027 0.000 169(0.181) (0.898) (0.920) (0.633) (0.192) (0.344)
1 2 0.199** -0.004 168 0.049 -0.004 168 0.001 -0.003 168(0.020) (0.387) (0.180) (0.563) (0.943) (0.881)
1 3 0.384*** 0.049*** 165 0.104*** 0.039** 165 0.017 0.029 165(0.000) (0.004) (0.007) (0.016) (0.420) (0.133)
2 1 0.256** 0.020 108 0.058 0.017 108 -0.009 0.012 108(0.027) (0.270) (0.226) (0.486) (0.752) (0.869)
2 2 0.128 -0.033 107 -0.016 -0.028 107 -0.053** -0.024 107(0.236) (0.402) (0.704) (0.234) (0.039) (0.106)
2 3 0.394*** 0.068*** 105 0.142*** 0.0477** 105 0.049** 0.0370* 105(0.000) (0.008) (0.001) (0.015) (0.037) (0.058)
3 1 0.365*** 0.112*** 166 0.132*** 0.062*** 166 0.0422** 0.043*** 166(0.000) (0.000) (0.000) (0.000) (0.018) (0.009)
3 2 0.227*** -0.021* 174 0.060 -0.018 174 -0.006 -0.013 174(0.005) (0.055) (0.109) (0.231) (0.802) (0.914)
3 3 0.273*** 0.030** 178 0.079*** 0.022** 178 0.015 0.017 178(0.000) (0.012) (0.010) (0.050) (0.382) (0.266)
Panel B Portfolio Created on TSI and Cash Flow Rights
TSI Cash flow rights Industry-adjusted Q Industry-adjusted LnQ −[1/Q− 1/(industryQ)]mean median N mean median N mean median N
1 1 0.128* 0.000 171 0.018 0.000 171 -0.023 0.000 171(0.060) (0.655) (0.581) (0.949) (0.237) (0.416)
1 2 0.171* -0.001 171 0.021 -0.001 171 -0.017 -0.001 171(0.082) (0.869) (0.601) (0.963) (0.453) (0.632)
1 3 0.387*** 0.035*** 165 0.113*** 0.031** 165 0.029 0.027* 165(0.000) (0.004) (0.002) (0.011) (0.123) (0.082)
2 1 0.058 -0.084 115 -0.024 -0.049 115 -0.054** -0.038* 115(0.473) (0.606) (0.556) (0.324) (0.036) (0.073)
2 2 0.506*** 0.111** 98 0.142** 0.0711** 98 0.032 0.049* 98(0.001) (0.016) (0.011) (0.030) (0.274) (0.073)
2 3 0.249*** 0.000 108 0.077** 0.000 108 0.014 0.000 108(0.003) (0.224) (0.040) (0.339) (0.542) (0.699)
3 1 0.257*** 0.000*** 162 0.080*** 0.000** 162 0.013 0.000 162(0.000) (0.003) (0.005) (0.027) (0.441) (0.355)
3 2 0.418*** 0.029*** 176 0.120*** 0.021** 176 0.025 0.016 176(0.000) (0.002) (0.003) (0.015) (0.262) (0.175)
3 3 0.285*** 0.066*** 182 0.094*** 0.043** 182 0.020 0.027 182(0.000) (0.002) (0.003) (0.020) (0.281) (0.249)
30

Panel C Portfolios Created on BSI and Voting Rights
BSI Voting rights Industry-adjusted Q Industry-adjusted LnQ −[1/Q− 1/(industryQ)]mean median N mean median N mean median N
1 1 -0.009 -0.056* 186 -0.039 -0.041** 186 -0.046*** -0.030*** 186(0.864) (0.085) (0.161) (0.039) (0.009) (0.007)
1 2 0.195*** -0.039 192 0.039 -0.038 192 -0.020 -0.027 192(0.002) (0.171) (0.172) (0.732) (0.271) (0.311)
1 3 0.304*** 0.0211** 191 0.080*** 0.018* 191 0.009 0.016 191(0.000) (0.018) (0.008) (0.085) (0.579) (0.556)
2 1 0.260*** 0.019** 153 0.089** 0.010* 153 0.027 0.006 153(0.002) (0.017) (0.010) (0.056) (0.164) (0.227)
2 2 0.187** 0.000 149 0.044 0.000 149 -0.011 0.000 149(0.032) (0.220) (0.303) (0.376) (0.674) (0.941)
2 3 0.329*** 0.039** 151 0.103*** 0.029** 151 0.033 0.019* 151(0.001) (0.011) (0.005) (0.018) (0.105) (0.061)
3 1 0.297*** 0.070** 105 0.078* 0.030* 105 0.004 0.017 105(0.005) (0.024) (0.095) (0.082) (0.887) (0.293)
3 2 0.667*** 0.186*** 109 0.207*** 0.102*** 109 0.062** 0.052** 109(0.000) (0.000) (0.000) (0.001) (0.020) (0.014)
3 3 0.310*** 0.081** 104 0.096* 0.052* 104 0.017 0.037 104(0.006) (0.022) (0.057) (0.065) (0.547) (0.264)
Panel D Portfolio Created on BSI and Cash Flow Rights
BSI Cash flow rights Industry-adjusted Q Industry-adjusted LnQ −[1/Q− 1/(industryQ)]mean median N mean median N mean median N
1 1 -0.036 -0.114*** 189 -0.067** -0.090*** 189 -0.075*** -0.061*** 189(0.475) (0.010) (0.014) (0.001) (0.000) (0.000)
1 2 0.382*** 0.034*** 190 0.104*** 0.026** 190 0.020 0.016 190(0.000) (0.005) (0.002) (0.031) (0.268) (0.218)
1 3 0.238*** 0.008** 197 0.069** 0.006 197 0.007 0.004 197(0.000) (0.030) (0.011) (0.128) (0.653) (0.739)
2 1 0.151* -0.002 158 0.024 -0.002 158 -0.017 -0.001 158(0.077) (0.680) (0.505) (0.894) (0.406) (0.404)
2 2 0.216*** 0.028** 145 0.085** 0.021** 145 0.029 0.011 145(0.006) (0.027) (0.030) (0.046) (0.249) (0.107)
2 3 0.408*** 0.060*** 152 0.125*** 0.047*** 152 0.034 0.028* 152(0.000) (0.001) (0.002) (0.006) (0.116) (0.059)
3 1 0.209** 0.021* 104 0.053 0.017 104 -0.004 0.013 104(0.021) (0.084) (0.219) (0.192) (0.881) (0.543)
3 2 0.242** 0.000 109 0.042 0.000 109 -0.019 0.000 109(0.044) (0.246) (0.418) (0.505) (0.520) (0.956)
3 3 0.839*** 0.232*** 104 0.291*** 0.136*** 104 0.109*** 0.079*** 104(0.000) (0.000) (0.000) (0.000) (0.000) (0.000)
31

Table 5 OLS Estimations of Firm Value on Corporate Governance
This table provides OLS estimations of firm value: industry-adjusted Q, industry-adjusted LnQ and inverse ofindustry-adjusted Q. We use the same control variables as those in Bebchuk, Cohen, and Ferrell (2008). The indicatorvariable High TSI equals 1 if a dual class firm falls in rank 3 (highest TSI) based on TSI, and 0 otherwise. Theindicator variable Low BSI equals 1 if dual class firms are in rank 1 (lowest BSI) based on BSI, and 0 otherwise.HighTSI × LowBSI is an interaction variable of High TSI and Low BSI. P−values are shown in the parentheses.We drop firms in utilities or financial industries and control for year and Fama-French industry fixed effects in all theregressions. ***, ** and * denote statistical significance at the level of 1%, 5% and 10%, respectively.
Industry-adjusted Q Industry-adjusted LnQ −[1/Q− 1/(industryQ)]1 2 3
High TSI -0.131 -0.052 -0.015(0.459) (0.509) (0.761)
Low BSI -0.689*** -0.309*** -0.169***(0.005) (0.002) (0.004)
HighTSI × LowBSI 0.587* 0.344** 0.233**(0.084) (0.018) (0.011)
Log Asset 0.151* 0.051 0.018(0.058) 0.171 0.459
Age -0.594*** -0.259*** -0.144***(0.003) (0.002) (0.002)
Delaware incorporation 0.061 0.005 -0.015(0.842) (0.973) (0.853)
Insider ownership 0.014 0.293 0.244(0.993) (0.568) (0.422)
Insider ownership2 0.277 -0.229 -0.244(0.870) (0.690) (0.484)
ROA 0.671* 0.226 0.101(0.074) (0.120) (0.209)
Capex/Assets 1.216 0.776* 0.582**(0.266) (0.059) (0.018)
Leverage -2.012*** -0.868*** -0.465***(0.001) (0.001) (0.008)
R&D/Sales 0.425*** 0.187*** 0.092**(0.006) (0.006) (0.018)
Industry Yes Yes YesYear Yes Yes Yes
Intercept 2.635*** 1.022*** 0.498***(0.000) (0.001) (0.009)
Number of Obs. 342 342 342
R2 53.00% 55.73% 49.96%
32

Table 6 OLS Estimations of Implied Cost of Capital (ICOC) in Dual-Class Firms
This table provides OLS estimations of implied cost of capital, which is computed as the present value of expectedfuture cash flows to the current stock price. The proxies of implied cost of capital are Gebhardt, Lee, and Swaminathan(2001) (GLS) residual income valuation and Hail and Leuz (2006) (HL) measure computed as the average of fourdifferent ICOC estimates. The dependent variables of Models 1, 2 and 3 are GLS, and the dependent variables ofModels 4, 5 and 6 are HL. P−values are shown in the parentheses. We drop firms in utilities or financial industriesand control for year and Fama-French industry fixed effects in all the regressions. ***, ** and * denote statisticalsignificance at the level of 1%, 5% and 10%, respectively.
Panel A Regressions of ICOC on TSI and BSI
GLS HL1 2 3 4 5 6
TSI -0.030** -0.030** -0.017* -0.017*(0.011) (0.011) (0.055) (0.056)
BSI -0.007 -0.006 -0.004 -0.003(0.575) (0.610) (0.731) (0.765)
CFR 0.121** 0.103** 0.117** 0.023 0.012 0.020(0.012) (0.037) (0.013) (0.483) (0.721) (0.528)
CFR2 -0.078 -0.079 -0.074 0.001 0.013 0.003(0.215) (0.216) (0.232) (0.981) (0.766) (0.940)
VR -0.061* -0.048 -0.060* -0.003 -0.012 -0.002(0.073) (0.212) (0.075) (0.936) (0.700) (0.943)
V R2 0.036 0.025 0.036 -0.006 0.001 -0.006(0.221) (0.451) (0.221) (0.836) (0.965) (0.837)
Log Asset 0.013*** 0.010** 0.013*** -0.006 -0.006 -0.006(0.001) (0.036) (0.001) (0.174) (0.130) (0.168)
Log Age 0.011* 0.003 0.011* 0.002 0.000 0.002(0.061) (0.712) (0.061) (0.779) (0.992) (0.789)
Insider ownership 0.010 0.006 0.010 0.0278* 0.025* 0.028*(0.316) (0.526) (0.330) (0.052) (0.071) (0.053)
ROE 0.011*** 0.013*** 0.011*** 0.003 0.004* 0.003(0.001) (0.001) (0.001) (0.181) (0.093) (0.158)
Leverage -0.006 0.033 -0.005 0.089*** 0.090*** 0.089***(0.807) (0.110) (0.824) (0.002) (0.000) (0.002)
R&D/Sales 0.147*** 0.148*** 0.147*** -0.062* -0.048 -0.063*(0.000) (0.000) (0.000) (0.096) (0.143) (0.094)
M/B -0.002 -0.002 -0.002 -0.001 -0.001 -0.001(0.274) (0.249) (0.272) (0.281) (0.242) (0.278)
Market cap -0.003*** -0.002** -0.003*** 0.000 0.000 0.000(0.004) (0.021) (0.004) (0.590) (0.833) (0.616)
Sales growth rate 0.014** 0.007 0.014** -0.002 0.010 -0.003(0.031) (0.342) (0.034) (0.823) (0.305) (0.808)
Beta 0.001 -0.001 0.001 -0.001 -0.002 -0.001(0.907) (0.887) (0.902) (0.865) (0.606) (0.876)
Turn -0.002 -0.004 -0.002 0.004** 0.003** 0.004**(0.246) (0.130) (0.254) (0.011) (0.010) (0.010)
Var 0.350 0.254 0.348 0.123 0.102 0.122(0.114) (0.330) (0.116) (0.239) (0.276) (0.244)
Rett−1 -0.025 -0.116 -0.026 -0.084* -0.130** -0.085*(0.664) (0.126) (0.654) (0.056) (0.012) (0.054)
Industry Yes Yes Yes Yes Yes YesYear Yes Yes Yes Yes Yes Yes
Intercept -0.039 0.008 -0.034 0.083*** 0.091*** 0.086***(0.158) (0.815) (0.241) (0.001) (0.000) (0.001)
Number of Obs. 3,076 3,210 3,076 2,968 3,102 2,968
R2 84.86% 80.39% 84.88% 60.86% 62.16% 60.88%
33

Panel B Regressions of ICOC on TSI and individual BSI provisions
GLS HL1 2
TSI -0.026** -0.015*(0.020) (0.088)
All attend more than 75% -0.008 -0.005(0.106) (0.215)
CEO serves less or equal 2 outside boards 0.001 0.005(0.895) (0.333)
Outside director>50% -0.001 0.000(0.792) (0.953)
5<Board size<16 -0.005 0.005(0.807) (0.544)
Nominating composed solely of outsider 0.005 0.010**(0.366) (0.016)
Chairman and CEO are separated -0.002 0.000(0.714) (0.945)
Compensation composed solely of outsider 0.004 -0.001(0.336) (0.792)
CFR 0.124*** 0.017(0.007) (0.597)
CFR2 -0.078 0.009(0.189) (0.832)
VR -0.063* 0.003(0.066) (0.918)
V R2 0.037 -0.011(0.215) (0.660)
Log Asset 0.011*** -0.007*(0.005) (0.092)
Log Age 0.012** 0.002(0.039) (0.802)
Insider ownership 0.008 0.027*(0.390) (0.057)
ROE 0.012*** 0.004*(0.001) (0.088)
Leverage -0.001 0.091***(0.949) (0.002)
R&D/Sales 0.147*** -0.063*(0.000) (0.095)
M/B -0.002 -0.001(0.190) (0.207)
Market cap -0.003 0.000(0.009) (0.656)
Sales growth rate 0.016** -0.002(0.027) (0.846)
Beta 0.001 -0.001(0.925) (0.795)
Turn -0.002 0.004***(0.291) (0.007)
Var 0.339 0.103(0.135) (0.299)
Rett−1 -0.026 -0.079*(0.636) (0.062)
Industry Yes YesYear Yes Yes
Intercept -0.029 0.081***(0.299) (0.003)
Number of Obs. 3,076 2,968
R2 85.15% 62.13%
34

Table 7 OLS Estimations of Cost of Debt in Dual-Class Firms
This table provides OLS estimations of cost of debt, which is computed as interest expense for the year divided byaverage short- and long-term debt during the year. P−values are shown in the parentheses. We drop firms in utilitiesor financial industries and control for year and Fama-French industry fixed effects in all the regressions. ***, ** and* denote statistical significance at the level of 1%, 5% and 10%, respectively.
Panel A Regressions of Cost of Debt on TSI and BSI
Cost of Debt1 2 3
TSI -0.020* -0.022*(0.073) (0.068)
BSI -0.020 -0.026(0.216) (0.119)
CFR 0.027 0.096* 0.060(0.547) (0.097) (0.439)
CFR2 0.002 -0.051 -0.010(0.960) (0.472) (0.908)
VR 0.058* 0.047 0.038(0.054) (0.175) (0.355)
V R2 -0.056** -0.053* -0.046(0.047) (0.071) (0.192)
Log Asset 0.013* 0.019** 0.020**(0.068) (0.012) (0.014)
ROA -0.011 0.000 0.013(0.795) (0.997) (0.771)
Capex/Assets 0.001 0.096 0.050(0.993) (0.407) (0.643)
Leverage 0.212*** 0.224*** 0.223***(0.000) (0.000) (0.001)
R&D/Sales 0.035 0.007** 0.122(0.532) (0.021) (0.335)
M/B -0.001 0.000 -0.001(0.289) (0.677) (0.280)
Market cap -0.001 -0.001 -0.002(0.329) (0.153) (0.109)
Assetintangible -0.056 -0.018 -0.078(0.164) (0.638) (0.157)
Sales growth rate 0.005 0.001 -0.004(0.774) (0.980) (0.923)
Rate -0.007*** -0.007*** -0.008***(0.000) (0.007) (0.002)
Industry Yes Yes YesYear Yes Yes Yes
Intercept 0.036 -0.043 0.011(0.516) (0.455) (0.885)
Number of Obs. 2,322 1,893 1,739
R2 76.31% 76.08% 75.56%
35

Panel B Regressions of Cost of Debt on TSI and Individual BSI Provisions
Cost of DebtTSI -0.028**
(0.016)All attend more than 75% -0.018
(0.168)CEO serves less or equal 2 outside boards -0.003
(0.661)Outside director>50% -0.007*
(0.100)5<Board size<16 0.024
(0.105)Nominating composed solely of outsider 0.011*
(0.077)Chairman and CEO are separated -0.012**
(0.012)Compensation composed solely of outsider -0.006
(0.253)CFR 0.023
(0.569)CFR2 0.002
(0.955)VR 0.064**
(0.035)V R2 -0.060**
(0.031)Log Asset 0.007
(0.320)ROA 0.002
(0.962)Capex/Assets -0.138
(0.179)Leverage 0.201***
(0.000)R&D/Sales 0.041
(0.438)M/B -0.002
(0.171)Market cap 0.000
(0.710)Assetintangible -0.063
(0.101)Sales growth rate 0.009
(0.548)Rate -0.007***
(0.000)
Industry YesYear Yes
Intercept 0.105**(0.039)
Number of Obs. 2,322
R2 77.71%
36

Table 8 Changes of Corporate Governance Around Unification
This table tabulates the change of corporate governance around unifications. Panel A shows the 3-yearaverage corporate governance before unification and 3-year average corporate governance after it. Panel Bshows the 5-year average corporate governance before unification and 5-year average corporate governanceafter it. Medians are shown in parentheses beneath the means. Column 3 shows the difference betweenthem. Column 4 provides the p−value of t−test for means of difference and p−value of Wilcoxon rank-sumtest for medians of differences (in brackets beneath the p−values for the means of differences). Appendixincludes the detailed description of all the variables. ***, ** and * denote statistical significance at the levelof 1%, 5% and 10%, respectively.
Panel A Event Window (−3,+3)
1 2 3Before(-3) After(+3) After-Before
Mean Median Mean Median Mean MedianTSI 0.79 0.80 0.63 0.60 -0.16*** -0.20***
(0.00) (0.00)BSI 0.60 0.60 0.69 0.71 0.09*** 0.11***
(0.00) (0.00)TI 0.69 0.70 0.66 0.67 -0.02 -0.03
(0.17) (0.23)Call special meeting 0.68 1.00 0.51 1.00 -0.17 0.00
Act by written consent 0.64 1.00 0.53 1.00 -0.12 0.00
No poison pill 0.73 1.00 0.53 1.00 -0.20 0.00
No staggered board 0.59 1.00 0.46 0.00 -0.13 -1.00
Cumulative voting rights 0.81 1.00 0.79 1.00 -0.01 0.00
All attend more than 75% 0.70 1.00 0.55 1.00 -0.15 0.00
CEO serves less or equal 2 outside boards 0.75 1.00 0.66 1.00 -0.09 0.00
Outside director>50% 0.39 0.00 0.45 0.00 0.06 0.00
5<board size<16 0.84 1.00 0.69 1.00 -0.15 0.00
Nominating composed solely of outsider 0.05 0.00 0.28 0.00 0.23 0.00
Chairman and CEO are separated 0.27 0.00 0.18 0.00 -0.09 0.00
Compensation composed solely of outsider 0.39 0.00 0.45 0.00 0.06 0.00
Number of Obs. 219 219 268 268
37

Panel B Event Window (−5 + 5)
1 2 3Before(-5) After(+5) After-Before
Mean Median Mean Median Mean MedianTSI 0.80 0.80 0.62 0.60 -0.18*** -0.20***
(0.00) (0.00)BSI 0.58 0.60 0.70 0.71 0.12*** 0.11***
(0.00) (0.00)TI 0.68 0.67 0.66 0.67 -0.02 0.00
(0.28) (0.45)Call special meeting 0.69 1.00 0.51 1.00 -0.18 0.00
Act by written consent 0.66 1.00 0.52 1.00 -0.13 0.00
No poison pill 0.73 1.00 0.54 1.00 -0.20 0.00
No staggered board 0.57 1.00 0.45 0.00 -0.12 -1.00
Cumulative voting rights 0.79 1.00 0.81 1.00 0.02 0.00
All attend more than 75% 0.73 1.00 0.55 1.00 -0.18 0.00
CEO serves less or equal 2 outside boards 0.70 1.00 0.65 1.00 -0.05 0.00
Outside director>50% 0.37 0.00 0.45 0.00 0.08 0.00
5<board size<16 0.86 1.00 0.66 1.00 -0.20 0.00
Nominating composed solely of outsider 0.04 0.00 0.29 0.00 0.25 0.00
Chairman and CEO are separated 0.27 0.00 0.19 0.00 -0.08 0.00
Compensation composed solely of outsider 0.33 0.00 0.46 0.00 0.13 0.00
Number of Obs. 426 426 486 486
38