corporate financing options in india: …iibf.org.in/documents/iibf macro research report_banking vs...
TRANSCRIPT

INDIAN INSTITUTE OF BANKING & FINANCE
MACRO RESEARCH REPORT (2015-16)
ON
CORPORATE FINANCING OPTIONS IN INDIA:
BANKING VS. CAPITAL MARKETS
DECEMBER 2016
SHRI BIBEKANANDA PANDA
Chief Manager (Economist)
State Bank of India
State Bank Staff College, Hyderabad
DR. AJAYA KUMAR PANDA
Assistant Professor
(Accounting & Finance)
National Institute of Industrial
Engineering, Mumbai

Corporate Financing Options in India: Banking vs. Capital Markets
I
Table of Contents
List of Tables ........................................................................................................................... IV
List of Figures ........................................................................................................................... V
List of Abbreviations ............................................................................................................. VII
Acknowledgement ................................................................................................................... IX
Executive Summary ................................................................................................................... 1
Recommendations ...................................................................................................................... 4
CHAPTER I
Introduction, Motivation, Objectives and Scope of the Study ................................................... 7
1.1 Introduction ...................................................................................................................... 7
1.2 Motivation and Scope of the Study .................................................................................. 7
1.3 Objectives of the Study .................................................................................................... 9
CHAPTER II
An Overview of Corporate Financing Pattern in India ............................................................ 10
2.1 Introduction .................................................................................................................... 10
2.2 Leverage Ratio of Indian Corporate .............................................................................. 13
2.3 Capital Market Financing in India ................................................................................. 16
2.3.1 Secondary Equity Market Financing in India ......................................................... 17
2.3.2 Primary Equity Market Financing in India ............................................................. 18
2.3.3 Corporate Bond Financing in India......................................................................... 19
2.3.4 Financing through American/Global Depository Receipts (ADR/GDR) ............... 29
2.3.5 Borrowings through External Commercial Borrowings (ECB) .............................. 30
2.3.6 Borrowings through Foreign Direct and Institutional Investment (FDI/FII) .......... 31
2.3.7 Financing through Private Equity (PE) ................................................................... 31
2.3.8 Financing through Financial Derivatives ................................................................ 32
2.3.9 Financing via Money Market Instruments .............................................................. 32
2.3.10 Commercial Banks Dominate External Debt Financing ....................................... 34
2.4 Financial Disintermediation in India ............................................................................. 35
2.4.1 Change in Financial Savings and Investment Patterns of Households ................... 37
CHAPTER III
Theoretical Framework & Literature Review .......................................................................... 39
3.1 Introduction .................................................................................................................... 39
3.2 Guiding Principles of Capital Structure ......................................................................... 39
3.3 Factors Influencing Capital Structure Decisions ........................................................... 40
3.3.1 Characteristic of the Economy ................................................................................ 40

Corporate Financing Options in India: Banking vs. Capital Markets
II
3.3.2 Characteristics of the Industry ................................................................................ 41
3.3.3 Characteristics of the Firm ...................................................................................... 42
3.4 Review of Capital Structure Theories ............................................................................ 43
3.4.1 Net Income Approach ............................................................................................. 43
3.4.2 Net Operating Income Approach ............................................................................ 44
3.4.3 Traditional Approach .............................................................................................. 45
3.4.4 Modigliani-Miller Approach ................................................................................... 45
3.4.5 Relaxing the Taxes and Capital Structure Condition .............................................. 47
3.4.6 Merton Miller Argument......................................................................................... 48
3.4.7 Trade-off Theory ..................................................................................................... 49
3.4.8 Static Trade-off Theory........................................................................................... 49
3.4.9 Dynamic Trade-off Theory ..................................................................................... 50
3.4.10 Pecking Order Theory ........................................................................................... 50
3.4.11 Signalling Theory.................................................................................................. 51
3.4.12 Market Timing Theory .......................................................................................... 52
3.4.13 Free Cash Flow Theory ......................................................................................... 52
3.4.14 Bankruptcy Cost.................................................................................................... 52
3.4.15 Agency Cost .......................................................................................................... 53
3.5 Sources of Finance for Corporate .................................................................................. 54
3.5.1 Sources of Finance by Time ................................................................................... 54
3.5.2 Sources of Finance by Ownership and Control ...................................................... 56
3.5.3 Sources of Finance by Generation of Funding ....................................................... 56
3.6 Review of Literatures ..................................................................................................... 57
3.6.1Global Experience .................................................................................................... 57
3.6.2 Indian Experience ................................................................................................... 66
CHAPTER IV
Research Methodology and Description of Data ..................................................................... 73
4.1 Objective 1: Financial Disintermediation and its Impact on Banks’ Performance ........ 73
4.1.1 Data Sources ........................................................................................................... 76
4.1.2 Statistical Tools used for Analysis .......................................................................... 76
4.1.3 Methodology for Bank Credit and Deposit Intermediation Indices ........................ 76
4.1.4 Capital Market Disintermediation Indices .............................................................. 77
4.1.5 Regression Analysis to Measure the Impact of Disintermediation on Banks’
Performance and Profitability .......................................................................................... 78
4.2 Objective 2: The Dynamic and Equilibrium Relationship between Corporate Health
and External Financing ........................................................................................................ 79
4.2.1 Altman Z score ........................................................................................................ 80

Corporate Financing Options in India: Banking vs. Capital Markets
III
4.2.2 Tobin’s Q Model ..................................................................................................... 81
4.2.3 Nature and Sources of Data .................................................................................... 82
4.2.4 Data Definitions and Sources.................................................................................. 83
4.2.5 Statistical Models .................................................................................................... 90
4.2.6 Methodology of the Study ...................................................................................... 91
4.3 Objective 3: Dynamics of financial health on corporate balance sheet and its Impact on
Banks’ financing and Net Interest Margin ........................................................................... 93
4.3.1 Statistical Models .................................................................................................... 94
CHAPTER V
Empirical Results & Interpretation .......................................................................................... 96
5.1 Objective 1: Financial Disintermediation and its Impact on Banks’ Performance and
Profitability .......................................................................................................................... 96
5.1.1 Impact of Disintermediation on Banks’ Performance and Profitability ............... 100
5.1.2 Disintermediation and the Bank Performance: A Correlation .............................. 103
5.1.3 Regression Result: Impact of Financial Disintermediation on Banks’ NIM ........ 104
5.1.4 Regression Result: Impact of Financial Disintermediation on Banks’ ROA ....... 107
5.2 Objective 2: The Dynamic and Equilibrium Relationship between Corporate Health
and External Financing ...................................................................................................... 109
5.3 Objective 3: Dynamics of Financial Health on Corporate Balance Sheet and its Impact
on Bank financing and NIM .............................................................................................. 113
5.4 Objective 4: The Financing Preferences of Indian Corporate Across Business Cycles
(Primary Research Survey) ................................................................................................ 117
CHAPTER VI
Conclusions ............................................................................................................................ 128
6.1 Financial Disintermediation and its Impact on Banks’ Performance and Profitability128
6.2 The dynamic and equilibrium relationship between corporate health and external
financing ............................................................................................................................ 130
6.3 Dynamics of financial health on corporate balance sheet and its Impact on bank
financing and Net Interest Margin (NIM) .......................................................................... 131
6.4 Financing preferences of Indian corporate across business cycle (Primary Survey) ... 132
Bibliography .......................................................................................................................... 135

Corporate Financing Options in India: Banking vs. Capital Markets
IV
List of Tables
Table 1: Average of Sources of Funds by Non-Government Non-Financial Public Limited
Companies................................................................................................................................ 12
Table 2: Share of Long Term Borrowings to Total Borrowings for Companies as per
Leverage Class ......................................................................................................................... 15
Table 3: Corporate Bond Issuances in India ............................................................................ 20
Table 4: Rating-wise Decomposition of Indian Corporate Bonds (Amount in Rs. Crore) ...... 24
Table 5: Foreign Investment Inflows to India ($ Billion) ........................................................ 30
Table 6: Data Definitions & Sources ....................................................................................... 84
Table 7: Correlation Matrix (2000-01 to 2014-15) ................................................................ 103
Table 8: Regression Result: Financial Disintermediation and Banks’ NIM.......................... 105
Table 9: Regression Result: Financial Disintermediation and Banks’ ROA ......................... 108
Table 10: Estimated Results of Model 1 & 2: Corporate Health vs. External Financing ...... 110
Table 11: Estimated Results of Model 3 & 4: Corporate Health vs. External Financing ...... 111
Table 12: Estimated Results of Model 5 & 6: Corporate Health vs. External Financing ...... 112
Table 13: Estimated Results of Model 7 & 8: Dynamics of financial health on corporate
balance sheet .......................................................................................................................... 113
Table 14: Estimated Results of Model 9, 10 & 11: Dynamics of financial health on corporate
balance sheet .......................................................................................................................... 114
Table 15: Estimated Results of Model 12, 13 & 14: Dynamics of financial health on Banks’
financing and Net Interest Margin (NIM) .............................................................................. 116

Corporate Financing Options in India: Banking vs. Capital Markets
V
List of Figures
Figure 1: Internal vs. External Sources of Finance by Indian NGNF Companies ................... 10
Figure 2: Leverage Ratio of selected NGNF public limited companies .................................. 13
Figure 3: Leverage Ratio: by sales........................................................................................... 13
Figure 4: Corporate Interest Coverage Ratio by Country ........................................................ 14
Figure 5: Industry Wise Leverage Ratio of Selected NGNF Public Limited Companies ....... 15
Figure 6: Development of Capital Market (Secondary Market) in India................................. 17
Figure 7: Resources Mobilised from the Primary Market in India (by Issuer type) ................ 18
Figure 8: Resources Mobilized through Primary Market (Rs. Billion) ................................... 19
Figure 9: Resources Mobilized in Private Placement Market (Rs. Billion) ............................ 19
Figure 10: Size of the Corporate Bond Market (as % GDP): March 2016 .............................. 22
Figure 11: Share in India’s Debt market Outstanding (August 2016) ..................................... 22
Figure 12: Institutional Investment in Indian Corporate Bond Market ................................... 23
Figure 13: Net Outstanding Amount (Rs. In Crores) in Indian Corporate Bond Market ........ 23
Figure 14: Size of Corporate Bond Market (% of GDP) - March 2016 .................................. 23
Figure 15: Rating-wise trading of Corporate Bonds in the secondary Market (% of total
trading; Avg. of last six years) ................................................................................................. 25
Figure 16: Sector-wise trading of Corporate Bonds in the secondary Market (% of total
trading; Avg. of last six years) ................................................................................................. 25
Figure 17: Commercial Paper (CP) Outstanding (Rs. Billion) ................................................ 33
Figure 18: Commercial Deposit (CD) Outstanding (Rs. Billion) ............................................ 33
Figure 19: Flow of Resources from Banks and Non-bank Sources to Commercial Sector ..... 34
Figure 20: Household Savings to Gross Domestic Savings (Percentage) .............................. 37
Figure 21: Household Investment in Financial and Physical Assets (Percentage) .................. 38
Figure 22: Credit & Deposit Growth of ASCB (Y-o-Y %) ..................................................... 96
Figure 23: Credit Intermediation Index ................................................................................... 98
Figure 24: Deposit Intermediation Index ................................................................................. 98
Figure 25: Deposit Disintermediation Index (BDD Index) for Banks ..................................... 98
Figure 26: Deposit Disintermediation Index (FDD Index) for Financial Intermediaries ........ 98
Figure 27: Loan Disintermediation Index (BLD Index) for Banks ....................................... 100
Corporate Financing Options in India: Banking vs. Capital Markets
VI
Figure 28: Loan Deposit Disintermediation Index (FLD Index) for Financial Intermediaries
................................................................................................................................................ 100
Figure 29:Interest and Non-Interest Income .......................................................................... 101
Figure 30: Interest and Non-Interest Income growth ............................................................. 101
Figure 31: Credit to Deposit Ratio ......................................................................................... 102
Figure 32: NIM vs. Credit Disintermediation Index .............................................................. 104
Figure 33: NIM vs. Deposit Disintermediation Index ........................................................... 104
Figure 34: ROA vs. Credit Disintermediation Index ............................................................. 107
Figure 35: ROA vs. Deposit Disintermediation Index........................................................... 107
Figure 36: My Organization Prefers Equity Financing over Debt ........................................ 117
Figure 37: My Organisation Prefers Borrowing from Bank to Corporate Bond Market ....... 119
Figure 38: Corporate Prefer Bank credit in India as the alternative funding options are not
popular/available .................................................................................................................... 119
Figure 39: My Organisation prefers to raise funds from Capital Market rather than Banks . 120
Figure 40: Important factors for a borrower while deciding the source of finance ............... 121
Figure 41: Interest rate is an important factor borrowers look into while borrowing ............ 121
Figure 42: Borrowers find the due diligence process by banks easier than the information and
screening required by capital market regulators .................................................................... 122
Figure 43: Due diligence process of banks is cumbersome for new/small borrowers ........... 122
Figure 44: Additional support services by the banks in addition to financing attracts
borrowers ............................................................................................................................... 123
Figure 45:Banks prefer Large Corporate to Small ones for lending ...................................... 124
Figure 46:Corporate with weak balance sheet &ulterior motives prefer to raise funds from
capital market to banks .......................................................................................................... 125
Figure 47:Corporate having weak financial condition prefers to raise funds through which
mode ....................................................................................................................................... 125
Figure 48:Development of Equity Market (including Bond Market) would help Corporate to
bypass the Bank route for their financial requirements ......................................................... 125
Figure 49:Major obstacles in the development of Corporate Bond Market in India ............. 126
Figure 50: Implementation of SDR/CDR and Bankruptcy and Insolvency code will
discourage Corporate borrowing from Banks ........................................................................ 127

Corporate Financing Options in India: Banking vs. Capital Markets
VII
List of Abbreviations
ADR American Depository Receipts
ASCB All Schedule Commercial Banks
AT1 Additional Tier-1
ATR Asset Turnover Ratio
BRICS Brazil Russia India China and South Africa
BSE Bombay Stock Exchange
CAGR Compound Annual Growth Rate
CBLO Collateralized Borrowing and Lending Obligations
CCIL Clearing Corporation of India Ltd.
CCP Central Counter Party
CD Certificates of Deposit
C-D Credit to Deposit
CDR Current Debt Ratio
CDS Credit Default Swap
CDSL Central Depository Services Limited
CFCR Cash Flow Coverage Ratio
CP Commercial Paper
CRISIL Credit Rating Information Services of India Limited
EBIT Earnings Before Interest and Tax
EBITDA Earnings Before Interest, Taxes, Depreciation and Amortization
ECB External Commercial Borrowings
EV Enterprise Value
FDI Foreign Direct Investment
FII Foreign Institutional Investment
FPI Foreign Portfolio Investment
FY Financial Year
GDP Gross Domestic Product
GDR Global Depository Receipts
GoI Government of India
GR Good Ratio
G-sec Government Securities
HDFC Housing Development Finance Corporation
HTM Held to Maturity
ICR Interest Coverage Ratio
ICSE Inter-Connected Stock Exchange
I-D Investment to Deposit
IFC International Finance Corporation
IMF International Monetary Fund
INR Indian Rupee
IPO Initial Public Offerings
Corporate Financing Options in India: Banking vs. Capital Markets
VIII
IPO Initial Public Offer
LAF Liquidity Adjustment Facility
LIBOR London Interbank Offered Rate
LIC Life Insurance Corporation
MCAP Market Capitalization
ME Market Value of Equity
MM Modigliani-Miller
MTM Mark to Market
NBFC Non-Banking Financial Corporations
NCAER National Council of Applied Economic Research
NGNF Non-Government Non-Financial Public Limited
NIM Net Interest Margin
NSDL National Securities Depository Limited
NSE National Stock Exchange
NYU New York University
PCE Partial Credit Enhancement
PE Private Equity
RBI Reserve Bank of India
RE Retained Earnings
REIT Real Estate Investment Trusts
ROA Return on Asset
ROCE Return on Capital Employed
RRB Regional Rural Bank
SB Size of Bank
SEBI Security and Exchange Board of India
SENSEX Stock Exchange Sensitive Index
SLR Statutory Liquidity Ratio
SME Small and Medium Enterprise
SPV Special Purpose Vehicle
TA Total Assets
USD US Dollar
VS Versus
VWAP Volume-Weighted Average Price
WC Working Capital
YoY Year on Year

Corporate Financing Options in India: Banking vs. Capital Markets
IX
ACKNOWLEDGEMENT
We would like to thank the Indian Institute of Banking and Finance (IIBF) for
providing us the opportunity to undertake this Study. We sincerely thank the eminent
Research Advisory Committee (RAC) experts of the Institute for their valuable feedbacks.
We would also like to thank Dr J. N. Mishra, Chief Executive Officer, IIBF for his kind
support.
We appreciate and acknowledge with deep gratitude the unrelenting support from K.
Lakshmi, Manager (Research), SBI and Maniraj Sreenivasan, AVP (Sales & Distribution),
SBI General Insurance for their guidance and support in conducting the Primary Research
Survey. It is our honour to thank the respondents (Directors & Top Executives of Corporate),
who has shared their valuable time to make the Primary Research Survey a success.
We would like to convey our gratitude to Prof. (Ms.) Karuna Jain, Director, National
Institute of Industrial Engineering (NITIE) for her guidance and continuous academic and
institutional support. We acknowledge the valuable suggestions of Prof. V.K Singh and Prof.
K.S. Ranjani, the faculty members of Accounting and Finance Department, NITIE.
Moreover, we cannot forget the endless support from NITIE library and extend our
appreciation to all the library staff.
Our sincere thanks to State Bank of India, especially Strategic Training Unit (STU)
Department and State Bank Staff College, Hyderabad for permitting and encouraging us to
undertake this Study. We express our heartfelt gratitude to Shri S. Mohan, General Manager
& Principal and Shri Bijay Kumar Toppo, DGM (PD&A), State Bank Staff College, for their
support and guidance at every stage of the Study. The invaluable comments, feedbacks and
suggestions from Research Officers at State Bank Staff College is deeply appreciated and
gratefully acknowledged.
Needless to say, the views expressed and the approach pursued in the Study solely
reflects the personal opinion of the authors.
Bibekananda Panda Dr. Ajaya Kumar Panda
December 12, 2016
Mumbai

Corporate Financing Options in India: Banking vs. Capital Markets
1
EXECUTIVE SUMMARY
Commercial Banks play an important role in the intermediation process because of their
overwhelming control over the entire financial assets of the economy and more so
because of the underdeveloped capital market in our country.
The advent of direct market financing techniques for large borrowers such as
securitization and institutionalization has led to the disintermediation of financial
institutions. Over the years, financial intermediaries (banks) have been sharing the pie in
financial intermediation business to capital markets.
It is important to have alternate sources of funding for the corporate sector, both to
finance growth and de-risk the balance sheet of the banks as also to strengthen balance
sheets of investors as well as issuers.
Economic liberalization helped cross border free capital movement. As a result, good
creditworthy borrowers are tapping cheap source of finance from domestic as well as
from international markets.
Total resources raised by the corporate sector have increased manifold as the Market
Capitalisation of the Indian stock markets in proportion of the GDP were only 12.2% in
1990-91 and have grown to the level of 103.0% in 2007-08 before moderating to 75.5%
of GDP in 2015-16 (BSE: 75.5%, NSE: 68.6%).
The financial disintermediation process does not necessarily lead banks to lose their
business. It opens many more opportunities for the existing players. The data on Indian
financial system shows that though disintermediation process kick-started in 1980s, the
impact of these newly developed institutions on bank credit is limited and the bank credit
still dominates the financing market.
With increasing need for formalization of the economy and privatization of its large
public sector, it is essential that capital needs to be effectively intermediated to increase
efficiency. With tight regulatory norms, balance sheet mismatch and rising bad debts,
Indian banks may not prefer to happily lend to long term projects, mainly to infrastructure
sector.
The RBI considers it desirable that large corporate groups should gradually start tapping
the corporate bonds and commercial paper markets for meeting at least a part of their
Corporate Financing Options in India: Banking vs. Capital Markets
2
financing needs. It proposes to encourage large borrowers to raise a certain portion of
their financing needs through the market mechanism.
Total leverage ratio of the firms moderated in 2014-15 to 66.3% after recording a jump in
the previous year. Larger corporate are having less leverage compared to smaller ones.
Leverage of small firms having sales less than Rs.1 billion, witnessed continuous increase
from 97.2% in 2012-13 to 128.3% in 2014-15. Large corporate (sales above Rs.10
billion) are having lower leverage ratio, below 60%.
IMF's latest financial stability report (October 2016) shows that leverage ratio (ICR) of
India's corporate sector appear to be a potent source of risk as the ratio has come down
from 6.7 in 2010 to 3.7 at present level, just above to Brazil (2.8).
In view of huge investment requirement for infrastructure sector, the presence of a well
developed corporate bond market assumes significance in India as the dominated
financial system is unlikely to fund such a high amount.
Compared to other economies, the size of the Corporate Bond market in India is small,
near to 17.8% of GDP, much lower than the countries like Korea, Malaysia, Singapore
and Hong Kong. It is mainly dominated by Government bonds that accounts for over 65%
of bond market capitalization and almost 35.0% of GDP.
Private placements dominate Indian Corporate Bond market. The public issuances which
were Rs.94.51 billion in 2010-11 had a significant rise to Rs.338 billion in 2015-16, a
CAGR of 29.0%. At the same time private placements increased from Rs.2,188 billion in
2010-11 to Rs.4,581 billion in the year 2015-16, a CAGR of 16.0%.
India’s Corporate debt market is dominated by financial institutions. Banking and
financial services accounted for 74% of all primary issues in FY15 whereas, non-financial
corporate accounted only for 19% of all outstanding issuance.
Net outstanding on Indian Corporate Bond market has grown considerably over the years
from Rs.7.9 trillion in March 2010 to Rs.20.2 trillion by March 2016, a CAGR of 17.0%
and is largely accessible to the top rated borrowers.
The disintermediation process that started in later half of the nineties got pronounced till
the sub-prime crisis. The capital market crash again weakened the disintermediation
process and banks regained their lost position in credit disbursement.
During the full studied period (2000-01 to 2014-15), a positive correlation between credit
disintermediation index and banks’ interest income and expenses is seen though not
significant.

Corporate Financing Options in India: Banking vs. Capital Markets
3
Regression analysis conducted to test the hypothesis whether disintermediation has
affected the profitability and performance of banks shows that the disintermediation has
not impacted the banks’ performance and profitability significantly.
The dynamic and equilibrium relationship study between corporate health and external
financing show that the increasing proportion of total borrowing out of enterprise value
has a significantly negative impact on financial health of the firm.
A higher equity financing out of total borrowing and a lower total borrowing out of its
enterprise value can boost corporate financial health provided the firms achieve a
significant net sales over their total asset, an ideal portion of long term asset financed by
debt and firms reinvesting back a significant amount of its retained earnings.
Excess current debt and more debt financing of long term asset would negatively impact
corporate health and hence, more investment may not add value under such
circumstances.
It is observed that among external financing parameters, bank borrowing to total
borrowing is negatively and significantly impacting the debt financing but positively
impacting current liability. We may infer that financing current liability through bank
borrowing may have positive impact on corporate balance sheet but financing long term
asset through bank borrowing may not be a good idea. The study does not suggest to
equity financing to monetize either current or non-current liability.
We have seen that when corporate go for more and more institution borrowing, i.e.
increasing debt financing, is expected to boost commercial banks’ return on assets. But if
corporate prefer more equity financing than debt, then banks profitability is negatively
impacted.
An excess of total corporate borrowing out of their enterprise value may have a negative
impact on banks’ profitability. Excess debt holding not only impacts corporate health, but
also impacts bank’s profitability negatively, and may make banking sector more
vulnerable.
The primary research survey result showed that corporate prefers equity over debt
financing. Between banks and capital markets, respondents opined in support of equity to
bank finance.
When respondents were asked to vote between borrowings from banks over corporate
bond market, majority voted in support of banks as development of Corporate Bond
market is still at its nascent stage.

Corporate Financing Options in India: Banking vs. Capital Markets
4
The over-dependence of corporate on banks for their funding requirement might be
caused by many factors including paucity of availability of other alternatives.
Development of equity as well as bond market is referred as the best solution that would
help the corporate to bypass the bank route for their financial requirements.
Recommendations
On the basis of the findings, the recommendations of the present study are;
As the firm’s financial health gets adversely affected by an increasing cost of borrowing,
during economic slowdown, regulator may opt for an easy monetary targeting for non-
financial sector of the economy so that the total cost of borrowings of those firms would
not cross a minimum threshold limit.
Secondly, the study finds a positive relationship between higher equity financing and
financial health. Then the question arises, why firms are not leveraging this opportunity
while India has a well regulated capital market. Some of the important questions in this
regard to be addressed by the regulators are; (1) Are institutional financing are easily
accessible than market based i.e. equity financing? (2) Are legal requirements for
institutional financing is user friendly than market based financing? (3) Are Indian non-
financial firms prefer to take a fairly certain calculated risk from institutional borrowing
than an uncertain risk from market borrowing? (4) Is it an institutional issue or Indian
firms are unwilling to migrate from conventional practices of borrowing to modern
market based practices of equity financing? The policy makers need to look upon these
issues to remove the bottlenecks in the system.
The study finds that excess current debt and more debt financing of long term asset may
push the firm into debt trap where additional investment may not add much value to the
firm. In such circumstances, the study recommends the Managers to prioritize their
working capital management and focus on debt ratio. Non-current liability should not be
substantial to the value of total asset and firms should avoid debt financing for long term
assets.
The study also observes that the commercial banks’ assets are highly correlated with firm
specific parameters. The policy makers should facilitate corporate to approach capital
market rather than banks’ for long term asset creation. Moreover, corporate are advised to
diversify their external financing from institutional borrowing to equity financing for

Corporate Financing Options in India: Banking vs. Capital Markets
5
better financial health. Diversifying corporate borrowing from bank based to equity based
will not adversely affect balance sheet of the domestic banking sector, rather an
appropriate equity financing will improve the corporate health and will intern stimulate
commercial banks’ asset base indirectly. Furthermore the coefficient of corporate
borrowing that is seen significant and negative while explaining total asset/liability of
scheduled commercial banks is a very strong signal for policy makers to focus the policy
attention on the above points.
This further justifies that diversified financing of the corporate will solve the dual
objective of better corporate and banks’ health and better asset management. This would
divert funding by banks to the other needy sectors.
The study observed that the over-dependence of corporate on banks for their funding
requirement is due to paucity of availability of other alternatives. Hence it is important to
penetrate on the alternative borrowing/capital raising avenues.
Development of equity as well as corporate bond market is seen as the best solution for
corporate to bypass the bank route for their long term financial requirements. It is
important to have alternate sources of funding for the corporate sector, both to finance
growth and de-risk the balance sheet of the banks as also to strengthen balance sheets of
investors as well as issuers.
The financial disintermediation process does not necessarily lead banks to lose their
business. It does open many more opportunities for the existing players. Hence banks and
capital market are advised to work together in addressing the securitization and risk-
sensitive bank capital requirement.
Banks are better in credit appraisal and securitization. Hence, with securitization, banks
certify borrowers’ credit quality and capital market finances the borrowers which will
reduce financial frictions. However, the development of the capital market lowers the cost
of bank equity capital and thus enables banks to raise the extra capital needed to take on
riskier loans that they would otherwise reject.
In view of huge investment requirement for infrastructure sector, the presence of a well
developed corporate bond market assumes significance in India as the dominated
financial system is unlikely to fund such a high amount. Hence, it is advised for a robust
corporate bond market in India as a substitute to bank financing.
The leverage ratio for India's corporate sector is at an alarming stage. Appropriate policy
needs to be implemented to reverse the trend and reduce the interest burden of corporate.

Corporate Financing Options in India: Banking vs. Capital Markets
6
As the development of capital market and other financing avenues are backed by large
international companies, banks need to consolidate and act as universal financial
institutions so that the pressure of competitions from the alternative channels can be
negated/ neutralized. Banks need to bring innovative products to meet rising customer
aspirations or needs, mainly by exploiting digital banking to help attract Gen-Y
customers.
As disintermediation process gets penetrate further, it would lead to loss of revenue from
interest income segment for banks. Hence the banks can strategically penetrate more
towards non-interest income business.
A larger and developed capital market helps the banking system to improve in screening
of borrowers, monitoring investments more efficiently, and signals risk elements through
information. With gradual development of the capital market, banks may attain the same
degree of protection against financial distress, and the same reputation-signaling effect,
with lower capital-to-asset ratios than those operating in smaller systems. The regulator
should consider both the sectors i.e., bank and capital market as complementary to each
other not competitive. It should facilitate the development of both the sectors
simultaneously and not one sector at the expense of the other. Together these can meet the
financing requirement of the economy with their best effort.

Corporate Financing Options in India: Banking vs. Capital Markets
7
CHAPTER I
Introduction, Motivation, Objectives and Scope of the Study
1.1 Introduction
The development strategies pursued in India since the Eighth Five Year Plan (1992-
97) has emphasized the role of private investment in the growth process of the economy. To
facilitate this process, financial sector reforms were initiated. This has resulted in about a
shift in corporate financing with fresh issues of capital becoming an important source of
funds, as against bank borrowing of the earlier periods.
Corporate investment is financed either by internal or external sources of funds.
Internal sources include accumulated profits, paid-up capital, reserves and surplus, and
provisions including depreciations. External sources of funds include, share capital and
premium, long-term borrowings through bonds/debentures and banking channel, short term
borrowings through bank borrowings, trade payables, other liabilities, capital raised through
equity markets, corporate bond markets, external commercial borrowings, foreign direct
investment, private equity etc. The external sources can again be classified as combination of
debt and equity. The relative share of each source in total sources of funds reveals the
importance attached to a particular source meeting corporate strategy and thus determines the
financing pattern.
Subprime meltdown of 2008 and subsequent debt issue in Europe, followed by
slowdown in both developing (lower middle income) and developed economies, have
significantly altered the financing sources to Indian corporate. Today, though liquidity
conditions and the capital market have recovered from multi year lows, anemic global
demand and weak outlook have compelled corporate to struggle in obtaining funds.
1.2 Motivation and Scope of the Study
Corporate investment is seen as a significant source of economic growth over the past
couple of decades. There has been tremendous growth in overall investment level in India,

Corporate Financing Options in India: Banking vs. Capital Markets
8
from less than 25.0% of GDP in 2000 to over 35.0% by 2006 and has moderated to 32.0% in
2015. A significant part of this investment drive has come from the corporate sector. Given
the linkage between investment levels and its impact on overall economic growth, corporate
financing and investment are crucial components of India’s future growth potential.
With increasing need for formalization of the economy and privatization of its large
public sector, it is essential that capital needs to be effectively intermediated to increase
efficiency. With tight regulatory norms, balance sheet mismatch and mounting bad debts,
banks are not happily lending to long term projects, mainly to infrastructure sector. With
Corporate Bonds playing a key role in intermediating debt capital efficiently between savers
and businesses; India needs to have deeper markets with larger issuances and trading of
Corporate Bonds. Large dependence of corporate on bank lending will remain a challenge to
India’s long term growth aspirations. With globalization and increased capital flows, bonds
can be effective tools of leveraging external capital flows in the most efficient manner.
Banks and capital markets have been viewed as competing sources of financing
(Jacklin and Bhattacharya 1988, Diamond 1997). This distinction suggests that one sector,
either banks or the capital market, develops at the expense of the other. Banks and capital
markets, rather than simply being competitors, are in fact complement to each other. Capital
market development lowers the cost of bank equity capital, and enables banks to raise extra
capital needed to take on loans that are riskier and would have been rejected. Banks have a
comparative advantage in assessing credit quality, granting and renewing bank loans should
provide positive signals to outside investors (Fama 1985), specially when the borrowing
firms do not have an established reputation. For this interconnectedness and mutual
dependency, efforts should be made to develop both the sectors side by side.
Bank-led financing of corporate has undergone a change post reforms of 1990s. The
new and alternative available sources have been welcomed by corporate India. Most
importantly, all these developments have prompted high net worth corporate to raise money
from the market. Continuous effort by the regulators to promote alternate avenues and asset
quality issue of banking sector has invited many research questions on the area. Though a lot
of works has been done in patches, this has analyzed the financial disintermediation process
in India and how the business cycle has impacted the corporate financing behavior. It has also
studied the impact of corporate health on Banks’ performance and profitability.

Corporate Financing Options in India: Banking vs. Capital Markets
9
1.3 Objectives of the Study
The proposed research primarily aims to study the corporate financing pattern in
Indian context. The study will examine the changing trend of financing pattern of Indian
corporate during pre and post economic crisis. The funds mobilised by corporate India
through equity and debt issuance is studied to capture the preferences of corporate at different
time periods. Development of alternate financing sources of corporate and their determinants
are also identified. Within this primary objective, the specific objectives of that study are as
follows:
1. To study the financial disintermediation process and its impact on banks’
performance and profitability
2. To study the dynamic and equilibrium relationship between corporate health and
external financing
3. To study the dynamics of financial health on corporate balance sheet and its
impact on banks’ financing and Net Interest Margin.
4. To study the financing preferences of Indian corporate across business cycle.
How/Why preferences for debts and equity financing have changed?
In view of the above, it is vital to revisit the corporate financing pattern in India and then
emerging trend. This study tries to explain the present financing pattern for corporate and
how the regulatory norms to develop alternate financing avenues have materialized, their
impact on traditional channels and the possible future outcome. The rest of the report is
organized as follows. Chapter 2 discusses about the development of the corporate financing
pattern in India, followed by a brief overview of the development of alternate channels of
finance and their success. Theoretical framework related to the study and the relevant
literatures are reviewed in Chapter 3. Relevant literatures on Indian and international context
are reviewed and the statistical techniques used in the study are explained in this chapter.
Description of the data and their sources are discussed in Chapter 4. Chapter 5 provides
details of empirical results. The primary survey results are also discussed in this chapter.
Chapter 6 concludes the study with possible suggestions and further scope of the study.
Corporate Financing Options in India: Banking vs. Capital Markets
10
CHAPTER II
An Overview of Corporate Financing Pattern in India
2.1 Introduction
Reserve Bank of India (RBI) defines internal sources of funds as; paid-up capital,
reserves and surplus, and provisions (including dividends). Nearly, 33.0% of corporate
financing for public and private limited companies in India comes from internal sources.
Even large firms in manufacturing and services sector get internal funding nearly 67.0% and
47.0%, respectively. However, the case is different for small and medium enterprises. These
firms often do not have significant savings and hence internal sources average only 10.0% of
total funds. Smaller firms face stronger credit constraints vis-à-vis their larger counterparts.
Private corporate investment as percentage of GDP in India has increased from 4.2% in
1980s to 16.0% in 2014-15. Similarly, share of private corporate sector in gross domestic
capital formation has increased from 19.1% in 1980s to nearly 42.0% in 2014-15.
June 2016 Financial Stability Report (RBI) has emphasized that “…bank credit is
closed to a section of borrowers exhibiting a strong network effect in their resource/capital
allocation decisions. As a result, lending to un-networked small borrowers seems much less
preferred. [3.xxii].
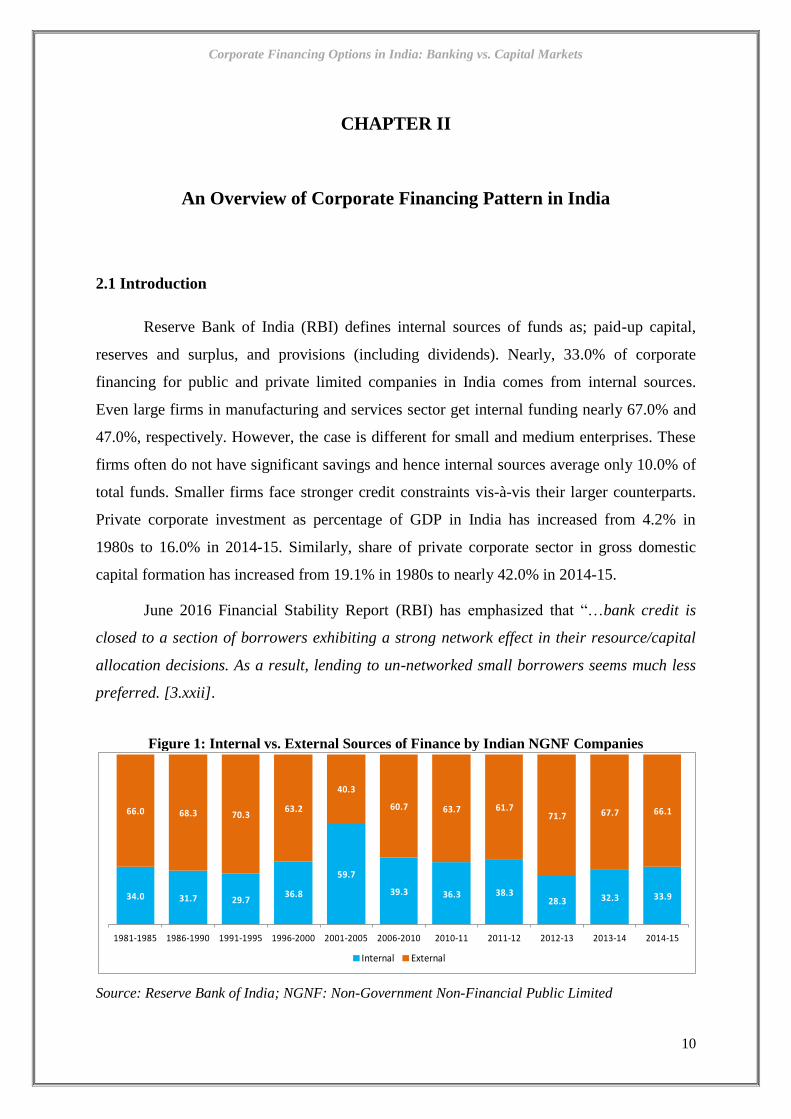
Figure 1: Internal vs. External Sources of Finance by Indian NGNF Companies
Source: Reserve Bank of India; NGNF: Non-Government Non-Financial Public Limited
34.0 31.7 29.736.8
59.7
39.3 36.3 38.328.3 32.3 33.9
66.0 68.3 70.363.2
40.3
60.7 63.7 61.771.7 67.7 66.1
1981-1985 1986-1990 1991-1995 1996-2000 2001-2005 2006-2010 2010-11 2011-12 2012-13 2013-14 2014-15
Internal External

Corporate Financing Options in India: Banking vs. Capital Markets
11
Banks led financing of corporate has undergone a change post reforms of 1990s. The
new and alternative available sources have been welcomed by many corporate. Most
importantly, all these developments have prompted high net worth corporate to raise money
from the market. Though the pie is shared with many new alternative avenues of finance, but
corporate still trust on the bank borrowings as the most important and dominant source of
finance.
Using the broad classification of sources of funds into internal and external, and
comparing their constituents’ share in total sources of funds show that internal sources of
funds contributed on an average comprise of one third of total sources of funds during 1980s
and 1990s. Though, firms relied more on internal source of finance during 2000-01 to 2004-
05, their reliance on external finance has been increasing since 2005-06. During 2008-09,
external sources contributed more than two-thirds of total sources of funds. The latest number
shows that the financing trend has remained more or less in the same order since 1980s. In
2014-15, internal sources funding was 33.9% compared to 66.1% by external sources. In
more detail, the internal funding pattern has seen an increasing trend in reserves and surplus
funding (8.5% in 1980-85 to 21.0% in 2014-15) and a decline in provisions (from 23.6% in
1981-85 to 7.7% in 2014-15). Paid-up capital ratio has remained almost stable.
Among external sources, the share of borrowing though has shared the pie with other
alternatives, but still dominates external sources of funding with 29.6% of share in 2014-15,
compared to 37.7% in 1980-85. The bank borrowings, that was contributing 12% of total
funding in 1981-85 has also moderated to 9.9% in 2014-15. Most of the corporate prefer to
raise long term capital as it constitutes nearly 26.0% of total borrowings and 39.0% of
external borrowings. Long term borrowings from banks that was nearly 19.3% in 2013-14
has come down drastically to 12.0% in 2014-15. This was substituted by capital raising
through bond market. The borrowings through bonds and debentures, has gone up from 2.3%
of total capital funding (3.4% of external sources of funding) in 2013-14 to 8.9% (13.5% of
external sources of funding) in 2014-15. This shows a gradual change in trend from bank
borrowings to bonds resources.

Corporate Financing Options in India: Banking vs. Capital Markets
12
Table 1: Average of Sources of Funds by Non-Government Non-Financial Public Limited
Companies
(per cent of total)
SOURCES OF
FUNDS
1981-
1985
1986-
1990
1991-
1995
1996-
2000
2001-
2005
2006-
2010
2010-
2011
2011-
2012
2012-
2013
2013-
2014
2014-
2015
Number of
Companies 1,745 1,957 1,835 1,897 2,083 3,180 3,485 18,255 1,628 18,255 16,923
INTERNAL
SOURCES 34.0 31.7 29.7 36.8 59.7 39.3 36.3 38.3 28.3 32.3 33.9
Paid-up capital 2.0 2.3 1.3 0.9 0.1 1.2 0.4 0.1 10.4 3.5 5.3
Reserves and
Surplus 8.5 5.1 12.0 13.4 9.7 24.5 22.5 21.5 12.5 17.0 21.0
Provisions 23.6 24.3 16.4 22.5 49.9 13.7 13.4 16.7 5.3 11.8 7.7
EXTERNAL
SOURCES 66.0 68.3 70.3 63.2 40.3 60.7 63.7 61.7 71.7 67.7 66.1
Paid-up capital 2.9 7.0 19.0 12.8 9.2 15.6 14.8 7.3
6.8* 16.5* 23.6* Net issues 2.0 2.8 4.4 4.3 4.2 1.5 2.6 3.9
Premium on shares 0.8 4.2 14.6 8.5 5.1 14.1 12.3 3.4
Capital receipt 0.3 0.3 0.1 0.3 0.6 0.3 0.1 0.1
Borrowings 37.7 37.8 32.9 35.1 10.6 27.3 25.2 25.8 42.6 40.2 29.6
Debentures 8.2 11.1 7.4 6.4 -1.0 1.5 2.7 2.3 4.6 2.3 8.9
Loans and
advances 22.6 24.4 24.6 27.3 11.7 25.2 22.5 22.9
From Banks 12.0 13.5 8.1 11.7 18.6 19.1 17.9 15.3 20.4@
15.0@
9.9@
From other
financial
institutions
7.9 7.4 10.2 9.7 -3.0 -0.4 0.8 0.0
From others 9.7 5.7 7.3 7.3 -4.0 7.1 3.7 8.2 14.9 3.7 6.4
Trade dues & other
current liabilities 24.9 23.3 18.3 15.0 19.8 17.5 23.6 28.1 9.9 7.4 6.6
TOTAL 100.0 100.0 100.0 100.0 100.0 100.0 100.0 100.0 100.0 100.0 100.0 Source: Flow of Funds Accounts of the Indian Economy: 2014-15, Aug 10, 2016; *: Share Capital and Premium,
@: Both long & Short term
The share of funds raised through external sources has declined during the last couple
of years. Composition of liabilities of the select companies was characterised by continuous
increase in the share of long term borrowings. Reserves and surplus also recorded
improvement in their share in 2014-15 after witnessing a decline in previous year. Of the
funds raised during 2014-15, there was preference for long term over short term borrowings.
Short term borrowings witnessed sharp decline in their share in 2014-15 over previous year.
This resulted in decline in share of funds raised through external sources. Among internal
sources, share of provisions (including depreciation provision) declined whereas that of
reserves and surplus improved on account of improved profits in 2014-15.
Corporate Financing Options in India: Banking vs. Capital Markets
13
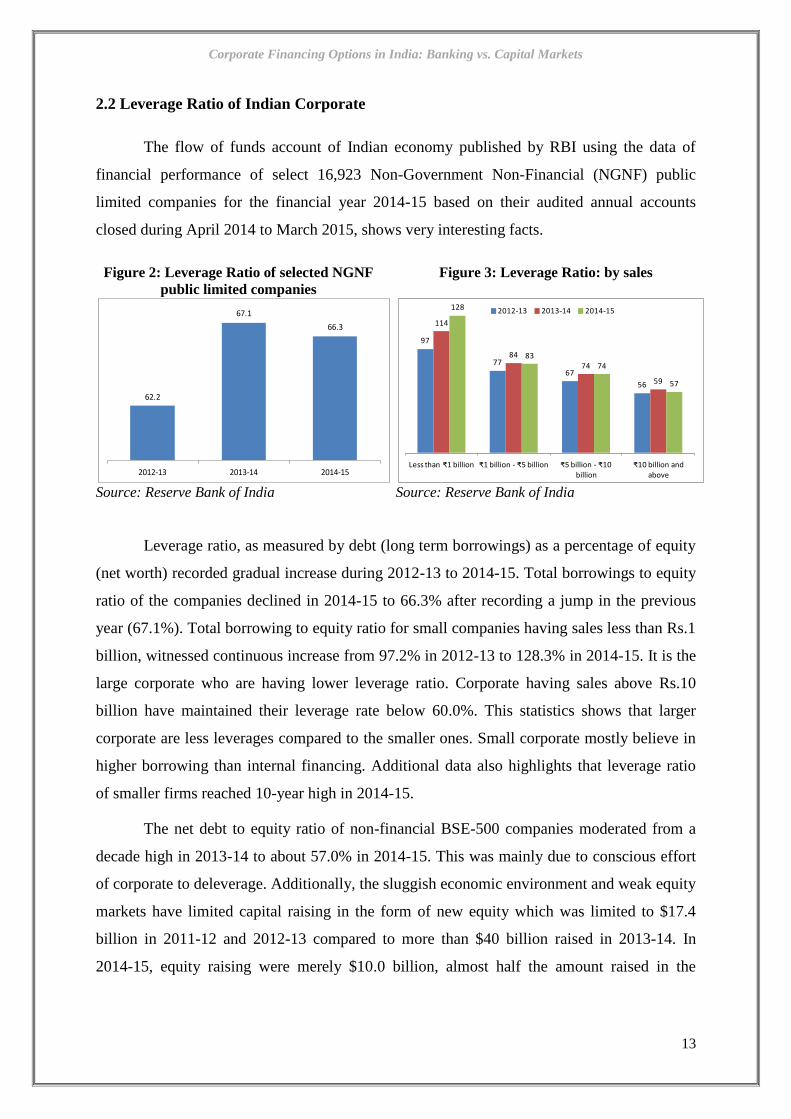
2.2 Leverage Ratio of Indian Corporate
The flow of funds account of Indian economy published by RBI using the data of
financial performance of select 16,923 Non-Government Non-Financial (NGNF) public
limited companies for the financial year 2014-15 based on their audited annual accounts
closed during April 2014 to March 2015, shows very interesting facts.
Figure 2: Leverage Ratio of selected NGNF
public limited companies
Figure 3: Leverage Ratio: by sales
Source: Reserve Bank of India Source: Reserve Bank of India
Leverage ratio, as measured by debt (long term borrowings) as a percentage of equity
(net worth) recorded gradual increase during 2012-13 to 2014-15. Total borrowings to equity
ratio of the companies declined in 2014-15 to 66.3% after recording a jump in the previous
year (67.1%). Total borrowing to equity ratio for small companies having sales less than Rs.1
billion, witnessed continuous increase from 97.2% in 2012-13 to 128.3% in 2014-15. It is the
large corporate who are having lower leverage ratio. Corporate having sales above Rs.10
billion have maintained their leverage rate below 60.0%. This statistics shows that larger
corporate are less leverages compared to the smaller ones. Small corporate mostly believe in
higher borrowing than internal financing. Additional data also highlights that leverage ratio
of smaller firms reached 10-year high in 2014-15.
The net debt to equity ratio of non-financial BSE-500 companies moderated from a
decade high in 2013-14 to about 57.0% in 2014-15. This was mainly due to conscious effort
of corporate to deleverage. Additionally, the sluggish economic environment and weak equity
markets have limited capital raising in the form of new equity which was limited to $17.4
billion in 2011-12 and 2012-13 compared to more than $40 billion raised in 2013-14. In
2014-15, equity raising were merely $10.0 billion, almost half the amount raised in the
62.2
67.1
66.3
2012-13 2013-14 2014-15
97
77
67
56
114
84
74
59
128
8374
57
Less than ₹1 billion ₹1 billion - ₹5 billion ₹5 billion - ₹10 billion
₹10 billion and above
2012-13 2013-14 2014-15

Corporate Financing Options in India: Banking vs. Capital Markets
14
previous up-cycle. It was observed that many corporate indulged in selling their assets to
slash the leverage.
The interest coverage ratio (ICR) is a measure of a company's ability to meet its
interest payments. Interest coverage ratio is equal to earnings before interest and taxes
(EBITDA) for a time period, divided by interest expenses for the same time period. The
interest coverage ratio is a measure of, the number of times a company could make the
interest payments on its debt with its EBITDA. It determines how easily a company can pay
interest expenses on outstanding debt. Theoretically, the lower the interest coverage ratio, the
higher the company's debt burden and the greater the possibility of bankruptcy or default is.
A lower ICR means fewer earnings available to meet interest payments and that the business
is more vulnerable to rise in interest rates. Excessive leverage poses balance sheet risk and
makes interest servicing a difficult task.
Figure 4: Corporate Interest Coverage Ratio by Country
Source: International Monetary Fund, Global Financial Stability Report (GFSR), October 2016
IMF's latest financial stability report (October 2016) shows that leverage ratios in
India's corporate sector appear to be a potent source of risk. As can be seen, the interest
coverage ratio of India's corporate sector in 2016 stands at 3.7, just above to Brazil (2.8).
Most importantly, the recent trend is very alarming for India as the ratio has come down from
6.7 in 2010 to 3.7 at present level. This is the second lowest amongst BRICS and emerging
market peers. Other emerging peers perform much better than India.
Long term borrowings constituted around 70.0% of total borrowings of companies in
2014-15, with predominant share of bank borrowings (more than 50.0%). However, the share
5.3
6.7
8.7
4.7
10.7
8.58.0 7.8
8.8
5.7
12.8
10.8
2.8
3.7
4.7 4.95.6
5.9 6.06.4 6.5 6.5
8.3 8.4
Brazil India Argentina Turkey China Chile Indonesia Mexico South Africa Philippines Russia Malaysia
2010 2016

Corporate Financing Options in India: Banking vs. Capital Markets
15
of bank borrowings declined over the years. Distribution of share of long term borrowings
(debt) in total borrowings in different leverage classes revealed that companies with very
high leverage ratio (more than 400%) had 55.0% of their total borrowings as bank
borrowings. Loss making companies (companies with their net worth less than zero) had
33.2% of their total borrowings as bank borrowings.
Table 2: Share of Long Term Borrowings to Total Borrowings for Companies as per
Leverage Class
Leverage Class (Per cent) 2012-13 2013-14 2014-15 2012-13 2013-14 2014-15
0- 100 60.4 58.4 61.9 56.1 51.4 49.2
100 - 200 84.3 78.7 76.3 63.2 58.8 55.9
200 - 300 83.9 85.3 87.1 60.0 61.7 64.5
300 - 400 89.4 91.5 91.0 60.1 57.9 59.0
Above 400 89.7 85.7 84.1 56.0 58.1 55.0
Net worth <0 71.0 61.2 55.4 43.9 34.6 33.2
Total 70.5 68.4 70.2 56.6 53.3 51.5
Source: Reserve Bank of India
At sectoral level, for Manufacturing sector and its major constituent industries (except
for cement and cement products), total borrowings to equity ratio improved in 2014-15 as
compared to 2013-14. Electricity sector was vulnerable in terms of high and increasing total
borrowing to equity ratio during the study period. Total borrowings to equity ratio in the
services sector deteriorated continuously. However, 9.1% companies had their leverage ratio
more than 200% and interest coverage ratio less than one or negative net worth in 2014-15.
Such companies had 21.8% share in total bank borrowings of select 16,923 companies.
Figure 5: Industry Wise Leverage Ratio of Selected NGNF Public Limited Companies
Source: Reserve Bank of India,
Finances of Non-Government Non-Financial Public Limited Companies: 2014-15
168.9
126.5
106
81.9
79.4
79.2
73.2
71.2
61.9
49.7
46.8
40.9
37.5
34.9
28.3
27.2
17.1
Electricity, gas, steam and air conditioning …
Construction
Transportation and storage
Food products and beverages
Electrical machinery and apparatus
Iron and steel
Services
Real Estate
Mining and quarrying
Textile
Manufacturing
Telecommunications
Cement and cement products
Chemicals and chemical products
Pharmaceuticals and medicines
Machinery and equipments n.e.c.
Motor vehicles and other transport equipments
Corporate Financing Options in India: Banking vs. Capital Markets
16
2.3 Capital Market Financing in India
The main components of Indian financial market are capital market (equity and debt),
money market, G-sec market, derivatives market, and foreign exchange market. Since the
beginning of reforms, the financial market has begun to respond in a favorable way. As part
of the overall reform process, the agenda has included structural transformation of the capital
market to bring it at par with their developed counterparts (Mohan, 2004).
To accelerate the process, Indian government and the Regulator have taken some
important steps including market pricing of public issues, introduction of proportional
allotment of shares, guidelines for corporate governance, revival of accounting standards at
par with international norms, opening market for FIIs etc. There has been an increase in the
share of retail investors from 25.0% to nearly 40.0% in share allotment process to investors
through book building. In this process, various intermediary institutions have emerged and
are in association with both the segments of capital market.
The passing of Depositories Act in 1996 followed by the establishment of Central
Depository Services Limited (CDSL) and National Securities Depository Limited (NSDL) as
depositories, marked the beginning for trading of dematerialized securities. This resulted in
improved settlement with speed, accuracy and security. Another important feature is the
shortening of the settlement period with the introduction of rolling settlement system. The
settlement system that was started at T+5 basis since July 2001 has been brought down to
T+3 system on April 2002 and to T+2 since April 2003. The Clearing Corporation of India
Ltd. (CCIL) was set up in April, 2001 to provide guaranteed and smooth clearing and
settlement functions for transactions in Money, G-Secs, Foreign Exchange and Derivative
markets. The introduction of guaranteed clearing and settlement led to significant
improvement in the market efficiency, transparency, liquidity and risk
management/measurement practices in these market along with added benefits like reduced
settlement and operational risk, savings on settlement costs, etc. Establishment of Clearing
Houses and Trade and Settlement Guarantee Funds, along with mechanism for on-line
margins and positions monitoring and implementation of risk management system, have
improved the quality of trading in terms of safety, transparency and efficiency.
Corporate Financing Options in India: Banking vs. Capital Markets
17
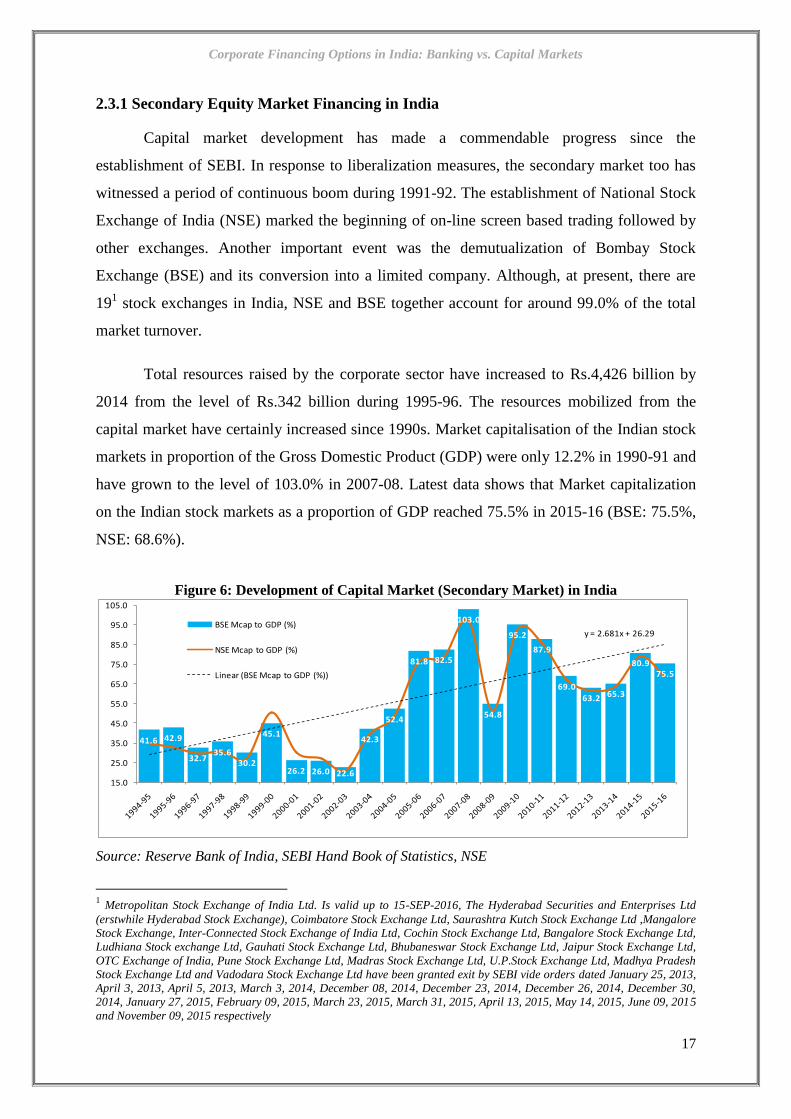
2.3.1 Secondary Equity Market Financing in India
Capital market development has made a commendable progress since the
establishment of SEBI. In response to liberalization measures, the secondary market too has
witnessed a period of continuous boom during 1991-92. The establishment of National Stock
Exchange of India (NSE) marked the beginning of on-line screen based trading followed by
other exchanges. Another important event was the demutualization of Bombay Stock
Exchange (BSE) and its conversion into a limited company. Although, at present, there are
191 stock exchanges in India, NSE and BSE together account for around 99.0% of the total
market turnover.
Total resources raised by the corporate sector have increased to Rs.4,426 billion by
2014 from the level of Rs.342 billion during 1995-96. The resources mobilized from the
capital market have certainly increased since 1990s. Market capitalisation of the Indian stock
markets in proportion of the Gross Domestic Product (GDP) were only 12.2% in 1990-91 and
have grown to the level of 103.0% in 2007-08. Latest data shows that Market capitalization
on the Indian stock markets as a proportion of GDP reached 75.5% in 2015-16 (BSE: 75.5%,
NSE: 68.6%).
Figure 6: Development of Capital Market (Secondary Market) in India
Source: Reserve Bank of India, SEBI Hand Book of Statistics, NSE
1 Metropolitan Stock Exchange of India Ltd. Is valid up to 15-SEP-2016, The Hyderabad Securities and Enterprises Ltd
(erstwhile Hyderabad Stock Exchange), Coimbatore Stock Exchange Ltd, Saurashtra Kutch Stock Exchange Ltd ,Mangalore
Stock Exchange, Inter-Connected Stock Exchange of India Ltd, Cochin Stock Exchange Ltd, Bangalore Stock Exchange Ltd,
Ludhiana Stock exchange Ltd, Gauhati Stock Exchange Ltd, Bhubaneswar Stock Exchange Ltd, Jaipur Stock Exchange Ltd,
OTC Exchange of India, Pune Stock Exchange Ltd, Madras Stock Exchange Ltd, U.P.Stock Exchange Ltd, Madhya Pradesh
Stock Exchange Ltd and Vadodara Stock Exchange Ltd have been granted exit by SEBI vide orders dated January 25, 2013,
April 3, 2013, April 5, 2013, March 3, 2014, December 08, 2014, December 23, 2014, December 26, 2014, December 30,
2014, January 27, 2015, February 09, 2015, March 23, 2015, March 31, 2015, April 13, 2015, May 14, 2015, June 09, 2015
and November 09, 2015 respectively
41.6 42.9
32.735.6
30.2
45.1
26.2 26.0 22.6
42.3
52.4
81.8 82.5
103.0
54.8
95.2
87.9
69.0
63.2 65.3
80.975.5
y = 2.681x + 26.29
15.0
25.0
35.0
45.0
55.0
65.0
75.0
85.0
95.0
105.0
BSE Mcap to GDP (%)
NSE Mcap to GDP (%)
Linear (BSE Mcap to GDP (%))

Corporate Financing Options in India: Banking vs. Capital Markets
18
2.3.2 Primary Equity Market Financing in India
Total Capital raised through Initial Public Offerings (IPOs) reached Rs.415.2 billion
in 2011-12 from Rs.78.6 billion in 1993-94. However, the global financial crisis coupled with
slowdown in Indian economy did hit the capital market and as a result, the capital raised
through IPOs sharply declined to the level of Rs.122.6 billion by December 2015. Similarly
capital raised in the form of listing has also increased from Rs.165.1 billion in 1993-94 to
Rs.544.2 billion in 2013.14, and moderated to Rs.274.0 billion in the first nine months of
2015-16.
Figure 7: Resources Mobilised from the Primary Market in India (by Issuer type)
Source: SEBI Hand Book of Statistics; *; For 2015-16, data is from April2015 to December 2015
Similarly corporate preference for funds raised through primary market (both public
and rights issue) has also seen considerable growth over the years. Total resources raised
from primary market have increased from Rs.243.7 billion to Rs.870.3 billion in 2007-08.
However, onset of the sub-prime crisis in 2007-08 discouraged further expansion and latest
number shows that for FY15-16 (by December 2015) an amount of Rs.396.5 billion was
raised from primary market.
Another significant development in the Indian capital market is the emergence and
growth of private placement of debts. Data shows that corporate prefer private placement
more than the public issue as substantiated by a continuous rise in percent of amount raised
through private placement. This is mainly due to ease of operation/servicing/administering,
relaxed regulation/complications and lower cost of raising funds.
0
100
200
300
400
500
600IPOs (Rs. Billion)
Listed (Rs. Billion)

Corporate Financing Options in India: Banking vs. Capital Markets
19
Figure 8: Resources Mobilized through Primary
Market (Rs. Billion)
Figure 9: Resources Mobilized in Private
Placement Market (Rs. Billion)
Source: SEBI Source: Reserve Bank of India, SEBI
2.3.3 Corporate Bond Financing in India
One of the pre-requisite for a successful economy is a well developed corporate bond market
that supports economic activity as it supplements the banking system and develops an
alternative source of finance for long-term investment requirement of the corporate sector.
Additionally, an active corporate bond market also helps in diversification of the risks in the
financial system. It would also provide institutional investors such as insurance companies
and provident and pension funds with quality long term financial assets, helping them in
matching their assets and liabilities.
Corporate bond market is a stable source of finance compared to equity markets as the latter
is volatile to a greater extent. Penetration into corporate bond market enables firms to tailor
their asset and liability profiles to reduce the risk of maturity mismatch. Recent report by
PwC-NAREDCO-APREA, titled ‘Building the Economy Block by Block’, highlights that
nearly $1 trillion is needed in the next five years to meet India’s infrastructure & housing
demand. The report has also highlighted that banks, private equity, NBFCs (Non-Banking
Financial Corporations) and REITs (Real Estate Investment Trusts) are expected to be the
major sources for financing infrastructure projects in the country.
Banks and Equity markets are the dominant sources of funds for business in India even as the
corporate bond market has languished for decades now. Going forward, the stress in the
banking sector along with increased capital requirements under Basel III may compel banks
to tighten lending. Bond markets could then play pivotal role in supporting the diverse
financing requirements of the growing Indian economy. Especially so for small and medium
0
100
200
300
400
500
600
700
800
900
19
93
-94
19
94
-95
19
95
-96
19
96
-97
19
97
-98
19
98
-99
19
99
-00
20
00
-01
20
01
-02
20
02
-03
20
03
-04
20
04
-05
20
05
-06
20
06
-07
20
07
-08
20
08
-09
20
09
-10
20
10
-11
20
11
-12
20
12
-13
20
13
-14
20
14
-15
20
15
-16
Rs.
Bill
ion
0
500
1,000
1,500
2,000
2,500
3,000
3,500
4,000
4,500
5,000
19
95
-96
19
96
-97
19
97
-98
19
98
-99
19
99
-00
20
00
-01
20
01
-02
20
02
-03
20
03
-04
20
04
-05
20
05
-06
20
06
-07
20
07
-08
20
08
-09
20
09
-10
20
10
-11
20
11
-12
20
12
-13
20
13
-14
20
14
-15
20
15
-16
Rs.
Bill
ion
Corporate Financing Options in India: Banking vs. Capital Markets
20
enterprises and infrastructure projects, which carry higher risks or require longer-term
financing that banks with their asset-liability constraints cannot provide. As the landscape for
bank-intermediated financing transforms under regulatory reforms and technological
advances, the need and opportunities for domestic corporate bond markets development are
apparent.
In view of huge investment requirement for infrastructure sector, the presence of a well
developed corporate bond market assumes significance in India as the dominated financial
system is unlikely to fund such a high amount. Corporate bond market is likely to be more
beneficial for business having longer term cash flows, where investors may be wary of risks
associated with equity and long-term financing from banks may not be easily available
[Report on High level committee on corporate bond and securitisation (2005)]
Corporate bond market development is still at a nascent stage in India. Though its
existence can be traced back since independence, but the real development started in the
decade of 1980s. The market is still far lagging behind and miniscule in comparison to the
Government securities market and Western markets.
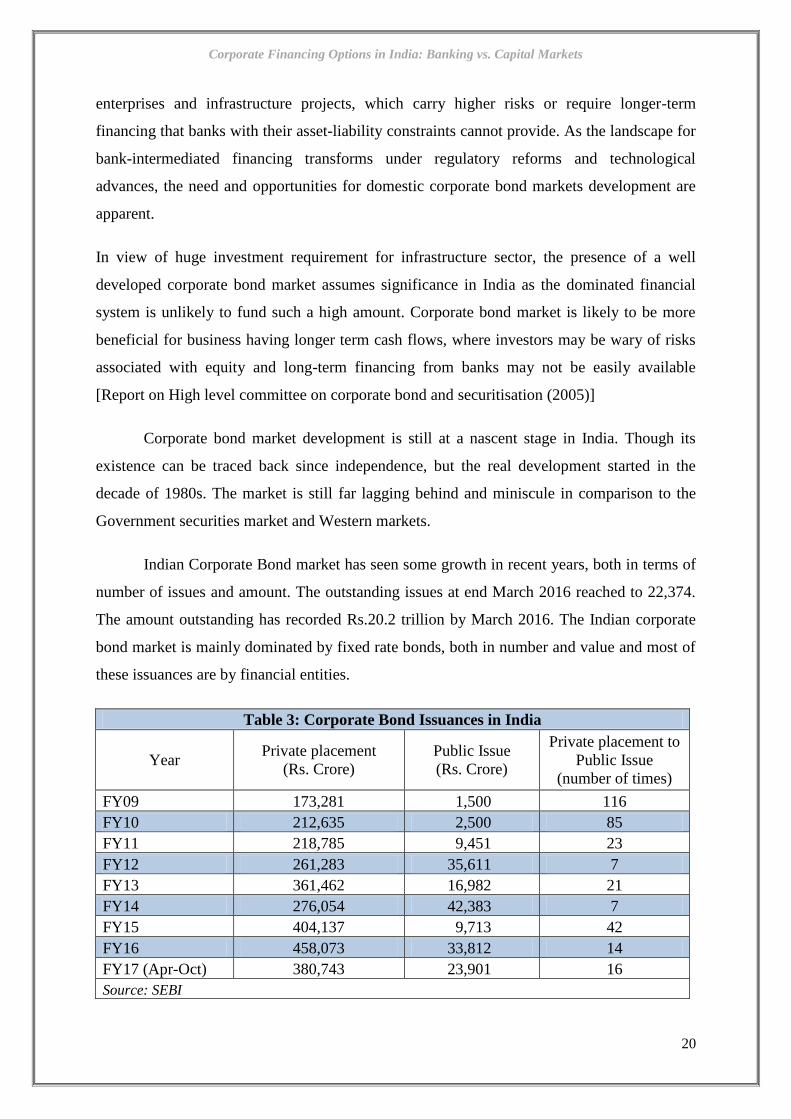
Indian Corporate Bond market has seen some growth in recent years, both in terms of
number of issues and amount. The outstanding issues at end March 2016 reached to 22,374.
The amount outstanding has recorded Rs.20.2 trillion by March 2016. The Indian corporate
bond market is mainly dominated by fixed rate bonds, both in number and value and most of
these issuances are by financial entities.
Table 3: Corporate Bond Issuances in India
Year Private placement
(Rs. Crore)
Public Issue
(Rs. Crore)
Private placement to
Public Issue
(number of times)
FY09 173,281 1,500 116
FY10 212,635 2,500 85
FY11 218,785 9,451 23
FY12 261,283 35,611 7
FY13 361,462 16,982 21
FY14 276,054 42,383 7
FY15 404,137 9,713 42
FY16 458,073 33,812 14
FY17 (Apr-Oct) 380,743 23,901 16
Source: SEBI

Corporate Financing Options in India: Banking vs. Capital Markets
21
Many new and innovative instruments have since been introduced over a period time
including partly convertible debentures, fully convertible debentures, deep discount bonds,
zero coupon bonds, bonds with warrants, floating rate bonds and secured premium notes,
with maturity period varying between one to ten years and coupon rates depending upon
tenure and credit rating. Recently, the GoI has introduced ‘Masala Bonds’ by which Indian
companies can borrow in Indian rupee from overseas markets.
The International Finance Corporation (IFC), the investment arm of the World Bank
issued a Rs.1,000 crore bond (November 2015) to fund infrastructure projects in India. In the
latest event (July 12, 2016), HDFC raised Rs.3,000 crore through the rupee denominated
Masala Bonds with an annualized yield of 8.33% to the investors.
Compared to the equity market, the corporate bond market is relatively
underdeveloped in India. Compared to other economies, the size of the bond market in India,
however, remains moderate as a percentage of GDP and is mainly dominated by Government
bonds that accounts for over 65.0% of bond market capitalization and almost 35.0% of GDP.
The size of the Indian Corporate bond market is 17.8% of GDP, much lower than the
countries like Korea, Malaysia, Singapore and Hong Kong (as on Mar’16). There are
potential risks associated with this market, such as, insufficient liquidity, narrow investor
base, refinancing risk, lack of better market facilities and standardization.
Recent measures by RBI, SEBI and GoI have resulted in increase in Corporate Bond
issuance by nearly 155% from Rs.2709.46 billion in 2010-11 to Rs.4,789.62 billion in 2014-
15. The number of issuances has increased by almost 77% from 4,280 in 2010-11 to 10,941
in 2014-152. Apart from these, there has been significant increase in the number of registered
foreign institutional investors (FIIs) in India. The surge in investor interest has created large
amounts of capital availability for the corporate sector. In the primary market, private-sector
issuances have been outpacing issuances by the public sector for the past several years. A
diverse array of companies from the entertainment to finance industries, are raising capital
through the primary market.
On 12 May, 2016, RBI has released a discussion paper on a proposed ‘Framework for
enhancing Credit Supply for Large Borrowers through the Market Mechanism’. Through
these guidelines, RBI is endeavoring to develop a deep and liquid Corporate bond market in
2 https://rbi.org.in/Scripts/BS_SpeechesView.aspx?Id=980

Corporate Financing Options in India: Banking vs. Capital Markets
22
India with an objective that a well developed bond market provides additional avenues to
corporate for raising funds in a cost effective manner and reduces reliance of corporate on
bank finance.
Private placements dominate Indian Corporate Bond market. Private placement
remains the most-preferred route to raise funds due to ease of issuance, cost efficiency,
administration and institutional demand in private placements. The public issuances which
were Rs.94.51 billion in 2010-11 had a significant rise to Rs.338 billion in 2015-16, a CAGR
of 29.0%. At the same time private placements increased from Rs.2,188 billion in 2010-11 to
Rs.4,581 billion in the year 2015-16, a CAGR of 16%. The secondary market trading which
was at Rs.6,053 billion in 2010-11, grew to Rs.10,224 billion in 2015-16, a CAGR of 11.0%.
The table manifests that the primary issuance of corporate bonds is dominated by
private placements. More than 95% of total issues are privately placed. In 2015-16, private
placement was almost 14 times higher than public issuances. As long as information about
such issues and their life-cycle performance (particularly default history) is publicly
available, investors should be able to take informed decisions. What is required here is a
public database that is freely accessible. Effort of authorities has been towards building a
trade repository of both primary and secondary activities.
Another significant character of India’s corporate debt market is the dominance of
financial institutions. Bulk of the issuance is in the so-called banking, financial services and
Figure 10: Size of the Corporate Bond Market (as %
GDP): March 2016
Figure 11: Share in India’s Debt market
Outstanding (August 2016)
Source: Asia Bond Monitor Source: Reserve Bank of India
74.0
41.3
32.730.1
18.4 17.8 16.9 16.5
6.02.1 0.4
G-Sec50%
Spl securities2%
FRB0%
T-Bill5%
SDL20%
Corporate Bond
23%

Corporate Financing Options in India: Banking vs. Capital Markets
23
insurance sector. Banking and financial services accounted for 74.0% of all primary issues in
2014-15 whereas, non-financial corporate accounted only for 19.0% of all outstanding
issuance. This points out that the access of non-financial corporate is limited to Indian
corporate bond market, which needs to be addressed.
Figure 12: Institutional Investment in Indian
Corporate Bond Market
Figure 13: Net Outstanding Amount (Rs. In Crores)
in Indian Corporate Bond Market
Source: CRISIL, Yearbook On The Indian Debt Market 2015 Source: SEBI
The size of the Indian Corporate Bond market as on March 2016 was17.8% of GDP,
much lower than the other peers including like Korea, Malaysia, Singapore and Hong Kong.
However, the recent RBI’s announcement to limit the lending to large borrowers is expected
to push large borrowers to the bond
market. Firms are expected to
increasingly tap the corporate bond
markets for their funding requirements
and issuances of corporate bond could
be expected to see a spurt. These steps
in conjunction with the measures
announced by the RBI for the
development of the corporate bond
markets would provide the much
needed boost for the deepening and
strengthening of the corporate bond
market segment.
12.0
18.2
22.7
13.7
19.3
15.4
8.7
0.0
5.0
10.0
15.0
20.0
25.0
-
500,000
1,000,000
1,500,000
2,000,000
2,500,000
Mar-11 Mar-12 Mar-13 Mar-14 Mar-15 Mar-16 Sep-16
Net Outstanding Amount (Rs. In Crores) Growth (YoY %)-RHS
Figure 14: Size of Corporate Bond Market (% of
GDP) - March 2016
Source: Asian Bonds Online, SEBI, RBI
74.0
41.3
32.7
30.1
18.4
17.8
16.9
16.5
6.0
2.1
0.4
South Korea
Malaysia
Singapore
Hong Kong
China
India
Thailand
Japan
Philippines
Indonesia
Vietnam
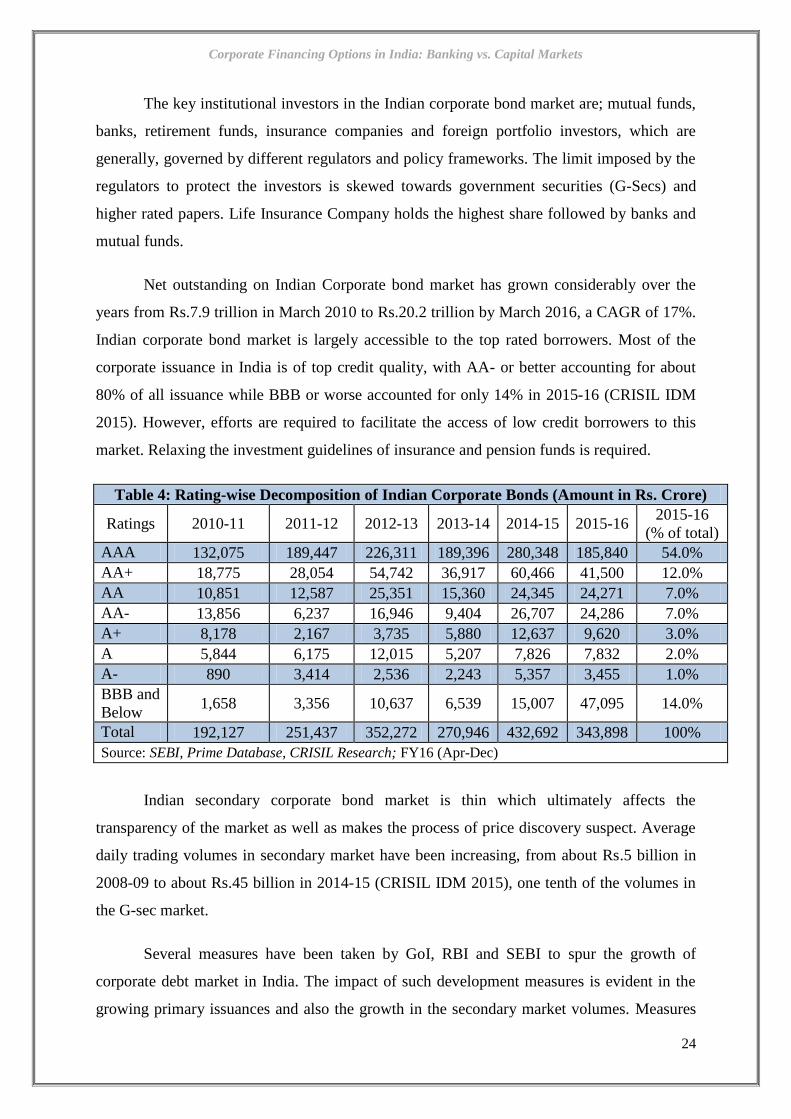
Corporate Financing Options in India: Banking vs. Capital Markets
24
The key institutional investors in the Indian corporate bond market are; mutual funds,
banks, retirement funds, insurance companies and foreign portfolio investors, which are
generally, governed by different regulators and policy frameworks. The limit imposed by the
regulators to protect the investors is skewed towards government securities (G-Secs) and
higher rated papers. Life Insurance Company holds the highest share followed by banks and
mutual funds.
Net outstanding on Indian Corporate bond market has grown considerably over the
years from Rs.7.9 trillion in March 2010 to Rs.20.2 trillion by March 2016, a CAGR of 17%.
Indian corporate bond market is largely accessible to the top rated borrowers. Most of the
corporate issuance in India is of top credit quality, with AA- or better accounting for about
80% of all issuance while BBB or worse accounted for only 14% in 2015-16 (CRISIL IDM
2015). However, efforts are required to facilitate the access of low credit borrowers to this
market. Relaxing the investment guidelines of insurance and pension funds is required.
Table 4: Rating-wise Decomposition of Indian Corporate Bonds (Amount in Rs. Crore)
Ratings 2010-11 2011-12 2012-13 2013-14 2014-15 2015-16 2015-16
(% of total)
AAA 132,075 189,447 226,311 189,396 280,348 185,840 54.0%
AA+ 18,775 28,054 54,742 36,917 60,466 41,500 12.0%
AA 10,851 12,587 25,351 15,360 24,345 24,271 7.0%
AA- 13,856 6,237 16,946 9,404 26,707 24,286 7.0%
A+ 8,178 2,167 3,735 5,880 12,637 9,620 3.0%
A 5,844 6,175 12,015 5,207 7,826 7,832 2.0%
A- 890 3,414 2,536 2,243 5,357 3,455 1.0%
BBB and
Below 1,658 3,356 10,637 6,539 15,007 47,095 14.0%
Total 192,127 251,437 352,272 270,946 432,692 343,898 100%
Source: SEBI, Prime Database, CRISIL Research; FY16 (Apr-Dec)
Indian secondary corporate bond market is thin which ultimately affects the
transparency of the market as well as makes the process of price discovery suspect. Average
daily trading volumes in secondary market have been increasing, from about Rs.5 billion in
2008-09 to about Rs.45 billion in 2014-15 (CRISIL IDM 2015), one tenth of the volumes in
the G-sec market.
Several measures have been taken by GoI, RBI and SEBI to spur the growth of
corporate debt market in India. The impact of such development measures is evident in the
growing primary issuances and also the growth in the secondary market volumes. Measures

Corporate Financing Options in India: Banking vs. Capital Markets
25
such as rationalising the listing norms, simplification in issuance procedures and processes,
standardisation of market conventions, setting up of reporting platform, implementation of
Delivery versus payment settlement of corporate bond trades, allowing banks to hold
corporate bonds from the infrastructure sector on their balance sheet under the category of
Held to Maturity (HTM) assets and issuing long term bonds without the requirement for
maintaining reserves have had an encouraging impact on the market.
Figure 15: Rating-wise trading of Corporate
Bonds in the secondary Market (% of total
trading; Avg. of last six years)
Figure 16: Sector-wise trading of Corporate
Bonds in the secondary Market (% of total
trading; Avg. of last six years)
Source: FIMMDA, NSE, BSE, CRISIL Research Source: FIMMDA, NSE, BSE, CRISIL Research
India has taken a calibrated approach to letting in foreign portfolio flows into her debt
market. Over time, the FPI debt portfolio has been getting more stable with a steady inflow of
long-term investors. Obviously, it would be preferable from the point of view of financial
stability that the FPI investor base consists largely of this category of investors rather than
speculative capital or arbitrage funds. The development of this market requires fundamental
reforms in financial markets, public finance and regulatory governance, something not easy
to achieve.
To attract sizable foreign funds into capital markets, RBI has allowed FPIs to invest in
unlisted debt securities as well as in securitized debt instruments. The RBI directive follows
the government announcement in the Union Budget 2016-17 to expand the scope of
investment by foreign investors. As per the RBI directive, FPIs can invest in the primary
issues of non-convertible debentures/bonds by a public company. Such investment would be
permitted only if the issuing company does not use the borrowing proceeds for real estate
activities, purchase of land, investing in capital market or on-lending to other entities. FPI
AAA79%
AA+9%
AA5%
AA-4%
A+ and Below3%
FIs45%
HFCs18%
PSUs11%
Private – non financial
sector12%
NBFCs10%
Banks3%
State level undertakings
1%
State financial
institutions0%

Corporate Financing Options in India: Banking vs. Capital Markets
26
limits in government bonds are currently low at 4%, which is significantly lower than other
peers.
Bottlenecks in Indian Corporate Bond Market
Some of the major bottlenecks in the development of the corporate bond market in India
that is widely discussed time to time in different committee report and forums are listed as
follows:
Global experience says that the largest participants in the corporate bond market are
insurance companies. Surprisingly, in India institutional investors like Insurance
companies, pension funds and provident funds with having large assets under their
management still have several constraints in the nature of investment mandates resulting
in limited participation of such entities. They prefer gilt over corporate bonds as they as
they have to provide safe and guaranteed returns.
India’s financial system has traditionally been a bank dominated system with corporate
relying more on loan financing compared to bond financing. Weaning corporate away
from banks has proved to be an uphill task.
Unavailability of credit risk transfer mechanism in the corporate bond market also works
as a deterrent for its growth. Though credit default swap (CDS) has been introduced in
India for years, there is no activity in the market. One of the major constraints is
restriction on netting of mark to market (MTM) position against the same counterparty
for capital adequacy and exposure norms.
The absence of robust bankruptcy laws is also reckoned as one of the major reasons for
lack of investor interest in corporate bonds. However, the Insolvency and Bankruptcy
Code, 2016 is expected to address some of the issues.
Lack of centralised database which enables investors to get complete information about
corporate debt market at one place.
Lack of functional trading platform with Central Counter Party (CCP) facility.
Measures on Development of the Corporate Bond market in the Union Budget 2016-17
In the Union Budget 2016-17, a number of important measures have been announced for
the development of the corporate bond market in India, and importantly, some of these are
followed by directives from RBI recently. The budget measures are;

Corporate Financing Options in India: Banking vs. Capital Markets
27
RBI to issue guidelines to encourage large borrowers to access a certain portion of their
financing needs through market mechanism instead of the banks, which have already
been brought into force.
Investment basket of foreign portfolio investors will be expanded to include unlisted debt
securities and pass through securities issued by securitisation SPVs.
LIC of India to set up a dedicated fund to provide credit enhancement to infrastructure
projects. The fund will help in raising the credit rating of bonds floated by infrastructure
companies and facilitate investment from long term investors.
For developing an enabling eco-system for the private placement market in corporate
bonds, an electronic auction platform will be introduced by SEBI for primary debt offer.
A complete information repository for corporate bonds, covering both primary and
secondary market segments will be developed jointly by RBI and SEBI.
A framework for an electronic platform for repo market in corporate bonds will be
developed by RBI.
Committees on Corporate Bond Market in India
A number of reports has been presented by the expert Committees on the
development of corporate bond markets in India viz. Report of High Level Expert Committee
on Corporate Bonds and Securitisation in 2005 (R. H. Patil Committee), Report of the High
Powered Expert Committee on Making Mumbai an International Financial Centre in 2007
(Percy Mistry Committee), A Hundred Small Steps [Report of the Committee on Financial
Sector Reforms (CFSR)] in 2009 (Dr. Raghuram Rajan Committee), Reports of the City of
London, etc.
These Committees have examined in detail various aspects related to the development
of corporate bond market and have made useful recommendations. Many of these
recommendations have been implemented. Most recently, the Working Group on
Development of Corporate Bond Market in India (H R Khan) submitted its report on August
2016.
H. R. Khan Committee recommendations
Given the importance of developing the corporate bond market in India, the committee
has given its recommendation under 7 ‘I’ framework (Issuers, Investors, Intermediaries,
Corporate Financing Options in India: Banking vs. Capital Markets
28
Infrastructure, Instruments, Incentives and Innovations). Some of the recommendations are
listed below.
Enhancing credit supply for large borrowers through market mechanism- for exposure
beyond a threshold.
Allowing banks to provide partial credit enhancement (PCE) of 50% of the bond issue
size subject to the PCE provided by any single bank not exceeding 20% of the bond issue
size.
Issuance of rupee denominated bonds overseas (Masala Bonds) by banks as AT1 and T2
capital.
Permitting brokers in repo in corporate bonds.
Allowing FPIs to trade directly in corporate bonds.
Initiating the process of accepting corporate bonds under Liquidity Adjustment Facility
(LAF) of RBI.
Setting up of electronic book platform for issuance of privately placed bonds for size of
Rs 500 crore and above.
Setting up of centralized database of corporate bonds.
Challenges and way forward for development of Corporate bond market in India
Indian corporate bond market is stuck with many structural bottlenecks. Some of
these are discussed below.
Market Infrastructure: It is desirable to have a highly efficient and safe market
infrastructure for a prospering bond market in any economy. A solid infrastructure would
make it easy for the investors to trade on bonds. Electronic platforms for trading need to be
developed.
Issuer Diversity: Going by the statistics, more than 85% of the corporate bond
issuance is undertaken by high rated issuers. For a successful credit enhancement mechanism,
more and more retail investors’ participation is a must. Retail investors could absorb the
credit risk through wider dissipation.
Increasing the Depth: Indian corporate bond market depth is thin and justifies
strengthening further. Most importantly, corporate find it difficult to raise fund from the
international market by issuing bonds in domestic currency. Recent development of ‘Masala

Corporate Financing Options in India: Banking vs. Capital Markets
29
Bond’ concept is a progressive effort and many corporate have successfully raised capital
even in a troubled international market.
Managing and transferring risk: Managing risk is one of the important parameters
where corporate bond market in India lags. Penetration of the corporate bond market would
invite more and more borrowers with lower ratings to enter the market that will raise the
default rate. Investors will have low confidence given probability of more defaults. To boost
the confidence of investors to fund risky borrowers, risk hedging instruments including
Credit Default Swaps needs to be introduced.
SDLs and Municipality bonds: With increase need of infrastructure in the country
and fiscal consolidation road map of the Centre as well as State and municipalities, local
governments including municipalities’ need to explore additional sources of finance to fund
infrastructure.
Apart from these measures some of the most important and urgent steps required are;
To initiate measures in improving liquidity, such as, consolidation of particularly the
privately placed bonds
Suitable framework for market making in corporate bonds
Introducing a suitable institutional mechanism for credit enhancement to enable SMEs
and other
Facilitating corporate with lower credit rating to access the corporate bond market
Developing a smooth yield curve for the government securities market for efficient
pricing of the corporate bonds
Increase the scope of investment by provident/pension/gratuity funds and insurance
companies in corporate bonds
Developing the securitization market under the new regulatory framework
Wider participation of retail investors in the market through stock exchanges and mutual
funds
2.3.4 Financing through American/Global Depository Receipts (ADR/GDR)
Since 1992, Indian companies have been listing abroad through American Depository
Receipts and Global Depository Receipts (ADRs and GDRs). Issuance reached a peak of $6.6
billion in 2007 and moderated thereafter. Funds raised through ADR/GDR were $1.3 billion
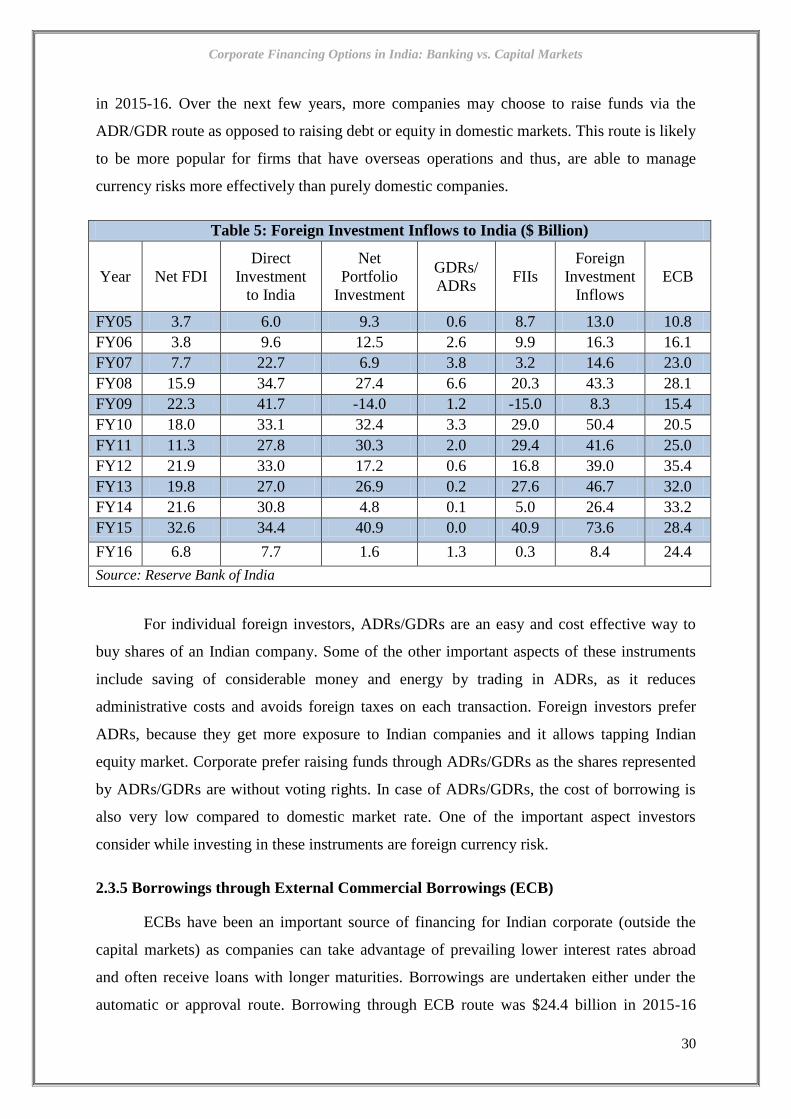
Corporate Financing Options in India: Banking vs. Capital Markets
30
in 2015-16. Over the next few years, more companies may choose to raise funds via the
ADR/GDR route as opposed to raising debt or equity in domestic markets. This route is likely
to be more popular for firms that have overseas operations and thus, are able to manage
currency risks more effectively than purely domestic companies.
Table 5: Foreign Investment Inflows to India ($ Billion)
Year Net FDI
Direct
Investment
to India
Net
Portfolio
Investment
GDRs/
ADRs FIIs
Foreign
Investment
Inflows
ECB
FY05 3.7 6.0 9.3 0.6 8.7 13.0 10.8
FY06 3.8 9.6 12.5 2.6 9.9 16.3 16.1
FY07 7.7 22.7 6.9 3.8 3.2 14.6 23.0
FY08 15.9 34.7 27.4 6.6 20.3 43.3 28.1
FY09 22.3 41.7 -14.0 1.2 -15.0 8.3 15.4
FY10 18.0 33.1 32.4 3.3 29.0 50.4 20.5
FY11 11.3 27.8 30.3 2.0 29.4 41.6 25.0
FY12 21.9 33.0 17.2 0.6 16.8 39.0 35.4
FY13 19.8 27.0 26.9 0.2 27.6 46.7 32.0
FY14 21.6 30.8 4.8 0.1 5.0 26.4 33.2
FY15 32.6 34.4 40.9 0.0 40.9 73.6 28.4
FY16 6.8 7.7 1.6 1.3 0.3 8.4 24.4
Source: Reserve Bank of India
For individual foreign investors, ADRs/GDRs are an easy and cost effective way to
buy shares of an Indian company. Some of the other important aspects of these instruments
include saving of considerable money and energy by trading in ADRs, as it reduces
administrative costs and avoids foreign taxes on each transaction. Foreign investors prefer
ADRs, because they get more exposure to Indian companies and it allows tapping Indian
equity market. Corporate prefer raising funds through ADRs/GDRs as the shares represented
by ADRs/GDRs are without voting rights. In case of ADRs/GDRs, the cost of borrowing is
also very low compared to domestic market rate. One of the important aspect investors
consider while investing in these instruments are foreign currency risk.
2.3.5 Borrowings through External Commercial Borrowings (ECB)
ECBs have been an important source of financing for Indian corporate (outside the
capital markets) as companies can take advantage of prevailing lower interest rates abroad
and often receive loans with longer maturities. Borrowings are undertaken either under the
automatic or approval route. Borrowing through ECB route was $24.4 billion in 2015-16

Corporate Financing Options in India: Banking vs. Capital Markets
31
from 2004-05 level of $10.8 billion. The growth has been fuelled not only by increasing
investment needs and available foreign capital, but also by the gradual relaxation of
regulations. Weighted average maturity for borrowings through ECB route has gone up from
4.11 year in 2004-05 to 6.2% in 2015-16. In 2015-16, the weighted average margin over 6-
month LIBOR or reference rate for Floating Rate ECB Loans was 1.5%.
2.3.6 Borrowings through Foreign Direct and Institutional Investment (FDI/FII)
Foreign Direct Investment (FDI) in India has increased significantly in the past
several years as regulations have been streamlined to suit corporate growth in India. FDI
ceilings on various sectors have gradually been increased in various sectors over the past
decade. Net FDI inflows to India have registered a growth from $3.7 billion in 2004-05 to
$32.6 billion by end of 2014-15 and moderated to $6.8 billion in 2015-16. A large number of
investments are also getting routed through Mauritius given advantages of the Indo-Mauritian
tax treaty. The services sector (both financial and non-financial), computer, real estate, and
telecom sectors have traditionally received the highest amount of FDI in recent years.
India continues to be a preferred market for foreign investors. FII’s net investments in
Indian equities and debt have touched record highs of $40.9 billion in 2014-15. This was
backed by expectations of a steady economic recovery, easing interest rates and improving
earnings outlook. However, the recent events such as US fed rate tapering, uncertainty in
Europe and growing geo-political unrests have increased preference of safe haven and capital
is flying back from emerging markets (including India) to Greenback. Thus a moderate net
FII inflow of $0.3 billion was seen in 2015-16.
2.3.7 Financing through Private Equity (PE)
A variety of international firms starting from global private equity players to
investment banks and sovereign investment funds, have entered into the Indian private equity
market in recent years. Thus, the market is often considered to be part of the FDI category.
However, given the significant and growing number of domestic players, it can be important
to look at PE as a distinct category. As the Government has renewed its commitment to
infrastructure development, called for a greater number of public-private partnerships, and
raised FDI caps, opportunity for PE has grown tremendously. Total PE deals have increased
by 62% YoY to $1.2 billion in February 2016 through 94 deals. PE investments during the

Corporate Financing Options in India: Banking vs. Capital Markets
32
October-December 2015 period was $3.9 billion, leading to total PE investments for 2015 to
a record high of $19.5 billion through 159 deals.
2.3.8 Financing through Financial Derivatives
Another development was the introduction of derivatives that took place in 1995
when Securities Contracts (Regulation) Act 1956 was amended to withdraw the prohibition
on option trading. Subsequently, a committee was set up by SEBI under the chairmanship of
Shri L. C Gupta to suggest appropriate regulatory guidelines for introduction of derivatives.
The Committee suggested for introduction of exchange traded derivatives to be declared as
securities so that framework for securities trading could also be made applicable for
derivative trading purpose. This was followed by setting up of a sub-committee under Shri J.
R Verma in 1998, who suggested for risk mitigating measures in derivative trading. It was
only after the Report submitted by these two committees that SEBI allowed BSE and NSE to
start with trading on index futures. BSE commenced trading on Index Futures from June 9,
2000 followed by NSE on June 12, 2000.
Now, there are a number of derivatives that are traded in the form of futures and
options which are both index based as well as stock specific. Trading for these derivatives
also takes place in Inter-Connected Stock Exchange (ICSE) in addition to BSE and NSE and
to facilitate this, overall guidelines have been issued by SEBI. These guidelines have enabled
the Exchanges to do overall supervision and guidance while SEBI has acted as a regulator of
the last resort for the trading in derivatives market (SEBI, 2006). Trading mechanism of
derivatives has been kept separate from that of cash segment with a clear modus operandi for
clearing and settlement. A broker of cash segment cannot become a member of derivatives by
automatic means.
2.3.9 Financing via Money Market Instruments
Money market is a composition of various sub-markets, such as, call/notice market,
Treasury Bills market, repo market, Certificates of Deposit (CD) and Commercial Paper (CP)
and commercial bill market. Since the initiation of reforms, there has been a concerted effort
by RBI towards development of a money market with efficiency, liquidity and stability as a
distinctive character. In order to widen, a deepen the money market RBI has taken several
steps to create a favorable policy environment by way of appropriate institutional and
instrumental development, technological enhancement.

Corporate Financing Options in India: Banking vs. Capital Markets
33
CP market is a constituent of the unsecured money market, in which corporate do
their fund-raising for their operational obligations. Prior to the introduction of CP, Indian
corporate had to negotiate hard for borrowing their working capital needs from commercial
banks by pledging inventory as collateral security. The introduction of CP helped corporate to
explore debt instruments and allowed them to access funds in the open market with certain
conditionality.
Figure 17: Commercial Paper (CP) Outstanding
(Rs. Billion)
Figure 18: Commercial Deposit (CD) Outstanding
(Rs. Billion)
Source: RBI& SEBI Source: SEBI & RBI
The outstanding in CP rose from Rs.47.7 billion in 1998-99 to Rs.441.7 billion in
2008-09. Following various relaxations in the terms and conditions for issue of CP, its
issuances gathered momentum thereafter and reached Rs.2602.4 billion at the end of the year
2015-16.
With the increased market orientation of monetary policy along with greater global
integration of domestic markets, RBI’s emphasis has been on setting prudential limits on
borrowing and lending in the call money market, encouraging migration towards the
collateralized segments and developing derivative instruments for hedging market risks
(Mohan, 2007). In this connection, steps have been taken over the period of time for
development of each of the sub-sectors that could ultimately result in modification of existing
instruments, introduction/innovation of new instruments as well as new measures that could
add to depth and liquidity in market. New instruments such as repo and CBLO (collateralized
borrowing and lending obligations) have increased their share in the annual average market
turnover in comparison to the earlier existing instruments such as call money market whose
share has rather declined.
2602.4
0
500
1,000
1,500
2,000
2,500
3,000
0
500
1,000
1,500
2,000
2,500
3,000
3,500
4,000
4,500

Corporate Financing Options in India: Banking vs. Capital Markets
34
2.3.10 Commercial Banks Dominate External Debt Financing
In India, bank credit forms a major part of external funding for corporate. In public
limited companies, bank borrowings account for nearly 30% of external financing and 20%
of total financing. In private limited companies, bank borrowings constitute 28.1% of
external financing and 17.3% of total company financing.
Figure 19: Flow of Resources from Banks and Non-bank Sources to Commercial Sector
Source: RBI Financial Stability Report June 2016
Drying/scanty sources of other financing models are one of the reasons for heavy
demand for bank finance in India. Regulatory hurdles, such as the high SLR and Priority
sector lending requirement have constrained banks’ lendable fund. Apart from the sluggish
demand and lack of pricing power of corporate have lead to lower credit off-take in recent
years. On the supply side, despite eased monetary policy, encouragement from policymakers,
and liquidity injections from RBI, banks have been selective in lending. As they face
profitability pressures and increased provisioning for non-performing loans, most banks made
only moderate cuts to their lending rates.

Corporate Financing Options in India: Banking vs. Capital Markets
35
2.4 Financial Disintermediation in India
The term, intermediation is defined in financial dictionary, anz.com as “to have
middle-man (intermediary) between borrowers and lenders, rather than borrowers and
lenders dealing directly to each other”. The role of the Commercial Banks in the
intermediation process is very important because of their overwhelming control over the
entire financial assets of the economy and more so because of the underdeveloped capital
market in our country.
Financial intermediaries emerge in the saving-investment process to intermediate
between the ultimate borrowers and ultimate lenders. The main objective was to mobilise
resources from the individual savers for the purpose of onward deployment, for which they
make two contracts: one with the lender and the other with the borrower. Among all the
financial intermediaries operating in market, commercial banks are the oldest ones known
and occupy a pivotal position in the entire economic system.
Disintermediation process would lead to a situation where there would be limited
need for financial intermediaries. As a result of the existence of transaction and information
costs, financial intermediation is unlikely to become redundant. Hence, disintermediation can
more properly be defined as a loss in importance of traditional banking activities, such as, the
collection of deposits from households for onward transmission to companies. In this
scenario, the role of financial institutions shifts to the provision of financial services on a fee
basis.
In our Indian economic system, like many other countries, other institutions including
mutual funds, non-banking financial companies etc. also function in the same line alongside
banks, albeit in a slightly different way in accepting deposits as well as different in
investment pattern.
Bank disintermediation process in India started in 1980s with development of capital
market as well as initiative from the Government towards tax concession policy and
permission to Public sector undertakings to accept deposits. Introduction of new tax
concession schemes by LIC and Small Saving Schemes by Postal Department also added to
the process. All these led to reduction of banks share in household savings as well as in
credit. With liberalization of Indian economy, capital is moving freely. Good creditworthy

Corporate Financing Options in India: Banking vs. Capital Markets
36
borrowers are tapping cheap source of finance from domestic as well as from international
market.
The role of financial institutions in the capital intermediation process has changed
significantly during post liberalization period of 1991. In the past, funds were intermediated
through banks and other savings institutions. The household as well as corporate savings
were deposited in these institutions and subsequently transmitted to business and retail
consumers. The advent of direct market financing for large borrowers techniques such as
securitization and institutionalization of savings has led to the disintermediation of financial
institutions. Over the years, global financial intermediaries including those in India have been
sharing the pie in financial intermediation business to capital markets.
The developments also brought new dimensions in the process of financial
intermediation – ‘vertical intermediation’ that involves money moving from savers to users of
funds and ‘horizontal intermediation’ wherein market participants move funds amongst
themselves.
Indian financial market experienced significant changes from 1980s onwards. With
the introduction of new instruments of savings in market, there was a decline in the rate of
bank savings. So it could be said that financial disintermediation was already in place from
the first half of 1980s resulting to 33% decline in bank savings in 1981-82 from 53% in 1980-
81 (Murthy, 1984).
Even if there is an effort to spread the overall risks away from the banks in a hitherto
bank dominated financial system, one cannot undermine the role of banks, which do credit
screening in a competitive market and that information becomes a vital input in the process of
price discovery and risk management in capital markets. However, banks’ efforts in
disseminating the information gathered through credit screening could be severely curtailed if
active secondary markets are absent.
In Indian capital market, inadequacy of retail investor presence is felt. Retail
investor interest in India’s capital market has been far short of potential. The survey of
household saving and investment behavior conducted by the NCAER in 2011 found that
households investing in bonds, debentures, equity instruments, mutual funds and derivatives
totaled 24.5 million and constituted only 10.74% of all households in the country. The
proportion of investor households was nearly 21% in urban areas and 6% in rural areas. Of

Corporate Financing Options in India: Banking vs. Capital Markets
37
these investors, 43% showed a preference for mutual funds, 22% had interest in bonds and
debentures, another 22% to the secondary market, 10% invested in IPOs and less than 4% in
derivatives. To sum up, though a significant share of investor households were exposed to the
secondary equity market, they amounted to only 2.4% of all households, with that figure
falling to just above 1% in terms of exposure to IPOs(NCAER 2011). Retail investor
presence appears smaller when assessed relative to population. A 2011 study from the Indian
School of Business (De, Gondhi and Sarkar 2011) estimated that there were around 2.02
million retail investors in India, which was small relative to the Indian population (0.2%).
2.4.1 Change in Financial Savings and Investment Patterns of Households
Households in India are major contributors to national savings. According to the
National Accounts series with 2011-12 as base the ratio of financial savings of households to
Gross Domestic Savings reached its peak to 93.2% in 2001-02. Household savings then
nosedived before the global financial crisis to 60.90% in 2007-08 and further moderated to
57.83% in 2014-15.
Figure 20: Household Savings to Gross Domestic Savings (Percentage)
Source: Reserve Bank of India
The national accounts statistics compute households’ savings as the sum total of
household financial savings and the savings of households in physical assets. The share of
household savings in financial and physical assets has always remained in support of the
latter. Household savings in financial assets has increased from 2.2% in 1951-52 to 64.5% in
1994-95 and moderated to 40.4% in 2014-15. Household savings in physical assets was
97.8% of total savings in 1951-52, which came down to 48.1% in pre sub-prime crisis. The
onset of meltdown and economic crisis again attracted higher share of household savings
54.6
93.2
57.8
50.0
55.0
60.0
65.0
70.0
75.0
80.0
85.0
90.0
95.0
1951
-52
1953
-54
1955
-56
1957
-58
1959
-60
1961
-62
1963
-64
1965
-66
1967
-68
1969
-70
1971
-72
1973
-74
1975
-76
1977
-78
1979
-80
1981
-82
1983
-84
1985
-86
1987
-88
1989
-90
1991
-92
1993
-94
1995
-96
1997
-98
1999
-00
2001
-02
2003
-04
2005
-06
2007
-08
2009
-10
2011
-12
2012
-13
2014
-15
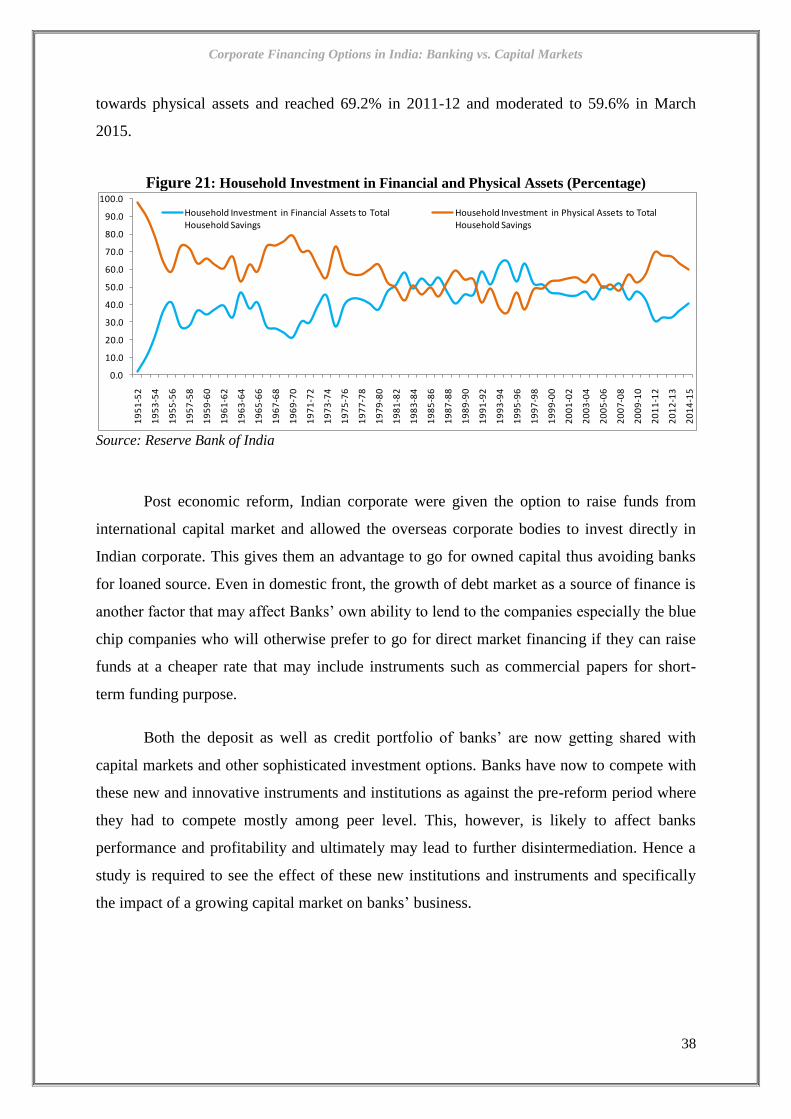
Corporate Financing Options in India: Banking vs. Capital Markets
38
towards physical assets and reached 69.2% in 2011-12 and moderated to 59.6% in March
2015.
Figure 21: Household Investment in Financial and Physical Assets (Percentage)
Source: Reserve Bank of India
Post economic reform, Indian corporate were given the option to raise funds from
international capital market and allowed the overseas corporate bodies to invest directly in
Indian corporate. This gives them an advantage to go for owned capital thus avoiding banks
for loaned source. Even in domestic front, the growth of debt market as a source of finance is
another factor that may affect Banks’ own ability to lend to the companies especially the blue
chip companies who will otherwise prefer to go for direct market financing if they can raise
funds at a cheaper rate that may include instruments such as commercial papers for short-
term funding purpose.
Both the deposit as well as credit portfolio of banks’ are now getting shared with
capital markets and other sophisticated investment options. Banks have now to compete with
these new and innovative instruments and institutions as against the pre-reform period where
they had to compete mostly among peer level. This, however, is likely to affect banks
performance and profitability and ultimately may lead to further disintermediation. Hence a
study is required to see the effect of these new institutions and instruments and specifically
the impact of a growing capital market on banks’ business.
0.0
10.0
20.0
30.0
40.0
50.0
60.0
70.0
80.0
90.0
100.0
19
51
-52
19
53
-54
19
55
-56
19
57
-58
19
59
-60
19
61
-62
19
63
-64
19
65
-66
19
67
-68
19
69
-70
19
71
-72
19
73
-74
19
75
-76
19
77
-78
19
79
-80
19
81
-82
19
83
-84
19
85
-86
19
87
-88
19
89
-90
19
91
-92
19
93
-94
19
95
-96
19
97
-98
19
99
-00
20
01
-02
20
03
-04
20
05
-06
20
07
-08
20
09
-10
20
11
-12
20
12
-13
20
14
-15
Household Investment in Financial Assets to Total Household Savings
Household Investment in Physical Assets to Total Household Savings
Corporate Financing Options in India: Banking vs. Capital Markets
39
CHAPTER III
Theoretical Framework & Literature Review
3.1 Introduction
Capital structure is generally defined as the combination of debt and equity capital
that a firm uses to finance its long-term operations. The ideal capital structure is an
everlasting discussion topic among academicians and industry experts. The optimum capital
structure as defined by Ezra Solomon is “Optimum leverage can be defined as that mix of
debt and equity which will maximize the value of a company, i.e., the aggregate value of the
claims and ownership interests represented on the credit side of the balance sheet.”
In corporate finance, the ratio between debt and equity is named as leverage which
needs to be optimized, as high leverage would bring a higher profit at an additional solvency
risk. However, the important thing in capital structure policy involves a choice between risk
taking capacity and expected return. The optimal capital structure strikes a balance between
these risks and returns. Some of the important guiding principles of capital structure are
discussed below.
3.2 Guiding Principles of Capital Structure
Cost principle: This principle is based upon cost minimization. The ideal pattern of
capital structure is one that minimizes cost of financing and maximizes the earnings per
share. Most importantly, the cost of capital is understood along with interest rate at which
payments have to be made to suppliers of funds and component of tax. Debt capital is
cheaper from this prospective.
Risk principle: This principle suggests that the source of finance that puts rigid
burden on earnings is risky. Hence such a pattern should be devised so that the company does
not run the risk of brining on a receivership with all its difficulties and losses. Common stock

Corporate Financing Options in India: Banking vs. Capital Markets
40
for financing capital requirements is preferred under risk principle and forbids as far as
possible the use of fixed income bearing securities.
Control principle: While taking a call on appropriate capital structure of the firm, the
important thing to keep in mind is that controlling position of residual owners remains
undisturbed. The use of preferred stock and debts offers a means of raising capital without
jeopardizing control. Issuance of equity dilutes control of existing shares and has adverse
impact on earnings per share.
Flexibility principle: Under this approach, the capital structure is to be so designed as
such that it allows management to use all sources whenever need for additional long term
funds is felt. As the exhaust of any particular source leads to loss of bargaining power for the
company and ultimately leads to raising funds at higher cost and adverse terms, hence the
capital structure should be flexible.
Timing principle: Timing is always important in financing, particularly in a growing
concern. Capital structure needs to be so designed as to allow management to exploit
opportunities presented in dynamic capital markets. This would enable the company to seize
the market opportunities and minimize cost of raising capital and obtain substantial savings.
Timing is an important concept in market as with different phases of business cycles, demand
of different types of securities oscillates. In times of boom when there is all-round business
expansion and economic prosperity and investors have strong desire to invest, it is easier to
sell equity shares. But during depression, bonds or other debt funding should be preferred.
3.3 Factors Influencing Capital Structure Decisions
Apart from these above discussed principles, a number of factors influence the capital
structure decision of a firm. Those principles are not complementary to each other and hence
the firm has to assign appropriate weightage to each of these principles to design prudent
capital structure. These factors can be broadly categorized in to three segments, i.e., as per
characteristics of the economy, characteristics of the industry and characteristics of the firm.
3.3.1 Characteristic of the Economy
Tempo of the business activity: During the recovery phase, when the economy is
likely to recover and the level of activity is expected to expand, greater reliance is accorded
to flexibility. Equity is preferred over debt in such situations.

Corporate Financing Options in India: Banking vs. Capital Markets
41
State of capital market: Cost and availability of funds are determined by the capital
market conditions. If the stock market is going to be plunged in bearish state and interest
rates are expected to decline, the management may provide greater weightage to
maneuverability factor in order to take advantage of cheaper debt later on.
Taxation: The taxation policy plays an important role in deciding the capital
structure. In case of India the existing tax provision makes debt more advantageous than
equity/stock.
State regulations: State plays an important role in decision regarding capitalization.
Control of Capital Issues Act in India prefers 4:1 ratio between debt and equity and 3:1
between equity and preferred stock.
Policy of Term-Financing Institutions: The financial institutions involved in term
lending business are important in this aspect. A relatively tight lending policy under
restrictive terms offers management to abstain from borrowing from those institutions so as
to preserve the company’s flexibility in capital funds.
3.3.2 Characteristics of the Industry
Cyclical variations: Income elasticity is an important concept which affects sales and
profitability of firms under different economic phases. There are industries whose products
are subject to higher sensitivity to income of the mass, whereas some products have low
income elasticity and their sales do not change in proportion to variation in national income.
The management keeps these things in mind and attaches more significance to flexibility and
risk principle in choosing suitable sources of funds. This is even more sensitive to an industry
dealing in products whose sales fluctuate very markedly over a business cycle. This facilitates
the firm to have a freedom either in expanding or contracting the resources used in
accordance with business requirements.
Degree of competition: Degree of competition is important in deciding the source of
finance as public utility concerns are generally free from intra industry competition. In such
concerns, the management provides greater preference to cost principle. But in industry
which faces neck to neck competition, risk principle is usually accorded more consideration.
Stage in life cycle: For a newly setup like infant industry, risk principle should be the
sub-guide line in selecting sources of funds since in such industry the rate of failure is very

Corporate Financing Options in India: Banking vs. Capital Markets
42
high. During the period of growth flexibility factor should be given special consideration so
as to leave room open for easy and rapid expansion of funds used.
3.3.3 Characteristics of the Firm
Size of the business: Business size is an important determinant of source of capital as
smaller companies find it hard in mobilising funds because of not having credit rating (poor
credit worthiness). In such circumstances, flexibility principle needs to be given special
attention to assure that as the company grows in size, it can easily access funds when needed
under acceptable terms. This is why common stock represents major portion of the capital in
smaller firms. Additionally, the control factor also invites special attention as larger concerns
have to employ different types of securities to procure desired amount of funds at reasonable
cost. To ensure availability of large funds for financing future expansion, concerns may insist
on flexibility principle. On the contrary, in medium sized companies who are in a position to
obtain the entire capital from a single source, leverage principle should be given greater
consideration so as to minimize cost of capital.
Form of Business Organization: In private limited companies where ownership is
closely held in a few hands, control principle is given more weightage. In case of public
limited companies, control principle may not be that effective (usability of the capital looms
large) as it is easier to acquire equity as well as debt capital. In proprietorship or partnership
firms, control is an important consideration because it is concentrated in a few hands.
Stability of earnings: With greater stability in sales and earnings, a company can
insist on leverage principle and accordingly it can undertake the fixed obligation debt with
low risk. But a company with irregular earnings will not choose to burden itself with fixed
charges. Such company should pay greater attention to risk principle.
Age of the firm: Younger companies find themselves in difficult situation to raise
capital in the initial years. It is, therefore, worthwhile to give more weightage to flexibility
principle so as to have as many alternatives open as possible in future to meet the growth
requirement. Established companies insist on cost principle.
Asset structure of the firm: A company which have invested major portion of funds
in long lived fixed assets and demand of whose products is assured, should pay greater

Corporate Financing Options in India: Banking vs. Capital Markets
43
attention to leverage principle to take advantage of cheaper source of fund. But risk principle
is more important for a firm whose assets are mostly receivables and inventory.
Credit standing: A company with high credit standing has greater ability to adjust
sources of funds. In such a case, the management should pay greater attention to flexibility
principle.
Attitude of management: Attitude of persons who are at the helm of affairs of a
company need to be analyzed in depth while assigning weights to different factors affecting
the pattern of capitalization. Where the management has strong desire for exclusive control,
preference is given to borrowing in order to be assured of continued control. If the principal
objective of the management is to stay in office, they insist more on risk principle. But
members of the Board of Directors who have been in office for pretty long time feel
relatively assured and they prefer to insist on cost principle.
3.4 Review of Capital Structure Theories
The capital structure of a firm as determined by its financing decision, affects its cost
of capital. There are different viewpoints on the impact of the debt-equity mix on the
shareholders’ wealth. One set of thought strongly supports the argument that the financing
decision has major impact on the shareholders’ wealth, while the other group refutes it.
Traditionalists argue that the firm can lower its cost of capital and increase the market value
per share by the judicious use of leverage. On the other hand, Modigliani & Miller argue that
in the absence of taxes and other market imperfections, the total value of the firm and its cost
of capital are independent of capital structure. The capital structure decision of the firms is
based on some of the important criteria. Most of these capital structure literatures deal with
concern the following questions: How do firms finance their operations?, which factors
influences these choices?, is it possible to increase the firm value just by changing the mix of
securities issued? and is there an optimal debt-equity combination that maximizes the value
of the firm? The set of theories explaining the relationship between capital structure, cost of
capital and value of the firm are elaborated below.
3.4.1 Net Income Approach
David Durand (1963) has suggested that the capital structure decision is relevant to
the valuation of the firm. His approach was based on the three assumptions i.e., there are no

Corporate Financing Options in India: Banking vs. Capital Markets
44
taxes, the cost of debt is less than the cost of equity and the use of debt does not change the
risk perception of the investors. Based on all the three assumptions, he argued that a change
in the capital structure leads to a corresponding change in the overall cost of capital as well as
the total value of the firm. If the ratio of debt to equity is increased, the weighted average cost
of capital will decline, while the value of the firm as well as the market price of ordinary
shares will increase. Conversely, a decrease in the leverage will cause an increase in cost of
capital and a decline in the value of the firm as well as that of the market price of equity
shares.
The argument is based on the logic that as the degree of leverage increases, the
weighted average cost of capital tends to decline and this leads to an increase in the total
value of the firm. Thus, the cost of debt being constant, the increased use of debt will
magnify the shareholders’ earnings and thereby the market value of the ordinary shares as
well. The argument suggests that the firm can employ almost 100% debt to maximize its
value.
3.4.2 Net Operating Income Approach
This approach suggests that there is nothing such as an optimum capital structure.
Any capital structure is optimum for the firm. This approach is also advocated by David
Durand but is diametrically opposite to the Net Income Approach. This approach believes
that the market value of a firm depends on its net operating income and business risk. The
change in the degree of leverage employed by a firm cannot change these underlying factors.
It merely changes the distribution of income and risk between debt and equity without
affecting the total income and risk which influence the market value of the firm.
It argues that the capital structure decision of the firm is irrelevant. Any alteration in
leverage will not lead to any change in the total value of the firm and the market price of
shares, as the overall cost of capital is independent of the degree of the leverage. This
approach is based on the assumptions that: a) the overall cost of capital remains constant for
all degrees of leverage, b) the value of equity is residual which is determined by deducting
the total value of debt from the total value of the firm, c) the cost of equity increases with the
degree of leverage as with the increase in the proportion of debt the financial risk of the
shareholders will increase. To compensate for the increased risk, the shareholders expect a
higher rate or return and finally, d) the cost of debt has two parts: explicit and implicit cost.
The explicit cost is represented by the rate of interest. Irrespective of the degree of leverage

Corporate Financing Options in India: Banking vs. Capital Markets
45
the firm is assumed to be able to borrow at a given rate of interest. This implies that the
increasing proportion of debt in the financial structure does not affect the financial risk of the
lenders and they do not penalize the firm by charging higher interest.
However, an increase in the degree of leverage causes an increase in the cost of
equity. This increase in cost of equity being attributable to the increase in debt is implicit part
of cost of debt. Thus the advantage associated with the use of debt supposed to be a cheaper
source of funds in terms of the explicit cost is exactly neutralized by the implicit cost
represented by the increase in cost of equity. As a result, the real cost of debt and the real cost
of equity according to Net Operating Income are the same and equal to overall cost. It does
not matter howsoever is the degree of leverage, the total value of the firm will remain
constant. The market price of shares will also not change with the change in the leverage
ratio.
3.4.3 Traditional Approach
The Traditional Approach is a mid-way approach between the Net Income and Net
Operating Income approach. It partly contains features of both the approaches. The traditional
approach accepts that the capital structure of the firm affects the cost of capital and its
valuation. However, it does not subscribe to the Net Income approach that the value of the
firm will necessarily increase with all degrees of leverages. Rather, it subscribes to the net
operating income approach which says that beyond a certain degree of leverage, the overall
cost of the capital increases resulting in decrease in the total value of the firm. Importantly, it
differs from net operating income approach in the sense that the overall cost of capital will
not remain constant for all the degree of leverages.
The essence of the traditional approach highlights that a firm uses an optimum
leverage ratio through judicious use of debt-equity mix to increase its total value and thereby
reduces its overall cost of capital. Summing up, a traditional approach highlights that up to a
point, the content of debt in the capital structure will favourably affect the value of the firm
and beyond that point the use of debt will adversely affect the value of the firm. At this level
of debt-equity mix the capital structure will be optimum.
3.4.4 Modigliani-Miller Approach
The Modigliani-Miller (MM) theorem was proposed by Franco Modigliani and
Merton Miller. This is treated as the basis for modern thinking on capital structure. The

Corporate Financing Options in India: Banking vs. Capital Markets
46
theorem argues that in a perfect market, the value of a firm is irrelevant to how that firm is
financed. The benchmark MM Irrelevance Propositions is the cornerstone of capital structure
theory.
The theory assumed a perfect capital market where information is symmetrically
available to all agents. There is absence of transaction and bankruptcy cost, and the securities
are infinitely divisible. Managers act in the interest of shareholders and the firms can be
grouped into equivalent risk classes on the basis of their business risk. Most importantly it
argues that there is no tax.
Under the above set of assumptions Modigliani and Miller (1958) postulated three
propositions. The first irrelevance proposition says that, a firm’s total market value is
independent of its capital structure. This proposition was more or less similar to that of the
net operating income approach. They viewed the value of a firm as a function of expected
operating income divided by the discount rate appropriate to its risk class, and proved that the
average cost of capital within a given class is independent of the degree of leverage.
The proposition II held that a firm’s cost of equity increases linearly with its debt-
equity ratio. Financial leverage adds to expected earnings per share while the share price
remains constant. This is due to the reason that the change in the expected earnings is offset
by a corresponding change in the return expected by the shareholders.
Proposition III suggests that an investment financed by common stock is
advantageous to the current stockholders if and only if its yield exceeds the capitalization
rate. When a corporate income tax, under which interest is a deductible expense is
considered, gain can accrue to stockholders from having debt in the capital structure, even
when capital markets are perfect.
Modigliani and Miller (1963) took taxation under consideration and proposed that the
firms should employ as much debt as possible. Companies have an advantage in using debt
rather than using internal capital, as they can benefit from debt tax shields. This tax shield
allows firms to pay lower tax than they should, when using debt capital instead of using only
their own capital. The theory argues that the more debt is, the more a firm’s value is created.
However, the theorem and its irrelevance propositions are valid only in case of a
perfect market structure which is a rare phenomenon. Relaxing these assumptions, which is a

Corporate Financing Options in India: Banking vs. Capital Markets
47
common phenomenon in the real world that is characterised by various imperfections such as
existence of taxes, bankruptcy costs, agency costs, and informational asymmetries, MM
theorem rarely holds. Post Modigliani and Miller's (MM) path-breaking article in 1958,
whether an optimal capital structure exists, has been academically and intensively studied.
Relaxing some of the assumptions of Modigliani and Miller's (MM) approach is discussed
below.
3.4.5 Relaxing the Taxes and Capital Structure Condition
One of the most important imperfections is the presence of taxes. When taxes are very
much applicable to corporate income, debt financing is advantageous. Modigliani and Miller
(1963) in the work “Corporate Income Taxes and the Cost of Capital: A Correction” have
made a correction to bring out the tax advantages of debt financing. The study argued that
the value of a firm is a function of leverage and the tax rate. While dividends and retained
earnings are not deductible for tax purposes, interest on debt is a tax- deductible expense. As
a result, when debt capital is used, the total income available for both the shareholders and
debt holders is greater than to others. The tax deductibility of corporate interest payments
favors the use of debt.
However the existence of other taxes, personal taxes (Miller 1977) and non-debt tax
shields (DeAngelo and Masulis 1980) makes the case different. Castanias (1983) cross-
sectional test of capital structure irrelevance hypothesis and the tax shelter-bankruptcy cost
hypotheses showed results inconsistent with the capital structure irrelevance hypothesis but
consistent with the tax shelter-bankruptcy cost hypotheses. The results were consistent with
the thesis that ex-ante default costs are large enough to induce the typical firm to hold an
optimum mix of debt and equity.
Stulz (1990) argued that debt can have both a positive as well as negative effect on the
value of the firm (even in the absence of corporate taxes and bankruptcy cost). Stulz (1990)
argued that as managers have zero equity ownership in the firm, this might tempt them to
often undertake negative present value projects. To solve this problem, shareholders may
force firms to issue debt; however, if firms are forced to pay out funds, they may have to
forgo positive present value projects. Therefore, the optimal debt structure is determined by
balancing the optimal agency cost of debt and the agency cost of managerial discretion.

Corporate Financing Options in India: Banking vs. Capital Markets
48
Not surprisingly, there are some controversial findings. Schnabel (1984) in the study
titled, ‘Bankruptcy, interest tax shields and 'optimal' capital structure: A cash flow
formulation’ showed that an optimal capital structure does not involve exclusive reliance on
debt financing in contrast to the classic result of Modigliani and Miller. Berens and Cuny
(1995) have revisited the capital structure puzzle in perspective of growth. Real growth
distorts the debt ratio as a measure of tax shielding. They argued that firms typically issue
debt characterized by fixed interest payments, even when they expect positive growth in
earnings. To totally shield itself from corporate tax, a firm is not advised to set debt equal to
firm value. Instead, it should set its current interest payments equal to current earnings.
The main benefit of debt is tax deductibility of interest and the costs are bankruptcy
cost (Kim, 1978) and agency cost (Jesen and Meckling, 1976; Myers, 1977). MacKie-Mason
(1990) studied the tax impact on the choice between debt and equity and concluded that
changes in the marginal tax rate for any firm should affect financing decisions.
Booth et al (2001) use the average tax rate, arguing that it includes the impact of tax
loss carry forwards and the use of the corporation as a conduit for income inflows. The
average tax rate would affect financing decision.
3.4.6 Merton Miller Argument
Merton Miller argued that the original MM proposition, which says that financial
leverage does not matter in a tax free world, is valid in a world where both corporate and
personal taxes exist. The study argued that the changes in the capital structure have no effect
on a firm’s total valuation. This proposition is the same as Modigliani-Miller’s original
proposition in a world of no taxes, but it contrasts sharply with their 1959 corporate tax
adjustment article, in which they found that debt had substantial advantage and companies
will continue issuing debt till the tax rate for the marginal bondholders is the same as the
corporate tax rate. Beyond this point, there is no tax advantage to companies from issuing
debt.
Miller’s equilibrium has the personal tax effect entirely offsetting the corporate tax
advantage. Accordingly, his model implies that at the margin, the personal tax rate on debt
income must equal to the corporate tax rate and in that scenario, changes in the proportion of
debt in the capital structure do not change the total after-tax income to investor. As a result,
capital structure decisions by the corporation would be irrelevant.

Corporate Financing Options in India: Banking vs. Capital Markets
49
3.4.7 Trade-off Theory
This theory argues that a firm’s capital structure decision involves a trade-off between
the tax benefit of debt financing and the costs of financial distress. When firms adjust their
capital structure, they tend to move towards a target debt ratio that is consistent with theories
based on tradeoffs between the costs and benefits of debt. Management always evaluates the
various costs and benefits of alternative leverage plans and strives to bring a trade-off
between them and a solution is obtained to balance marginal costs and marginal benefits. It
also said that firms are assumed to trade-off the tax benefits of debt with the bankruptcy costs
of debt when making their decisions.
Trade-off theory allows the bankruptcy cost to exist. It states that there is an
advantage to financing with debt (the tax benefit of debts) and that there is a cost of financing
with debt (the bankruptcy costs of debt). The marginal benefit of further increases in debt
declines as debt increases, while the marginal cost increases, so that a firm that is optimizing
its overall value will focus on this trade-off when choosing how much debt and/or equity is
used for financing.
3.4.8 Static Trade-off Theory
Static trade-off theory as suggested by Myers (1984), proposes that a firm is viewed
as setting a target debt to value ratio and gradually moving towards it. It suggests that every
firm has an optimal debt–equity ratio that maximizes its value. The theory also affirms that
firms have optimal capital structures, which they determine by trading off the costs against
the benefits of the use of debt and equity. The benefits from debt tax shield are thus adjusted
against cost of financial distress. It also argued that, agency cost, informational asymmetry
and transaction cost are some of the other costs to be mitigated.
The theory predicts that an optimal target financial debt ratio exists, which maximizes
the value of the firm. The optimal point can be attained when the marginal value of the
benefits associated with debt issues exactly offsets the increase in the present value of the
costs associated with issuing more debt (Myers, 2001). Transaction costs play an important
role in a firm’s capital structure decision. Transaction costs associated with obtaining new
external financing are higher than the costs of obtaining internal financing. Internal funds do
not bear any transaction costs. Studies are consistent with the pecking order theory (Gaud et
al., 2005; Mazur, 2007).

Corporate Financing Options in India: Banking vs. Capital Markets
50
3.4.9 Dynamic Trade-off Theory
In identifying the optimal capital structure of a firm, the role of time is very crucial. In
a dynamic model, the correct financing decision typically depends on the financing margin
that the firm anticipates in the next period. Some firms expect to pay out funds in the next
period, while others expect to raise funds. Stiglitz (1972) took the drastic step of assuming
away uncertainty. The first dynamic models to consider the tax savings versus bankruptcy
cost trade-off are Kane, Marcus, and MacDonald (1984) and Brennan and Schwartz (1984).
Their models took into consideration of the following factors; uncertainty, taxes, and
bankruptcy costs, but no transaction costs. These firms maintain high levels of debt to take
advantage of the tax savings and to adjust to shocks without any cost as there is no
transaction cost. The theory suggests that if the firms optimally finance only periodically
because of transaction costs, then the debt ratios of most firms will deviate from the
optimum, most of the time. The theory also highlights that if the firm's leverage reacts less to
short-run equity fluctuations and more to long-run value changes.
3.4.10 Pecking Order Theory
Donaldson (1961) and Myers (1984) have viewed that management follows a
preference ordering when it comes to financing. The argument says that the costs of issuing
risky debt or equity overwhelm the forces that determine optimal leverage in the trade-off
model and hence resulting into preference for pecking order. The trade-off theory fails to
predict the wide degree of cross-sectional and time variation of observed debt ratios. The
pecking order theory is mainly a behavioural explanation of financing pattern of certain
companies. It is consistent with some rationale arguments, such as asymmetric information
and signalling, as well as with flotation costs. Moreover, it is consistent with the observation
that the most profitable companies within an industry tend to have the least amount of
leverage.
The pecking order theory is popularized by Myers (1984) which argues that equity is
a less preferred means to raise capital because when managers (who are assumed to know
better about true condition of the firm than investors) issue new equity, investors believe that
managers think that the firm is overvalued and managers are taking advantage of this over-
valuation. As a result, investors will place a lower value to the new equity issuance.

Corporate Financing Options in India: Banking vs. Capital Markets
51
The pecking order theory rightly explains why the bulk of external financing comes
from debt, and why more profitable firms borrow less not just because of their low target debt
ratio. The order of financing is seen as follows; a) firms prefer internal finance, b) if external
finance is required, firms issue the safest security first. They start with debt, then possible
hybrid securities such as convertible bonds, then perhaps equity as a last resort. This theory
argues that profitable firms prefer internal funds and when external funds are required, the
firm will borrow. Financing through equity issuing is the least preferred option. The pecking
order theory assumes that there is no target capital structure.
This theory suggests that firms avoid external financing while they have internal
financing available and avoid new equity financing while they can engage in new debt
financing at reasonably lower interest rate. This theory is based on the assertion that the
managers have more information about their firms than the investors. This disparity of
information is referred to as asymmetric information. Other things being equal, because of
asymmetric information, managers will issue debt when they are positive about their firms’
future prospects and will issue equity when they are unsure.
The determination of capital structure in practice involves considerations in addition
to the concerns about earning per share, value and cash flow. A firm may have enough debt
servicing ability but it may not have assets to offer as collateral. Attitudes of firms with
regard to financing decisions may also be quite often influenced by their desire of not losing
control, maintaining operating flexibility and have convenient timing and cheaper means of
raising of funds.
3.4.11 Signalling Theory
Noting the inconsistency between trade-off theory and the observed pecking order of
financing, Myers and Majluf (1984) proposed a new theory, called the signalling, or
asymmetric information theory of capital structure. The study highlighted that with
asymmetric information, equity issues are rationally interpreted on average as bad news,
since the managers are motivated to make issues when the stock is overpriced. This theory
argues that if firms issue no new security but only use its retained earnings to support the
investment opportunities, the information asymmetric can be resolved. That implies that
issuing equity becomes more expensive as asymmetric information insiders and outsiders
increase. Firms whose information asymmetry is large should issue debt to avoid selling
under-priced securities. The capital structure decreasing events such as new stock offering

Corporate Financing Options in India: Banking vs. Capital Markets
52
leads to a firm’s stock price decline. An announcement of increasing capital structure events
is received by the market as good news because financial intermediaries like investment bank
can become insiders to monitor the firm’s performance.
3.4.12 Market Timing Theory
Baker and Wurgler (2002) have suggested a new theory of capital structure, the
“Market Timing Theory”. This theory states that the current capital structure is the
cumulative outcome of past attempts to time the equity market. Market timing implies that
the firms issue new shares when they perceive they are overvalued and that the firms
repurchase their own shares when they consider these to be undervalued. As a consequence,
current capital structure is strongly related to historical market values. The results suggest the
theory that capital structure is the cumulative outcome of past attempts to time the equity
market.
3.4.13 Free Cash Flow Theory
Myers (2001) argued that high debt levels will increase value, despite the threat of
financial distress, when a firm’s operating cash flow significantly exceeds its profitable
investment opportunities. Thus, the profit earning capacity increases the value of the firm
despite the threat of financial distress. Firms with a negative free cash flow increase their debt
ratio to respond to the lack of internal funds. The percentage adjustment is smaller for firms
with relatively more debt than for firms with relatively low debt. This theory mainly talks
about the matured firms those are prone to over invest. Firms with a positive free cash flow
use this cash flow to lower their debt ratio.
3.4.14 Bankruptcy Cost
This is one of the important imperfections affecting capital structure decision of a
firm. When a firm is unable to meet its obligations, it results in financial distress that can lead
to bankruptcy because a major contributor to financial distress is debt. The greater the level
of debt, the larger the debt servicing burden associated with it and, the higher the probability
of financial distress. If there is a possibility of bankruptcy, and if administrative and other
costs associated with bankruptcy are significant, the leveraged firm may be less attractive to
investors than that of the unleveraged one. As a result, the investors are more likely to
penalize the price of the stock as leverage increases. This leads to rise in expected bankruptcy

Corporate Financing Options in India: Banking vs. Capital Markets
53
cost and a decline in profit. Hence this pushes less profitable firms toward lower leverage
targets.
Similarly, expected bankruptcy cost is higher for firms with more volatile earnings
that drive smaller, less-diversified firms towards fewer targets leverage. Baxter (1967) used
the concept of bankruptcy costs to argue for the existence of an optimal capital structure.
Expected bankruptcy cost depends on the cost of bankruptcy (legal fees, loss of sales,
employees and suppliers) and the probability of occurrence. Increased debt financing will
increase the probability of bankruptcy and will in turn increase expected bankruptcy costs.
The optimal debt ratio is reached when the marginal tax savings from debt financing is equal
to the marginal loss from expected bankruptcy costs. Bankruptcy cost is a cost directly
incurred when the perceived probability that the firm will default on financing is greater than
zero. One of the bankruptcy costs is liquidation cost, which represents the loss of value as a
result of liquidating the net assets of the firm. Another bankruptcy cost is distress cost, which
is the cost, a firm incurs if stakeholders believe that the firm will discontinue.
3.4.15 Agency Cost
The concept of agency cost was put forward by Jensen and Meckling (1976). It argues
that there is an agency relationship between the shareholders and creditors of firms that have
substantial amounts of debt, where the shareholders have little incentive to limit losses in the
event of a bankruptcy. Agency theory says that the interests of managers and shareholders
may conflict and managers may make major financial policy decisions on capital structure
which is sub-optimal from the shareholders' point of view. Usually, the managers are
interested in accomplishing their own targets which may differ from the firm value. The
owners may try to monitor and control the managers’ behaviours. These monitoring and
control actions results in agency costs of equity. When a lender provides money to a firm, the
interest rate is based on the risk of the firm. The manager may tempt to transfer value from
creditors to shareholders. These monitoring and control actions results in agency cost of debt.
Mehran (1992) viewed that compensation contracts, managerial equity investment,
and monitoring by the board of directors and major shareholders can reduce conflicts of
interest between the managers and the shareholders. The study also suggested that capital
structure models that ignore agency costs are incomplete. However, long back, Jensen and
Meckling (1976) argued that debt financing limits free cash flow available to the managers
and thereby helps to control agency problem.
Corporate Financing Options in India: Banking vs. Capital Markets
54
Myers (1977) put forth another type of agency cost of debt which arises from the
underinvestment problem. When a firm has debt which matures after an investment option
expires, shareholders save the incentive to reject projects that have positive net present values
because the benefits from accepting the projects accrues to the bondholders without
increasing the shareholders' wealth. The issuance of debt, therefore, leads to suboptimal
investment for the firm, requiring this type of agency cost to be traded off against the tax
savings of debt financing to determine the optimal capital structure. Ang, Cole, and Lin
(2000) on the other hand, stated that agency costs are significantly higher when an outsider
rather than an insider manages the firm and lower with greater monitoring by banks.
3.5 Sources of Finance for Corporate
Corporate can follow various ways to finance the investment appetite. There are
various sources of finance which can be classified on the basis of time period, ownership and
control, and the respective source of funding or source of generation of funding. Choosing
right source and the right pattern (mix) of finance are a matter of in-depth financial analysis
and pose a key challenge for every finance manager to have a primary understanding of the
characteristics of the financing sources. Sources are the point of generation of capital. All the
sources of capital have different characteristics to suit different types of requirements.
3.5.1 Sources of Finance by Time
Classifying the sources of finance on the basis of time period is commonly
classified into Short term, Medium term and Long term sources of financing.
Short Term Sources of Finance: Short term financing means financing for a period of
less than 1 year needed by firms mostly to meet short term financial requirements like to
finance the current assets such as inventory of raw material and finished goods, debtors,
maintaining minimum cash in hand and bank balance etc. Hence short term financing is
otherwise known as working capital financing. Short term finances are available in the
form of:
Trade Credit
Short Term Loans like Working Capital Loans from Commercial Banks
Fixed Deposits for a period of 1 year or less
Advances received from customers

Corporate Financing Options in India: Banking vs. Capital Markets
55
Creditors
Payables
Factoring Services
Bill Discounting etc.
Medium Term Sources of Finance: This is source of financing for a period of 3 to 5
years. It is needed mostly to a corporate firstly when, long-term capital is not available for
the time being and secondly, when a large amount of deferred revenue expenditures of the
current period are to be written off over a period of 3 to 5 accounting years. Medium term
financing sources can in the form of one of:
Preference Capital or Preference Shares
Debenture / Bonds
Institutional Loans from Financial Institutes/NBFIs, Government, and
Commercial Banks etc.
Lease Finance
Hire Purchase Finance
Long Term Sources of Finance: Long-term financing meets the capital requirement
over a period of more than 5 years to 10, 15, 20 years or maybe more depending on other
factors. Capital expenditures in fixed assets like plant and machinery, land and building
etc. of a business including a part of the working capital that permanently stays with the
business are funded using long-term sources of finance. Long term financing sources can
be in form of any of them:
Share Capital or Equity Shares
Preference Capital or Preference Shares
Retained Earnings or Internal Accruals
Debenture / Bonds
Term Loans from Financial Institutes, Government, and Commercial Banks
Venture Funding
Asset Securitization
International Financing by way of Euro Issue, Foreign Currency Loans, ADR, GDR
etc.

Corporate Financing Options in India: Banking vs. Capital Markets
56
3.5.2 Sources of Finance by Ownership and Control
The source of capital on the basis of ownership and control is categorized in two
unique types. One is rate of interest of the capital and the other is sharing of ownership and
control. It is well known source of financing through debt and equity. Firms may choose
either of one or may go for a combination of both. When, firms may not like to dilute their
ownership rights in the business, they may prefer debt financing whereas others may believe
in sharing the risk, may choose equity. Strategically, firms may choose a combination of
both.
Borrowed Capital/Debt Instruments: Finance sourced through debt instruments are
generally borrowed at interest cost and can be borrowed from external financial sources like
financial institutions, commercial banks or even from public (people of the country) through
debt instruments like debentures, commercial papers, credit notes etc. The advantage of this
type of funding is that there no dilution of ownership or control on business of the
entrepreneur. Cost of debt is generally lower than that of equity because it is risk free and can
provide tax benefit by reducing taxable income. Moreover it gives business a leverage
benefit.
Owned Capital/Sharing Ownership: It is the source of financing through equity
capital by issuing equity shares. When the business grows and internal accruals like profits
of the company are not enough to meet financing requirements, the promoters have a
choice of selecting ownership capital. Owners’ capital is sourced from Equity Capital,
Preference Capital, Retained Earnings, Convertible Debentures, Venture Fund or from
Private Equity. In spite of dilution of ownership, equity financing carries certain
advantages such as it is a long term capital and is retailed permanently with the business
and there is no burden of paying interest or installments like borrowed capital. Moreover
the risk of bankruptcy also reduces. Businesses in infancy stages prefer equity capital for
this reason.
3.5.3 Sources of Finance by Generation of Funding
From the source of generation, it can be either internal or external source to generate
fund. Internal source of capital is the capital which is generated internally from the business
such as retained profits, reducing or controlling working capital, or from the sale of assets of
the business. It will have the same features of owned capital or equity. The best part of the

Corporate Financing Options in India: Banking vs. Capital Markets
57
internal sourcing of capital is that the business grows in accordance with the entrepreneur’s
strategy and does not depend on outside parties. As a result, in case of internal funding,
neither ownership is diluted nor fixed obligation / bankruptcy risk arises.
Similarly, an external source of finance is the capital which is sourced from outside
the business. Deciding the right source of finance is a crucial business decision taken by top-
level finance managers. The wrong source of finance increases the cost of funds which in turn
would have a direct impact on the profit and feasibility of project under concern. Improper
match of the type of capital with business requirements may go against the smooth
functioning of the business. For instance, if fixed assets, which derive benefits after 2 years,
are financed through short-term finances will create cash flow mismatch after one year and
managers will again have to look for finances and pay the fee for raising capital again.
3.6 Review of Literatures
Modigliani and Miller (1958) were the pioneers in theoretically examining the effect
of capital structure on a firm’s value. In their seminal papers (1958, 1963), they showed that
under the assumptions of perfect capital market, equivalent risk class, no taxes, 100%
dividend-payout ratio and constant cost of debt, the value of a firm is independent of its
capital structure. Hence in the perfect capital market, the capital structure does not affect a
firm’s value. It is the theory of capital structure irrelevance that a firm’s value depends on the
ability of its assets to create value, and is irrelevant if the assets originate in internal capital or
external capital.
3.6.1Global Experience
Modigliani and Miller (1958) in their paper ‘the cost of capital, corporation finance
and the theory of investment’ observed that the correlation between cost of capital and
leverage was significantly equal to zero. When a corporate income tax, under which interest
is a deductible expense, is considered, gain can accrue to stakeholders from having debt in
the capital structure even when capital markets are perfect.
David Durand (1963) criticized the Modigliani and Miller model on the ground that
the assumptions used in their model are unrealistic. He propounded the net income approach
of capital structure which states that firm can increase its value or lower the cost of capital by
using the debt capital. Solomon (1963) argued that the cost of debt does not always remain

Corporate Financing Options in India: Banking vs. Capital Markets
58
constant. It further explained that when the leverage level exceeds the accepted level, the
probability of default in interest payments increases thus raising the cost of debt.
Stiglitz (1969, 1974) proved the validity of the M-M model under relaxed
assumptions whereas Smith (1972), Krause and Litzenberger (1973), Baron (1974, 1975),
and Scott (1976, 1977), supported the M-M model, but only under the conditions of risk free
debt and costless bankruptcy. They argued that when bankruptcy has positive costs, there
exists an optimal capital structure which is a trade-off between tax advantage of debt and
bankruptcy costs.
This trade-off theory was challenged by Miller (1977) on the ground that bankruptcy
and agency costs are too small to offset the tax advantage of debt. But when personal taxes
are taken into account, this advantage is completely offset by the disadvantage of personal
tax. Thus, in equilibrium, the value of a firm is independent of its capital structure, even the
market structure is imperfect.
In subsequent studies, De Angelo and Masulis (1980) rejected the Miller’s argument
and said that even if bankruptcy, agency and related costs are ignored, introduction of non-tax
debt shields is enough for a firm to have an optimal capital structure. And even if these costs
are taken into account, an optimal capital structure exists, irrespective of availability of non-
debt tax shields. Their study demonstrated that with the presence of corporate tax shield
substitutes for debt, each firm will have a “unique interior optimum leverage decision with or
without leverage related costs”.
Ghemawat and Caves (1986), in their study titled ‘Capital commitment and
profitability: An empirical investigation’ studied that, Opportunities to pre-commit costs can
either increase the rents of incumbent firms (by deterring entry), or decrease them (through
commitment races and lapses into non-cooperation). Authors seek to discriminate statistically
between these predictions in the determinants of profits of businesses in a cross-section of
concentrated markets for producer nondurables. They concluded that profits decline with
deepening of capital intensity. The study argued cut-throat competition as a result of capital
intensity might eliminate all future profits, depressing each firm’s security level. Overall, a
business's profitability declines with its industry's scope for pre-committing production
capacity (sunk costs). However, variables interacted with the scope for commitment does not
point clearly toward one or the other mechanism. Therefore, commitment opportunities seem

Corporate Financing Options in India: Banking vs. Capital Markets
59
likely to lead to deterrence and non-cooperative rivalry in proportions that differ
idiosyncratically among markets.
However, capital structure decision is an unresolved issue as there is no definite
pattern observed. Jensen and Meckling (1976) highlighted the agency cost involved in
conflict of interest between the managers and the shareholders which leads to finance
investment opportunities through outside fund. Myers (1984) suggested a hierarchy for
funding known as pecking order theory that suits to large size firms with considerably high
profit. The signaling theory pioneered by Gordon Donaldson (1961) and further developed by
Myers and Majluf (1984) and others portrayed the bad signal that the firm would confer if
they issue equity capital instead of debt capital which forces the firm to issue debt capital.
The papers analysed in detail highlights the role played by the debt capital in determining the
optimal capital structure which would enable the firm to increase its profit and thereby
improve the value of the firm. Al-Sakran (2001), Kayo and Kimura (2010) got the evidence
in support of pecking order theory.
Ross (1977) suggested that the value of firms will rise with leverage as increasing
leverage drives market perception of value. Asquith and Mullins (1983), Masulis and Korwar
(1986), and Mikkelson and Partch (1986) also empirically observed that announcements of
new equity issues are greeted by sharp declines in stock prices. This is a major reason why
equity issues are comparatively rare among large established corporations. Harris and Raviv
(1990) highlighted that debt also plays an important role in allowing investors to generate
information useful for monitoring management and implementing efficient operating
decisions. Moreover, risk of the firm’s return is unknown to investors. They are forced to rely
on noisy signals such as the firm’s level of capital structure to determine the risk of their
investment and the firm’s value may be under-priced by the market (Myers and Majluf,
1984).
Harris (1988), in the paper titled, ‘Capital intensity and the firm's cost of capital’,
explored whether specification errors rather than measurement errors explained empirical
result. It was observed that negative capital intensive coefficients in structure-performance
equations support allegations of gross measurement error in accounting-based measures of
economic profitability. The result was consistent with theoretical prediction that both higher
predicted profitability and higher capital requirements increase capital intensity. Higher firm-
specific cost of capital reduces capital intensity.

Corporate Financing Options in India: Banking vs. Capital Markets
60
Titman and Wessels (1988) in their paper, “The determinants of capital structure
choice”, analyzed the explanatory power of some of the theories of optimal capital structure.
The study extends empirical work on capital structure theory in three ways. First, it examines
a much broader set of capital structure theories, many of which have not previously been
analyzed empirically. Second, since the theories have different empirical implications in
regard to different types of debt instruments, the authors analyze measures of short-term,
long-term, and convertible debt rather than an aggregate measure of total debt. Third, the
study used a factor-analytic technique that mitigates the measurement problems encountered
when working with proxy variables. It observed an opposite relation between collateralizable
capital and debt level. This is because a manager wants to avoid secured debt financing as
they increase the level of monitoring and reduce the level of perquisites. It observed that
future growth rates were negatively related to long-term debt, accepting the pecking order
theory which assumes that firms give more preference to retained earnings when deciding
about financing a project.
Pinegar and Wilbricht (1989), in a study titled “What managers think of capital
structure theory: A survey” analyzed the responses received from 176 firms chosen out of the
list of fortune 500 firms for 1986, out of which, 121firms indicated that they follow a
financing hierarchy, while 47 indicated that they seek to maintain a target capital structure.
The financing hierarchy showed that the managers first prefer internal equity (retained
earnings) for financing new projects. The next priority goes to straight debt, convertible debt,
external common equity, straight preferred stock and convertible preferred stock in a
sequence. So the projected cash flow from the asset is the major determinant of the choice of
the managers among various sources of capital, leading to conclude that corporate managers
are more likely to follow a financing hierarchy than to maintain a target debt- equity ratio.
Harris and Raviv (1991), in their paper titled “The theory of capital structure” have
used the agency cost, asymmetric information, product/input market interactions and
corporate control considerations (but excluded tax-based theories) concepts in analysing the
capital structure. The study concluded that in the agency model the leverage is positively
associated with a firm’s value and is negatively related to the extent of growth opportunities,
interest coverage, and the cost of investing firm prospects. However, the study also
highlighted that leverage of a firm increases with the extent of informational asymmetry.

Corporate Financing Options in India: Banking vs. Capital Markets
61
Givoly Collins et al. (1992), in their work “Taxes and Capital Structure: Evidence
from Firms' Response to the Tax Reform Act of 1986” studied the interaction between taxes
and leverage decisions in a controlled environment in the years surrounding the enactment of
the Tax Reform Act. The results supported the tax-based theories of capital structure and
indicated that there exists a substitution effect between debt and non debt tax shields, and that
both corporate and personal tax rates affect leverage decisions.
Rajan and Zingales (1995), in paper titled “What do we know about capital structure?
Some evidences from international data” investigated the determinants of capital structure
choice by analyzing the financing decisions of public firms in the major industrialized
countries. At an aggregate level, firm leverage was found to be fairly similar across the G-7
countries. Profit was found to be negatively correlated with leverage. They stated that in the
short run, dividends and investments were fixed, and if debt financing was the dominant
mode of external financing, then changes in profit will be negatively correlated with changes
in leverage. Large firms tend to issue less equity. They also emphasized that the negative
influence of profit on leverage should become stronger as firm size increases.
Hovakimian, Opler, and Titman (2001) in their empirical work argued that firms may
face impediments to movements toward their target ratio, and that the target ratio may change
over time as a firm's profitability and stock price change. Masulis (1980, 1983), Brennen and
Schwartz (1978) and Jensen and Meckling (1976) also advocated the existence of an optimal
capital structure in an imperfect market, while using different mechanisms.
Empirical work by Bradley, Jarrell and Kim (1984), Long and Malitz (1985) and
Titman and Wessells (1985) largely supports bankruptcy costs or agency costs as partial
determinants of leverage and of optimal capital structure.
The finding of Berger (2002) was consistent with the agency costs hypothesis, i.e.
higher leverage or a lower equity capital ratio is associated with higher profit efficiency, all
else equal. Additionally the study also concluded that under the efficiency risk hypothesis,
the expected high earnings from greater profit efficiency substitute for equity capital in
protecting the firm from the expected costs of bankruptcy or financial distress, whereas under
the franchise-value hypothesis, firms try to protect the expected income stream from high
profit efficiency by holding additional equity capital.
Corporate Financing Options in India: Banking vs. Capital Markets
62
The study by Chudson (1945) got the direct evidence on the industries with high
proportion of fixed assets tending to use more long-term debt. Remmer et al. (1974)
suggested that certain institutional variables, earning rate seem to be more important as
determinants of debt ratio internationally. Toy et al. (1974) reported that the corporation size
and the industry-class do not appear to be determinants of debt ratio. Scott and Martin (1975)
concluded that industry-class is indeed a determinant of financial structure. They also
concluded that corporate size is the determinant of firm’s financial leverage ratio. Lulose
(1976) proved that the concern should reduce the proportion of borrowed funds either by
conversion of debts into equity or by retiring part of debt capital through the issue of further
shares.
Carelton and Siberman (1977) concluded that the higher the variability is in rate of
return on invested capital, the lower will be the degree of financial leverage adopted. They
also found the return on investment to be negatively correlated with the debt ratios. Ferri and
Jones (1979) concluded that the industry-class was linked to a firm’s leverage, but not in a
direct manner than what has been suggested in other researches. Myers (1977) argues that
firms with growth potential will tend to have less capital structure. Growth opportunities can
produce moral hazard effects and push firms to take more risk. In order to mitigate this
problem, growth opportunities should be financed with equity instead of debt.
Harris, Rodney, Roenfeldt and Cooley (1983) stated that financial leverage clienteles
play an important role in the determination of the capital structure. Richard Kolondy and
Diane Rizzule Suher (1985) indicated that no relationship is shown between shareholders
return and the company’s pre-issue degree of financial leverage. Kose John (1987) has
viewed that in case of pure signalling case, the equilibrium is characterized by direct
contractual pre-commitments to implement investment policies, which is riskier than pare to-
optimal levels.
Mathew (1991) studied the relationship between capital structure and value of the
firm. It aimed to find the significance of differences in capital structures of different
companies inter and intra industry. The results supported the view that an increase in leverage
leads to a fall in the cost of capital as debt is a cheaper source than equity. It also pointed out
that the optimum debt level balances a decrease in the profitability of acquisition against a
higher share of the synergy for the target’s shareholders.

Corporate Financing Options in India: Banking vs. Capital Markets
63
Israel (1991) studied the capital structure theory based on corporate control
considerations. The study concluded that the optimum debt level balances, a decrease in the
profitability of acquisition against a higher share of the synergy for the target’s shareholders.
His study concluded certain implications: (a) the probability of firms becoming acquisition
targets decreases with their leverage, (b) acquirers' share of the total equity gain increases
with targets' leverage, (c) when acquisitions are initiated, targets' stock price, targets' debt
value, and acquirers' firm value increase, and (d) during the acquisition, target firms' stock
price changes further; the expected change is zero and the variance decreases with targets'
debt level.
Pettit and Singer (1985) argued that tax considerations are of little importance for
small firms because these firms are less likely to generate high profit and therefore are less
likely to use debt for tax shields. Large firms have an incentive to employ more debt because
they have tax deductible such as depreciation, research and development expense and
investment deductions.
Cressy and Olofsson (1997) argued that the growth of small firms is more sensitive to
internal finance than that of larger firms. For small firms the probability of facing financial
constraints is higher and that makes it harder to gain access to banking resources. The study
also argued that these small players are prepared to pay higher interest rates for additional
loans and don’t consider issuing external equity in order to stay in control.
Chungchang (1992) got the evidence that the leverage can be used as an instrument to
transfer wealth between investors and employees. The transfer can go in either direction. Hull
(2002) found that the industry debts to equity norms are significantly more negative than the
returns for the firms moving closer to these norms. Rajan and Zingales (2002) in their study
found that Firms across G-7 countries are fairly leveraged to same extent, with only UK and
Germany being relatively less leveraged. Nissim and Penman (2003) concluded that the
financial statement analysis distinguishes leverage in financing activities from leverage in
operations. Tucker (2007) tried to understand whether industry-optimal gearing ratio
targeting behaviour arises in the long run while a hierarchy of financing (or pecking order)
arises in the short run. The relationship between components of common corporate gearing
ratios is investigated using a Johansen co-integration methodology. Evidence of target
adjustment is found, though only with respect to certain gearing ratios.

Corporate Financing Options in India: Banking vs. Capital Markets
64
Smith and Watts (1992) observed the negative relation between debt and growth
opportunity. On the other hand, firms with high growth will tend to look to external funds to
fit the growth (Michaelas et al., 1999). Growth is likely to put a strain on retained earnings
and push the firm into borrowing. Firms would look to short-term, less long-term for their
financing needs. Studies found growth is positively related to capital structure (Michaelas et
al. 1999; Bevan and Danbolt, 2002; Eriotis, 2007).
Bhaduris (2002) suggested that dividends are the signal of financial health to
outsiders. A firm with a constant stream of dividends will face less asymmetric information
when entering into the equity market. Dividend payments decrease with the amount of
internal funds and increase with the need for external financing. Dividend policy allows for
releasing of resources when a firm has no profitable projects and conveys information about a
firm’s future expectations to capital markets. Booth et al (2001), Amidu (2007), Abor and
Biekpe (2006), Abor and Biekpe (2009) observed that size plays an important role in capital
structure. Frank and Goyal (2004) observed a positive relationship between payout ratio and
debt.
Hussain and Matlay (2007) assert that small firms strive for external sources of
finance only if the internal sources are exhausted. These firms try to meet their financial
needs with a pecking order of personal and retained earnings, debt and issuance of new
equity. Small firms are often managed by very few managers whose main objective is to
minimize the intrusion in their business and that are why internal funds will lie in the first
place of their preference of finance. If internal funds are not enough, small firms will prefer
debt to new equity mainly because debt means lower level of intrusion and lower risk of
losing control.
Daskalakis and Psillaki (2008) concluded that the behaviour of the small firms can be
easily linked to the pecking order theory as these firms borrow as their investment needs
rather than an attempt to achieve an optimal capital structure.
Ang and McConnel (l982) viewed that large firms are less susceptible to bankruptcy
as they tend to be more diversified than smaller companies. Hence, lower expected
bankruptcy costs enable large firms to take on more debts. Padron et al. (2005) suggested that
large firms can reduce the level of information asymmetries in the market and obtain

Corporate Financing Options in India: Banking vs. Capital Markets
65
financial resources more easily. They argued that among two companies with same
profitability, larger company will get more external finance than the smaller one.
Ceston and White (2003) suggested that the small firms find it more difficult to access
financial services due to greater information and transaction costs. They argued that
information cost can be considered nil for internal finance but are very high when issuing
new capital, whereas debt lies in an intermediate.
Tucker and Lean (2003) believed that fixed transaction costs prevent small firms from
accessing financial services and disproportionately help large firms. Small firms do not bear
higher business risk but also higher financial distress risk. Banks tend to respond to this risk
by the value of collateral available. This creates a problem for small firms in that they often
do not have significant fixed assets to secure.
Miao (2005), in a paper “Optimal capital structure and industry dynamics” provided a
competitive equilibrium model of capital structure and industry dynamics. He indicated that
firms make financing, investment, entry, and exit decisions subject to idiosyncratic
technology shocks. The capital structure choice reflects the trade-offs between the tax
benefits of debt and the associated bankruptcy and agency costs. More efficient firms are less
likely to exit and have lower agency costs. It was concluded that interaction between
financing and production decisions is important in an industry equilibrium after analyzing the
changes in technology growth, technology risk, entry distribution, entry cost, fixed cost,
bankruptcy cost, and tax policy.
Padron et al. (2005) argued that large firms with regular dividend payment history can
obtain financial resources more easily. This is based on the belief that large firms, when issue
more dividend to their stock holders, will tend to borrow less money from banks compared to
small firms will do. More profitable firms have more internal financing available. That
suggests when firms lacking internal funds are using more debt financing. This supports the
pecking order theory and confirms the findings of some earlier studies (Gaud et al. (2005),
Amidu (2007), Chakraborty (2010), Vanacker and Manigart (2010)).
Michaelas et al (1999) argued that firms with high growth are more likely to exhaust
internal funds and require additional capital. The coefficient of growth opportunity and
capital structure is significant positive. Growth is likely to put a strain on retained earnings
Corporate Financing Options in India: Banking vs. Capital Markets
66
and push the firm into borrowing. Psillaki and Daskalakis (2009) believed that, the asset
structure is not correlated with capital structure. However, Hall et al. (2004) find a negative
relationship between the short-term debt and the asset structure and a positive relationship
between long-term debt and asset structure.
Banks and capital markets, rather than simply being competitors, are in fact
complement to each other. Capital market development lowers the cost of bank equity
capital, and enables banks to raise extra capital needed to take on riskier loans which they
would otherwise reject. Banks have a comparative advantage in assessing credit quality and
therefore granting and renewing bank loans should provide positive signals to outside
investors (Fama 1985), especially when the borrowing firms do not have an established
reputation. For this interconnectedness and mutually dependency, efforts should be made to
develop both the sectors side by side.
Fama (1985) and Diamond (1991) have suggested that as banks have a comparative
advantage in assessing credit quality, then granting and renewing bank loans should provide
positive signals to outside investors, especially when the borrowing firms do not have an
established reputation. This is already a proven success story as James (1987) analyses the
impact of loan announcements on firms’ stock returns, and compares it with that of other
financings. He finds that bank loan agreements convey positive information to investors on
borrowing firms’ prospects in that these firms show higher excess returns around the event
date than for alternative financings.
Song and Thakor (2010) further argue that such a co-dependence connects the banks
and markets through two channels - securitization and regulatory requirements of risk-
sensitive bank capital. Under the process of securitization, through credit screening the
banking system certifies a borrower’s credit quality (hence the importance of ensuring the
quality of loan origination for developing a credible and sustainable securitization market)
and the markets provide the financing. Development of capital markets eases financing
friction and thus reduces the cost of capital for banks. This helps banks in raising additional
capital to extend riskier loans which they might avoid otherwise.
3.6.2 Indian Experience
Study by Chandra (1975) got the evidence of a significant relationship between the
share price and return, risk, growth size, leverage, etc. It also concluded that leverage in the

Corporate Financing Options in India: Banking vs. Capital Markets
67
capital structure is one of the factors affecting the value of a share of a firm. Venkatesan
(1983) found that only debt coverage ratio was found to be the important variable
significantly affecting the financial structure of the firm.
Study by Sharma (1986) on the financial appraisal of Industrial corporations in India
concluded that there may not be a uniform capital structure which will suit the requirements
of all the companies. Capital structure has to be tailored to suit the needs of every individual
company. However, the study viewed that it is possible to frame a model capital structure for
a group of companies having similar characteristics.
The study by Pandey (1984) and Bhatt (1990) revealed that the corporate managers
generally prefer borrowings to owned funds because of the advantage of the lower cost and
no dilution of existing management control over the company.
Contrary to this view, the study by Babu and Jain (1998) argued that the corporate
firms in India show an almost equal preference for debt and equity in designing their capital
structure. Their study cited the freedom in paying dividend and ease in raising money are the
prime reasons for equity preference. Additionally, intense completion has dented returns
which is the reason why firms do not prefer debt over equity even though debt is a cheaper
source of finance backed by tax advantage.
Pandey (1992) observed that the M-M theory is not fully valid under Indian
conditions. His study concluded that, initially, the cost of capital and value of a firm are
independent of the capital structure changes, but they rise after a certain level. Though the
earlier study, Pandey (1988) revealed that the tendency of large size companies is to
concentrate in the high-level leverage, but it was difficult to conclude that the size has an
impact on the degree of leverage.
Sengupta (1998) in the paper titled “Corporate disclosure quality and cost of debt”,
made an attempt to prove that the firms with high disclosure quality rating from financial
analysts enjoy a lower effective interest cost of issuing debt. The paper investigated the link
between a firm’s overall disclosure quality and its cost of debt financing. Sample of 114 firms
were taken in total and 103 firms with total interest cost were taken for regression. The study
concluded that there exists a significant negative association between a measure of a firm
over all disclosure quality and two alternative measures of firms incremental borrowing cost.

Corporate Financing Options in India: Banking vs. Capital Markets
68
Rao and Mohana (1989) concluded that there is a negative correlation between
retained earnings and the debt-equity ratio in the sense that a company with higher volume of
retained earnings had low debt equity ratio.
Study by Sharma and Rao (1969) tested the M-M model using cross-sectional analysis
for engineering companies and found that the value of a firm was independent of its capital
structure after allowing for tax advantage. Kakani (1999) highlighted that diversification
strategy is a significant strategy and sizes were found to be of insignificant in deciding the
leverage level of the firm.
Kotrappa (2000) stated that the choice between debt and equity sources of capital for
a corporate borrower is greatly influenced by factors viz., taxes on corporate income,
inflation, controlling interest and capital market reforms.
Sen and Pattanayak (2005) examined the issue of corporate financial structure and its
determinants by studying its association between observed leverage and a set of explanatory
variables. The result suggested that liquidity, size, efficiency and growth, quality of assets,
profitability and service diversification are the most critical factors influencing the capital
structure of the Indian banking firms.
Sahoo and Omkarnath (2005) in an attempt to find the determinants of capital
structure taking into account the three measurements of debt-equity choice such as short-
term, long-term and total debt ratio respectively found that some of the variables were
significant for some specific dependent variables. Their study found out that profitability,
asset structure were most significant factors deciding the capital structure instead of the firm
size and growth opportunity.
Dogra and Gupta (2009) studied the sources of funds of SME sector operating in the
state of Punjab. The study tried to find out the existence of the relationship between capital
structure of the firm and its characteristics. The Pearson chi-square statistics was highly
significant showing strong association of capital structure with the type of firm, age of the
firm, growth of the firm, degree of competition and level of capital investment but not by the
owner’s qualification.

Corporate Financing Options in India: Banking vs. Capital Markets
69
Malabika Deo and Jackline (2009), in their study titled “The determinants of debt
ownership structure: Some empirical evidence" found that firms across industries do not have
a specific norm or preference for debt choices. They concluded that the firms with low
profit/profitability go for long term borrowings while rising costs (both agency costs and
bankruptcy costs) associated with raising funds induced the firms to shift to short term
borrowings. The total debt increased with the increase in size for smaller sized and large
sized firms whereas it increases with the decrease in size of medium sized firms. However,
total debt came down with increase in profit and increased with rise in collateral assets.
Bhattacharjee (2010) in the paper titled “Determinants of capital structure of Indian
industries” conducted an empirical study of the determinants of capital structure of 151
selected firms across 13 industrial sectors. The major finding was that the variables like
liquidity and growth in terms of performance of the firms have significant influence on debt-
equity ratio. The study concluded that leverage varied across industries and between firms
belonging to the same industrial sector.
Vinayek and Gupta (2010), in their work “Determinants of capital structure in drugs
and pharmaceutical industry in India: A comparative study of pre and post-liberalization
period” examined the determinants of capital structure of firms in drugs and pharmaceutical
industry in pre-liberalization period and post-liberalization period. They found a significant
difference in the determinants of capital structure in pre-liberalization as well as on post-
liberalization periods. The variables like profit, capital intensity and collaterals which were
insignificant in the pre-liberalization period were significant to the market value debt equity
ratios in the post- liberalization period, while size of the firm which was found to be the
significant determinant of capital structure in both the pre-liberalization and post-
liberalization period. They concluded that the difference was due to the changes in business
environment and capital market.
Sinha and Ghosh (2010) examined the adjustment speed in the dynamic capital
structure choice of the firms. The study tried to explore whether a firm’s recapitalization
policy that allows dynamic adjustments in leverage revision through two decision variables,
i.e., the target leverage and the adjustment speed. They found that the firms’ recapitalization
is subject to changes in the firm-specific as well as macroeconomic variables, where both the
target leverage and the adjustment speed are determined by the firm’s reactive and/or
proactive adjustment behaviours.
Corporate Financing Options in India: Banking vs. Capital Markets
70
Azhagaiah and Deepa (2011) in a study “Impact of firm size on the relationship
between profitability and capital structure” analyzed the impact of sales size on the
relationship between profit and leverage, considering the size as the control variable. The
findings proved that there exists a positive correlation between them in case of small size
firms while, the study showed a negative relation providing evidence that debt capital
decreases with increase in size of the firm.
Azhagaiah and Deepa (2011) in another empirical work “Choice of capital structure
model: An empirical analysis with reference to static trade-off vs. pecking order theories in
beverage and alcohol industry in India” attempted to determine the predictors of capital
structure in the beverage and alcohol industry in India and also to find out the approach
followed by these firms to decide their capital structure. The findings proved that pecking
order hierarchy is followed in beverage and alcohol industry in India. Collateral value of
assets and profit are found to be the major determinant of capital structure.
Azhagaiah and Deepa (2011), in an empirical work entitled “Determinants of
profitability: A study with reference to income size-wise analysis of selected firms” analyzed
the impact of income on determinants of profitability by grouping the firms of tea, dairy and
vegetable oil sector into three size categories viz., “low income”, “medium income”, and
“high income” firms based on their profit before interest tax and depreciation. The results
indicated that future growth and volatility determined the profit of medium and high income
firm, while capital intensity was the significant major determinant variable of profitability in
case of low income firms.
Panigrahi (2011), in the work “Location as a Determinant of Capital Structure: A
Study of Indian Private Sector Firms” analyzed whether the location of a firm affects its
capital decisions of Indian companies. The analysis was conducted on a sample of 300 Indian
private sector companies, comprising of 20 different sectors for the period 1999-2000 to
2007-2008, duly grouping them on the basis of their regions as western, eastern, southern and
northern region. Findings revealed that the region or location of a company strongly
influences the quantum of inflow of funds.
Pahuja and Sahi (2012) analyzed the factors determining the capital structure of
Indian companies using agency and pecking order theory. Debt equity ratio was used as the
dependant and size, growth, profitability, liquidity and tangibility are treated as independent

Corporate Financing Options in India: Banking vs. Capital Markets
71
variables in the study. The data for a sample of 30 companies listed Bombay Stock
Exchange’s SENSEX were considered for a period comprising 2008-2010. Two major
determinants of capital structure are observed to be growth and liquidity.
Chadha and Sharma (2015) in their study “Determinants of capital structure: an
empirical evaluation from India” observed that the size, age, asset tangibility, growth,
profitability, non-debt tax shield, business risk, uniqueness and ownership structure are
significantly correlated with a firm’s financial leverage or key determinants of capital
structure in Indian manufacturing sector. It also observed that the other variables like
dividend payout, liquidity, interest coverage ratio, cash flow coverage ratio (CFCR), and
inflation and GDP growth rate are empirically found to be insignificant to determine the
capital structure of Indian manufacturing sector. Additionally the study concluded that no
single theory (trade off vs. pecking order) which can explain the capital structure nature of
Indian manufacturing sector holds completely true for India. What is observed is a mix of
both the theories.
Bossone (2010), Song and Thakor (2010) have suggested that banks and capital
markets are integral parts of a co-evolving financial system, wherein they not only compete,
but also complement and co-evolve. Some studies also suggest that expanding bank activities
into capital markets by allowing them to hold equity stakes in firms might generate efficiency
gains (Bosonne and Lee, 2004; Li and Masulius, 2004). Access to larger capital markets
reduces bank costs by providing banks with more efficient instruments of risk management
and reputation signalling which enable them to economise on the financial capital.
Krishnamurthy (1994) was of the view that though there is no evidence to support the
view of large scale disintermediation, but there is some visible decline on aggregate deposit
growth rate requiring banks to guard themselves against future threat of financial
disintermediation. Further, due to liberalization of Indian economy and with increased
importance of capital market during 1990s, the share of bank credit mainly to commercial
sector recorded a downturn. This is due to new financing options available to corporate
(EPW, 1991; RBI, 2000; RBI, 2002).
Based on the selected data of Indian banking sector from 1980-89, Sen (1991) has
concluded that high SLR requirement with low yield is detrimental to growth of banks as the
private firms on the face of credit crunch offer bonds and shares at attractive rates to tap

Corporate Financing Options in India: Banking vs. Capital Markets
72
funds directly from households resulting in financial disintermediation. This also means a fall
in the amount of funds available to the public due to SLR requirements of commercial banks.

Corporate Financing Options in India: Banking vs. Capital Markets
73
CHAPTER IV
Research Methodology and Description of Data
The study is composed of a set of objectives. The methodology used and the sources
of data are different for all the objectives. In this chapter, individual objective’s methodology
and nature and sources of data are discussed separately.
4.1 Objective 1: Financial Disintermediation and its Impact on Banks’ Performance
One of the objectives of the study is to measure the overall impact of financial
disintermediation on all scheduled commercial banks’ profitability and performance. The
overall impact on the banks due to the development of alternate financial institutions as well
as the growth of Indian capital market, both as possible sources of disintermediation, has
been studied. With the development of capital market, there can be a shift in the preference of
the investors to invest in the new and innovative instruments like mutual funds, insurance
(those paying additional returns along with insurance benefit) and such other instruments that
are giving better return than banks, and hence are more attractive. Thus withdrawals from
banks may go to invest in other sources. When more and more household savings are getting
transmitted to capital market related instruments, it promotes more disintermediation process.
While pursuing the work of disintermediation process and its impact on bank
performances and profitability, the following sub-objectives are taken into consideration;
1. To review the growth and composition of financial intermediaries and instruments.
2. To examine the disintermediation impact of capital market growth on the performance of
Indian Banks.
3. To examine the overall financial disintermediation impact on Banks’ Profitability.
The Hypotheses of our disintermediation study are as follows;

Corporate Financing Options in India: Banking vs. Capital Markets
74
H0: There is no significant impact of overall financial disintermediation on the Performance
of Banks.
H0: There is no significant impact of overall financial disintermediation on the Profitability of
Banks.
The study is exploratory in nature. It is an empirical research work based on aggregate
data and is meant to provide information on any negative impact on banks’ deposit and loan
growth functions due to the development of alternative avenues of deposits and credit that is
better known as ‘disintermediation’. For this purpose, to begin with, an examination for
growth and development of financial institutions and instruments in Indian Financial System
has been made.
Borrowers’ preference from Commercial Banks to other non-banking sources of
credit is a genesis of bank disintermediation. In order to see the impact of capital market and
other non-banking credit and deposit sources on banks’ loan disbursal and deposit
acceptance, indices have been developed. Finally, the impact on profit and performance of
Banks’ has been analyzed. For this purpose, important indicators of profit have been
identified and analyzed for shift in trend followed by regression analysis to determine if
disintermediation has impacted their profitability and performance.
Some of the indicators used to measure the performance and profitability of Indian
banks are explained below. They are the basic indicators usually used to measure the
performance comprising of both income and expenses. Income here includes income from
both on and off balance sheet activities. On balance sheet activity represents income from
intermediation activity, whereas off-balance sheet activity represents income from non-
intermediation activity. Similarly, expenses have been classified as expenditure towards
interest payment and other expenses, where the former represents expense made for
intermediation activity.
Interest Income: Interest income represents income from traditional intermediation
activity of loan disbursal. Increase in interest income is a result of more and more of deposits
being converted into loans of different forms, supported by opportunities/avenues.
Interest expense: Interest expense represents expenditure towards traditional
intermediation activity of accepting deposits. An increase in interest expense represents more
of national savings of nation being converted into deposits of different forms of savings.

Corporate Financing Options in India: Banking vs. Capital Markets
75
Non-Interest Income: Non-interest income represents income from other sources
(other than interest on loan) such as, commissions, brokerage, exchange, service charges,
government fees, rent from lockers and premises, cross-selling etc. An increase in such
income suggests that there is a shift from banks’ traditional to fee generation activities (more
towards those falling out of their traditional intermediation activity).
Non-interest Expense: Non-interest expenses include establishment and other
operating expenses, such as, payments to and provisions for employees, rent, taxes, lighting,
stationeries, telephone, printing, depreciation etc. The major item of non-interest expenditure
is the establishment cost that include major chunk of salary and allowances to employees. An
increase in this type of expenses represents inefficiency on the part of management to control
over the cost of operation that makes a negative impact on performance and profitability
because efficient banks are expected to have a lower operating cost.
Net-Interest Margin: Another important indicator of efficiency is net interest
margin. It is defined as the excess of interest income over interest expense. It is an important
indicator of banks efficiency since it drives a wedge between interest paid to depositors and
the interest received from borrowers on their loans.
Apart from these basic indicators, credit-deposit ratio, investment-deposit ratio as well
as internal determinants like the log of bank assets (to determine the importance of banking
finance), capital to total assets, overheads to total assets, advance to total assets and also some
of the variables introduced in regression analysis to capture the impact of disintermediation in
banks’ performance like market capitalization to GDP and bank disintermediation (loan &
deposit) index.
C-D & I-D Ratio: The two important measures that determine the level of bank
performance in terms of their intermediary behavior are the credit-deposit ratio (C-D ratio)
and investment-deposit (I-D ratio). These two ratios determine as to what percent of deposits
accepted goes towards loan and what percent goes towards investment activities instead of
loan conversion. An increase in the C-D ratio shall mean that more of the deposit is converted
into loan assets, which is a sign for improvement of basic intermediation activity. Whereas
increase in I-D ratio means deviation away from intermediation activity as it shows that more
and more of deposits is getting invested into market.

Corporate Financing Options in India: Banking vs. Capital Markets
76
4.1.1 Data Sources
This objective is based on secondary data sourced from RBI, SEBI and Indian Banks’
Association. Data is collected mostly from various publications issued by the RBI, including
Handbook of Statistics on Indian Economy, Report on Trend and Progress of Banking in
India, and Statistical Tables Relating to Banks in India. In addition, another source has been
Handbook of Statistics on the Indian securities market published by Security and Exchange
Board of India (SEBI). Key business statistics data of Indian Banks’ Association is used for
extraction of relevant information.
4.1.2 Statistical Tools used for Analysis
Identification of the factors augmenting the disintermediation process in Indian
financial sector is one of objective of the study. The impact of capital market and the overall
disintermediation on the important banking variables are identified with the help of
regression techniques. Factors are identified for measuring the movement of these variables
through trend analysis and other statistical techniques. The tools applied for analysis are ratio
analysis, trend analysis, linear growth rate, correlation analysis, multiple linear regression
models etc. In addition, some tests have also been applied like the Durbin-Watson test for
autocorrelation, Multicollinearity Test, F-test and T- test. A brief explanation for each of
these tools and techniques is given below.
4.1.3 Methodology for Bank Credit and Deposit Intermediation Indices
There is growth of alternative means of investment in last couple of years. An analysis of
the trend with respect to time for measuring any change in the intermediary role vis-à-vis
bank credit and deposit is important. The indices shown here show the intermediary role of
commercial banks and non-banking institutions with regard to both deposit taking and credit
disbursal.
Bank Deposit Intermediation Index (BDI Index) = Net annual deposit with
commercial banks / Total deposit with all intermediary institutions.
Non Bank Deposit Intermediation Index (NBDI Index) = Net annual deposit with non
banking financial intermediaries / Total deposit with all intermediary institutions, i.e.,
1- BDI Index.
Bank Credit Intermediation Index (BCI Index) = Net annual credit by commercial
banks / Total credit by all intermediary institutions

Corporate Financing Options in India: Banking vs. Capital Markets
77
Non Bank Credit Intermediation Index (NBCI Index) = Net annual credit by non
banking financial intermediaries / Total credit by all intermediary institutions, i.e., 1-
BCI Index
Where; Total deposit with all intermediary institutions = Aggregate of Bank deposits,
NBFC deposits, RNBC deposits and deposits of State Co-operative Banks maintaining
accounts with RBI.
Total credit with all intermediary institutions = Aggregate of Bank credit (including RRB
credits), Credit by State Cooperative, credit by all India financial institutions and credit from
primary market (equity, bonds & private placement).
4.1.4 Capital Market Disintermediation Indices
The recent trend shows that corporate prefer to access capital market directly to raise
funds rather than depending on an intermediary institute for the purpose. This has led to
development of capital market allowing corporate houses to bypass intermediary institutions.
This might be articulated by a number of factors including rate of interest, the degree of risk
associated or the amount of liquidity, cheap availability of funds for corporate houses and so
forth.
Recent relaxation in norms to promote capital market has helped corporate to overtake
banks and access direct credit. It is important to find whether there is any disintermediation
effect of capital market both on commercial banks as well as on financial institutions with
respect to their deposit taking and credit disbursal. For this purpose four indices are
developed as under mentioned:
Bank Disintermediation (deposit) Index (BDD Index) = Net annual deposit with
commercial banks / Total annual capital market mobilization
Financial Disintermediation (deposit) Index (FDD Index) = Net annual deposit with
all financial intermediaries / Total annual capital market mobilization
Bank Disintermediation (loan) Index (BLD Index) = Net annual loan by commercial
banks / Total annual capital market mobilization
Financial Disintermediation (loan) Index (FLD Index) = Net annual loan by all
financial intermediaries / Total annual capital market mobilization

Corporate Financing Options in India: Banking vs. Capital Markets
78
Where; Total capital market mobilization is the sum of resources mobilized from the
primary market, resource mobilization in the private placement market and net resources
mobilized by mutual funds. These are the total funds mobilized in the form of primary
capital market in India.
The Banking disintermediation indices are prepared to analyze the impact of capital
market disintermediation on banks deposit and loan. Similarly, the financial disintermediation
indices are to measure the impact of capital market disintermediation on all financial
institutions (both bank and nonbanking institutions). In case of BDD index which shows
banks’ deposit disintermediation, a higher index number shows lower deposit
disintermediation and vice versa. Similar is the case for BLD index that measures banks’
credit disintermediation. A higher index number shows lower credit disintermediation and
vice versa. The FDD and FLD indices which measure deposit and credit disintermediation of
all financial institutions (both bank and nonbanking institutions), a higher index number
shows lower deposit and credit disintermediation and vice versa.
4.1.5 Regression Analysis to Measure the Impact of Disintermediation on Banks’
Performance and Profitability
To test the hypothesis whether disintermediation has affected the profitability and
performance of Indian banking sector, a set of two regression equations are framed.
Following, Kunt & Ross (1999) and Naceur & Goaied (2005), Net Interest Margin (NIM),
which is a measure of efficiency of performance and is also the determinant of net return
from intermediation activity, is used as regressand (dependant variable) in the equation.
Similarly, Naceur & Goaied (2005), Return on Assets (ROA), i.e. Percentage of
profit earned per unit of asset has been used as regressand (dependant variable) in the other
equation. This is a measurement of the efficiency of the Bank in terms of profitability,
measured per unit of assets, i.e., Total Bank Income after Tax/ Total Assets.
NIM = f (SBS, MCAP, BDD Index, BLD Index, C-D)………………………… (1)
ROA = f (SBS, MCAP, BDD Index, BLD Index, C-D)………………………… (2)
Where:
SBS: Size of the Banking System
MCAP: Market Capitalization Index
Corporate Financing Options in India: Banking vs. Capital Markets
79
C-D: Credit to Deposit ratio
NIM: Net Interest Margin and
ROA: Return on Assets
The regressors (dependant variables) used in the equations are MCAP, size of the Bank,
BLD Index, BDD index and C-D ratio. The regressors are defined as follows;
1. Market Capitalization Index (MCAP) is the total stock market capitalization/GDP.
This variable is used as a proxy for financial market development and as a measure of
the size of the equity market.
2. Size of Bank (SB) is the total asset of the Bank/GDP. This is used to represent the
importance of banking finance in economy.
3. Bank Credit Disintermediation index (BLD Index) is defined as Net annual credit by
the Bank to total Annual Capital Market Mobilization.
4. C-D Ratio is introduced in the model as the basic indicator of intermediation activity.
4.2 Objective 2: The Dynamic and Equilibrium Relationship between Corporate Health
and External Financing
This part of the study aims at exploring the relationship between corporate health and
investments with respect to external financing. Corporate can follow various ways to finance
the investment appetite. There are various sources of finance which can be classified on the
basis of time period, ownership and control, and the respective source of funding or source of
generation of funding. Choosing right source and the right pattern (mix) of finance are a
matter of in-depth financial analysis and pose a key challenge for every finance manager to
have a primary understanding of the characteristics of the financing sources. On the basis of a
“time period”, the financing sources are classified into long term, medium term, and short
term financing. On the basis of “ownership and control”, sources of finance is based on
owned capital and borrowed capital, and for sources of capital, it might be internal sources or
external sources of capital. Sources are the point of generation of capital. All the sources of
capital have different characteristics to suit different types of requirements.
Corporate health could emerge from three sources/factors such as firm specific,
industry specific and macroeconomic factors. In the present study, we have considered two
core representatives of corporate health i.e. ‘Altman Z Score’ and ‘Tobin’s Q’.

Corporate Financing Options in India: Banking vs. Capital Markets
80
4.2.1 Altman Z score
It is popularly used as a parameter to capture bankruptcy. Previously in order to
trace any signs of imminent bankruptcy, investors have to calculate and analyze all kinds
of financial ratios. But each ratio has its unique feature and tells a different story about a
firm's financial health. At times, they can even appear to contradict each other. Having to
rely on a bunch of individual ratios, the investor may find it confusing and difficult to
know when a stock is going to the wall.
In a bid to resolve this conundrum, NYU Professor Edward Altman introduced
the Z-score formula in the late 1960s. Rather than search for a single best ratio, Altman
built a model that distills five key performance ratios into a single score. As it turns out,
the Z-score gives investors a pretty good snapshot of corporate financial health. Here, we
look at how to calculate the Z-score and how investors can use it to help make buy and sell
decisions.
The Z-score Formula: Z-Score = (1.2×A) + (1.4×B) + (3.3×C) + (0.6×D) + (1.0×E)
Where:
A = Working Capital/Total Assets
B = Retained Earnings/Total Assets
C = EBIT/Total Assets
D = Market Value of Equity/Total Liabilities
E = Sales/Total Assets
The lower the score, the higher the chance that a company is headed for
bankruptcy. A ‘Z-score’ of lower than 1.8, in particular indicates that the company is
heading towards bankruptcy. Companies with scores of above 3 are unlikely to suffer from
bankruptcy. Scores in between 1.8 and 3 lie in a gray area. But in the present study, we
have only used the ‘Z score’ as a representative of the financial health, since predicting and
analyzing bankruptcy are beyond the scope of the present study. The present study tries to
capture the dynamic relationships between ‘Altman Z score’ with a group of firm specific
and external financial indicators.
Corporate Financing Options in India: Banking vs. Capital Markets
81
Theoretical Relevance of the constituents of ‘Z Score’
Working Capital/Total Assets (WC/TA): This ratio is a good test for corporate
distress. A firm with negative working capital is likely to experience problems meeting its
short-term obligations because there simply are not enough current assets to cover those
obligations. By contrast, a firm with significantly positive working capital rarely has trouble
paying its bills.
Retained Earnings/Total Assets (RE/TA): This ratio measures the amount of
reinvested earnings or losses that reflects the extent of the company's leverage. Companies
with low RE/TA are financing capital expenditure through borrowings rather than through
retained earnings. Companies with high RE/TA suggest a history of profitability and the
ability to stand up in a bad year of losses.
Earnings Before Interest and Tax/Total Assets (EBIT/TA): This is a version
of Return on Assets (ROA), an effective way of assessing a firm's ability to squeeze profits
from its assets before factors like interest and tax are deducted.
Market Value of Equity/Total Liabilities (ME/TL): This is a ratio that shows, if a
firm is to become insolvent, then how much the company's market value would decline
before liabilities exceed assets on the financial statements. This ratio adds a market value
dimension to the model that isn't based on pure fundamentals. In other words, a
durable market capitalization can be interpreted as the market's confidence in the company's
solid financial position.
Sales/Total Assets (S/TA): This tells investors how well management handles
competition and how efficiently the firm uses assets to generate sales. Failure to grow market
share translates into a low or falling S/TA.
4.2.2 Tobin’s Q Model
‘Tobin's Q’ is the ratio of the market value of a company's assets (as measured by the
market value of its outstanding stock and debt) divided by the replacement cost of the
company's assets (book value). ‘Q-ratios’ are also popularly used for calculating a stock
market valuation. In this case, the aggregate of the stock market value for companies in a
given stock market or index is divided by the aggregate of the replacement value of those

Corporate Financing Options in India: Banking vs. Capital Markets
82
companies' assets. It states that if q (representing equilibrium) is greater than one (q > 1),
additional investment in the firm would make sense because the profits generated would
exceed the cost of firm's assets. If q is less than one (q < 1), the firm would be better off
selling its assets instead of trying to put them to use. The ideal state is where q is
approximately equal to one denoting that the firm is in equilibrium. In the present study we
have taken ‘Q value’ and tried to analyze the empirical relationship of firm specific and
external financing factors with ‘Q value’ which otherwise represents the value of the firm.
Relevance of Tobin’s q, Revisiting Theory:
A better measure of a floor for the stock price is the firm’s liquidation value per share. This
represents the amount of money that could be realized by breaking up the firm, selling its
assets, repaying its debt, and distributing the reminder to its shareholders. The reasoning
behind this concept is that if the market price of equity drops below the liquidation value, the
firm becomes attractive as a takeover target. A corporate raider would find it profitable to buy
enough shares to gain control and then actually to liquidate. Similarly, another approach to
value a firm is the replacement cost of its assets less liability. Some analysts believe the
market value of the firm cannot remain for long too far above its replacement cost because if
it did, competitors would try to replicate the firm. The competitive pressure of other similar
firms entering the same industry would drive down the market value of all firms until they
came into equality with replacement cost. These ideas are popular among economists, and the
ratio of market price to replacement cost is known as Tobin’s q after the Nobel winning
economist James Tobin. In the long run, according to this view, the ratio of market price to
replacement cost will tend towards 1, but the evidence is that this ratio can differ significantly
from 1 for very long period. Although focusing on the balance sheet can give some useful
information about a firm’s liquidation value or its replacement cost, the analyst must usually
turn to expected future cash flows for a better estimate of the firm’s value as a going concern.
4.2.3 Nature and Sources of Data
The present study uses annual data over the period 2000 to 2015 for 1000 Indian non-
financial firms listed on BSE. To capture corporate health, the study has used ‘Altman Z
score’ which is largely used as proxy for corporate health. To have a better understanding of
corporate health, the study has extended its focus to address the relationship of corporate
financing structure with firm value. Tobin Q is taken as proxy for firm value. For external
financing, the study will be focusing on various medium to long term financial indicators.

Corporate Financing Options in India: Banking vs. Capital Markets
83
Over external financing, we have considered financing opportunities of firms from various
sources like (1) Current portion of long term foreign currency borrowings, (2) Long term
borrowings from RBI, (3) Borrowing from banks, (4) Borrowing from financial institutions,
(5) Borrowings from Central & State Govt. (6) Borrowings through Debentures and Bonds
and (7) Borrowings through equity. Moreover it has been observed from the data that for
raising debt, Indian firms are relying mostly on borrowings from banks and financial
institutions. Borrowing through Bond and Debentures and from Central and State Govt. is
very low. There are large numbers of missing variables observed for large number of the
firms under the study period. Hence, to deal with the situation, we have consolidated
borrowings from banks, financial institutions, and through equity in line with the title of the
study (i.e. banks vs. capital markets). The list of variables, definitions and sources are
discussed in table below.
4.2.4 Data Definitions and Sources

Corporate Financing Options in India: Banking vs. Capital Markets
84
Table 6: Data Definitions & Sources
Indicator Definition Sources
Net Sales Net sales are the amount of sales generated by a company after the deduction of returns, allowances for
damaged or missing goods and any discounts allowed.
Prowess
(CMIE)
Total
Assets
Total assets are the sum of all current and noncurrent assets, equal to the sum of total liabilities and
stockholders' equity combined.
Prowess
(CMIE)
Net Fixed Asset The fixed-asset turnover ratio is, in general, used by analysts to measure operating performance. It is a ratio
of net sales to fixed assets, net of depreciation. Prowess (CMIE
EBITDA Earnings before interest, tax, depreciation and amortization (EBITDA) is a measure of a company's
operating performance.
Prowess
(CMIE)
Current liabilities Current liabilities are a company's debts or obligations that are due within one year, appearing on the
company's balance sheet and include short term debt, accounts payable, accrued liabilities and other debts.
Prowess
(CMIE)
Non-Current
Liabilities
Noncurrent liabilities are long-term financial obligations listed on a company's balance sheet that are not
due within the present accounting year, such as long-term borrowing, bonds payable and long-term lease
obligations.
Prowess
(CMIE)
Retained earnings Retained earnings refer to the percentage of net earnings not paid out as dividends, but retained by the
company to be reinvested in its core business, or to pay debt. It is recorded under shareholders' equity on Prowess

Corporate Financing Options in India: Banking vs. Capital Markets
85
the balance sheet (CMIE)
Enterprise Value
(EV)
Enterprise Value (EV) is a measure of a company's total value, often used as a more comprehensive
alternative to equity market capitalization. It includes market value of equity plus market value of Debts.
Prowess
(CMIE)
Working Capital
Working capital is a measure of both a company's efficiency and its short-term financial
health. The working capital ratio i.e. (Current Assets/Current Liabilities) indicates whether a company has
enough short term assets to cover its operation and short term debt.
Prowess
(CMIE)
EBIT
Earnings before interest and taxes, (EBIT), indicates a firm's revenue, or earnings, and subtracts its COGS
and operating expenses. EBIT, is also called "operating earnings," or "operating profit," or "operating
income."
Prowess
(CMIE)
Market Value of
Equity
Market value of equity is calculated by multiplying the number of shares outstanding by the share price of
a particular date.
Prowess
(CMIE)
Outstanding Shares Outstanding shares refer to a company's stock currently held by all its shareholders, including share blocks
held by institutional investors and restricted shares owned by the company’s officers and insiders
Prowess
(CMIE)
Volume Weighted
Average Price of
Shares
Volume-weighted average price (VWAP) is the ratio of the value traded to total volume traded over a
particular time horizon (usually one day). It is a measure of the average price at which a stock is traded
over the trading horizon.
Prowess
(CMIE)

Corporate Financing Options in India: Banking vs. Capital Markets
86
Dividend Paid Company's net profits can be allocated to shareholders by ways of dividend, or kept within the company as
retained earnings. Dividend paid implies the cash outflow due to payment of Dividend.
Prowess
(CMIE)
ROA Return on assets (ROA) is an indicator of how profitable a company is in relation to its total assets. It is
calculated by dividing a company's annual earnings by its total assets.
Prowess
(CMIE)
ROCE
Return on capital employed (ROCE) is a financial ratio that measures a company's profitability and the
efficiency with which its capital is employed. ROCE is calculated as: ROCE = Earnings Before Interest
and Tax (EBIT) / Capital Employed.
Prowess
(CMIE)
Market
Capitalization
Market capitalization is the market value of a company's outstanding shares. This figure is found by taking
the current stock price and multiplying it by the total number of shares outstanding.
Prowess
(CMIE)
NIM
Net interest margin (NIM) is a measure of the difference between the interest income generated by banks
and the amount of interest paid out to their lenders (i.e.to deposits), relative to the amount of their interest
earning assets.
Prowess
(CMIE)
ROA (Banks) Return on Asset of all schedule commercial banks Prowess
(CMIE)
Total Asset (or)
Liability Total assets or liabilities of all schedule commercial banks
Prowess
(CMIE)

Corporate Financing Options in India: Banking vs. Capital Markets
87
Calculated Variables for the Study
Indicator Calculation Definition Sources
Asset Turnover Ratio
(ATR) Net Sales/Total Assets
The asset turnover ratio is an efficiency ratio that measures a company's
ability to generate sales from its assets
Author’s
Calculation
EBITDA Return on Assets
Ratio (EBITDAR) EBITDA/ Total Assets
The EBITDA Return on Assets ratio measures the amount of EBITDA
profit generated in comparison to total assets.
Author’s
Calculation
Current Debt Ratio (CDR) Current liabilities/Total
assets
It shows the proportion of a company's assets which are financed
through current debt or liability. Higher the ratio indicated that the poor
working capital management.
Author’s
Calculation
Debt Ratio (DR) Non-Current Liabilities
/Total Assets
It shows the proportion of a company's assets which are financed
through debt. A high liability to assets ratio can be negative; this indicates
the shareholder equity is low and potentiality of the solvency issues.
Author’s
Calculation
Good Ratio (GR) Retained earnings
/Total Assets
The higher the retained earnings to assets ratio, the lower reliant the
company is on other common types of debt and equity financing.
Author’s
Calculation
ETTB Ratio Equity/Total
Borrowing) Ratio of market value of Equity to Total Borrowing
Author’s
Calculation

Corporate Financing Options in India: Banking vs. Capital Markets
88
BBTTB Ratio Bank Borrowing /Total
Borrowing
Ratio of Bank Borrowing to Total Borrowing (Bank Borrowing includes
borrowing from Financial institutions)
Author’s
Calculation
BBTEV Ratio Bank Borrowing /EV Ratio of Bank Borrowing to Enterprise Value (EV) Author’s
Calculation
TBTEV Ratio Total Borrowing/EV Ratio of Total Borrowing to Enterprise Value (EV) Author’s
Calculation
ETEV Ratio Equity/EV Ratio of Equity / Enterprise Value (EV) Author’s
Calculation
A Altman “A” Working Capital/Total Assets Author’s
Calculation
B Altman “B” Retained Earnings/Total Assets Author’s
Calculation
C Altman “C” EBIT/Total Assets Author’s
Calculation
D Altman “D” Market Value of Equity/Total Liabilities Author’s
Calculation

Corporate Financing Options in India: Banking vs. Capital Markets
89
E Altman “E” Sales/Total Assets Author’s
Calculation
AMZ Altman Z Score (1.2×A) + (1.4×B) + (3.3×C) + (0.6×D) + (1.0×E) Author’s
Calculation
TQ Tobin’ Q Market value of outstanding stock and debt/ Book value of Asset Author’s
Calculation
INTR Interest Rate Annual interest rate RBI Bulletin

Corporate Financing Options in India: Banking vs. Capital Markets
90
4.2.5 Statistical Models
Basic Model: ........ (1)
Stands for Corporate Health for firm i at time t, is the firm specific factors.
These are considered in one period lag to ensure that the data are observable prior to the
event of financial performance, represent the external financing indicator over the
time across the firms, and finally are the macroeconomic indicators that are used as
control variables in the model to enhance the predictive ability of the overall model.
Market interest rate has been used as;
Model 1:
Model 2:
Model 3:
Model 4:
Model 5:

Corporate Financing Options in India: Banking vs. Capital Markets
91
Model 6:
Model 1, 2 and 3 uses ‘Altman Z’ Score as proxy for corporate health. The
components under external finance consider two broad prospects like borrowing through
banks and financial institutions and through equity. The first considers the debt component
which creates obligation without sharing ownership whereas the second captures ownership
without obligations. Again the proportion of external financing is captured firstly with respect
to total borrowing and secondly with respect to enterprise value of the corporation. No doubt
this makes the models more vibrant to capture the inter linkages between corporate health and
external financing in the context of bank vs. capital market. The firm specific parameters like
asset turnover ratio, ratio of EBITDA on total asset, debt ratio, current debt ratio and good
ratio are captures sales efficiency, operational efficiency, asset financing through current
debt, long term debts etc. captures the channels of linkages of external financing to firm’s
value and its performance. Moreover the study attempts to bring out the relevance of internal
financing through retained earning which is captured by good ratio (GR) i.e. proportion of
retained earnings over total asset. All the firm specific parameters are taken in one period lag
to capture the impact parameter accurately. In all the models, interest rate is used as control
variable to improve the overall level of significance of the model.
4.2.6 Methodology of the Study
The present study has undertaken panel data analysis to capture the investment behaviour
of Indian manufacturing firms. Panel data otherwise known as longitudinal or cross sectional
time series is a data structure where the behaviour of the entities is observed across time.
These entities could be countries, states, firms etc. The advantage of panel data over other
data structure is that it allows controlling the variables that cannot be observed or measured.
It also controls the variables that change over time but not across entities. Hence it accounts
for individual heterogeneity and have the freedom to include variables at any stage of the
analysis. Keeping in mind the large scope of heterogeneity in the firm size, the present study

Corporate Financing Options in India: Banking vs. Capital Markets
92
has used panel data technique. Fixed Effect and Random Effect models have been
experimented to capture the functional relationships between the models.
Fixed Effect (FE) Model: FE models are useful when we want to analyse the impact of
variables that vary over a period of time. It explores the relationship between predictor and
the outcome variable within an entity and each of the entity has its own features that may or
may not be captured by the predictor variables. It is believed that something within the
individual entities may bias the predictor or outcome variable and hence, need to be
controlled. This is the rationale behind the assumption that the correlation between an entity’s
error and predictor variable should be zero. FE model removes the effects of the time
invariant features of the predictor variables so that the net and unbiased effect of the predictor
can be captured. Generally, those time invariant characteristics are unique to the entity and
should not be correlated with other entities. Each entity is independent and therefore the
entity’s error term (εit) and constant (αi) should not be correlated with others. The constant
(αi) captures the individual effects. If error term (εit) and constant (αi) are correlated, then FE
model is not suitable, rather we have to choose Random Effect (RE) models. The equation of
FE model can be written as:
Yit = α1i + β1X1it + β2X2it + εit
i = 1, 2,………N. (Cross-sectional identifier)
t = 1, 2,……………T. ( Time identifier)
FE model assumes slope of the model remain constant and intercept (α) change across
individuals (or panels) but remains fixed over time. Hence FE models are time Invariant.
Random Effect Model: RE models are otherwise known as Random intercept or Partial
pooling model. The rational of RE model is that the variation across entities is assumed to be
random and uncorrelated with the independent variables. If the difference across entity has
some influence on dependent variable RE model should be used. Moreover, time invariant
variables can be included in RE models, which are absorbed by intercept (αi) in FE models.
In case of RE model, α1i is assumed to be random with group mean value of intercept.
Yit = α1i + β1X1it + β2X2it + εit
and α1i = (α1 + μi)

Corporate Financing Options in India: Banking vs. Capital Markets
93
Yit = α1 + β1X1it + β2X2it + ωit
Where ωit = (μi+ εit) is a composite error term with firm specific error (μi) and cross
section error term (εit).
Selection of Appropriate Model
Hausman test is used to decide the preferred model between FE and RE models in
panel data analysis. It basically tests whether the unique error (μi) is correlated with repressor.
The null hypothesis (H0) of Hausman test implies, H0: μi is not correlated with repressor.
Hausman assumes an asymptotic Chi-square (χ2) distribution. If H0 is rejected, then Fixed
Effect (FE) model will be the appropriate model, otherwise Random Effect (RE) model
would be the alternative selection. Conceptually, if μi and Xi are correlated, then FE model is
preferred and if μi and Xi are uncorrelated, then RE model is preferred.
4.3 Objective 3: Dynamics of financial health on corporate balance sheet and its Impact
on Banks’ financing and Net Interest Margin
This objective aims to capture the impact of financial health on corporate balance
sheet with special reference to corporate profitability and operating efficiency. The structure
of external financing impacts corporate balance sheet via corporate profitability, addressing
operational efficiency of capital employed, use of debt financing to long term asset and the
change in the structure of current liability, are the major research questions. The study
extends its models i.e. model 7 to 11 that aims to capture the impact of financial health
through the structure of its external financing on corporate balance sheet outcomes. Model 7
captures the impact on return on asset, which is a profitability indicator of corporate balance
sheet. Similarly, Model 8 captures the impact on return on capital employed, which is the
profitability indicator of capital employed. Model 9, 10 and 11 have studied the impact of
external financing on current and non-current liability as well as net working capital
management. These models are presented below.

Corporate Financing Options in India: Banking vs. Capital Markets
94
4.3.1 Statistical Models
Model 7:
Model 8:
Model 9:
Model 10:
Model 11:
Model 12:
Model 13:

Corporate Financing Options in India: Banking vs. Capital Markets
95
Model 14:
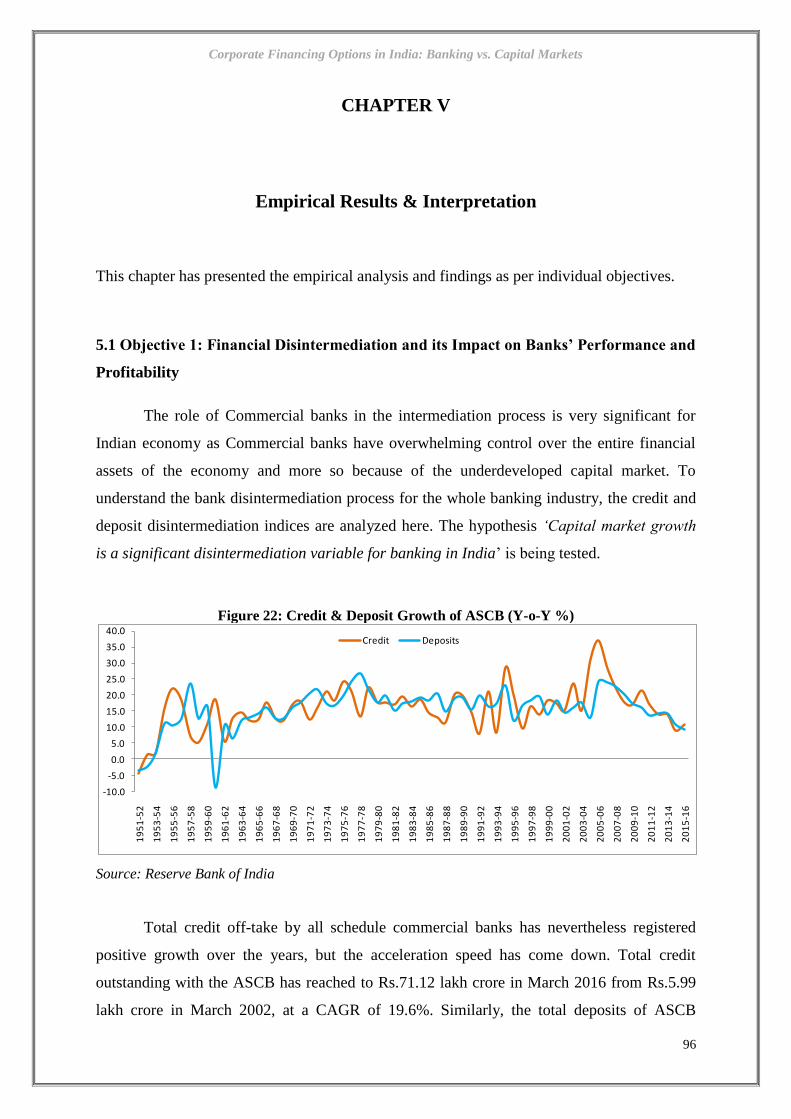
Corporate Financing Options in India: Banking vs. Capital Markets
96
CHAPTER V
Empirical Results & Interpretation
This chapter has presented the empirical analysis and findings as per individual objectives.
5.1 Objective 1: Financial Disintermediation and its Impact on Banks’ Performance and
Profitability
The role of Commercial banks in the intermediation process is very significant for
Indian economy as Commercial banks have overwhelming control over the entire financial
assets of the economy and more so because of the underdeveloped capital market. To
understand the bank disintermediation process for the whole banking industry, the credit and
deposit disintermediation indices are analyzed here. The hypothesis ‘Capital market growth
is a significant disintermediation variable for banking in India’ is being tested.
Figure 22: Credit & Deposit Growth of ASCB (Y-o-Y %)
Source: Reserve Bank of India
Total credit off-take by all schedule commercial banks has nevertheless registered
positive growth over the years, but the acceleration speed has come down. Total credit
outstanding with the ASCB has reached to Rs.71.12 lakh crore in March 2016 from Rs.5.99
lakh crore in March 2002, at a CAGR of 19.6%. Similarly, the total deposits of ASCB
-10.0
-5.0
0.0
5.0
10.0
15.0
20.0
25.0
30.0
35.0
40.0
19
51
-52
19
53
-54
19
55
-56
19
57
-58
19
59
-60
19
61
-62
19
63
-64
19
65
-66
19
67
-68
19
69
-70
19
71
-72
19
73
-74
19
75
-76
19
77
-78
19
79
-80
19
81
-82
19
83
-84
19
85
-86
19
87
-88
19
89
-90
19
91
-92
19
93
-94
19
95
-96
19
97
-98
19
99
-00
20
01
-02
20
03
-04
20
05
-06
20
07
-08
20
09
-10
20
11
-12
20
13
-14
20
15
-16
Credit Deposits

Corporate Financing Options in India: Banking vs. Capital Markets
97
reached to Rs.93.27 lakh crore by March 2016 from Rs.11.03 lakh crore in March 2002, at a
CAGR of 16.5%.
The average credit growth of the ASCB in pre-recession period (2001-02 to 2007-08)
was much higher (24.6%) compared to post recession period (2009-10 to 2015-16) at 14.5%.
Similarly, the average deposit growth in pre-recession period (2001-02 to 2007-08) was much
higher (18.8%) compared to post-recession period (2009-10 to 2015-16) at 13.6%. This
moderation in credit and deposit growth is attributed to a number of factors including
economic slowdown and low business confidence, but development of alternate source of
funding options is also one of the factors responsible for the moderation in credit. Similarly,
the robust performance of the capital market attracted more and more household savings
towards capital market indicating a clear shift of deposits from banks. The sub-prime crisis of
2007-08, crashed the market and resulted in investor or depositor shy away from the capital
markets.
The individual decision to park the savings in a bank account or in a non-bank
institution varies from time to time. The same argument is also applicable in case of credit.
Hence, a drop in banks’ intermediation indices (both deposit and credit) in relation to time
with a similar increase in the index figures of non-banking institutions, or otherwise, a
negative slope in trend can be considered as bank disintermediation through
institutionalization. The index values are rebased based on the 2000-01 number (2000-
01=100).
Bank Credit Intermediation Index though has remained same in 2015-16 compared to
2000-01 but appears with a huge volatility in between years. The overall slope as measured
by the trend line shows a negative slope for bank credit intermediation index. In case of bank
deposit intermediation index, the index showed a sudden jump from 0.15 in 2000-01 to 0.19
in 2005-06 and then declined further to reach minimum of 0.08 in 2015-16. Similar negative
slope is also recorded for deposit intermediation index for banks. Hence an evidence of bank
disintermediation through institutionalization is observed.

Corporate Financing Options in India: Banking vs. Capital Markets
98
Figure 23: Credit Intermediation Index Figure 24: Deposit Intermediation Index
Source: RBI, SEBI, Authors’ Calculation Source: RBI, SEBI, Authors’ Calculation
Financial disintermediation indices are to measure the impact of capital market
disintermediation on all financial institutions (both bank and nonbanking institutions). The
Figures depict the movement of all the four indices from 2000-01 to 2015-16. For BDD
Index, the ratio has declined to 0.13 in 2015-16 from 0.21 in 2000-01. Similar trend is also
observed for FDD index as the index has come down from 0.21 in 2000-01 to 0.13 in 2015-
16. The common trend between the two indices is seen as they are highly positively
correlated. It is seen that the deposit indices have reached lowest level in 2007-08, pre-
subprime crisis, when the equity market boomed and market capitalization of corporate
reached its peak. Due to better return, depositors were parking their savings in equity market
related instruments.
Figure 25: Deposit Disintermediation Index (BDD
Index) for Banks
Figure 26: Deposit Disintermediation Index (FDD
Index) for Financial Intermediaries
Source: RBI, SEBI, Authors’ Calculation Source: SEBI, RBI, Authors’ Calculation
The deposit disintermediation index depicted in above picture portrays no clear
movement of the index during the studied period, though with an insignificant negative slope
y = -1.1745x + 123.45
50.0
75.0
100.0
125.0
150.0
175.0
200.0
20
00
-01
20
01
-02
20
02
-03
20
03
-04
20
04
-05
20
05
-06
20
06
-07
20
07
-08
20
08
-09
20
09
-10
20
10
-11
20
11
-12
20
12
-13
20
13
-14
20
14
-15
20
15
-16
BCI Index NBCI Index Trend (BCI Index)
y = -2.0206x + 109.21
50.0
60.0
70.0
80.0
90.0
100.0
110.0
120.0
130.0
20
00
-01
20
01
-02
20
02
-03
20
03
-04
20
04
-05
20
05
-06
20
06
-07
20
07
-08
20
08
-09
20
09
-10
20
10
-11
20
11
-12
20
12
-13
20
13
-14
20
14
-15
20
15
-16
BDI Index NBDI Index Trend (BDI Index)
y = -0.0912x + 81.086
20.0
40.0
60.0
80.0
100.0
120.0
140.0
160.0
180.0 BDD Index Trend (BDD Index)
y = -0.0522x + 81.596
20.0
40.0
60.0
80.0
100.0
120.0
140.0
160.0
180.0 FDD Index Trend (BDD Index)

Corporate Financing Options in India: Banking vs. Capital Markets
99
that pronounces more disintermediation. In the event of segregating the whole studied period
of 16 years to pre (2000-01 to 2007-08) and post sub-prime crisis (2008-09 to 2015-16)
period, it throws some interesting facts. The slope coefficient of the banking (deposit)
disintermediation index was negative during both the studied periods but the slope co-
efficient during pre-recession phase was much higher than the slope coefficient of post
recession phase. The same trend is also observed for financial disintermediation (deposit)
index. This clearly shows that the disintermediation process that started in later half of the
nineties got pronounced till the sub-prime crisis. The capital market crash again weakened the
disintermediation process.
In case of credit disintermediation indices, especially for bank credit
disintermediation index, the index did not record any significant change, albeit there was
volatility in the interim periods. This shows that banks are still treated as major source of
finance for corporate. Importantly, the credit disintermediation index for banks is seen
declining gradually to reach lowest point (0.05) in 2007-08, before having a ‘u’ turn (0.22) in
subsequent year, 2008-09. This shows that it was not only depositors who were attracted
towards capital market investment, corporate were also getting access to easy credit at lower
rate compared to those from banks. But economic meltdown led to a nosedive in capital
market activity and corporate again shifted to banks as the favorite financing destinations. In
case of financial disintermediation index, the numbers are hard to interpret as during some of
the years negative net credit was seen by all financial institutions. A significant variation is
observed during the subprime crisis as during this phase, funds mobilized through capital
market came to a standstill due to panic, contagion effect from international market and
depletion in investors’ faith.
When we segregate the whole studied period of 16 years to pre (2000-01 to 2007-08)
and post sub-prime crisis (2008-09 to 2015-16) period, it is observed that the slope
coefficient of the banking (credit) disintermediation index was negative during both the
studied periods but the slope co-efficient during pre-recession phase was much higher than
the slope coefficient of post recession phase. This clearly shows that the disintermediation
process that started in later half of the nineties got pronounced till the sub-prime crisis. The
capital market crash again weakened the disintermediation process and banks regained their
lost position in credit disbursement.

Corporate Financing Options in India: Banking vs. Capital Markets
100
Figure 27: Loan Disintermediation Index (BLD
Index) for Banks
Figure 28: Loan Deposit Disintermediation Index
(FLD Index) for Financial Intermediaries
Source: RBI, SEBI, Authors’ Calculation Source: RBI, SEBI, Authors’ Calculation
For a lower-middle income economy like India, there is huge need of funds to finance
growth. In a speech (26 June, 2016) addressing a seminar on "Infrastructure and Global
Economic Growth" organized by Asia Infrastructure Investment Bank (AIIB), Finance
Minister Shri Arun Jaitley has stated that, “Over the next decade, we require over $1.5 trillion
in India alone to fill up the infrastructure gap”. Total credit outstanding of ASCB at end
2015-16 was $1.08 trillion (assuming 1 USD= 66 INR). When only infrastructure sector’s
funding requirement is projected at $1.5 trillion which is ~ $450 billion higher than total
credit outstanding of ASCB till now, threat of disintermediation seems to be not alarming at
this juncture, which might change in the later phase. Commercial banks get ample space to
expand their business to meet the funding requirement of all the sectors of the economy.
5.1.1 Impact of Disintermediation on Banks’ Performance and Profitability
Bank performance is a function of several inputs. As defined by ‘Berger 2005’, both
micro, i.e., bank related variables and macro variables affect its performance. One of the
important measures of efficiency is the intermediation cost stated as a percent to total assets.
Another widely used measure is the cost-income ratio that may be defined as the ratio of
operating cost to net total income. In addition, some of the widely used measures are non-
interest operating expenses to total assets, total expenses to assets, total expenses to total
revenue, non-interest expenses to adjusted operating revenue and staff expenses to assets. The
parameters of profitability used are return on assets, return on equity, profit per employee,
etc.
y = 1.258x + 108.4
30.0
60.0
90.0
120.0
150.0
180.0
210.0
240.0
270.0 BLD Index Trend (BDD Index)
y = 13.595x - 64.152
-1500.0
-1000.0
-500.0
0.0
500.0
1000.0
1500.0
2000.0
2500.0
3000.0
3500.0 FLD Index Trend (BDD Index)

Corporate Financing Options in India: Banking vs. Capital Markets
101
Figure 29:Interest and Non-Interest Income Figure 30: Interest and Non-Interest Income growth
Source: Reserve Bank of India Source: Reserve Bank of India
Logically, gradual disintermediation would lead to relatively increased contribution of
the non-interest income to total income of the Bank. The reason behind this is the shift in
services by the bank away from interest earning assets, such as, loans and advances, and
investment activities towards various other non-income activities which include income from
fee, commission and other service charges. Non-interest income to total income of the ASCB
has moderated from 18.1% in 2004-05 to 11.8% in 2013-14 before increasing marginally to
12.3% in 2014-15. The ratio of non-interest income to interest income has come down from
22.1% in 2004-05 to 14.1% in 2014-15. The growth rate of the interest income of the ASCB
has slowed down from 19% in 2004-05 to 10% in 2014-15. At the same time, non-interest
income growth has increased from 2.7% to 16.1% during the same period. This shows that
due to deepening of disintermediation and competition from peers, banks are attempting to
raise non-interest income.
Broadly saying, the two important measures that determine the level of bank
performance in terms of its intermediary behavior are the credit-deposit ratio (C-D ratio) and
investment-deposit (I-D ratio). These two ratios determine as to what percent of deposits
accepted goes towards loan and what percent goes towards investment activities instead of
getting converted into loan. An increase in the C-D ratio shall mean that more of the deposit
is converted into loan assets, which is a sign for improvement of basic intermediation
activity. Whereas increase in I-D ratio means deviation away from intermediation activity as
it shows that more and more of deposits is getting invested into market.
81.9 84.0 84.3 83.6 83.8 84.0 86.0 88.4 88.6 88.2 87.7
18.1 16.0 15.7 16.4 16.2 16.0 14.0 11.6 11.4 11.8 12.3
2005 2006 2007 2008 2009 2010 2011 2012 2013 2014 2015
Interest Income to Total Income Non-interest Income to Total Income
0.0
5.0
10.0
15.0
20.0
25.0
30.0
35.0
40.0
45.0
2006 2007 2008 2009 2010 2011 2012 2013 2014 2015
Interest Income growth Non-interest Income growth

Corporate Financing Options in India: Banking vs. Capital Markets
102
Figure 31: Credit to Deposit Ratio
Source: Reserve Bank of India
Both C-D ratio and I-D ratio of ASCB is depicted above show a gradual increase in
I-D ratio till the year 2004-05, accompanied by a decline in C-D ratio. The C-D ratio of the
ASCB declined from 79% in 1969-70 to the lowest level of 51.7% in 1998-99 and
accelerated thereafter to record 77.7% in 2015-16. I-D ratio also expanded from 29.5% in
1969-70 to 42.1% in 1993-94 and reached peak of 45% in 2003-04 before moderating further
to reach 28.1% in 2015-16. From credit side, development of the capital market along with
economic liberalization was one of the important reasons why I-D ratio was high in nineties
and beginning of twenty first century. Economic boom helped corporate to raise capital from
the primary market and through issuance of bonds. Most importantly, the important segment
of the bank lending, i.e., large corporate borrowing was very limited during that phase. Most
of the large corporate were relying on market sources rather than bank credit for their
business expansion.
However, C-D ratio jumped from 55.9% in 2004-05 to 64.7% in 2005-06, outpacing the
growth of I-D ratio. Further, the sub- prime crisis incidence augmented deepening of the bank
credit as capital market collapsed and most of the borrowers shifted their preference to bank
borrowings due to lack of liquidity in the capital market. Higher I-D ratio in the first phase of
twenty first century was attributed to the regulatory guidelines including RBI instructions of
maintaining higher reserve requirements that required more of funds to be parked in
Government securities and other approved securities and ultimately lower allocation towards
20.0
30.0
40.0
50.0
60.0
70.0
80.0
90.0Credit-Deposit Ratio (%) Investment-Deposit Ratio (%)

Corporate Financing Options in India: Banking vs. Capital Markets
103
credit. Gradually, the policy in lowering the mandatory requirements of SLR and CRR
resulted in increasing quantity of funds available with banks for credit disbursal.
5.1.2 Disintermediation and the Bank Performance: A Correlation
Table 7: Correlation Matrix (2000-01 to 2014-15)
BLD Index BDD Index Interest income
Interest
Expense
BLD Index 1.00
BDD Index 0.925**
(0.000) 1.00
Interest income 0.309
(0.263)
0.457
(0.087) 1.00
Interest Expense 0.284
(0.305)
0.490
(0.064)
0.903**
(0.000) 1.00
2000-01 to 2006-07
BLD Index 1.00
BDD Index 0.900
(0.006)
1.00
Interest income 0.335
(0.463)
0.672
(0.098) 1.00
Interest Expense 0.335
(0.463)
0.672
(0.098)
0.990
(0.000) 1.00
2008-09 to 2014-15
BLD Index 1.00
BDD Index 0.973**
(0.00)
1.00
Interest income 0.222
(0.633)
0.113
(0.809) 1.00
Interest Expense 0.386
(0.393)
0.441
(0.322)
0.471
(0.286) 1.00
Source: Author’s Calculation; *&**: Correlation is significant at the 0.05 level (2-tailed) and 0.01 levels
(2-tailed); Number in parenthesis is the p-value.
To study the impact of financial disintermediation process on the performance of the
commercial banks, it is necessary to measure the correlation between disintermediation
indices and the basic measures of the banks’ performance. The correlation matrix discloses
the relation between the disintermediation indices with two of the important performance
indicators for the Banks, i.e., interest income and interest expense (both expressed as a
percent to total assets). For the measures of performance, i.e., interest income and interest
expense, the theoretical assumption is that due to the impact of disintermediation both will
get reduced, or in other words, there will be a direct positive correlation between them and
the disintermediation indices. Theoretically, the correlation between banking

Corporate Financing Options in India: Banking vs. Capital Markets
104
disintermediation indices (credit & deposit), and banks’ interest income and expense should
be positively correlated, which show higher intermediation activity and vice versa.
During the full studied period (2000-01 to 2014-15), we have seen an insignificant
positive correlation between credit disintermediation index and banks’ interest income and
expenses. Even segregating the complete studied period to pre and post-recession period
shows no significant change in the correlation value and sign. But the correlation between
deposit disintermediation index and interest income and expenses of the banks’ show positive
correlation though significant at 10% level. However, the correlation between these has
become weak and insignificant in the post-recession period, whereas, pre-recession period
correlation was robust and positive and only significant at 10% level.
5.1.3 Regression Result: Impact of Financial Disintermediation on Banks’ NIM
Theoretically, if disintermediation impacts the performance and profitability of the
banks, then there will be a negative slope between the net interest margin with that of the
market capitalization index, i.e., with an increase in market capitalization index, there will be
a decline in the value of net interest margin. The correlation coefficient in our case is reported
as -0.50 with 5% level of significance. MCAP and SB may also indicate the
complementarities or substitutability between bank and equity market financing. Hence, it
may be anticipated that if NIM has negative relation with market capitalization, then it would
also have negative relation with size of a bank (bank asset to GDP). In our present case, we
have also observed the same negative correlation of -0.60 with 1% significant level.
Figure 32: NIM vs. Credit Disintermediation Index Figure 33: NIM vs. Deposit Disintermediation Index
Source: RBI, Authors’ Calculation Source: RBI, Authors’ Calculation
0.00
0.05
0.10
0.15
0.20
0.25
0.30
0.35
0.00
0.01
0.01
0.02
0.02
0.03
0.03
20
00
20
01
20
02
20
03
20
04
20
05
20
06
20
07
20
08
20
09
20
10
20
11
20
12
20
13
20
14
20
15
20
16
NIM Credit Disintermediation Index-rhs
Correlation : -0.22
0.00
0.05
0.10
0.15
0.20
0.25
0.30
0.35
0.40
0.00
0.01
0.01
0.02
0.02
0.03
0.03
20
00
20
01
20
02
20
03
20
04
20
05
20
06
20
07
20
08
20
09
20
10
20
11
20
12
20
13
20
14
20
15
20
16
NIM Deposit Disintermediation Index-rhs
Correlation : -0.31

Corporate Financing Options in India: Banking vs. Capital Markets
105
The credit disintermediation index that measures impact of capital market
development over bank credit, contrary to previous variables (MCAP & SB), the relation here
between NIM and disintermediation index is expected to be a straight one as it may well be
assumed that if disintermediation is making impact over banks’ performance, there will be a
decline in the Bank’s NIM. However, the study has shown negative correlation (0.20) though
it is insignificant. This might be lauded by increase in competition and regulators restriction
which has limited the commercial banks’ pricing power and interest income.
Surprisingly, our study shows a negative slope though insignificant at 10% level.
However, the relation between these two variables during pre and post sub-prime crisis is
seen positive. The correlation co-efficient between disintermediation index and NIM was
recorded 0.32 during 2001-02 to 2007-08 and the relation further strengthened to 0.57 during
post-crisis period (2009-10 to 2015-16).
Table 8: Regression Result: Financial Disintermediation and Banks’ NIM
Dependent Variable:
Net Interest Margin
(NIM)
Model 1
Model 2
Constant 0.03**
(4.84)
0.03**
(5.91)
SB -0.02
(-2.07)
-0.02
(-1.72)
MCAP -0.01
(-1.92)
-0.01*
(-2.36)
CD 0.04
(1.75)
0.03
(1.59)
BLD -.018
(-1.54) -
BDD - -.016*
(-2.27)
Diagnosis
F statistics: 3.44 (p-0.04)
R2: 0.534
Root MSE: 0.002
VIF: 7.66
Heteroscedasticity (Breusch-
Pagan):4.90 (p- 0.03)
DW: 1.73
F-statistics: 4.68 (p-0.02)
R2: 0.609
Root MSE: 0.002
VIF: 7.16
Heteroscedasticity (Breusch-
Pagan):3.59 (p- 0.058)
DW: 1.578
Note: The numbers in parentheses are t-statistics. ** and * represent statistical significance at 1% and
5% levels, respectively.
We have set two sets of regression models using credit disintermediation and deposit
disintermediation model separately as these two variables are highly correlated (0.92) at 1%

Corporate Financing Options in India: Banking vs. Capital Markets
106
significance level. The first model that uses credit disintermediation index is seen to be
significant (F-statistics: 3.44) at 5% level. Though most of the independent variables (except
SB) reflected wrong sign, those were not statistically significant. The goodness of fit is
recorded as 53% with root mean square error of 0.002. The overall model is significant at 5%
level. The regression result of NIM shows that, the regression co-efficient of market
capitalization index is negative and significant at 5% level.
The regression diagnostics are conducted to see the predictability of the regression
model. To check whether regression model suffers from multicollinearity, we have conducted
VIF (Variance Inflation Factor) test. The primary concern is that as the degree of
multicollinearity increases, the regression model estimates of the coefficients become
unstable and the standard errors for the coefficients can get wildly inflated. As a rule of
thumb, if VIF values are greater than 10, it may merit further investigation. Tolerance, i.e.,
defined as 1/VIF, is also used to check on the degree of collinearity, tolerance value lower
than 0.1 is comparable to a VIF of 10. It means that the variable could be considered as a
linear combination of other independent variables. In our case, VIF and tolerance of none of
the variables is worrisome and is found to be in the reasonable limit. Hence our model is free
from multicolinearity issue.
In the second diagnostic stage, we have conducted Breusch-Pagan/Cook-Weisberg
test to identify the heteroscedasticity issue in the model. The null hypothesis of constant
variance or homoscedasticity is rejected as the chi-square (χ2) value is recorded at 4.90,
significant at 5% level. Hence the model suffers from heteroscedasticity problem. The next
diagnostic check is of Autocolinearity. The Issues of Independence is checked via Durbin
Watson statistics. The assumption that the errors associated with one observation are not
correlated with the errors of any other observation covering several different situations. The
Durbin-Watson statistic has a range from 0 to 4 with a midpoint of 2. The observed value in
this case is close to 2, i.e., 1.73, giving indication of no autocolinearity. Though the model is
a good fit, outputs may not be reliable.
In the second regression equation, altering deposit disintermediation index in place of
credit disintermediation index, we have seen better results. The model is seen to be
significant (F-statistics: 4.68) at 5% level. Most of the independent variables (except SB) here
also reflects unexpected sign, but not statistically significant. Among the independent
variables, only MCAP is significant at 5% level. The goodness of fit is recorded as 60% with

Corporate Financing Options in India: Banking vs. Capital Markets
107
root mean square error of 0.002. The overall model is significant at 5% level. The diagnosis
check shows better result than the earlier model. We can conclude that disintermediation has
not significantly affected the performance of the banks.
5.1.4 Regression Result: Impact of Financial Disintermediation on Banks’ ROA
In this equation, the impact of credit and deposit disintermediation on banks’
profitability is measured. The hypothesis of disintermediation affects profitability of the
banks is tested here. Theoretically, there should be a negative relation between profitability
measure (ROA) with market capitalization index, i.e., with an increase in the value of market
capitalization index, there will be a decline in the value of ROA.
In the current study, the regression co-efficient of market cap is seen positive (0.64)
but statistically insignificant. SB and ROA are positively correlated but not significant. The
credit disintermediation index is expected to be negatively correlated to ROA. But, the study
shows a positive but insignificant slope. A negative insignificant positive relation between C-
D ratio and ROA shows that intermediation activity is no more the main source of
profitability for the banks. Hence, apart from intermediation activity, banks’ profitability also
gets determined by other sources. The overall model is seen to be insignificant even at 10%
level as the F-statistics records at 1.68. The R2 is printed at 36%, showing that the model is a
not a good fit and the sum of four regressors explains nearly 34% variations in ROA.
Figure 34: ROA vs. Credit Disintermediation Index Figure 35: ROA vs. Deposit Disintermediation Index
Source: RBI, Authors’ Calculation Source: RBI, Authors’ Calculation
0.00
0.05
0.10
0.15
0.20
0.25
0.30
0.35
0.00
0.20
0.40
0.60
0.80
1.00
1.20
1.40
1.60
20
00
20
01
20
02
20
03
20
04
20
05
20
06
20
07
20
08
20
09
20
10
20
11
20
12
20
13
20
14
20
15
20
16
ROA Credit Disintermediation Index-rhs
Correlation : 0.08
0.00
0.05
0.10
0.15
0.20
0.25
0.30
0.35
0.40
0.00
0.20
0.40
0.60
0.80
1.00
1.20
1.40
1.602
00
0
20
01
20
02
20
03
20
04
20
05
20
06
20
07
20
08
20
09
20
10
20
11
20
12
20
13
20
14
20
15
20
16
ROA Deposit Disintermediation Index-rhs
Correlation : -0.02

Corporate Financing Options in India: Banking vs. Capital Markets
108
Table 9: Regression Result: Financial Disintermediation and Banks’ ROA
Dependent Variable:
Return on Asset (ROA)
Model 1
Model 2
Constant 1.03
(1.71)
0.88
(1.47)
SB 2.43
(1.89)
2.29
(1.70)
MCAP 0.87
(1.62)
0.64
(1.23)
CD -4.08
(-1.70)
-3.34
(-1.43)
BLD 1.13
(0.94) -
BDD - 0.23
(0.28)
Diagnosis
F statistics: 1.99 (p-0.16)
R2: 0.40
Root MSE: 0.24
VIF: 7.66
Heteroscedasticity (Breusch-
Pagan):0.08 (p- 0.77)
DW: 0.639
F-statistics: 1.68 (p- 0.22)
R2: 0.36
Root MSE: 0.25
VIF: 7.16
Heteroscedasticity (Breusch-
Pagan):0.00 (p- 0.96)
DW: 0.660 Note: The numbers in parentheses are t-statistics. ** and * represent statistical significance at 1% and
5% levels, respectively.
The regression diagnostics for the profitability model is conducted to see the
predictability of the regression model. To check whether regression model suffers from
multicollinearity, we have conducted VIF (Variance Inflation Factor) test. In this case, VIF
and tolerance of none of the variables is worrisome and is found to be in the reasonable limit.
Hence the model is free from multicolinearity issue. In diagnostic stage of heteroskedasticity,
the Breusch-Pagan/Cook-Weisberg test, null hypothesis of Constant variance or
homoscedasticity is not rejected as the chi-square (χ2) value is recorded at 0.00, not
significant even at 10% level. Hence our model is also free from Heteroscedasticity problem.
The next diagnostic check is of Autocolinearity. The observed D-statistics in our model is not
close to 2, i.e., 0.66, giving indication of autocolinearity issue. Overall the model is not
reliable. Hence the model is not sufficient to predict any relation between regressors and
regressand. The same set of results is also seen for the other model. Hence we do not see the
impact of disintermediation on banks’ profitability.

Corporate Financing Options in India: Banking vs. Capital Markets
109
5.2 Objective 2: The Dynamic and Equilibrium Relationship between Corporate Health
and External Financing
Each model has given special attention with respect to predestination tests to capture
the multicollinearity and heteroskedasticity among the panels. Though the present study uses
the balance sheet information and the key parameters are estimated for the balance sheet
information, there is high probability that the independent variables will be correlated. Hence
before moving to solving the final model, the collinear variables are identified through their
VIF (variance inflating factor). Again, the estimated models are adjusted with robust standard
error to capture the heterogeneity among the panels.
Model 1, captures the empirical relationships between Altman Z score (AMZ) and a
group of regressor including firm specific and external financing variables. Out of the
independent variables, the model considers asset turnover ratio (ATR), debt ratio (DR) and
good ration (GR) as the firm specific variables. Other forms of specific variables are not
considered in model 1 due to multicolianearity, failure to capture the model objectives and to
improve the overall level of significance of the model. Secondly, the model 1 aims to capture
the impact of institutional financing of firm value. Analyzing the estimated statistics, the
Hausman test recommends random effect after it fails to reject the null hypothesis (H0) that
the difference in coefficients is not systematic. The significant Wald Chi square, indicated the
overall significance level of the model. It has been found that the asset turnover ratio (ATR),
debt ratio (DR) and good ration (GR) are positively and significantly impacting financial
health of the firms as indicated by AMZ which is in line of theoretical expectation. Among
the external financing parameters, i.e. equity out of total borrowing (ETTB) and bank
borrowing out of total borrowing (BBTTB), ETTB is positively and significantly impacting
financial health of the firm i.e. higher equity financing out of total borrowing would increase
Z score (AMZ) where increase Z score implies better financial health and far from
bankruptcy. Control factor interest is appearing positive and significant in influencing
financial health in the present study.
Similarly, model 2 captures the impact of external financing captured by bank
borrowing as proportion of enterprise value (BBTEV), total borrowing as proportion of
enterprise value (TBTEV), and equity financing out of enterprise value (ETEV) on Z score
where TBTEV is negatively and significantly impacting Z score. The increasing proportion
of total borrowing out of enterprise value would have a significantly negative impact on

Corporate Financing Options in India: Banking vs. Capital Markets
110
financial health of the firm. Increasing total borrowing out of enterprise value would reduce Z
score that decreases financial health and increases chances of bankruptcy. Bank and equity
borrowing to enterprise value i.e. (BBTEV) and (ETEV) is appearing insignificant to
influence financial health of the firms. Moreover all the firm specific indicators and the
interest rate are positive and significant in line with Model 1, supporting the stability of the
estimated parameters.
Table 10: Estimated Results of Model 1 & 2: Corporate Health vs. External Financing
Model 1: AMZ (Dependent Variable) Model 2 AMZ (Dependent Variable)
Number of Observations 16000 Number of Observations 16000
Number of Groups 1000 Number of Groups 1000
Wald Chi2
357.09*** Wald Chi2
365.07***
Rho 0.0029 Rho 0.0021
Variables Coefficients Variables Coefficients
ATR 0.082*** ATR 0.081***
DR 0.091** DR 0.140**
GR 0.048*** GR 0.047***
BBTTB 0.003 BBTEV 0.007
ETTB 0.004** TBTEV -0.016**
INTR 0.145** ETEV 0.008
Constant 0.058 INTR 0.140**
Constant 0.177
Hausman Test Statistics Hausman Test Statistics
Chi 2 = 2.04 Prob. = 0.84 Chi
2 = 12.94 Prob. = 0.117
Note: ***, **, * implies the level of significance at 1%, 5% and 10% level, respectively.
Model 3, brings all the five external financing parameters together to analyze their
impact on financial health indicator. The consistency of the properties of the estimated
parameters in the Model 3 further justifies the robustness of the model and probability of
accuracy. All the firm specific parameters are positive and significant. Out of external
financing parameters, ETTB is having a significantly positive and TBTEV is having a
significantly negative impact on corporate health. Collectively a higher equity financing out
of total borrowing and a lower total borrowing out of its enterprise value can boost corporate
financial health, provided the firms achieve a significant net sales over its total asset, an ideal
portion of long term asset financed by debt and the firms reinvesting back a significant
amount of their retained earnings. In all the three models of AMZ, the rho, the interclass
correlation parameter is substantially low (less than 3%) implying less than 3% of variance in

Corporate Financing Options in India: Banking vs. Capital Markets
111
the error distributions of the model is due to difference across panels. All the 1000 sample
firms are of different size. Hence heterogeneity seems to be natural phenomenon. To capture
these heterogeneity, the study has estimated the parameters with robust standard error that
could successfully controlled the heteroskedasticity in the estimated error.
Table 11: Estimated Results of Model 3 & 4: Corporate Health vs. External Financing
Model 3: AMZ (Dependent Variable) Model 4: TQ (Dependent Variable)
Number of Observations 16000 Number of Observations 16000
Number of Groups 1000 Number of Groups 1000
Wald Chi2
368.22*** Wald Chi2
127.11***
Rho 0.0022 Rho 0.045
Variables Coefficients Variables Coefficients
ATR 0.081*** EBITDAR 1.905**
DR 0.140** CDR -0.162*
GR 0.047*** DR -0.158*
BBTTB 0.002 GR 1.876**
ETTB 0.003* BBTTB -0.008
BBTEV 0.007 ETTB 0.003**
TBTEV -0.016** INTR 1.350**
ETEV 0.007 Constant -5.507
INTR 0.139*
Constant 0.180
Hausman Test Statistics Hausman Test Statistics
Chi 2 =12.81 Prob. = 0.118 Chi
2 =02.91 Prob. = 0.719
Note: ***, **, * implies the level of significance at 1%, 5% and 10% level respectively.
In a similar attempt, the present study also tries to capture the impact of external
financing on corporate health; taking Tobin’s Q as the indicator of a firm’s health. The
estimated result of Models 4, 5 and 6 is presented in adjacent table. In these models, as firm
specific factor, we have taken ratio of EBITDA to total asset (EBITDAR), current debt ratio
(CDR) i.e. ratio of current debt to total asset, Debt ratio (DR) i.e. ration of non-current
liability to total asset and finally good ratio (GR) i.e. retained earnings over total asset. The
variables are selected to avoid multicolinearity among regressor and those variable are taken
that can improve models predictive ability without suffering from the problem of model
misspecification. In the present study, enormous effort has been given to make each model
unique to its structure of parameters.

Corporate Financing Options in India: Banking vs. Capital Markets
112
Table 12: Estimated Results of Model 5 & 6: Corporate Health vs. External Financing
Model 5: TQ (Dependent Variable) Model 6: TQ (Dependent Variable)
Number of Observations 16000 Number of Observations 16000
Number of Groups 1000 Number of Groups 1000
Wald Chi2
27.79*** Wald Chi2
127.01***
Rho 0.044 Rho 0.045
Variables Coefficients Variables Coefficients
EBITDAR 1.902*** EBITDAR 1.902***
CDR -0.151** CDR -0.152**
DR -0.146** DR -0.147**
GR 1.873** GR 1.874**
BBTEV -0.002 BBTTB -0.008
TBTEV -0.015** ETTB 0.003*
ETEV 0.002 BBTEV -0.002
INTR 1.27** TBTEV -0.015**
Constant -5.212 ETEV 0.002
INTR 1.268**
Constant -5.128
Hausman Test Statistics Hausman Test Statistics
Chi 2 =09.73 Prob. = 0.218 Chi
2 =14.73 Prob. = 0.071
Note: ***, **, * implies the level of significance at 1%, 5% and 10% level respectively.
All the firm specific parameters are appearing statistically significant. EBITDAR and
GR are positively impacting TQ compared to CDR and DR which are having negative
impact. Since TQ represents firm value, an increased earning and retained rate would
definitely add to value and more current and non-current liability would impact negatively.
Hence the estimated statistics is as per theoretical expectation. Among the external financing
parameters ETTB i.e., Equity out of total borrowing is having significantly positive impact on
TQ. Similarly, in Model 5, total borrowing out of enterprise value (TBTEV) is significantly
and negatively impacting. The same consistency is observed in Model 6. More over all the
external financing parameters are impacting corporate health in the same way irrespective of
corporate health being proxied by Altman Z score or Tobin’s Q value. All the 6 models are
statistically significant and rejected the null hypothesis that not all the coefficients are equal
to zero. On the recommendation of Hausman test, the random effect estimates are considered
and all models are estimated with robust standard error.

Corporate Financing Options in India: Banking vs. Capital Markets
113
5.3 Objective 3: Dynamics of Financial Health on Corporate Balance Sheet and its
Impact on Bank financing and NIM
The estimated statistics of the Model 7 and 8 are shown below. In Model 7, ROA is
significantly explained by asset turnover ratio, good ratio, debt ratio and EBITDA ratio.
These parameters are influencing ROA positively and significantly. Out of external
parameters, equity financing out of total borrowing and enterprise value is having a
significantly positive impact on return on asset. Hence, equity financing is contributing
positively to the profitability parameter of the corporate balance sheet. Contrary to equity,
total borrowing out of enterprise value, is having a negative impact. In other words, equity
financing is positively contributing to profitability whereas debt finance is negatively
contributing. In this case, interest rate is appearing significant.
Table 13: Estimated Results of Model 7 & 8: Dynamics of financial health on
corporate balance sheet
Model 7: ROA (Dependent Variable) Model 8: ROCE (Dependent Variable)
Number of Observations 16000 Number of Observations 16000
Number of Groups 1000 Number of Groups 1000
Wald Chi2
18.50*** Wald Chi2
83.57***
Rho 0.042 Rho 0.018
Variables Coefficients Variables Coefficients
ATR 0.0605*** ATR 0.0701***
GR 0.2395** GR 0.3967*
DR 0.0428* DR 0.0169
EBITDAR 0.2257** EBITDAR 0.3632**
BBTTB 0.0039 BBTTB 0.0013**
ETTB 0.0082*** ETTB 0.0016***
BBYEV 0.0044 BBTEV 0.0080
TBTEV -0.0401*** TBTEV -0.018***
ETEV 0.0849** ETEV 0.0247**
INTR 0.2852*** INTR 0.3598
Constant -1.648 Constant -1.1698
Hausman Test Statistics Hausman Test Statistics
Chi 2 = 08.03 Prob. = 0.131 Chi
2 = 11.94 Prob. = 0.111
Note: ***, **, * implies the level of significance at 1%, 5% and 10% level respectively.
In case of Model 8, other than debt ratio, all the firm specific parameters are
appearing statistically significant. Similarly, except bank borrowing to enterprise value, all

Corporate Financing Options in India: Banking vs. Capital Markets
114
the external financing parameters are statistically significant. Total borrowing out of
enterprise value is negatively influencing return on capital employed. In other word, it has
been concluded that so far return on capital employed is concerned, any kind of financial
structure such as either debt or equity, may impact positively on return on capital employed,
but total borrowing should not exceed an optimum level.
Table 14: Estimated Results of Model 9, 10 & 11: Dynamics of financial health on corporate
balance sheet
Model 9: DR Model 10: CDR Model 11: NWC
Number of Obs. 16000 Number of Obs. 16000 Number of Obs. 16000
Number of Groups 1000 Number of Groups 1000 Number of Groups 1000
F-Statistics
140.53*** F-Statistics
139.7*** F-Statistics
118.47*
** RMSE
95.78 RMSE 95.63 RMSE 60.74
Variables Coeff. Variables Coeff. Variables Coeff.
ATR -0.060*** ATR 0.068*** ATR -2.35***
EBITDAR 0.233* EBITDAR -0.187* EBITDAR 9.35*
ROA 1.024*** ROA -1.010*** ROA 31.01***
GR -0.352*** GR 0.306*** GR -9.25**
BBTTB -0.081** BBTTB 0.083** BBTTB -0.02
ETTB -0.003 ETTB 0.030 ETTB -0.04
BBTEV 0.001 BBTEV -0.001 BBTEV -0.13*
TBTEV 0.005 TBTEV -0.003 TBTEV -0.05
ETEV -0.028** ETEV -0.014* ETEV 0.001
INTR -3.763*** INTR 3.637*** INTR 55.88**
Constant 11.55*** Constant -2.547 Constant 17.38
Note: ***, **, * implies the level of significance at 1%, 5% and 10% level respectively.
Model 7 and 8 presents the relationship between external financing on debt ratio and
current liability ratio. Among firm specific factors, asset turnover ratio and good ratio is
having a negative impact on debt ratio. It is obvious that more retained earnings would reduce
the scope of debt financing to long term asset, and a lower asset turn over may be the result of
higher debt financing to asset. Hence the model seems to capture the firm behavior in line
with the theoretical expectation. Out of external financing parameters, bank borrowing to
total borrowing is having negative and significant impact on the debt financing but positively
impacting current liability. Hence we may infer that financing current liability through bank
borrowings may have positive impact on corporate balance sheet but financing long term

Corporate Financing Options in India: Banking vs. Capital Markets
115
asset through bank borrowing may not be as good. Moreover, the study does not suggest in
support of equity financing, either to monetize current or non-current liability. In the same
line, for working capital management, the structure of external financing hardly makes any
sense. It is only the firm specific parameters that plays crucial role even though bank
borrowing is significant at 10% level of probability.
Equation 12, 13 and 14 tries to model banking sector parameters with respect to
financial health of corporate. As indicators of the banking sector, the study has considered
Return on Assets of all scheduled commercial banks (BROA), net interest margin (NIM) and
change in total asset or liability of the banking sector. As corporate are appearing as one of
the potential financial customer of banking sector, and in the previous models we have tried
to capture the financial health of the corporate with respect to external financing, where
financing from banks and financial institution stands to be a major component, here an
attempt is made to study the impact on banking sector with respect to the financial health of
the corporate. This is in a way exploring another dimension of capturing impact of corporate
health on banking sector. The model- 12 to 14, are estimated with simple panel OLS and the
estimated statistics are presented in table below. In model 12, ROA of all the scheduled
commercial banks are regressed upon a group of firm specific and external parameters. It has
been noticed that asset turnover ratio (ATR), current liability to total asset ratio (CDR) and
non-current liability to total asset ratio (DR) is having significant positive impact on return on
asset of the banking sectors.
Similarly out of external financing parameters, bank borrowing to total borrowing
(BBTTB) and bank borrowing to enterprise value (BBTEV) is positively and significantly
influencing commercial banks ROA, which seems to be in line of theoretical expectation.
When, corporate go for more and more institutional borrowing, i.e., in case of increasing debt
financing among corporate is expected to boost commercial banks’ return on asset. But
incase corporate prefer more equity financing than debt financing they shift from bank
borrowing to equity financing where ROA is negatively impacted. This is captured by ETTB
and ETEV, which are significant and negative. But an excess total corporate borrowing out of
their enterprise value may have a negative impact on banks profitability as indicated by
(TBTEV). Hence an excess leverage i.e., excess debt holding not only impacts corporate
health, but also impacts banks’ profitability negatively and may make banking sector more
vulnerable.

Corporate Financing Options in India: Banking vs. Capital Markets
116
In case of NIM, current debt, non-current debt and retained earnings are impacting NIM
positively. Out of the external borrowing, all the bank borrowing parameters are impacting
NIM positively. But in this case equity out of total borrowing is also affecting positively to
NIM which seems difficult to justify. In model 14, the study has attempted to capture
determinants of total asset or liability of commercial banks. In this case all the firm specific
parameters are positively and significantly contributing to commercial banks asset. But
corporate bank borrowing is negatively impacting total asset and liabilities of scheduled
commercial banks.
Table 15: Estimated Results of Model 12, 13 & 14: Dynamics of financial health on Banks’
financing and Net Interest Margin (NIM)
Model 12: BROA Model 13: NIM Model 14: L&A
Number of Obs. 16000 Number of Obs. 16000 Number of Obs. 16000
Number of
Groups 1000 Number of Groups 1000
Number of
Groups 1000
F-Statistics
8.89*** F-Statistics
250.9*** F-Statistics
14.38***
RMSE
26.11 RMSE 10.28 RMSE 6.45
Variables Coeff. Variables Coeff. Variables Coeff.
ATR 0.75*** ATR -0.001 ATR 0.140**
CDR 15.69*** CDR 0.092** CDR 2.477***
DR 15.31*** DR 0.104** DR 2.812***
GR 0.27 GR 0.003** GR 0.295**
BBTTB 0.02** BBTTB 0.020** BBTTB -0.005**
ETTB -0.02*** ETTB 0.055*** ETTB -0.003
BBTEV 0.24 BBTEV 0.005* BBTEV -0.091
TBTEV -0.97*** TBTEV 0.003 TBTEV -0.068
ETEV 0.02*** ETEV -0.003 ETEV -0.001
INTR -0.63*** INTR -0.045*** INTR -0.271***
Constant 80.98*** Constant 2.822*** Constant 20.035**
* Note: ***, **, * implies the level of significance at 1%, 5% and 10% level respectively.

Corporate Financing Options in India: Banking vs. Capital Markets
117
5.4 Objective 4: The Financing Preferences of Indian Corporate Across Business Cycles
(Primary Research Survey)
With an objective to understand the corporate financing trends in India, we have
conducted a survey among 3,500 Chief Financial Officers (CFOs), Directors and other top
executives who are directly involved in decision making of financing of the firms. The
questionnaire was designed to collect data on financing pattern and behavior of the top
management towards financing needs. We followed a convenient sampling method given the
access and approach to the top executives. Most of the questions were close-ended and
executives were given a scale of preference from 1 to 5 where 1 stands for strongly disagree
and 5 for strongly agree. (1: Strongly Disagree, 2: Disagree, 3: Neutral, 4: Agree, 5: Strongly
Agree). The questionnaire was circulated in a manner targeting all the industries throughout
the geography of the country. Even multinational companies operating in India are also
covered in the survey. This chapter is based on the collective response of a set of two hundred
and seventeen responses that is collected. The responses of the questions are as follows;
5.4.1 My Organization Prefers Equity to Debt Capital
Debt versus equity is a very logical comparison when a firm thinks about raising
funds to meet its capital needs.
Equity is especially important for
certain industries and kinds of
businesses, like technology start-
ups and companies with global
aspirations. Equity investment is
mainly done through venture
capital and private equity
investors. The general belief is
that, equity investment is prevalent in a particular region where start-up environment is at a
nascent stage. However, as the environment of start-ups mature and valuation becomes
saturated, then the debt financing becomes the need of the hour. Equity is the preferred
choice of the start-ups in their incipient stage as they do not have access to easy debt funding
and they need good amount of funds for marketing and increasing their customer base. Best
part of the equity investment is that the founders need not have to worry about repaying the
money back. Founders and equity investors are sitting in the same boat and equity investors
Figure 36: My Organization Prefers Equity Financing
over Debt
Strongly
Disagree8%
Disagree8%
Neutral23%
Agree23%
Strongly Agree38%
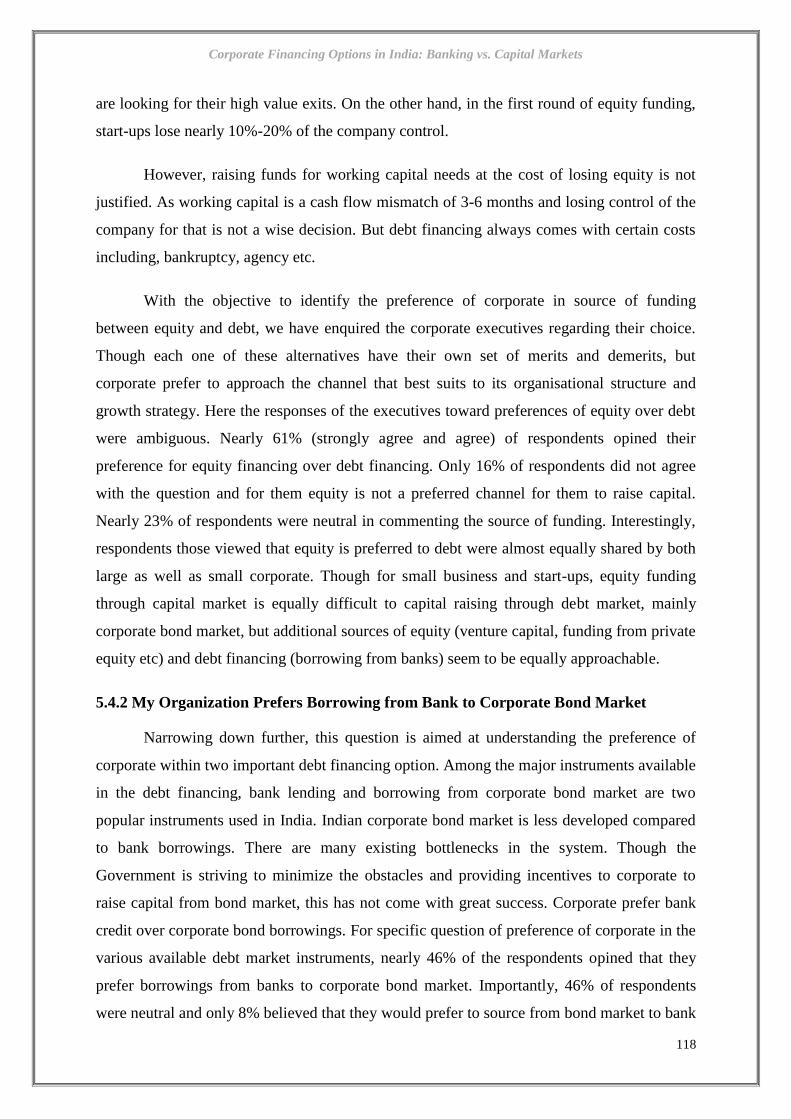
Corporate Financing Options in India: Banking vs. Capital Markets
118
are looking for their high value exits. On the other hand, in the first round of equity funding,
start-ups lose nearly 10%-20% of the company control.
However, raising funds for working capital needs at the cost of losing equity is not
justified. As working capital is a cash flow mismatch of 3-6 months and losing control of the
company for that is not a wise decision. But debt financing always comes with certain costs
including, bankruptcy, agency etc.
With the objective to identify the preference of corporate in source of funding
between equity and debt, we have enquired the corporate executives regarding their choice.
Though each one of these alternatives have their own set of merits and demerits, but
corporate prefer to approach the channel that best suits to its organisational structure and
growth strategy. Here the responses of the executives toward preferences of equity over debt
were ambiguous. Nearly 61% (strongly agree and agree) of respondents opined their
preference for equity financing over debt financing. Only 16% of respondents did not agree
with the question and for them equity is not a preferred channel for them to raise capital.
Nearly 23% of respondents were neutral in commenting the source of funding. Interestingly,
respondents those viewed that equity is preferred to debt were almost equally shared by both
large as well as small corporate. Though for small business and start-ups, equity funding
through capital market is equally difficult to capital raising through debt market, mainly
corporate bond market, but additional sources of equity (venture capital, funding from private
equity etc) and debt financing (borrowing from banks) seem to be equally approachable.
5.4.2 My Organization Prefers Borrowing from Bank to Corporate Bond Market
Narrowing down further, this question is aimed at understanding the preference of
corporate within two important debt financing option. Among the major instruments available
in the debt financing, bank lending and borrowing from corporate bond market are two
popular instruments used in India. Indian corporate bond market is less developed compared
to bank borrowings. There are many existing bottlenecks in the system. Though the
Government is striving to minimize the obstacles and providing incentives to corporate to
raise capital from bond market, this has not come with great success. Corporate prefer bank
credit over corporate bond borrowings. For specific question of preference of corporate in the
various available debt market instruments, nearly 46% of the respondents opined that they
prefer borrowings from banks to corporate bond market. Importantly, 46% of respondents
were neutral and only 8% believed that they would prefer to source from bond market to bank

Corporate Financing Options in India: Banking vs. Capital Markets
119
borrowings. Neutral responses also throw some light on recent development of the corporate
bond market. However, most of the respondents who believed that borrowings from bond
market are easier belong to large corporate.
Corporate decision to issue bonds instead of other methods of raising money can be
driven by many factors viz. the features and benefits of bonds versus other common methods
of raising capital. In India though banks still dominate the market space, when it comes
borrowing, issuing bonds is often a more attractive proposition. The interest rate that the firm
obliges on bond finance is often less than the interest rate they would be required to pay in
bank loan. Since the money paid out in interest is subtracted from corporate profits, and
companies are in business to generate profits, minimizing the interest amount that must be
paid to borrow money is an important consideration. It is one of the reasons why healthy
corporate, those do not seem to need money, often issue bonds when interest rates are at
extremely low levels. The ability to borrow large sums of money at low interest rates gives
corporate the ability to invest in growth, infrastructure and other projects. Additionally,
issuing bonds also gives companies significantly greater freedom to operate as they see fit -
free from the restrictions that are often attached to bank loans.
Further digging down in knowing reason for preference of bank finance over other
available alternatives, nearly 85% of respondents opined that alternative funding options are
not popular/ available in the country, the incidence of which compels more and more
corporate to opt for bank lending route. It is difficult for a new and small enterprise to raise
capital from equity and corporate bond market. Additionally, prolonged economic slowdown
Figure 37: My Organisation Prefers Borrowing
from Bank to Corporate Bond Market
Figure 38: Corporate Prefer Bank credit in
India as the alternative funding options are not
popular/available
Strongly
Disagree
8%
Disagree
0%
Neutral
46%
Agree
23%
Strongly
Agree
23%
Strongly
Disagree
0%
Disagree
7%
Neutral
8%
Agree
8%
Strongly
Agree
77%

Corporate Financing Options in India: Banking vs. Capital Markets
120
and weak business cycles also prevent corporate to raise capital efficiently from both
corporate bond as well as equity market.
5.4.3 My Organisation Prefers to Raise Funds from Capital Market rather than Banks
Addition to the question 1
where corporate opined their
preference of equity financing over
debt, this question aims at
understanding the preference of
corporate between equity financing
and a part of the debt finance segment,
i.e., popular debt financing channel,
bank borrowings. The responses were
in the same expected manner as nearly 50% of respondents opined that they would prefer
equity over bank finance. However, the percentages of responses from those prefer bank
borrowing channel was nearly 42%. Most importantly, compared to the question 1, where
16% of respondents did not agree with the fact that equity is not a preferred channel for them
to raise capital over debt, here 42% preferred banking channel to capital market. This clearly
indicates that the bank borrowing channel still dominates to meet the capital appetite in India.
The notion of the entrepreneurs towards capital market has undergone a dramatic
change due to further deepening of the capital market. Earlier, it was believed that the capital
market was more expensive than the bank borrowing, but over the last few years what is seen
is completely opposite to it. A great deal depends on the costs involved in a transaction on the
capital market, like a potential prospectus. These costs are a burden especially for smaller
accounts.
5.4.4 Important factors for a borrower while deciding the source of finance
With an objective to identify the crucial factors for a borrower while opting for a
source of finance, the respondents were asked to rank their preferences from the set of
possible reasons. Interest rate leads the rank as 77% of the respondents believed that interest
rate is the most important factor in deciding the source of finance followed by availability of
source of finance (62%). Business cycle and economic condition shared the third place with
Figure 39: My Organisation prefers to raise funds
from Capital Market rather than Banks
Strongly
Disagree
25%
Disagree
17%
Neutral
8%
Agree
17%
Strongly
Agree
33%
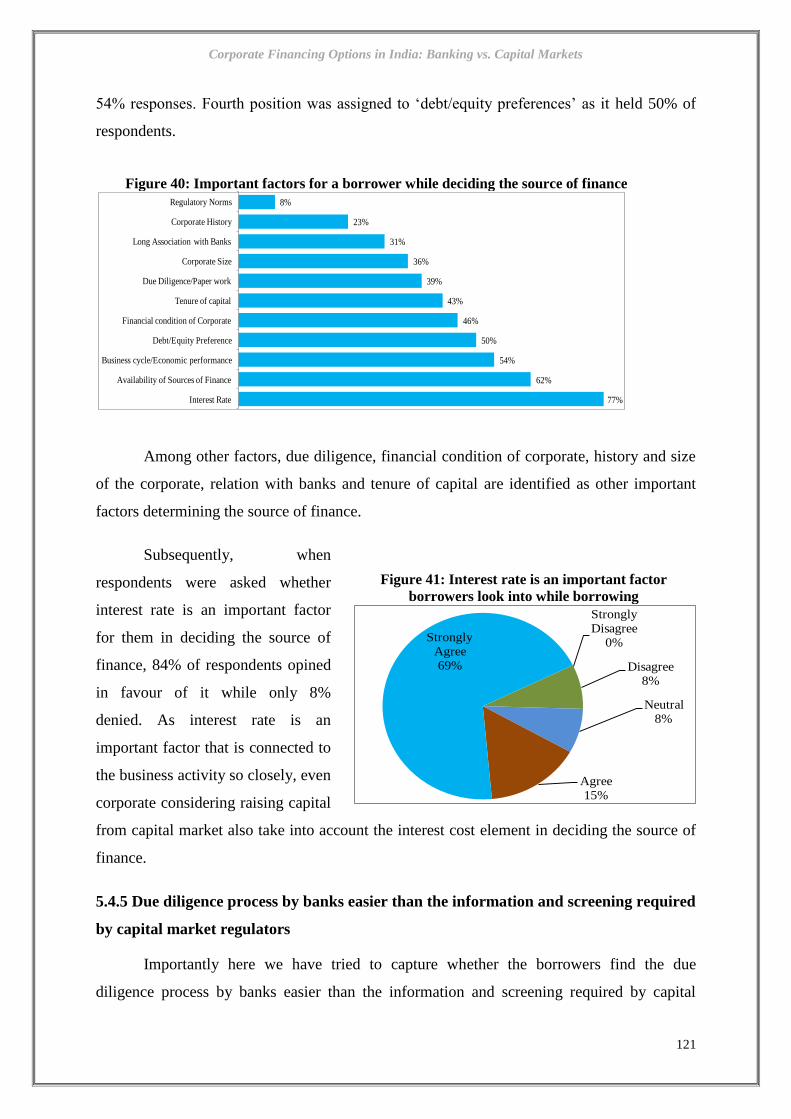
Corporate Financing Options in India: Banking vs. Capital Markets
121
54% responses. Fourth position was assigned to ‘debt/equity preferences’ as it held 50% of
respondents.
Among other factors, due diligence, financial condition of corporate, history and size
of the corporate, relation with banks and tenure of capital are identified as other important
factors determining the source of finance.
Subsequently, when
respondents were asked whether
interest rate is an important factor
for them in deciding the source of
finance, 84% of respondents opined
in favour of it while only 8%
denied. As interest rate is an
important factor that is connected to
the business activity so closely, even
corporate considering raising capital
from capital market also take into account the interest cost element in deciding the source of
finance.
5.4.5 Due diligence process by banks easier than the information and screening required
by capital market regulators
Importantly here we have tried to capture whether the borrowers find the due
diligence process by banks easier than the information and screening required by capital
Figure 40: Important factors for a borrower while deciding the source of finance
Figure 41: Interest rate is an important factor
borrowers look into while borrowing
77%
62%
54%
50%
46%
43%
39%
36%
31%
23%
8%
Interest Rate
Availability of Sources of Finance
Business cycle/Economic performance
Debt/Equity Preference
Financial condition of Corporate
Tenure of capital
Due Diligence/Paper work
Corporate Size
Long Association with Banks
Corporate History
Regulatory Norms
Strongly
Disagree
0%
Disagree
8%
Neutral
8%
Agree
15%
Strongly
Agree
69%

Corporate Financing Options in India: Banking vs. Capital Markets
122
market regulators. No definite conclusion is derived as nearly 38% of respondents agreed that
due diligence process in banks is easier for them to fulfill and obliged to, than the 23% who
were opposed to it. Almost 40% of respondents were neutral.
Hence the due diligence
process for corporate while raising
capital is almost equally difficult to
oblige for both bank as well as
capital market. Additionally, the
analysis of cases by sector and
borrower profile also points that
small borrowers find it almost
difficult to access the capital market.
At the same time, they struggle in
fulfilling the documentation process
desired by the banks. Similarly, if a firm that belongs to a stressed sector, approaches capital
market, investors punish the firm through lower subscription or demand for higher yield.
With gradual relaxation of norms in the capital market and initiatives in promoting corporate
bond market, we believe that due diligence process might be less painful in coming days.
5.4.6 Due diligence process followed by banks is cumbersome for new /small borrowers
With specific intention to know
how difficult the due diligence process
for small borrowers approaching for
bank credit, the question was thought
upon them. The general belief of small
and new borrowers finding it difficult to
access bank credit seems to be true as
69% of respondents opined in favour of
it. Only 16% of respondents did not
agree. In India, mainly the new/small
entrepreneurs/ borrowers generally operate as unregistered enterprises and more often, they
do not maintain proper books of accounts and are not formally covered under taxation rules.
Hence, the banks shy away from lending these institutions and they are forced to access
Figure 42: Borrowers find the due diligence process by
banks easier than the information and screening
required by capital market regulators
Figure 43: Due diligence process of banks is
cumbersome for new/small borrowers
Strongly
Disagree
15%
Disagree
8%
Neutral
39%
Agree
23%
Strongly
Agree
15%
Strongly
Disagree
8%
Disagree
8%
Neutral
15%
Agree
15%
Strongly
Agree
54%

Corporate Financing Options in India: Banking vs. Capital Markets
123
outside sources of finance at an exorbitant rate. But changing rules and initiatives by the
government/regulators including MUDRA scheme has opened up the space for small
entrepreneurs and has taken enough steps to reduce their hassles.
5.4.7 Additional services rendered by Banks in addition to financing (including Vendor
management, supply chain management, buyer collaborations etc.) are important for
attracting borrowers
We were interested in knowing despite cheaper and hassle free options available to
the borrowers for fund raising, why
corporate still prefer to borrow from
banks. Sometimes in addition to
financing the loan, banks also offer a
bundle of additional value added
services to borrowers that neither capital
market nor bond market offers. Some of
these services includes; vendor
management, supply chain
management, buyer collaborations,
payments, tax payment, salary
disbursement etc.
However, only 54% of respondents agreed to us saying that additional services
offered might be attracting more borrowers towards banking channel. Jointly 46% of
respondents were neutral and disagreed with the statement. This might be driven by the fact
that not all banks do offer all the additional services. Corporate in business for long are more
professional than banks in arranging these added services at a much cheaper and effective
way. Its only those small borrowers who are new to the business might be interested in these
services.
5.4.8 Banks prefer large corporate to small ones for lending
The hypothesis that the banks prefer large corporate borrowers to small ones in
financing is tested here. Moreover, 86% of respondents opined that banks prefer large
corporate borrowers. Only 9% were neutral and 5% disagreed. There are ample reasons with
banks for their leniency towards large borrowers which have both business and reputational
Figure 44: Additional support services by the
banks in addition to financing attracts borrowers
Strongly
Disagree
8%
Disagree
15%Neutral
23%
Agree
8%
Strongly
Agree
46%

Corporate Financing Options in India: Banking vs. Capital Markets
124
considerations. But recent asset quality issue has given sudden jolt to banks as more and more
number of large corporate credit are getting re-structured, due to rising NPA.
Banks have already realised their mistake in their focus of lending to large corporate
as the latest RBI data illustrates that the
major part of the stress in banks’
balance sheet is attributed to large
borrowers as their share in GNPAs is
86.4% against a share of 58.0% on total
credit portfolio as on march 2016.
Concentration risk is recorded highest
to large corporate in sectors including
power, infrastructure, steel and cement
etc. Banks need to relook their strategy and should diversify their customer portfolio.
5.4.9 Corporate with weak balance sheet/ulterior motives (siphoning of funds to other
business) prefers to raise funds from capital market to banks
Generally, due diligence process followed by the banks in financing corporate is
believed to be strict. Hence, there is a common thought that corporate with weak balance
sheet or promoters with ulterior motives including siphoning of funds to other business,
prefer raising funds from capital market to banks. For quite some time, the banking regulator
(RBI) has come out with a set of strict measures to put in place to disseminate credit
information pertaining to willful defaulters for cautioning banks and financial institutions so
as to ensure that further bank finance is not made available to such borrowers. 35% of
respondents were neutral as there is another set of theory that argues that those promoters or
corporate believe that capital market participants are well aware about the company’s
financial condition and balance sheet structure. Hence all the available information gets
reflected in the demand of the corporate share. Investors price the already available
information and punish the firms with low demand when they come public for raising funds.
Only 35% of respondents agreed that weak corporate or promoters with ulterior intentions
prefer to raise capital from the capital market, followed by 30% of respondents, not
subscribing to the thought.
In an open ended question to the respondents regarding the sources of finance for
corporate with weak balance sheet, we have seen that 47% of the respondents opined that
Figure 45:Banks prefer Large Corporate to Small
ones for lending
Strongly
Disagree
2%
Disagree
3%
Neutral
9%Agree
29%
Strongly
Agree
57%

Corporate Financing Options in India: Banking vs. Capital Markets
125
external commercial borrowings are most preferred instruments for corporate, followed by
venture capital (40%). Only 33% of respondents believed that banks are preferred by those
enterprises. Weak corporate might believe that international borrowers may not price harshly
for their weak balance sheet and ulterior intention compared to domestic investors, and
allowed them a space to raise capital through ECB route.
5.4.10 Development of equity market (including debt market) would help corporate to
bypass the bank route for their financial requirements
A comparison of corporate funding split with other economies shows a high degree
of reliance on loans from banks and other financial institutions. Traditionally, bank finance
coupled with equity markets and external borrowings has been the preferred funding source
for Indian corporate. While it is
true that the Indian corporate debt
market has transformed itself into
a much more vibrant trading field
for debt instruments from the
elementary market than what it
was about a decade ago, there is
still a long way to go.
This particular question is
asked to understand the concern
of the entrepreneurs whether they believe that over dominance of bank credit is mainly due to
scanty supply of other sources of finance. Surprisingly, nearly 55% of respondents opined
Figure 46:Corporate with weak balance sheet
&ulterior motives prefer to raise funds from
capital market to banks
Figure 47:Corporate having weak financial
condition prefers to raise funds through which
mode
Figure 48:Development of Equity Market (including
Bond Market) would help Corporate to bypass the Bank
route for their financial requirements
Strongly
Disagree
18%
Disagree
12%
Neutral
35%
Agree
23%
Strongly
Agree
12% 33%
47%40%
20%
Banks External
Commercial
Borrowings
Venture Capital Other Sources
7%
13%
20%
27%33%
Strongly
Disagree
Disagree Neutral Agree Strongly
Agree

Corporate Financing Options in India: Banking vs. Capital Markets
126
that limited availability of other financing options compels promoters to approach bank for
finances. Only 20% of respondents did not agree with the thought. An efficient bond market
helps corporate to reduce their financing costs. It enables them to borrow directly from
investors, bypassing the major intermediary role of a commercial bank. Recent RBI
instructions to limit the bank lending to large corporate is expected to open up sufficient
space for the development of the corporate bond market in India.
5.4.11 What are the major obstacles in the development of Corporate Bond market in
India?
Banks and equity markets are the dominant sources of capital for business in India
even as the corporate bond market has languished for decades now. The development of bond
market requires fundamental reforms in financial markets, public finance and regulatory
governance, something not easy to achieve. The basic market infrastructure needs to be put in
place. With the intention of knowing the major obstacles in the development of the corporate
bond market in India, we have given a set of reasons to the respondents to identify or choose
the obstacles for the development of the corporate bond market in India.
Nearly 30% of respondents agreed that not allowing mutual funds to invest in the
Indian corporate bond market is the prime region followed by the restrictive regulatory
prudential norms for the participants in Indian corporate bond market. 21% of respondents
believed that existing market structure does not work in support of the corporate bond market
Figure 49:Major obstacles in the development of Corporate Bond Market in India
8.3%
12.5%
16.7%
20.8%
22.5%
29.2%
Pricing
Excess equity market liberalisation than bond market
Initial offer cost
Market structure
The regulatory prudential norms for the participants in Indian corporate bond market is
restrictive
Not allowing MF to invest in

Corporate Financing Options in India: Banking vs. Capital Markets
127
in India followed by 17% of respondents suggested that higher initial offer cost discourages
corporate bond market in India.
5.4.12 Implementation of Strategic Debt Restructuring/Corporate Debt Restructuring
(SDR/CDR) coupled with Bankruptcy and Insolvency Code will discourage corporate
borrowing from Banks
To understand the reaction
of the borrowers towards recent
policy development and
tightening norms towards bad
loans, we have sought the opinion
of entrepreneurs whether
enforcement of new measures
including CDR/CDR and
Bankruptcy and Insolvency Code
would discourage them to
approach banks for further capital. 35% of respondents were neutral and 35% disagreed with
the question. However, only 30% agreed with the statement. Hence, implementation of new
rules might not discourage the preferences of corporate for banking finance and would still
take a risk.
Figure 50: Implementation of SDR/CDR and
Bankruptcy and Insolvency code will discourage
Corporate borrowing from Banks
29%
6%
35%
18%
12%
Strongly
Disagree
Disagree Neutral Agree Strongly
Agree

Corporate Financing Options in India: Banking vs. Capital Markets
128
CHAPTER VI
Conclusions
The role of the commercial banks in the intermediation process is very important
because of their overwhelming control over the entire financial assets of the economy and
more so because of the underdeveloped capital market in our country. In India, bank credit
forms a major part of external funding for corporate. In public limited companies, bank
borrowing accounts for nearly 30% of external financing and 20% of total financing. In
private limited companies, bank borrowing constitutes 28.1% of external financing and
17.3% of total company financing.
To support the endeavoring effort of the Indian economy and to sustain its high
growth rate, it is imperative that financing constraints in any form be removed and alternate
financing channels be developed in a systematic manner for supplementing traditional bank
credit. While the equity market in India has been quite active, the size of the corporate debt
market is very small in comparison not only to developed markets, but also to some of the
emerging market economies in Asia such as Malaysia, Thailand and China. A liquid
corporate debt market can play a critical role by supplementing the banking system to meet
the requirements of the corporate sector for long-term capital investment and asset creation.
6.1 Financial Disintermediation and its Impact on Banks’ Performance and Profitability
The share of household savings in financial and physical assets has always remained
in support of the later. Household savings in financial assets has increased from 2.2% in
1951-52 to 64.5% in 1994-95 and moderated to 40.4% in 2014-15. Household savings in
physical assets was 97.8% of total savings in 1951-52, which came down to 48.1% in pre
sub-prime crisis.
Bank credit intermediation index though has remained same in 2015-16 compared to
2000-01 but with a huge volatility in between years. The overall slope as measured by the
trend line shows a negative slope for bank credit intermediation index. In case of bank
deposit intermediation index, the index had a sudden jump from 0.15 in 2000-01 to 0.19 in

Corporate Financing Options in India: Banking vs. Capital Markets
129
2005-06 and then declined further to reach minimum of 0.08 in 2015-16. Similar negative
slope is also recorded for deposit intermediation index for banks. Hence an evidence of bank
disintermediation through institutionalization is observed. In case of credit disintermediation
indices, especially for bank credit disintermediation index, the index did not record any
significant change, albeit there was volatility in the interim periods. segregate the whole
studied period of 16 years to pre (2000-01 to 2007-08) and post sub-prime crisis (2008-09 to
2015-16) period, it is observed that the slope coefficient of the banking (credit)
disintermediation index was negative during both the studied periods but the slope co-
efficient during pre recession phase was much higher than the slope coefficient of post
recession phase. This clearly shows that the disintermediation process that started in later half
of the nineties got pronounced till the sub-prime crisis. The capital market crash again
weakened the disintermediation process and banks regained their lost position in credit
disbursement.
During the full studied period (2000-01 to 2014-15), we have seen an insignificant
positive correlation between credit disintermediation index and banks’ interest income and
expenses. Even segregating the complete studied period to pre and post-recession period
shows no significant change in the correlation value and sign.
Regression analysis conducted to test the hypothesis whether disintermediation has
affected the profitability and performance of banks shows a mixed result. Regression Result
of NIM shows a negative and significant co-efficient with market cap. Similarly, a negative
significant relation between size of the Bank and NIM is too observed. The disintermediation
has not impacted the performance of the banks.
In the equation measuring the impact of disintermediation on profitability, regression
co-efficient of market cap is seen positive, albeit insignificant too. A positive relation
between the size of the Bank and ROA is also recorded. The hypothesis that
‘disintermediation does not affect the performance of banks’ is not rejected. Similarly, for
profitability the hypothesis that ‘disintermediation does not affect the profitability of banks is
also not rejected.
For a lower-middle income Economy like India, there is huge gap of funds to finance
growth. In a recent speech addressing a seminar on "Infrastructure and Global Economic
Growth" organized by Asia Infrastructure Investment Bank (AIIB), Finance Minister Shri

Corporate Financing Options in India: Banking vs. Capital Markets
130
Arun Jaitley has viewed that, “Over the next decade, we require over $1.5 trillion in India
alone to fill up the infrastructure gap”. The total credit outstanding of ASCB at end 2015-16
was $1.08 trillion (assuming 1 USD= 66 INR). When only infrastructure sector’s funding
requirement is projected at $1.5 trillion which is ~ $450 billion higher than total credit
outstanding of ASCB till now ($1.08 billion), threat of disintermediation though is
significant, banks have enough room for intermediation activity.
6.2 The dynamic and equilibrium relationship between corporate health and external
financing
The present study has taken five external financing parameters such as proportion of
equity to total borrowing, proportion of bank borrowing to total borrowing, bank borrowing
to enterprise value, total borrowing to enterprise value and equity to enterprise value and for
corporate health, we have taken Altman Z score and Tobin’s Q. Six models at different
combinations are estimated where each model is unique at its kind. The firm specific
variables are selected correcting multocollionearity, avoiding model misspecification and
improving overall level of significance level of the model. The parameters are estimated with
robust standard error to control heteroskedasticity. Panel random effect model is suggested by
Hausman test. The study concludes that total borrowing to enterprise value negatively and
significantly impacting Z score. The increasing proportion of total borrowing out of
enterprise value would have a significantly negative impact on financial health of the firm.
Increasing total borrowing out of enterprise value would reduce Z score that decreases
financial health and increases chances of bankruptcy. Collectively a higher equity financing
out of total borrowing and a lower total borrowing out of its enterprise value can boost
corporate financial health provided the firms achieve a significant net sales over their total
asset, an ideal portion of long term asset financed by debt and firms reinvesting back a
significant amount of its retained earnings.
The robustness of the model is checked by regression the same external financing
parameters on Tobin’s Q, where the study concludes the same recommendations. While
taking TQ as proxy for corporate health, EBITDAR, CDR, DR and GR have been considered
as the firm specific parameters. The study finds the same behavior of external financing on
corporate health i.e. a higher equity financing out of total borrowing and a lower total
borrowing out of its enterprise value can boost corporate financial health provided the firms
achieve a significant earning over its total asset and a significant reinvestment back from

Corporate Financing Options in India: Banking vs. Capital Markets
131
retained earnings. Moreover excess current debt and more debt financing of long term asset
would negatively impact corporate health and hence, more investment may not add value
under such circumstances.
6.3 Dynamics of financial health on corporate balance sheet and its Impact on bank
financing and Net Interest Margin (NIM)
The present study extends its model to capture the impact of financial health on
corporate balance sheet through the channels of external financing. As was observed, each
model is developed and estimated uniquely. The study concludes that out of external
parameters, equity financing out of total borrowing and enterprise value is having a
significantly positive impact on return on asset. Hence, equity financing is contributing
positively to the profitability parameter of the corporate balance sheet. Contrary to equity,
total borrowing out of enterprise value is having a negative impact. In other words, equity
financing is positively contributing to profitability whereas debt finance contribution is
negative.
Similarly, except bank borrowing to enterprise value, all the external financing
parameters are statistically significant addressing ROCE. Total borrowing out of enterprise
value is negatively influencing return on capital employed. In other words, it has been
concluded that so far return on capital employed is concerned, any kind of financial structure
either debt or equity may impact positively to return on capital employed, but total borrowing
should not exceed an optimum level.
Out of external financing parameters, bank borrowing to total borrowing is negatively
and significantly impacting the debt financing but positively impacting current liability.
Hence, we may infer that financing current liability through bank borrowing may have
positive impact on corporate balance sheet but financing long term asset through bank
borrowing may not be a good idea. Moreover, the study does not suggest to equity financing
to monetize either current or non-current liability. In the same line, for working capital
management, the structure of external financing hardly makes any sense. It is only the firm
specific parameters that play crucial role even though bank borrowing is appearing significant
10% level of probability.
So far as banking sector is concerned, the study has identified that when corporate go
for more and more institution borrowing, i.e. in case of increasing debt financing among

Corporate Financing Options in India: Banking vs. Capital Markets
132
corporate is expected to boost commercial banks’ return on asset. But if corporate prefer
more equity financing than debt, and financing preference shifts from bank borrowing to
equity financing, then banks profitability is negatively impacted. Similarly, an excess of total
corporate borrowing out of their enterprise value may have a negative impact on banks’
profitability. In other words, excess debt holding not only impacts corporate health, but also
impacts bank’s profitability negatively, and may make banking sector more vulnerable.
In case of NIM, current debt, non-current debt and retained earnings are impacting
NIM positively. Out of the external borrowings, all the bank borrowing parameters are
impacting NIM positively. But in this case, equity out of total borrowing is also affecting
positively to NIM, which seems difficult to justify. The results of the model, studying the
determinants of total asset or liability of commercial banks show that all the firm specific
parameters are having a positive and significant impact on commercial banks’ asset. But bank
borrowing by corporate is seen negatively impacting total asset and liabilities of scheduled
commercial banks.
6.4 Financing preferences of Indian corporate across business cycle (Primary Survey)
Answering the most critical question, ‘debt versus equity’, majority of the
respondents voted in support of equity financing over debt financing. Interestingly,
respondents those viewed that equity is preferred over debt were almost equally shared by
both large as well as small corporate. Among various available options in the debt market,
banks and corporate debt market are popular. Given the dominance of the banking system in
the country, when respondents were asked to vote between borrowings from banks over
corporate bond market, majority voted in support of banks as development of corporate bond
market is still at its nascent stage. Respondents while expressing their preference of banking
channel over other available alternatives pointed out that the scarce availability of alternate
funding options is one of the reasons for such trend.
But between banks and capital markets, respondents opined that they would prefer
equity to bank finance. This points the changing outlook of corporate towards equity market,
which has become possible due to deepening of the capital market. Among the various
factors, investors consider while raising capital, interest rate is voted as the most important
followed by availability of source of finance and business cycle and economic condition.

Corporate Financing Options in India: Banking vs. Capital Markets
133
Respondents with equal footing accepted and rejected that current due diligence
process in banks is easier for them to fulfill and obliged to compare to, than raising from
capital markets. This may vary based on a banks’ risk perception towards different sectors
and geographies. Most of the respondents also opined that small and new borrowers find it
difficult to access banking credit. But we believe that MUDRA scheme might act as a game
changer in coming days. Sometimes, banks are able to attract more borrowers mainly from
small and new entrepreneurs due to a bundle of additional value added services like vendor
management, supply chain management, buyer collaborations etc. Corporate in business for
long are more professional than the banks in arranging these added services at a much
cheaper and effective way. It is only those small borrowers who are new to the business
might put interest, a dominant factor over other services. Respondents believed that banks
prefer large borrowers compared to small ones. Banks need to relook their strategy as the
ratio of large accounts turning toxic or stressed is higher as per the RBI’s latest report.
Borrowing behavior of ulterior motive entrepreneurs, who intend to siphon away the
funds to other business, is now regularly getting discussed in the public domain. There is a
common belief that corporate with weak balance sheet or promoters with ulterior motives
including siphoning of funds to other businesses prefer to raise funds from capital market
than accessing bank finance. The respondents were divided in their opinion as there is
another set of theories which tell otherwise. When the respondents were asked about the
exact source of preference of funds for those borrowers who want to divert the funds from
one to the other business, external commercial borrowings was voted the best, followed by
venture capital and bank borrowings. The over-dependence of corporate on banks for their
funding requirement might be caused by many factors including paucity of availability of
other alternatives. Development of equity as well as bond market is referred as the best
solution that would help the corporate to bypass the bank route for their financial
requirements. Despite sincere effort by the Govt. and other regulators, Indian bond market is
still dominated by Govt. securities and highest rated corporate bonds.
Recent policy actions by the RBI in limiting the credit of commercial banks to large
borrowers as well as some other important policy changes are expected to boost liquidity and
deepen the corporate bond market in India. Some of the major roadblocks in the development
of corporate bond market in India as identified by the respondents are; a) not allowing mutual
funds to invest in the Indian corporate bond market, b) restrictive regulatory prudential norms

Corporate Financing Options in India: Banking vs. Capital Markets
134
for the participants in Indian corporate bond market and c) existing market structure, which is
not conducive for corporate bond market in India.
Corporate Financing Options in India: Banking vs. Capital Markets
135
Bibliography
1. Abor, J. and Biekpe, N. (2006). An empirical test of the agency problems and capital
structure of South Africa quoted SMEs, SA Journal of Accounting Research, 20(1), 51-
65.
2. Abor, J. and Biekpe, N. (2009). How do we explain the capital structure of SMEs in sub-
Saharan Africa? Evidence from Ghana, Journal of Economic Studies, 36(1), 83-97.
3. Adeyemi, S. B., and Oboh, C. S. (2011). Perceived Relationship between Corporate
Capital Structure and Firm Value in Nigeria, International Journal of Business and Social
Science, 2(19), 131-143.
4. Ahmed, H. J. A., and Hisham, N. (2009). Revisiting Capital Structure Theory: A Test of
Pecking Order and Static Order Trade-of Model from Malaysian Capital Market,
International Research Journal of Finance and Economics, 30, 58-65.
5. Allen, N. Berger, (2002). Capital Structure and Firm Performance: A new approach to
testing agency theory and an application to the banking industry, Board of Governors of
the Federal Reserve System, Washington, 20-21.
6. Al-Sakran S.A. (2001). Leverage determinants in the absence of corporate tax system: the
case of non-financial publicly traded corporations in Saudi Arabia, Managerial Finance,
27, 58-86.
7. Amidu, M. (2007). Determinants of capital structure of banks in Ghana: an empirical
approach, Baltic Journal of Management, 2(1), 67-79.
8. Ang J.J. and McConnel J. (1982). The administrative cost of corporate bankruptcy: a
note, Journal of Finance, 37, 219-216.
9. Ang, J. S., R. A. Cole, and J. W. Lin. (2000). Agency costs and ownership structure, The
Journal of Finance, 55(1), 81-106.
10. Asquith, P., and D. W. Mullins. (1983). The impact of initiating dividend payments on
shareholders’ wealth, Journal of Business, 77-96.
11. Azhagaiah, R., and R. Deepa. (2011). Impact of firm size on the relationship between
profitability and capital structure, Udyog Pragati, 35(3).
12. Azhagaiah, R., and R. Deepa. (2011). Determinants of profitability: A study with
reference to income size-wise analysis of selected firms. SMART Journal of Business
Management Studies, 7(2), 42-56.
13. Azhagaiah, R., and R. Deepa. (2011). Choice of capital structure model: An empirical
analysis with reference to static trade-off Vs pecking order theories in beverage and

Corporate Financing Options in India: Banking vs. Capital Markets
136
alcohol industry in India. International Journal of Research in Computer Application &
Management, 6(1), 107-11.
14. Baxter, N. (1967). Leverage risk of ruin and the cost of capital, Journal of Finance, 663-
81.
15. Baker, M., and J. Wurgler. (2002). Market timing and capital structure. The Journal of
Finance, 57(1), 1-32.
16. Berens, J. L., and C. J. Cuny. (1995). The capital structure puzzle revisited, The Review of
Financial Studies, 8(4), 1185-208.
17. Bhaduri S. (2002). Determinants of corporate borrowing: some evidence from the Indian
corporate structure, Journal of Economic and Finance, 26, 200-215.
18. Bhattacharjee, B. J. (2010). Determinants of capital structure of Indian industries, The
Indian Journal of Commerce, 63(3), 14-25.
19. Bhole, L. M., and Jitendra Mahakud (2005). Trends and Determinants of Private
Corporate Savings in India, Economic and Political Weekly, 4243- 4250.
20. Bokpin, A. G., and Isshaq, Z. (2008). Stock market development and financing decisions
of listed firms in Ghana, African Journal of Business Management, 2 (10), 209-216.
21. Booth, L., Aivazian, V., Demirguc-Kunt, A. and Maksimovic, V. (2001). Capital
structures in developing countries, Journal of Finance, 56, 87-130.
22. Brennan, M., and E. Schwartz. 1984. Optimal financial policy and firm valuation,
Journal of Finance, 39, 593-607.
23. Carelton .W.T. and Siberman. I. H. (1977). Joint determination of rate of return and
capital structure. An econometric analysis, Journal of Finance, 32, 811-821.
24. Castanias, R. (1983). Bankruptcy risk and optimal capital structure. The Journal of
Finance, 38 (5), 1617-35.
25. Chadha, S., and A. K. Sharma. (2015). Determinants of capital structure: an empirical
evaluation from India, Journal of Advances in Management Research, 12(1), 3-14.
26. Chakraborty, I. (2010). Capital structure in an emerging stock market: The case of India,
Research in International Business and Finance, 24, 295-314.
27. Chandrasekhar, C. P. (2007). Private Equity: A New Role for Finance?, Economic and
Political Weekly, 42(13), 1136-1145.
28. Chandrasekhar, C. P. (2009). Continuity or Change? Finance Capital in Developing
Countries: A Decade after the Asian Crisis, in Ghosh Jayati and Chandrasekhar C P

Corporate Financing Options in India: Banking vs. Capital Markets
137
(ed), After Crisis: Adjustment, Recovery and Fragility in East Asia, Tulika Books, New
Delhi.
29. Challenges in Developing the Bond Market in BRICS (Shri R. Gandhi, Deputy
Governor – Sep 27, 2016 – at the Seminar on “Challenges in Developing the Bond
Market in BRICS” conducted jointly by CII and MoF, Government of India in Mumbai)
https://rbi.org.in/Scripts/BS_SpeechesView.aspx?Id=1025
30. Cressy, R., and Olofsson, C. (1997). European SME Financing: An Overview, Special
Issue of Small Business Economics, Small Business Economics, 9, 87-96.
31. Carelton, .W.T. and Siberman, I. H. (1977). Joint determinatin of rate of return and
capital structure. An econometric analysis, Journal of Finance, 32, 811-821.
32. Chaudhari, K., Raje, M., & Singh, C. (2014). Corporate Bond Markets in India: A Study
and Policy Recommendations. Working Paper No: 450, Indian Institute of Management,
Bangalore.
33. Chungchang. (1992). Capital Structure as an optimal contract between Employees and
investors, The Journal of Finance, 47 (3), 1141-1157.
34. DeAngelo, H., and R. Masulis. (1980). Optimal capital structure under corporate and
personal taxation. Journal of Financial Economics, 8, 3-29.
35. Deutsche Bank Research. (2009). Trends in India’s Corporate Financing, Asia Current
Issues.
36. Demirguc-Kunt, Asli, Laeven, Luc, Levine, Ross (2004). Regulations, Market Structure,
institutions, and the Cost of Financial intermediation, Journal of Money, Credit and
Banking, 36(3), 593-622.
37. Dhal, S. (2010). Regulatory Requirements and Commercial Banks Lending rate: Some
Theoretical Perspectievs, Banks and Bank Systems, 5(2).
38. Diamond, D. (1997). Liquidity, banks, and markets. Journal of Political Economy,
105(5), 928-56.
39. Dogra, B., and S. Gupta. (2009). An empirical study on capital structure of SMEs in
Punjab, The ICFAI Journal of Applied Finance, 15(3), 60-80.
40. Donaldson, G. (1961). Corporate debt capacity: A study of corporate debt policy and the
determination of corporate debt capacity. Boston: Division of Research, Harvard School
of Business Administration.
41. Durand, D. (1963). The Cost of Capital in an Imperfect Market: A Reply to M-M,
American Economic Review, 53(3), 433-443.

Corporate Financing Options in India: Banking vs. Capital Markets
138
42. Eugene, F. Fama (1985). What’s different about banks?, Journal of Monetary
Economics, 15(1), 29-39.
43. Fama, E. F., and French, K. (2002). Testing trade-off and pecking order Predictions
about dividends and debt, Review of Financial Studies, 15, 1-33.
44. Fischer, E. O., R. Heinkel, and J. Zechner. (1989). Dynamic capital structure choice:
Theory and tests. The Journal of Finance, 44(1), 19-40.
45. Frank, M. Z. and Goyal, V. K. (2009). Which Factors Are Reliably Important? Financial
Management, 1-37.
46. Gaud O., Jani E., Hoesli M. and Bender A. (2005). The capital structure of Swiss firms:
An empirical analysis using dynamic panel data, European Financial Management, 11,
51-69.
47. Givoly, D., C. Hayn, A. R. Ofer, and O. Sarig. (1992). Taxes and capital structure:
Evidence from firms' response to the Tax Reform Act of 1986. The Review of Financial
Studies, 5(2), 331-55.
48. Ghemawat, P., and R. E. Caves. (1986). Capital commitment and profitability: An
empirical investigation, Oxford Economic Papers, New Series, 38(1), 94-110.
49. Givoly, D., C. Hayn, A. R. Ofer, and O. Sarig. (1992). Taxes and capital structure:
Evidence from firms' response to the Tax Reform Act of 1986, The Review of Financial
Studies, 5(2), 331-55.
50. Hall, G., Hutchinson, P. and Michaelas, N. (2004). Determinants of the capital structure
of European SMEs, Journal of Business Finance and Accounting, 31(5), 711-728.
51. Harris, F. H. De B. (1988). Capital intensity and the firm's cost of capital, The Review of
Economics and Statistics, 70 (4), 587-94.
52. Harris, M., and A. Raviv. (1990). Capital structure and the informational role of debt,
The Journal of Finance, 45 (2), 321-49.
53. Harris, M., and A. Raviv. (1991). The theory of capital structure, The Journal of
Finance, 46(1), 297-355.
54. Hussain, J. and Matlay, H. (2007). Financing preferences of ethnic minority
owner/managers in the UK, Journal of Small Business and Enterprise Development,
14(3), 487-500.
55. IMF. Global Financial Stability Report (GFSR), “Fostering Stability in a Low-Growth,
Low-Rate Era”, October 2016.
56. Jangili, R., and K. Sharad. (2010). Determinants of Private Corporate Sector Investment

Corporate Financing Options in India: Banking vs. Capital Markets
139
in India, Reserve Bank of India Occasional Papers, 31(3), 67-89.
57. Jensen, M. C., and W. H. Meckling, (1976). Theory of firm: Managerial behavior,
agency costs and ownership structure, Journal of Financial Economics, 305-60.
58. Jon, Tucker. (2007). Long and short-run capital structure dynamics in the UK An
industry level study, University of the West of England Evarist Stoja, Queen’s University
Belfast.
59. John, M. Harris, Jr., Rodney, L. Roenfeldt, and Philip, L. Cooley. (1983). Evidence of
Financial Leverage clientle, The Journal of Finance, 38(4), 1125-1131.
60. Kane, A., A. Marcus, and R. MacDonald. (1984). How big is the tax advantage to debt?,
Journal of Finance, 39, 841-52.
61. Kayo, E.K., and Limura, H. (2010). Hierarchical determinants of capital structure,
Journal of Banking & Finance, 35, 358-371.
62. Kim E.H. (1978). A mean-variance theory of optimal capital structure and corporate debt
capacity, Journal of Finance, 33(1), 45-63.
63. Kester, C. W. (1986). Capital and ownership structure: A comparison of United States
and Japanese manufacturing corporations, Financial Management, 15(1), 5- 16.
64. Kim, E. H. (1978). A mean-variance theory of optimal capital structure and corporate
debt capacity, Journal of Finance, 33(1), 45-63.
65. Kotrappa. (2000). Contemporary issues in Business finance by Omprakash Kajipet,
Discovery Publishing House, New Delhi, 1st Edn., 70-75.
66. Kothari, C.R. (1990), Banking in India: Challenges ahead in Indian Banking, Social
banking and Profitability,Arhant publishers, 1, 19-25.
67. Kose, John. (1987). Risk-shifting incentives and signalling through Corporate Capital
Structure, The Journal of Finance, 42(3), 623-639.
68. Krishnamurthy, N S. (1994). Financial Disintermediation, IBA bulletin, 16 (3), 12-14.
69. Kunt, Asli Demirguc. and Levine, Ross. (1999). Bank Based and Market Based
Financial Systems: Cross -Country Comparisons, www.worldbank.org.
70. Leeladhar. (2007). Indian Financial Sector Reforms, RBI Monthly Bulletin, 61(4).
71. MacKie-Mason, J. K. (1990). Do taxes affect corporate financing decisions?, The
Journal of Finance, 45, 1471-1493.
72. Malabika, Deo., and S. Jackline. (2009). The determinants of debt ownership structure:
Some empirical evidence, Indian Journal of Finance, 3(1), 22-27.
Corporate Financing Options in India: Banking vs. Capital Markets
140
73. Masulis, R.W., and A. N. Korwar. (1986). Seasoned equity offerings, Journal of
Financial Economics, 91-118.
74. Mathew. (1991). Optimal Financial Leverage- The ownership factor, Finance India,
5(2), 195-201.
75. Mayer, Colin. (1990). Financial Systems, corporate Finance and Economic
Development, in R.G Hubbard (ed), Asymmetric Information, Corporate finance and
Investment, NBER, Chicago University Press.
76. Mayer, C. S. (2001). Capital structure, The Journal of Economic Perspectives,15 (2), 81-
102.
77. Mazur, K. (2007). The determinants of capital structure choice: Evidence from Polish
Companies, International Atlantic Economic Society, 13, 495-51.
78. Myers, S. C., and N. S. Majluf. (1984), Corporate financing and investment decisions
when firms have information that investors do not have. Journal of Financial
Economics, 13, 187-221.
79. Myers, S .C. (1977). Determinants of corporate borrowing. Journal of Financial
Economics, 147-75.
80. Masulis, M. S. (1983). The Impact of Capital Structure on Firm Value, Journal of
Finance, 38, 107-25.
81. Mehran, H. (1992). Executive incentive plans, corporate control, and capital structure.
The Journal of Financial and Quantitative Analysis, 27(4), 539-60.
82. Miao, J. (2005). Optimal capital structure and industry dynamics, The Journal of
Finance, 60(6), 2621-59.
83. Miller, M. H. (1977). Debt and Taxes, Journal of Finance, 32, 261-73.
84. Mikkelson, W. H., and M. M. Partch. (1986). Valuation effects of security offerings and
the issuance process. Journal of Financial Economics, 31-60.
85. Mitra, A. (2009). Why corporate bond market in India is in Nelson’s low level
equilibrium trap for so long?, NSE News, 8-16.
86. Mitton, T. (2007). Why have debt ratios increased for firms in emerging markets?,
European Financial Management, 14, 127-151.
87. Michaelas, N., Chittenden, F. and Poutziousris, P. (1999). Financial policy and capital
structure choice in UK SMEs: empirical evidence from company panel data, Small
Business Economics, 12, 113-130.

Corporate Financing Options in India: Banking vs. Capital Markets
141
88. Mitali, Sen and J. K. Pattanayak. (2005). An Empirical Study of the Factors Influencing
the Capital Structure of Indian Commercial Banks, The ICFAI Journal of Applied
Finance, 2 (3), 23-38.
89. Modigliani, F., and Miller, M. H. (1958). The cost of capital, corporation finance and the
theory of investment, American economic Review, 48(3), 261-297.
90. Modigliani, F., and Miller, M. H. (1963). Corporate income taxes and the cost of capital:
a correction, American economic Review, 53, 433-443.
91. Mohan, Rakesh. (2006). Recent Trends in the Indian Debt Market and Current
Initiatives, RBI, 2006.
92. Mohan, R. (2004). Globalisation: The Role of Institution Building in the Financial
Sector: The Indian Case (part 1&2), RBI monthly bulletin, 18(2), 117-151.
93. Myers, S., and Majluf, M. (1984). Corporate financing and investment decisions when
firms have information that investors do not have, Journal of Financial Economics, 13,
187-221.
94. Myers, S. C. (1984). The capital structure puzzle, The Journal of Finance, 39(3), 575-
92.
95. Nagaraj, R. (1996). India’s capital market growth: Trends, Explanations and Evidence,
Economic and Political Weekly, 31(35), 36-37.
96. Pandey, I. M. (2005). Financial Management (9th edition), Vikas Publishing House,
Delhi.2005. 330-342.
97. Patitosh, Chandra, Sinha and Santanu, Kumar, Ghosh. (2010). Macroeconomic
Variables and Firms’ Adjustment-Speed in Capital Structure Choice: Indian Evidence,
The ICFAI Journal of Applied Finance, 16(4), 29-50.
98. Patil, Dr. R. H. The Report of the High Level Expert Committee on Corporate Bonds and
Securitization. 2005.
99. Percy Mistry Committee, Report of the High Powered Expert Committee on Making
Mumbai an International Financial Centre in 2007.
100. Prasanna, Chandra. (1995). Fundamentals of Financial Management, Tata
McGrawHill Publishing Company Limited, New Delhi, 495-498.
101. Panigrahi, A. K. (2011). Location as a determinant of capital structure: A study of
Indian private sector firms. Indian Journal of Commerce & Management Studies, 2(1),
24-32.
102. Psillaki, M., and Daskalakis, N. (2009). Are the determinants of capital structure

Corporate Financing Options in India: Banking vs. Capital Markets
142
country or firm specific?, Small Business Economics, 33, 319-333.
103. Pettit, R., and Singer, R. (1985). Small business finance: a research agenda, Financial
Management, 14, 97-112.
104. Padron, Y.G., Apolinario R. M. C., Santana, O. M., Marlel, V. C. M. and Sales, L. J.
(2005). Determinant factors of leverage: An empirical analysis of Spanish
corporations, Journal of Risk Management, 6, 60-68.
105. Pahuja, A. and Sahi, A. (2012). Factors affecting capital structure decisions: empirical
evidence from selected Indian firms, Financial Industrial & Management Research,
1(3), 77-86.
106. Patrick, Bolton., and David, S. Schartstein. (1998). Corporate Finance, the Theory of
the Firm, and Organizations, Journal of Economic Perspectives, 12(4), 95-114.
107. Pinegar, J. M., and L. Wilbricht. (1989). What managers think of capital structure
theory: A survey, Financial Management, 18(4), 82-91.
108. Prabhakaran, Nair. V. R. (2005). Determinants of Fixed Investment: A study of Indian
Private corporate Manufacturing Sector, Working Paper 369, CDS, Trivandrum.
109. Pradhan, Jaya, Prakash. (2007). Trends and Patterns of Overseas Acquisitions by
Indian Multinationals, Working Paper No:2007/10, ISID, New Delhi.
110. PwC-NAREDCO-APREA report. 2016. Building the Economy Block by Block.
111. Raghvan, S., and Sarwono, D. (2012). Development of the corporate bond market in
India: An empirical and policy analysis, International Conference on Economics and
Finance Research, International Proceedings of Economics Development and
Research, 32, 49-53.
112. Raghvan, S., and Sarwono, D. (2012). Development of the corporate bond market in
India: An empirical and policy analysis, International Conference on Economics and
Finance Research, International Proceedings of Economics Development and
Research, 32, 49-53.
113. Rajan, and Zingales. (2002). A Review of Research on the practices of Corporate
finance. South Asian Journal of Management, 9(4), 29. 36.
114. Rajan, R. G., and L. Zingales. (1995). What do we know about capital structure?
Some evidence from international data, The Journal of Finance, 50(5), 1421-60.
115. Raghuram Rajan Committee, A Hundred Small Steps [Report of the Committee on
Financial Sector Reforms (CFSR)] in 2009.
116. Rajakumar, J. D. (2005). Corporate Financing and Investment Behaviour in India,

Corporate Financing Options in India: Banking vs. Capital Markets
143
Economic and Political Weekly, 40(38), 4159-4165.
117. RBI. (2016). Report of the Working Group on Development of Corporate Bond
Market in India, August 2016.
118. RBI (2000), Financial Disintermediation, Annual Report 1999-2000, Vol. LIV, No. 9,
48.
119. RBI (2002), Financial Intermediary Based Versus Market Based Financing.
120. RBI. (2016), Handbook of Statistics on the Indian Economy 2014-15, Mumbai.
121. Richard, Kolondy., and DianeRizzule, Suher. (1985). Changes in capital structure,
New equity issues and scale effects. The Journal of Financial Research, 3(2), 127-
135.
122. Ronen, Israel. (1991). Capital Structure and the market for corporate control: The
Definite role of debt and financing, The Journal of Finance, 46(4), 391-1409.
123. Ross, S. A. (1977). The determination of financial structure: The incentive signaling
approach, Bell Journal of Economics, 23-40.
124. Sabnavis, Madan. (2003). Is it time for financial disintermediation,
www.thehindubusinessline.com.
125. Sagar, Seema. (2005). Financing and Investment Patterns of Indian Firms, Economic
and Political Weekly, 40(3), 231-239.
126. Schnabel, J. A. (1984). Bankruptcy, interest tax shields and 'optimal' capital structure:
A cash flow formulation. Managerial and Decision Economics 5(2), 116-19.
127. SEBI, Repeal of Capital Issues (Control) Act 1992,
http://www.sebi.gov.in/History/capitalissue.pdf
128. SEBI. (2015), Handbook of Statistics on Indian Securities Market 2015, Mumbai.
129. Sengupta, P. (1998). Corporate disclosure quality and the cost of debt, The
Accounting Review, 73(4), 459-74.
130. Sharma, M. L. (1986). Financial Appraisal of Industrial Corporations in India: A study
of State Agro Industrial Corporations in India, Prateeksha Publications, Jaipur.
131. Solomon, Ezra. (1963). The Theory of Financial Management. New York: Columbia
University Press.
132. Stiglitz, J. E. (1969). A Re-examination of M-M Theorem, American Economic
Review, 59, 784-93.
Corporate Financing Options in India: Banking vs. Capital Markets
144
133. Stulz, Rene., M. Merton, Miller., and Modern, Finance. (1990). Keynote adress,
Financial Managment Association Meetings, Seattle, October 2000, 3-25.
134. S. M. Sahoo., and G. Omkarnath. (2005). Capital Structure of Indian Private
Corporate Sector: An Empirical Analysis, The ICFAI Journal of Applied Finance,
2(10), 20-37.
135. The Crisil Year Book on the Indian Debt Market 2015.
136. The Development of India's Corporate Bond market. City of London, 2008.
137. Titman, S., and R. Wessels. (1988), The determinants of capital structure choice, The
Journal of Finance, 43(1), 1-19.
138. Tucker, J., and Lean, J. (2003). Small firm finance and public policy, Journal of Small
Business and Enterprise Development, 10(1), 50-61.
139. Vinayek, R., and A. Gupta. (2010). Determinants of capital structure in drugs and
pharmaceutical industry in India: A comparative study of pre and post liberalization
period, The Indian Journal of Commerce, 63(3), 26-38.
140. Venkatamuni, Reddy, R., and Hemanth, Babu, P. (2008). Corporate Finance Structure
in Indian Capital Market: A Case of Indian Pharmaceutical Industries, The ICFAI
University Journal of Financial Economics, 6(2), 30-40.
141. Velayudham, T. K. (1989). Bank profitability and all that, Economic and Political
Weekly, 24(9), 457-460.
142. Reserve Bank of India, https://www.rbi.org.in/
143. Ministry Of Corporate Affairs - Government of India, http://www.mca.gov.in/