copyright warning &...
TRANSCRIPT

Copyright Warning & Restrictions
The copyright law of the United States (Title 17, United States Code) governs the making of photocopies or other
reproductions of copyrighted material.
Under certain conditions specified in the law, libraries and archives are authorized to furnish a photocopy or other
reproduction. One of these specified conditions is that the photocopy or reproduction is not to be “used for any
purpose other than private study, scholarship, or research.” If a, user makes a request for, or later uses, a photocopy or reproduction for purposes in excess of “fair use” that user
may be liable for copyright infringement,
This institution reserves the right to refuse to accept a copying order if, in its judgment, fulfillment of the order
would involve violation of copyright law.
Please Note: The author retains the copyright while the New Jersey Institute of Technology reserves the right to
distribute this thesis or dissertation
Printing note: If you do not wish to print this page, then select “Pages from: first page # to: last page #” on the print dialog screen

The Van Houten library has removed some of the personal information and all signatures from the approval page and biographical sketches of theses and dissertations in order to protect the identity of NJIT graduates and faculty.

ABSTRACT
The absolute viscosity of the normal paraffins C 5H 12 to
C20H42 was studied to determine a relationship more useful in
.au
predicting liquid viscosities than existing correlations such
as the methods of Andrade, Souders, Thomas, and Doolittle.
It was found that a function of corresponding liquid states
could be designed which related viscosity to the number of carbon
atoms. This function, here called liquidity, is defined as the
extent to which a substance exists as a liquid with respect to
temperature. This function can be expressed mathematically as:
Lc = t - t
m/tc - tmor L
b = t - tm/tb tm
where: Lc = liquidity based on thecritical temperature
L b = liquidity based on thenormal boiling temperature
t = any temperature, °C
t b = normal boiling temperature,°C
tc = critical temperature,°C
tm = normal melting temperature,
Once the basis for liquidity is determined, the denominator in the
above expressions remain constant, and the % liquidity becomes a
straight line function of the temperature.
It was further found that a plot of L c vs. number of carbon
atoms for the n - paraffins resulted in curves of iso - viscosity
which, when fitted to straight lines, could be used for calculation,
extrapolation, or interpolation of viscosity data. Thus, a method
was developed for the viscosity prediction of the n - paraffins
above C4H10
to apply at any temperature within the normal liquid
range. Deviations from the experimental values of viscosity to
those resulting from the designed liquidity function are within
± 10 per cent for the majority, and less than± 20 per cent for
the extreme cases. This approach to viscosity prediction is valid
with or without the availability of experimental data.

ABSOLUTE VISCOSITY OF THE n - PARAFFIN LIQUIDS
BY
GERALD PERMUTT
A THESIS
PRESENTED IN PARTIAL FULFILLMENT OF
THE REQUIREMENT FOR THE DEGREE
OF
MASTER OF SCIENCE IN CHEMICAL ENGINEERING
AT
NEWARK COLLEGE OF ENGINEERING
This thesis is to be used with due respect to the rights of theauthor. Bibliographical references may be noted, but passages must notbe copied without permission of the college and without credit beinggiven in subsequent written or published work.
NEWARK, NEW JERSEY1960

APPROVAL OF THESIS
FOR
DEPARTMENT OF CHEMICAL ENGINEERING
NEWARK COLLEGE OF ENGINEERING
BY
FACULTY COMMITTEE
APPROVED:
NEWARK, NEW JERSEY
JUNE. 1960

ACKNOWLEDGEMENT
The author wishes to express his sincere thanks to
Dr. Saul I. Kreps who made this study possible. It was
by means of his guidance that this thesis takes its
present form.

TABLE OF CONTENTS
Page
Introduction 1
Methods of Viscosity Prediction 3
Development 6
Curve Fitting 11
Results and Conclusions 14
Recommendations 16
Appendix 17
Nomenclature 41
References 42

LIST OF TABLES
Table No. Page No.
1. Absolute Viscosity of the n - Paraffin Liquids 18
Iso-Viscous Values of Liquidity vs. Number ofCarbon Atoms 27
Slope and Intercept for Lines of Iso-Viscosity 29
4. Tabulated Procedure for Gompertz Curve-Fitting 30
5. Comparison of Calculated and Experimental LiquidViscosities 31
6. Temperature Constants 33

LIST OF FIGURES
Figure No. Page No.
1.Viscosity vs. Temperature for n - Paraffins34
2.Liquidity vs. Absolute Viscosity for n - Paraffins35
3.Liquidity vs. Absolute Viscosity for n - Paraffins36
4.Temperature vs. Liquidity for n - Paraffins37
5.Liquidity vs. Number of Carbon Atoms for Lines of
Iso-Viscosity
38
6.Liquidity vs. Number of Carbon Atoms Curve - Fittedfor Straight Lines of Iso-Viscosity
39
7.Fitted Gompertz Curve of Intercept vs. Coded Viscosity.40

INTRODUCTION
The term viscosity may be considered as the measure of internal
fluid friction which tends to oppose any dynamic change in the fluid
motion. Another definition is that viscosity is the ratio of shear-
ing stress to the rate of shear. However one may choose to define
viscosity, it remains as one of the important properties of the
fluid state.
The importance of viscosity is readily apparent in the design
calculations involving heat transfer and fluid flow. These two
areas of engineering interest depend in part on definite values of
viscosity. It therefore follows that the more accurately one can
determine the viscosity of a fluid under a given set of conditions,
the more accurately can the problems of heat transfer and fluid
flow be calculated or predicted.
Since the studies of fluids must take viscosity into consideration,
voluminous work has been recorded on this subject. The theory of gas
viscosity, based on the theory of corresponding states, seems relatively
well established and mathematical relationships agree with the experimen
tal results much more so than for the case of liquid viscosity.
The existing and more commonly accepted methods for predicting
liquid viscosity, i.e., Andrade (2), Souders (2), Thomas (2), and
Doolittle (5,6), fall short of ideal due to one or more of the
following:
1. Accurate experimental data is required.
2. The accuracy of prediction does not hold over an
extended temperature range.
3. The prediction is unduly complicated.
4.
The accuracy of prediction does not hold over the
entire range of molecular weights within a homologous
series.
In this study, the experimental values of absolute viscosity (I)
for the n - paraffins were used as the basis for investigation. The
purpose of this paper was to improve the state of viscosity prediction
by developing a correlation which would minimize or eliminate the
above-mentioned shortcomings which presently exist in the accepted
methods. As a result, a method for viscosity prediction is presented
for the n - paraffins above C 411 10 at any temperature within the liquid
range. This method appears applicable whether or not experimental data
is available.

METHODS OF VISCOSITY PREDICTION
The methods of viscosity prediction which are accepted and
found to be most generally useful are those of Andrade (2), Souders (2),
Thomas (2), and Doolittle (5,6).
The Andrade equation is an explicit temperature-viscosity relation
taking the form of an exponential:
In u = B /T + Aor u = DeB/T
where; u = viscosity, centipoise
I = temperatur, °K
A, B, D, = constants
At least two experimental points are required to solve for the constants
which appear in the equation. This method is recommended for the
correlation of data on liquids under low pressure, and at temperatures
below the normal boiling point. Errors may range up to several per cent.
Souders method is an empirical relation of a log log viscosity
function:
log (log 10 u) = m PL
- 2.9 ;
where: u = viscOsity at low pressure, centipoiseP
L
= density, g/cm3
m = constant = I/M
I = viscosity-constitutional constantcalculated from atomic andstructural constants
M = molecular weight
Accurate knowledge of the density at a questioned temperature level
is required along with a constant which is calculated from atomic
and structural constants. These constants must be known very precisely
since it appears as an exponential multiplier. Hydrocarbons, except
for the low-molecule-weight n - paraffins, unsaturates, and branched
compounds, may be expected to yield values in error 20 per cent.
Thomas method is an empirical relationship of the log viscosity
as a function of a constant, density, and reduced temperature.
log 8.569 u/(PL)1/2 = θ(1/Tr- 1);
where: u = viscosity at low pressure, centipoise
PL= density, g/cm3
θ = viscosity-constitutional constant
calculated from atomic values
Tr = reduced temperature
This method is restricted to temperatures below the normal boiling
point and does not apply to alcohols, acids, or multihalogenated
compounds.
Doolittle has developed a method for viscosity prediction of the
n - paraffins which is satisfactorily valid but complicated. It in-
volves a logarithmic integral, and constants of integration which vary
with molecular weights above 240. This method was further developed to
include the consideration of Free Space but was limited to molecular
weights between 100 and 240, and is expressed
4

in u = -Ae500/T
(-E i ( 500/1 ) ) - 4.66 + ce500/T
where: -Ei ( -500/T ) is the logarithmic integral
c = molecular weight constant of integration
Free Space in a liquid is considered to be that space seemingly
arising from the total thermal expansion of the liquid without
a change of phase. Deviations from measured u of values calculated
to these integrated forms are within the accuracy of measurements
in a majority of cases.

DEVELOPMENT OF THE CORRELATION
This study was restricted to available data for the n — paraffins
within the normal liquid range, i.e., at the temperatures between
boiling and freezing under atmospheric pressure. The compounds under
consideration were CH4 through C20H42.
It was believed, that since a plot of temperature vs. absolute
viscosity, Figure 1, for each individual compound resulted in fairly
parallel curves, that a straight line relationship might exist. A
function of corresponding liquid states, here called liquidity, was
developed and defined in terms of the temperature.
Lb = t tm
/tb
tm
; where:
Lb =
liquidity based on the
normalboiling temperature
t =
any temperature, oC
tb
=
normal boiling temperature, °C
t =
normal melting temperature, °C
This parameter, when substituted for temperature in the above viscosity
vs. temperature plot, resulted in Figure II.
Because of the intersecting character of the curves in Figure II,
a correlation in this form appeared doubtful and, therefore, a different
form of liquidity, L c, was introduced to replace L b and is shown in
Figure III.
L ==t - tm/tc - tm ; where:
Lc =
liquidity based on thecritical temperature
tc =
critical temperature,oC
In essence, Lc may be defined as the extent to which the chemical compound
exists as a liquid. A compound, therefore, would possess 0 per cent
liquidity at the freezing point and 100 per cent liquidity at the boiling
or critical temperature depending on whether L b or Lc is in question.
Since the denominator in the equation for liquidity remains constant,
a straight line function relating L c to temperature results, and is
shown in Figure IV.
As is visible in Figure III, the Lc function based on the critical
temperature again resulted in parallel curves. When Lc was plotted against
the number of carbon atoms, Nc , for curves of constant viscosity, here
called iso-viscosity, a series of curves resulted which somewhat resembled
a damped harmonic motion, Figure V. It appeared that the amount of dis-
persion from an imaginary neutral axis was almost constant for each curve
when related to Nc . Furthermore, the oscillation decreased with the in-
crease in the number of carbon atoms. It is possible that this oscillation
may involve a shape and/or weight factor, but this was not investigated at
this time.
The method of Least Squares (3) was employed to fit this oscillating
curve to a straight line, Figure VI. In order to minimize the effect of
the oscillations, the values for CH4 to C4H10 were excluded. Thus, th e
fitted straight lines gave liquidity, which is a function of temperature,
as a function of the number of carbon atoms.
Lc = m Nc + b ; where: m = slopeNC= number of carbon atoms
b = intercept value of the iso-viscouslines on the L c axis
- 7

It was desirable to attempt to relate the constants, m and b, with
a known parameter. While no useful relationship for the slope was
developed, the intercept, b, was found to be an exponential curve function
of viscosity. Since a plot of intercept vs. parametric viscosity lines
resulted in a smooth curve which asymptotically approached both axes,
Figure VII, it was found that this curve could be fitted according to
statistical methods.
This curve, which takes the name of Gompertz (3) describes a series
in which the decay (or growth) of the logarithms of the parameters are
declining by a constant percentage. The Gompertz curve was found to fit
well the variation of intercept with respect to the parametric iso
-viscosity of Figure VI. If an empirical equation is desired, the following
is offered:
The decoding of u* is done directly from the following:
In lieu of explaining the method of application for the developed
correlation, the following typical problem is presented as an illustration.

Determine the absolute viscosity of hexadecane at 60 °C.
At 60 °C, hexadecane, C 16H34 , has a liquidity of 9.64 per cent.
This value can be approximated directly from Figure IV, or can be
calculated from the expression for liquidity:
Interpolation of Figure VI between the constant viscosity lines of 2.00
and 1.50 for the point L c = 9.64 and Nc = 16 results in a viscosity
prediction of 1.60. This predicted value differs from the experimental
value of 1.57 by 0.03 centipoise, or +1.9 per cent.
Should direct interpolation for the viscosity be undesirable, then
Figure VIII or the empirical equation of u* may be used. The only
factor needed for these alternative methods is the intercept along the
the liquidity axis of Figure VI corresponding to the given point L c = 9.64
and Nc = 16. This intercept is approximated to be 2.0, and u* is solved
as follows:
Using Figure VII, u* is found to be 6.8 for an intercept of 2.0. These
coded viscosities are decoded according to the values given in Table IV,
and are 1.608 and 1.62 respectively, and differ from the experimental
value by 2.4 and 3.2 per cent.

All three methods for viscosity prediction are expected to prove
valid for the n - paraffins from C4H10 through C20H42 and above. When
the critical temperature for a compound is unknown, a line on Figure IV
can be drawn parallel to C20H42 with the origin at the melting temperature,
0 per cent liquidity.

CURVE FITTING (3)
In order to fit the curves in Figure V to a straight line, the
method of Least Squares was employed. For the iso-viscous line u = 1.0,
only the following points were considered:
The straight line is of the form y = m x + b or, in
this particular case, Lc = m Nc + b. The slope and
intercept, m and b, are found according to the genera
formula:b n
t + m Σ NC = E LC
b Σ NC + m Σ (NC2) = Σ (NcLc)
or
16 b + 200 m = 237.8
200 b + 2840 m = 3182.5
solving these simultaneous equations resulted in
m = 0.618 and b = 7.14.
Table III gives the values of m and b for all the
iso-viscous lines in Figure VI.
NC LC
5 12.0
6 8.8
7 13.6
8 10.4
9 13.8
10 12.0
II 14.0
12 13.8
13 15.4
14 15.5
15 16.5
16 16.8
17 18.0
18 18.4
19 19.2
20 19.6

The values for the constants in the empirical equation for u*,
Gompertz curve, were developed in Table IV and then solved as follows:
- 12 -

13

RESULTS AND CONCLUSIONS
A function of corresponding liquid states expressing the degree
of liquid which a substance exhibits was termed liquidity. This term
was mathematically defined as: L c = t - t
m/tc
- tm. Since the denominator
is constant, for any one substance, liquidity becomes a straight line
function of the temperature and is shown in Figure IV.
Liquidity was designed as a straight line function of the number
of carbon atoms for lines of iso-viscosity. This function was
empirically stated as: L c = m Nc + b and is shown in Figure VI for
viscosity values ranging from 0.21 to 2.50 centipoise.
Plotting the intercept of the iso-viscous lines in Figure IV as a
function of viscosity resulted in a smooth Gompertz curve, Figure VII,
which has the following empirical equation:
The initial plotting of liquidity vs. Nc resulted in an oscillating
curve resembling damped harmonic motion. The amplitude along any given
iso-viscous line decreased as the number of carbon atoms increased. It
was also found that the amplitude for a given N c , at all values of
viscosity, was of the same phase and magnitude.

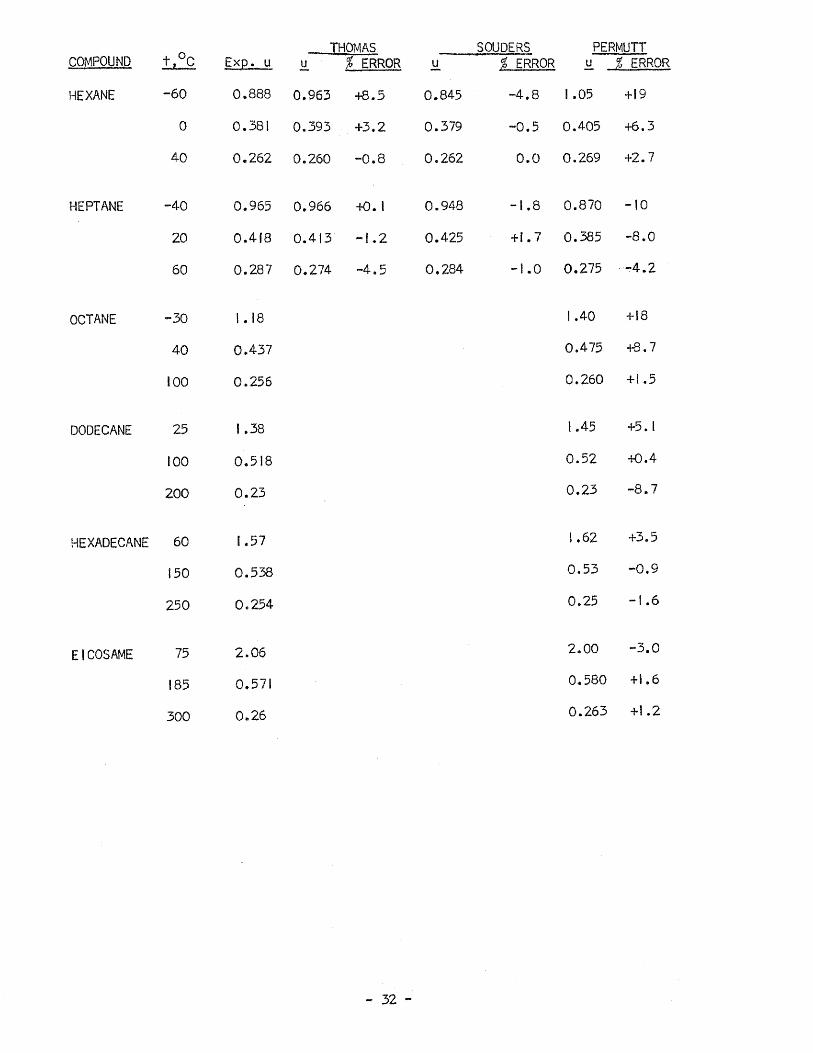
By means of the liquidity function, it is possible to predict
the viscosity of all n - paraffins above C 4H 10 at any temperature
within the normal liquid range. Deviations from the experimental
values to those resulting from the methods presented in this paper
are within ± 10 per cent for the majority, and less than ± 20 per
cent for the extreme cases. Representative comparisons are shown
in Table V.
The method developed in this study, of which there are three
modes of application, may be employed to predict the viscosity
values of the n - paraffin liquids when no experimental data is
available by means of extrapolating in Figure VI, and in Figure IV
if the critical temperature is unknown.

RECOMMENDATIONS
The elimination of the oscillatory tendency of Figure V would
improve the accuracy of the method developed by this study. This
tendency might be due to a weight and/or shape factor and should be
investigated.
In line with the results of this paper, it is felt that similar
studies of other homologous series be initiated to determine to what
extent the liquidity function applies throughout the chemical families.
If future efforts prove favorable, a generalized viscosity function
might then be designed to cover all liquids.
It is recommended that experimental values of viscosity for the
n - paraffins above C20H42
be determined for the normal liquid range.
These values would establish the accuracy of predicting viscosity from
Figure VI by means of extrapolation.
It is further felt that some relationship exists between the slopes
of the iso-viscous lines of Figure VI and another parameter exists. If
this relationship was found and its empirical expression relatively
simple, then the need for interpolating in order to solve for the inter
cept would be eliminated.

APPENDIX
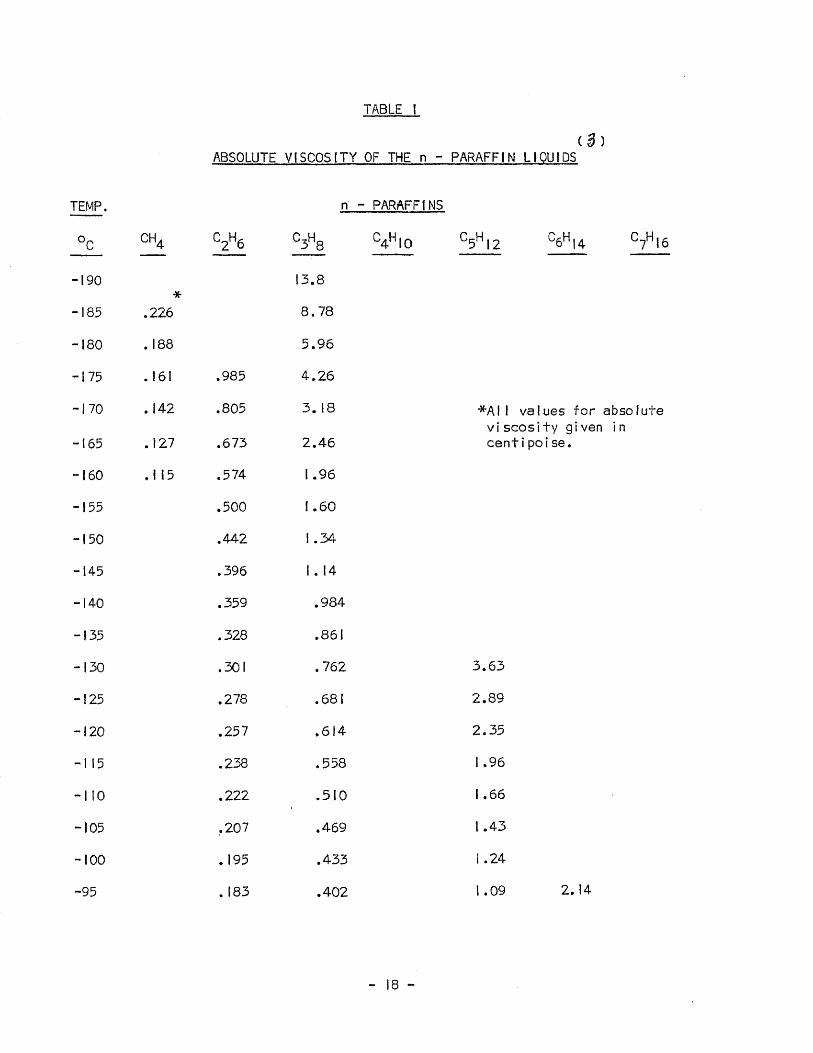
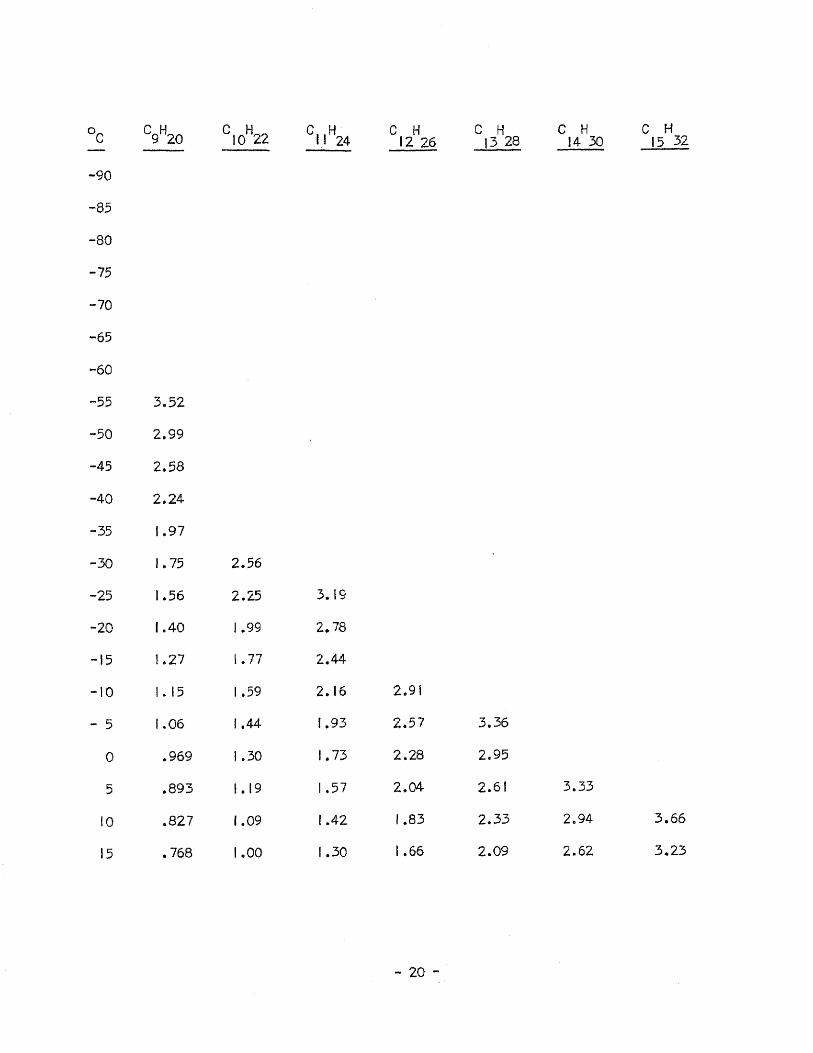
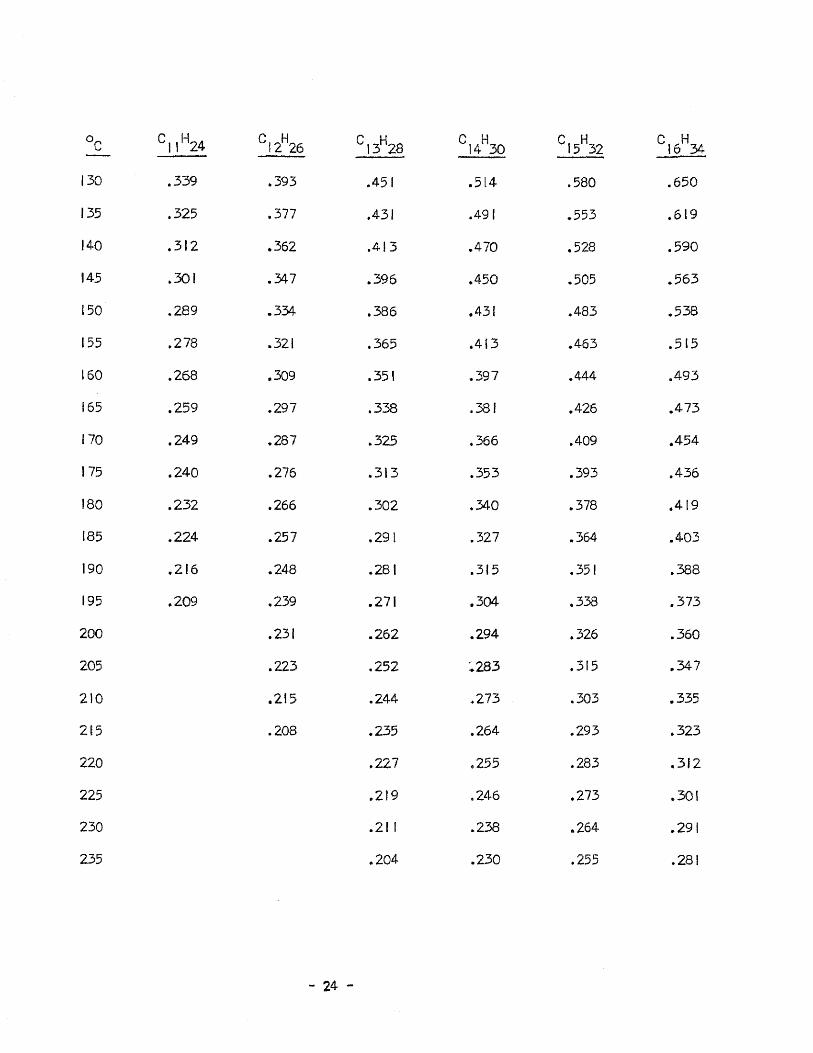
TABLE I
( 3 )ABSOLUTE VISCOSITY OF THE n - PARAFFIN LIQUIDS
TEMP. n - PARAFFINS
°C
-190
CH4
*
C2H6
C3H8
13.8
C4H10 C5H12
C6H 14 C 7H 16
-185 .226 8.78
-180 .188 5.96
-175 .161 .985 4.26
-170 .142 .805 3.18 *All values for absoluteviscosity given in
-165 .127 .673 2.46 centipoise.
-160 .115 .574 1.96
-155 .500 1.60
-150 .442 1.34
-145 .396 1.14
-140 .359 .984
-135 .328 .861
-130 .301 .762 3.63
-125 .278 .681 2.89
-120 .257 .614 2.35
-115 .238 .558 1.96
-110 .222 .510 1.66
-105 .207 .469 1.43
-100 .195 .433 1.24
-95 .183 .402 1.09 2.14

°CC2H6
C3H8
C4H10
C5H12
C6H14
C7H16
C8H18
-90 .172 .374 .630 .973 1.83 3.77
-85 .162 .350 .580 .874 1.58 3.11
-80 .327 .536 .791 1.38 2.61
-75 .307 .497 .720 1.22 2.22
-70 .288 .462 .659 1.09 1.92
-65 .272 .431 .607 .978 1.68
-60 .256 .403 .562 .888 1.48
-55 .242 .378 .522 .809 1.31 2.12
-50 .228 .355 .487 .741 1.18 1.86
-45 .216 .335 .455 .683 1.06 1.64
-40 .205 .315 .428 .632 .965 1.46
-35 .298 .403 .587 .882 1.31
-30 .282 .380 .547 .810 1.18
-25 .267 .359 .511 .747 1.07
-20 .253 .341 .480 .692 .981
-15 .241 .323 .451 .643 .900
-IC .229 .307 .426 .600 .829
-5 .219 .293 .402 .561 .767
.0 .210 .279 .381 .526 .713
5 .267 .362 .495 .664
10 .255 .344 .467 .620
15 .245 .328 .441 .582
°CC9H20
C10H22 C11H24 C12H26 C 13H28 C 14H30 C15H32
-90
-85
-80
-75
-70
-65
-60
-55 3.52
-50 2.99
-45 2.58
-40 2.24
-35 1.97
-30 1.75 2.56
-25 1.56 2.25 3.19
-20 1.40 1.99 2.78
-15 1.27 1.77 2.44
-10 1.15 1.59 2.16 2.91
- 5 1.06 1.44 1.93 2.57 3.36
0 .969 1.30 1.73 2.28 2.95
5 .893 1.19 1.57 2.04 2.61 3.33
10 .827 1.09 1.42 1.83 2.33 2.94 3.66
15 .768 1.00 1.30 1.66 2.09 2.62 3.23

°CC5H12
C6H14
C7H16
C8H18 C9H20 C10 H22
20 .235 .313 .418 .547 .716 .928
25 .225 .299 .397 .515 .670 .861
30 .216 .285 .377 .487 .628 .802
35 .207 .273 .359 .461 .590 .749
40 .262 .343 .437 .556 .701
45 .251 .327 .415 .525 .658
50 .241 .313 .395 .497 .619
55 .231 .299 .376 .471 .584
60 .222 .287 .359 .447 .552
65 .213 .275 .343 .425 .522
70 .205 .264 .327 .405 .495
75 .253 .313 .386 .470
80 .243 .300 .369 .448
85 .234 .288 .353 .426
90 .225 .277 .338 .407
95 .217 .266 .323 .389
100 .209 .256 .310 .372
105 .246 .298 .356
110 .237 .286 .341
115 .228 .275 .327
120 .220 .264 .314
125 .212 .254 .301

°CC
11H24
C12H 26 C13H28 C14H30 C15H32 C16H34 C17H36
20 1.19 1.51 1.89 2.34 2.87 3.48 4.21
25 1.10 I.38 1.71 2.11 2.57 3.10 3.71
30 1.01 1.27 1.56 1.91 2.31 2.77 3.30
35 .939 1.17 1.43 1.74 2.09 2.49 2.95
40 .873 I.08 1.31 1.59 1.90 2.25 2.65
45 .815 I.00 1.21 1.46 1.74 2.04 2.40
50 .763 .932 l.12 1.35 1.59 1.87 2.18
55 .716 .870 1 .04 1.24 1.47 1.71 1.99
60 .673 .815 .973 1.15 1.35 1.57 1.82
65 .634 .764 .909 1.07 1.25 1,45 1.67
70 .599 .719 .851 1.00 1.17 1.35 1.55
75 .567 .678 .800 .938 1.09 1.25 1.43
80 .537 .640 .753 .880 1.02 1.17 1.33
85 .510 .606 .710 .827 .953 1.09 1.24
90 .485 .574 .671 .780 .895 1.02 1.16
95 .462 .545 .635 .736 .843 .959 1.08
100 .440 .518 .602 .696 .795 .902 1.02
105 .420 .494 .572 .659 .751 .850 .958
110 .402 .471 .544 .625 .711 .803 .903
115 .384 .449 .518 .594 .674 .760 .852
120 .368 .429 .494 .565 .640 .720 .806
125 .353 .411 .472 .539 .609 .684 .764

°CC18H38
C19H40 C20H42
20
25
30 3.891 4.565
35 3.458 4.033 4.699
40 3.093 3.588 4.156
45 2.782 3.212 3.701
50 2.516 2.891 3.316
55 2.286 2.616 2.988
60 2.087 2.379 2.706
65 1.912 2.172 2.461
70 1.760 1.992 2.249
75 1.625 1.833 2.063
80 1.505 1.693 1.900
85 1.398 1.568 1.755
90 1.303 1.458 1.627
95 1.217 1.359 1.513
100 1.140 1.269 1.410
105 1.070 1.189 1.318
110 1.006 1.116 1.235
115 0.948 1.058 1.159
120 0.896 0.989 1.091
125 0.847 0.934 1.028
°CC
11H24 C 12H26 C 13H28
C14H30 C 15H32 C16H34
130 .339 .393 .451 .514 .580 .650
135 .325 .377 .431 .491 .553 .619
140 .312 .362 .413 .470 .528 .590
145 .301 .347 .396 .450 .505 .563
150 .289 .334 .386 .431 .483 .538
155 .278 .321 .365 .413 .463 .515
160 .268 .309 .351 .397 .444 .493
165 .259 .297 .338 .381 .426 .473
170 .249 .287 .325 .366 .409 .454
175 .240 .276 .313 .353 .393 .436
180 .232 .266 .302 .340 .378 .419
185 .224 .257 .291 .327 .364 .403
190 .216 .248 .281 .315 .351 .388
195 .209 .239 .271 .304 .338 .373
200 .231 .262 .294 .326 .360
205 .223 .252 .283 .315 .347
210 .215 .244 .273 .303 .335
215 .208 .235 .264 .293 .323
220 .227 .255 .283 .312
225 .219 .246 .273 .301
230 .211 .238 .264 .291
235 .204 .230 .255 .281

°CC17
H36
C18H38 C
19H40
C20
H42
130 .725 .803 .884 .971
135 .689 .762 .838 .919
140 .656 .724 .795 .871
145 .625 .689 .756 .827
150 .597 .657 .719 .786
155 .570 .627 .686 .748
160 .545 .599 .654 .713
165 .522 .573 .625 .680
170 .501 .548 .598 .650
175 .480 .526 .573 .622
180 .461 .504 .549 .596
185 .443 .484 .526 .571
190 .426 .465 .506 .548
195 .4(0 .448 .486 .526
200 .395 .431 .468 .506
205 .381 .415 .450 .486
210 .367 .400 .433 .468
215 .354 .385 .417 .451
220 .342 .372 .402 .435
225 .330 .359 .388 .419
230 .319 .347 .375 .404
235 .308 .335 .362 .390

° C14H30 C15H32
C16H34 C17H36 C18H38 C19H40 C20H42
240 .222 .246 .272 .308 .324 .350 .377
245 .215 .238 .263 .298 .313 .338 .365
250 .207 .231 .254 .288 .303 .327 .353
255 .201 .223 .246 .279 .29 .32 .34
260 .216 .238 .261 .28 .31 .33
265 .209 .231 .253 .27 .30 .32
270 .202 .223 .245 .27 .29 .31
275 .216 .237 .26 .28 .30
280 .210 .230 .25 .26 .29
285 .203 .223 .24 .26 .28
290 .216 .23 .25 .27
295 .209 .23 .25 .26
300 .202 .22 .24 .a
305 .21 .23 .25
310 .21 .22 .24
315 .20 .22 .23
320 .21 .23
325 .20 .22
330 .20 .21
335 .21
340 .20
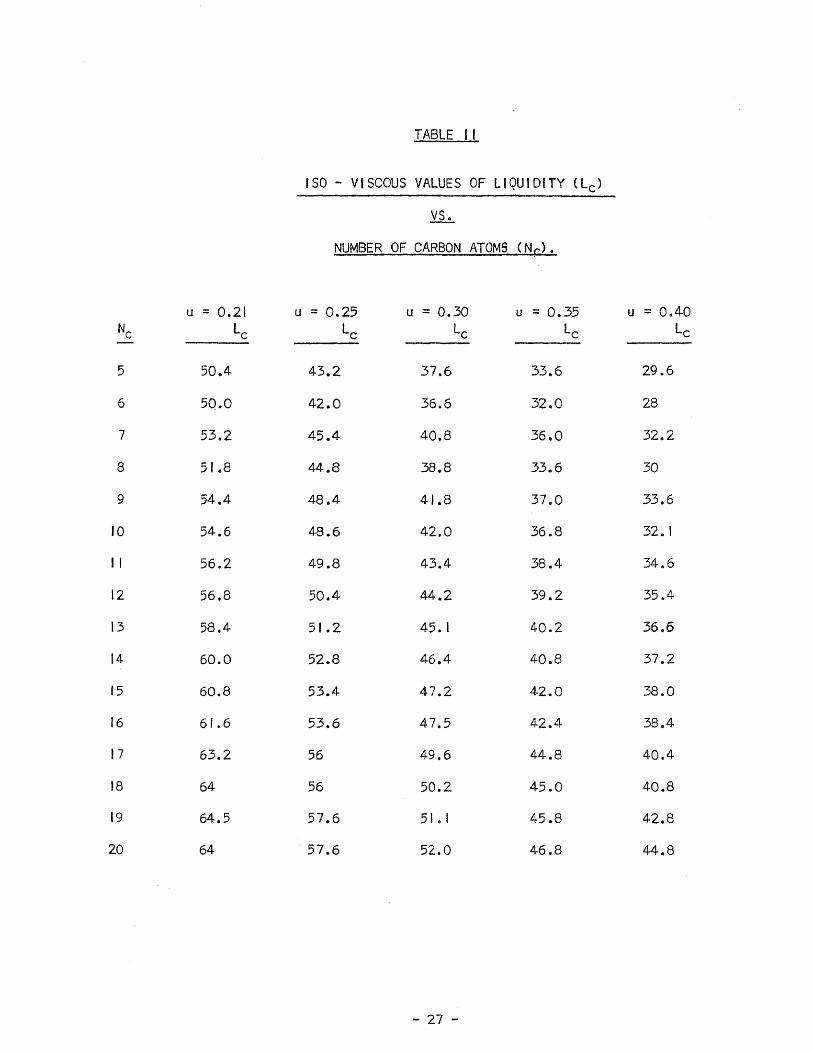
TABLE
ISO - VISCOUS VALUES OF LIQUIDITY (L c )
VS.
NUMBER OF CARBON ATOMS (1\1_0.
NCu = 0.21
Lc
u = 0.25Lc
u = 0.30LC
u = 0.35LC
u = 0.40LC
5 50.4 43.2 37.6 33.6 29.6
6 50.0 42.0 36.6 32.0 28
7 53.2 45.4 40.8 36.0 32.2
8 51.8 44.8 38.8 33.6 30
9 54.4 48.4 41.8 37.0 33.6
10 54.6 48.6 42.0 36.8 32.1
11 56.2 49.8 43.4 38.4 34.6
12 56.8 50.4 44.2 39.2 35.4
13 58.4 51.2 45.1 40.2 36.6
14 60.0 52.8 46.4 40.8 37.2
15 60.8 53.4 47.2 42.0 38.0
16 61.6 53.6 47.5 42.4 38.4
17 63.2 56 49.6 44.8 40.4
18 64 56 50.2 45.0 40.8
19 64.5 57.6 51.1 45.8 42.8
20 64 57.6 52.0 46.8 44.8

NC u = 0.50
LCu = 0.60
LCu = 0.80
LCu = 1.00
LCu = 1.50
LCu = 2.00
LC
u = 2.50LC
5 24 20 15.2 12 5.6 4.4 2.4
6 22 17.6 12.5 8.8 4
7 26.7 22.4 17.0 13.6 8.4 5.3 3.2
8 23.6 20 14.2 10.4 4.6 1.3
9 27.5 23.5 17.6 13.8 8 4.8 2.4
10 26 22.0 15.8 12 6 2.6
11 28.4 24.2 18.0 14 8.4 4.6 2.1
12 29.1 24.4 18 13.8 7.6 4.0 1.3
13 30 25.6 19.5 15.4 9.2 5.6 2.9
14 30.8 26 20 15.5 9.2 5.3 2.8
15 31.6 27.2 21.2 16.5 10 6.4 3.5
16 32 27.8 21.2 16.8 10.4 6.6 3.9
17 33.6 29.2 22.8 18 11.6 7.6 4.8
18 34 29.6 22.8 18.4 11.6 7.7 4.1
19 34.8 30.2 23.6 19.2 12.2 8.3 5.6
20 35.5 30.6 24 19.6 12.8 8.8 6

TABLE III
SLOPE AND INTERCEPT
FOR LINES OF ISO—VISCOSITY
VISCOSITY,u
SLOPE,m
INTERCEPT,b
0.21 1.097 44.04
0.25 0.921 39.18
0.30 1.000 32.14
0.35 0.955 27.72
0.40 1.000 23.40
0.50 0.847 18.76
0.60 0.805 14.96
0.80 0.703 10.18
1.00 0.618 7.14
1.50 0.520 2.23
2.00 0.374 0.72
2.50 0.230 0.35

TABLE IV
TABULATED PROCEDURE FOR GOMPERTZ CURVE -FITTING
log b = log k
u u* b log bgu*
(log a)gu* + (log a)gu*bC
2.30 0 0.492 -.3080 1.0000 -9.5356 -.3785 .418
2.20 1 0.563 -.2495 .9894 -9.4346 -.2775 .528
2.10 2 0.637 -.1959 .9789 -9.3347 -.1775 .664
2.00 3 0.717 -.1445 .9686 -9.2359 -.0787 .834
1.90 4 0.987 -.0057 .9583 -9.1381 +.0191 1.045
1.80 5 1.27 .1038 .9482 -9.0413 .1159 1.306
1.70 6 1.565 .1945 .9382 -8.9455 .2116 1.628
Σ1 log b = -.6053
1.60 7 1.88 .2742 .9282 -8.8508 .3064 2.03
1.50 8 2.23 .3483 .9184 -8.7570 .4001 2.51
1.40 9 3.07 .4871 .9086 -8.6643 .4928 3.11
1.30 10 4.00 .6021 .8990 -8.5726 .5846 3.84
1.20 II 4.99 .6981 .8895 -8.4818 .6753 4.74
1.10 12 6.04 .7810 .8800 -8.3920 .7652 5.82
1.00 7.14 .8558 .8706-8.3031 .8540 7.15
Σ2log b = 4.0445
.90 14 8.60 .9345 .8615 -8.2152 .9420 8.75
.80 IS 10.18 1.0078 .8524 -8.1282 1.0290 10.69
.70 16 12.40 1.0934 .8434 -8.0421 1.1150 13.03
.60 17 14.96 1.17493 .8344 -7.9570 1.2002 15,86
.50 18 18.76 1.27323 .8256 -7.8727 1.2845 19.25
.40 19 23.40 1.3692 .8169 -7.7893 1.3679 23.33
.30 20 32.14 1.5071 .8082 -.7.7068 1.4504 28.21
log b = 8.36010
30

TABLE y
COMPARISON OF CALCULATED AND EXPERIMENTAL
LIQUID VISCOSITIES(2)
THOMAS SOUDERS PERMUTTCOMPOUND + °C Exp. u u % ERROR u % ERROR u %ERROR
ETHANE -175 0.985 1.521 +54 0.288 -72 1.365 +38.6
-120 0.257 0.330 +27 0.173 -33 .350 +36
PROPANE -140 0.984 1.15 +17 0.398 -60 0.670 -32
- 80 0.327 0.332 +1.5 0.222 -32 0.285 -12.8
-40 0.205 0.199 -2.9 0.169 -18 0.190 - 7.3
BUTANE -90 0.63 0.68 +8.0 0.45 -29 0.69 +9.5
-60 0.403 0.414 +2.7 0.316 -21 0.415 +3.0
-30 0.282 0.280 -0.7 0.239 -(5 0.24 -15.0
0 0.210 0.205 -2.4 0.191 -9.0 0.22 + 4.8
PENTANE -120 2.35 2.55 +8.6 1.40 -40 1,84 -21
-80 0.791 0.921 +16 0.673 -15 0.752 - 4.9
-40 0.428 0.471 +10 0.402 -6,1 0.415 - 3.0
0 0.279 0.289 +3.6 0.271 -2.8 0.275 - 1.4
30 0.216 0.216 0.0 0.212 -1.8 0.220 + 1.8
THOMAS SOUDERS PERMUTTCOMPOUND + °C Exp. u u % ERROR u 1 ERROR u % ERROR
HEXANE -60 0.888 0.963 +8.5 0.845 -4.8 1.05 +19
0 0.381 0.393 +3.2 0.379 -0.5 0.405 +6.3
40 0.262 0.260 -0.8 0.262 0.0 0.269 +2.7
HEPTANE -40 0.965 0.966 +0.1 0.948 -1.8 0.870 -10
20 0.418 0.413 -1.2 0.425 +1.7 0.385 -8.0
60 0.287 0.274 -4.5 0.284 -1.0 0.275 -4.2
OCTANE -30 1.18 1.40 +18
40 0.437 0.475 +8.7
100 0.256 0.260 +1.5
DODECANE 25 1.38 1.45 +5.1
100 0.518 0.52 +0.4
200 0.23 0.23 -8.7
HEXADECANE 60 1.57 1.62 +3.5
150 0.538 0.53 -0.9
250 0.254 0.25 -1.6
EICOSAME 75 2.06 2.00 -3.0
185 0.571 0.580 +1.6
300 0.26 0.263 +1.2

TABLE VI
TEMPERATURE CONSTANTS
COMPOUND MELTING TEMPERATURE
tm, 0CCRITICAL TEMPERATURE
tc, 0CBOILING TEMPERATURE
fib, °C
CH4 -182.5 -82.5 -161.5
C2H6 -183.3 32.3 - 88.6
C3H8 -187.7 96.8 - 42.1
C4H10 -138.4 152.01 - 0.5
C5H12 -129.7 196.6 36.1
C6H14 - 95.3 234.7 68.7
C7H16 - 90.6 267.0 98.4
C8H18 - 56.8 296.2 125.7
C9H20 - 53.5 322.0 150.8
C10H22 - 29.7 346.0 174.1
C 11H24 - 25.6 367.0 195.9
C12H26 - 9.6 386.0 216.3
C13H28 - 5.4 404.0 235.4
C14H30 5.9 422.0 253.6
C15H32 9.9 437.0 270.6
C16H34 18.2 452.0 286.8
C17H36 22.0 462.0 301.8
C 18H38 28.2 477.0 316.1
C19H40 32.1 487.0 329.7
C20H42 36.8 502.0 342.7

FIGURE I
VISCOSITY VSTEMPERATURE
FOR
n PARAFFINS

FIGURE 11LIQUIDITY VS. ABSOLUTE VISCOSITYFORn - PARAFINS
- 35 -

FIGURE 11LIQUIDITY VS. ABSOLUTE VISCOSITYFORn - PARAFINS
- 36 -

FIGURE IV
TEMPERATURE VS. LIQUIDITYFOR
n -PARAFFINS

FIGURE V
LIQUIDITY VS NUMBER OF CARBON ATOMS
FOR
LINES OF ISO - VISCOSITY

FIGURE VILIQUIDITY VS. NUMBER OF CARBON ATOMSCURVE - FITTED FORSTRAIGHT LINES OF ISO-VISCOSITY

FIGURE VIIFITTED GOMPERTZ CURVEOFINTERCEPT VS. CODED VISCOSITY
- 40

NOMENCLATURE
a - constant
b - intercept
g - constant
k - constant
Lb - liquidity based on normal boiling temperature
LC
- liquidity based on critical temperature
m - slope; change in L c / change in NC
NC
- number of carbon atoms
nt
- total number of points fitted to a straight line
t - temperature, °C
tb - normal boiling temperature, °C
tc - critical temperature, °C
tm - normal melting temperature, °C
u* - coded viscosity to be converted to absolute viscosity
u - absolute viscosity, centipoise

REFERENCES
1. Rossini, F.D., K.S. Pitzer, R.L. Arnett, R.M. Braun, and C.C. Pimentel,
Selected Values of Physical and Thermodynamic Properties of
Hydrocarbons and Related Compounds, API Project 44, Carnegie Institute
of Technology, 1953.
2. Reid, R.C. and T.K. Sherwood, "The Properties of Gases and Liquids",
pp. 202-213, McGraw Hill Book Co., Inc., New York (1958).
3. Groxton, F.E. and D.J. Cowden, "Applied General Statistics," pp.447-
452, Prentice-Hall, Inc., New York (1939)
4. Physical Properties of Chemical Compounds - II, Advances in Chemistry
Series #22, American Chemical Society, Washington, D.C. (1959)
5. Doolittle, A.K, J. App!. Phys., Vol. 22, 1951, pp. 1031-1035,pp. 1471-1475.
6. Doolittle, A.K, J. Appl. Phys., Vol. 23, 1952, pp. 236-239.