copyright warning &...
TRANSCRIPT

Copyright Warning & Restrictions
The copyright law of the United States (Title 17, United States Code) governs the making of photocopies or other
reproductions of copyrighted material.
Under certain conditions specified in the law, libraries and archives are authorized to furnish a photocopy or other
reproduction. One of these specified conditions is that the photocopy or reproduction is not to be “used for any
purpose other than private study, scholarship, or research.” If a, user makes a request for, or later uses, a photocopy or reproduction for purposes in excess of “fair use” that user
may be liable for copyright infringement,
This institution reserves the right to refuse to accept a copying order if, in its judgment, fulfillment of the order
would involve violation of copyright law.
Please Note: The author retains the copyright while the New Jersey Institute of Technology reserves the right to
distribute this thesis or dissertation
Printing note: If you do not wish to print this page, then select “Pages from: first page # to: last page #” on the print dialog screen

The Van Houten library has removed some of the personal information and all signatures from the approval page and biographical sketches of theses and dissertations in order to protect the identity of NJIT graduates and faculty.

ABSTRACT
DECISION MAKING BASED ON QUANTITATIVE ANDQUALITATIVE EVALUATIONS
byRohan A. Pandit
This study emphasizes mainly on the influence of evaluations, both qualitative and
quantitative, on decision making for many occasions that occur in business and technically
oriented settings. Decisions made with a certain fuzzy as well as technical behavior are
structured by means of computer-assisted decision-making tools. Decision support tools assist
decision makers in making crucial decisions. For instance the tool that has been designed for
the purpose of this research will be used for selecting capital-intensive products. It is also
intended to prove that with the help of decision support systems decision makers could make
decisions by reducing fuzzy decision behavior about capital investments in organizational
systems. Such tools consider more than one criterion in making a decision. The criteria for
decision-making will range from the attributes of the system itself to the cost of the system.
For each system under consideration for selection, each attribute will be analyzed and rated.
Then a cumulative account of all the attributes for each vendor is brought together as a set.
Though this set is produced by each decision maker there is little correlation between his
decisions and the evaluation of the product. A product's quantitative evaluation may warrant
of a different kind of decision than a qualitative evaluation.

An evaluation of a system leads to a decision. However when a decision is the one of
selection, as is quite often the case, quantitative and qualitative evaluations may be done.
Quantitative evaluations generally are performed based on statistical analysis of the system
under consideration. A quantitative evaluation may be based also on algorithms designed for
specific scenarios. On the other hand a qualitative evaluation may take place in settings that
deal with a single system that must be evaluated and it's evaluation recorded in language
specific descriptive terms. This study discusses how decisions can be made using qualitative
and quantitative evaluations for the object or situation under consideration.

DECISION MAKING BASED ON QUANTITATIVE ANDQUALITATIVE EVALUATIONS
byRohan A. Pandit
A ThesisSubmitted to the Faculty of
New Jersey Institute of Technologyin Partial Fulfillment of the Requirements for the Degree of
Master of Science in Information Systems
Department of Computer and Information Sciences
January 2001


APPROVAL PAGE
DECISION MAKING BASED ON QUANTITATIVE ANDQUALITATIVE EVALUATIONS
Rohan A. Pandit
Dr. Constantine N. Manikopoulos, Thesis Advisor DateAssociate Professor of Electrical and Computer Engineering, NJIT
Dr. James J. M. McHugh, Committee Member DateProfessor of Computer and Information Science, NJIT
Dr. Fadi P. Deek, Committee Member DateAssociate Professor of Computer and Information Science, NJIT
BIOGRAPHICAL SKETCH
Author: Rohan A. Pandit
Degree: Master of Science in Information Systems
Date: January 2001
Undergraduate and Graduate Education:
• Master of Science in Information Systems,New Jersey Institute of Technology, Newark, NJ, 2001
• Bachelor of Engineering in Chemical Engineering,Dharamsinh Desai Institute of Technology, Nadiad, India, 1998
Major: Information Systems

To my beloved family and friends
v

ACKNOWLEDGEMENT
I wish to express my appreciation to Dr. Constantine Manikopoulos, who served as my
research advisor. I am thankful to him for providing guidance and wisdom to my work. I have
had many instances of critical advice from him that has led to improve this study. I
acknowledge his encouragement during the many phases of this work.
I especially thank Ms. Haymwantee Singh for guiding and supporting me in my
efforts for specific parts of my work. I gained special insight into some aspects of mathematics
and it's applicability to this topic from her. I am grateful for her assistance. Special thanks to
my fellow graduate students and close friends whose encouragement kept me going.
vi

TABLE OF CONTENTS
Chapter Page
1 A FOUNDATION FOR USING EVALUATIONS 1
1.1 The Importance of the Use of Evaluations 1
1.2 Qualitative Evaluations for Decision Making 3
2 QUANTITATIVE EVALUATIONS FOR SOFTWARE SYSTEMS 5
2.1 Using Custom Algorithms for Software Evaluation 5
2.2 User Satisfaction Measurement 18
3 QUALITATIVE EVALUATIONS FOR SOFTWARE SYSTEMS 21
3.1 Protocol Analysis for Evaluating Systems 21
3.1.1 Features of the MSN Portal being Analyzed 21
3.1.2 Protocol Instruments 23
3.1.3 Analysis Summary and Recommendations 24
3.1.4 Inferences and Conclusions 26
3.2 Other Qualitative Criteria for Evaluations 27
4 DECISION MAKING BASED ON MULTIPLE CRITERIA FOR SYSTEMS 31
4.1 The Database Selection Problem 31
4.2 Selecting the Right Database Product: A Fuzzy Logic Approach 34
5 ANALYZING THE USE OF DECISION SUPPORT SYSTEMS 39
5.1. Learning in Co-operative Environments and the Use ofDecision Support Systems 40
5.1.1 Hypotheses for Accomplishing the Objective 41
5.1.2 Methods, Tasks and Conducting the Experiment 44
5.1.3 Results and Findings 46
5.2 Critical Comments on Methods used for Data Analysis in the Case Study 48
5.2.1 Problems, Limitations and Assumptions 49
5.2.2 Alternative Ways of Analyzing Data 50
vii

TABLE OF CONTENTS(Continued)
Chapter Page
5.3 The Proposal of a Method for Testing the Use of Decision Support Systems 50
5.3.1 The Foundation for the Testing Method 51
5.3.2 Design and Procedures 52
5.3.3 Hypotheses for the Main Effects and Interaction Effects 54
5.3.4 Method for Data Analysis 55
5.3.5 Inferences and Comparison with Case Studies 58
6 RESOURCE ESTIMATES 61
6.1 Total Costs 61
6.2 Perceived Benefits 64
7 CONCLUSIONS 67
APPENDICES 69
APPENDIX A: The Consent Form 70
APPENDIX B: Instructions for the Subject 71
APPENDIX C: Task List 73
APPENDIX D: Interview Questions and Subjects for Protocol Analysis 74
APPENDIX E: Individual Test Results 75
APPENDIX F: DSS Output for Decision Maker inputs 77
APPENDIX G: DSS Output for Final Decision Matrix 79
REFERENCES 80
viii
LIST OF TABLES
Table Page
1 Evaluation for interface dimensions 11
2 Evaluation for element mapping a dimension 12
3 Evaluation of each element mapping a dimension for a property 14
4 The evaluation table for software product TB 16
5 Positive aspects and problems 24
6 Specific recommendations and suggestions 26
7 Matrix for vendors versus attributes 35
8 A tabulation of the ratings for alternate solutions/vendors/databases 37
9 Hypothetical test results 55
10 Interaction Effects 56
11 Table of effects 57
12 Table for two-way ANOVA 58
13 Table for cost of building the DSS 62
14 Table for testing the DSS 63
15 Table for cost of testing software and the use of the DSS among users 64
16 Table for perceived profits and savings (benefits) 65
ix

LIST OF FIGURES
Figure Page
1 Dimensions and Properties 7
2 Algorithm for evaluating the dimensions of a software 10
3 Algorithm for evaluation of the element mapping a dimension 13
4 Relationship between a software element and dimension 14
5 The effectiveness evaluation of a software 15

GLOSSARY
Eta Index of correlation not limited to linear relationships
F-test A test of significance employed to judge the tenability of the null hypothesis of no
relation between two or more variables, or of no difference between two variables.
Likert Scale
null hypothesis A null hypothesis helps to decide between (1) believing that a relationship
between two (or more) variables exists in the population from which sample data are
drawn and (2) believing that no such relationship exists in the population from which
sample data are drawn.
one-way ANOVA one-way analysis of variance is comparing variances-the variances among
means is compared with the variance within conditions in order to find out how far apart
the means are on average.
SS Sum of Squares of values of any given variable
t-test A test of significance employed to judge the tenability of the null hypothesis of no
relation between two variables.
two-way ANOVA two-way analysis of variance is similar to one-way analysis of variance in
addition that interaction effects are taken into consideration.
xi

CHAPTER 1
A FOUNDATION FOR USING EVALUATIONS
A group used to make decisions on a particular topic of discussion or issue can use
various group decision support systems. Group decision support systems are crucial when
groups need communications, computer and decision support process or structures [9].
Various tasks are supported by group decision support systems. Group decision support tools
are available for a group involved in discussions, communication, planning, design and
development. Simple asynchronous tools such as instant messaging system is used in
workplaces for making decisions with the support of another group members when they are
distributed over time and space. Instances of making decision for selecting naming
conventions during a software installation, asking for assistance on a certain task etc. can be
made by a junior developer by messaging a senior colleague. Such scenarios involve
communication, however, other tasks where a solution must be selected for it to be
implemented fall critically under McGrath's typology or task circumplex [22].
1.1 The Importance of the Use of Evaluations
The task circumplex indicates that arriving at a solution involves starting with an idea. This
constitutes planning for a possible solution. Many such ideas and consequent plans may be
conceptualized. The most crucial phase of the process of arriving at a solution consists of
choosing the alternative. This is an intellective task and it forms the basis of the discussion on
1

quantitative and qualitative evaluations. Since this may also turn out to be fuzzy in nature it will
call for multi-criteria decision-making [12] and most crucially when capital investment projects
must be evaluated. One such example is the choosing of an academic database, which costs
millions of dollars. Much research has been done for the effectiveness of solutions for such
problems as selecting the optimum database for a given query based on the decision about
which database, from a number of given databases, should be chosen for that query. Since this
is very specific to a query a similar principle can be applied to a collection of queries and
estimates can be made about cumulative costs of retrieval.
This, done for all the databases, in our context 'solution' yields the appropriate
database. Another approach to selecting solutions (academic databases) has been considered
on a yet unpublished research-work, which takes into account gross rating values of a decision-
maker. Importance is also given to the attributes of a database by each decision maker and
each attribute is rated. Following this various mathematical calculations are conducted by the
software on these ratings and a final decision vector (a one dimensional matrix) consisting of
the cumulative effect of the decision makers ratings (made earlier) is presented. The database
that yields the highest point value or a numeric value must be chosen as the one most
appropriate for the selection problem under consideration. This takes into account the
fuzziness [15] of each decision maker through a quantitative approach presented as a case
study of quantitative evaluation for making a decision.
2

1.2 Quantitative Evaluations for Decision Making
Qualitative evaluations of possible solutions for decisions to be made on them may be done as
executive summaries or by recording non-numeric and language specific inputs or opinions
about the systems. This can also follow the pattern of questionnaires, qualitative-quantitative
evaluation scales such as the Likert scale, which translates qualitative inputs to quantitative
ratings [26] when many users for a single system are involved. On the other hand executive
summaries or self-recorded diaries [26] would be more appropriate for a single user
independently evaluating the system.
Thus choosing alternatives for ultimately deciding which one must be chosen leads to
negotiating solutions [22]. This is also a key issue in the task circumplex in that negotiating the
right solution makes the concluding result a successful or unsuccessful one. Hence in this
phase occurs cognitive conflict and it must lead to resolution of the conflict. This is very well
done by negotiating into the solution (qualitative or quantitative evaluation) that best fits the
given problem. Not much is discussed here, about which solution must be negotiated into.
This must be done crucially after many alternatives are chosen qualitatively or quantitatively. It
can therefore be seen that the earlier mentioned intellective task of arriving at the right
solution is done by approaching the problem quantitatively or qualitatively.
A negotiated solution is finally put to execution. This is also crucial but it is seen as less
strategic than the previous domains of the problem of decision-making. This is because
3

execution consists of less conflict that arriving at the right solution. However this may not
mean that no importance be given to the execution since the final product or the result in
general depends on execution. Besides, the result meeting the original idea spells success and
so due importance must be given to execution.
4

CHAPTER 2
QUANTITATIVE EVALUATIONS FOR SOFTWARE SYSTEMS
2.1 Using Custom Algorithms for Software Evaluation
This is the first section on quantitative evaluations and the use of quantitative evaluations has
been discussed before. On this section it has been discussed of how to use algorithms to
analyze systems. The use of algorithms is done in programming and solution formulation.
Algorithms may be used in places having a structured solution. The use of algorithms may not
be warranted in places where the problem is weakly structured and the possible solution is very
subjective. However when it is intended to remove subjectivity from the ultimate decisions
that must be taken they can be quantified by the use of algorithms. The concept of usability
and functionality [13] is particularly taken into account here because the sample evaluations
illustrated here are that of the user-interface of software products.
In the context of discussion algorithms are used to analyze systems and therefore
algorithms do not contain programming syntax but do contain logic for evaluating the system.
The logic used in the algorithm must be formulated using the attributes of the system. This
means that system features, costs, end user satisfaction etc must be put down as attributes and
must be analyzed quantitatively to enable a final numeric output to enable making a decision in
favor of or against the choice of the solution or the system. Therefore it is crucial to formulate
the decision algorithm correctly and in logical sense. The algorithm may begin by identifying
5

the systems various features. Thereafter if many systems are under consideration for a
selection task, then it must be analyzed whether the system has the feature or not. It must go
through a certain order of logic for the entire system. There may be a system lacking a feature
and hence there should be no evaluation for such a feature. Does this mean that the system
will lose on the numeric value it gains from not having the feature? It may or may not in
comparison to the other systems. There could be another system, which carries the feature,
which may not evaluate very well on the given scale. The system could have done a very low
numeric value on the attribute. Therefore not carrying a feature may affect the evaluation of
the system.
It is shown here how two softwares were evaluated using algorithms specific to the
generality of those systems. It means that when certain similar systems must be evaluated there
must be a common set of criteria that each one must be evaluated for. The criteria have been
set for the systems under consideration. The evaluations are based on the responses that one
would get as answers to the questions in the algorithms. The formulation of question
algorithms is based on the said set of criteria, which are decided before the evaluation is
started. The results have been tabulated on spreadsheets for ease of review when needed. For
this the following figure 1 is used as my basis to start the evaluation.
A dimension has the set of properties. To start evaluation the following question must
be asked. Does the software have an element that reflects this dimension? If yes then evaluate
it quantitatively or qualitatively depending on the dimension. Then a dimension is evaluated
6

evaluated with respect to the properties set. The question asked is whether the dimension has
this property? If yes then evaluate it quantitatively or qualitatively.
This forms the starting point of the evaluation. Questions shall be asked regarding the
dimensions and properties of the software. They lead to the various question algorithms and
the final justification of which software must be chosen.
Figure 1 Dimensions and Properties
The softwares under evaluation are product TB and product DF. Both softwares are
information management softwares and the use of these is generally seen in document
personal management and organization of related material that is normally related however is
not brought together by existing software systems. The softwares were evaluated for the user-
interface of each. The various criteria used were the user-interface dimension and the
properties of the dimensions. The softwares were not evaluated for performance or any other
underlying features. The following primary questions were asked for the evaluation of the
software. Do the set of properties of dimension sets i.e. for e.g. Foundation Factors, Ease of

learning etc. have the same? If yes how well do they satisfy, how does the software satisfy the
dimension? and so on. Here is a set of dimensions and properties of user-interfaces [30].
With n=6(index for dimensions) and N=5(properties) where
D1=Foundation Factors(8 elements)
D2=Ease of learning (10 elements)
D3=Sense of control(13 elements)
D4=Effectiveness(9 elements)
D5=Psychological and Sociological (13 elements)
D6=Administrative(10 elements)
Values for N are as follows
1=Perception
2=Measurability
3=Orthogonality
4=Sensitive
5=Evaluative
The following structured question forms the building block of this section in that this
identifies the dimension in the software. Does the software have Dn(where n can be from 1 to
6 and hence D1 to D6 are Foundation Factors, Understanding etc. in order). D1 through D6
describe the dimension sets. Hence it must be asked if the software does have a Dn.x(where
Dn.x is any element of the dimension element of the dimension set such as Guidance in
8

Foundation Factors) for each of the elements of the set. Hence one must pick a Dn and start
evaluation at Dn.x. It will be asked what identifies the Dn.x? Finally notes shall be written on
how well the dimension is exemplified by, say a certain thing on the software. This means that
one must find the object or feature in the software that reflects the dimension. Dn.x ? R
means the following: Does such a dimension called Dn.x exist. R is the result in Yes or No.
9

Figure 2 Algorithm for evaluating the dimensions of a software
The final results are tabulated as follows. The dimensions identified in the software are
qualitatively or quantitatively evaluated and may be placed in the table shown below. The
evaluations taking place are purely subjective and they form the basis of choosing the software
among the two that are available for this evaluation.

Table 1 Evaluation for interface dimensions
Dimension setname
Dn.x Dn.x ? R in Y/N Element in s/wthat maps thedimension
Quantitative/Qualitative evaluation
Y/N
Dotted lines in the cells indicate the appropriate subject matter filled in the table. An excel
worksheet or other such spreadsheet software is recommended to be used to record the results
of the evaluations of the subject. For this evaluation a single subject was chosen. The subject
evaluated the software and recorded his results in an large worksheet.
To evaluate whether the 'Dimension Set' satisfies its 'Properties Set' the properties set
is applied to each Dn.x. Hence what must be done is Dn.x ? N i.e ask the following question:
Does Dn.x have N(i.e. the property for e.g. Perceptive, Measureability). The more Yes's it gets
the better is the software and also the quality or quantity of Dn.x. This is a crucial factor
because not only is the presence or absence of a feature is being tested but it's qualitative or
quantitative value, whichever is appropriate, is also evaluated. Hence the biasness towards the
software that has more features is eliminated in that it may evaluate poorly on it's qualitative or
quantitative value. The results will be tabulated in the following table:
11

Table 2 Evaluation for element mapping a dimension
Dimensionset name
Dn.x Dn.x ?R inY/N
Element ins/w thatmaps thedimension
Dn.x ?N inY/N
Quantitative/Qualitativeevaluation
Y/N
Thus the meaning of this final algorithm translates to the following questions. What is
the feature of the software that identifies Dn.x and whether it does satisfy N(property) or not?
If it does then what are its qualitative and quantitative properties? In detail the algorithm is as
follows. First a dimension set is picked. This means that a dimension set is chosen from D1 to
D6 called Foundation Factors, Ease of learning, Sense of control, Effectiveness, Psychological
and Sociological, Administrative. Then a dimensions element must be chosen. The existence is
then verified. If it does have the element then the next step is to verify if the property for that
dimension element exists and if it does then it must be evaluated quantitatively or qualitatively.
This must be repeated for each property(Perception, Measurability, Orthogonality, Sensitive,
Evaluative) for the dimension under analysis. The next step is to go to the next dimension and
follow the algorithm for it. This is repeated until all the dimensions are evaluated. The
algorithm is as follows:
12

Figure 3 Algorithm for evaluation of the element mapping a dimension
The following calculation is based on only one element in the software identifying one
dimension. The first algorithm would yield 8+10+13+9+13+10= 63 results. The second
algorithm would yield 6*(8+10+13+9+13+10= 63) = 378 results
However the software element— dimension relationship is M:N. Shown as follows

Figure 4 Relationship between a software element and dimension
This makes the evaluation even more complex where a software element based table
must be made to see how "EFFECTIVE" the software is. The more there are Y check marks
and better the Quantity or Quality of evaluation better is the software.
Table 3 Evaluation of each element mapping a dimension for a property
SoftwareElement 1
Dimensionset name
Dn.x Dn.x ? R inY/N
Property exits ?R in Y/N
Element insoftware thatmaps thedimension
Y/N Y/NSoftwareElement 2
Dimensionset name
Dn.x Dn.x ? R inY/N
Property exits ?R in Y/N
Element in s/wthat maps thedimension
14
Thus the 'effectiveness' evaluation is based on the following graphic:

Figure 5 The effectiveness evaluation of a software
The above figure shows that for a software element if all dimensions that apply satisfy
and all properties that apply satisfy each dimension that applies then the effectiveness of the
software is a one hundred percent. Opposite to this when, for that software element, if the
least number of dimensions that apply do not satisfy and the least number of properties that
apply and do not satisfy each dimension that applies, the software is considered most
ineffective or not useful. Similar to the effectiveness the software may be rated differently in
terms of what is being measured. This means that the scale of 100 to 0 can be used for an
overall effect of the system like overall efficiency, it's time efficiency, security etc just like the
effectiveness which was measured in this study. Each software being evaluated may rate any
amount(on the scale of 100 to 0 percent) on the effectiveness or the system feature under
evaluation. The results of evaluation of the softwares has been shown in the tables below.
15

Table 4 The evaluation table for software product TB
Dimension Set (Dn)Understanding &Ease of Learning
Dimension Element(Dn.x)
Dn.x?R(Y/N)
Element in s/wthat maps thedimension Quantitative/Qualitative Evaluation
Guidance Y Help menusThe software as well as the dialogueboxes guide the
user well in his task, and
includes many references and examples.
Informativeness Y Pull down menus,
dynamic text.
The help as well as the dialogue boxesgive ample information
such as to do a specific
function, as well as learn about
the software.
Conciseness and brevity. Y MenusIt is very concise in giving informationand gives the user
exactly what he asks for
Clarity and simplicity YThe interface is very simple and easy touse.
Though the material offered is a bit too
much.
Comprehension NThe system is a bit difficult tocomprehend for a firsttime user as the options and menus offera complex set of
functions.
Segmentation and
Decomposition
Y The system is very well decomposed intosubdivisions, so that the user can onlywork on what he
chooses.
Consistency YThe system is consistent, with all themessages appearing
Consistently in the same place,
as with all the dialogue boxes.
Retention YThe interface interacts well with the userand makes him well acquainted
with the system commands.
From the study of these two softwares by the one subject that was selected to evaluate
the systems, it should concluded that the first software, product TB, evaluated quantitatively as
well as qualitatively better than the other software, product DF.
16

The software product DF was evaluated in the same manner. The product did not
evaluate as well as the first software from the quantitative(Yes's and No's for the existence of
dimensions) and qualitative(subjective description) evaluations. The evaluation has not been
shown. Following is a transcript of what the user thought about the two systems.
"Using the software product TB, is just like using your natural brain and no effort must be really made to understand
the inner workings of the menus and contexts that go with the software. It is striking that TB is for users who have some basic
experience with application software such as the MS Word, MS Excel. For more comprehensive users of the computer, those
who use the web extensively in conjunction with various other programs and files on his/her computer is more likely to use
this software.
The software product DF is more of an information organization product related to business databases/commercial
applications. TB taps the potential of the fundamental aspect of the human cognizance that root of each thought is a
"Strategic" choice and that all proceeds from thereon. The rest is details and use of tools."
The overall score of the Yes's to the satisfaction of the user(in this case it is the
subject) with respect to the completeness of the software in relation to dimension is 8:6 in
favor of TB. The quantitative and qualitative analysis also show preference towards TB and
that makes it doubly sure that the TB must be made "STANDARD" for the use of business
practice tools i.e. for presentation, information organization and retrieval. It is truly of great
help when you have your TB sitting right in front of you on your desktop.
The evaluation with respect to the properties of dimensions would yield better and
more comprehensive results for TB conclusively because, in the first place, TB has more
dimensions and secondly, Algorithm 2 which helps in evaluation of the software with respect
to the satisfaction condition of properties being applicable set for a dimension set, will have an
17

advantage for TB. Hence it is not necessary to apply Algorithm 2 avoiding another about 60
results on the worksheet. The effectiveness of TB software could be about 85% approximately
with the help of the spreadsheet evaluation.
2.2 User Satisfaction Measurement
The measuring of user satisfaction is crucial to the evaluation of the system. The measure of
user satisfaction enables the choice of the system or solution. A system which rates poorly on
user satisfaction will not make a good choice for the decision options under consideration. The
systems user satisfaction is also a measure of quantitative evaluation of the system in that the
users rate the system and consequently enable the ultimate judgment of whether the choice of
the system must be made or not. It must be considered that the system that evaluates very
highly on user satisfaction is mostly likely to succeed. If however the system is not a an end
user system it may have to be evaluated differently using methods suggested in the other
sections of this study. User satisfaction is very qualitative in terms of user inputs about the
system. However methods have been devised to quantify such user inputs about the system.
One especially interesting study on user satisfaction is done on [3]. It explains how user
satisfaction may be quantified.
Referring to a model of analysis in the study it has been said "This model suggests that
satisfaction is the sum of one's positive and negative reactions to a set of factors. An
individual's feelings must, in this model, be placed somewhere between a 'most negative' and a
"most positive" reaction." [3]. It can be commented about the method of defining/computing
18

user satisfaction and what's missing in this paper for deciding whether the system is usable for
a the group that was tested. By this it is meant whether a system should be called usable or not
considering the user satisfaction of each user that was tested. User participation, user
involvement and user attitude was studied in a paper by Henri Barki and Jon Hartwick [4].
This is an important study because these serve as key variables in successful information
systems development.
The user satisfaction was defined as the ∑(rating*weight) using proper indexing for the
rating, the factor under consideration and individual. It has been said that the individuals
feelings must be placed between most negative and most positive however nothing has been
said of what would happen to "overall user satisfaction". S i - has been defined however it
remains to be seen whether or not putting that system into use for the target population would
be satisfactory. For this it is suggested to use "pessimistic weighing" for the importance value
(the importance of factor j to individual i). The reactions Rij(the reaction to factor j by
individual i) should also be "pessimistically weighed". Pessimistic weighing means that the
average of the minimum of reaction-values / importance-values given by all individuals and
the average of reaction-values / importance-values given by all individuals. This is same as
saying the following mathematically
for reaction:
1 /2[ R21, R31 ...) + 1 /total#of_individuals(R 1j + R2j R31...) ]
19

and similarly importance:
1 /2[ ) + 1 /total#of_individuals(W1j + W2j + W3j +...)
In simple words, by this we get the worst-case scenario of a reaction to a particular aspect of
the system. Finally we can use pessimistic weighing for user satisfaction values Si obtained for
each individual and that will be the final "Overall User Satisfaction" value for the system.
20

CHAPTER 3
QUALITATIVE EVALUATIONS FOR SOFTWARE SYSTEMS
3.1 Protocol Analysis for Evaluating Systems
Protocol Analysis is proven to obtain subjective inputs from the users of the system. They can
put into control condition such as a room without noise, distraction, clear work area, a
working system in good condition etc. to obtain correct results about their inputs of the
system without influences from obstructing factors. The 'protocol' in the protocol analysis is
the complete recording of the interaction of a user with a system, while that user 'thinks out
loud' in order to allow the recording of his or her perceptions, reasoning, and reactions to the
system [301. In the following sections the protocol analysis of the MSN portal has been shown.
3.1.1 Features of the MSN Portal being analyzed
A web portal has many features and two of them had been chosen to be analyzed in particular.
Personalizing the contents of the web portal is being analyzed besides analyzing the user for
navigating through the content on the portal. We define personalization as the ability for a web
user to customize the content and layout of their own portal web page. It is one of the most
successful ways of increasing traffic at portal sites today, and helps to ensure return customers.
Typical content options include: local and national news, weather, stocks, sports scores,
horoscopes, and favorite links.
21

Personalization also has navigational value. For many people, browsing the Web is still
a slow experience. Personalizing a portal home page is one way to get much of the daily
content they're seeking in one location. We also looked at where on the page the personalized
information starts. After all, if we go to the trouble of personalizing a page, we want to see
information as soon as we display the page—we don't want to have to scroll to see it.
So the crucial areas to focus on include: Providing a single, obvious way to perform a
specific task like change the content, layout, color, providing options to cancel actions and
return to a personalized home- proper navigation, Avoiding technical or designer jargon.
Content on the MSN portal is most elaborate in that it comes from various topics of daily
interest. This makes it interesting for anyone surfing the portal a pleasurable experience. The
msn portal offers content that caters to the tastes of a wide range of web users. The content of
the site is basically the heart of the portal and it appeals the audience to come over and over to
the site. The MSN portal has wide ranging topics of interest such as news, chat rooms, games,
online organizers and calendars, email and a whole range of information filled sections such as
interactive highlights, spotlight, stock quotes.
The user finds information through the web portal and he or she can appreciate the
value that it provides. For instance the portal offers to show the latest models of an
automobile company, career options with it's career section and entertainment via the
entertainment section. There is also the major search engine, which contributes to assist the
users in finding content.
22

3.1.2 Protocol Instruments
Protocol instruments were designed especially to the study the msn portal for the said features.
The expected inputs from users would be the description of what they found useful, pleasing,
valuable, best system utility, support for tasks and also what they did not find useful,
displeasing, confusing and missing with the system. With this in mind the protocol
questionnaire was designed. Other instruments included a consent form, which would enable
the researcher to get consent from the user for the various interactions with the user and the
instruction sheet for the exchange of information between the user and researcher. The
protocol instruments are found in the appendices. They are labeled as the consent form,
instructions for the subject, task lists, and interview questions. Specific to the topic of user
interface satisfaction questionnaires have been developed [6].
The sample result report is also presented with his background information, summary
of experience, positive aspects of the system (for the subject), difficulties encountered with the
system, subjects' and evaluators' comments and suggestions. This result report is particularly
important to the evaluation of the system since it is meant to summarize the experiences of the
user and the inferences that an evaluator must derive from this. The results must be used to
make recommendations to improve the system. In the following sections it is presented how
recommendations can be made to make improvements.
23

3.1.3 Analysis Summary and Recommendations
The analysis summary and recommendations are tabulated below. These are put into tabulated
form from the result reports prepared after the user carries out the tasks that were assigned
and returns the completed post-task questionnaire.
Table 5 Positive aspects and problems
SubjectA •
•
•
Positive Aspects
Volume of information provided
Better information than other sites
Good special sections/features
•
•
•
•
Problems/Difficulties
Advertisements were a distracting element
Icons were bad at few places
Repetition of forms
Problem recognizing the utility of a feature —bad interface metaphor
B • Links about news items • Advertisements were in irrelevant places
• User interface with good colors and design • Some pages were lacking clarity
• Valuable and good information • On some pages fonts were very bad
• Being a portal it had all the features that aportal is supposed to have
• Was not able to get what he was expecting atsome places
C • Formatting is very good. • The links on the site were not relevant.
• It provides lots of information. • It really required more search for finding the
• The pages were very subject oriented. stuff, as it is not generalized.
• The pages were very neat and clean andeverything was very visible.
• Enough stories were required to be complete.
D • He liked the option of local as well as • Default pages provide details, which are notinternational news to be added so that whenhe logs in he could see the news headlines. •
required.
Proper search is not provided for all the links.• He founds the ads very less. • The news section highlighted whether it is• The access to hundreds of sites and links. gossip, proper catch is not there so that proper
• The site is fully and highly interactive. arrangement is needed.
• The page takes more time to load, as thereseems to be more stuff on the page.
24

User interaction with the systems content and personalizing the site was studied and
the protocol analysis yields a whole list of recommendations that are made below. Before we
present them here was what we thought about the various sessions with the subjects. Subjects
certainly did their tasks with commonality. This enables us to make recommendations not
based on the user's idiosyncratic notions but about his natural interaction with the system that
followed a general set pattern of web usage. There were features in the system that were not
liked by the user. However the user expressed satisfaction at places where he found the stuff
was very much accessible to him/her.
Most of the common problems that were encountered were in finding things that were
placed on the site. Not all features of the site were a problem to access. There were times when
the user found that the user interface was pleasing, help was adequate when needed and the
menu system was how the user perceived it to be.
Information was of a great value to all the users and they termed the information
provided to them as being useful and better than what they had seen on other sites. One
subject also appreciated the fact that msn was a good portal having all the features that a portal
was required to have. This was very much as expected since msn is one of the largest portals in
the world of portals. Specific to pages such as the sports page the content was expected to be
categorized into categories such as each separate sport. The user was overloaded with
information from various sports rather than the one he liked. On the news content links
should have been provided to go to the next article from the user's current location. This
would have eased the use of the page in as much as the user would not have to go to the main
25

page to fetch the piece of news headlines that he is looking for. I should be made available to
him from his current location since it is relevant and related information.
Table 6 Specific recommendations and suggestions
Suggestion
User interfaceimprovement
Specific Recommendation to improve
Fonts, color and background must be improvedacross the various sections of the site to enableuser satisfaction and ease of use. Bright fontshurt the subject's eye at some places in the site.This must be fixed
Recommendation if features does not needimprovement or redesign
Removingdispleasing content
The advertisements are a source of distractionand displeasure to the user while he interactswith the system. They must be placed moresubtly on a page so as not to distract the user.
Improving theinterface metaphor
Improvement is required in presentation oficons and links. They were misleading at timesand did not represent what they were meant torepresent.
Content in the site It was greatly satisfying for the user to find thecontent that he was looking for. For instancemovie reviews and stock quotes andinformation were available and presented well.So this feature must be kept up with.
Organization ofContent/Chunking
Information/Content should be categorizedand presented to him. For instance on a sportspage the content should show categories ofdifferent sports such as baseball, basketballinstead of presenting the content as a largepiece of information
Updating the content Check box provided is not of any use. It addsto the confusion.
3.1.4 Inferences about the system
What yields from the exercise of protocol analysis is the capacity of a researcher to present
possible improvements to the system and it's redesign if required. The features of the system
that do not require any specific changes in design can have cosmetic changes take place over
them on for the user to find a new look and feel.
26
The msn portal is a very large system and recommendations made here are on the
basis that two subjects were made subject to the protocol. Hence it is necessary that for such a
large system the system be tested for usage by many users. It can be said that the usefulness of
protocol analysis is high especially when there are not enough sales for the system or when the
system is not doing good in the market. It is particularly helpful as a tool for redesign and has
unique value to helping make design decisions that were not considered from the user's point
of view. When a user speaks out loud about what he/she is doing it is helpful for the
researcher to know what reactions a user has to a system and whether or not to improve the
systems features.
There is a great demand for user response to the systems deployed in public use.
Questionnaires, survey forms and the like will help decide objectively how the system is
performing but protocol analysis certainly provides a more complete picture of the user's
interaction with the system. The user responses can be interpreted in many different ways to
enable the improvement of a system.
3.2 Other Qualitative Criteria for Evaluations
There are many other lines of thinking about qualitative evaluations of systems. The evaluators
of the system may be of different kinds. There may be people who take the stand for
technological innovations as an advancement of mankind and evaluate systems as being
beneficial to mankind. On the other hand segmented-institutionalists consider human factors
of systems before rating the system as being beneficial or not beneficial or other such
27

evaluation. As said by [19] in his paper "Systems rationalists also differ on critical assumptions.
For example, many systems rationalists imply that important social decisions can be made with
one comprehensive, enduring rationality".
As shown in [19], systems rationalists have different lines of analyses, which makes
them different from each other. Just as any person tends to rationalize his thinking about a
particular topic or discussion. Systems Rationalists do differ in their opinions of how they
analyze certain situations and organizational information systems. Moreover he has separated
the systems rationalists to be simply rationalists or structuralists and human relations
specialists. Their analysis of technology, social settings, organizing concepts, dynamics of
technical diffusion etc. differ. For instance, a system rationalist leader is the one who
acknowledges social conflict in a team that is very diverse in its' ideas. He/she will take
advantage of this. On the other hand the management scientist type of team leader, as [19]
mentions would ignore social conflicts and will be more rigid because of such belief. The
following is an argument about the decisions from a decision maker who
A team leader who is a system rationalist (having his/her critical assumptions about a
single unequivocal rationalism) or is a structuralist would always focus on achieving his goals
considering that there is little to discuss about the acceptance of the information system or
technology being used. Such considerations can lead to timely delivery of products or services
assuming that there is little social conflict(just like the system rationalists assume). On the other
hand segmented-instituionalists, who also do differ in their thinking about the assumptions of
28

social behavior, while leading a team, would most likely analyze the social patterns of the
participating parties or individuals.
Say a team leader or project manager follows the pattern of a segmented insitutionalist
in thinking that he must analyze the kind of social conflicts that do occur while the project is
on it's way. This does help in a way if what he assumed turned out to be right. For instance he
assumed that all project members must not be seated closely. This is technically untrue but
socially true in the sense that there may be conflicting styles of working that affect a projects
members' ability to perform in such a setting. On the other hand the system rationalist would
argue that it would be more important to focus on achieving goals of the project and that it is
assumed that the social conflicts will always persists in a performing group.
Lastly, it can be said that the critical assumptions, that the system rationalists and
segmented institutionalists make about the given information system or technology, are proven
to be legitimate, after a large population tests them over a long period of time. It is worth
pondering of what the greatest downfall of a decision-maker who is a systems rationalist would
be, while selecting or evaluating a software. Similarly, it may be questioned of what the greatest
downfalls, of the decision made would be, when the decision-maker is a segmented
institutionalist.
Another evaluation method is shown as a heuristic evaluation of a world wide web
prototype of the bureau of labor statistics(http://stats.bls.gov/blshome) site. It has been
shown how usability principles like 'chunking', 'progressive levels of detail' etc. can be used as
29

heuristics for evaluation [21]. Continuing the assessment of the role of ease of use or usability
[13], usefulness and attitude in usage of the world wide web a study by [20] shows how their
technology acceptance model(TAM) accomplishes these objectives. Another survey of user
attitudes towards computers is shown in the study by [24].
30

CHAPTER 4
DECISION MAKING BASED ON MULTIPLE CRITERIA FOR SYSTEMS
There are various ways investments in information technology are made by evaluating systems
[7]. [9] lays a foundation for the use of GDSS. In [11] it has been said that computer systems
are used for an individual's decision making for business, and most strategic decisions are
ultimately made by an individual, rather than a group. A group has been shown using
computers in high-level decision-making [11]. The problem of making decisions considering
multiple attributes of the system is a difficult. The difficulty of making choices or selecting
from various products is particularly seen in investing huge amounts of capital in them. It is
therefore important to identify the right attributes of the system for them to be evaluated. The
problem here is that once a set of attributes common to each system is found a method is
chosen to evaluate them. Quite often it is difficult to rate an attribute quantitatively against that
of another system. It may be quite easy to subjectively describe how well the attribute of one
system does against another. To remove this fuzziness a method is devised to quantify the
decision makers' reactions.
4.1 The Database Selection Problem
A specific problem chosen here is that of choosing academic databases. Many instances occur
when expensive databases must be chosen. This is a capital investment project. Similar
investments in technology and especially software must be evaluated before any decisions are
made. Decisions made should be based on such evaluations. The problem of database
31

selections in particular has been encountered many times and is assessed using various
methods. Some methods focus on the testing the query itself and the number of documents
retrieved. As mentioned earlier research has been done for effectiveness of solutions for such
problems as selecting the optimum database for a given query based on the decision about
which database, from a number of given databases, should be chosen for that query. This is
very specific to the query and hence a collection of queries can be formulated and cumulative
costs can be computed [25]. The reason is that with relevant documents irrelevant documents
are retrieved. The key criteria of analysis may be based on precision and recall [5].
With this in mind the issue of selecting databases does not become easier. The value of
research done should be for real work places. The application of this research is often unseen
because decisions made are ad hoc and except in large corporations the use of tools for
decision making is limited because of the overheads involved. Often this is due to
economically limiting factors. Some employees of large corporations were informally
interviewed regarding the use of decision aids. They all denied and said that the use of decision
aids was not prevalent because importance was given to solution formulation and not selecting
the solution as is most often the case with decision-making. They also recorded the fact that
investments in capital or the formulation of a solution for building large software applications
was primarily done by managers and chief technical officers. They reported the non-use of a
structured approach to making such decisions. This was done purely based on the experience
of the team leader or manager.
32

Proposed here is an approach to making selections for capital investment projects.
GDSSs have been defined as integrated computer-based systems that facilitate solution of
semi- or unstructured problems by a group that has joint responsibility for making decisions
[1]. Keeping this in mind a software program was built to implement the solution to the
problem of making selections. It can be called a Decision Support System simply because it
generates a decision in the form of a table where product ratings are displayed from highest to
lowest. The solution consists of first preparing a set of attributes or features that a vendor
provides for his product. Then each vendor is rated for a feature. A weight is given to the
feature. The weight is also decided by each of the decision-makers. The weight is assigned to
the attribute or the feature of the product after all the rating sheets are filled in. The rating-
sheet consists of a matrix like table in which vendors are placed as columns and the attributes
or features are placed as rows. Each cell carries in it a rating value for the corresponding
feature and vendor. The rating sheet for each decision maker is then combined to form a
single tabulated rating table by performing various computations on it. The computation
basically consists of pessimistically averaging the rating provided by each of the decision
makers. These are explained in the following section. The weights assigned to each feature are
then pessimistically averaged similar to the ratings.
The rating matrix and weights matrix are then combined by multiplying the weight
matrix with the rating matrix to get a complete effect of the rating. With this a final matrix is
produced which is a simple one-dimensional matrix with the highest numeric value placed first
following with the remaining numerals in descending order. The meaning of this matrix is that
the highest rated vendor is placed first and then the remaining follow. The highest rated
33

vendor is the collective choice of all the decision-makers. The detail of how the computation is
performed on the ratings and weights is shown in the next section.
4.2 Selecting the Right Database Product: A fuzzy logic approach
In the previous section it has been described of how a fuzzy qualitative decision about a
database can be quantified and brought to the stage where a decision is generated as numeric
output produced from the computation. This means that the database/vendor that got the
highest numeric value will be chosen. The following is an account of what the Decision
Support System will do.
First the vendors and attributes are selected. The attributes are the various system
features. The academic databases come with more than one module for support of the various
departments of the library. A module may support the inter-library loan department with it's,
say, ILL feature whereas another may support the reference department with it's
SEARCHING feature etc. The vendors are commercial database vendors. The following is an
overall algorithm for the computation of the final matrix.
1. Select the set of vendors and set of attributes
2. Rate each attribute with respect to each vendor
3. Compute the modified pessimistic aggregated rating(MPAR) matrix for vendor v/s
attribute
4. Assign a weight to each attribute
34

5. Compute the weighting vector
6. Multiply the MPAR matrix by the weighting vector
In this model there are k decision makers. Each decision maker will be evaluating each
of i attributes against each of the j integrated library systems. Each decision maker will be
presented with a rating worksheet arranged such that the rating for the ith attributes against
each of the j integrated library systems.
Each decision maker will be presented with a rating worksheet arranged such that the
rating for the ith attribute with respect to the jt h alternative will be done in the interval [0, 1] or
[0, 10] with the 0 meaning that the attribute is least important and 1 or 10 meaning that the
attribute is most important.
Table 7 Matrix for vendors versus attributes
Attributes
Vendor 1
Vendors orAlternatives
Vendor 2 Vendor 3 Vendor 4Advancedsearchingfeature
rating rating rating rating
Accept variablebarcodes
rating rating rating rating
Customizationoption
rating rating rating rating
Patrongenerated ILL
rating rating rating rating
Patronnotification
upon arrival ofitem via email
rating rating rating rating
35

36
The modified pessimistic aggregation is calculated as follows. The ratings are picked
from the cells by the DSS program and the computation that has been shown is performed.
r121 = rating value of decision maker 1 for attribute 1 with respect to vendor/alternative 2.
In the above formula,
i represents an attribute or a variable,
j represents a vendor or a database alternative,
k represents the decision maker
The rating of the kth decision maker is for the ith attribute with respect to the j th
alternative. Now the pessimistic mean must be calculated. The DSS does this for the user. This
is done in the following manner. The DSS reads the rating values given by each of the k
decision makers for attribute 1 and vendor 1. The minimum from the values of ratings r ij^k is
selected as
The mean is then computed for each r isk by summing the values and dividing by the number
of decision makers.
The mean of rmin and rave gives the r pess_mean ss_mean

Now the DSS will ask the decision makers for weight to be assigned to each attribute. This is
interpreted as the importance of the attribute to the institution or the organization making the
selection. Weights to each attribute on the list are assigned as a number from interval [0, 1] or
[0, 10] with the 0 meaning that the attribute is least important and 1 or 10 meaning that the
attribute is most important. The modified pessimistic weight is calculated as
Where W stands for weight. And the meanings of i and k remain the same. Finally
when the weighing matrix, which is a (1 * n) matrix is multiplied by the rating matrix, which is
a (n * m) matrix it yields a (1 * m) matrix which contains the final decision matrix. The
decision matrix contains numeric values from the highest to the lowest with the vendor name
showed against each value. Hence it can be found which vendor rated the best according to
the decision- makers. The final table of results or the decision-matrix appears as shown below.
Table 8 A tabulation of the ratings for alternate solutions/vendors/databases(for this study)
Vendor 1 Vendor 2 Vendor 3 Vendor 4 Vendor 5
9.75 8.45 7.25 6.32 5.77
Values in the above table are factious. The matrix shows that Vendor 1 is the collective
choice of the decision makers. In the following section an experiment has been devised to
37
measure the satisfaction with the outcomes of the decision from the use of such a DSS. The
experiment is just a design and hence the data presented therein is hypothetical to prove the
objectives of the experiment. In certain cases decision makers may feel that though they rated
certain vendors very highly for their products(in this case the databases) those vendors were
not selected since many others may have rated other vendors highly. The use of a
face-to-face(FTF) discussion for discussing the issues that remained unresolved from the use of the
DSS is warranted.
The DSS designed for the purpose of this solution does not allow group
communication. It only automates the process of decision and aids in reducing of the fuzzy
behavior of the qualitative evaluations. The design of the experiment suggests whether the use
of FTF after using the DSS is beneficial to the group or not. The DSS was built to make
computations and get inputs from decision makers. However the input module, which allows
input from the user and the computational module that read in users' inputs are run in
separate sessions one after the other i.e. the input module must be run and then the
computational module. The DSS runs in line mode and a GUI is being worked on. Besides,
an evaluation plan for actually conducting the experiment is also being worked on. The
evaluation plan will make cost suggestions for the use of DSS and FTF-dis cussions to evaluate
the databases.
38

CHAPTER 5
ANALYZING THE USE OF DECISION SUPPORT SYSTEMS
The case study shown here is a collection of two case studies, in research papers [17], [18], that
are focused very closely to the topic of current discussion. Hence their findings and methods
of analysis are very important to the study of the use of Decision Support Systems. The
inferences derived from there are very helpful in analyzing systems in organizations. Though
systems are evaluated quantitatively they do not involve the use of statistical analysis and
factors of value around the system. By this it means that evaluations of systems focus on the
apparent factors such as functionality of the system, the capabilities of the system, it's usability
etc. However there is no kind of research value added to it in that there is most likely no
thought given to interaction of system factors, psychological factors, human factors etc. The
formulation of a hypothesis (has been shown in the following sections) for these factors helps
analyze the selection or evaluation better. Statistical analysis then helps to analyze and evaluate
the system produce numeric values for certain analytic factors such as F, t, p etc., which are
then interpreted to mean something for the system under consideration. This means that the
end value of this analysis is for instance whether a system must be chosen or not, a system did
better than the others etc.
Two case studies are chosen were experiments on the use of GDSS in auditing. The
first study that was published in 1994 [18], primarily studies the effects of the communication
medium on learning and satisfaction of the subjects that either worked in a (face-to-face) FTF,
39

GDSS (Group Decision Support Systems)-mediated or an independent environment.
The following study which showed continued research in this field was published in 1996 [17]
and it studied the choice-shift phenomenon occurring with the use of GDSS, efficiency of the
performing group and the perceived satisfaction of the participants in each group - FTF ,
GDSS-mediated and individuals working independently.
5.1. Learning in Co-operative environments and the Use of Decision Suppor tSystems
This first study [18] mainly describes the use of GDSS tools in making decisions in auditing
such as audit planning, risk assessment and setting the materiality level for a client. This study
has been referred to as study 1 [18]. The paper examines the various effects of GDSS on
groups. For instance learning is a positive effect of GDSS. This has been studied by comparing
the extent of learning for participants in individual decision making environment, FTF
environment, and GDSS environment. The nature of the study is therefore conceptual as well
as empirical. Results of the learning experiences have been presented.
On the second study [17] continued research has been shown on the topic of group
decision making in auditing tasks. This study has been referred to as study 2 [17]. The research
primarily focuses on the topics of the choice-shift phenomenon (explained later) efficiency of
groups (GDSS-mediated and FTF) and the level of perceived satisfaction for these groups.
Like the first experiment this one also has the group of individuals working independently.
The experiment has been done in two
40

stages. The first one is done to test the hypothesis that the extent of shift in acceptable audit
risk (AAR) level for the two communication modes (GDSS-mediated and Fn.).
The second stage of the experiment investigates whether the difference in the extent of
choice shift observed between the GDSS-mediated and 1-(T14 groups was done to the presence
of the automated decision aids or was due to the anonymity of individual members inputs. In
this part of the experiment anonymity was manipulated (anonymous v/s non -anonymous)
while holding communication condition constant (i.e. GDSS-mediated).
5.1.1 Hypotheses for Accomplishing the Objective
There were two set of hypothesis in study 1 [18] that were used to analyze the participants in
the groups using either GDSS or FTF discussions for making decisions for audit planning, risk
assessment and setting the materiality level for the client. The hypothesis mainly consisted of
two parts. The first set of hypothesis was regarding the effect of the communication medium
of learning. This meant that whether the medium used to make decisions helped the users
learn and make better decisions or not.
H1A: Subjects in GDSS-mediated groups will exhibit greater learning than subjects in the FTF
groups.
H1B: Subjects in GDSS-mediated groups will exhibit greater learning than subjects working
individually.
41

The second set of hypothesis was used to analyze the satisfaction in group processes.
The subjects were made to answer questionnaires regarding their satisfaction level, perceived
improvement etc.
H2A: Subjects in GDSS groups and subjects in FTF will have equivalent satisfaction levels
with the group experience.
H2B: Subjects in GDSS groups and subjects in FTF will have equivalent satisfaction levels
with the outcome of the group deliberations.
H2C: Subjects in GDSS groups and subjects in FTF will have equivalent self-reported group
efficiency ratings.
H2BD: Subjects in GDSS groups and subjects in FTF will have equivalent levels of perceived
improvement.
In [17] To study the phenomenon of choice shift in GDSS-mediated environments
and it's difference from the FTF environment for which decisions made are considered to be
the usual norm or standard. It has been intriguing to the researchers about whether the
significant choice-shifts or group-shifts would be observed for a GDSS-mediated group. The
question now arises whether the group shifted into a risky or a cautious decision due to the
mediation of the decision aid. The answer is task dependent and is not of concern for the
research. What is however of interest here is whether the shift was caused due to the
anonymity of the group or due to the intervention of technology.
To test these uncertain ideas certain hypothesis were proposed and subjects were
assigned to various groups. Then tasks would be assigned to each group. Later measures of
42

their experiences would be done via standard measuring instruments such as questionnaires
etc. The hypothesis and the reasons for them are as follows.
H1: GDSS-mediated groups will exhibit the same degree of choice shift as face-to-face
groups.
H2: The time required to reach a consensus will not be significantly different between
GDSS-mediated and FTF groups.
H3: Satisfaction with the group process will not be significantly different between GDSS-
mediated and face-to-face groups.
The first hypothesis was primarily proposed to test the intervention of GDSS
technology in decision-making. The traditional FTF meeting for group decision -making is
understood to be the standard. However choice-shift does occur in that the group will tend to
deviate from the task from distracting comments by individuals, intervening of a member with
an irrelevant point of discussion etc. Also the dominance of the individual making the
comments must be considered since he/she may not be easy to prevent from talking or
distracting the group.
The GDSS-mediated group is put to question about whether there does or does not
occur a choice shift in decisions made. There may not be distracting comments due to each
person on the GDSS would likely to prevent himself from presenting such ideas that have
unknown reactions from the participants. This might enable the group to comply with the
rules and focus on the task at hand. The efficiency might be a crucial factor. It might be higher
than the FTF group. To test this a second hypothesis is made.
43
The second hypothesis states whether or not the time required to reach a consensus
will be different in the two groups. This could mean that a group placed under mediation of
GDSS for making decisions may perform better and faster than the FTF group with the
anonymity that was provided to it. However the converse may be true in that the FIT group
may be more satisfied and perform more efficiently given that it has the liberty to freely
interact with the other group members without any mediation or obstruction (if it so feels to
the members) of technology. The third hypothesis tests the satisfaction of the groups using
GDSS and those that use 1-4T14 meetings to make their decisions. This is a crucial factor to
decide the use of GDSS technology versus traditional FTF meetings.
5.1.2 Methods, Tasks and Conducting the Experiment
In study 1 [18], the subjects were asked to perform the task of assessing audit risk in the
environment of GDSS-mediation and FTF meetings. The subjects were given pre-treatment
test and post-treatment test. The pre-treatment test was administered to assess the subject's
initial knowledge of internal controls relevant to the purchase segment of the acquisitions/cash
disbursement cycle. The subjects were then subjected to the treatment task, which, consisted of
working either individually, working FTF or working in a co-operative environment with the
GDSS. The GDSS-mediated group used the VisionQuest GDSS software.
After the treatment task the subject's internal control questionnaires and client
descriptions from the pre-test phase were returned to them. The subjects were instructed to
make any additions and corrections to the questionnaires returned to them.
44

Learning effects were measured by observing the difference in the number of internal control
questions between pre-test and post-test. The measure of satisfaction was from the
questionnaire, whose responses were to be entered on a Likert scale. For instance one
question had the two extremes as "very dissatisfied" and "very satisfied".
The second study [17] had two stages. Stage one the subjects were asked to make an audit
judgment task individually and then repeat the task in a group setting. The task involved
determining the level of acceptable audit risk for a hypothetical client. Audit risk is considered
as the probability that an auditor will fail to notice an existing misstatement in the client's
accounting records and as a result issue a clean audit report instead of issuing an alert about
the misstatement.
The appropriate level of acceptable audit risk must be determined for audit processes.
If acceptable audit risk is set too high then the auditor may be performing a substandard audit.
This might lead to legal liability of the auditor if the client defects. If the acceptable audit risk is
set too low then the auditor may have to perform audit that is of very high standard to catch
all or nearly all misstatements and mistakes in the clients accounting records. Control was
exercised to that there was no interaction between subjects when they completed the task
individually. Following the completion of the task individually they were placed in a group.
The group was then subjected to make decisions about the acceptable audit risk level either in
a GDSS-mediated or in a 1-4714 meeting environment.
45

5.1.3 Results and Findings
On the first study [18] F tests have been done and the results suggest that the subjects working
in GDSS-mediated co-operative groups learned more than subjects in the 1-114 groups and
subjects working individually. There was no difference between the levels of learning
improvement between the 1-T14 and individual group. These results met the expected
hypothesis effects. The hypotheses were tested by finding the mean change in subject's pre-
treatment and post-treatment scores (learning effects).
The learning effects scores in the GDSS group was compared to the learning effect
scores in the FTF group. The differences in pretreatment and post-treatment scores were
marginally significant. It was found as said before that GDSS group learnt more than the FTF
group and there was not much difference between levels of improvement for FTF and
individual. Another part of this experiment dealt with measuring the level of satisfaction in the
three groups (individual, GDSS-mediated and The measured level of satisfaction
indicated that the 1-T14 group was more satisfied than the GDSS-mediated group in the results
or outcome of the group deliberation. A hypothesis proposed by the researchers that both the
GDSS-mediated and FTF groups will have equal satisfaction was rejected. This was supported
by the fact that the GDSS-group gave lower efficiency rating than the subject in the 1-T14
groups.
This part of the study also tried to prove a hypothesis about the improvement in ability
to perform similar tasks in the future. The results indicated that individuals working
46

independently were less confident that their assignment had improved their ability to identify
weakness in the internal control structures (internal control structures are said to be ones that
control the transactions for acquisitions/cash disbursement cycle) than subjects in the FTF
group and subjects in GDSS-mediated groups. Co-operative environments increase subjects
perceptions that treatment task (going through a group deliberation) improved their decision-
making ability. The FTF groups were more confident of their improved ability than GDSS-
mediated groups. The methods used for finding the measures of satisfaction and measure of
perceived improvement, F-test were used. In a certain case where the four satisfaction
questions were to be measure for reliability, the Cronbach's alpha was used. A Cronbach's
alpha of 0.92 was obtained.
The results from the two stages from the second study [17] are as follows. Stage one
results were analyzed by performing paired-samples t-tests to test the first null hypothesis that
mean individual AAR was not significantly different from the group AAR in each
communication mode. The second hypothesis was tested by taking the two communication
modes into consideration. t-tests were used and it was found that subjects in FTF took longer
than subjects in the GDSS-mediated group to reach a consensus.
The third hypothesis was tested by comparing subject's satisfaction ratings of their
satisfaction with the group process based on their responses to certain questions in the
debriefing questionnaire. A reliability analysis of the questionnaire revealed a Cronbach's alpha
of 0.79 indicating that it can be considered a reliable measure for subject's reactions to the
group process.
47

The results from the second stage are as follows. Here anonymity was manipulated as
being anonymous v/s non-anonymous while holding GDSS-mediated communication mode
constant. This stage of the research clears up any gray areas regarding the cause in difference in
the extent of choice shift between GDSS-mediated and FTF due to the mode of GDSS i.e.
anonymous or non-anonymous. The means of individual and group ratings were close. A
paired-samples t-test was performed to test the significance of the shift, the results shown that
the difference between the individual and group means for the non-anonymous
GDSS-mediated group was not significant. No significant choice-shift was observed for non-
anonymous GDSS-mediated groups.
Considering the results of stage one the extent in choice-shift can be attributed to the
mode of communication and not anonymity in the GDSS-mediated group. From results of
stage 1 and stage 2 specifically GDSS technology can serve to mitigate the choice-shift
phenomenon commonly observed in the outcome of group decision processes. Also a
significant "cautious choice-shift" was observed in the 1-4T14 group whereas there was no choice
shift observed in either anonymous or non-anonymous groups.
5.2 Critical Comments on Methods Used for Data Ana lysis in the Case Study
The authors researched the usefulness of GDSS in auditing tasks over 1-4T1-: and individual
efforts. The designed hypothesis for testing and their primary method of analysis appears to
factorial design. Since only the results are presented on both papers it can be only presumed of
what method would have been used.
48
In the most common scenario the method of reporting scores were the means and
standard deviations of the individuals in respective groups. The t-tests have been performed
on study 2 [17] and F-tests were performed in study 1 [18]. The two research scenarios were
done with an intention to further their knowledge in the field of 'use of GDSS in auditing'. F-
tests reported the results of the hypothesis for instance "the subjects in GDSS-mediated group
will exhibit greater learning than subjects in FTF groups (study 1 [18]).
Paired-samples t-tests were performed to test null-hypothesis in the research scenario
assessing acceptable audit risk (AAR) in GDSS-mediated, FTF and individual environments.
This was meant primarily to compare group means. The results indicated that the hypothesis
did hold. A smaller value of t obtained indicating that mean individual AAR was not
significantly different from group AAR in each of the two communication modes proved that
hypothesis. A significant value oft obtained showed that there was a significant difference
in mean values between individual and FTF groups.
5.2.1 Problems, Limitations and Assumptions
There were no problems and limitations found in the study. In the experiment (study 1 [18])
the one-way ANOVA was appropriate to use. However since the experiment consisted of pre-
treatment tasks and post-treatment there could have been possible invalidity of results. Internal
validity is particularly in question because there could have been learning going on between the
pre-treatment and post-treatment tasks.
49
5.2.2 Alternative Ways of Analyzing Data
Alternate ways of analyzing the data would have been to calculate eta and prove the size-
effects of each of the independent variables. This was not shown on the study in either paper.
The primary reason is that eta can serve as an index of any type of relationship.
5.3 The Proposal of a Method for Testing the Use of Decision SupportSystems
The experiment is based on the subject of 'selecting academic databases'. This study is real
and this part of the study i.e. the experiment is hypothetical. The task at hand here is the
selection of academic databases that cost millions of dollars and are crucial to the faculty and
student population. The selection of the right databases is therefore of prime concern for
meeting the financial budgets. The tasks of selecting a database involve the various decision
makers who make decisions for selecting the databases from various vendors.
The task of selection can be done by the head of the department alone or involve the
staff from the different departments of the institution. A certain DSS will be used to assist the
decision makers to make the crucial selection. The DSS enables its users to rate and weigh
various database attributes for each vendor. Each user can fill-in a rating sheet and then the
rating sheets are brought together by the DSS and a final result is thrown out as a table
containing the vendor with it's corresponding rating, the vendor with the highest rating
standing at the top.
50

The task of selection can now be done either by
(a) Using the DSS (DSS-assisted)
(b) Not using the DSS and using FTF communication for the deliberation of
selecting the database
(c) The DSS followed by FTF discussion for any unresolved issues
(d) Individually
The subjects the on the experiment are hypothesized as the members of the department
wanting to make a database selection. It is not described how the subjects would be assigned
to the group.
5.3.1 The Foundation for the Testing Method
The independent variables therefore entail the 'mode of decision making' - i.e.
1. DSS assisted
2. FTF
3. DSS-assisted + 1-(T14
4. Individual
The independent variable 'mode of decision making' therefore toggles or is manipulated as the
above-mentioned modes. The dependent variable is the 'satisfaction' of the users with the
process of decision-making. The overall satisfaction reflects the agreement of all members of
various departments to the consensus of having chosen the right databases during the exercise.
51

Satisfaction entails overall satisfaction with the group process as said before and satisfaction
due to improvement in the financial spending (which may include savings due to the choice of
the new set of databases, benefits due to the new configuration of databases and
improvement in services).
5.3.2 Design and Procedures
Here is a description of the design and procedures of the experiment. The instruments such as
the questionnaire was adapted from study 1 [18]. The data analysis procedures were adapted
from [27]. The financial budgets are assumed to have been calculated before and after the
selection of the new set of databases to analyze if the institution profited or lost by
reconfiguring their set of databases. A profit may not necessarily be only in terms of dollar
amount. It is left to the institution or environment's decision maker community who will
decide whether they perceived profit or satisfaction as has been said before about
satisfaction/improvement. It is also assumed that the new set of databases may not have at
least one new database or have at least one old database eliminated from the old set of
databases.
The questionnaire was designed much on the lines of the satisfaction questionnaire of
the study 2 [17] experiment. It was brain stormed of the questions that could be asked to the
potential decision maker about working with the group, outcome of the group decision and
their experience. Three questions were aimed at satisfaction due to improvement in the
financial spending scene of the institution and three were for measuring the overall
52

improvement for working with the group and the DSS. The responses to each question were
measured using the 7-point Likert scale with each scale having the two extremes of the
reaction to the question. The questions and scales are as follows:
1. The institution profited financially by saving on database costs by reselecting
their set of databases.
1 2 3 4 5 6 7
Will lose Will lose Will Neither Will profit Will Profited
heavily somewhat profit nor somewhat profit highlyLose loss
2. The institution profited financially by replacing the old ill-performing databases
by newer and better performing databases.
1 2 3 4 5 6 7
Will lose Will lose Will Neither Will profit Will Profited
heavily somewhat profit nor somewhat profit highlylose loss
3. How would you describe your experience when working with your group?
1 2 3 4 5 6 7Very Dissatisfied Somewhat Neither Somewhat Satisfied Very
dissatisfied dissatisfied satisfied satisfied
53

4. How satisfied were you with your groups' list of new recommendations for selecting the set
of databases?
1 2 3 4 5 6 7Very Dissatisfied Somewhat Neither Somewhat Satisfied Very
dissatisfied dissatisfied satisfied satisfied
5. How efficient was your group at discussing the present selection criteria and developing
recommendation for the new database.
1 2 3 4 5 6 7Very Inefficient Somewhat Neither Somewhat Efficient Very
inefficient inefficient efficient efficient
6. To what extent do you feel this group improved the selection process?
1 2 3 4 5 6 7Worsened Worsened No Neither Somewhat Improved Very high
the the improvement improved improvementprocess processhighly
5.3.3 Hypotheses for the Main Effects and Interaction Effects
The hypothesis related to the main effects of the modes of communication to the selection
process and perceived satisfaction of the participant decision makers are as follows:
H1: The DSS will improve the financial scene (saving, benefits, satisfaction) better than FTF.
54

H2: FTF improved the financial scene better than using the DSS.
H3: Individual doing the task would not do better than DSS
5.3.4 Method for Data Analysis
Here is a table of data that has been hypothesized to match the hypothesis. The scores are
mean scores from the satisfaction questionnaire. The satisfaction scores are the key scores that
are being measured. Also satisfaction includes a user's overall satisfaction and the user's
satisfaction due to improvement in the selection process.
Table 9 Hypothetical test results
DSS RowMeans
RowEffect
Yes NoFTF Yes 7 3 5 1
No 4 2 3 -1ColumnMeans
5.5 2.5 4
ColumnEffects
1.5 -1.5
55
The interaction effects calculated are tabulated as follows

Table 10 Interaction Effects
CommunicationMode
InteractionEffect
= Group-Mean
- GrandMean
- RowEffect
- ColumnEffect
DSS + FTF0.5 7 4 1 1.5
FTF -0.5 3 4 1 -1.5DSS -0.5 4 4 -1 1.5Individual 0.5 2 4 -1 -1.5
Totals0 16 16 0 0
The row effects show that the groups subjected to the use of FTF communication and
meeting for making decisions perform better than those not meeting FTF (1.0 to —1.0). The
column effects show that groups using DSS perform better than the ones that do not. The
interaction effect was that the group that uses both the DSS and FTF-meeting and the group
that uses neither do better than the ones that use either of the two (DSS or FTF singly).
56

Total SS = Between SS + Within SS 4 50 = 48 + 2 is now true
Now the degree of freedom within conditions and between conditions is as follows:
df(between conditjons)
df(within conditions)
df total = df between + df within = 3 + 8 = 11
Calculating F:
Table 11 Table of effects
Condition
DSS +FTF
Subjectnumber
1
Score
8
Grandmean
4
RowEffect
1
ColumnEffect
1.5
InteractionEffect
0.5
Error
1
DSS +FTF
2 7 4 1 1.5 0.5 0
DSS +FTF
3 6 4 1 1.5 0.5 -1
FTF 4 4 4 1 -1.5 -0.5 1FTF 5 3 4 1 -1.5 -0.5 0FTF 6 2 4 1 -1.5 -0.5 -1DSS 7 5 4 -1 1.5 -0.5 1DSS 8 4 4 -1 1.5 -0.5 0DSS 9 3 4 -1 1.5 -0.5 -1
Individual 10 3 4 -1 -1.5 0.5 1Individual 11 2 4 -1 -1.5 0.5 0Individual 12 1 4 -1 -1.5 0.5 -1
/X 48 48∑X2 I 242 192 12 27 3 8
57
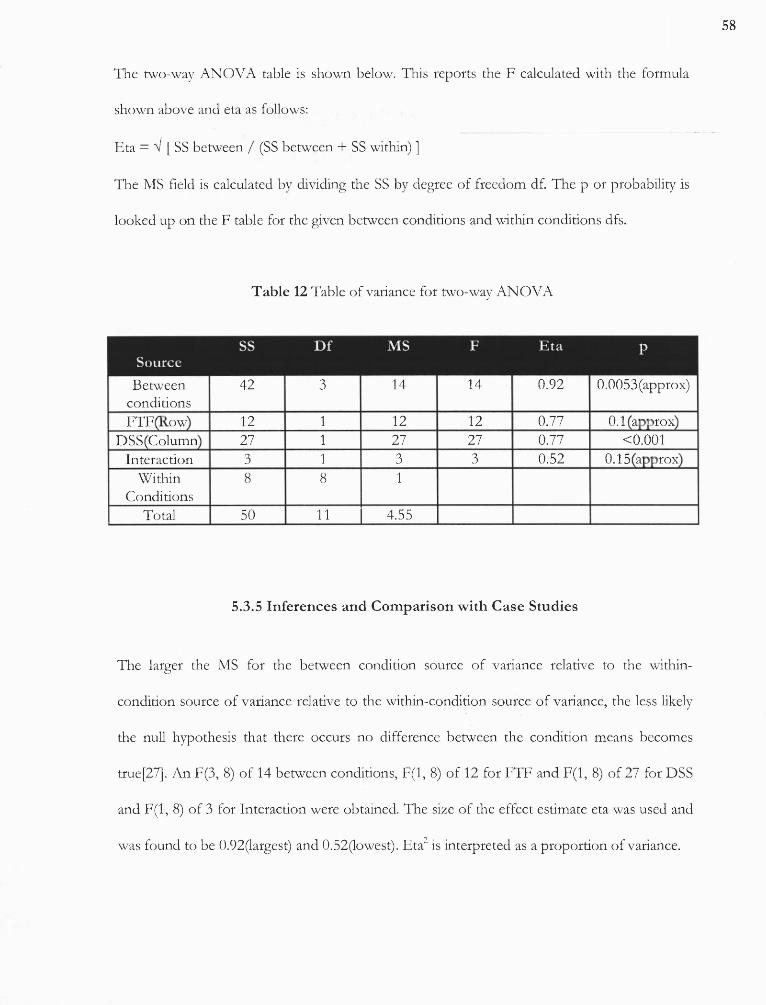

Therefore eta2 equals 0.85(largest) and 0.27(lowest). Since there aren't only two
conditions being compared eta may not represent a linear relationship. P expresses the
probability that an eta of the size obtained or larger could have occurred if the relationship
between the independent variable of condition membership and the dependent variable of
score on the response variable were actually zero in the population [27]. Eta is therefore a very
non-specific index of effect size when it is based on a source of variance with df > 1 and is
much less informative than which tells us about linear relationship. The eta of 0.92 is based on
a df of 3 for between-conditions effect and is large. The etas for FTF(indicating row),
DSS(indicating column) and interaction are based on a single df and it is therefore equal to
correlation cry. It can be said that the size of the effect of FTF is r=0.77 and that for interaction
is 0.52.
The group working in DSS was more satisfied about the improvement of the financial
budgeting for databases showing(F(1, 8)=27, p<0.001) as opposed to the FTF group (F(1,
8)=12, p=0.01). Since a two-way analysis of variance was done the results especially the size of
effects estimates regards each of effect of analysis(row, column and interaction effects) as
though it were the only one investigated in that study.
The results in the study conducted on the research paper (study 1 [18]) indicate greater
satisfaction for FTF rather than GDSS-mediation for their own group experience. The
findings for the hypothetical scenario here(selecting the database) indicate greater overall
satisfaction for DSS mediated decision-making. study 2 [17] reports greater learning from FTF
59

was greater than GDSS mediated. My findings are opposite for the fact that the use of DSS
followed by FTF meetings for resolving unresolved issues or discussing any fuzziness about
their decisions, increased user ability to make decisions.
60

CHAPTER 6
RESOURCE ESTIMATES
6.1 Total Costs
The resource estimates in assessing a system for it's user-interface and selection among a range
of different available systems is as follows. The factors under consideration have been shown
as different tabulations below. In order to evaluate the system a DSS must be built as has been
outlined in the previous sections. The system must be programmed for it to be automated and
assist more than one user and more than nominal amount of vendors and attributes/features
of each vendor. The cost of building this is followed by the cost of testing the software built
for validity of its' results and calculations. There must be a way to then distribute the system to
the user community and test it for any unknown bugs and fix them. Here are some
calculations about the resource estimates for evaluating the system quantitatively using the
DSS.
The cost of building the DSS can be calculated as follows. The DSS in the context of
this discussion is the one referred to in section. It must be implemented as a software for the
decision maker to evaluate the database-systems/vendors. To recall from the previous section,
the decision makers will rate the system on semantic differential scale[22]. The inputs from
users are taken by the DSS and it calculates the final ratings for each database-system
considering each decision makers' rating. The cost of building the DSS for evaluating the
61
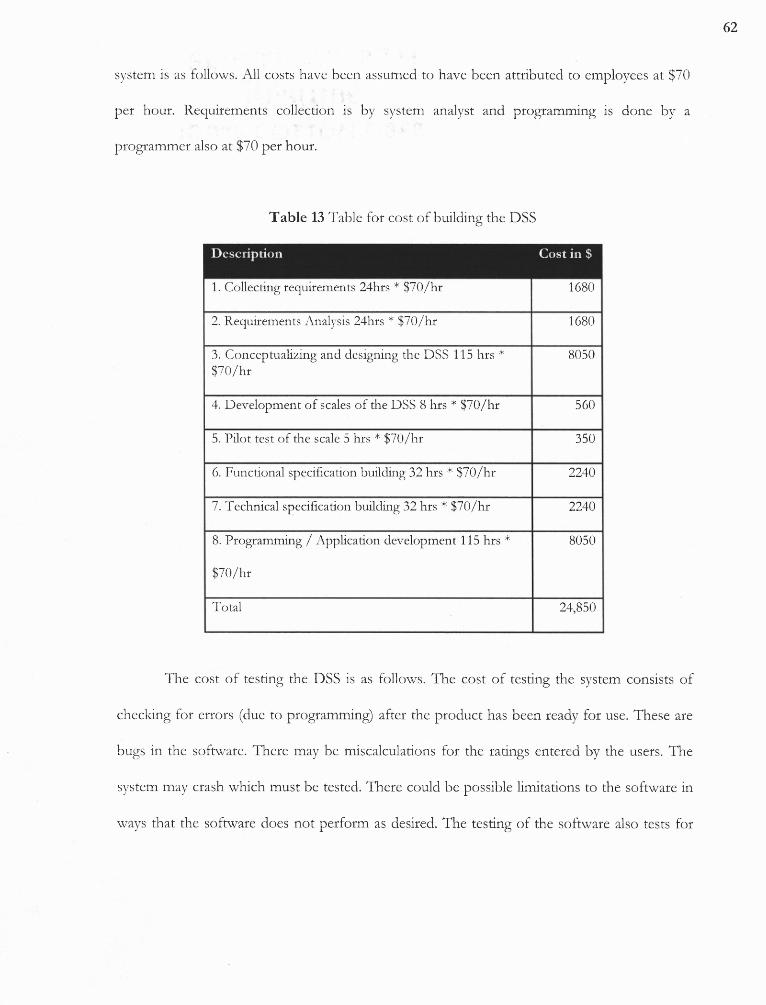
system is as follows. All costs have been assumed to have been attributed to employees at $70
per hour. Requirements collection is by system analyst and programming is done by a
programmer also at $70 per hour.
Table 13 Table for cost of building the DSS
Description Cost in $
1. Collecting requirements 24hrs * $70/hr 1680
2. Requirements Analysis 24hrs * $70/hr 1680
3. Conceptualizing and designing the DSS 115 hrs * 8050$70/hr
4. Development of scales of the DSS 8 hrs * $70/hr 560
5. Pilot test of the scale 5 hrs * $70/hr 350
6. Functional specification building 32 hrs * $70/hr 2240
7. Technical specification building 32 hrs * $70/hr 2240
8. Programming / Application development 115 hrs * 8050
$70/hr
Total 24,850
The cost of testing the DSS is as follows. The cost of testing the system consists of
checking for errors (due to programming) after the product has been ready for use. These are
bugs in the software. There may be miscalculations for the ratings entered by the users. The
system may crash which must be tested. There could be possible limitations to the software in
ways that the software does not perform as desired. The testing of the software also tests for
62

users being able to give correct inputs and correct the inputs given. This can generally be done
by a tester who is paid $50/hr.
Table 14 Table for testing the DSS
Description Cost in $
1.Testing for software bugs 24hrs * $50/hr 1200
2. Testing validity of scales(if the software does not accept illegal values) 8 hrs * 400$50/hr
3.Testing the DSS for crashes 5 hrs * $50/hr 250
4. Cost of time for preparing and entering test data 8 hrs * $70/hr 480
5. Setting up supplies and equipment (computers, internet connection etc.) 1000
Total 3330
The cost of testing the software and testing the use of the DSS among users is as
follows. The cost of testing and using the software among real users consists of employing
potential persons who will really make use of the software. These are persons from the various
departments that use the software for (a) the purpose of searching documents in the database-
system, (b) assisting users of the database-system, (c) delivering documents to users that do not
own the system. Testing includes using the DSS and rating the database-systems various
features on the semantic differential scale and entering the number into the DSS. The users are
then asked to deliver the files to the administrator who feeds them to the part of the DSS that
calculates the final decision matrix. Persons are needed to administer the entire session,
63

potential users that will use the software and assistants. The costs are calculated as follows. The
total cost found was $ 35,520 ($ 24,850 + 3330 + 7340).
Table 15 Table for cost of testing software and the use of the DSS among users
Description Cost in $
1.Deploying the system to the users 3 hrs * $70/hr 210
2.User training 10 employees * 5 hrs * $70 3500
3.Building Vendor — Attribute List 3 employees * 3 hrs 630* $70
4.Administrator for one session 4 hrs * $50/hr 200
5. Potential users 10 * 4 hrs * $70/hr 2800
Total 7340
6.1 Perceived Benefits
The perceived benefits due to the use of the DSS are relatively easier to calculate because they
are compared to the old method of making decisions by a single person or by a face-to-face
decision group. The benefits perceived are saving of time from discussions done in the past.
This statistic (of time) is an approximate figure from decision-making discussions held in the
past. The other benefit is that of having chosen a database system that were useful to a
department rather than the one that is not (which would have been chosen using a face-to-face
discussion/individual decision). This is estimated by questioning each department of how
many systems that they perceived useful were added or those not useful were removed. The
64

saving from removing an old system or the benefit (perceived profits from a single system)
from adding a new system is calculated. The gross estimate of profits yielded with the choice
of the new set of databases is assumed to have been calculated (predicted earnings).
Table 16 Table for perceived profits and savings (benefits)
Description Cost in $ /
year
1. Time saved 10 decision makers * 32 hrs * $70/hr 22,400
2. Removal of old academic database systems — 2 system * $2,000,000/system 4,000,000
3. Addition of one new academic database system — 1 system * -2,000,000$2,000,000/system
4. Perceived profit from the services of the new system 200,000
Total 4,022,400
From this the a simple cost/benefit ratio [27] can be calculated as follows:
Cost = $ 35,520
Benefit = $ 4,022,400 / year
Cost/benefit ratio = 8.83 * 10 -3
This is a very low cost to benefit ratio or a very high benefit to cost ratio. This means
that the profit or benefit incurred from the use of the DSS is very high. If selections are done
every year then the following can be deduced. The benefits exceeded costs for the year when
65

the DSS was built. The next year onwards there will be no development or testing costs. The
profits will be calculated based only on the cumulative savings as shown above.
66

CHAPTER 7
CONCLUSIONS
The solution to making selections is therefore first evaluating the software or system at hand.
The next step is to analyze the results of the evaluation. If the evaluation was quantitative then
the numbers generated from the evaluation must be assessed. The numerical data generated
from the various methods of data analysis must be interpreted correctly. Firstly the data
generated from the DSS uses pessimistic averaging. Hence the lowest values are taken into
consideration when averaging. The numeric values generated from such an evaluation are
considered as absolute for systems being evaluated. A method to assess the advantages or
disadvantages of using the DSS as against FTF or an individual evaluation of the system has
been shown.
Quantitative evaluations are much preferred in decision making when there is ample of
available time to assess the software because the use of quantitative evaluations for much detail
oriented work for analyzing systems, such as the use of statistical methods. Qualitative
methods are suggested to be used when systems are relatively less complex and easy to use. It
has been discussed earlier how the analysis of user-interface can be done using an algorithm to
assess each dimension of the interface.
One must bear in mind that for a user-interface evaluation a dimension may not exist
and the evaluation may not yield correct results. Hence it is important that all dimensions of
67

the user-interface analyzed qualitatively. Finally the use of qualitative and quantitative methods
Finally the use of qualitative and quantitative methods is purely dependent on the problem at
hand.
68

APPENDICES
Appendix A: The Consent Form - The consent for conducting protocol analysisAppendix B: Instructions for the Subject — Instructions for protocol analysis subjectsAppendix C: Task List — The lists of tasks for protocol analysis subjectsAppendix D: Interview Questions and Subjects for Protocol Analysis-
A Post-task questionnaire given to all protocol analysis subjectsAppendix F: Individual Test Results — Results of protocol analysisAppendix G: DSS output for Decision Maker inputs — User Inputs during a decision
making session with the DSSAppendix H: DSS output for Final Decision Matrix — DSS output in the form of
final decision matrix for the systems being analyzed
69
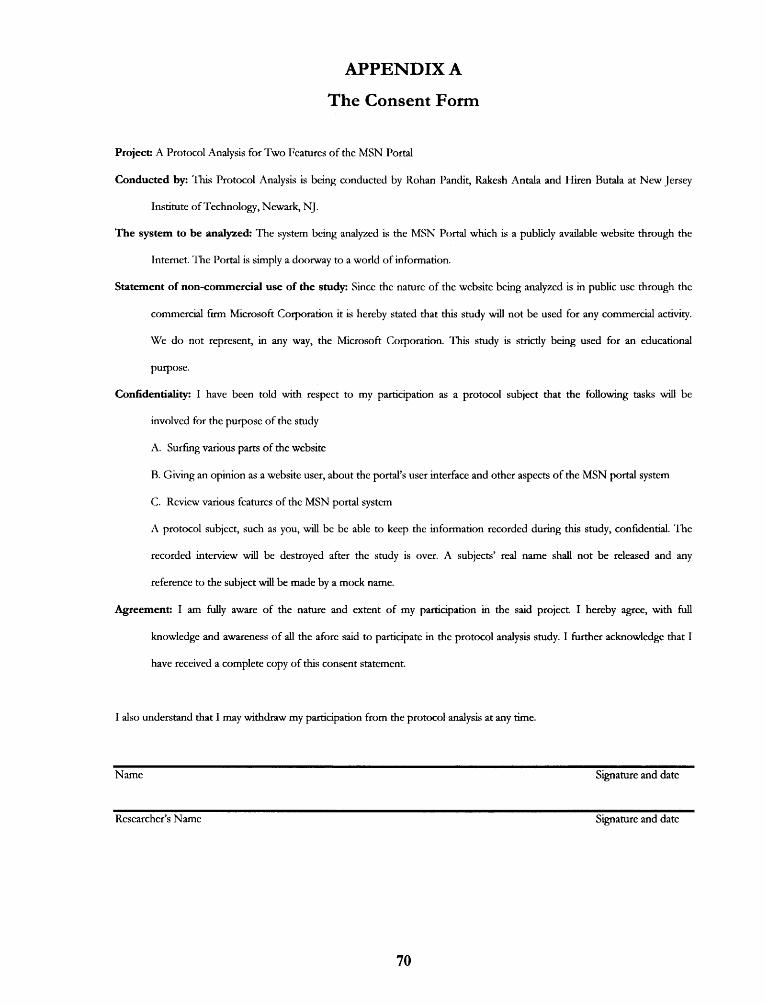
APPENDIX A
The Consent Form
Project: A Protocol Analysis for Two Features of the MSN Portal
Conducted by: This Protocol Analysis is being conducted by Rohan Pandit, Rakesh Antala and Hiren Butala at New Jersey
Institute of Technology, Newark, NJ.
The system to be analyzed: The system being analyzed is the MSN Portal which is a publicly available website through the
Internet. The Portal is simply a doorway to a world of information.
Statement of non-commercial use of the study: Since the nature of the website being analyzed is in public use through the
commercial firm Microsoft Corporation it is hereby stated that this study will not be used for any commercial activity.
We do not represent, in any way, the Microsoft Corporation. This study is strictly being used for an educational
purpose.
Confidentiality: I have been told with respect to my participation as a protocol subject that the following tasks will be
involved for the purpose of the study
A. Surfing various parts of the website
B. Giving an opinion as a website user, about the portal's user interface and other aspects of the MSN portal system
C. Review various features of the MSN portal system
A protocol subject, such as you, will be be able to keep the information recorded during this study, confidential. The
recorded interview will be destroyed after the study is over. A subjects' real name shall not be released and any
reference to the subject will be made by a mock name.
Agreement: I am fully aware of the nature and extent of my participation in the said project. I hereby agree, with full
knowledge and awareness of all the afore said to participate in the protocol analysis study. I further acknowledge that I
have received a complete copy of this consent statement.
I also understand that I may withdraw my participation from the protocol analysis at any time.
Name Signature and date
Researcher's Name Signature and date
70

APPENDIX B
Instructions for the Subject
Overview
Thank you for volunteering to assist with the protocol analysis. The system that has been chosen for this study is the popular
msn portal. A portal is a doorway to a to a world of information. A portal is supposed to be rich with information and is mean
to be for just about anybody who wishes to use it. The major functions of a portal are to provide its' audience with a content
that is rich in information. A portal may have some of the most common sources of information such as news, entertainment,
media, educations, special features, search features and a whole range of web features such as games, chat email, online
organizers and much more. The system that is being studied as has been said before is the msn portal. The msn portal has a
wide range of features including the afore said.
What the user is expected to do
As a subject to this study you will be expected to do certain number of given tasks. The tasks will be to work with the different
features of this portal. The tasks have been predefined for you. These tasks will require the use of standard tools such as a
mouse, keyboard, monitor and the computer in order for you to accomplish them. The tasks involve navigating an Internet site
for content. During this session you will be verbalizing about what you are doing while you are doing it. This means that while
you are clicking on a link to go to the next page you will speak out loud that you are doing so. Another example is when you are
lost or not finding your way around the website you would want to say for instance that I'm having a difficulty getting around
the site.
Your interaction with the system
While dealing with the system you are expected to speak out loud each action that you are doing. Though it is not expected that
you give a very highly detailed account of what you are thinking, however you should give a clear picture of what you are trying
to accomplish and what you are currently doing at every instance. Your interaction with the system is most crucial to the study
and hence you are requested to speak up at every point whether it is easy for you to get around i.e. navigate through the site or
when it is difficult for you to do so. At times when you are stuck you may ask for help. About how help will be provided is said
in the following section named assistance. You will be interacting with the system like you normally do and there is nothing
very special or different about how you will do it here.
71

Assistance and Communicating with the researcher
Assistance about how to get around a certain problem will be provided by me. However assistance will not be provided soon as
I find that you arc stuck. You will be allowed to think for a while and then if you really cannot get through with the task then I
will show you how to proceed. This does not mean that I will explain the entire procedure of the task. This also does not mean
that you are being tested. The tasks are simple day-to-day activities that one does on the web and hence it will be likely that you
will need little assistance accomplishing the tasks.
About recording the session over tape
While you are doing your tasks and verbalizing each of your actions I will be recording your voice on the tape. Even our
interaction will be recorded. In short the entire session will be recorded on tape. The recorded conversation will be used to later
prepare a transcript and analyze your interaction with the system. You will not be identified throughout the presentation report
of the study.
Tell us about the system
The study is about analyzing the system with respect to responses given by users like you. This is not a test of your knowledge
about the system if you happen to know it. This is also not to test your speed of doing the tasks. The study requires you to do
your tasks just the way you would have done normally in order for us to evaluate the system correctly. Hence you must tell
about the system and what you feel about it as you go. Report any problems that you encounter. Also report anything that you
find is unusual. It is therefore best to be as natural as possible and only to keep in mind that you will verbalize clearly as you do
your tasks.
72
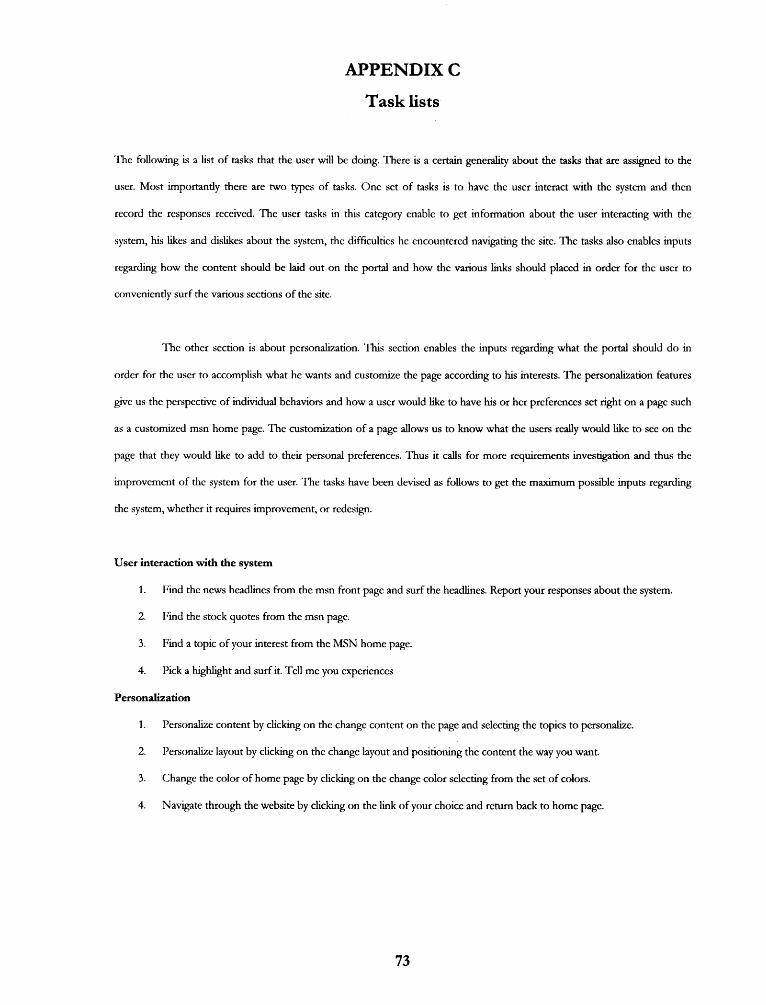
APPENDIX C
Task lists
The following is a list of tasks that the user will be doing. There is a certain generality about the tasks that are assigned to the
user. Most importantly there are two types of tasks. One set of tasks is to have the user interact with the system and then
record the responses received. The user tasks in this category enable to get information about the user interacting with the
system, his likes and dislikes about the system, the difficulties he encountered navigating the site. The tasks also enables inputs
regarding how the content should be laid out on the portal and how the various links should placed in order for the user to
conveniently surf the various sections of the site.
The other section is about personalization. This section enables the inputs regarding what the portal should do in
order for the user to accomplish what he wants and customize the page according to his interests. The personalization features
give us the perspective of individual behaviors and how a user would like to have his or her preferences set right on a page such
as a customized msn home page. The customization of a page allows us to know what the users really would like to see on the
page that they would like to add to their personal preferences. Thus it calls for more requirements investigation and thus the
improvement of the system for the user. The tasks have been devised as follows to get the maximum possible inputs regarding
the system, whether it requires improvement, or redesign.
User interaction with the system
1. Find the news headlines from the msn front page and surf the headlines. Report your responses about the system.
2. Find the stock quotes from the msn page.
3. Find a topic of your interest from the MSN home page.
4. Pick a highlight and surf it. Tell me you experiences
Personalization
1. Personalize content by clicking on the change content on the page and selecting the topics to personalize.
2. Personalize layout by clicking on the change layout and positioning the content the way you want.
3. Change the color of home page by clicking on the change color selecting from the set of colors.
4. Navigate through the website by clicking on the link of your choice and return back to home page.
73

APPENDIX D
Interview questions and Subjects for Protocol Analysis
The following are a set of post task questionnaire questions. They are designed to get the user opinion about the overall
functioning of the system. About how the user felt the system was, about what he/she felt was confusing and not appropriate
that made the part of the system unusable. The interview questions are asked after the user finishes all the tasks and hence has
an overall view of the system or the part of the system being analyzed. This is the most crucial part of the study. The responses
obtained through this post- task questionnaire are used to suggest improvements or keep the current system up with some or
no changes. The responses to these help especially in pointing parts of the system that require extensive redesign and
unification with other parts of the system.
The responses also call for considering the system from the user perspective than more from just a design perspective in which
user tasks or trails of tasks are usually assumed since at every point of the design the user is not present to give his/her inputs
regarding how he/she will do things. This post-task questionnaire is therefore very useful for us to indicate what were the
unidentified issues during system design that led the user to a wrong path or were correctly designed and must be kept so that
the user will find that functionality each time he visits the system. This also means that the parts of the system that the user felt
right must be maintained in the right way and must not be scrapped out to give way to other pieces of functionality or feature.
The system has been liked for that feature and must be therefore consistent across time.
Questionnaire for User content Interaction and Personalization of the system
1.What was most valuable with the system?
2.What was confusing in the system?
3.What was missing in the system?
4.What was not useful?
5.What was the utility of some of the feature interactive highlights encountered in the system?
6.How well the system supports your given tasks?
Subjects
Subject Age Sex I. T. Experience Interest in Web Portals ResearcherA 23 M Semi-expert Yes Rohan PanditB 24 M Expert Less Rohan PanditC 27 M Expert Yes Hiren ButalaD 25 M Expert Yes Hiren ButalaE 31 M Expert Less Rakesh AntalaF 23 F Novice Yes Rakesh Antala
74

APPENDIX E
Individual Test Results
Test Results for subject B (Final)
Background of the subject
This subject was an expert web user. He uses most features of the web. Therefore he knows the ins and outs of the web. This
subject was even used user interface jargon like functionality and usability to my surprise. According to him he uses the web
usually to surf for content, to email his friends and visits new sites very frequently. Thus he has the knowledge about what a
web is made of and the various components that go into making the web pages. Therefore it was an interesting experience to
have him as a protocol subject to a set of primitive tasks. His comments were also interesting.
Summary of Experience
This subject knew a whole lot about web pages, portals and their design and pointed out every small aspect of the system where
there were misnomers, problems, missing functionality and unusable features in a flash. His experience was pleasant with the
system. He encountered a lot of good and bad features, which made the system appear to him as a fairly okay system at times
and very good at times.
Positive Aspects of the System
He found the interface was good and the colors and design used in making the web site was pleasing. On many pages he
mentioned of things being in places they should be, like links and menu systems. He mentioned of good content being shown
to him. The content was the major focus of the study wherein the user was meant to interact with the content presented to
him. That there was satisfaction in viewing the content is a positive aspect of the system, which would not require any redesign
or improvement. He found that the entertainment section was good and that he liked the task where he was asked to look for
and read movie reviews.
Difficulties Encountered with the system
He also presented a negative account of the system besides the positive. He mentioned that it was confusing at first to find the
news page and he was expecting to find US News but he was led to a page with links that he found confusing. Hence the links
on this page were confusing for him. There were bad fonts at places.
75

User Comment and Suggestions
He mentioned that some links for navigation were named 'next' and 'previous' to lead the page's users to the following or
preceding page of content. However he did not like this naming convention and said that they should be changed to something
more meaningful in nature such as 'next story' or 'complete story' for a news item. He also found that some pages had
streaming media and he would have liked them to be displayed to him via the page itself rather than pop-up windows. He also
did not like places in the site where the site requested to personal information. He also noticed that updates on stocks did not
occur real time(however this site was not meant to be a stock specialist).
Evaluator's Comments and Suggestions
From observing the user's interaction with the system what he found most appealing was the font and color and layout on
many pages. He admitted to have seen good content through the breadth of the site. I would suggest that msn keep up with the
good work of providing content that is liked by users such as this subject. Also it is suggested that some web features be laid
out in the fashion that user's would perceive right. This calls for fixing site bugs such as avoiding asking for personal
information when it is not really necessary, avoiding too many pop-up windows that distract the user and take up system
resources on the client's machine. Also it is suggested that the page be up to date for such expert users as this subject.
76

APPENDIXF
DSS Output for Decision Maker inputs
Below is a transcript of a users' session with the DSS. The ratings were placed on a worksheet and data was entered from it into
the system. This is the stage where ratings are entered by the decision maker.
*****WELCOME TO THE DECISION-MAKING SYSTEM FOR LIBRARY DATABASES*****
Enter total number of vendors: 2 Enter the name for vendor 1: ocean Enter the name for vendor 2: skymount
Enter total number of attributes: 2 Enter the name for attribute 1: . ill Enter the name for attribute 2: oclc
Enter total number of decision makers: 2
*--INSTRUCTIONS--* Enter values from the rating matrix for the following VENDOR-ATTRIBUTE pairs.
Enter the Decision-Maker number from the top-left of the rating sheet: 1
77

Writing your input to file RATINGSHEET1ocean-ill: 2skymount-ill: 3ocean-oclc: 4skymount-oclc: 5
Verify matrix values. Correct any: y/n? yEnter row #: 1Enter col #: 2Enter new value: 6Correct another value? nEnter weight for ill: 6
Enter weight for oclc: 8
Verify weight values. Correct any: y/n? yEnter attr #: 1Enter new value: 9Correct another value? n
ocean skymount2.000000 6.000000
oclc 4.000000 5.000000Enter the Decision-Maker number from the top-left of the rating sheet: 2
Writing your input to file RATINGSHEET2ocean-ill: 3skymount-ill: 4ocean-oclc: 2skymount-oclc: 1
writing to file done
Verify matrix values. Correct any: y/n? nEnter weight for ill: 5
Enter weight for oclc: 4
Verify weight values. Correct any: y/n? nocean skymount3.000000 4.000000
oclc 2.000000 1.000000writing to file done
Enter y at the prompt to exit: y
78

APPENDIXG
DSS Output for Final Decision Matrix
Here is an output from the computational module. The final decision matrix is seen the second to last line.
opened RATINGSHEET1 opened RATINGSHEET2
prnmatrix: 1.250000 3.750000
2.250000 4.250000
FINAL RATED MATRIX:
19.812500 16.562500
closed RATINGSHEETl closed RATINGSHEET2 End Press any key to continue

REFERENCES
1. Aiken, M. W., Liu Sheng, 0. R. and Vogel, D. R., "Integrating Expert Systems WithGroup Decision Support Systems", ACM Transactions on Information Systems,Vol. 9, no. 1, January 1991.
2. Alavi, M., "An Assessment of The Prototyping Approach to Information SystemsDevelopment", Communications of the ACM, Vol. 27, no. 6, June 1984.
3. Bailey, J. E., and Pearson, S. W., "Development of a Tool for Measuring andAnalyzing Computer User Satisfaction", Management Science, May 1983.
4. Barki, H. and Hartwick, J., "Measuring User Participation, User Involvement andUser Attitude", MIS Quarterly, March 1994.
5. Blair, D. C. and Maron, M. E., "An Evaluation of Retrieval Effectiveness for a Full-Text Document-Retrieval System", Communications of the ACM, March 1985.
6. Chin, J., Diehl, V. and Norman, K., "Development of an Instrument Measuring UserSatisfaction of the Human-Computer Interface", ACM CHI 1988 Proceedings.
7. Clemons, "Evaluation of Strategic Investments Information Technology",Communications of the ACM, January 1991.
8. Connolly, T., Jessup, L. M., and Valacich, J. S., "Effects of Anonymity andEvaluative Tone on Idea Generation in Computer-Mediated Groups", ManagementScience, June 1990.
9. DeSanctis, G. and Gallupe, B., "A Foundation or The Study of Group DecisionSupport Systems", Management Science, Vol. 33, 1987.
10. Dickson, G. W., DeSanctis, G. and McBride, D. J., "Understanding TheEffectiveness of Computer Graphics for Decision Support", Communications of theACM, January1986.
11. Gerson, M., Chien, I. S. and Raval, V., "Computer Assisted Decision SupportSystems: Their Use in Strategic Decision Making", Communications of the ACM,1992.
12. Gogus, 0. and Boucher, T. 0., "Fuzzy NCIC", The Engineering Economist, Vol.43,no. 3, Spring 1998.
80

81
13. Goodwin, N. C., "Functionality and Usability", Communications of the ACM, March1987.
14. Hoadley, E., "Investigating the Effects of Color", Communications of the ACM,Vol. 33, no. 2, February 1990.
15. Hutchinson, M. 0., "The Use of Fuzzy Logic in Business Decision-Making",Derivatives Quarterly, Vol. 4, no. 4, Summer 1998.
16. Jessup, L. M. and Tansik, D. A., "Decision Making in an Automated Environment:The Effects of Anonymity and Proximity with a Group Decision Support System",Decision Sciences, Vol. 22, 1991.
17. Karan, V., Kerr, D.S., Murthy, U.S. and Vinze, A. S., "Information TechnologySupport for Collaborative Decision Making in Auditing: An ExperimentalInvestigation", Decision Support Systems, Vol. 16, 1996.
18. Kerr, D. S., and Murthy, U. S., "Group Decision Support Systems and Co-operativeLearning in Auditing: An Experimental Investigation", Journal of InformationSystems, Vol. 8, no. 2, 1994.
19. Kling, R., "Social Analyses of Computing Theoretical Perspectives in RecentEmpirical Research", Computing Surveys, Vol. 12, no. 1, March 1980.
20. Lederer, A.L., Maupin, D. J., Sena and M. P., Zhuang, Y, "The Role of Ease of Use,Usefulness and Attitude in the Prediction of World Wide Web Usage". ACM CPR1998.
21. Levi, M. and Conrad, F., "A Heuristic Evaluation of a World Wide Web Prototype",ACM Interactions, Jul- Aug. 1996.
22. Mantei, M. M.. and Teorey, T. J., "Cost/Benefit Analysis for Incorporating HumanFactors in the Software Lifecycle", Communications of the ACM, Vol. 31, no. 4, April1988.
23. McGrath, J. E., Groups: Interaction and Performance, Prentice Hall, Englewood Cliffs, NJ,1984.
24. Morrison, P., "A Survey of Attitudes Toward Computers", Communications of theACM, December 1983.
25. Norbert, F., "A Decision-Theoretic Approach to Database Selection in NetworkIR", ACM Transactions on Information Systems, Vol. 17, no. 3, July 1999.

82
26. Ocker, R., Fjermestad, J., Hiltz, S. R. and Johnson, K., "Effect of Four Modes ofGroup Communication on the Outcomes of Software RequirementsDetermination", Journal of Management Information Systems, Vol. 15, no. 1,summer 1998.
27. Rosenthal, R. and Rosnow, R. L., Essentials of Behavioral Research: Methods and DataAnalysis, McGraw Hill, 2nd Ed., 1991.
28. Singh, H. and Pandit, R.; "Integrated Library System Selection: A Fuzzy MulticriteriaDecision Support System" (Unpublished).
29. Stylianou, Madey & Smith, "Selection Criteria for Expert System Shells: A Socio-Technical Framework", Communications of the ACM, Oct. 1992.
30. Turoff, M. and Hiltz, S. R.,"http://eies.njit.edu/—turoff/coursenotes/CIS732/book/chapters/is1gc.http"