copyright by ravindra nath bhargava 2003
TRANSCRIPT

Copyright
by
Ravindra Nath Bhargava
2003

The Dissertation Committee for Ravindra Nath Bhargavacertifies that this is the approved version of the following dissertation:
Instruction History Management
for High-Performance Microprocessors
Committee:
Lizy K. John, Supervisor
Craig Chase
David Glasco
Stephen Keckler
Calvin Lin
Yale N. Patt

Instruction History Management
for High-Performance Microprocessors
by
Ravindra Nath Bhargava, B.S.E., M.S.E.
Dissertation
Presented to the Faculty of the Graduate School of
the University of Texas at Austin
in Partial Fulfillment
of the Requirements
for the Degree of
Doctor of Philosophy
The University of Texas at Austin
August 2003

This dissertation is dedicated to my wife, Lindsay, and my parents.

Acknowledgments
I would like to thank my lab mates for their help, insight, and time.
This academic journey would have been much less enjoyable if it were not
spent with friends. I give special gratitude to current and past members of the
LCA, Juan Rubio, Ramesh Radhakrishnan, Deepu Talla, Srivats Srinivasan,
and Madhavi Valluri, who made my research experience more fulfilling.
This work would not have been possible without encouragement and
assistance from my adviser, Prof. Lizy John. She has believed in me from day
one and I am grateful for her unconditional support. I also thank my commit-
tee, Prof. Craig Chase, Dr. David Glasco, Prof. Stephen Keckler, Prof. Calvin
Lin, and Prof. Yale Patt for sharing their time, friendship, and knowledge
with me. In addition to the members of my committee, UT-Austin professors
Brian Evans, Aleta Ricciardi, and Doug Burger have provided much needed
inspiration, motivation, and guidance over the last six years.
Thanks to Shirley, Debi, Linda, Melanie, and other administrative staff
for their hard work. Also, I would like to thank Prof. John Board and Prof.
Xiaobai Sun of Duke University for encouraging me to follow this path. In
addition, I gratefully acknowledge Intel Corporation and the University of
Texas for their generous financial support.
I thank my friends for never giving up on me and always keeping a smile
on my face. Finally, I would like to thank my parents, my siblings, Anil, Tina,
and Ashu, and my wife Lindsay for their love, support, and understanding.
This is not something I could have accomplished alone.
v

Instruction History Management
for High-Performance Microprocessors
Publication No.
Ravindra Nath Bhargava, Ph.D.The University of Texas at Austin, 2003
Supervisor: Lizy K. John
History-driven dynamic optimization is an important factor in improv-
ing instruction throughput in future high-performance microprocessors. History-
based techniques have the ability to improve instruction-level parallelism by
breaking program dependencies, eliminating long-latency microarchitecture
operations, and improving prioritization within the microarchitecture. How-
ever, a combination of factors, such as wider issue widths, smaller transistors,
larger die area, and increasing clock frequency, has led to microprocessors that
are sensitive to both wire delays and energy consumption. In this environment,
the global structures and long-distance communications that characterize cur-
rent history data management are limiting instruction throughput.
This dissertation proposes the ScatterFlow Framework for Instruction
History Management. Execution history management tasks, such as history
data storage, access, distribution, collection, and modification, are partitioned
and dispersed throughout the instruction execution pipeline. History data
packets are then associated with active instructions and flow with the instruc-
tions as they execute, encountering the history management tasks along the
vi

way. Between dynamic instances of the instructions, the history data packets
reside in trace-based history storage that is synchronized with the instruction
trace cache. Compared to traditional history data management, this Scat-
terFlow method improves instruction coverage, increases history data access
bandwidth, shortens communication distances, improves history data accuracy
in many cases, and decreases the effective history data access time.
A comparison of general history management effectiveness between the
ScatterFlow Framework and traditional hardware tables shows that the Scat-
terFlow Framework provides superior history maturity and instruction cover-
age. The unique properties that arise due to trace-based history storage and
partitioned history management are analyzed, and novel design enhancements
are presented to increase the usefulness of instruction history data within the
ScatterFlow Framework.
To demonstrate the potential of the proposed framework, specific dy-
namic optimization techniques are implemented using the ScatterFlow Frame-
work. These illustrative examples combine the history capture advantages
with the access latency improvements while exhibiting desirable dynamic en-
ergy consumption properties. Compared to a traditional table-based predic-
tor, performing ScatterFlow value prediction improves execution time and re-
duces dynamic energy consumption. In other detailed examples, ScatterFlow-
enabled cluster assignment demonstrates improved execution time over pre-
vious cluster assignment schemes, and ScatterFlow instruction-level profiling
detects more useful execution traits than traditional fixed-size and infinite-size
hardware tables.
vii

Table of Contents
Acknowledgments v
Abstract vi
List of Tables xii
List of Figures xiii
Chapter 1. Introduction 1
1.1 History-Driven Dynamic Optimization . . . . . . . . . . . . . . 2
1.2 Problems Faced In History Data Management . . . . . . . . . 6
1.3 The ScatterFlow Framework for Instruction History Management 8
1.4 Thesis Statement . . . . . . . . . . . . . . . . . . . . . . . . . 11
1.5 Dissertation Contributions . . . . . . . . . . . . . . . . . . . . 12
1.6 Organization . . . . . . . . . . . . . . . . . . . . . . . . . . . . 13
Chapter 2. Technology Constraints on History-DrivenOptimization 15
2.1 Traditional History Data Storage . . . . . . . . . . . . . . . . 15
2.2 Limitations of Traditional History Tables . . . . . . . . . . . . 17
2.2.1 Table Modeling Methodology . . . . . . . . . . . . . . . 18
2.2.2 Access Latency . . . . . . . . . . . . . . . . . . . . . . . 19
2.2.3 Energy Consumption . . . . . . . . . . . . . . . . . . . 22
2.3 Design Options . . . . . . . . . . . . . . . . . . . . . . . . . . 24
2.4 Related Work . . . . . . . . . . . . . . . . . . . . . . . . . . . 26
viii

Chapter 3. The ScatterFlow Framework for Instruction HistoryManagement 29
3.1 Overview . . . . . . . . . . . . . . . . . . . . . . . . . . . . . . 29
3.1.1 History Storage . . . . . . . . . . . . . . . . . . . . . . . 31
3.1.2 Instruction History Data . . . . . . . . . . . . . . . . . 34
3.1.3 A Framework Design . . . . . . . . . . . . . . . . . . . . 35
3.2 Implications of Framework Design Choices . . . . . . . . . . . 38
3.2.1 Performance . . . . . . . . . . . . . . . . . . . . . . . . 39
3.2.2 Complexity and Energy . . . . . . . . . . . . . . . . . . 42
3.3 Uses In Dynamic Optimization . . . . . . . . . . . . . . . . . . 45
3.3.1 Speculations . . . . . . . . . . . . . . . . . . . . . . . . 45
3.3.2 Optimization Hints . . . . . . . . . . . . . . . . . . . . 45
3.3.3 Instruction Profiling Support . . . . . . . . . . . . . . . 46
3.4 Related Work . . . . . . . . . . . . . . . . . . . . . . . . . . . 47
Chapter 4. Experiment Methodology 52
4.1 Performance Simulation Methodology . . . . . . . . . . . . . . 52
4.2 Baseline Microarchitecture Design Choices . . . . . . . . . . . 53
4.3 Impact of Baseline Parameter Choices . . . . . . . . . . . . . . 59
4.4 Benchmark Programs . . . . . . . . . . . . . . . . . . . . . . . 61
4.5 Metrics . . . . . . . . . . . . . . . . . . . . . . . . . . . . . . . 62
Chapter 5. History Management Effectiveness 67
5.1 Trace Storage Characterization . . . . . . . . . . . . . . . . . . 67
5.2 Path Information and Multiplicity . . . . . . . . . . . . . . . . 69
5.3 The Life of a History Data Packet . . . . . . . . . . . . . . . . 71
5.4 History Maturity . . . . . . . . . . . . . . . . . . . . . . . . . 73
5.5 Comparison to Traditional Tables . . . . . . . . . . . . . . . . 76
5.6 History Capture Effectiveness Discussion . . . . . . . . . . . . 80
5.7 Power Dissipation of the Framework . . . . . . . . . . . . . . . 84
ix

Chapter 6. Value Prediction Using the Framework 88
6.1 Background . . . . . . . . . . . . . . . . . . . . . . . . . . . . 88
6.2 Value Predictor Implementation Choices . . . . . . . . . . . . 90
6.3 Implementing Value Prediction Within The Framework . . . . 91
6.4 Methodology . . . . . . . . . . . . . . . . . . . . . . . . . . . . 94
6.5 Performance and Energy Analysis . . . . . . . . . . . . . . . . 95
6.5.1 Effects of Table Access Latency on Performance . . . . . 95
6.5.2 Comparing Prediction Strategies . . . . . . . . . . . . . 97
6.5.3 Energy Analysis . . . . . . . . . . . . . . . . . . . . . . 99
6.6 Related Work . . . . . . . . . . . . . . . . . . . . . . . . . . . 103
6.7 Discussion . . . . . . . . . . . . . . . . . . . . . . . . . . . . . 104
Chapter 7. Cluster Assignment Using the Framework 105
7.1 Background . . . . . . . . . . . . . . . . . . . . . . . . . . . . 105
7.1.1 Previous Cluster Assignment Work . . . . . . . . . . . . 105
7.1.2 Understanding Inter-Trace Data Dependencies . . . . . 107
7.2 Cluster Assignment Evaluation Methodology . . . . . . . . . . 110
7.3 Feedback-Directed Retire-Time Cluster Assignment . . . . . . 112
7.3.1 Pinning Instructions and the Assignment Strategy . . . 113
7.3.2 Collecting Inter-Trace Information Using The Framework 114
7.4 Results and Analysis . . . . . . . . . . . . . . . . . . . . . . . 116
7.4.1 ScatterFlow Performance . . . . . . . . . . . . . . . . . 116
7.4.2 Effects of Framework Hints on Assignment . . . . . . . 118
7.4.3 Improvements Over Previous Retire-Time Method . . . 120
7.5 Discussion . . . . . . . . . . . . . . . . . . . . . . . . . . . . . 122
Chapter 8. Execution Trait Profiling Using the Framework 124
8.1 Background . . . . . . . . . . . . . . . . . . . . . . . . . . . . 124
8.2 Implementing Within the Framework . . . . . . . . . . . . . . 126
8.3 History Capture Comparison . . . . . . . . . . . . . . . . . . . 128
8.4 Unique Detections . . . . . . . . . . . . . . . . . . . . . . . . . 130
8.5 Importance of Instruction Coverage . . . . . . . . . . . . . . . 133
8.6 Discussion . . . . . . . . . . . . . . . . . . . . . . . . . . . . . 133
x

Chapter 9. Framework Tuning and Enhancements 137
9.1 History Data Management Inefficiencies . . . . . . . . . . . . . 137
9.1.1 Update Lag . . . . . . . . . . . . . . . . . . . . . . . . . 137
9.1.2 Meaningless Updates . . . . . . . . . . . . . . . . . . . . 139
9.1.3 Block-Level Trace Builds . . . . . . . . . . . . . . . . . 140
9.2 Sensitivity Analysis . . . . . . . . . . . . . . . . . . . . . . . . 141
9.2.1 Trace Storage Size . . . . . . . . . . . . . . . . . . . . . 141
9.2.2 Fill Unit Latency . . . . . . . . . . . . . . . . . . . . . . 142
9.2.3 Machine Width . . . . . . . . . . . . . . . . . . . . . . . 147
9.3 Tuning Trace Storage and Update . . . . . . . . . . . . . . . . 149
9.3.1 Issue-Time Fill Unit . . . . . . . . . . . . . . . . . . . . 150
9.3.2 Atomic Traces . . . . . . . . . . . . . . . . . . . . . . . 152
9.3.3 Path Associativity . . . . . . . . . . . . . . . . . . . . . 155
9.4 History Management Enhancements . . . . . . . . . . . . . . . 158
9.4.1 Smart Update . . . . . . . . . . . . . . . . . . . . . . . 158
9.4.2 Victim History Cache . . . . . . . . . . . . . . . . . . . 161
Chapter 10. Conclusions and Future Work 165
10.1 Conclusions . . . . . . . . . . . . . . . . . . . . . . . . . . . . 166
10.2 Future Work . . . . . . . . . . . . . . . . . . . . . . . . . . . . 170
Bibliography 174
Vita 191
xi

List of Tables
4.1 Baseline Microarchitecture Simulation Configuration . . . . . 55
4.2 SPEC CINT2000 Benchmark Programs . . . . . . . . . . . . . 61
4.3 Inputs for SPEC CINT2000 Benchmark Programs . . . . . . . 62
4.4 Weights for History Maturity . . . . . . . . . . . . . . . . . . 65
5.1 Dynamic Trace Storage Characteristics for the Baseline Mi-croarchitecture . . . . . . . . . . . . . . . . . . . . . . . . . . 68
5.2 Average Fetched History Age (ScatterFlow Framework) . . . . 76
5.3 Size, Latency, and Storage of Analyzed Tables Relative to His-tory Storage . . . . . . . . . . . . . . . . . . . . . . . . . . . . 77
5.4 Potential Sources of History Data Latches . . . . . . . . . . . 86
5.5 Power Dissipation of ScatterFlow Framework . . . . . . . . . . 87
6.1 Configurations of Analyzed Value Predictors . . . . . . . . . . 94
6.2 Total Value Predictions and Value Prediction Accuracy . . . . 98
6.3 Energy Consumption for Analyzed Value Predictor Tables . . 100
6.4 Energy Consumption for On-Chip Caches . . . . . . . . . . . . 102
7.1 Frequency of Repeated Data Forwarding Producers . . . . . . 109
7.2 Frequency of Repeated Critical Inter-Trace Forwarding Distances110
7.3 Sources of History Data Latches for ScatterFlow Cluster As-signment . . . . . . . . . . . . . . . . . . . . . . . . . . . . . . 116
7.4 Data Forwarding Distance for Critical Inputs . . . . . . . . . . 119
7.5 Dynamic Per Trace Profiled Leader and Follower Averages . . 121
8.1 Potential Sources of History Data Latches . . . . . . . . . . . 128
9.1 Change In Trace Storage Characteristics Using Atomic Traces 153
9.2 Path Associativity Effects on Trace Storage . . . . . . . . . . 157
xii

List of Figures
1.1 Overview of Typical History Data Management . . . . . . . . 3
1.2 Overview of the ScatterFlow Framework . . . . . . . . . . . . 9
2.1 A Traditional PC-Indexed History Data Table . . . . . . . . . 16
2.2 Effects of Ports and Associativity on Table Access Latency . . 20
2.3 Effects of Block Size on Table Access Latency . . . . . . . . . 21
2.4 Effect of Ports and Associativity on Per-Access Energy . . . . 23
2.5 Effect of Block Size on Per-Access Energy . . . . . . . . . . . 24
2.6 Latency and Energy Required To Access 64 Bytes from a Table 25
3.1 Example of a ScatterFlow History Data Packet . . . . . . . . 34
3.2 History Data Flow in the ScatterFlow Framework . . . . . . . 36
4.1 The Pipeline of the Baseline Microarchitecture . . . . . . . . . 54
4.2 Organization of an Execution Cluster . . . . . . . . . . . . . . 58
4.3 Applying History Maturity Weights to History Age . . . . . . 65
5.1 Unique Dynamic Trace Blocks Per Static Instruction . . . . . 71
5.2 Percentage of Retired Instructions Built into the Most CommonTrace Blocks . . . . . . . . . . . . . . . . . . . . . . . . . . . . 72
5.3 Number of Unique Dynamic Trace Blocks Per History Packet . 73
5.4 Fetched History Age Using the ScatterFlow Framework . . . . 74
5.5 Fetched History Age Using a 4096-Entry Traditional Table (In-finite Ports) . . . . . . . . . . . . . . . . . . . . . . . . . . . . 77
5.6 ScatterFlow History Maturity and Instruction Coverage Versusa 4096-Entry Table (Four Ports) . . . . . . . . . . . . . . . . . 79
5.7 ScatterFlow History Maturity and Instruction Coverage Versusa 4096-Entry Table (Infinite Ports) . . . . . . . . . . . . . . . 80
5.8 ScatterFlow History Maturity and Instruction Coverage Com-parisons for 1024-entry and 16k-entry Tables (Four Ports) . . 81
xiii

5.9 ScatterFlow History Maturity and Instruction Coverage Com-parisons for 1024-entry and 16k-entry Tables (Infinite Ports) . 82
6.1 ScatterFlow Value Prediction History Data Packet . . . . . . . 92
6.2 Performing Value Prediction Using the ScatterFlow Framework 93
6.3 Effect of Table Access Latency on Performance . . . . . . . . . 96
6.4 Performance Comparison of Value Prediction Strategies . . . . 97
6.5 Access Frequencies for Tables Related to Value Prediction . . 100
6.6 Normalized Energy Consumption of Value Predictors and On-chip Caches . . . . . . . . . . . . . . . . . . . . . . . . . . . . 102
7.1 A Processor with Clustered Execution Resources . . . . . . . . 106
7.2 ScatterFlow Cluster Assignment History Data Packet . . . . . 115
7.3 Speedup Due to Cluster Assignment Strategy . . . . . . . . . 117
7.4 Key Data Dependencies in ScatterFlow FDRT Cluster Assignment120
8.1 Execution Trait Detection History Data Packet . . . . . . . . 127
8.2 Execution Trait Detection Using the ScatterFlow Frameworkand 4096-Entry Traditional Tables Normalized to an Infinite-Sized Table . . . . . . . . . . . . . . . . . . . . . . . . . . . . 129
8.3 Breakdown of Unique Execution Trait Detections . . . . . . . 131
8.4 Execution Trait Detection Coverage for the Most FrequentlyExecuted Instructions . . . . . . . . . . . . . . . . . . . . . . . 134
9.1 Number of Fetches to a Trace Between Updates . . . . . . . . 139
9.2 Effect of Trace Storage Size on Instruction Coverage . . . . . . 141
9.3 Effect of Trace Storage Size on History Maturity . . . . . . . . 143
9.4 Effect of Fill Unit Latency on Instruction Coverage . . . . . . 144
9.5 Effect of Fill Unit Latency on History Maturity . . . . . . . . 146
9.6 Effect of Fill Unit Latency on ScatterFlow Value Prediction . 147
9.7 Effect of Fill Unit Latency on ScatterFlow Cluster Assignment 147
9.8 Effect of an Eight-Wide Machine on History Maturity and In-struction Coverage . . . . . . . . . . . . . . . . . . . . . . . . 149
9.9 Effect of a 32-Wide Machine on History Maturity and Instruc-tion Coverage . . . . . . . . . . . . . . . . . . . . . . . . . . . 150
xiv

9.10 Effect of an Issue-Time Fill Unit on History Maturity and In-struction Coverage . . . . . . . . . . . . . . . . . . . . . . . . 151
9.11 Percentage of Once-Updated History Traces Using an Issue-Time Fill Unit . . . . . . . . . . . . . . . . . . . . . . . . . . . 152
9.12 Effect of Atomic Traces on History Maturity and InstructionCoverage . . . . . . . . . . . . . . . . . . . . . . . . . . . . . . 154
9.13 Change in Exact Trace Match Percentage Using Atomic Traces 155
9.14 Percentage of Once-Updated History Traces Using Atomic Traces156
9.15 Effect of Path Associativity on History Maturity and Instruc-tion Coverage . . . . . . . . . . . . . . . . . . . . . . . . . . . 157
9.16 Effect of Smart Update on History Maturity and InstructionCoverage . . . . . . . . . . . . . . . . . . . . . . . . . . . . . . 159
9.17 Applying Smart Update to ScatterFlow Value Prediction . . . 160
9.18 Applying Smart Update to Execution Trait Detection . . . . . 161
9.19 Effect of a Victim History Cache on History Maturity . . . . . 163
9.20 Effect of a Victim History Cache on ScatterFlow Value Predic-tion Performance . . . . . . . . . . . . . . . . . . . . . . . . . 164
10.1 Flexible Dynamic Tuning Using the ScatterFlow Framework . 171
xv

Chapter 1
Introduction
Microprocessor performance has continually improved due to innova-
tions in manufacturing technology and microarchitecture design. Clock fre-
quency improvements increase the rate at which instructions are processed.
Transistors are becoming smaller and faster. In addition, increasing chip area
and transistor density provide a wealth of resources for general-purpose mi-
croprocessors [15].
As these microprocessor trends continue, the key to improving instruc-
tion throughput with a fixed clock frequency is to increase the number of in-
structions being simultaneously processed. Increasing the instruction width of
the microarchitecture is one way to increase instruction-level parallelism [91].
Wide instruction design involves increasing the resources at each stage of in-
struction processing to allow more instructions to proceed in parallel.
Modern microprocessors take advantage of these available design im-
provements, but new microarchitecture design challenges are surfacing, such as
improving the utilization of execution resources and dealing with the complex-
ity of wire delay-dominated design [12, 73, 85]. To improve resource utilization
and instruction throughput, history-driven optimization techniques are used
to overcome barriers in the program flow and instruction execution. Almost
all modern microprocessors use some history-based speculation to predict dy-
namic instruction behavior, and the degree of history-based speculation is
1

expected to increase [41, 68].
The increasing impact of wire delay has changed basic design assump-
tions for many history-driven microarchitecture mechanisms. These history-
based techniques depend on quickly accessing instruction-level history infor-
mation collected in hardware tables during execution. Accessing this history
data in the traditional manner has become costly in both time and energy, and
can be detrimental to instruction throughput [2, 7, 52]. If these design and
technology trends continue, these problems will only get worse in the future.
In this dissertation, a design approach is presented to improve the per-
formance of history-based dynamic optimization techniques for future micro-
processors. The proposed framework directly associates history data with
instructions in the instruction storage, and the history data remains with the
instructions as the data flow through a decentralized history management sys-
tem. This strategy allows low-latency access to history data for a large per-
centage of instructions, while reducing the dependence on long communications
and long-latency data table accesses.
1.1 History-Driven Dynamic Optimization
Recently observed execution behavior has proven to be a good indica-
tor of future execution behavior. Many dynamic optimization techniques in
modern microprocessors take advantage of this concept. For example, effec-
tive data caching improves the latency of acquiring stored data by assuming
recently used data will be used again soon. A correct branch prediction elim-
inates pipeline bubbles by guessing the branch direction and target based on
the behavior of the same branch in the past [109].
2

Current History Data Management Many history-driven techniques mon-
itor behavior at the instruction level. The history data management process
is illustrated in Figure 1.1 and explained below. The enumerated list matches
the circled numbers in the figure.
history accessinstruction−level
fetch instructions
INSTRUCTION MEMORY
HISTORYTABLE
EXECUTION CORE
PERFORMOPTIMIZATION
NEW INSTRUCTION BEHAVIOR UPDATEHISTORY
24
85 6 7
91
3
Figure 1.1: Overview of Typical History Data Management
1. As the execution core processes the instructions, the instructions index
the history table using their unique instruction address. Instruction-
level history data are traditionally stored on a per-address basis so that
multiple dynamic instances of a static instruction build one complete
execution history.
2. The table uses the instruction indexes to identify the table entry that
corresponds to each instruction and the history data in these entries is
driven out of the table.
3

3. The history data are returned to the execution core.
4. The instruction-level history data may be used directly, or converted
into a more manageable format for the optimization logic. Either way,
the delivery of the history data to the execution core allows the history-
driven optimization to be performed on the instructions.
5. At some point during instruction processing, new execution behavior is
observed.
6. The new execution information and table indexing information are sent
to the table update logic.
7. To perform an update of the history data, the old data must be read
from the history data table.
8. The history data in the table entry are combined with the new behavior
to produce the most current history data information.
9. Finally, the table entry is updated with the most recently calculated
history information. When an instruction is fetched and executed again
(e.g., a loop or a sub-routine), updated history data are available in the
history table.
Current history-based techniques often rely on centralized history data
management and global hardware tables to provide history data for the in-
structions. In this dissertation, centralized refers to two aspects of traditional
history data management. First, there is a centralization in time, as tables
are consulted on-demand for history data access and history data update. For
example, note how the history management tasks are clustered around the
4

history data table in Figure 1.1. Second, the history data are contained only
in the global history data table and nowhere else. Therefore, instructions have
to consult the history tables to read or modify the history data. These aspects
of centralization place a heavy focus on the history data table.
History-Based Techniques There are several ways that history-driven op-
timization can improve the average instruction throughput. Speculatively
breaking program-imposed dependencies improves the instruction-level par-
allelism. For example, correctly predicting the result of an instruction com-
putation allows data dependent instructions to progress without waiting for
the actual computation of the data producer [69]. Successful speculations on a
branch direction and branch target allow instruction fetch mechanisms to fetch
further ahead and quickly fill the pipeline with useful instructions [62, 109].
Another use of history-driven techniques is to guide policies for caching,
instruction scheduling, and prioritization. While these techniques are not cre-
ating speculative behavior, they enhance instruction throughput by improving
resource usage and the pipeline progression of in-flight instructions. History-
driven optimization can also eliminate or reduce long-latency operations in the
microprocessor [57, 59, 92, 94]. In addition, prediction mechanisms have been
used for such tasks as coordinating dynamic reconfiguration [99], reducing
power [4, 43], and enhancing multi-threading [116].
History-based prediction of program behavior is not limited to mech-
anisms in the microarchitecture core. Numerous high-level performance op-
timization strategies have also been proposed. In this work, “high-level” de-
scribes optimization systems outside of the microarchitecture core that require
dynamic feedback about instruction behavior to improve the executing instruc-
5

tion stream. Instruction-level feedback manages many run-time optimization
environments such as dynamic compilers [3, 17, 21, 49, 66], binary transla-
tors [32, 60], and just-in-time compilers [30]. High-level run-time optimizers
can acquire instruction information from either software-based profilers or from
special hardware profiling support in hardware [46, 78, 125].
1.2 Problems Faced In History Data Management
A history-driven optimization achieves high performance by providing
accurate history data to all optimizable instructions. Therefore, an ideal his-
tory table would have a table entry for each instruction and be accessible each
clock cycle to as many instructions as necessary. In the recent past, these con-
ditions were mostly realizable, and many history-driven optimization strategies
are still proposed based on the assumption that large amounts of history data
are available with a small access penalty.
High clock frequencies, short pipeline stages, and smaller transistors
lead to processors that are dominated by wire delay [12, 73]. In this scenario,
the entire chip is no longer accessible in one clock cycle. Similarly, access-
ing large, cache-like, instruction-level storage tables (e.g., history data tables)
requires multiple cycles [2]. These latencies are problematic because a long
table access latency can weaken or eliminate the usefulness of speculation. If
accessing instruction history data and computing the prediction requires too
many cycles, the attacked execution inefficiency may resolve naturally before
a prediction can be completed.
In this environment, high-performance strategies that rely on large
global tables for accurate history data pay a high price for each table ac-
cess. When building data tables for history-driven performance mechanisms,
6

microprocessor designers must balance properties such as data accuracy and
instruction bandwidth with latency and power considerations. For example, a
reduction in table entries leads to multiple instructions mapping to the same
table entry and corrupting the history information [22, 114, 124], but more
entries also increase the table access latency. Reducing the number of access
ports can cause conflicts and prevent instructions that benefit from specula-
tion from ever accessing the history data table. On the other hand, more ports
also increase latency.
Energy consumption constraints can also limit the effectiveness of spec-
ulation. Power has become a primary design consideration [14, 44, 115], and
high-performance history data tables can potentially consume a significant
amount of dynamic energy. Table design decisions that improve performance,
such as increases in table entries and access ports, also lead to more energy con-
sumption. For example, this dissertation illustrates that a high-performance
value predictor consumes 4.3 times the dynamic energy as all of the on-chip
caches combined. A limited energy budget may result in reduced performance
for the sake of less energy consumption.
In a wide-issue environment, there is a trade-off between collecting
and accessing accurate history data and the latency and energy properties of
traditional hardware tables. The primary problems identified and attacked in
this dissertation are:
• History data tables are becoming less effective for history-driven opti-
mization in wide-issue, high-performance microprocessors because his-
tory data accuracy and instruction access bandwidth must be sacrificed
for lower latencies and reasonable energy consumption.
7

• Long-distance communications and global access of history data make
the design of traditionally-managed, history-driven techniques difficult
in wide-issue, high-performance microprocessors.
1.3 The ScatterFlow Framework for Instruction History
Management
To achieve better instruction throughput in future wide-issue micro-
processors, it is essential that history-driven optimizations deliver accurate
history data to as many instructions as possible. Therefore, the accumulation
and delivery of history data should be a fundamental design consideration.
The solution proposed in this dissertation is the ScatterFlow Framework for
Instruction History Management.
General Approach One goal of this microprocessor framework is to pro-
vide quick and efficient access to execution history data for a large percentage
of instructions. This goal is accomplished by associating history data with
instructions in a more direct manner for the duration of the instruction execu-
tion lifetime. Within the microarchitecture, each instruction is appended with
execution history data that flows with the instruction as it travels through
the pipeline. The history data are provided with intermediate storage along
the existing execution path where needed (e.g., instruction queue, reservation
station, reorder buffer, and load/store queues). When history-driven optimiza-
tion logic is encountered by the instruction in the pipeline, the history data are
immediately available for read or update. Upon completion of the instruction,
the updated instruction history data are placed in history storage.
A high-level picture of the ScatterFlow Framework is shown in Figure
8

1.2. ScatterFlow history data management begins early on in the instruction
pipeline, at the fetch stage. There is a one-to-one mapping between instruc-
tions in instruction storage (e.g., I1) and history data in the history storage
(e.g., H1). So when a group of instructions is fetched from the instruction
storage, a corresponding group of history data are fetched from the history
storage.
. . . . .I1 H1 I2 H2 In Hn
. . . . .I1 H1 I2 H2 In Hn
. . . . .I1 H1 I2 H2 In Hn
H1 H2 Hn. . . . .I1 I2 In. . . . .
. . .
. .
. . . . .H1 I2 In Hn
H1 H2 Hn. . . . .
I1 H2
RETIRE−TIMEFILL UNIT
STORAGEINSTRUCTION
STORAGEHISTORY
MODIFY
OPTIMIZE
READ
DELIVER
ACCESS
INDEX
EXECUTION CORE
WRITE STORAGE
Figure 1.2: Overview of the ScatterFlow Framework
When the instructions are prepared to execute, the history data are al-
ready delivered and directly associated with the instructions. As instructions
encounter history-driven optimizations, the history data are immediately avail-
able for read. Similarly, when an instruction exhibits new execution behaviors,
the history data are still associated with the instruction and modification takes
place locally.
The retire-time fill unit completes a feedback loop between the exe-
cution core and the history storage. The freshly modified history data from
9

completed instructions are sent to the fill unit and coalesced into new blocks
of history data. This procedure takes place off the performance critical path
and allows for complex updates without sacrificing performance [5, 39, 87].
The last step in the ScatterFlow history management is to write the history
data back into the history storage.
Comparison to Current History Management Instead of performing
history management tasks exactly when they are required, the ScatterFlow
Framework partitions history management tasks and spreads them out in both
time and space. History data are pre-emptively brought into the execution
core along with the instructions, and remain associated with the instructions.
History data are modified as they flow with the instructions without access
to a global history table. This flow of history data reduces much of the long-
distance communication that plagues current history management and global
history data tables.
By retrieving history data for multiple instructions with one access to
the history storage, the ScatterFlow style of history data storage reduces port
requirements compared with a traditional history data table. A traditional
history data table makes one access for each instruction that requires history
data. In addition, fewer table entries are required to represent the stored data
in the ScatterFlow Framework because history data for multiple instructions
are stored in one entry. Therefore, the history storage is providing full instruc-
tion access bandwidth for a large percentage of instructions without suffering
the latency and energy penalties associated with extra access ports and table
entries.
By “caching” the history data in a similar manner as the instructions,
10

stored history data also take advantage of the temporal and spatial locality
properties of their corresponding instructions. In this manner, the history
data for the most important instructions are made available. In addition, the
history data update scheme is performed on a “block” of history data. These
blocks can correspond to instruction basic blocks, but later chapters demon-
strate that the history data see additional benefits when they correspond to
traces of instructions [89, 93, 103].
The ScatterFlow Framework presents an instruction history data man-
agement strategy for history-based dynamic optimization, and it has the ability
to unify the design approach for multiple history-driven techniques (as dis-
cussed in Chapter 10). The ScatterFlow history storage provides low-latency,
high-bandwidth instruction execution history data for a large percentage of
important instructions without suffering the same latency and energy penal-
ties as traditional techniques. At the same time, the proposed framework
addresses future history data management scalability issues by trading long-
distance communications and global history data tables for flowing history
data.
1.4 Thesis Statement
Integrating history data management tasks into the instruction pipeline
and associating history data directly with instructions at all stages improve
the effectiveness of history-driven optimization in high-performance micropro-
cessors.
11

1.5 Dissertation Contributions
This dissertation examines the design challenges of instruction history
data management in the context of a high-performance microprocessor. To
capture and deliver accurate history data, traditional history data tables face
table access latency, communication latency, and energy consumption issues
that limit the effectiveness of history-driven optimization. The proposed Scat-
terFlow Framework for Instruction History Management addresses these limi-
tations by associating history data directly with instructions in the instruction
storage and flowing the history data with the in-flight instructions.
The ScatterFlow style of history management permits every instruction
fetched from the instruction storage to receive history data, and accomplishes
this high coverage with reduced port and table entry requirements. Conse-
quently, history data are available more frequently, with a lower latency, and of-
ten with lower energy requirements compared to traditional, high-performance,
port-constrained history data tables. The flowing of the history data enables
immediate access to history data for both read and modification, reducing the
dependence on long-distance communications to global history data.
This dissertation compares the general history capture effectiveness of
the proposed framework against that of traditional tables by evaluating in-
struction coverage and history maturity. The ScatterFlow Framework style of
history data storage and acquisition provides superior history capture effec-
tiveness compared to port-constrained traditional history data tables of simi-
lar area, similar latency, or similar data storage. In addition to the discussed
ScatterFlow advantages, some improvements are related to the implementa-
tion decision to use trace-based instruction and history storage, which provides
natural path-based information to the history data.
12

The ScatterFlow Framework design choices create advantages and dis-
advantages compared to traditional history data management. These trade-
offs are analyzed and this work finds that the ScatterFlow Framework is prefer-
able for history data management under most conditions. Decentralizing his-
tory management tasks and managing constantly-changing data in trace-based
storage result in unique issues, including history data packet multiplicity, up-
date dilution, block-based trace builds, history data trace evictions, update
lag, and meaningless updates. With these challenges in mind, design opti-
mizations and tuning are proposed to further increase the coverage, accuracy,
and maturity of instruction history data.
Finally, value prediction, cluster assignment, and execution trait de-
tection provide examples of implemented history-driven techniques that ex-
ercise different properties of the ScatterFlow Framework. In general, these
detailed and illustrative examples improve performance and display good dy-
namic energy consumption properties, especially when compared to dynamic
optimizations implemented with traditional history storage structures.
1.6 Organization
This chapter provided a high-level overview of this dissertation work,
including the importance of history-driven optimization, the problems faced
using traditional history data management methods, and the proposed Scat-
terFlow Framework for Instruction History Management. Chapter 2 further
motivates the necessity of a new approach to instruction-level history capture
and distribution. The general approach of the ScatterFlow Framework is out-
lined in Chapter 3. In addition, the chapter analyzes the design decisions,
and summarizes related design approaches. Chapter 4 outlines the experi-
13

ment methodology, baseline configuration, and performance metrics so that a
detailed characterization of the ScatterFlow Framework can be presented in
Chapter 5.
Chapters 6, 7, and 8 provide specific examples of how the proposed
framework can improve execution efficiency. The dynamic optimization tech-
niques implemented using the ScatterFlow Framework include value predic-
tion, cluster assignment, and execution trait detection. Each example is con-
cluded with a discussion of its ability to take advantage of the ScatterFlow
Framework. In Chapter 9, enhancements to the framework design are pro-
posed to tune the history capture ability. Finally, Chapter 10 contains the
concluding remarks and a discussion on future uses of the ScatterFlow Frame-
work.
14

Chapter 2
Technology Constraints on History-Driven
Optimization
Many history-driven microarchitecture techniques access instruction
history data stored in one or more hardware tables. This chapter discusses
the design of traditional history data tables, addresses typical table design as-
sumptions found in literature, and quantifies the effects of table design choices
on access latency and dynamic energy consumption.
2.1 Traditional History Data Storage
When a history-driven microarchitecture mechanism is proposed, the
speculation algorithm is often the focus of the work. The hardware tables
that capture the instruction-level history are idealized in many ways, and
modeled with aggressive assumptions. This research methodology allows novel
algorithms to be fully explored. While these assumptions have been mostly
valid in past generations of microprocessors, for the techniques to be viable in
future microprocessors, table design issues should be addressed.
Traditional history data tables are read and updated at the instruc-
tion level. Therefore, each entry is intended to contain history data for one
instruction. Figure 2.1 shows the common practice of indexing the table by
the low-order bits of the instruction’s address, or program counter (PC). The
15

. . .
.
. . .
.
Way 0 Way 1
tag data
tag
tag
data
data data
data
datatag
tag
tag. .
. .
Dec
oder
Instruction PC
0
N
1
N.0
N.1
=?
=?
Hit/Miss
Data Out
Res
ult
Figure 2.1: A Traditional PC-Indexed History Data TableThis figure represents the logical structure of a traditional PC-indexed table readaccess (write components not shown). The table is two-way associative with N lines,N*2 entries and one port. An instruction PC is fed to the decoder which selects aline in the table. If one way tag from the line matches, then there is a hit and thecorrect data are selected for output on the one port. Otherwise, there is a miss.
PC uniquely identifies the static instance of the instruction in the executing
program.
The history data tables can be designed in a similar manner to data
caches. For example, to improve efficiency, the table entries often contain a tag
and are organized in an associative manner. Also, there must be an available
access port for each instruction that intends to read or write the table in each
cycle. It is possible to design history data tables without the tags, which
reduces the energy, the latency, and the accuracy.
One typical assumption is that the data in a traditional hardware table
is accessible within one processor clock cycle from anywhere in the microar-
chitecture core. The process of accessing data includes delivering the inputs
to the table, indexing the table, selecting the data, driving the data from the
16

table, and delivering the data to the proper location in the processor. Per-
forming this activity in one cycle has been possible for many years. Even large
data and instruction caches have recently been accessible with only a one-cycle
delay.
Another common assumption is that table access ports can be freely
added. Put another way, as many instructions as necessary can simultaneously
access the table. One port is sometimes sufficient, but multiple access ports
are often needed. Techniques that require multiple parallel instruction access
are especially common in wide-issue environments.
The design of many proposed mechanisms does not restrict the number
of table entries and table associativity. If any limits are placed on either, it has
typically been due to considerations for area and complexity, not access latency
and energy consumption. While the size and associativity assumptions are not
realistic, they are useful for finding the maximum (or ideal) performance from
the analyzed mechanisms.
Previously proposed history-based dynamic optimization mechanisms
provide important contributions that have lasting impact regardless of the
underlying implementation. All the discussed table design assumptions were
made for good reasons. However, technology has changed such that key pre-
sumptions must be re-examined.
2.2 Limitations of Traditional History Tables
Rising clock frequencies, shrinking transistor sizes, and increasing tran-
sistor totals occur because they benefit the overall performance of modern
processors. However, these trends can also degrade the per-clock instruction
17

throughput that dynamic optimization mechanisms are attempting to increase.
This section estimates the latency and energy consumption effects of wide-issue
processing on traditional history data table design.
2.2.1 Table Modeling Methodology
Per-access latency and energy consumption are calculated for several
different hardware table configurations. Many data storage structures, such
as history tables, are designed as caches of untraditional dimensions and have
been modeled as such [2]. Therefore, the latency and energy estimations are
obtained using Cacti 2.0, an analytical cache modeling tool that creates a
cache configuration using latency and energy considerations [101]. The tool is
modified to choose configurations that produce the lowest latency.
A processor with a 100nm feature size technology, a 1.1 V power sup-
ply, and a 3.5 GHz clock frequency (0.2857 nanosecond clock period) is used
as the basis for all the following Cacti analysis. This technology point was
chosen according to projections from the Semiconductor Industry Association
(SIA) [108]. As the frequency continues to increase and the feature size con-
tinues to shrink, the projected latencies shown in this section will become even
more dramatic.
The Cacti tool has some modeling restrictions. For example, the min-
imum usable block size in this tool is eight bytes. This does not allow us to
model history data tables with less than eight bytes per entry. Also, Cacti 2.0
requires that one read/write port is modeled, but no more than two can be
used. For tables with more than two ports, the first two ports are modeled as
read/write ports and the remainder of the reported ports are modeled as one
write port. For example, a four-ported table is modeled with two read/write
18

ports and two write ports. Write ports are chosen to represent read/write ports
because they provide a similar sizing function, which results in a comparable
latency. However, this assumptions results in optimistic energy values.
2.2.2 Access Latency
The combination of small transistors and high clock frequencies pro-
mote a scenario where wire delay does not scale well relative to logic delay. It
is common for the width of wires that connect transistors to shrink as tran-
sistors get smaller. Without any other changes, a smaller width increases the
resistance of a wire, and an increased resistance can increase the wire delay.
There are strategies to reduce the resistance, but in practice these techniques
still do not allow wire speeds to keep pace with clock frequencies and transistor
size [73]. In addition, microprocessor dies sizes are increasing.
In this environment, large global structures, such as history data tables,
may take multiple clock cycles to access. History-based microarchitecture
speculations are supposed to provide an immediate resolution for a process that
typically takes much longer. Therefore, each clock cycle of delay imposed by
the history retrieval and prediction computation can reduce the usefulness of
the speculation. For example, in the programs studied in this dissertation, 33%
of integer operations are executed within four cycles after they are decoded.
History data tables accessed after decode that require more than four cycles of
latency have no opportunity to optimize this large percentage of instructions.
Figure 2.2a illustrates the access times for hardware tables of several
sizes versus the number of ports. Notice that the smallest structure in the fig-
ure, a 1024-entry table with one port, requires two cycles to access. Already,
the assumption of a one cycle access is no longer valid. These multi-cycle
19

latencies in the graphs do not even include the additional latency for selec-
tion logic, data routing, the update algorithm, or the compounded latency of
techniques that require serial accesses to multiple tables [74, 120, 121].
0.0000
0.5714
1.1428
1.7142
2.2856
2.8570
3.4284
1 2 4 8
Ports
Acc
ess
Late
ncy
(ns)
16k-entries8k-entries4k-entries2k-entries1k-entries
2
10
8
6
4
12
Clock
Cycles
0.0000
0.5714
1.1428
1.7142
2.2856
2.8570
1 2 4 8 16
Associativity
Acc
ess
Late
ncy
(ns)
16k-entries8k-entries4k-entries2k-entries1k-entries
2
10
8
6
4
Cloc
kC
ycles
a. Ports (One-way) b. Associativity (Four ports)
Figure 2.2: Effects of Ports and Associativity on Table Access LatencyThe block size for these tables is eight bytes.
As the table size increases, the latency consequences of building addi-
tional ports become increasingly severe. In an eight or 16-issue machine, eight
or more instructions could request history data from hardware tables in the
same cycle (e.g., value prediction, scheduling techniques). The graphs show
that a 16k-entry table with eight ports requires 12 cycles to access the data.
Figure 2.2b presents latency versus associativity with the number of
ports fixed at four. The associativity increase only costs one additional clock
cycle for configurations with two to eight ways since the port effects dominate
the delay.
Figure 2.3 presents the latency variability due to changing the block
size (i.e., the amount of data retrieved from the table) for tables with one port
and with four ports. For the table with one port, the penalty for retrieving
128 bytes per entry instead of eight bytes is as low as one cycle and at most
20

two cycles, depending on the number of entries. For the table with four ports,
the increase in block size has a more pronounced effect, especially for blocks
of 32 bytes and larger. As the number of entries increases, the penalty for
increasing the block size also increases.
0.0000
0.2857
0.5714
0.8571
1.1428
1.4285
8 16 32 64 128
Block Size (bytes)
Late
ncy
(ns)
4k entries2k entries1k entries512 entries
0
5
4
3
2
1
Cycles
0.0000
0.5714
1.1428
1.7142
2.2856
2.8570
3.4284
3.9998
4.5712
5.1426
8 16 32 64 128
Block Size (bytes)La
tenc
y(n
s)
4k entries2k entries1k entries512 entries
0
18
16
14
12
10
8
6
4
2
Clock
Cycles
a. One port b. Four ports
Figure 2.3: Effects of Block Size on Table Access LatencyThe tables are direct-mapped.
This analysis shows that the latency to access history data tables is
sensitive to the design parameters. The latency increases quickly as the num-
ber of ports and table entries are increased. Unfortunately, multiple ports and
high table entry counts result in more accurate data for more instructions, and
are critical to high performance in high-performance, wide-issue microproces-
sors. For certain scenarios, the block size and associativity can be increased
with a minimal change in latency. Therefore, adjusting block size and asso-
ciativity may be more suitable methods for increasing table performance in a
wire delay-dominated environment.
Finally, another component of latency that cannot be ignored is the
latency to communicate data to and from the history data tables. Currently,
the processor die is increasing in size, the clock period is decreasing, and logic
21

is getting faster, but the wire delays are not scaling in the same way [2, 12, 73,
85]. The result is that long-distance communications on the chip will require
multiple clock cycles. Aggarwal et al. demonstrate that only 10% of the die
may be reachable within one clock cycle at a 100nm technology point [2].
In a similar study, Matzke shows that only 13 of the die will be reachable
within two clock cycles and 23 of the die within four clock cycles at the same
technology point [73]. So in future processors, global communications will not
only be difficult and expensive to route, but their multi-cycle latencies must
be factored into performance decisions.
2.2.3 Energy Consumption
Dynamic processor energy consumption is a design constraint of in-
creasing importance. Always a concern for embedded processors, power con-
siderations are putting limitations on high-performance microprocessor de-
sign [14, 44, 115]. Whenever a large or complex piece of hardware is consid-
ered, it is useful to evaluate its dynamic energy properties as well. The table
entries, associativity, port count, and access frequency all directly affect the
energy consumption of hardware tables.
As an example, useful value predictors [69] are typically composed of
one or more large cache-like structures. Commonly studied table sizes range
from 8KB to 160KB and beyond. In each cycle, multiple instructions must
read and write to this structure to maintain high performance. During the
examined execution of the SPEC2000 integer benchmarks, 61% to 78% of
all instructions are candidates for value prediction. With this high level of
potential activity and complexity, a high-performance value predictor is found
to consume 4.3 times more dynamic energy than all of the on-chip caches
22

combined (see Chapter 6). This is an unacceptable level of energy consumption
for one history-driven technique.
The graphs in Figure 2.4 underscore the influence of ports and asso-
ciativity on energy consumption. Though increasing either design parameter
leads to an increase in energy, note that the scale for associativity is four
times that of the ports graph. These graphs confirm that steps to increase
performance can cost designers in energy consumption.
0
1
2
3
4
5
6
7
8
9
10
1 2 4 8
Ports
Ene
rgy
Per
Acc
ess
(nJ)
16k-entries8k-entries4k-entries2k-entries1k-entries
0
5
10
15
20
25
30
35
40
1 2 4 8 16
Associativity
Ene
rgy
Per
Acc
ess
(nJ)
16k-entries8k-entries4k-entries2k-entries1k-entries
a. Ports (direct-mapped) b. Associativity (four ports)
Figure 2.4: Effect of Ports and Associativity on Per-Access EnergyThe block size for these tables is eight bytes.
Figure 2.5 presents two graphs where the block sizes are varied. Similar
to the results seen for latency, there is a low change in energy while increasing
block sizes up to 32 bytes. After that, the relative energy consumption per
access rises considerably for each increase in block size. With four ports, the
power penalty for increased block size is considerably more than for a table
with one port.
This energy analysis has shown that increasing the number of ports,
associativity, or entries can quickly increase the energy consumed per access,
23

0
1
2
3
4
5
6
8 16 32 64 128
Block Size (bytes)
Ene
rgy
Per
Acc
ess
(nJ)
4k entries2k entries1k entries512 entries
0
5
10
15
20
25
30
35
8 16 32 64 128
Block Size (bytes)
Ene
rgy
Per
Acc
ess
(nJ)
4k-entry2k-entry1k-entry512-entry
a. One Port b. Four ports
Figure 2.5: Effect of Block Size on Per-Access EnergyThe tables are direct-mapped. Note the difference in scale between the two graphs.
but the block size can be increased with only a small energy increase. The
high per-access energy becomes a problem when it is combined with frequent
access to the table. Adding ports to a table seems like the best option for high
performance, but extra ports are expensive in terms of energy. Therefore,
history-driven techniques that have high port and table entry requirements
will either contribute heavily to the overall energy consumption problems or
sacrifice performance.
2.3 Design Options
As the instruction width increases, tables require extra ports to handle
the additional instruction bandwidth, causing problems from both the latency
and energy consumption perspectives. This port increase is the product of
the common practice of instruction-level table accesses. On the other hand,
increasing the block size per access has less severe results, and may be a better
source for providing the needed history data bandwidth.
In Figure 2.6, the latency and energy consumption are examined based
24

on different implementations for extracting 64 bytes of data from fixed-sized
tables. The choices range from acquiring 64 bytes on one port to acquiring
eight bytes per port simultaneously on eight ports. This figure shows that
using fewer ports is always better. For smaller tables, the difference in latency
and energy is not that great, but for larger tables, the differences can be
dramatic.
0.0000
1.1428
2.2856
3.4284
4.5712
5.7140
6.8568
1/64 2/32 4/16 8/8
Ports/Block Size (bytes)
Late
ncy
(ns)
256 kb128 kb64 kb32 kb16 kb8 kb4 kb
0
24
20
16
12
8
4
Clock
Cycles
Size
0
2
4
6
8
10
12
14
16
1/64 2/32 4/16 8/8
Ports/Block Size (bytes)
Ene
rgy
Per
Acc
ess
(nJ)
256 kb128 kb64 kb32 kb16 kb8 kb4 kb
Size
a. Latency b. Energy
Figure 2.6: Latency and Energy Required To Access 64 Bytes from a TableThe tables are direct-mapped. The number of entries are a function of the block size andtotal table size (shown in legend).
Dynamic energy consumption of tables is composed of two aspects: the
energy per access and the number of accesses. Using large block sizes and
fewer ports decreases both values. Therefore, a latency and energy friendly
table may have to acquire multiple pieces of instruction-level data from one
access instead of individual pieces on several accesses. The challenge is to de-
termine an efficient way to store data so that multiple pieces of useful history
data are stored together.
The best table design points have shifted as technology advances. For
example, while increasing ports and table entry counts come at an exorbitant
25

cost, other design parameters, such as block size, can be improved with less
overhead. With an abundance of transistors, the resources available for local
storage (e.g., buffers and registers) have increased. Recognizing the discussed
difficulties with long-distance communication, short local communication will
improve the efficiency of history data delivery as well. The ScatterFlow Frame-
work design is based upon these observations.
2.4 Related Work
The problems associated with high-power, high-latency tables and caches
have been addressed in various ways in the literature and in practice.
• Structures that are traditionally designed as one large table can be de-
composed into a hierarchy of tables, like a memory system. Hierarchies
have been applied to fetch hardware [100], the register file [113], and
translation look-aside buffer [25]. The hierarchy approach decreases la-
tency for a subset of critical instructions but increases complexity and
risks a decrease in performance.
• Faced with the wire delay problem, caches can be organized and manip-
ulated to take advantage of the non-uniform access times [58]. Instead of
guaranteeing a low latency for all data, the cache is designed such that
critical data are accessed as quickly as possible while the rest of the data
are accessed in time increments dependent on the physical proximity to
the processor core.
• One way to retrieve multiple pieces of data with a lower latency is
through banking [110]. Banking can become complicated and inefficient
26

for tables with irregular, frequent accesses and for wide issue machines
that fetch past branches. Gabbay and Mendelson study a banked table
for trace-based value prediction access [40]. The goal is to organize the
data in a way such that the values to be accessed next can be automat-
ically accessed in parallel with the current value.
• Another way to reduce latency while achieving multi-port read access
is through replicating the cache or data table [33]. Replication is more
space efficient than true multi-porting, but can have performance prob-
lems due to the requisite broadcast writes [102].
• Sometimes smaller tables will lead to better performance [2, 52]. While
it is ideal to have both low latency accesses and high history data accu-
racy, performance will sometimes improve when sacrificing accuracy for
a shorter latency.
• To save both time and power, portions of the indexing process can be
predicted, for example, line prediction and way prediction [57]. Index-
ing predictions work well for caches with regular access patterns, like
instruction caches.
In general, the above solutions and others like them have been proposed
for machines with a narrower instruction width than the baseline architecture
discussed in this dissertation (16-wide), and are therefore somewhat limited.
Some solutions are for power or latency, but not for both. Furthermore, some
solutions come at the cost of performance. In addition, these solutions are
presented for specific applications and do not necessarily apply well to tables
with different purposes, access patterns, and frequencies.
27

The main point to note about many of the above design strategies is
that they still maintain the traditional notion of a global history table. There
is still a dependence on global communications, multiple ports, and many table
entries. As design and technology trends continue, these solutions will not be
able to scale and remain high performance.
28

Chapter 3
The ScatterFlow Framework for Instruction
History Management
Instruction history data drive a variety of dynamic performance en-
hancement techniques. Traditional history management centers all history
data tasks around a global, instruction-indexed hardware table. However,
technology changes and higher performance goals require designers to rethink
the merits of the traditional table design. This chapter presents an alternate
design approach that improves the efficiency of history-driven optimization
techniques.
3.1 Overview
The traditional hardware table is currently the primary support mech-
anism for history-driven strategies. To achieve suitable data accuracy and
performance, these tables often consist of many entries and multiple ports.
In a wide-issue, high-frequency processor, retrieving data from this style of
global storage is time consuming and has high energy consumption. The extra
latency can reduce the achievable performance and the energy consumption
can limit the acceptable design choices.
By associating history data directly with instructions in the microarchi-
tecture and spreading history management tasks throughout the processor, the
29

proposed framework provides high instruction coverage and bandwidth while
allowing energy-efficient and low-latency access to the history data. This asso-
ciation is accomplished at the storage level by enforcing a one-to-one mapping
between instructions stored in the instruction storage and the history data in
the history storage. This storage organization allows history data for each of
the fetched instructions to be retrieved on one access.
The history data also accompany instructions as they flows through the
pipeline. As instructions execute, the history data encounter the decentralized
history data management tasks. The advantage of flowing history data is that
the history data are readily available for read and modification by dynamic
optimization mechanisms throughout the processor. A common scenario is for
the history data to be read early in the pipeline by a prediction mechanism.
Later, when the actual behavior is observed, the instruction’s history data are
modified by another pocket of optimization-related logic.
This framework design approach scatters history management tasks
throughout the processor, and the history data encounter the management
tasks as they flow through the instruction execution pipeline. Therefore, this
combination of design strategies is named the ScatterFlow Framework for In-
struction History Management, and is called the ScatterFlow Framework, or
simply the Framework, in this dissertation.
Note that the ultimate residence of the history data (i.e., the history
storage) has not been “scattered”. In fact, this dissertation suggests that
history data for multiple history-driven techniques reside in the same his-
tory storage (see Chapter 10). In this sense, the history management of the
ScatterFlow Framework has become more unified compared to current history
management where each history-driven technique centers all management ac-
30

tions around its own global history data table. The ScatterFlow Framework
essentially scatters history management in two ways: 1) history management
tasks are partitioned and included as part of the instruction pipeline, and 2)
the flowing of history data packets is essentially a dispersal of the history data
entries found in the fetch-time history storage.
3.1.1 History Storage
The ScatterFlow history storage is synchronized with the instruction
storage. Logically, for every instruction in the instruction storage, there is
an equivalent history data packet in the history storage, and the history data
are indexable in the same way as its corresponding instruction. There are
multiple ways to implement the history storage. The method suggested in
this dissertation is a separate physical structure that is indexed with the same
fetch address as the instruction cache.
Although the history storage design is tied to the instruction storage
design, there are several choices for the instruction storage. The implementa-
tion of the ScatterFlow Framework presented in this dissertation leverages the
instruction trace cache [89, 93, 103]. Associating execution history data with
instruction storage, particularly the trace cache, has several benefits for our
targeted design and performance points:
1. Each instruction in the instruction storage has its own unique history
data that are easily accessible and cannot be confused with other instruc-
tions’ history data. With traditional instruction-indexed tables, it is
time consuming to find the proper entry for each instruction and deliver
the data. In addition, the data can be corrupted when two instructions
map to the same data storage entry in the table [22, 114, 124].
31

2. History data are available for each fetched instruction for low latency
and low energy cost. By associating history data with each of the in-
structions and synchronously managing the history storage, one fetch
provides history data for many instructions. Figure 2.6 in Chapter 2
shows that wide data access with one port is preferable to regular data
access with many ports for both latency and energy consumption. These
characteristics are especially true of the trace cache, which is designed
for low latency access and high instruction bandwidth.
3. The most frequently executed instructions will be assigned a unique in-
struction history. The trace cache, like other caches, exploits the con-
cepts of temporal and spatial locality to maintain a useful subset of
data. Therefore, the instructions in the cache are likely to be the most
useful instructions at any given time. The history data stored in the
synchronous history storage also exhibit these properties of cached data.
4. Accessing instruction history data is done in parallel with instruction
fetch. Before any instruction is executed, it must be fetched from in-
struction storage. Therefore, history data access is fully or mostly over-
lapped by a required action. Even if the history data storage has a higher
latency than the instruction cache, a few extra cycles can be hidden by
instruction-specific stages such as decode and register rename.
5. The accuracy of instruction history data is often improved by the path-
based storage of the trace cache. This property is specific to the trace
style of storage. Each trace entry in the trace storage entry usually
contain several branches and are snapshots of small paths within the
dynamic execution of the program. Some instructions may be present in
32

multiple traces, but each trace is a program path with a separate context.
Along different paths, unique instruction-level execution behaviors may
be observable.
After an instruction and its history data are fetched into the micropro-
cessor, the history storage is never directly consulted again by that dynamic
instance of the instruction. This eliminates long-distance global communica-
tions between the execution core and the stored history data. Instead, the
instruction’s history data are preemptively requested during instruction fetch,
travel with the instruction through the pipeline, and used as needed. The
history data use and optimization logic are located in pockets at appropriate
positions in the microprocessor, as is the history data modification logic. The
process of writing the history storage with fresh history data is the duty of
the fill unit. In this manner, instruction history data follow the same feedback
flow as their instruction, requiring only short communication distances and
local storage.
This dissertation advocates one history storage structure for multiple
history-driven techniques, which is accessed at the same time as the instruction
storage. However, this is not a requirement. The important aspect of Scat-
terFlow history storage is that one access provide sufficient bandwidth for the
currently executing instructions and that history data reach the instructions
before they need it. An alternate approach is to access the history storage
later on in the pipeline to reduce update lag issues (see Chapter 9) and reduce
the amount of flowing history data. However, one limitation to keep in mind
is that block- or trace-based accesses are difficult to implement efficiently if
they do not return the data before instructions enter the out-of-order portion
of the execution pipeline.
33

3.1.2 Instruction History Data
Instruction history data represent past execution behavior of a par-
ticular instruction. This history data can be different types of information
and have numerous uses. One goal of the ScatterFlow Framework is to allow
as many different styles of instruction-level dynamic optimization as possible.
Therefore, the specifics are up to the microarchitecture designer.
A history-driven mechanism often tracks multiple execution character-
istics for each instruction. In the ScatterFlow Framework, the history data for
each instruction is contained in a history data packet. An example history data
packet is illustrated in Figure 3.1. The INSTR field represents an instruction
and its standard microarchitecture-level meta-data. The other fields are part
of the history data packet.
confidence counter
History Data Packet
INSTR 2 12
execution information
Figure 3.1: Example of a ScatterFlow History Data Packet
In this example, the confidence counter is execution-based history that
is commonly associated with an instruction. The counter represents the con-
fidence with which an instruction exhibits a dynamic property, such as pre-
dictability. Each time the instruction is executed, the history is read at pre-
diction time and then updated when the prediction has been verified.
A different type of instruction history is execution information, which
can be any value, relationship, or status determined at run-time in the mi-
croarchitecture. Past execution behavior within the microarchitecture is often
34

valuable for calculating predictions and determining resource access priority.
Later chapters explore concrete examples of instruction execution history and
history data packets.
3.1.3 A Framework Design
One approach for building the ScatterFlow Framework is shown in Fig-
ure 3.2. There are, of course, many ways to design a high-performance mi-
croprocessor, and the key ScatterFlow Framework principles are applicable
in most of these scenarios. This subsection presents one possible design that
makes sense for our targeted design point. The shaded portions of the figure
represent areas where the original hardware is augmented to support the his-
tory data that travels with each instruction. Essentially, this shaded area is
the ScatterFlow Framework.
Not all of the proposed hardware augmentations are necessary for every
technique implemented in the ScatterFlow Framework. Instead, the presented
design is an implementation starting point for history-based techniques. The
highlights of the ScatterFlow Framework are now discussed. The letters match
those circled in Figure 3.2.
• A. All instructions are initially fetched into the microprocessor core
through the instruction cache (I-Cache). Here, the instructions have no
dynamically acquired history. As they are decoded, the per-instruction
execution history data packets are appended to each instruction and
initialized to their default values.
• B. As the instructions flow through the pipeline, data paths and tem-
porary storage points are expanded to accommodate the instruction his-
35

B
C
D
E
FA
LSULSU FUFU..........
I−Cache CacheTrace
Decode Merge
Issue
SQ LQ
From L2
Retire and
Update
Reorder
Buffer
Rename
Mem Ctrl
StorageHistory
\History
UnitFill
Figure 3.2: History Data Flow in the ScatterFlow Framework
tory data. The reservation stations, load queue, and store buffer are
possible locations for history data to be stored. These distributed place
holders allow the history data packets to easily maintain a one-to-one
relationship with the instruction. Other logical units have shaded areas
to represent potential locations for history reads and modifications. For
example, the functional unit is a candidate to modify history data. The
memory controller is also a natural location for both history data reads
36

and modifications.
• C. The reorder buffer (ROB) can also maintain instruction history data.
Data stored here will not flow through the pipeline. The ROB history
data fields are quickly accessible when instructions are placed in the
ROB after renaming and when they are removed from the ROB after
instruction writeback. However, accessing the data from the ROB while
the instructions are in flight would be cumbersome. Therefore, this stor-
age location makes sense for data that are read and updated only before
ROB allocation or at retire-time. Chapter 6 presents another choice for
this type of data.
• D. An appealing time to perform powerful history updates and history-
based optimization is after instruction retirement [39, 51, 90]. Instead
of consuming resources and pipeline stages during performance-critical
portions of the instruction pipeline, complex history data updates can
take place after instructions retire.
• E. The fill unit constructs instruction traces and corresponding history
data traces. After a trace is constructed, the fill unit selects the proper
trace storage set and initiates a replacement if necessary. The updated
history data are always written to the identically-mapped history stor-
age. The fill unit is also a candidate for history-based optimization, for
example, trace construction and replacement.
• F. When an instruction trace is fetched from the trace cache to the
microprocessor core, the corresponding trace of history data are also
fetched. This step completes the instruction feedback loop. As necessary,
37
the two traces are merged such that each instruction is appended to its
history data.
This dissertation refers to this basic ScatterFlow Framework flow and
organization throughout, and variations on the design are suggested as ap-
propriate. Specific uses of the Framework incorporate a large percentage of
the outlined ScatterFlow hardware. The precise components and usage vary
among the different techniques. However, the use of appended instruction his-
tory data, trace-like history storage, retire-time update, and fill unit assistance
are core ideas to the Framework. In Chapter 10, a more advanced framework
that simultaneously supports multiple history-driven techniques is discussed.
3.2 Implications of Framework Design Choices
Later chapters illustrate successful uses of the ScatterFlow Framework.
In these examples, the Framework provides a combination of flexibility, per-
formance, and complexity advantages that is not achievable with traditional
history management implementations. However, not every history-driven tech-
nique fits seamlessly into the ScatterFlow Framework.
This section presents insight into when the Framework is most useful
for history-driven optimization techniques. In addition, the trade-offs with
traditional history management are discussed. These insights are presented
from a performance viewpoint and then a complexity and energy consumption
viewpoint. Later chapters present specific framework applications and discuss
how well they follow the different ScatterFlow Framework principles.
38

3.2.1 Performance
The ScatterFlow Framework is not a rigid history management imple-
mentation. Instead, the Framework is a collection of principles, which are
attractive for instruction history data accumulation and distribution. Not all
history-driven mechanisms have the same requirements for achieving high per-
formance and therefore they will not exercise the Framework in the same way.
Below is a discussion of the key ScatterFlow Framework properties, their rel-
evance to the implementation of individual history-driven techniques, and the
differences compared with traditional history management.
Low Latency History Access History data are quickly accessible within
the ScatterFlow Framework. After the history storage has been accessed at
fetch time, there are no global history data reads at any other point in the
pipeline. Instead, the history data values are accessed via the flowing history
data packets, allowing quick access for history data read and modification.
However, there are scenarios where this property does not provide a direct
advantage over traditional table storage.
Optimizations that are performed early in the pipeline benefit from the
low, fixed history access latency of the ScatterFlow history storage. Both value
prediction and cluster assignment are typically performed at issue time and
therefore benefit from the reduced latency. However, if an optimization takes
place later in the pipeline, then a high traditional table access latency is more
tolerable.
There is also the possibility that a multiple-cycle ScatterFlow history
storage access time is too long. This access time is the time required to drive
39

history data out of the history storage. Some history-driven fetch-time mech-
anisms require a shorter period between accesses to provide optimal perfor-
mance. Branch predictors are often designed to provide a new fetch address
every cycle. Therefore, a multiple-cycle trace history storage could not easily
provide branch hints or speculations fast enough to assist or replace a conven-
tional branch predictor without special considerations [52].
High Instruction Coverage The ScatterFlow Framework provides history
data for every instruction in the history storage. This allows history-based
mechanisms to easily optimize a wide range of instructions. This instruction
coverage does not come at the cost of a higher latency compared to traditional
data tables because of the reduced number of entries and ports.
Not every type of history-driven optimization requires the same amount
of coverage. Cluster assignment is applicable to every instruction, and value
prediction is applied to all result-producing instructions. Both of these mecha-
nisms require high coverage. Techniques that isolate an infrequently occurring
instruction type or a subset of an instruction type do not need the same amount
of coverage.
If a low-coverage technique uses the ScatterFlow Framework, there are
some potential inefficiencies. In this case, not every instruction requires all the
fields in the history data packet. However, these packets still exist in the his-
tory storage, and in the most general implementation of the Framework, these
empty history data packets would still flow with the instructions. Instead,
low-coverage techniques may be adequately represented by a small traditional
history storage table.
40

High Instruction Bandwidth By using trace-based storage, the Scatter-
Flow Framework is capable of accessing history data packets for multiple in-
structions with just one access to one port. This high bandwidth is essential
in a wide-issue environment. With many instructions progressing in paral-
lel through the pipeline, optimally accessing history data for each instruction
from a traditional table would require many ports and a non-trivial effort to
route the data.
Some history-driven optimizations do not require access to the peak
instruction bandwidth. In general, there is a mixture of instruction types in a
trace cache line. Therefore, history tables that service just one instruction type
can perform well with fewer ports and still provide enough access bandwidth
without high latency and energy costs. However, as the instruction width of
the microprocessor increases, this becomes less likely.
Retire-Time Trace Updates In the ScatterFlow Framework, history data
are fetched in a trace format. As the corresponding instructions begin execu-
tion in the out-of-order microprocessor core, the trace concept is lost as the
instructions begin to progress at their own individual pace. However, the fill
unit collects the retired instruction stream and reconstructs the instruction
and history data traces. Therefore, history data are written into the history
storage in the trace format.
The trace updates reduces energy consumption versus traditional data
tables by reducing the number of total updates to the history storage. In
addition, this style of history data access, accumulation, and update allows
the history data to express path-based execution trends. Traditional tables
build only one set of history data for a static instruction, which is beneficial
41

if the history data does not exhibit path-based characteristics.
Long latencies at retire time are not as critical to performance as they
are in earlier stages of the pipeline. This latency tolerance permits advanced
history update and dynamic optimization techniques. However, retire-time
updates and predictions can lead to a staleness problem. Staleness occurs when
the history data are not based on the most current dynamic execution behavior.
The performance consequences of staleness are noticeable for instructions that
rely heavily on quick updates (analyzed in Chapter 9).
3.2.2 Complexity and Energy
Beyond improving instruction throughput, the ScatterFlow Framework
is also appealing for wide-issue, high-frequency microprocessor design. The
Framework can provide a reduced design complexity and desirable energy con-
sumption properties. Therefore, it is often still beneficial to use the Framework
even if a dynamic optimization mechanism does not exploit all the possible
performance advantages.
History Storage The history storage allows for high instruction bandwidth
using low-latency, energy-efficient history access. For history-driven techniques
that support many instruction accesses per cycle, traditional history data ta-
bles will have high energy consumption. Multiple ports are required to handle
multiple instruction accesses per cycle, and, as shown in Chapter 2, ports
are a major contributor to the energy consumption per access. In addition,
when multiple instructions are attempting to read and write a history table
in each cycle, each access is increasing the amount of energy consumed. The
trace-based history access method of the ScatterFlow Framework reduces the
42

number of reads and writes because more instruction-level history data are ob-
tainable on each access. Therefore, a steadily-used dynamic optimization that
typically requires a multi-ported table can save dynamic table access energy
using the ScatterFlow Framework (demonstrated in Chapter 6).
Localized History Flow A global history table presents design difficulties
beyond access time. There is also the issue of routing the data. It is likely
that history data are accessed from one stage of the pipeline, returned in
a different stage, and updated in yet another stage. No matter where the
table is physically located, there will be communication overhead and routing
design challenges. This communication bottleneck is especially likely when
there are multiple history-driven dynamic optimization mechanisms present in
the microarchitecture.
The ScatterFlow Framework takes advantage of local bandwidth and
storage. Instruction history are pre-emptively fetched from history storage
at fetch time and follow the same fixed path through the pipeline as their
corresponding instructions. This simplifies the history data communication
because history data modifications are performed in flight. The ScatterFlow
Framework’s decentralized management and localized access to history data
lead to less long-distance wiring.
Short communications are not free, they require wires and latches to
hold the data. The energy consumption of the latches is non-trivial in some
implementations of the ScatterFlow Framework. History data can reside wher-
ever instructions are temporarily located. Each bit of flowing history data
requires a latch, which consumes energy on each clock cycle. The dynamic
energy consumption due to latches is approximated in this work. The benefits
43

of flowing the history data is that short wires are preferable to the long wires,
and they simplify the overall routing within the processor. In addition, the
resources required to create temporary buffers for holding the history data are
readily available, and are often already present in long-distance communica-
tion [73].
Instruction-History Data Association Immediately accessible history
data are an attractive quality of the ScatterFlow Framework. The history
storage and flowing history data effectively eliminate long-distance accesses to
large global traditional tables. However, it is difficult to represent multi-level
optimization and prediction schemes exclusively with the ScatterFlow Frame-
work’s method of history data management. The history storage provides a
flat hierarchy of storage. Therefore, schemes with levels of indirection (e.g.,
multiple tables accessed in serial) cannot be easily translated into a history
data packet. However, the Framework can still easily eliminate one level of
the table hierarchy.
A second fallibility occurs with excessive instruction history data. Stor-
age and communication resources are never infinite. Therefore, it is possible to
have too much per-instruction history data. For instance, if the history storage
access latency becomes too much greater than the instruction storage latency,
it may become difficult to associate the history data with their respective in-
structions. Restrictive history data size does not arise in this dissertation as
only individual history-based optimizations are analyzed in isolation. Solutions
for managing large quantities of history data are suggested in Chapter 10.
44

3.3 Uses In Dynamic Optimization
The ScatterFlow Framework allows low-latency access to a large per-
centage of instructions. The Framework not only improves the efficiency of
existing history-based optimization mechanisms, but also increases the prac-
ticality of techniques that may have been left unexplored. There are many
different ways to use the Framework for optimization. In this section, the op-
timization opportunities created by the ScatterFlow Framework are grouped
into three general categories: speculations, optimization hints, and instruction
profiling support for high-level optimization techniques.
3.3.1 Speculations
One use of the ScatterFlow Framework is to deliver a speculation. Here,
the history data packet consists of the prediction (e.g., branch prediction, re-
sult value prediction) and supporting data (e.g., confidence counter). Using
the Framework to hold and deliver speculation data reduces the dependency on
traditional global tables, possibly eliminating the tables entirely. The Scatter-
Flow history storage enables all instructions fetched from instruction storage to
access their speculations quickly and with better energy properties compared
to high-performance port-restricted traditional data tables. This dissertation
applies the ScatterFlow speculation strategy to value prediction in Chapter 6.
3.3.2 Optimization Hints
Techniques, policies, and heuristics in the microarchitecture can be
guided and assisted by instruction execution history. ScatterFlow history data
packets that provide additional input to an existing mechanism are called opti-
mization hints. These hints are a means to improve existing microarchitecture
45

mechanisms, both speculative and non-speculative in nature.
Per-instruction history data are not typical due to the limitations of
traditional history tables. The number of instructions that can receive history
data is limited by the number of table entries. In addition, the latency and
energy to access optimization hints can be difficult to justify because the hint
is just one input to a larger optimization process.
The ScatterFlow Framework improves the support of optimization hints
in several ways. Intolerable access latency and insufficient coverage are two
of the traditional table inefficiencies addressed by the Framework. Also, the
Framework can collect execution behavior from deep within the microarchi-
tecture core using the history data packets, avoiding long-distance updates to
a global history data table. Finally, traditional tables required to implement
the same technique are reduced or eliminated by using the ScatterFlow Frame-
work. This dissertation presents an optimization hint for cluster assignment
in Chapter 7.
3.3.3 Instruction Profiling Support
The ability to assign history data to each executing instruction is also
attractive to high-level dynamic optimization techniques. The ScatterFlow
Framework can be the history capture foundation that enables advanced soft-
ware and hardware techniques. ScatterFlow history packets provide lightweight,
continuous, instruction-level profiling for a high percentage of instructions.
Just-in-time compilers, dynamic compilers, and run-time adaptive op-
erating systems are examples of software that make dynamic performance
decisions based on instruction-level history. In addition, there are several pro-
posed hardware frameworks which provide dynamic instruction feedback to
46

software [46, 78, 125]. These techniques can benefit from high-bandwidth,
low-latency history capture properties of the ScatterFlow Framework. This
dissertation presents an execution trait detection interface for a generic high-
level analyzer in Chapter 8.
3.4 Related Work
This section presents previous and concurrent research related to the
design approach of the ScatterFlow Framework, such as the history capture
strategy, the leveraging of an instruction cache for history storage, and the use
of retire-time updates.
Augmented Instruction Storage A trace cache can store additional in-
formation beyond the decoded instruction. Traditional versions of the trace
cache choose to store multiple branch targets, branch directions, and the ter-
minating instruction type in each trace cache line [89, 103]. This information
is acquired dynamically after one execution of a trace instruction, but the
trace is never updated with any new information in the future. Zyuban et
al. suggest placing static cluster assignments in the trace cache, but do not
analyze the idea further [126].
Much of the trace cache work builds upon studies of a decoded in-
struction cache and fill unit [37, 76, 92]. The fill unit places dynamically
accumulated instruction information into the decoded instruction cache. The
information consists of decoding hints to reduce the latency of variable-length
instruction decoding. The fill unit also places dynamic branch information
into the decoded instruction cache, including both branch targets for two-way
47

branches and information about the instruction that generates the condition
code.
Lee et al. propose a decoupled value prediction for processors with a
trace cache [63]. They place retire-time value predictions and dynamic classi-
fication information in a Predicted Value Cache, which is accessed in parallel
with the trace cache. The decoupled value prediction strategy relies on a series
of traditional hardware tables to support the retire-time value prediction. The
focus is on removing value prediction from the critical path and reducing port
requirements. The latency and energy advantages are not addressed, nor are
broader applications.
Other works before the trace cache have suggested dynamically placing
information in an instruction cache. For branch prediction, Smith suggests
placing a one-bit branch prediction field with each instruction in the instruc-
tion cache [109]. M. Johnson also investigates placing branch information, such
as a branch target and branch location, into each instruction cache block [54].
J. D. Johnson proposes an expansion cache that is similar to the trace cache,
but for statically scheduled architectures. Each line of the expansion cache con-
tains dynamic information on instruction alignment, branch target addresses,
and branch prediction bits [53]. In addition, modern commercial processors use
branch prediction hardware that is designed to be separate from instruction
storage, but indexed similarly [56, 75].
Retire-Time Optimization Techniques Retire-time updates and opti-
mizations have been previously proposed and are a recurring theme for high-
performance trace cache processors. Friendly et al. focus on compiler-like
optimizations that are performed dynamically in the fill unit within a trace
48

cache entry [39]. The fill unit rearranges and rewrites instructions within the
trace cache line to increase their execution efficiency. These optimizations
include marking register-to-register move instructions, combining immediate
values of dependent instructions, combining a dependent add and shift into
one instruction, and rearranging instructions to minimize the latency through
their operand bypass network. Jacobson and Smith propose similar prepro-
cessing steps for the Trace Processors [51]. They look at three optimizations
similar to those proposed by Friendly et al.: instruction scheduling, constant
propagation, and instruction collapsing.
Patel and Lumetta explore compiler-like retire-time optimization [90].
They suggest using branch promotion techniques to create long traces called
frames. These frames are stored in a frame cache, and an optimization engine
performs compiler-like optimizations on the frames. The optimizations are not
driven by per-instruction feedback as in the ScatterFlow Framework. Addi-
tional work by Patel et al. uses dynamic information from a branch bias table
to promote dynamically predicted branches to assert instructions [88], thus
improving the performance of the branch predictor in a trace cache processor.
Retire-time predictions have also been proposed. The decoupled value
prediction scheme from Lee et al. performs value predictions at instruction
retire [63]. Lee and Yew also propose a similar system for use with an in-
struction cache [64]. Rakvic et al. propose a completion-time multiple branch
predictor [96] for a block-based trace cache [11]. The ScatterFlow Framework
is a complimentary design for the presented retire-time optimizations.
Instruction-Level Hardware Profiling One fundamental function of the
ScatterFlow Framework is a per-instruction execution profiler. Regardless of
49

how the collected execution history data are used, the process of collecting the
instruction-level execution information is a form of profiling. Previous work
has presented hardware for run-time profiling at the instruction level.
Merten et al. present a dynamic hardware instruction stream optimizer
which attempts to identify commonly executed regions (also called hot spots)
of code to support run-time optimizations [77]. This work uses dedicated hard-
ware tables and logic and reports rapid detection of hot spots with negligible
overhead. Furthermore, this hardware has been applied to run-time optimiza-
tions [78]. The on-chip dynamic optimizers reorganize the instruction stream
based on information profiled at run-time and are suitable for interface with
the ScatterFlow Framework history capture strategy.
Frameworks have been proposed to aid software by providing an inter-
mediary between the hardware profiling mechanism and the software [46, 125].
These frameworks collect samples of instruction behavior in a small hardware
table or buffer. The samples are then post-processed by on-chip resources
such as a co-processor [125] or another thread context on a multi-threaded
processor [46]. The systems have user-programmed hardware that filters and
captures per-instruction profiles for a subset of instructions. Then, a more
complex mechanism is deployed to read the buffers, analyze the profile data,
and communicate the information to software. This style of hardware profil-
ing requires programmed input from the software to use the limited history
capture resources.
The ScatterFlow Framework can serve as the underlying hardware that
captures the per-instruction information, but with less dependence on filters
and high-level guidance. The wide coverage provided by the Framework can
help identify key instructions and execution traits dynamically.
50

Narayanasamy et al. present a Multi-Hash architecture to catch impor-
tant processing events [83]. These events are captured using a series of hash
tables to filter the dynamic instruction stream. In addition, interval-based
profiling identifies the importance of an event. The Multi-Hash work is able
to provide low detection error with a reasonable hardware budget (less than
16KB of hardware tables).
Dean et al. present ProfileMe as a hardware approach to sample in-
structions and paired instructions as they travel through the out-of-order
pipeline [26, 31]. The results are designed to provide off-line feedback for
programmers and optimizers. Conte et al. propose a profile buffer to allow for
dedicated profiling [28]. The goal of the buffer is to improve the accuracy of in-
formation used in compiler optimizations while designing a hardware-compiler
system. In similar work, Conte et al. sample a software readable branch target
buffer, allowing them to estimate a program’s edge execution frequencies [29].
Here, the hardware is designed to collect samples of specific instruction subsets
with a limited amount of coverage within the subset.
51

Chapter 4
Experiment Methodology
The experimental results in this dissertation are obtained by detailed
simulation of a microprocessor. This chapter discusses the simulation tools
and process. The baseline microarchitecture, benchmark programs, and key
metrics are also explained.
4.1 Performance Simulation Methodology
This dissertation uses software-based simulation to evaluate the Scat-
terFlow Framework. A self-developed detailed timing simulator models aggres-
sive instruction-level parallelism techniques, resource contentions, and specu-
lative execution. Alpha binary files [1] are functionally executed by using the
sim-fast tool from the SimpleScalar 3.0 simulator suite [16]. The sim-fast tool
is modified to capture dynamic instruction information, package the informa-
tion into simulator-specific instruction packets, and place the packets into a
buffer that is consumed by the timing simulator.
Speculative execution is modeled in this microarchitecture framework.
Before a program is simulated, the program is run once to create a static
copy of resurrected code [10]. The resurrected code is a software structure
that contains information for the static instructions that execute dynamically.
When the program is simulated and a branch target is mispredicted in the
52

timing model, the resurrected code is consulted for the wrong-path instruc-
tion stream. If the resurrected code does not contain the mispredicted path
instruction, nops are inserted until the mispredicted branch is resolved. Unless
noted otherwise, all instruction-level results presented in this dissertation are
taken from correct-path instructions only. The wrong-path code is simulated
to approximate secondary effects on the caches and other structures.
4.2 Baseline Microarchitecture Design Choices
In the experiments, the baseline architecture represents a high-frequency,
wide-issue, high-performance design. The pipeline for the microarchitecture is
shown in Figure 4.1. Three pipeline stages are assigned for instruction fetch
(illustrated as one box) because the trace cache has an access latency of three
cycles. Instructions fetched from the instruction cache also incur these three
stages. After the instructions are fetched, there are additional pipeline stages
for instruction decode, renaming of logical registers to physical registers, issue
into the instruction window, dispatch to functional units, instruction execute,
register writeback, and instruction retirement. Instructions are then sent to
the fill unit. Register file read accesses and reorder buffer writes are started
during the rename stage. Memory instructions incur extra stages to access
the data translation look-aside buffer (TLB) and data cache. Floating point
instructions and complex instructions (not shown) also endure extra pipeline
stages for execution.
More details about the organization and properties of the baseline ar-
chitecture are presented below. The baseline configuration and parameters are
summarized in Table 4.1.
53

Dec
ode
FU
Dis
patc
h
Exe
cute
DC
Ret
urn
DC
Acc
ess
D−
TLBm
em
Ste
erR
S Is
sue
Ren
ame
RF
Acc
ess
Fet
ch x
3
Fill
Uni
t
Writ
ebac
k
Ret
irem
ent
Figure 4.1: The Pipeline of the Baseline Microarchitecture
Front End A trace cache allows multiple basic blocks of instructions to be
fetched with just one request [89, 93, 103]. Traces are constructed from the
retired instruction stream by the fill unit. A trace cache line is completed
after 16 instructions, on the third branch, at an indirect jump instruction, at
a return instruction, or at a call instruction. When the traces are constructed,
the intra-trace and intra-block dependencies are analyzed. From this analysis,
the fill unit can add bits to the trace cache line, which accelerate register
renaming and instruction steering [89].
There are many ways to design a trace cache. The trace cache in this
dissertation is two-way set-associative and consists of 1024 total entries (i.e.,
1024 traces or 16k instruction slots). Partial matching is the process of fetching
a trace cache line up to the point where the branch predictor disagrees with
the built-in branch direction of the trace [38]. The baseline trace cache does
not have path associativity, meaning that no two traces in the cache have
the same start address. This design constraint reduces the complexity of the
trace cache fetch mechanism. In addition, technique such as trace packing and
inactive issue are not used [89].
The ScatterFlow Framework history storage is designed to complement
54

Table 4.1: Baseline Microarchitecture Simulation ConfigurationData memory
L1 Data Cache: 4-way, 32B block, 32KB, 2-cycle accessL2 Unified cache: 4-way, 32B block, 1MB, +8 cyclesNon-blocking: 16 MSHRs and 4 portsD-TLB: 128-entry, 4-way, 1-cycle hit, 30-cycle missStore buffer: 32-entry w/load forwardingLoad queue: 32-entry, no speculative disambiguationMain Memory: Infinite, +65 cycles
Fetch Engine
Trace cache: 2-way, 1024-entry, 3-cycle accesspartial matching, no path associativity
L1 Instr cache: 4-way, 32B block, 4KB, 2-cycle accessBranch Predictor: 16k-entry gshare/bimodal hybridBranch Target Buffer: 512 entries, 4-way
BP mispredict penalty: minimum of 10 cycles
Execution Cluster· Functional unit # Execute latency Issue latency
Simple Integer 2 1 cycle 1 cycleSimple FP 2 3 1Memory 1 1 1Int. Mul/Div 1 3/20 1/19FP Mul/Div/Sqrt 1 3/12/24 1/12/24Int Branch 1 1 1FP Branch 1 1 1
· Inter-Cluster Forwarding Latency: 2 cycles per forward· Register File Latency: 2 cycles· 5 Reservation stations· 8 entries per reservation station· 2 write ports per reservation station
· 128-entry Integer Reorder Buffer · 64-entry Floating Point Reorder Buffer· Fetch width: 16 instructions · Decode width: 16 instructions· Issue width: 16 instructions · Execute width: 16 instructions· Retire width: 16 instructions
the trace cache. Logically, it is an extension to the trace cache. This work
assumes an implementation where it is a separate but identically managed
55

physical structure. The resulting history storage is equivalent to a two-way
1024-entry cache where entry stores up to 16 packets of instruction execution
history data. The history storage access latency is the same as the trace cache
latency if the history data trace size does not exceed the instruction trace
size. Even in the cases where the history storage size exceeds the trace cache
size, any extra latency can be overlapped by instruction decode and register
rename.
The front end of the processor also includes a small instruction cache.
This cache is accessed on trace cache misses. One instruction basic block and
up to 8 instructions are introduced from the instruction cache per cycle, if the
instructions all belong to the same cache line.
Branch prediction consists of both the directional branch predictor and
the branch target buffer. The directional predictor is a hybrid branch pre-
dictor, consisting of a gshare predictor and bimodal predictor [74, 123]. It
uses 16k-entry tables. The branch target buffer is a 4-way, 512-entry tagged
table. Both the trace cache and the instruction cache share the same branch
prediction hardware. Instead of a trace cache-specific branch predictor which
predicts multiple branches at once or predicts at the trace level [11, 89, 103],
trace cache branch instructions are predicted individually by the described
branch predictor.
Execution Resources Execution resources are clustered to minimize the
bottlenecks that result from wide-issue complexity. The size of the structures
within a cluster are more manageable, and the data communication latency
within a cluster is reduced. The microarchitecture in this dissertation is com-
posed of four, four-way clusters [85]. Four-wide, out-of-order execution engines
56

have proven manageable in the past. In addition, similarly configured 16-wide
clustered trace cache processors have been studied [39, 126].
The execution resources modeled in this dissertation are heavily parti-
tioned, as shown in Figure 4.2. Each cluster consists of five reservation stations
that feed a total of eight special-purpose functional units. There are functional
units for memory address generation, branch target calculation, integer arith-
metic, and floating point arithmetic instructions. The reservation stations
hold up to eight instructions and allow out-of-order instruction selection. The
economical size reduces the complexity of the wake-up and instruction select
logic while maintaining a large total instruction window size [85].
Intra-cluster communication (i.e., forwarding data from the functional
units to the reservation stations within the same cluster) is done in the same
cycle as instruction execute. However, to forward data to another cluster takes
two cycles. This latency includes all communication and routing overhead
associated with sharing inter-cluster data [86, 126]. Parcerisa et al. show that
point-to-point interconnect network can be built efficiently and is preferable to
bus-based interconnects [86]. There is no data bandwidth limitation between
clusters in this dissertation.
Data Memory The data memory subsystem consists of the level one (L1)
data cache, the store buffer, the load queue, and the memory controller. Store
instructions are assigned to an entry in the store buffer as they are placed
in the reorder buffer. Similarly, load instructions are allocated entries in a
separate load queue. The L1 data cache is accessed by the memory controller
with eligible load and store instructions from the load queue and store buffer.
The cache has four ports and can withstand up to 16 outstanding memory
57

RSRSRSRSRS
ALUALU BR
INTRA−CLUSTER INSTRUCTION CROSSBAR
DATA BYPASSINTRA−CLUSTER
DATA RESULT BUS
MEMCPX
To Load & Store Queues
Data Bypass
Inter−Cluster
IN
OUT
Figure 4.2: Organization of an Execution ClusterThere are eight special-purpose functional units per cluster: two simple integerunits, one integer memory unit, one branch unit, one complex integer unit, onebasic floating point (FP), one complex FP, one FP memory. There are five 8-entry reservation stations: one for the memory operations (integer and FP), onefor branches, one for complex arithmetic, two for the simple operations. FP is notshown.
operations.
The load queue is queried each cycle for eligible load instructions that
have their memory address calculated. Before a load instruction accesses mem-
ory, it consults the store buffer for older, uncommitted stores destined for the
same memory location. On a match, the load is either held up due to an in-
complete store, or the data value is forwarded from the store buffer to the load
58

instruction. Load instructions may not obtain data from the memory system
in the presence of an unresolved store address. Store instructions are not sent
to memory until they are ready to retire.
4.3 Impact of Baseline Parameter Choices
The choice of baseline architecture does, of course, has an effect on the
history management techniques being evaluated in this dissertation. Some of
these effects are partially explored in Chapter 9. This section discusses some
of the implications of key design choices.
The latency and energy calculations are calculated based on a 3.5 GHz
clock frequency, 100 nanometer transistor technology, and 1.1 V power source.
The trend has been for these values to quickly and continually change, such
that the clock frequency increases, the transistors shrink, the power supply
voltage reduces, overall power increases, chip complexity increases, and die
area increases. If these trends hold, then the current history management
problems discussed in this dissertation will only get worse. However, one goal
of the ScatterFlow Framework is to provide a history management solution
that scales well for future processors, which is accomplished by synchronizing
with the instruction storage and using local communications to flow the history
data.
Given the 100nm technology design point, a 16-instruction wide mi-
croarchitecture puts heavy strain on the instruction bandwidth requirements
of history data tables. Sixteen wide machines have been studied in the liter-
ature for some time [91, 103], but have not been introduced yet into com-
mercial general-purpose high-performance microprocessors. Hopefully, the
ScatterFlow Framework is one mechanism that allows the machine width to
59

realistically increase. However, even with the current issue widths in high-
performance processors, the instruction bandwidth issues are relevant, espe-
cially for future microprocessors that face even more severe trade-offs of accu-
racy and instruction coverage for access latency and energy consumption.
The 10-stage execution pipeline has some implications in the presented
performance comparison. A more drawn out pipeline, such as the one see for
the Intel Pentium 4 processor [48], would have an effect. For example, the
processor performance may be more sensitive to branch mispredictions. In
addition, extra pipeline stages at the beginning of the execution pipeline gives
history data tables (or history storage) more access slack since instructions
take longer to reach the out-of-order portion of the microprocessor. In ad-
dition, a longer pipeline creates more locations where history data must be
temporarily stored, increasing the dynamic energy consumption overhead of
flowing the history data. A longer pipeline would also increase the update lag
(see Chapter 9).
The choice of instruction storage has an obvious impact on the Scatter-
Flow Framework because the history storage is synchronous. In this case, the
trace style of history storage provides both advantages and disadvantages for
the history storage (as discussed throughout this dissertation). In particular,
partial matching is helpful to the history management effectiveness. However,
there are other trace cache strategies that could provide further improvement,
such as inactive issue and trace packing [89]. Finally, the aggressive modeling
of the branch predictor leads to better instruction throughput, but did not
have a noticeable effect on the ScatterFlow Framework history management
efficiency.
60

4.4 Benchmark Programs
The ScatterFlow Framework is evaluated using integer programs from
the SPEC CPU2000 suite [112]. There are several reasons to use this bench-
mark suite. Foremost, most microarchitecture dynamic optimization mecha-
nisms in computer architecture literature are evaluated using SPEC integer
programs. Therefore, these programs provide a comparison point for the ex-
periments in this dissertation. In addition, commercial processors are also
designed with this benchmark suite in mind. Finally, integer benchmarks pro-
vide a great challenge to a dynamically optimizing wide-issue processor.
The evaluated benchmark programs are described in Table 4.2. This ta-
ble also supplies the program abbreviations (Abbrev.) used in analysis figures,
and supplies the number of static instructions that are dynamically encoun-
tered during execution (Static Instr.).
Table 4.2: SPEC CINT2000 Benchmark ProgramsBenchmark Abbrev. Description Static Instr.bzip2 bzp Compression 1757crafty crf Game Playing: Chess 15,728eon eon Computer Visualization 6228gap gap Group Theory, Interpreter 13,572gcc gcc C Programming Language Compiler 127,144gzip gzp Compression 6234mcf mcf Combinatorial Optimization 3317parser psr Word Processing 2904perlbmk prl PERL Programming Language 2900twolf twf Place and Route Simulator 7644vortex vor Object-oriented Database 30,903vpr vpr FPGA Circuit Placement and Routing 2952
The program input values and execution flags are presented in Ta-
ble 4.3. The MinneSPEC reduced input set [61] is used when applicable. The
MinneSPEC inputs are intended to produce the same execution characteristics
61

as the original SPEC inputs but with a shorter running time. Otherwise, the
SPEC test input is used. The programs are executed for 100 million instruc-
tions after skipping the first 100 million instructions.
Table 4.3: Inputs for SPEC CINT2000 Benchmark ProgramsBenchmark Input Source Inputsbzip2 MinneSPEC lgred.source 1crafty SPEC test crafty.ineon SPEC test chair.control.kajiya chair.camera chair.surfaces ppmgap SPEC test -q -m 64M test.ingcc MinneSPEC mdred.rtlanal.igzip MinneSPEC smred.log 1mcf MinneSPEC lgred.inparser MinneSPEC 2.1.dict -batch mdred.inperlbmk MinneSPEC mdred.makerand.pltwolf MinneSPEC mdredvortex MinneSPEC mdred.rawvpr MinneSPEC mdred.net small.arch.in -nodisp -place only -init t 5
-exit t 0.005 -alpha t 0.9412 -inner num 2
The benchmark executables are the pre-compiled Alpha binaries avail-
able with the SimpleScalar 3.0 simulator [16]. The C programs were compiled
using the Digital C compiler (V5.9-005). The C++ benchmark (eon) was com-
piled using the Digital C++ compiler (V6.1-027). The target architecture for
the compiler was a four-way Alpha 21264, which in many ways is ideal for a
clustered architecture with four-wide clusters.
4.5 Metrics
While some of the improvements provided by the ScatterFlow Frame-
work, such as design complexity, are difficult to measure quantitatively, this
dissertation provides measurements for history capture effectiveness, relative
performance, and dynamic energy change. When specific techniques are imple-
62

mented using the Framework, such as value prediction or cluster assignment,
they are evaluated using performance and energy metrics. In addition, it is use-
ful to provide general insight about the Framework without requiring a battery
of Framework implementation examples. Therefore, history capture metrics
are presented to provide a general context for comparisons with traditional
tables and for evaluations of basic ScatterFlow Framework design trade-offs.
Performance Impact In this work, performance is the instruction through-
put, which is measured as the number of retired instructions per clock cycle
(IPC). The number of instructions per program and processor frequency does
not change, so the IPC directly translates to the improvement in execution
time. The performance is presented as speedup, which is the IPC of a pro-
gram over the IPC achieved on the baseline microarchitecture. The harmonic
mean of the individual program speedups is used to summarize the perfor-
mance change over the entire benchmark suite.
Dynamic Energy Change The dynamic energy consumption analysis in
this dissertation is restricted to the specific microarchitecture storage hardware
being evaluated. The dynamic energy of the hardware tables is calculated by
multiplying the port activity of a structure by the energy per port access. The
activity is determined through the simulation process described in this chapter.
The energy per port access is acquired from an analytical cache model, Cacti
2.0 [101]. Traditional tables and the ScatterFlow Framework trace storage
are assumed to have a design similar to that of a traditional cache [2, 14].
Therefore, the analytical model provides a good approximation of relative
dynamic energy consumption. The dynamic energy reductions achieved by
63

the ScatterFlow Framework are presented as relative changes to the energy
consumed by traditional tables accomplishing the same task. The dynamic
energy consumption of flowing history data is also approximated in this work
by multiplying the number of introduced latches by the approximate energy
consumed per latch [47].
History Management Efficiency The ability to quantify history manage-
ment without a battery of specific, implemented history-driven techniques is
useful for quickly evaluating design trade-offs. Two metrics are presented to
measure how well history data are captured and delivered. Instruction cover-
age is the percentage of all dynamically retired instructions that have history
available during execution. History maturity is a weighted average of the his-
tory ages for all retiring history data packets, where the history age is the
number of updates to the history data packet.
For history maturity, the history ages are weighted to provide a better
representation of the history data importance. Depending on the type of
execution history data, the number of meaningful updates varies. For example,
if a history data packet field is a two-bit saturating counter, three updates
control the full range of possible counter values. If the history is a value from
the last dynamic execution, then one update provides the maximum amount
of relevant history. On the other hand, pure counts (e.g., number of dynamic
occurrences) have no such limitation on the number of beneficial updates and
benefit from as many updates as possible.
Two versions of history maturity are presented. The history maturity
weights applied to the history age are shown in Table 4.4 and the resulting
weighted history ages are shown in Figure 4.3. The full history maturity is the
64

full weight multiplied by the history age. The capped history maturity is the
capped weight multiplied by the history age for values up to 63 For all history
ages over 64, the weighted history age is capped at 64.
Table 4.4: Weights for History MaturityHistory Age Full Weight Capped Weight0 - 10 1.00 1.0011 - 63 1
log10(Age)1
log10(Age)
>= 64 1log10(Age) 64
1.E+00
1.E+01
1.E+02
1.E+03
1.E+04
1.E+05
1.E+06
1.E+07
1.E+08
1.E+00 1.E+01 1.E+02 1.E+03 1.E+04 1.E+05 1.E+06 1.E+07 1.E+08
History Age
Wei
ghte
dH
isto
ryA
ge
UnweightedWith Full WeightWith Capped Weight
Figure 4.3: Applying History Maturity Weights to History AgeNote the logarithmic scale of the x-axis and y-axis.
Using the full weight, the relative ordering of the weighted history ages
is maintained for the full range of ages. However, as the number of updates
increases, the weighted age becomes a smaller percentage of the original age.
The capped weight is the same as full weight for history data with an age
below 64, but all history data with an age over 63 is treated the same.
Both full history maturity and capped history maturity are used in
65

this dissertation. The full history maturity reduces the emphasis on heavily-
updated history but is still strongly influenced by the large history ages. This
weight is more applicable during feedback to high-level analyzers because it is
useful to understand which designs best accommodate heavily-updated history.
However, the history examples in this dissertation (and in microarchitecture
research in general) do not benefit from more than a few consecutive updates,
and therefore the capped history maturity is more representative of the true
usefulness of the history data.
66

Chapter 5
History Management Effectiveness
The trace-based accumulation of history data in the ScatterFlow Frame-
work has unique properties compared to the traditional per-address table. This
chapter presents a characterization of the history data collected using the
Framework. The captured history data are also contrasted with the history
data collected by a traditional table.
5.1 Trace Storage Characterization
Table 5.1 presents run-time characteristics for the baseline trace storage
components: the instruction trace cache and trace history storage. The results
are obtained using the methodology and baseline configuration presented in
Chapter 4. Instruction coverage is the percentage of retired instructions that
are fetched from the trace cache. Recall that only instructions fetched from the
trace cache have previously-updated history data in the ScatterFlow Frame-
work. For the examined programs, 91.8% of retired instructions are fetched
from the trace cache on average, ranging from 74.1% for gcc to 99.4% for bzip2.
Hit Rate is the percentage of trace accesses that result in either a full
or partial hit. The average hit rate for these programs is 75.7%. Instruction
coverage is related to the trace storage hit rate, but they are not directly
correlated. Other factors that contribute to the instruction coverage include
67

Table 5.1: Dynamic Trace Storage Characteristics for the Baseline Microar-chitecture
Program Instruction Coverage Trace Size Hit Rate Evict % Same Update %bzip2 99.39% 10.79 94.04% 0.00% 99.62%crafty 86.17% 11.48 66.77% 11.51% 85.41%eon 91.08% 10.85 68.35% 3.75% 93.34%gap 91.58% 11.49 68.92% 5.18% 92.76%gcc 74.12% 10.83 55.16% 19.34% 76.55%gzip 94.11% 12.44 79.05% 0.33% 97.13%mcf 95.97% 8.52 83.67% 0.12% 90.26%parser 97.49% 9.29 90.60% 0.19% 93.76%perlbmk 98.91% 10.68 87.31% 0.02% 99.49%twolf 89.18% 11.24 67.02% 3.53% 91.94%vortex 89.74% 9.88 77.03% 8.89% 89.73%vpr 93.67% 11.53 70.56% 1.28% 93.98%average 91.79% 10.75 75.71% 4.51% 92.00%
the average number of entries per trace line (Trace Size), the percentage of
partial hits, and branch predictability.
The trace storage eviction rate affects the accuracy of the history data.
Evict % is the percentage of trace builds that result in a full eviction of a
valid trace cache entry and the corresponding trace of history data packets.
Full evictions remove a trace of instructions and corresponding history that
are potentially useful. Trace storage evictions are only bad for performance
when instructions that will be used again soon are removed. Trace storage
replacements (like cache replacements in general) are beneficial if the evicted
data are no longer being used and the new data exhibit temporal locality in
the future.
A “partial” eviction is possible when a freshly constructed trace shares
at least one trace block, but not all, with the trace that it is replacing. Same
Update % conveys the amount of useful history packet replacements that occur
68

during new trace constructions. On average, 92.0% of history data packets
replace a stored history data packet that corresponds to the same instruction
address in the same unique trace block. While the average Same Update % is
similar to the instruction coverage, remember that retired history packets come
from both the trace cache and the instruction cache. Instruction coverage is
the percentage of all retired instructions fetched from the trace cache. The
similarity of these percentages indicates that many uncovered instructions are
due to cold misses.
5.2 Path Information and Multiplicity
Two differences between history capture using traditional tables and
the ScatterFlow Framework are the indexing and storage techniques. The
Framework uses trace-based storage indexing instead of per-address indexing.
Fetching in a trace format enables low-latency, high-bandwidth history data
access that is critical in wide-issue environments. In addition, trace-based
storage has certain unique properties compared to traditional history storage
that are discussed in this section.
A static instruction can have dynamic instances spread out among mul-
tiple trace entries in the trace cache [87]. This observation has been called
redundancy. The replication and dispersal of static instructions leads to mul-
tiple instruction history data packets being associated with one instruction
address. This history data packet multiplicity enables execution history to
take on program path characteristics. While redundancy may be inefficient
for instruction storage, path-based history data collection has been found to
improve the history accuracy in table-based mechanisms [50, 82, 123].
A drawback of history multiplicity occurs if a static instruction does not
69

show different dynamic characteristics along different program paths. When
all dynamic instances behave the same, multiplicity leads to a dilution of the
history update. Instead of accumulating history information in one place, like
a traditional table, the history is accumulated at a slower rate in each of the
multiple entries.
Not only can dynamic instances of static instructions exist in multiple
traces, they can also be present in multiple blocks within the same trace.
Consider a loop that is one basic block. For traces that accommodate three
basic blocks, the same static instruction can be present three times. While path
information can boost performance and history accuracy, it will not benefit
the general history capture efficiency of the Framework if too much history
update dilution occurs.
Figure 5.1 illustrates the number of unique trace blocks that are encoun-
tered dynamically by each static instruction. Trace blocks are the individual
basic blocks within a trace (up to three per trace). The bottom portion of
the all bar shows that over 71.1% of static instructions are dynamically con-
structed into one unique trace block. Only 11.6% of static instructions are
dynamically constructed into more than two trace blocks, and less than 1%
are built into more than 10 dynamic trace blocks during the entire course of
execution.
Figure 5.1 does not portray the dynamic execution frequency for each
static instruction. It is likely that the static instructions with high dilution are
also the most commonly executed. In Figure 5.2, the dynamically-encountered
trace blocks for each static instruction are sorted by dynamic frequency. The
bottom portion of the all bar illustrates that 86% of dynamically retired in-
structions are built into their most common trace block instance, and 95% are
70

0%
10%
20%
30%
40%
50%
60%
70%
80%
90%
100%
bzp crf eon gap gcc gzp mcf psr prl twf vor vpr all
Uni
que
Tra
ceB
lock
sP
erS
tatic
Inst
ruct
ion
>105-104321
Figure 5.1: Unique Dynamic Trace Blocks Per Static Instruction
built into one of the two most commonly created trace blocks. So while an
instruction and its history may appear in several trace blocks during program
execution, an instruction tends to favor one particular trace block. Therefore,
the dynamic dilution is not as severe as the static results indicate.
5.3 The Life of a History Data Packet
The storage and management of history data packets differ from that
of instructions because the history data are always changing. Instructions and
their corresponding history data packets are fetched as one trace, but they are
constructed into new traces at the block level. Therefore, an instruction and
its history data packet can be built into traces that are different from the one
which they were fetched. This change of context does not alter the meaning
of the freshly built trace of instructions or the old trace of instructions, but it
71

0%
10%
20%
30%
40%
50%
60%
70%
80%
90%
100%
bzp crf eon gap gcc gzp mcf psr prl twf vor vpr all
Upd
ates
To
Mos
tCom
mon
Tra
ceB
lock
s
Others2nd1st
Figure 5.2: Percentage of Retired Instructions Built into the Most CommonTrace Blocks
does have consequences for the history data.
It is possible to replace a trace of lightly-updated history with a trace
of heavily-updated history because of block-level trace builds. Therefore, an
eviction could increase the amount of useful history in the trace cache. In
addition, a trace could be fetched many times and never updated with new
history, while traces that are never fetched have more heavily updated history.
Chapter 9 further examines this phenomena and offers design options to reduce
this behavior.
Figure 5.3 depicts the number of unique trace blocks to which an in-
struction history packet belonged during its lifetime. A history packet’s life-
time begins when it is associated with an instruction fetched from the instruc-
tion cache. The lifetime ends when the history packet is evicted from history
storage or at the end of the simulation.
72

0%
10%
20%
30%
40%
50%
60%
70%
80%
90%
100%
bzp crf eon gap gcc gzp mcf psr prl twf vor vpr all
Uni
que
Tra
ceB
lock
sP
erH
isto
ry
>105-104321
Figure 5.3: Number of Unique Dynamic Trace Blocks Per History Packet
Figure 5.3 shows that, on average, 79% of history packets are found
in one dynamic trace block during their lifetimes, 9% are found in two trace
blocks, and 12% are found in three or more trace blocks. While the aver-
age values in this figure have similarities to Figure 5.1, three programs, gzip,
mcf, and parser, show a significant amount of history data multiplicity. All
three of these programs have a low eviction rate (Table 5.1) and either high
static instruction redundancy (Figure 5.1) or high dynamic per-path behav-
ior (Figure 5.2). This combination of long-living history data packets and
multiple-path behavior leads to high history data packet multiplicity.
5.4 History Maturity
Two metrics are presented to quantify the general efficiency of history
data capture and delivery: instruction coverage and history maturity. The
73

instruction coverage is the percentage of instructions that have access to their
history data. This value has already been presented in Table 5.1. History
maturity is the weighted average of the history ages for fetched history data
packets. After an instruction is retired, its corresponding history data are
updated. Each update adds one to the age of the history data. The under-
lying assumption of this metric is that each update adds value to the history
information.
Figure 5.4 presents a breakdown of the observed unweighed history
ages. The different shades within the bars represent a range of history ages.
These values are collected at fetch time and only for history packets associated
with correct-path instructions. An age of zero means that the instruction is
fetched from the instruction cache and its history data packet has never been
updated.
0%
10%
20%
30%
40%
50%
60%
70%
80%
90%
100%
bzp crf eon gap gcc gzp mcf psr prl twf vor vpr all
Fet
ched
His
tory
Age
>128k64k-128k8k-64k1k-8k64-10238-632-710
Figure 5.4: Fetched History Age Using the ScatterFlow Framework
74

On average, the all bar shows that 92% of fetched instructions have his-
tory data with an age greater than zero. Eighty-two percent of history packets
have at least eight updates and 60% have at least 64 updates. Figure 5.4
also shows that the largest percentage of history packets fall in the 8k to 64k
update range. The history packets that receive greater than 128k updates are
often from the traces that are never evicted from storage. The values for each
range vary greatly among the programs because history age is sensitive to the
instruction footprint and instruction locality characteristics.
The execution of instructions with a nonzero history age has a chance
to be enhanced using a history-driven mechanism, but the level of optimization
depends on the type of history, history age, and the accuracy of the history.
For most history-driven applications, a few updates can provide the maxi-
mum amount of information. Therefore, weighted history ages are introduced
(Chapter 4). The reason for applying a weight to the history age is to bet-
ter represent the influence of heavily-updated history since most of the older
updates are irrelevant when the history data are used. The history maturity
metric provides a succinct representation of meaningful history age.
Table 5.2 presents the capped history maturity and full history matu-
rity. Also presented is the average history age (i.e., the unweighted version of
the history maturity). The average history age drops by 75% on average when
the full weight is applied. As intended, the full history maturity reduces the
influence of heavily updated history on the metric. This maturity metric is
appropriate for a general analysis that accounts for a full range of ScatterFlow
Framework uses. However, for the applications presented in this dissertation,
the heavily-updated history data are overemphasized in the full history ma-
turity. The capped weight further reduces the influence of heavily-updated
75

history by giving all history packets with a history age of at least 64 the same
significance in the capped history maturity value.
Table 5.2: Average Fetched History Age (ScatterFlow Framework)
Capped History Maturity Full History Maturity Average History Agebzip2 62.8 17178.9 87861.7crafty 24.7 1295.0 24129.2eon 40.4 4789.9 19752.9gcc 48.8 55.0 171.1gap 58.0 4170.7 5663.7gzip 57.8 5254.4 24625.5mcf 61.3 15023.1 76915.9parser 56.5 8743.2 43485.7perlbmk 63.5 14950.5 78820.4twolf 52.9 3239.2 15180.9vortex 44.9 817.4 3589.4vpr 58.4 10037.5 50151.1
5.5 Comparison to Traditional Tables
This section compares the history capture ability of the ScatterFlow
Framework with traditional history tables. Three sizes of traditional tables
are used in this comparison, both with and without access port constraints.
The port constrained tables are presented in Table 5.3. The tables sizes are
chosen such that one table approximately matches either the latency (Tab4k),
area (Tab1k), or stored data (Tab16k) of the ScatterFlow history storage (HS).
Figure 5.5 presents a history age breakdown like that in Figure 5.4 for a
traditional direct-mapped table with 4096 entries. The history age is measured
at fetch time, and updates occur at retire time. No limits are placed on the
instruction access bandwidth to the table. Access of another instruction’s
history data due to a table entry conflict counts as a history with zero age.
76

Table 5.3: Size, Latency, and Storage of Analyzed Tables Relative to HistoryStorage
Entries Ports Assoc Latency Area BitsHS 1024 1 2 1.00 1.00 1.00Tab1k 1024 4 1 0.59 0.88 0.06Tab4k 4096 4 1 1.04 2.41 0.25Tab16k 16384 4 4 2.34 8.70 1.00
HS is the history storage. The block size for the tables is 8 bytes and forthe history storage it is 128 bytes. The latency and area are relative to thehistory storage and estimated by Cacti 3.0. These results are based on a90nm technology.
0%
10%
20%
30%
40%
50%
60%
70%
80%
90%
100%
bzp crf eon gap gcc gzp mcf psr prl twf vor vpr all
Fet
ched
His
tory
Age
>128k64k-128k8k-64k1k-8k64-10238-632-710
Figure 5.5: Fetched History Age Using a 4096-Entry Traditional Table (InfinitePorts)
The instruction coverage provided by the ScatterFlow Framework and
table are similar on average. Ninety-two percent of instructions access an
updated history packet using the Framework, while 91% of instructions access
appropriate history data using a traditional table. However, the table has a
77
significantly larger percentage of heavily updated history. In the table, 18%
of the history data are updated more than 128k times versus only 8% in the
Framework. As for the lightly updated history in the table, 78% are updated at
least eight times and 68% are updated at least 64 times. The former percentage
is less than the Framework but the latter percentage is greater.
ScatterFlow instruction coverage and history maturity are presented in
Figure 5.6. The presented metrics are normalized to the 4096-entry table with
four ports. Compared to this table with a similar access latency as the history
storage, the ScatterFlow Framework provides 2.4x more instruction coverage,
2.5x better capped history maturity, and 1.5x better full history maturity.
Most of this improvement comes from the instruction bandwidth advantages
provided by the cache-line history data storage. For some programs (gzip,
mcf, parser), the full history maturity does not improve. Besides the inherent
ability of traditional history tables to capture more mature history data, these
programs have a particularly high history data packet multiplicity, which tends
to eliminate some long-standing history data.
In Figure 5.7, the port restrictions on the 4096-entry are lifted. This
graph reveals a slight average instruction coverage increase, a full history ma-
turity decrease of 35.8%, and a capped history maturity increase of 5.6% when
using the ScatterFlow Framework. The history maturity results reveal that a
highly accessible table is preferable for history data that benefit from heavy
updates, while the Framework is still better for history data that reaches full
usefulness more quickly.
Figure 5.8 illustrates the relative difference in history maturity and
instruction coverage between the Framework and traditional four-ported tables
of 1024 entries and 16k entries. The 1024-entry table has a similar area to
78

0.0
0.5
1.0
1.5
2.0
2.5
3.0
3.5
4.0
4.5
5.0
5.5
6.0
bzp gcc crf eon gap gzp mcf psr prl twf vor vpr HM
Nor
mal
ized
toa
4096
-ent
ry,4
-por
tTab
le
Full History Maturity Capped History Maturity Instruction Coverage
26.1 12.1
Figure 5.6: ScatterFlow History Maturity and Instruction Coverage Versus a4096-Entry Table (Four Ports)
the ScatterFlow Framework but provides much worse history management
effectiveness of the ScatterFlow Framework. The Framework provides a 3.1x
improvement in instruction coverage, a 4.6x improvement in capped history
maturity, and a 3.1x improvement in full history maturity. The reduction in
table entries from 4096 to 1024 has a large effect on history capture efficiency
for these benchmark programs.
The ScatterFlow Framework still provides a 2.2x improvement in in-
struction coverage and a 1.7x improvement in capped maturity over a four-
ported, 16k-entry table that stores the same number of bits as the history
storage. However, the port restrictions still do not allow the traditional table
to fully enjoy this size improvement.
In Figure 5.9, the 16k-entry table with no port restrictions provides
at least 98.5% coverage for all programs, which is close to the upper limit of
79

0.0
0.5
1.0
1.5
2.0
2.5
3.0
3.5
4.0
4.5
bzp gcc crf eon gap gzp mcf psr prl twf vor vpr HM
Nor
mal
ized
toa
4096
-ent
ryT
radi
tiona
lTab
le
Full History Maturity Capped History Maturity Instruction Coverage
11.5
Figure 5.7: ScatterFlow History Maturity and Instruction Coverage Versus a4096-Entry Table (Infinite Ports)
instruction coverage. Even with no port restrictions, the Framework improves
full history maturity by 34%, capped history maturity by 64%, and coverage
by 29% versus the 1024-entry table, but produces a 84% decrease in full history
maturity, a 21% decrease in capped history maturity, and 8.7% less instruction
coverage than the 16k-entry table. This illustrates that traditional tables
without port restrictions provide more efficient history management per bit.
5.6 History Capture Effectiveness Discussion
The process of collecting dynamically changing data in a trace-based
format has not been previously studied. Instruction redundancy in the trace
cache leads to several interesting scenarios involving dynamic trace cache data.
During program execution, almost 30% of static instructions are dynamically
80

0.0
2.0
4.0
6.0
8.0
10.0
12.0
14.0
16.0
18.0
20.0
22.0
24.0
bzp gcc crf eon gap gzp mcf psr prl twf vor vpr HM
Nor
mal
ized
toa
1024
-ent
ry,4
-por
tTab
le
Full History Maturity Capped History Maturity Instruction Coverage
848 12741111 90.0 31.0
a. 1024-Entry, Direct-Mapped Table
0.0
0.5
1.0
1.5
2.0
2.5
3.0
bzp gcc crf eon gap gzp mcf psr prl twf vor vpr HM
Nor
mal
ized
toa
16k-
entr
y,4-
way
,4-p
ortT
able
Full History Maturity Capped History Maturity Instruction Coverage
b. 16k-Entry, 4-Way Table
Figure 5.8: ScatterFlow History Maturity and Instruction Coverage Compar-isons for 1024-entry and 16k-entry Tables (Four Ports)
81

0.0
1.0
2.0
3.0
4.0
5.0
6.0
7.0
8.0
9.0
bzp gcc crf eon gap gzp mcf psr prl twf vor vpr HM
Nor
mal
ized
toa
1024
-Ent
ryT
radi
tiona
lTab
le
Full History Maturity Capped History Maturity Instruction Coverage
321 343 28.3 357
a. 1024-Entry, Direct-Mapped Table
0.0
0.1
0.2
0.3
0.4
0.5
0.6
0.7
0.8
0.9
1.0
bzp gcc crf eon gap gzp mcf psr prl twf vor vpr HM
Nor
mal
ized
To
16k-
entr
y,4-
way
Tra
ditio
nalT
able
Full History Maturity Capped History Maturity Instruction Coverage
b. 16k-Entry, 4-Way Table
Figure 5.9: ScatterFlow History Maturity and Instruction Coverage Compar-isons for 1024-entry and 16k-entry Tables (Infinite Ports)
82

constructed into more than one unique trace block. When this occurs, the
history data packets are also disseminated among multiple traces, but are
representing a single static instruction. As a result, more than 20% of history
data belong to more than one unique trace block during their lifetime.
The multiplicity of the instruction-level history data is not truly a re-
dundancy. Although each trace block contains the same instruction, each is
unique in its placement in the control flow of the executing code. There-
fore, the history data now capture path-based execution trends. On the other
hand, the multiplicity slows the accumulation of per-address execution history
for path-insensitive instructions.
The multiplicity of instruction history data packets in the trace stor-
age and block-level trace builds in the fill unit create more unique update
properties for history data. The processor may fetch instructions from one
trace line entry but construct the instructions into another trace, intertwin-
ing execution characteristics from both paths. While the potential for diluted
history and cross-path history exist, the occurrences are not high in the ana-
lyzed benchmark programs. Eighty-six percent of retired instructions execute
in their most commonly executed unique trace block. Therefore, most history
data are not being diluted between different instances of a static instruction.
However, the other 14% of retired instructions affect performance significantly
and their history data should still be optimized.
Recognizing the challenging nature of dynamic trace-based history stor-
age, two metrics are proposed to measure the relative history capture efficiency.
Instruction coverage is the percentage of retired instructions that execute with
history data that has been updated at least once. History maturity quantifies
the usefulness of active history by factoring in the total number of history
83

updates, and is presented in a full and capped format.
Using instruction coverage and history maturity, the ScatterFlow Frame-
work provides similar or better history capture efficiency than a 4096-entry
traditional address-indexed table with no port restrictions. The compari-
son reveals that the Framework has an advantage in instruction coverage
and the collection of lightly-updated history (less than eight updates) and
capped history maturity. The traditional table has an advantage in collecting
medium-updated history (eight to 63 updates), collecting heavily-updated his-
tory (more than 64 updates), and full history maturity. When the number of
ports is limited to four, the ScatterFlow Framework enjoys a 2.4x improvement
in instruction coverage and a 2.5x improvement in capped history maturity.
In a comparison with other table sizes, the ScatterFlow Framework
provides superior instruction coverage and history maturity to a 1024-entry
table with or without port restrictions. On the other hand, the Framework
cannot deliver instruction coverage or history maturity similar to a 16-entry
table with no port restrictions, which accommodates most of the data working
set.
5.7 Power Dissipation of the Framework
In this section, the ScatterFlow Framework power dissipation consists
of two components, the history storage and the flowing history data. The
history storage power is the number of total accesses to the history storage
per second multiplied by the energy consumed per access. Computing the
power dissipation due to the flowing history data involves determining the
total number of latches required and multiplying that total by the energy
consumed per latch per second.
84

In this analysis, Cacti 2.0 [101] approximates the energy per history
storage access for a 100nm transistor technology. For a 1024-entry, 2-way
history storage with one read/write port and 128 bytes per entry (i.e., eight
bytes per history data packet), the total energy consumed per access is 2.036
nJ. Read and writes are assumed to consume the same amount of energy.
Simulation reports the number of total read and write accesses per access
(see Figure 6.5). The number of history storage reads is equal to the number
of trace cache reads, including wrong path accesses. The number of history
storage writes is equal to the number of total trace builds, since all history
data traces must be written to the history storage to maintain accurate history
data.
This section presents a “full blown” approach for calculating the power
due to the flowing of history data. All bits in the history data packet are
assumed to reside everywhere that an instruction can also reside. In each
location, one latch is required for each bit of a 64-bit history data packet.
Table 5.4 presents the total number of latches. The history data flows through
the in-order stages of the pipeline (decode, rename, and issue stages). When
instructions are allocated into the reorder buffer, load queue, and store buffer,
so are their history data. After that, the history data travel with the instruc-
tions into the out-of-order portion of the microarchitecture, which contains
the reservation stations. For this analysis, the fill unit supports five full traces
of instructions and their history data, which is 80 packets worth of history
data. The Misc. category represents various additional potential history data
storage points including the memory controller.
Each of the latches consume energy on every clock cycle. There is
potential for gating the clock, but this optimization is ignored in this analysis.
85

Table 5.4: Potential Sources of History Data Latches
Location Total Packets Number of LatchesDecode Stage 16 1024Rename Stage 16 1024Issue Stage 16 1024Reservation Stations 160 10,240Load Queue 32 2048Store Buffer 32 2048Reorder Buffer 192 12,288Fill Unit 80 5120Misc. 25 1600Total 569 36,416
The energy consumption for the latches is taken from work by Heo et al. [47]. In
this work, the authors examine different types of latches for activity-sensitive
placement within a microprocessor. The energy per latch includes one level of
inverters for the clock signal but other additions to the clocking tree are not
included in this analysis.
Heo et al.’s implementation of the Power PC latch is used for this work
because of its low energy properties under heavy clock and data transitions
(Tests 5-7 in [47]). The average energy consumed per latch per clock is 97 fJ for
a 250nm technology at 2.5 V. The energy (E = CV 2) is scaled to 100nm and
1.1 V (to match the Cacti 2.0 parameters in this dissertation) by conservatively
scaling the capacitance linearly (100250
) and the scaling the voltage ((1.12.5
)2). The
resulting energy per latch per cycle used in this analysis is then 7.51 fJ.
Table 5.5 presents the power dissipation of the history storage, the flow-
ing history data, and the entire ScatterFlow Framework for each benchmark
program. The number of accesses per cycle includes both read and writes to
history storage. This access rate is indicative of the instruction throughput of
86

the program since reading and creating traces occur more often as instructions
complete more quickly. On average, the history storage dissipates 3.30 Watts
of power and the latches for flowing history data dissipate 0.96 Watts. In this
full blown scenario, the latches are responsible for a power overhead of about
13
compared to the history storage. The flowing overhead ranges from 19.20%
to 61.63% for the examined programs.
Table 5.5: Power Dissipation of ScatterFlow Framework
History Storage Flowing TotalProgram Access/Cycle Power (W) Power (W) Power (W) % Increasebzip2 0.300 2.14 0.96 3.10 44.74%crafty 0.438 3.12 0.96 4.08 30.68%eon 0.700 4.99 0.96 5.94 19.20%gap 0.519 3.70 0.96 4.66 25.87%gcc 0.277 1.97 0.96 2.93 48.57%gzip 0.218 1.55 0.96 2.51 61.63%mcf 0.424 3.02 0.96 3.98 31.72%parser 0.538 3.83 0.96 4.79 24.97%perlbmk 0.609 4.34 0.96 5.30 22.05%twolf 0.431 3.07 0.96 4.03 31.17%vortex 0.555 3.95 0.96 4.91 24.21%vpr 0.552 3.93 0.96 4.89 24.34%Avg 0.463 3.30 0.96 4.26 32.43%
Specific history-driven techniques in the ScatterFlow Framework have
different requirements and will rarely need the described amount of flowing
history data. For example, if a history-driven technique targets only load in-
structions, then there is no need to store history data in reservation stations
for other instruction types or in the store queue. Even with the power require-
ments of the flowing history data, Chapter 6 shows that the total ScatterFlow
energy consumption proves to be much lower than a traditionally designed,
multi-ported, high-entry, high-performance history data table.
87
Chapter 6
Value Prediction Using the Framework
This chapter presents an example use of the ScatterFlow Framework.
The history data packets are ScatterFlow speculations that contain predicted
result values and supporting history data. Using this technique to manage
value prediction leads to a performance improvement and dynamic energy
reduction compared to traditional table-based value prediction techniques.
6.1 Background
True data dependencies are a fundamental obstacle to higher instruction-
level parallelism (ILP). Value prediction speculatively satisfies true data de-
pendencies by predicting instruction results early, leading to higher utilization
of the processor resources as well as faster resolution of slowly completing
instructions and long dependency chains. Improved ILP is particularly use-
ful in wide-issue microprocessors with execution resources that are typically
underutilized.
Data consuming instructions arrive quickly in a wide-issue microar-
chitecture. One way to quantify the potential usefulness of successful value
predictions is to study the distance between result-producing instructions and
their consumers. For a large percentage of result-producing load instructions
(83%) and integer instructions (82%), data consumers appear within one cycle.
88

If values cannot be predicted quickly enough to break these data dependencies,
value prediction will not be useful. Swiftly breaking these data dependencies
leads to greater ILP and higher utilization of processor execution resources.
Sensitive to Latency Excessive value prediction latency is a detriment to
overall instruction throughput. It reduces the effectiveness of successful pre-
dictions by prolonging the resolution of data dependencies. A lengthy latency
for computing a predicted value can overlap with the out-of-order processing
of instructions, allowing an instruction to produce its actual result before the
predicted result is available.
Previous work reveals that value predictor latencies that extend even a
few cycles past instruction rename cannot provide predictions quickly enough
for a large percentage of instructions [7]. A successful value prediction that
is provided eight cycles after register rename does not benefit 55% of load
instructionss. For integer arithmetic operations, a large percentage, 33%, ex-
ecute within three cycles.
High Energy Consumption Another design issue in a high-performance
processor is energy consumption. More transistors, higher clock rates, incor-
rect speculations, and wider microarchitectures all contribute to this growing
problem. In the SPEC CPU2000 integer benchmark, 61% to 78% of all in-
structions are eligible for value prediction. This large percentage of eligible
instructions leads to high value predictor port activity with traditional tables.
This work shows that a traditional at-fetch hybrid value predictor consumes
almost 5 times as much energy as all the on-chip caches combined because of
high predictor activity and high performance table design.
89

6.2 Value Predictor Implementation Choices
There are multiple points in the pipeline at which an instruction can
be value predicted. Performing value prediction at instruction fetch is a com-
monly assumed implementation [19, 41, 67, 105]. In a typical processor, an
instruction address can be sent to the fetch logic each cycle. In at-fetch value
prediction, this same fetch address is used to access the value predictor. Based
on the address, the value predictor generates predictions for all the instructions
being fetched in that cycle.
This imposes two restrictions. In a processor that fetches past branches
in a single cycle (such as a trace cache processor), the fetched instruction
addresses can be non-contiguous. Determining the address for each fetched
instruction requires more information than is typically available at fetch time.
Solutions that may work when fetching up to the first branch, such as banking,
no longer work well [41]. The second problem is the lack of instruction type
information. During fetch, the instructions are indistinguishable, so value
prediction resources are forced to consume instructions that are not eligible
for prediction (branches, stores, floating point). This proves costly for a port-
constrained predictor.
The advantage of at-fetch prediction is compelling. There is no need
for a predicted value until the instruction has been decoded and renamed.
Therefore, some or all of the value predictor’s table access latency is hidden
by the instruction fetch latency and decode stages.
An alternative to predicting at fetch time is to predict after the in-
structions are decoded [7]. In post-decode value prediction, the addresses for
non-contiguous instructions beyond the first branch are now known, allowing
90

more instructions to access the value prediction hardware. Using the instruc-
tion type information available after decode, more judicious read port access
arbitration takes place, limiting access only to instructions that generate re-
sults.
The disadvantage of post-decode prediction is that the value predictor
access latency is not hidden by earlier stages of the pipeline. The tables are
accessed when the predicted value is ideally desired. Every extra cycle is a
delay in breaking a possible data dependency.
Value prediction computation for an instruction can be done at retire
time. In Decoupled Value Prediction, an instruction retires and updates the
value predictor table as in traditional value prediction [63]. Then the retired
instruction accesses the value predictor again right away and computes a new
prediction. This predicted value is stored in a Prediction Value Cache and can
be used by a future instance of the instruction. This cache is read like the
history storage in the ScatterFlow Framework, but updated differently.
From an energy standpoint, Decoupled Value Prediction offers only
small improvements. It maintains the traditional centralized instruction-indexed
value predictor table and structure. At retire-time it must be read to perform
new value predictions, and it must also be updated by retiring instructions.
6.3 Implementing Value Prediction Within The Frame-work
ScatterFlow value prediction leads to performance improvements versus
conventional at-fetch value predictors because of reduced access latency and
improved instruction coverage. It also addresses the energy and complexity
91

concerns of decoupled value prediction by eliminating the global, instruction-
level value prediction tables.
Figure 6.1 shows the ScatterFlow history data packet. In this work,
ScatterFlow value prediction performs matched stride prediction which re-
quires an additional 16-bit stride [107]. There is also a two-bit confidence
counter stored in the history data packet. The data widths illustrated in this
figure are the maximum widths, but they are reducible. Loh shows that the
maximum data widths are not necessary to achieve high performance in value
prediction [71].
INSTR predicted value matching stridelast stride confidence cntr
Value Prediction History Data Packet
2 bits16 bits16 bits32 bits
Figure 6.1: ScatterFlow Value Prediction History Data Packet
Figure 6.2 illustrates the ScatterFlow value prediction. Value prediction
history data packets are fetched in trace format from the history storage and
fed to the processor core. However, in this example history-driven technique,
the execution history data do not need to be accessed in the heart of the
pipeline. After the predicted values are properly placed into the speculative
physical register file (or similar structure), they do not need to be read or
updated again by the ScatterFlow logic until after instruction retirement.
Therefore, this implementation uses a separate Prediction Trace Queue
(PTQ) to buffer the prediction traces. However, the PTQ is not a neces-
sary addition for the ScatterFlow value speculations to be implemented. The
predicted value and stride are pieces of execution history data information
92

Fill Buffer VP Logic
Instruction Fetch Latency 2
Instruction Fetch Latency 3
Decode
To Phys Reg
create ROB entries
final value
Trace Cache
Prediction TraceQueue (PTQ)
Rename
Issue
Dispatch
Execute
Writeback
History Storagehistory storage update
up to 16 predictons up to 16 instructions
ReorderBuffer
store history data traces in PTQ
Figure 6.2: Performing Value Prediction Using the ScatterFlow Framework
that can flow with the instruction through the entire pipeline as discussed in
Chapter 3. The PTQ reduces the number of history data latches within the mi-
croarchitecture while promoting high-performance, energy-efficient value pre-
diction.
The prediction traces persist in the PTQ until the related instructions
retire. While the fill unit is creating new traces from the retired instructions,
the fill unit value prediction logic compares the final values to the predicted
values from the oldest trace in the PTQ. Wrong-path instructions exist in
the PTQ, but it is possible to recognize this condition and ignore or discard
those traces. New predictions are then combined by the fill unit logic into a
prediction trace that is stored in the history storage.
In previous work, the ScatterFlow value prediction is called Latency
and Energy Aware Plus (LEA+) value prediction [7, 8]. ScatterFlow predic-
tion is restricted to performing one-level algorithms, such as stride prediction.
93

Context prediction and, thus, hybrid prediction, are not feasible without re-
quiring support from traditional tables or severely increasing the history data
size.
6.4 Methodology
The baseline microarchitecture and simulation methodology do not
change from what is outlined in Chapter 4. However, there are some dif-
ferences between the parameters and methodology in this work and what is
found in previous work [7, 8]. Earlier evaluations used the Sun SPARC in-
struction set [122] and executables instead of Alpha. In addition, the value
prediction misspeculation recovery is more pessimistic, increasing the number
of mispredictions and the average misprediction latency.
The value predictors simulated in this analysis are shown in Table 6.1.
The optimistic configuration is an aggressive but unrealistic post-decode value
predictor with no port restrictions and zero latency. It is presented for com-
parison purposes because similar assumptions are made in the value prediction
literature.
Table 6.1: Configurations of Analyzed Value Predictors
Predictor LVP Entries Stride Entries Context Entries Ports Total Lat. Unhidden Lat.Optimistic 8192 8192 8192 16 0 cycles 0 cyclesAt-Fetch Hybrid 8192 8192 1024 4 8 cycles 4 cyclesScatterFlow VP N/A N/A N/A N/A 3 cycles 0 cycles
Ports refers to the available ports at read or write, modeled as two read/write portsand then matching read-write pairs beyond that. Total Lat. is the latency in clockcycles from value prediction request until a value is produced. Unhidden Lat. is thenumber of total prediction latency cycles that extend past rename.
The unhidden latency (Unhidden Lat.) for the at-fetch predictor is the
total prediction latency (Total Lat.) minus the four cycles for the fetch and
94

decode pipeline stages. This total latency consists of the latency to access
the table plus two cycles for the following: creating and routing the indexing
addresses to the predictor, determining the final prediction state, calculat-
ing the value prediction, choosing the proper value from among the multiple
predictors, and routing the result back to the instruction.
For all predictors, each table is direct-mapped, tagged, and updated
by every result-producing instruction. All value predictors are assumed to be
fully pipelined and capable of serving new requests every cycle. When a value
misprediction is encountered, the microarchitecture reissues all instructions
younger than the mispredicted instruction. Update latencies were modeled in
previous work but were found to have negligible effects on overall performance.
The optimistic and at-fetch value predictors use perfect confidence for choosing
among the sub-predictors. More details on the value predictor configurations
are available [7, 8].
6.5 Performance and Energy Analysis
This section illustrates the performance and energy improvements pro-
vided by the proposed ScatterFlow Framework speculations. First, a tradi-
tional value predictor’s sensitivity to latency. With these effects in mind, the
performance of the different value prediction strategies is compared. Finally,
the last subsection presents the dynamic energy implications of each value
prediction configuration.
6.5.1 Effects of Table Access Latency on Performance
Figure 6.3 quantifies the change in performance when altering value
predictor latency. For this analysis, a version of the optimistic predictor with
95

a nonzero latency is used. The latency (lat) is the number of cycles between
when an instruction is renamed and when its predicted value becomes available
(i.e., the unhidden latency). As a reference, the assumption in previous work is
that this latency is zero, and a hybrid predictor with two levels of 8192-entry,
eight-ported tables experiences a total table access latency of 28 cycles, 24 of
which are unhidden.
0.95
1.00
1.05
1.10
1.15
1.20
1.25
1.30
bzp gcc crf eon gap gzp mcf psr prl twf vor vpr HM
Spe
edup
Ove
rB
asel
ine
w/N
oV
P
lat 0 lat 4 lat 8 lat 16 lat 32
Figure 6.3: Effect of Table Access Latency on Performancelat X is the number of cycles after an instruction is decode that its predicted valuebecomes available.
The figure shows that unhidden table latency significantly affects per-
formance. The optimistic predictor with no latency (lat 0) provides a 8.9%
speedup in execution time. Four cycles of unhidden latency reduces the abso-
lute speedup, but by only 0.7% on average. As the latency increases, a larger
percentage of instructions can compute a result for themselves and the benefits
of successful value prediction deteriorate. A 16-cycle value prediction latency
decreases speedup to 4.2% and a 32-cycle latency decreases speedup to 1.8%.
96

These effects on performance indicate a need for a low-latency prediction de-
livery solution.
6.5.2 Comparing Prediction Strategies
Figure 6.4 compares the overall performance of each value prediction
strategy. On average, the optimistic at-fetch value predictor produces the
best performance improvement, achieving 8.9% speedup over the base model.
The ScatterFlow value speculations achieve the next best performance (7.2%
speedup). The traditional at-fetch hybrid predictor produces a 3.5% speedup
but falls far short of the optimistic case. Remember that value prediction
literature often makes assumptions similar to those of the optimistic at-fetch
value predictor.
0.95
1.00
1.05
1.10
1.15
1.20
1.25
1.30
bzp gcc crf eon gap gzp mcf psr prl twf vor vpr HM
Spe
edup
Ove
rB
asel
ine
w/N
oV
P
At-Fetch ScatterFlow VP Optimistic At-Fetch
Figure 6.4: Performance Comparison of Value Prediction Strategies
These performance results highlight the latency and per-instruction
97

data bandwidth advantages of the ScatterFlow Framework. The performance
superiority of ScatterFlow prediction over at-fetch prediction is possible be-
cause the unhidden prediction latency is intrinsically zero. In addition, the
prediction read bandwidth is effectively unconstrained because of the trace
prediction format.
Table 6.2 presents the number of total value predictions (Total Preds)
and the value prediction accuracy (VP Rate) for the three evaluated value
prediction strategies. These two values provide more insight into the speedup
results of Figure 6.4. For example, ScatterFlow value prediction provides more
speedup for perlbmk than the optimistic predictor. The table shows that Scat-
terFlow prediction provides a 10% increase in total predictions and a similar
value prediction accuracy.
Table 6.2: Total Value Predictions and Value Prediction Accuracy
At-Fetch ScatterFlow VP At-Fetch OptimisticTotal Preds VP Rate Total Preds VP Rate Total Preds VP Rate
bzip2 22,007,891 99.73% 48,130,910 97.74% 44,809,967 99.74%crafty 12,699,810 98.58% 24,575,934 98.23% 29,574,059 98.42%eon 8,006,436 99.85% 15,356,565 99.58% 16,241,435 99.74%gap 11,818,940 99.97% 34,118,965 96.39% 27,382,935 99.95%gcc 6,421,093 98.99% 7,532,678 97.10% 15,395,199 98.86%gzip 7,215,986 98.91% 13,677,132 98.32% 15,852,956 98.60%mcf 15,060,608 98.92% 19,927,912 96.88% 24,583,776 98.85%parser 6,621,815 97.71% 10,515,975 96.30% 12,809,016 97.64%perlbmk 23,430,855 99.99% 55,739,674 99.52% 50,522,843 99.99%twolf 8,133,015 99.88% 14,164,682 99.08% 16,905,278 99.80%vortex 10,095,083 99.82% 25,121,515 99.78% 29,190,321 99.78%vpr 10,221,779 99.75% 21,035,218 97.37% 22,380,892 99.70%
For a few programs, the relationship between the data in Table 6.2 and
the graph in Figure 6.4 is not as clear. Traditional at-fetch prediction provides
98

more speedup for bzip2 than ScatterFlow value prediction, but with half the
number of predictions. However, at-fetch prediction correctly speculates at
a higher rate. In another case, ScatterFlow value prediction provides fewer
predictions and a lower prediction rate than the optimistic predictor for mcf,
but still provides better performance. This particular program happens to be
memory bound with low instruction throughput. Therefore relative perfor-
mance is also sensitive to the secondary effects of value prediction (e.g., cache
warming, branch prediction update rate). In addition, each prediction scheme
leads to different instructions being predicted, and some instructions are more
performance critical than others [35, 111, 119].
6.5.3 Energy Analysis
The dynamic energy consumption of value prediction hardware depends
largely on the activity of value predictor tables. Figure 6.5 reports read and
write frequencies for the at-fetch value predictor with four ports. The first
column in the graph is the number of value predictor reads that take place
during execution (AF VP Read). The next column, AF VP Update, is the
number of updates made to the value predictor at instruction retire. The
SF Trace Read column is the number of trace reads from history storage in
ScatterFlow value prediction. The final column represents trace builds (SF
Trace Build). The history storage is written on each trace build.
AF VP Update is greater than AF VP Read when there are many pre-
dictable instructions that do not get access due to the limited number of read
ports. However, these instructions still update since they could be predictable
in the future. AF VP Read is greater than AF VP Update when a large num-
ber of wrong-path instructions access the read ports. These instructions do
99

000.0E+0
10.0E+6
20.0E+6
30.0E+6
40.0E+6
50.0E+6
60.0E+6
70.0E+6
80.0E+6
90.0E+6
100.0E+6
bzp gcc crf eon gap gzp mcf psr prl twf vor vpr avg
Tot
alA
cces
ses
AF VP Read AF VP Update SF Trace Read SF Trace Build
Figure 6.5: Access Frequencies for Tables Related to Value Prediction
not ever update.
Table 6.3 outlines the value prediction hardware used in the evaluated
predictors. To determine total energy for each prediction strategy, the relevant
activity factors in Figure 6.5 are multiplied by the corresponding structure’s
per-access energy from Table 6.3. The energy to perform a write is assumed
to be equivalent to the energy to perform a read.
Table 6.3: Energy Consumption for Analyzed Value Predictor Tables
Structure Notation Entries Block Size Assoc Ports Energy Per Access(nJ)1k-entry L1 Context Table 1kL1CtxtE 1024 16B 1 4 1.24851k-entry L2 Context Table 1kL2CtxtE 1024 8B 1 4 1.15308k-entry Stride/LVP Table 8kTableE 8192 8B 1 4 2.9643ScatterFlow History Storage SFHSE 1024 128B 2 1 2.0362ScatterFlow PTQ SFPTQE 32 128B 1 1 0.2684
The energy per access is for a read access and is calculated using Cacti 2.0 [101].The Ports for the value prediction tables are modeled as two read/write ports plustwo write ports.
100

The 66 bits of history data per instruction are only flowing through the
two early stages of the pipeline (total of 2112 latches) in ScatterFlow value
prediction. This energy consumption, as well as the energy required to pipeline
multiple-cycle history data access in traditional value prediction, are assumed
to be negligible and offsetting in this energy study, and they are therefore
ignored.
Moreno et al. observe that a classifying hybrid predictor can allow for
only one prediction table to be “turned on” during value prediction [79]. This
possibility is covered with At-Fetch Gated. In this configuration, only energy
from the stride prediction table is consumed, and the other tables are assumed
to consume no energy.
The equations used for determining the overall dynamic energy of the
value prediction strategies are:
[1] At-Fetch HybridE = (VP Read * hybridE) + (VP Update * hybridE)
[2] At-Fetch GatedE = (VP Read * 8kTableE) + (VP Update * 8kTableE)
[3] ScatterFlow VPE = (TR Read * SFHSE) + (TR Build * SFHSE) + (2 * TR Read * SFPTQE)
where hybridE = (8kTableE + 8kTableE + 1kL1CtxtE + 1kL2CtxtE )
Figure 6.6 compares the energies of the studied value prediction strate-
gies to the dynamic energies of the L1 data cache, L1 instruction cache, L2
cache, and trace cache from our baseline microarchitecture. Caches Combined
is the sum of the energies from these on-chip caches. The configurations and
energy per access for the on-chip caches are presented in Table 6.4.
Performing high-performance traditional value prediction in a wide-
issue processor proves to be a high-energy task. The at-fetch hybrid predictor
consumes 4.3 times the dynamic energy of all the on-chip caches combined and
101

0.01 0.10 1.00 10.00 100.00
Instr L1
Unified L2
Trace Cache
Data L1
Caches Combined
ScatterFlow VP
At-Fetch Gated
At-Fetch Hybrid
Total Dynamic Energy Consumption Normalized to ScatterFlow VP
17.47
6.22
1.00
4.10
3.42
0.28
0.33
0.07
Figure 6.6: Normalized Energy Consumption of Value Predictors and On-chipCaches
Note the logarithmic scale. All values are normalized to the energy consumptionof ScatterFlow VP. Caches Combined is the Data L1, Trace Cache, Instruction L1,and Unified L2 combined energy
Table 6.4: Energy Consumption for On-Chip Caches
Structure Entries Block Size Assoc Ports Energy Per Access(nJ)L1 Instruction Cache 128 32 4 1 1.1639L1 Data Cache 1024 32 4 4 5.9381L2 Unified Cache 32768 32 4 1 27.5408Trace Cache 1024 64 2 1 1.0035
17.5 times the dynamic energy of the ScatterFlow value predictor. The gated
at-fetch predictor is more energy friendly, as expected, but still consume 6.2
times the energy of the ScatterFlow VP. ScatterFlow value prediction is the
only style of prediction that reduces energy consumption below the level of
the on-chip caches.
102

6.6 Related Work
Lee et al. propose a decoupled value prediction for processors with a
trace cache [63]. They perform value predictions at instruction retire using an
instruction-level dynamic classification value prediction scheme based on work
by Rychlik et al. [106]. The goal of Decoupled value prediction is to remove
value prediction from the critical path in instruction fetch and to reduce the
port requirements for the four value prediction tables.
Gabbay and Mendelson study the effects of fetch bandwidth on value
prediction [41]. They propose a highly-interleaved prediction table for trace
cache processors to address the observations and issues uncovered in their
work. Their simulated architecture uses idealized components to stress the
instruction fetch and value prediction aspects of their work.
Tullsen et al. present a method of storage-less value prediction [118].
Their energy and complexity-efficient method is based on exploiting locality of
register values. By using values already present in registers, there is no need
to store these values in a value prediction table. Using static and dynamic
approaches with compiler assistance, they show improvement over a 1k-entry
last value predictor. However, there is no energy analysis, and this approach
is not compared to high performance value predictors.
There have been efforts to quantify the performance consequences of
latency-constrained tables for an entire processor [2] and fetch hardware [100],
but there is no work that has applied these constraints to value predictors.
Moreno et al. analyze power-related issues with value speculation without
dealing with restricted ports or latency issues [79]. They present speedup
versus power consumed for several configurations of value predictors. They
note that a classifying hybrid predictor can potentially reduce the energy for
103

value predictor reads. They also discuss the power issues due to mispredicted
values and instruction window complexity.
6.7 Discussion
In this chapter, value prediction is implemented using history data
packets in the ScatterFlow Framework. Circumventing globalized per-address
tables leads to both energy and performance improvements. Value prediction
is applicable to a large percentage of dynamically executing instructions and
therefore is amenable to the Framework’s wide instruction coverage property.
Finally, value prediction occurs early in the processor pipeline. The ability
to quickly access and associate value predictions with fetched instructions is
valuable and largely responsible for the performance improvement.
Additional speculation techniques can benefit from ScatterFlow specu-
lations, including memory renaming [80, 120, 81], memory dependence predic-
tion [27], branch prediction [109, 62, 123], cache line and way predicting [57],
and prefetching [94, 24]. However, the precise implementation is specific to
the technique and some speculation strategies may not see large performance
gains compared to table-based strategies.
For example, memory dependence prediction and branch prediction
focus on a smaller subset of the full instruction stream than value prediction.
Therefore, the instruction coverage and instruction bandwidth requirements
are not as high. Also, memory dependence prediction takes place late in
the instruction pipeline and is more tolerant to long table latency than value
prediction. On the other hand, branch prediction takes place so early in the
pipeline that it cannot tolerate the fetch latency from history storage without
special considerations [52].
104

Chapter 7
Cluster Assignment Using the Framework
In this chapter, the ScatterFlow Framework assists retire-time cluster
assignment by providing optimization hints. The ScatterFlow history data
packets collect inter-trace data dependency history. The fill unit uses the
dependency information to improve the retire-time performance beyond that
of issue-time cluster assignment.
7.1 Background
A clustered microarchitecture design allows for wide instruction exe-
cution while reducing the amount of complexity and long-latency communi-
cation [20, 34, 36, 45, 85, 126]. The execution resources are partitioned into
smaller and simpler units. Within a cluster, communication is fast while inter-
cluster communication is more costly. Therefore, the key to high performance
on a clustered microarchitecture is assigning instructions to clusters in a way
that limits inter-cluster data communication. Figure 7.1 illustrates a four-
cluster configuration for a 16-wide processor.
7.1.1 Previous Cluster Assignment Work
During cluster assignment, an instruction is designated for execution
on a particular cluster. This assignment process can be done dynamically at
105

Inter−ClusterData Bypass
C2 C3CLUSTER 1 CLUSTER 4
Data Memory System
I13I1 I2 I3 I4 I14 I15 I16. . . . . . Decoded/Renamed Instruction Trace
Instruction Memory Subsystem (Trace Cache, L1 I−Cache)
Figure 7.1: A Processor with Clustered Execution ResourcesC2 and C3 are clusters identical to Cluster 1 and Cluster 4.
issue time or at retire time. Dynamic issue-time cluster assignment occurs
after instructions are fetched and decoded. In recent literature, the prevailing
philosophy is to assign instructions to a cluster based on data dependencies
and workload balance [20, 85, 95, 126]. The precise method varies based on
the underlying architecture and execution cluster characteristics.
Typical issue-time cluster assignment strategies do not scale well. De-
pendency analysis is an inherently serial process that must be performed in
parallel on all fetched instructions. Therefore, increasing the width of the mi-
croarchitecture further delays this dependency analysis (also noted by Zyuban
et al. [126]). Accomplishing even a simple steering algorithm requires addi-
tional pipeline stages early in the instruction pipeline.
A trace cache environment facilitates the use of retire-time cluster as-
signment and allows the issue-time dynamic cluster assignment logic and steer-
ing network to be removed entirely. Instead of performing cluster selection,
106

instructions are issued directly to clusters based on their physical instruction
order in a trace cache line or instruction cache block. Cluster assignment is
accomplished at retire time by physically (but not logically) reordering in-
structions so that they are issued directly to the desired cluster. Shifting the
cluster assignment mechanism addresses many of the problems associated with
issue-time cluster assignment.
Friendly et al. present a retire-time cluster assignment strategy for a
trace cache processor based on intra-trace data dependencies [39]. The trace
cache fill unit is capable of performing advanced analysis since the latency at
retire time is more tolerable and less critical to performance [39, 51]. The
shortcoming of this strategy is that the dynamic execution information that
is readily available at issue time, is absent at retire time. For instance, data
dependency and workload balance information for future invocations of an
instruction are not known at instruction retirement. Zyuban et al. suggest
placing static cluster assignments in the trace cache, but do not provide details,
results, or analysis [126].
7.1.2 Understanding Inter-Trace Data Dependencies
The fill unit accurately determines intra-trace dependencies. A trace is
an atomic trace cache unit. Therefore, the same intra-trace instruction data
dependencies will exist when the trace is fetched later. However, incorporat-
ing inter-trace dependencies at retire time requires a prediction of issue-time
dependencies, some of which may occur thousands or millions of cycles in the
future. Therefore, it is useful to understand whether inter-trace dependencies
are predictable based on history data, and whether accurate prediction leads
to improved performance.
107

The effects on performance due to eliminating dependency-related la-
tencies have been studied in the past [5, 6] but are reproduced for this dis-
sertation. If all data forwarding between instructions takes place in the same
cycle (i.e., with no latency), then theoretic performance improves by 25.8%.
The notion of a critical input is also explored. For instructions with two data
sources, the data input that arrives last is considered to be the critical input.
If all critical data dependencies requires zero latency for data forwarding, 91%
of the ideal performance can be achieved.
Speedups due to independently eliminating inter-trace and intra-trace
data forwarding latencies are reported in earlier work [5, 6]. The key ob-
servations when isolating the two types of data dependencies are that: 1)
even though inter-trace dependencies are one-third as frequent as intra-trace
dependencies, they have similar performance effects in isolation, and 2) inter-
trace data dependencies must be optimized to achieve even one-half the ideal
speedup possible from cluster assignment.
These observations illuminate an opportunity for an execution history-
based mechanism to provide performance improvements by predicting the
source clusters of data producers for instructions with inter-trace dependen-
cies. Table 7.1 examines how often an instruction’s forwarded data comes from
the same producer instruction, as identified by its address. For each static in-
struction, the address of the last producer is tracked for each source register
(RS1 and RS2). The table shows that an instruction’s data forwarding pro-
ducer is the same for RS1 97.9% of the time and the same for RS2 95.2% of
the time.
The last two columns isolate only the critical producers of inter-trace
consumers. These percentages are expectedly lower, but producers are still the
108

Table 7.1: Frequency of Repeated Data Forwarding Producers
All Critical Inter-traceInput RS1 Input RS2 Input RS1 Input RS2
bzip2 99.67% 99.70% 98.56% 99.18%crafty 97.37% 98.35% 87.42% 94.75%eon 97.48% 92.27% 91.04% 79.41%gap 97.93% 93.79% 83.81% 81.00%gcc 98.95% 96.11% 94.63% 87.68%gzip 99.33% 99.17% 97.56% 96.71%mcf 98.45% 97.10% 91.39% 93.18%parser 98.13% 86.66% 88.28% 77.94%perlbmk 94.93% 94.29% 75.04% 77.47%twolf 96.65% 92.95% 88.41% 79.80%vortex 96.72% 95.55% 86.49% 85.54%vpr 99.35% 96.66% 96.24% 93.53%average 97.91% 95.22% 89.90% 87.18%
same for 89.9% of the critical inter-trace RS1 inputs and for 87.2% of the crit-
ical inter-trace RS2 inputs. Therefore, mechanisms to predict the forwarding
producer can work with a high degree of success.
Although the same instruction address is repeatedly producing data
for the inputs, this does not mean that the inputs are coming from the same
cluster or the same trace. Inter-trace dependencies do not necessarily arrive
from the previously encountered trace. They could arrive from any trace in
the past. Also remember that static instructions are sometimes incorporated
into several different dynamic trace blocks. Therefore, it is also relevant to
determine if inter-trace dependencies are arriving from the same unique trace
block.
Table 7.2 analyzes the distance between an instruction and its critical
inter-trace producer. This distance is measured in the number of dynamic
instructions issued between the data dependent instructions. The values in
109

the table are the percentages of consumer instructions that encounter the
same data dependence distance in consecutive executions. This percentage
correlates well to the percentages in the last two columns of Table 7.1. On
average, 89.4% of critical inter-trace forwarding is the same distance from a
producer as the previous dynamic instance of the instruction.
Table 7.2: Frequency of Repeated Critical Inter-Trace Forwarding Distances
bzip2 99.00%crafty 93.36%eon 88.40%gap 88.72%gcc 91.70%gzip 96.76%mcf 91.56%parser 85.67%perlbmk 81.70%twolf 76.31%vortex 89.71%vpr 90.24%average 89.43%
Distance is measured in number of retired instructions.
7.2 Cluster Assignment Evaluation Methodology
The baseline architecture for this cluster assignment work differs slightly
from the configuration presented in Chapter 4. These changes are implemented
to emphasize the trends in data forwarding networks and clustered execution
resources.
Baseline Changes The default cluster assignment mechanism in this chap-
ter steers instructions to a cluster based on their physical placement in the
110
instruction buffer. Instructions are sent in groups of four to the corresponding
cluster where they are routed on a smaller crossbar to the proper reservation
station. This style of partitioning results in less complexity and fewer poten-
tial pipeline stages, but restricts issue-time flexibility and steering power. A
load-balancing scheme is used in the rest of this dissertation.
The other fundamental change to the baseline microarchitecture is the
latency to communicate between clusters. In this chapter, forwarded instruc-
tion data requires two cycles to reach a neighboring cluster. Forwarding be-
yond an adjacent cluster takes an additional two cycles for each traversed
cluster. The end clusters (clusters 1 and 4) do not communicate directly. A
uniform two cycle forwarding latency is used in the other chapters.
These results differ slightly from those in previous work [5, 6] due to
the more recent nature of the performance simulator, a different instruction
stream window for the benchmark programs, and increased penalties for mis-
speculation.
Cluster Assignment Options The feedback-directed retire-time cluster
assignment implemented with ScatterFlow Framework per-instruction hints is
compared to two other cluster assignment schemes. In the issue-time cluster
assignment, instructions are distributed to the cluster where one or more of the
input data are known to be generated. Inter-trace and intra-trace dependencies
are visible, and a limit of four instructions is assigned to each cluster every
cycle. Besides simplifying hardware, this also balances the cluster workloads.
This option is examined with zero latency and with four cycles of latency for
dependency analysis, instruction steering, and routing.
The other primary comparison point is the Friendly retire-time cluster
111
assignment scheme. This is the only previously proposed fill unit cluster as-
signment policy. Friendly et al. propose a fill unit reordering and assignment
scheme based on intra-trace dependency analysis [39]. Their scheme assumes
a front-end scheduler restricted to simple slot-based issue, as in this chap-
ter’s baseline model. For each issue slot, each instruction is checked for an
intra-trace input dependency in the respective cluster. Based on these data
dependencies, instructions are physically reordered within the trace.
7.3 Feedback-Directed Retire-Time Cluster Assignment
This section presents the background, motivation, and details for a
feedback-directed, retire-time (FDRT) instruction reordering and cluster as-
signment scheme implemented in the ScatterFlow Framework. The proposed
cluster assignment strategy improves retire-time cluster assignment by assign-
ing instructions to a cluster based on both intra-trace and inter-trace depen-
dencies. In addition, the critical instruction input is identified and considered
in the assignment strategy. The ScatterFlow history data packets contain the
inter-trace dependency and critical input information.
The fill unit physically reorders instructions to match the desired cluster
assignments. When the trace is later fetched from the trace cache, the instruc-
tions issue to the proper cluster based on their physical position. Logically,
the instructions remain in the same order. The logical ordering is marked in
the trace cache line by the fill unit. Though this adds some complexity, tech-
niques such as pre-computing register renaming information and pre-decoding
instructions compensate and lead to an overall complexity decrease. The pri-
mary contribution of physical reordering is that it reduces inter-cluster commu-
nications while maintaining low-latency, complexity-effective issue-time logic.
112

7.3.1 Pinning Instructions and the Assignment Strategy
One goal of ScatterFlow FDRT cluster assignment is to speculatively
assign dependent inter-trace instructions to the same cluster. This not only re-
quires identifying the dependent pairs but also identifying the cluster to which
they should be assigned. To accomplish this, designated producers of inter-
trace dependencies are provided with a suggested destination cluster. Later
on, the fill unit attempts to accommodate this suggestion. These instructions
pass this cluster value to their inter-trace consumers and those consumers pass
it to their inter-trace consumers and so on. In this manner, key producers and
their inter-trace consumers are routed to the same cluster.
This chaining forces intra-cluster data forwarding between inter-trace
dependencies, and in the process a cluster chain of instructions with inter-trace
dependencies is created. The first instruction of the cluster chain is called a
leader. The subsequent links of the chain are called followers.
Physically reordering instructions at retire time based on inter-trace
data dependency history can cause more inter-cluster data forwarding than
it eliminates. The same trace of instructions can be reordered in a different
manner each time the trace is constructed. Producers may shift from one
cluster to another, never allowing consumers to accurately gauge the cluster
from which their input data is produced.
To eliminate this effect, when an instruction is assigned to a cluster
chain as a leader or a follower, its suggested execution cluster never changes.
The idea is to permanently pin a leader to one cluster and not permit the
leader or its followers to change their chain cluster. The criteria for selecting
inter-trace dependency cluster chain leaders and followers are presented in
earlier work [6].
113
The fill unit now has access to intra-trace data dependencies, inter-trace
data dependencies, and critical input information. There is enough retire-time
information during trace construction to establish intra-trace dependencies.
The inter-trace dependencies and critical input information are available as
optimization hints delivered by the ScatterFlow Framework. The available
information is used in a two-pass assignment strategy that is explained in
detail in related work [6].
The primary goal of the assignment strategy is to minimize the number
of clusters that must be traversed when forwarding data between instructions.
An emphasis is placed on assigning identified data-consuming instructions to
the same cluster as their producer or to a cluster that neighbors their producer.
Instructions that are not identified as consumers are assigned to clusters based
on their producer status.
7.3.2 Collecting Inter-Trace Information Using The Framework
The ScatterFlow Framework provides optimization hints for retire-time
cluster assignment. Every instruction that is fetched into the processor must be
assigned to an execution cluster. Therefore, every instruction is a candidate to
accumulate history data for this cluster assignment optimization. The cluster
assignment history data packet is presented in Figure 7.2 and described below.
Total, only eight bits of execution history are required for each history data
packet.
• Leader/Follower Value: The two-bit field indicates whether the instruc-
tion is a leader or follower in an inter-trace dependency chain.
114

INSTR leader/follower pinned cluster # confidence cntr critical input src
FDRT History Data Packet
2 bits 2 bits 2 bits 2 bits
Figure 7.2: ScatterFlow Cluster Assignment History Data Packet
• Confidence Counter: The two-bit counter must reach a value of two
before an instruction is qualified to be a leader. It is incremented when
the established leader criteria [6] are met and decremented otherwise.
This prevents instructions with variable behavior from becoming pinned
chain leaders.
• Pinned Execution Cluster Number: The field holds the pinned cluster
number. Inter-trace data producers forward the two-bit value along with
data to its inter-trace data consumers.
• Critical Input Source: This two-bit counter tracks which input source
register is satisfied last. When the counter is saturated at zero, then
RS1 is the critical input source. When the counters is saturated at
three, then RS2 is the critical input source. This criticality information
is used to focus the cluster assignment policies.
The history data are not read until retire time, but they are modified
during the out-of-order execution in the microarchitecture core. Therefore, the
history data packets must arrive at instruction issue with their corresponding
instructions. Because all instructions are potential targets for cluster assign-
ment optimization, all of the reservation stations must be extended to handle
the history data. However, the reorder buffer, load queue, store buffer, and
115

most other places do not. As an extra energy optimization, it is possible to
start the access of the history storage at the same time as the third phase
of the instruction fetch so that the history storage access overlaps the third
instruction fetch stage, decode, and rename. Using these design suggestions,
the total number of latches is 2048, as shown in Table 7.3. This is only 5.6%
of the total number of latches presented in Chapter 5.
Table 7.3: Sources of History Data Latches for ScatterFlow Cluster Assignment
Location Total Packets Number of LatchesIssue Stage 16 128Reservation Stations 160 1280Fill Unit 80 5120Total 256 2048
7.4 Results and Analysis
This section first presents the performance comparison of ScatterFlow
FDRT, issue-time, and the previous retire-time cluster assignment strategies.
ScatterFlow FDRT cluster assignment is found to work the best on average
for the benchmark suite. This section also analyzes the ScatterFlow FDRT
cluster assignment strategy in more detail, and further stresses the importance
of the Framework’s per-instruction hints.
7.4.1 ScatterFlow Performance
Figure 7.3 presents the execution time speedups normalized to the base-
line architecture for different dynamic cluster assignment strategies. The two
retire-time instruction reordering strategies are compared to issue-time in-
116

struction steering in Figure 7.3. In one case, instruction steering and routing
is modeled with no latency (labeled as No-lat Issue-time) and in the other
case, four cycles are modeled (Issue-time).
The results show that ScatterFlow FDRT cluster assignment is the best
overall option studied, with a 6.4% improvement over the baseline assignment
strategy. However, the latency-free issue-time cluster assignment is preferable
for half of the programs. The issue-time assignment strategy in this work
concentrates on increasing intra-cluster data forwarding, but does not heavily
weight the load balance, critical inputs, or inter-cluster forwarding distance.
For mcf, which is memory bound, the scheduling priorites are not appropriate.
When applying a four-cycle latency, the issue-time assignment is only prefer-
able to ScatterFlow FDRT assignment for three of the benchmark programs,
and, on average, the performance drops by 1.9% compared to the base.
0.90
0.95
1.00
1.05
1.10
1.15
1.20
1.25
1.30
1.35
1.40
bzp gcc crf eon gap gzp mcf psr prl twf vor vpr HM
No-lat Issue-time Issue-time FDRT Frendly
Figure 7.3: Speedup Due to Cluster Assignment Strategy
117

The reasons that ScatterFlow FDRT assignment provides a perfor-
mance boost over Friendly’s previous retire-time (Previous RT) method and
the baseline assignment method are an increase in intra-cluster forwarding
and a reduction in average data forwarding distance. Table 7.4a presents the
changes in intra-cluster forwarding. On average, both retire-time cluster as-
signment schemes increase the amount of same-cluster forwarding to above
50%, with ScatterFlow FDRT assignment doing better.
The inter-cluster distance has the biggest effect on performance (Ta-
ble 7.4b). For every benchmark, the retire-time instruction reordering schemes
can improve upon the average forwarding distance. In addition, the Scatter-
Flow FDRT scheme usually provides shorter overall data forwarding distances
than the Friendly method. The short distances are accomplished by funnel-
ing producers with no input dependencies to the middle clusters and placing
consumers as close as possible to their producers.
The results presented in Table 7.4 provide insight into the three occa-
sions (eon, gap, and parser) where the previous retire-time assignment method
outperforms the ScatterFlow FDRT assignment. In each of those cases, the
Friendly retire-time scheme provides more intra-cluster data forwarding be-
cause the inter-trace dependencies are not as critical.
7.4.2 Effects of Framework Hints on Assignment
Figure 7.4 is a breakdown of instructions based on the data dependency
that led to their cluster assignment in the ScatterFlow FDRT strategy. On
average, 38% of instructions have only a critical intra-trace dependency, while
21% of the instructions have only an inter-trace chain dependency. Only 10% of
the instructions have both a chain inter-trace dependency and a critical intra-
118

Table 7.4: Data Forwarding Distance for Critical Inputsa. Percentage of Intra-Cluster Forwarding
Base Previous RT ScatterFlow FDRTbzip2 36.35% 55.95% 69.22%crafty 39.92% 58.24% 60.18%eon 35.54% 59.49% 58.90%gap 46.20% 62.27% 60.45%gcc 49.12% 60.66% 63.21%gzip 35.87% 56.99% 54.01%mcf 56.53% 65.66% 62.35%parser 46.26% 60.07% 56.35%perlbmk 48.60% 59.76% 65.84%twolf 46.85% 58.54% 60.64%vortex 42.72% 56.16% 62.05%vpr 40.90% 61.45% 60.89%average 43.74% 59.60% 61.17%
b. Average Data Forwarding DistanceBase Previous RT ScatterFlow FDRT
bzip2 0.92 0.77 0.42crafty 0.87 0.65 0.52eon 0.90 0.60 0.56gap 0.75 0.52 0.54gcc 0.66 0.54 0.45gzip 0.90 0.72 0.60mcf 0.55 0.46 0.49parser 0.70 0.55 0.53perlbmk 0.73 0.60 0.41twolf 0.71 0.62 0.52vortex 0.78 0.67 0.46vpr 0.86 0.63 0.55average 0.78 0.61 0.50
The critical input is the data input that arrives last.If there is only one input for the instruction, thenit is the critical input. Distance is the number ofclusters traversed by forwarded data.
trace dependency. Therefore, 31% of instructions (only inter-trace plus intra
& inter) are assigned to clusters based on the data profiled by the ScatterFlow
Framework’s per-instruction hints.
119
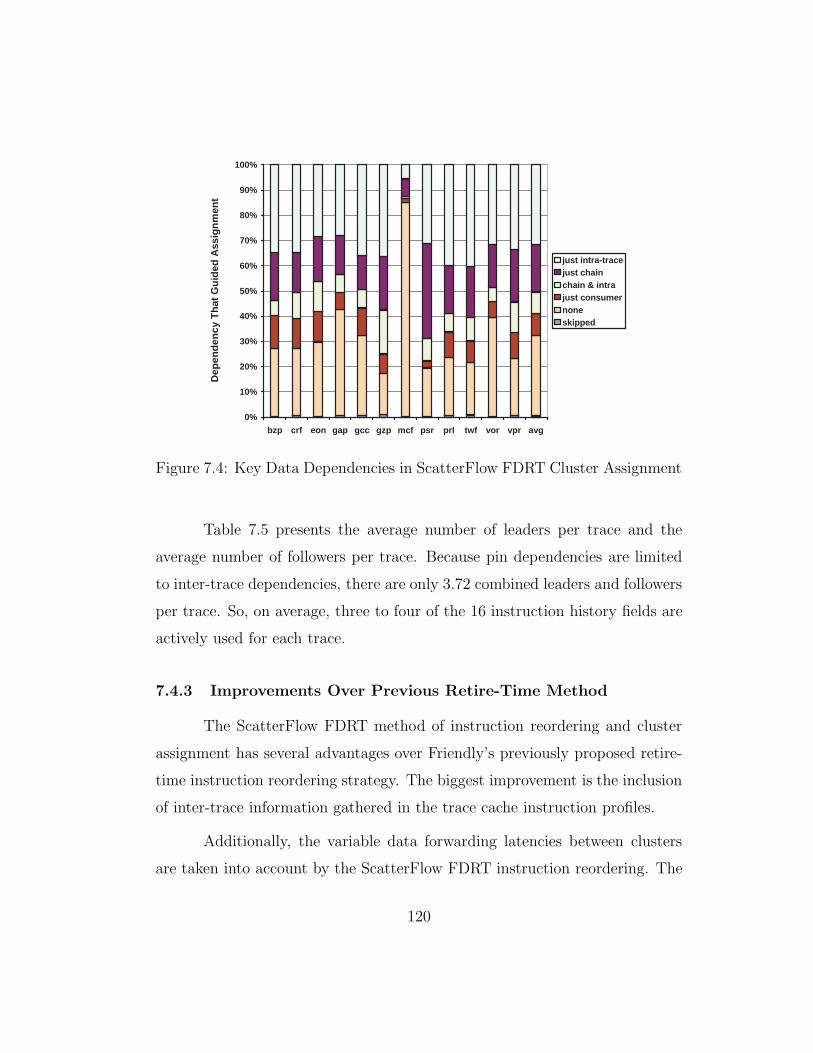
0%
10%
20%
30%
40%
50%
60%
70%
80%
90%
100%
bzp crf eon gap gcc gzp mcf psr prl twf vor vpr avg
Dep
ende
ncy
Tha
tGui
ded
Ass
ignm
ent
just intra-tracejust chainchain & intrajust consumernoneskipped
Figure 7.4: Key Data Dependencies in ScatterFlow FDRT Cluster Assignment
Table 7.5 presents the average number of leaders per trace and the
average number of followers per trace. Because pin dependencies are limited
to inter-trace dependencies, there are only 3.72 combined leaders and followers
per trace. So, on average, three to four of the 16 instruction history fields are
actively used for each trace.
7.4.3 Improvements Over Previous Retire-Time Method
The ScatterFlow FDRT method of instruction reordering and cluster
assignment has several advantages over Friendly’s previously proposed retire-
time instruction reordering strategy. The biggest improvement is the inclusion
of inter-trace information gathered in the trace cache instruction profiles.
Additionally, the variable data forwarding latencies between clusters
are taken into account by the ScatterFlow FDRT instruction reordering. The
120

Table 7.5: Dynamic Per Trace Profiled Leader and Follower Averages
# of Leaders # of Followersbzip2 1.27 2.07crafty 1.64 1.92eon 1.15 1.75gap 1.62 3.00gcc 0.65 1.17gzip 2.38 2.90mcf 1.24 3.09parser 0.93 3.85perlbmk 1.15 2.16twolf 1.32 2.28vortex 1.16 1.76vpr 2.06 2.11average 1.38 2.34
inter-cluster forwarding latency is variable based on the distance between the
communicating clusters. Therefore, the ScatterFlow FDRT strategy funnels
instructions to the middle clusters when possible, reducing the amount of
data forwarding that must span two and three clusters. For example, if the
Friendly instruction placement is modified to assign most instructions to the
middle clusters, the average performance improvement increases to 3.3% from
3.1%.
Finally, Friendly’s strategy examines each instruction slot and looks
for a suitable instruction while the ScatterFlow FDRT method looks at each
instruction and finds a suitable slot. This subtle difference accounts for some
performance improvement as well. Additional analysis shows that performing
only the intra-trace heuristics from the ScatterFlow FDRT strategy results
in a 4.1% improvement, compared to the 3.1% for Friendly’s method. The
remaining performance improvement generated by ScatterFlow FDRT assign-
121

ment comes from incorporating inter-trace dependency information.
7.5 Discussion
In this ScatterFlow Framework example, the history data are optimiza-
tion hints that assist an existing mechanism, retire-time cluster assignment.
A retire-time trace cache fill unit performs better cluster assignment using dy-
namically captured data dependency and criticality history data. The history
packet size is small because the data consists mostly of small fields such as
two-bit counters, two-bit execution cluster numbers, and one-bit state indica-
tor fields.
The wide instruction coverage aspect of the ScatterFlow Framework is
critical to this application because every instruction is assigned to a cluster.
Although not every instruction actively uses the hint for optimization, it is
not possible to determine which dynamic instruction might need the hint be-
forehand. Therefore, achieving instruction-level history is critical to gaining
the maximum performance from this optimization.
The ScatterFlow Framework’s decentralized history data flow is also
used well by this application. The identification of inter-trace producers and
consumers and their communications take place deep within the microarchitec-
ture. Retrieving data from and updating to a large global instruction history
table requires intrusive, long-distance communications.
There are additional uses for ScatterFlow optimizations hints. A history-
driven mechanism with two levels of tables can be redesigned using the Scat-
terFlow Framework history data and only one level of tables. For example,
a memory renaming implementation uses one level of tables to capture store-
122

load relationships and to hold an index into another level of tables which hold
the store values [120]. A ScatterFlow Framework implementation could track
the store-load relationships and value file indices in the history data packets.
The use of the Framework eliminates the need for one table and increases the
instruction coverage.
ScatterFlow optimization history data can also be used to provide a
speculative index into a table. For example, history data has been used to
selectively index a traditional value prediction table at fetch time [9]. This
increases the overall accuracy of value prediction and the useful instruction
bandwidth to the value predictor. Storing a table index in a history data
packet also permits existing tables to be updated in an advanced manner at
retire time, but indexed directly with the per-instruction hint.
123

Chapter 8
Execution Trait Profiling Using the
Framework
This chapter studies the profiling ability of the ScatterFlow Framework
when supporting a generalized high-level dynamic optimizer. In this work, the
retired instruction stream is monitored for instruction-level execution charac-
teristics. The detection ability of the Framework is compared against that of
per-address history tables of both fixed and unlimited sizes.
8.1 Background
One proposed use of the ScatterFlow Framework is to provide instruction-
level execution history to high-level dynamic optimizers, such as just-in-time
compilers and profiling co-processors. In this scenario, the Framework is the
history capture mechanism that feeds the high-level optimizer. For exam-
ple, the high-level optimizer might periodically sample the retiring execution
stream for a certain type of execution characteristic, such as value invari-
ance [69]. Upon detecting this run-time instruction trait, the instruction
stream is optimized [46, 125]. The job of the ScatterFlow Framework is to
manage the history data for all the instructions.
The analysis compares the history capture abilities of the ScatterFlow
Framework and traditional table storage when employed by the hypothetical
124

high-level dynamic optimizer. The following instruction traits are profiled:
branch bias, memory dependence, result value invariance, and constant data
dependency distance. The four presented traits are chosen to represent a
variety of behaviors for different classes of instructions.
Branch Bias A conditional branch is biased if the branch direction con-
tinuously evaluates to the same value. Knowing a branch’s directional bias
is useful to both hardware and software. A classifying branch predictor [23]
treats biased branches differently from branches with more irregular behavior.
A software dynamic compiler can reorganize the instruction stream to match
the dynamic program flow and make more aggressive optimizations. Similarly,
a hardware post-retirement optimizer can use this characteristic of a branch
to construct a better performing instruction stream in hardware [77, 90].
Value Invariance Value invariance occurs when a result value does not
change. This knowledge is helpful to microarchitecture mechanisms like last
value predictors and classifying value predictors [106]. Dynamic compilers
that perform constant value propagation can make use of this information
for highly-aggressive optimizations [3]. All result-producing integer arithmetic
and load instructions are profiled for value invariance.
Memory Dependence Many load instructions retrieve a recently stored
value. These memory dependence relationships are difficult to detect stati-
cally, but dynamic detection benefits many different optimizations. In hard-
ware, disambiguation hardware [27, 42] uses this dynamic knowledge to im-
prove speculative issuing of load instructions in the presence of uncalculated
125
store addresses. Memory renaming hardware uses the detection of a load-store
relationship to speculatively fulfill load requests [81, 120]. In history-driven
optimization software, understanding memory relationships improves the ag-
gressiveness and quantity of optimizations. For instance, a load can be moved
above a store if it is determined that the store never (or rarely) conflicts with
the load. The memory dependence relationship between and load and a store
is detected when the a address match is found in the store buffer.
Dynamic Instruction Dependence Distance The dynamic instruction
dependence distance is the number of executed instructions between an in-
struction and the producer of its data. This information is useful for on-chip
scheduling, specifically cluster scheduling [39, 95]. Applications for dynamic
software optimizers have not been proposed, but understanding the dynamic
data communications could be helpful. The distance is calculated by compar-
ing tag values when data dependencies are detected at register rename.
8.2 Implementing Within the Framework
For each trait, confidence counters and previous execution history in-
formation are maintained in history storage and history data packets. The
history data packet is illustrated in Figure 8.1. For branch bias, value invari-
ance, and dynamic instruction dependence distance, the counter is three bits.
For memory dependence, the counter is two bits. As noted in Chapter 6, the
maximum value widths for the execution history stored in the history packets
have the potential to be reduced with losing significant performance [70, 71].
126

Execution Trait Detection History Data Packet
branch bias memory dep val invar data instr dist
1 + 3 bits 32 + 2 bits 32 + 2 bits 10 + 3 bits
direction cntr dep PC cntr value cntr distance cntrINSTR
Figure 8.1: Execution Trait Detection History Data Packet
Flowing History Data Energy Requirements As noted in the previous
chapter, the history data storage does not need to be accessed immediately
along with the instruction storage. As an additional optimization for this
analysis, 16 bit values are assumed to work as well as 32 bit values for value
invariance and memory dependence. Note that branch bias (branches), value
prediction (arithmetic and loads), and memory dependence (loads and stores)
are specific to certain instruction types and do not need to be present in
reservation stations that do not support these instruction types. In addition,
memory dependence and load value prediction are detected by the memory
controller though the load queues and store buffers and not in the out-of-order
execution core like the remaining techniques. Given the discussed assumptions
and conditions, Table 8.1 presents the total number of required latches. The
total of 10,565 latches is 29.3% of the “full blown” scenario considered in
Chapter 5.
Detecting Execution Traits A counter is incremented by one when an
instruction’s stored execution history information from the previous execution
matches the current execution information, otherwise the counter is decre-
mented by one. A trait is detected when the counters are fully saturated.
Detection is different from speculation because an execution behavior is being
reported and not predicted. When a trait is detected, the counter value is reset
127

Table 8.1: Potential Sources of History Data Latches
Location Total Packets Packet Size Number of LatchesIssue Stage 16 54 864Branch RS’s 32 17 544Load/Store RS’s 32 13 416Arithmetic Op RS’s 64 29 1856Complex Op RS’s 32 29 928Load Queue 32 36 1152Store Buffer 32 18 576Fill Unit 80 54 4320Total 320 33.3 (avg) 10,656
RS stands for reservation station. Total packets is the number of instruc-tions storage locations that require history data. Packet size is the numberof bits required at each location.
to zero. This reset requires the instruction to fully reestablish the execution
trait before it will be detected again.
For comparison, four 4096-entry tables track each individual instruction
trait. Each table captures history only for the subset of instructions that will
use the data. For example, only conditional branches access and update the
branch bias table. Each table entry contains the same counters, thresholds,
and update conditions described above.
8.3 History Capture Comparison
This section compares the number of traits detected when using the
ScatterFlow Framework, an infinite-sized table, and a fixed-size table. After
every 100,000 retired instructions, the history data of the next 500 retired
instructions are examined for execution characteristics. The graphs in Fig-
ure 8.2 present the number of trait detections for the ScatterFlow Framework
and 4096-entry tables normalized to the number of trait detections for the
128

infinite-sized table.
0.4
0.5
0.6
0.7
0.8
0.9
1.0
1.1
1.2
1.3
1.4
1.5
1.6
1.7
1.8
bzp crf eon gap gcc gzp mcf psr prl twf vor vpr HM
Nor
mal
ized
Tra
itD
etec
tions
ScatterFlow Framework 4k-entry Table
0.4
0.5
0.6
0.7
0.8
0.9
1.0
1.1
1.2
1.3
1.4
1.5
bzp crf eon gap gcc gzp mcf psr prl twf vor vpr HM
Nor
mal
ized
Tra
itD
etec
tions
ScatterFlow Framework 4k-entry Table
a. Branch Bias b. Value Invariance
0.6
0.7
0.8
0.9
1.0
1.1
1.2
1.3
1.4
bzp crf eon gap gcc gzp mcf psr prl twf vor vpr HM
Nor
mal
ized
Tra
itD
etec
tions
ScatterFlow Framework 4k-entry Table
4.9
0.4
0.5
0.6
0.7
0.8
0.9
1.0
1.1
1.2
1.3
1.4
bzp crf eon gap gcc gzp mcf psr prl twf vor vpr HM
Nor
mal
ized
Tra
itD
etec
tions
ScatterFlow Framework 4k-entry Table
c. Memory Dependence d. Dynamic Instruction DependenceDetection
Figure 8.2: Execution Trait Detection Using the ScatterFlow Framework and4096-Entry Traditional Tables Normalized to an Infinite-Sized Table
The ScatterFlow Framework detects more biased branches than the
fixed-size traditional table for six of 12 programs, more value invariance for 11
of 12 programs, more memory dependence for 11 of 12 programs, and more
fixed dependence distances for nine of 12 programs. Overall, there is a clear
preference for using the trace style of history storage.
The ScatterFlow Framework is not better in all cases. The Framework
struggles to detect execution traits for the gcc program, which executes the
129

fewest instructions from the trace cache. The other troublesome programs for
the Framework, vortex and crafty, also have lower trace cache hit rates, higher
eviction rates, lower instruction coverage, and less history maturity.
Figure 8.2 reveals that the ScatterFlow Framework can outperform an
infinite-sized table. Additional trait detections occur because some traits are
only observable by using the Framework’s path-based history storage instead of
a per-address table. These detections illustrate the importance of path-based
correlation on instruction-level execution characteristics. The Framework pro-
vides superior detection to an infinite per-address table for six programs in
branch bias detection, for seven programs in value invariance detection, for
six programs in memory dependence detection, and for six programs in fixed
dependence distance detection.
The individual programs that perform best in the Framework are gzip,
mcf, and parser. In Chapter 5, these programs display the most history data
multiplicity and the strongest tendency toward path-based behavior. These
characteristics help explain how these three programs constantly outperform
an infinite-sized per-address table.
8.4 Unique Detections
The graphs in Figure 8.3 present a breakdown of unique trait detections
found using the ScatterFlow Framework and traditional tables. An execution
trait detection is unique if one history capture design, but not the other, identi-
fies an instruction trait. The upper section of the bar represents the percentage
of unique trait detections achieved by the Framework due to its path-based na-
ture (Frame-perpath). The next section of the bar is the percentage of unique
traits detected by the Framework due to superior history age (Frame-mature).
130

0%
10%
20%
30%
40%
50%
60%
70%
80%
90%
100%
bzp crf eon gap gcc gzp mcf psr prl twf vor vpr all
Uni
que
Inst
ruct
ion
Tra
itD
etec
tions
Frame-perpathFrame-matureTable-perinstrTable-mature
0%
10%
20%
30%
40%
50%
60%
70%
80%
90%
100%
bzp crf eon gap gcc gzp mcf psr prl twf vor vpr all
Uni
que
Inst
ruct
ion
Tra
itD
etec
tions
Frame-perpathFrame-matureTable-perinstrTable-mature
a. Branch Bias b. Value Invariance
0%
10%
20%
30%
40%
50%
60%
70%
80%
90%
100%
bzp crf eon gap gcc gzp mcf psr prl twf vor vpr all
Uni
que
Inst
ruct
ion
Tra
itD
etec
tions
Frame-perpathFrame-matureTable-perinstrTable-mature
0%
10%
20%
30%
40%
50%
60%
70%
80%
90%
100%
bzp crf eon gap gcc gzp mcf psr prl twf vor vpr all
Uni
que
Inst
ruct
ion
Tra
itD
etec
tions
Frame-perpathFrame-matureTable-perinstrTable-mature
c. Memory Dependence d. Dynamic Instruction DependenceDetection
Figure 8.3: Breakdown of Unique Execution Trait Detections
Superior history age occurs when one structure identifies a trait while
the other does not yet have enough updates to possibly report a detection.
If both structures have ample updates and only the ScatterFlow Framework
detects an execution trait, then the difference is attributed to the path na-
ture of the Framework history storage and update. Following the same line of
thought, similar percentages are presented for the table history storage struc-
ture. Table-perinstr is the percentage of unique trait detections due to the
per-address nature of traditional table updates, and Table-mature is the per-
centage of unique detections that result from superior age in the traditional
131

table.
The bar titled all represents a summation of the unique trait detec-
tions from both the ScatterFlow Framework and traditional table for the 12
benchmark programs. For each profiled trait, the Framework is responsible for
a larger percentage of the unique detections than the tables. In branch bias
detection, 55% of unique detections are captured by the Framework (Frame-
perpath + Frame-mature). The percentage of unique detections by the Frame-
work for memory dependence detection, value invariance detection, and de-
pendency distance detection are 64%, 67%, and 56%, respectively.
Notice that on the same occasions where the ScatterFlow Framework
detects more overall traits than the tables (Figure 8.2), the Framework also has
more unique detections than the tables and vice-versa. Therefore, the more
interesting aspect is whether the unique detections are due to the path-based
behavior or history maturity. This distinction is also portrayed in Figure 8.3.
The all bar shows that, overall, the Framework provides more unique
detections due to superior history age for memory dependence and value invari-
ance detection than the traditional table (Frame-mature versus Table-mature).
However, for the other two execution traits, the table produces more unique
detections due to a history age advantage. As for the path-based history col-
lection of the Framework, it is responsible for many more unique detections
than the undiluted per-address nature of the traditional tables in each case
(Frame-perpath versus Table-perinstr).
132

8.5 Importance of Instruction Coverage
This section compares the ScatterFlow Framework with a different
table-based method for collecting instruction-level execution behavior. Small
hardware history collection tables are often proposed to support a high-level
history-driven optimizer. There are several ways to choose the instructions
which get access to the table. One way is to dynamically determine the most
frequently executed instructions and only examine those instructions.
Figure 8.4 examines the percentage of detected traits that belong to
the most frequently executed instructions. The instruction frequency is broken
into four sections within each bar in the figure. Each section is cumulative.
For example, the percentage of detections that occur due to the 100 most
frequently instructions is found by combining the Top 10 and Top 100 sections
of the bar.
The graphs show that the 10 most executed instructions are rarely suf-
ficient to account for 10% of the instruction execution trait detections. Even
monitoring the top 100 dynamically executed instructions usually accounts for
less than 50% of the trait detections. Here, high instruction coverage would
help trait detection because it is difficult to dynamically or statically pick
a subset of instructions that will exhibit a certain characteristic. The Scat-
terFlow Framework design permits this type of expansive reach without the
design complexities and limitations of traditional per-address history tables.
8.6 Discussion
This section evaluates the ScatterFlow Framework as a history capture
mechanism for a generalized high-level history-driven dynamic optimizer. The
133
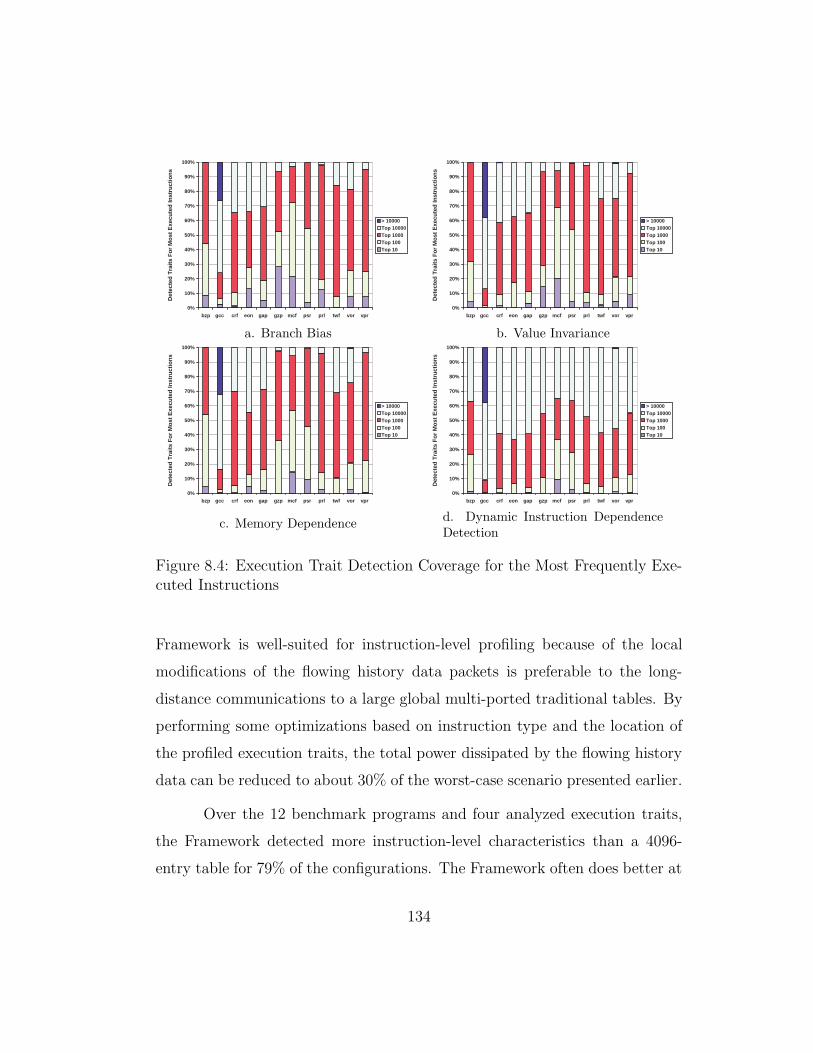
0%
10%
20%
30%
40%
50%
60%
70%
80%
90%
100%
bzp gcc crf eon gap gzp mcf psr prl twf vor vpr
Det
ecte
dT
raits
For
Mos
tExe
cute
dIn
stru
ctio
ns
> 10000Top 10000Top 1000Top 100Top 10
0%
10%
20%
30%
40%
50%
60%
70%
80%
90%
100%
bzp gcc crf eon gap gzp mcf psr prl twf vor vpr
Det
ecte
dT
raits
For
Mos
tExe
cute
dIn
stru
ctio
ns
> 10000Top 10000Top 1000Top 100Top 10
a. Branch Bias b. Value Invariance
0%
10%
20%
30%
40%
50%
60%
70%
80%
90%
100%
bzp gcc crf eon gap gzp mcf psr prl twf vor vpr
Det
ecte
dT
raits
For
Mos
tExe
cute
dIn
stru
ctio
ns
> 10000Top 10000Top 1000Top 100Top 10
0%
10%
20%
30%
40%
50%
60%
70%
80%
90%
100%
bzp gcc crf eon gap gzp mcf psr prl twf vor vpr
Det
ecte
dT
raits
For
Mos
tExe
cute
dIn
stru
ctio
ns
> 10000Top 10000Top 1000Top 100Top 10
c. Memory Dependence d. Dynamic Instruction DependenceDetection
Figure 8.4: Execution Trait Detection Coverage for the Most Frequently Exe-cuted Instructions
Framework is well-suited for instruction-level profiling because of the local
modifications of the flowing history data packets is preferable to the long-
distance communications to a large global multi-ported traditional tables. By
performing some optimizations based on instruction type and the location of
the profiled execution traits, the total power dissipated by the flowing history
data can be reduced to about 30% of the worst-case scenario presented earlier.
Over the 12 benchmark programs and four analyzed execution traits,
the Framework detected more instruction-level characteristics than a 4096-
entry table for 79% of the configurations. The Framework often does better at
134
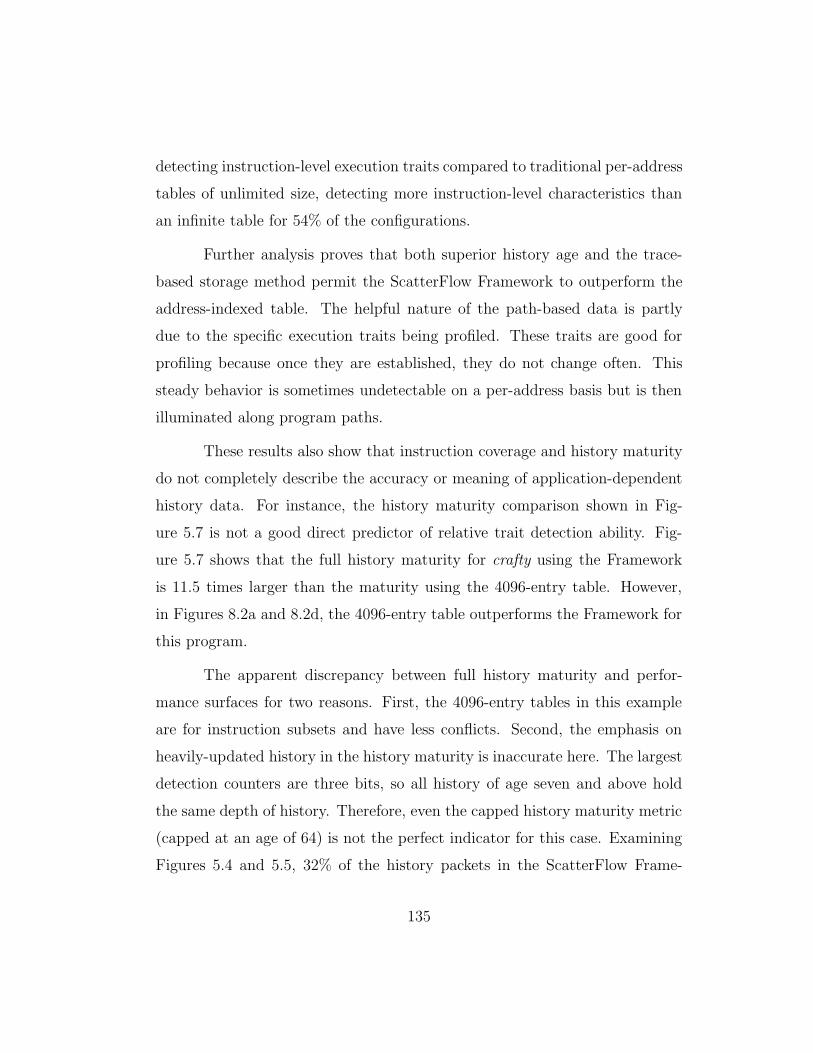
detecting instruction-level execution traits compared to traditional per-address
tables of unlimited size, detecting more instruction-level characteristics than
an infinite table for 54% of the configurations.
Further analysis proves that both superior history age and the trace-
based storage method permit the ScatterFlow Framework to outperform the
address-indexed table. The helpful nature of the path-based data is partly
due to the specific execution traits being profiled. These traits are good for
profiling because once they are established, they do not change often. This
steady behavior is sometimes undetectable on a per-address basis but is then
illuminated along program paths.
These results also show that instruction coverage and history maturity
do not completely describe the accuracy or meaning of application-dependent
history data. For instance, the history maturity comparison shown in Fig-
ure 5.7 is not a good direct predictor of relative trait detection ability. Fig-
ure 5.7 shows that the full history maturity for crafty using the Framework
is 11.5 times larger than the maturity using the 4096-entry table. However,
in Figures 8.2a and 8.2d, the 4096-entry table outperforms the Framework for
this program.
The apparent discrepancy between full history maturity and perfor-
mance surfaces for two reasons. First, the 4096-entry tables in this example
are for instruction subsets and have less conflicts. Second, the emphasis on
heavily-updated history in the history maturity is inaccurate here. The largest
detection counters are three bits, so all history of age seven and above hold
the same depth of history. Therefore, even the capped history maturity metric
(capped at an age of 64) is not the perfect indicator for this case. Examining
Figures 5.4 and 5.5, 32% of the history packets in the ScatterFlow Frame-
135

work are updated less than eight times compared to 38% for the table. The
ScatterFlow Framework still holds an advantage, but the difference is not as
pronounced as with the standard history maturity values.
136

Chapter 9
Framework Tuning and Enhancements
In this chapter, the baseline microarchitecture design choices are ex-
amined in more detail. First, some inefficiencies in the current ScatterFlow
Framework design are presented as motivation and background for the re-
maining discussion. Next, the history management sensitivity to trace storage
size, fill unit latency, and machine width are explored. To address some of
the history capture concerns presented in Chapter 4, the third section revis-
its several trace storage design choices. The last section proposes two unique
design enhancements to improve the accuracy of history data collected using
the Framework.
9.1 History Data Management Inefficiencies
The baseline microarchitecture design is based on a combination of
well-known performance and design complexity trade-offs, but is not based on
considerations for ScatterFlow history data efficiency. The resulting inefficien-
cies are discussed in this section.
9.1.1 Update Lag
In this dissertation, the trace cache fill unit collects instructions at retire
time. This positioning reduces the instruction bandwidth to the fill unit and
137

eliminates wrong-path traces from entering trace storage. Also, in a typical
trace cache environment, the fill unit can tolerate extra latency at retire-time,
allowing the fill unit to perform complex updates and trace constructions for
a negligible performance decrease [5, 38].
In the ScatterFlow Framework, there are drawbacks to the retire-time
fill unit. One problem is the delay between history data fetch and history
storage update, or the update lag. Depending on the type of history data,
the history packet update could take place as early as issue time. However,
the fill unit does not place the updated history data into history storage until
an entire trace of retired instructions has been constructed and all retire-time
optimizations are complete. Therefore, the history packet updates are not
visible in history storage until much later. In traditional history management,
the global reads and writes take place on demand and are therefore spaced
together more closely in time.
The update lag results in the fetch of stale history data that does not
accurately reflect the entire past of the instructions. Figure 9.1 presents the
number of fetches (excluding wrong path fetches) to a trace of data since the
last update. Ideally, this number should be one. After each fetched history
data trace, the trace should be updated in storage before the next fetch occurs.
On average, 63% of fetched history data traces have been updated exactly once
since the previous fetch to that trace.
On average, 21% of fetched history data traces have not been updated
since the last fetch and 16% have been updated more than once. So, over one-
third of the fetched traces are not experiencing ideal update-fetch behavior.
This behavior is the result of the update lag problem as well as block-level
trace builds (discussed later).
138

0%
10%
20%
30%
40%
50%
60%
70%
80%
90%
100%
bzp crf eon gap gcc gzp mcf psr prl twf vor vpr
Tra
ceLi
neF
etch
esB
etw
een
Upd
ates
>102-1010
Figure 9.1: Number of Fetches to a Trace Between Updates
9.1.2 Meaningless Updates
During program execution, multiple dynamic instances of a static in-
struction may exist concurrently in the processor pipeline. In a wide-issue,
deeply-pipelined processor, instructions may take hundreds or thousands of
cycles to retire. In that time, a trace entry may be repeatedly fetched. If the
history data packets have not been updated due to the update lag, then each
access to the history storage will yield the same values.
The fill unit history update logic has no cognizance of other in-flight
instruction instances with the same address. Each in-flight history data packet
is updated as if it is the only active instance. So, not only does each history
data packet have the same initial value, but they could all have the same
value after update. Then, the history data packets overwrite each other in the
history storage. This behavior is particularly bad for counters since a series of
139

instruction executions could ultimately lead to only one stored increment or
decrement.
In traditional history data tables, each update is made only after glob-
ally accessing the most recent data from the table. So, ideally, multiple in-
stances of an instruction should perform multiple updates to the stored history
data packet. Instead, the history packet has the appearance of only one up-
date instead of a more mature history. The overwritten history data packets
perform meaningless updates. One goal of the ScatterFlow Framework is to
maximize the number of updates to fetched history data. Therefore, the his-
tory data packets’ lack of awareness is problematic.
9.1.3 Block-Level Trace Builds
Traces are constructed from basic blocks of retired instructions. The
fill unit treats each retiring block the same. Block-level trace building leads to
traces that are constructed from segments of multiple old traces and possibly
combined with instruction blocks fetched from the instruction cache. In addi-
tion, partial matches of fetched traces are permitted from the trace storage.
These factors result in a flexible, high-performance design that allows a variety
of different trace combinations to be built.
Constructing mismatched and partial traces does not necessarily benefit
the instruction history data collected by the ScatterFlow Framework. Execu-
tion history data are associated with an instruction, not a trace. Therefore,
if an instruction is fetched from one trace and constructed into a different
trace, so is the instruction’s history data. Any path-based correlation that
exists in the previous trace is lost when the packet is constructed into a new
trace. Given the potential usefulness of path-based execution history data,
140

block-level builds are a possible inefficiency.
9.2 Sensitivity Analysis
The performance of the ScatterFlow Framework is dependent on some
of the core microarchitecture components. In this section, the sensitivity to
the trace storage size, fill unit latency, and machine width are explored.
9.2.1 Trace Storage Size
In the ScatterFlow Framework, history data storage size is directly
related to the size of the trace cache to maintain a one-to-one mapping of
history data to instruction slots. Figure 9.2 illustrates the change in instruction
coverage as the size of the trace storage components increases.
0.6
0.7
0.8
0.9
1.0
1.1
1.2
1.3
bzp gcc crf eon gap gzp mcf psr prl twf vor vpr HM
Nor
mal
ized
Inst
ruct
ion
Cov
erag
e
256 512 1024 2048 4096 8192
Figure 9.2: Effect of Trace Storage Size on Instruction CoverageTrace storage size is presented as the number of trace entries.
Trace storage size is presented as the number of trace entries. The
141

graph shows that the instruction coverage increases as the trace storage size
increases. Trace storage with 256 entries has 17.2% less instruction coverage
compared to the baseline 1024-entry trace storage. Increasing the size to 512
entries improves the coverage to within 5.3% of the baseline. Further increasing
the size to 2k-entries, 4k-entries, and 8k-entries helps improve the instruction
coverage beyond the baseline by 2.7%, 4.2%, and 4.6% respectively. Many of
the programs see little benefit after 1024 entries, but for programs with large
instruction footprints, like gcc, larger trace storage sizes continue to increase
instruction coverage.
The history maturity trends for each program in Figure 9.3 follow the
instruction coverage trends in Figure 9.2. On average, 256-entry trace storage
reduces the full history maturity by 59% and capped history maturity by
40% versus the baseline while 8192-entry trace storage increases full history
maturity by 51% and capped history maturity by 18%.
Some programs, such as vortex, exhibit non-uniform full history matu-
rity behavior with the 256-entry trace storage. Here, the smaller storage limits
the amount of instruction redundancy and history packet multiplicity and im-
proves maturity by limiting dilution. Therefore, the total history age in the
trace storage is not increasing, but the average per-history age is increasing.
This same phenomena is not seen with capped history maturity.
9.2.2 Fill Unit Latency
In the ScatterFlow Framework, the retire-time fill unit constructs the
instruction traces as well as the history data traces. Often, the fill unit is
responsible for performing complex history updates. These tasks fall upon the
fill unit because its placement at retire time is off the critical execution path.
142

0.0
0.5
1.0
1.5
2.0
2.5
3.0
bzp gcc crf eon gap gzp mcf psr prl twf vor vpr HM
Nor
mal
ized
His
tory
Mat
urity
256 512 1024 2048 4096 8192
3.7 5.24.4
a. Full History Maturity
0.4
0.6
0.8
1
1.2
1.4
1.6
1.8
2
2.2
bzp gcc crf eon gap gzp mcf psr prl twf vor vpr HM
Nor
mal
ized
His
tory
Mat
urity
256 512 1024 2048 4096 8192
b. Capped History Maturity
Figure 9.3: Effect of Trace Storage Size on History MaturityTrace storage size is presented as the number of trace entries.
Therefore, a long latency does not significantly degrade the performance of a
trace cache processor [5, 38, 39].
The fill unit latency is less tolerable for the ScatterFlow Framework
143

than a traditional trace cache processor. If a freshly-constructed instruction
trace is already in the trace cache, it can be discarded since it does not provide
any new information. However, a new history data trace always provides new
information. The rate at which history data traces are refreshed in history
storage influences the fetched history data values. For example, in a short
loop, the same trace may be fetched repeatedly in a short period of time.
However, the fetched trace is only updated after the fill unit completes the
construction of the history data trace.
The instruction coverage is reduced by an increased fill unit latency.
The increase in update lag delays the availability of constructed traces. So
traces that are available for fetch from the trace storage with no fill unit
latency are no longer available with the long delay. Figure 9.4 shows that for
a 10 cycle or 100 cycle delay, the loss in instruction coverage is less than 1%.
However, for a 1000 cycle delay, there is a 2.7% average decrease in coverage
with a decrease as high as 10% for gcc.
0.88
0.90
0.92
0.94
0.96
0.98
1.00
1.02
bzp gcc crf eon gap gzp mcf psr prl twf vor vpr HM
Nor
mal
ized
Inst
ruct
ion
Cov
erag
e
Fill Lat 0 Fill Lat 10 Fill Lat 100 Fill Lat 1000
Figure 9.4: Effect of Fill Unit Latency on Instruction Coverage
144

Figure 9.5 presents history maturity for fill unit latencies of 10 cycles,
100 cycles and 1000 cycles normalized to the zero cycle case. A longer fill unit
latency decreases the history maturity. Ten cycles of fill unit latency cause
a 12.8% drop in full history maturity (0.7% capped), 100 cycles cause a 31%
drop in full history maturity (1.9% capped), and 1000 cycles cause a 70% drop
in full history maturity (7.3% capped).
The loss in fetched history maturity is due to the increase in update
lag and meaningless updates. Over the course of the entire execution run, the
reduction in useful updates compounds, noticeably lowering the history age.
Notice that it is also possible for the history maturity to increase when the
fill unit latency is increased (as seen in gap) because the fill unit latency is
delaying the eviction of useful history.
Figure 9.6 shows the effect of fill unit latency on performance for Scat-
terFlow value prediction, and Figure 9.7 shows the effect of fill unit latency on
performance for ScatterFlow cluster assignment. A latency of 10 or 100 cycles
does not reduce speedup by more than 1.0% in either case. For ScatterFlow
value prediction, a 10-cycle fill unit latency actually improves performance on
average. A 1000-cycle latency is more detrimental, reducing absolute speedup
by 2.8% for value prediction and by 2.2% for cluster assignment. However,
even with the 1000-cycle latency, some programs see only small degradations
in performance or improvements.
The fill unit latency affects performance in several ways. It delays
updates and evictions to the trace cache, changing the instruction fetch per-
formance. It also delays the update of history data in the history storage.
Both of these consequences of extra latency generally have a negative effect on
performance, but have the potential to improve the interaction with the trace
145

0.0
0.2
0.4
0.6
0.8
1.0
1.2
bzp gcc crf eon gap gzp mcf psr prl twf vor vpr HM
Nor
mal
ized
His
tory
Mat
urity
Fill Lat 0 Fill Lat 10 Fill Lat 100 Fill Lat 1000
a. Full History Maturity
0.60
0.65
0.70
0.75
0.80
0.85
0.90
0.95
1.00
1.05
bzp gcc crf eon gap gzp mcf psr prl twf vor vpr HM
Nor
mal
ized
His
tory
Mat
urity
Fill Lat 0 Fill Lat 10 Fill Lat 100 Fill Lat 1000
b. Capped History Maturity
Figure 9.5: Effect of Fill Unit Latency on History Maturity
storage.
146

0.80
0.85
0.90
0.95
1.00
1.05
1.10
1.15
1.20
1.25
1.30
bzp gcc crf eon gap gzp mcf psr prl twf vor vpr HM
Spe
edup
Ove
rC
hapt
er6
Bas
elin
e
FU Lat 0 FU Lat 10 FU Lat 100 FU Lat 1000
Figure 9.6: Effect of Fill Unit Latency on ScatterFlow Value Prediction
0.90
0.95
1.00
1.05
1.10
1.15
1.20
bzp gcc crf eon gap gzp mcf psr prl twf vor vpr HM
Spe
edup
Ove
rC
hapt
er7
Bas
elin
e
FU Lat 0 FU Lat 10 FU Lat 100 FU Lat 1000
Figure 9.7: Effect of Fill Unit Latency on ScatterFlow Cluster Assignment
9.2.3 Machine Width
The ScatterFlow Framework targets wide instruction issue processors,
and this dissertation concentrates on a 16-wide machine as an example. How-
147

ever, the technology constraints that apply for the presented issue width, clock
frequency, and feature size, are not limited to one machine width. In wider
machines, these constraints are even more pronounced. In a scenario with even
smaller transistors and faster clocks, a reduced issue machine can also face the
same problems with global history tables.
This subsection studies the effectiveness of the ScatterFlow Frame-
work’s history capture ability with alternate machine widths. In this eval-
uation, changing the width of the architecture means corresponding changes
in the trace storage line size, trace storage latency, instruction bandwidth,
instruction window size, ROB entries, and the number of execution clusters.
The remaining resources, such as the memory system and the branch predictor,
remain the same for comparison purposes.
The trace entry size is the most relevant change. For an eight-wide
machine, each trace entry supports a maximum of eight instructions and two
basic blocks. For a 32-wide machine, each trace entry supports a maximum of
32 instructions and six basic blocks.
Figure 9.8 shows the average reduction in history maturity (16.4% for
full and 7.6% for capped) and instruction coverage (2.2%) for the eight-wide
configuration. The effects on history efficiency vary among the programs. The
trace storage in the eight-wide machine is capable of storing only half the data
of the baseline trace storage. Comparing the history data efficiency to the 512-
entry trace storage (which is also half the size of the baseline) in Figures 9.2
and 9.3, the eight-wide trace-based configuration leads to better history data.
Figure 9.9 presents the instruction coverage and history maturity for a
32-wide architecture normalized to the baseline. The 32-wide implementation
decreases the full history maturity by 18.1%, but increases the capped history
148

0.4
0.6
0.8
1.0
1.2
1.4
1.6
1.8
bzp gcc crf eon gap gzp mcf psr prl twf vor vpr HM
Nor
mal
ized
toB
asel
ine
Full History Maturity Capped History Maturity Instruction Coverage
Figure 9.8: Effect of an Eight-Wide Machine on History Maturity and Instruc-tion Coverage
maturity slightly. The decrease in full history maturity is due primarily to
the history data packet multiplicity. The longer traces allow more basic block
permutations for trace builds. Some programs can still have history maturity
increases because of the doubling in trace storage size. Instruction coverage
decreases by 1.3%.
9.3 Tuning Trace Storage and Update
The trace storage design is integral to the instruction coverage, history
maturity, and resulting performance gains in the ScatterFlow Framework. In
general, most optimizations that improves the trace storage efficiency, through-
put, or both will benefit the Framework [38, 97, 98]. This section evaluates
trace storage design choices and their potential to improve the per-instruction
149

0.4
0.5
0.6
0.7
0.8
0.9
1.0
1.1
1.2
1.3
1.4
bzp gcc crf eon gap gzp mcf psr prl twf vor vpr HM
Nor
mal
ized
To
Bas
elin
e
History Maturity Instruction Coverage
Figure 9.9: Effect of a 32-Wide Machine on History Maturity and InstructionCoverage
profiling ability of the Framework.
9.3.1 Issue-Time Fill Unit
One design option that reduces the update lag problem is an issue-time
fill unit [48, 89, 103]. This placement negates many of the retire-time advan-
tages discussed earlier and does not fit the philosophy of per-instruction history
data. Many of the instruction execution characteristics that collected in his-
tory packets have not occurred by instruction issue. However, it is instructive
to understand the best case history update for the ScatterFlow Framework.
In this analysis, the fill unit is modified to collect the post-decode in-
struction stream instead of the retiring instruction stream. For optimal trace
storage efficiency, instructions from mis-speculated branch paths are filtered
from the fill unit. This filtering is not always possible to determine at issue-
150

time, but is done in an oracle fashion by the performance simulator.
Figure 9.10 presents the instruction coverage and history maturity when
using the issue-time fill unit. The instruction coverage changes slightly for
some programs, but stays steady overall because the filtered issue-time fill unit
builds the same traces as the retire-time fill unit. The large improvements in
full history maturity highlight the advantages of issue-time instruction collec-
tion. The time from fetch to build is shorter for an issue-time fill unit, reducing
the update lag and meaningless updates.
0.8
1.0
1.2
1.4
1.6
1.8
2.0
2.2
bzp gcc crf eon gap gzp mcf psr prl twf vor vpr HM
Nor
mal
ized
To
Bas
elin
e
Full History Maturity Capped History Maturity Instruction Coverage
3.9
Figure 9.10: Effect of an Issue-Time Fill Unit on History Maturity and In-struction Coverage
Figure 9.11 presents the percentage of fetched history traces that re-
ceived exactly one update since the last fetch. The graphs present data for
a processor with the baseline (retire-time) fill unit and for a processor with
an issue-time fill unit. The decrease in update lag causes the percentage of
once-updated history traces to increase from 63% to 84%. These results make
151

a case for decreasing the update lag in a wide-issue processor equipped with
the ScatterFlow Framework, possibly by repositioning the fill unit.
40%
50%
60%
70%
80%
90%
100%
bzp gcc crf eon gap gzp mcf psr prl twf vor vpr HM
Tra
ces
with
One
Upd
ate
Bet
wee
nF
etch
es
Base w/Issue-Time Fill Unit
Figure 9.11: Percentage of Once-Updated History Traces Using an Issue-TimeFill Unit
9.3.2 Atomic Traces
One alternative to block-level trace builds is to treat traces as an atomic
unit within the ScatterFlow Framework [104]. With atomic traces, an entire
trace is fetched from trace storage (i.e., no partial matching), an entire trace
retires at once, and an entire trace updates at once. Atomic trace management
forces a retired trace to be returned to history storage as the same trace unit
that was fetched.
Two methods for atomic trace construction are presented. In the first
strategy, new traces are constructed only from blocks of instructions fetched
consecutively from the instruction cache. This Atomic strategy leads to shorter
152

instruction traces because a switch from instruction cache instructions to trace
cache instructions is a trace stop condition. The other presented strategy
(Atomic+) allows segments from an atomically retired trace to be built into
new traces. The drawback is that the instruction redundancy increases since
one retiring trace block may be built into two separate traces.
Table 9.1 represents the change in average trace line size and trace
storage hit rate when atomic traces are used in the ScatterFlow Framework.
On average, the Atomic strategy reduces the trace line size from 10.75 to 8.41
while the Atomic+ strategy maintains the average line size. On the other
hand, the basic Atomic strategy improves the trace storage hit rate by 13.8%
while Atomic+ does not. In addition, the Atomic scheme reduced overall
instruction throughput (not shown) by 3.4% on average, and by as much as
8.3%. The Atomic+ strategy maintains average performance although the
speedup of individual programs varies from -3.0% to +7.7%.
Table 9.1: Change In Trace Storage Characteristics Using Atomic Traces
Trace Line Size Hit %Program Base Atomic Atomic+ Base Atomic Atomic+bzip2 10.79 10.10 10.80 94.07% 99.97% 96.90%gcc 10.83 7.94 10.75 55.15% 66.09% 52.26%crafty 11.48 8.27 11.33 67.01% 78.10% 65.12%eon 10.85 8.52 10.83 68.27% 77.81% 71.23%gap 11.49 9.43 11.49 68.53% 86.61% 74.35%gzip 12.44 9.74 12.35 79.05% 97.85% 83.33%mcf 8.52 4.95 8.50 83.68% 99.71% 78.45%parser 9.29 5.18 9.37 85.79% 99.44% 63.60%perlbmk 10.68 10.14 10.74 81.40% 96.84% 90.10%twolf 11.24 8.94 11.19 66.00% 87.27% 67.70%vortex 9.88 9.06 9.86 77.07% 77.73% 77.91%vpr 11.53 8.61 11.22 70.82% 94.94% 71.90%avg 10.75 8.41 10.70 74.74% 88.53% 74.40%
153
Figure 9.12 presents the relative history maturity and instruction cover-
age when using the basic Atomic strategy. On average, this strategy improves
instruction coverage by 1.9%, full history maturity by 13.6%, and capped his-
tory maturity by 4.7%. However, these improvements are not seen for all
individual benchmark programs.
0.8
0.9
1.0
1.1
1.2
1.3
1.4
1.5
1.6
bzp gcc crf eon gap gzp mcf psr prl twf vor vpr HM
Nor
mal
ized
To
Bas
elin
e
Full History Maturity Capped History Maturity Instruction Coverage
2.4
Figure 9.12: Effect of Atomic Traces on History Maturity and InstructionCoverage
The goal of atomic traces is to increase the percentage of exact matches.
An exact match occurs when a freshly built trace matches a trace that already
exists in the trace storage. Figure 9.13 presents the percentage of built traces
that are an exact match with a trace in storage. Atomic best meets the goal of
atomic traces by increasing the exact match percentage from 87% to 95%. The
Atomic+ strategy reduces the number of exact matches despite an increase in
hit rate because of a corresponding increase in trace storage evictions.
While the exact trace match percentage increases for all programs using
154

60%
65%
70%
75%
80%
85%
90%
95%
100%
bzp gcc crf eon gap gzp mcf psr prl twf vor vpr avg
Tra
ceU
pdat
eE
xact
Mat
ches
Base Atomic Atomic+
Figure 9.13: Change in Exact Trace Match Percentage Using Atomic Traces
Atomic traces, Figure 9.14 shows that the percentage of once-updated fetched
traces does not. One possible source of zero-updated and multiple-updated
fetched traces is the block-level build strategy. However, these results com-
bined with the issue-time fill unit results indicate that the primary reason for
the poor update behavior is the update lag and not the block-level builds.
9.3.3 Path Associativity
The effectiveness of the ScatterFlow Framework improves with the hit
rate of the trace storage. The lack of path associativity in the trace storage
leads to additional misses. Path associative trace storage allows two traces
with the same starting address to simultaneously exist.
Path associativity is not generally a default trace storage configuration
because it places extra strain on the fetch mechanism. Choosing between two
155

40%
45%
50%
55%
60%
65%
70%
75%
80%
bzp gcc crf eon gap gzp mcf psr prl twf vor vpr HM
Tra
ces
with
One
Upd
ate
Bet
wee
nF
etch
es
Base Atomic Traces
Figure 9.14: Percentage of Once-Updated History Traces Using Atomic Traces
traces with the same head block is difficult. Previous literature makes this
choice based on the results from the branch predictor [89]. Both traces are
accessed and the one which follows the path suggested by the branch predictor
is returned.
Performance for trace storage with path associativity is compared to the
baseline in Table 9.2. Path associativity raises the hit rate of the trace storage,
but also the eviction rate. While the increased hit rate may help the instruction
coverage, Figure 9.15 shows that the increase in evictions is not good for history
maturity. Since path associativity requires a more complex design, decreases
history efficiency, and only improves instruction throughput (not shown) by
1%, it is not a good design choice for the ScatterFlow Framework.
156

Table 9.2: Path Associativity Effects on Trace Storage
Baseline with TC Path AssociativityProgram TC Hit Rate TC Evicts % TC Hit Rate TC Evicts %bzip2 94.07% 0.00% 97.72% 11.88%gcc 55.15% 19.35% 55.93% 30.04%crafty 67.01% 11.41% 68.27% 26.83%eon 68.27% 3.75% 72.11% 14.94%gap 68.53% 4.85% 79.28% 15.42%gzip 79.05% 0.33% 82.98% 40.10%mcf 83.68% 0.12% 95.22% 29.33%parser 85.79% 0.19% 93.79% 45.06%perlbmk 81.40% 0.03% 91.67% 2.03%twolf 66.00% 3.56% 73.42% 26.11%vortex 77.07% 8.88% 77.07% 10.62%vpr 70.82% 1.28% 77.28% 23.61%avg 74.74% 4.48% 80.40% 23.00%
0.50
0.60
0.70
0.80
0.90
1.00
1.10
bzp gcc crf eon gap gzp mcf psr prl twf vor vpr HM
Nor
mal
ized
toB
asel
ine
Full History Maturity Capped History Maturity Instruction Coverage
Figure 9.15: Effect of Path Associativity on History Maturity and InstructionCoverage
157

9.4 History Management Enhancements
The ScatterFlow Framework has room to improve the maturity and
accuracy of the captured instruction history data. This section analyzes two
Framework enhancements: smart update and the victim history cache.
9.4.1 Smart Update
Smart update is a solution for meaningless updates and update lag.
In a ScatterFlow Framework equipped with smart update, the differences in
history data values are also stored in the history data packets. For instance,
if the initial value is two and the updated value should be three, the values
three (updated value) and one (difference between initial and updated value)
are stored in the history packet.
New history data traces are not automatically placed into history stor-
age after construction. If the history data trace already exists in storage, it is
read by the fill unit. Then the history values from this stored trace are up-
dated using the differences from the current trace. This process allows history
updates to compound instead of exist in isolation, transforming meaningless
updates into meaningful updates.
Smart update comes at a cost. For each constructed trace, the his-
tory storage is read to obtain the current data and then written with the new
history data. Normally, the history storage only has to be written on trace
builds. Extra reads to the history storage may hurt performance by conflicting
with reads initiated by the processor core, and by delaying the history stor-
age writes. The extra reads also increase the dynamic energy consumption
attributed to the ScatterFlow Framework. Lee and Yew propose a mechanism
to handle stale retire-time predictions that does not require extra retire-time
158

reads, but does require extra fetch-time computation and special considera-
tions for wrong-path fetches [65]. In the analysis below, the potentially harmful
effects of smart update are not considered.
Figure 9.16 presents the change in history maturity and instruction
coverage relative to the baseline with no smart update. The addition of smart
update does not change the trace storage update rate or instruction through-
put, so the instruction coverage remains constant. However, the full history
maturity is improved by 87.3% and the capped history maturity is improved
by 4.3%. This improvement is created by turning the meaningless updates
into meaningful updates. Therefore, the programs with large improvements
on this graph are the programs most affected by the staleness caused by long
fetch-to-retire latencies.
0.9
1.0
1.1
1.2
1.3
1.4
1.5
1.6
1.7
1.8
1.9
bzp gcc crf eon gap gzp mcf psr prl twf vor vpr HM
Nor
mal
ized
toB
asel
ine
Full History Maturity Capped History Maturity Instruction Coverage
Figure 9.16: Effect of Smart Update on History Maturity and InstructionCoverage
The improvement in history maturity does not reflect the entire benefit
159

of the smart update scheme. The change in update mechanics also improves
the accuracy for certain types of history data. Figure 9.17 shows the change in
the number of total value predictions and number of correct predictions. For
11 of the 12 programs, the number of correct predictions improves by more
than the number of total predictions, which leads to better value prediction
accuracy.
0.90
0.95
1.00
1.05
1.10
bzp gcc crf eon gap gzp mcf psr prl twf vor vpr HM
Nor
mal
ized
Impr
ovem
entW
ithS
mar
tUpd
ates
Total Predictions Correct Predictions
Figure 9.17: Applying Smart Update to ScatterFlow Value Prediction
Figure 9.18 presents trait detection totals normalized to an infinite per-
address table. For each execution characteristics, the ScatterFlow Framework
is now able to detect more execution traits using smart update than the infinite
table on average. This improvement is the result of faster saturation of the
confidence counters due to the reduction in meaningless updates.
160

0.4
0.6
0.8
1.0
1.2
1.4
1.6
1.8
2.0
2.2
2.4
2.6
2.8
bzp crf eon gap gcc gzp mcf psr prl twf vor vpr HM
Nor
mal
ized
Tra
itD
etec
tions
ScatterFlow w/Smart Update ScatterFlow 4k-entry Table
0.4
0.6
0.8
1.0
1.2
1.4
1.6
1.8
2.0
2.2
2.4
2.6
2.8
bzp crf eon gap gcc gzp mcf psr prl twf vor vpr HM
Nor
mal
ized
Tra
itD
etec
tions
ScatterFlow w/Smart Update ScatterFlow 4k-entry Table
a. Branch Bias b. Value Invariance
0.6
0.8
1.0
1.2
1.4
1.6
1.8
2.0
2.2
bzp crf eon gap gcc gzp mcf psr prl twf vor vpr HM
Nor
mal
ized
Tra
itD
etec
tions
ScatterFlow w/Smart Update ScatterFlow 4k-entry Table
7.4 4.9
0.4
0.6
0.8
1.0
1.2
1.4
1.6
1.8
bzp crf eon gap gcc gzp mcf psr prl twf vor vpr HM
Nor
mal
ized
Tra
itD
etec
tions
ScatterFlow w/Smart Update ScatterFlow 4k-entry Table
c. Memory Dependence d. Dynamic Instruction DependenceDetection
Figure 9.18: Applying Smart Update to Execution Trait Detection
9.4.2 Victim History Cache
A victim cache saves data lost on a cache eviction [55]. A Victim
History Cache (VHC) stores recently evicted history data traces. If there is no
trace in history storage that exactly matches a freshly constructed trace, the
VHC is probed for a trace of history data. On a VHC hit, the history storage
is updated with a trace of data from the VHC and not the recently collected
history data.
For the VHC to help, the victim trace should have more heavily updated
history than the freshly built trace. However, this is not necessarily true. The
161

new trace might be built from heavily updated traces, not just from instruction
cache instructions. Therefore, this analysis analyzes a second policy that swaps
history data for all trace blocks that were fetched from the instruction cache,
even if they have a matching trace in history storage. The idea is that these
trace blocks would benefit the most from the saved data in the VHC.
The change in history maturity for the two VHC schemes are shown in
Figure 9.19. The VHC holds 512 evicted traces of history data and is direct-
mapped. This configuration is used for all VHC analyses. The basic VHC
scheme (VHC) improves the full history maturity by 6.2%, and the modified
approach (VHC On All IC) improves the history maturity by 15.4%. Instruc-
tion coverage is not presented because, similar to smart update, the coverage
does not change.
Half of the programs do not benefit from the baseline VHC policy,
and the history maturity of mcf decreases by 22.5% with the VHC. Here,
the freshly constructed traces of data have more history maturity than the
previously evicted traces. This increase in maturity is possible under several
circumstances. For example, if the trace is evicted during the time it takes for
the instructions to proceed from fetch to retire, then the fresh trace is a more
heavily updated version of the evicted trace.
When applying the more restrictive VHC policy (VHC On All IC),
all 12 programs exhibit a better history maturity than the basic VHC policy,
and every program has an improved history maturity over the baseline with no
VHC. This policy provides a more consistent improvement over the benchmark
suite.
While the VHC improves history maturity, the increase in history accu-
racy has to be measured with specific applications of the ScatterFlow Frame-
162

0.7
0.8
0.9
1.0
1.1
1.2
1.3
1.4
1.5
1.6
bzp gcc crf eon gap gzp mcf psr prl twf vor vpr HM
His
tory
Mat
urity
Nor
mal
ized
toS
catte
rFlo
w
VHC VHC On All IC
2.43 2.46
a. Full History Maturity
0.90
0.95
1.00
1.05
1.10
1.15
1.20
1.25
bzp gcc crf eon gap gzp mcf psr prl twf vor vpr HM
Nor
mal
ized
His
tory
Mat
urity
VHC VHC On All IC
b. Capped History Maturity
Figure 9.19: Effect of a Victim History Cache on History Maturity
work. Figure 9.20 presents the change in execution speedup when applying
the two different VHC schemes to ScatterFlow value prediction. The overall
performance improvement is small on average, less than 1% in both cases with
VHC On All IC performing better. Two conclusions from these results are: 1)
163

an improvement in history maturity does not always lead to an improvement
in history accuracy, and 2) only a small percentage of history data are updated
with data from the VHC.
0.95
1.00
1.05
1.10
1.15
1.20
1.25
1.30
bzp gcc crf eon gap gzp mcf psr prl twf vor vpr HM
Spe
edup
Ove
rC
hapt
er6
Bas
elin
e
ScatterFlow VP w/VHC w/VHC On All IC
Figure 9.20: Effect of a Victim History Cache on ScatterFlow Value PredictionPerformance
164

Chapter 10
Conclusions and Future Work
This dissertation addresses the challenge of timely, accurate, energy-
efficient instruction history data management in a wide-issue, high-frequency
microprocessor. History-driven dynamic optimization mechanisms are crucial
for increasing instruction-level parallelism and fully utilizing the resources in
a wide-issue microprocessor. However, current history storage design presents
obstacles to high performance, energy efficiency, and design ease.
The ScatterFlow Framework for Instruction History Management is
proposed as a solution to these challenges. The ScatterFlow Framework con-
sists of several history management strategies: 1) provide a one-to-one map-
ping between instructions in the microarchitecture (both in storage and in
flight) and their history data, 2) partition the history management tasks and
distribute them throughout the instruction execution pipeline, and 3) flow the
history data along with instructions as they travel through the microprocessor.
The proposed strategy improves on traditional history management,
which centers tasks around a global instruction-level history data table, by
providing: 1) history data for each instruction fetched from ScatterFlow his-
tory storage, 2) low-latency, energy-efficient access to instruction history data,
and 3) reduced dependence on long-distance communications and global data
tables. This chapter presents the conclusions from this work and future re-
search directions for ScatterFlow instruction history management.
165
10.1 Conclusions
A wide-issue, high-frequency microarchitecture is an important future
design point for achieving high performance. History-driven, dynamic op-
timization techniques increase instruction throughput by creating additional
instruction-level parallelism and improving resource utilization. Many dif-
ferent history-driven mechanisms have been proposed to improve performance
and reduce energy consumption using strategies such as speculatively breaking
dependencies between instructions, prioritizing instruction access to hardware
resources, pre-fetching distant data, activating energy-saving techniques, and
dynamically recompiling program code.
A global address-indexed hardware table is the traditional method for
capturing and retaining instruction history data. Current technology and de-
sign trends combined with the push toward increased instruction width ma-
chines have reduced the efficiency of the traditional history table to the point
where some proposed optimization techniques no longer help. Accessing his-
tory data from large global tables and communicating the data to distant
locations on the processor take multiple cycles, which reduces the usefulness
of the techniques. In addition, the increase in instruction issue width has cre-
ated a demand for access ports and entries for traditional tables. However,
this extra hardware is expensive because of access latency, dynamic energy
consumption, and design complexity considerations.
The proposed ScatterFlow Framework is an alternate approach for
history data management that is scalable for future microprocessors supple-
mented with heavy history-driven optimization. The Framework stresses the
importance of low-latency, energy-efficient access to a high bandwidth of in-
struction history data. Each instruction in the instruction storage has an
166
associated history data packet in the ScatterFlow history storage. When the
processor core fetches instructions, it also fetches the corresponding history
data packet for each instruction. This synchronous storage approach enables
low-latency, wide access to instruction-level history data, especially with the
use of an instruction trace cache.
The history data packets remain associated with active instructions as
they flow through the processor pipeline. In the ScatterFlow Framework, the
history management tasks have been partitioned and integrated into the in-
struction execution pipeline. The resulting proximity of the history data to its
corresponding instructions allows quick read and modification of history data
when history-driven optimization logic is encountered.
Using two metrics, instruction coverage and history maturity, to eval-
uate the general history data capture ability, the ScatterFlow Framework
demonstrates the ability to efficiently capture history data. Compared to
port-restricted traditional history data tables, the ScatterFlow Framework pro-
vides improved instruction coverage and history maturity for tables of similar
latency, similar area, and similar storage size. Compared to a 4096-entry,
direct-mapped, traditional table with no port restrictions, the ScatterFlow
Framework provides superior instruction coverage and better access to lightly-
updated history data. The table produces better overall history maturity,
including better access to heavily-updated history data. However, in most
practical applications of the ScatterFlow Framework, lightly-updated history
data are sufficient to capture the full range of observed instruction behavior.
This dissertation also presents a detailed investigation for three history-
driven optimization techniques implemented in the ScatterFlow Framework:
167

value prediction, cluster assignment, and execution trait detection. The his-
tory data packets in ScatterFlow value prediction contain the predicted data
values. This shift from table-based speculation data to ScatterFlow specu-
lations leads to a 3.7% increase in execution time speedup and a 17.5 times
reduction in dynamic energy consumption compared to a traditional value
predictor for the SPEC CPU2000 integer benchmarks. These improvements
are enabled by the high coverage, low-latency history data reads, and energy-
efficient history storage in the ScatterFlow Framework.
ScatterFlow cluster assignment uses the history data packets to store
inter-trace data dependency and critical input information. The Framework
permits a large percentage of instructions to collect history data deep within
the microarchitecture without long-distance, global communication. These
ScatterFlow optimization hints allow retire-time cluster assignment to improve
performance by 8.5% over a latency-constrained issue-time cluster assignment
scheme.
In the third example, the ScatterFlow Framework profiles instruction
execution traits for a generic high-level dynamic optimizer. On average, the
Framework history data provide between 22% and 103% more unique execu-
tion trait detections than a fixed-sized 4096-entry traditional table that has
no other design restrictions. In more than half of the trait/program cases,
the Framework detects more execution traits than an infinite per-address ta-
ble that has no design restrictions. This improvement is possible because of
path-based effects on trace-based history data.
In the ScatterFlow Framework, trace history storage has data that are
constantly being updated. Due to issues like history packet multiplicity, up-
168

date dilution, block-level trace builds, history data evictions, update lag, and
meaningless updates, the trace-based management of history data is challeng-
ing. This dissertation explores these phenomena and finds that careful design
of the ScatterFlow Framework reduces the negative effects.
The history data packet multiplicity is found to often be beneficial
because of the inherent program context provided by each trace, but it also
results in history update dilution. Over 20% of dynamically created history
packets become part of multiple traces. However, the history data update
dilution is manageable. Eighty-six percent of retired instructions execute after
being fetched from their most common trace block.
Using atomic traces, a path associative trace cache, and an issue-time
fill unit addresses some of the trace-based history storage issues. On average,
these enhancements improve the history maturity and the instruction cov-
erage, but have their own unique design and performance limitations. Two
additional techniques, smart update and victim history caching, improve the
history maturity and history data accuracy, resulting in better performance
for ScatterFlow value prediction and execution trait detection.
Not all history-driven techniques implemented in the ScatterFlow Frame-
work will deliver significant performance improvement. From a strictly per-
formance perspective, optimization mechanisms that focus on a small subset
of dynamic instructions may be equally satisfied by traditional tables with a
manageable number of entries. Similarly, if this small subset of instructions
also has a low occurrence rate per cycle, then port-constrained traditional ta-
bles are a viable option. In addition, the Framework’s low-latency delivery
of per-instruction history benefits history-driven techniques that occur early
169

in the instruction pipeline. Instruction-level techniques that optimize at the
back end of the pipeline can often tolerate the long latency access of traditional
tables.
While every history-driven optimization implemented with the Scat-
terFlow Framework may not result in dramatic improvements in instruction
throughput, most history-driven techniques benefit in some way. Storing his-
tory data within the Framework eliminates the need for a traditional table,
saving chip area, long distance data communications, and table access energy.
In a processor already fitted with the Framework, the ease of implementing an
additional history-driven optimization makes most history-driven optimization
mechanisms worth implementing in the ScatterFlow Framework.
Enabling a more efficient design for history-driven execution optimiza-
tion is crucial for the performance of future wide-issue high-frequency mi-
croprocessors. This dissertation has proposed a scalable history manage-
ment strategy for future microarchitectures that benefit from history-driven
instruction-level optimization. The ScatterFlow Framework is capable of im-
proving known dynamic optimization techniques and enabling history-driven
optimization techniques that previously may not have been realistic.
10.2 Future Work
In many current processors, there are already multiple optimization
techniques occurring simultaneously. In the future, the number of specula-
tion techniques is expected to increase. The flexibility and generality of the
Framework allows multiple dynamic optimizers and high-level profilers to exist
within the Framework concurrently.
170

Flexible Dynamic Tuning Using the ScatterFlow Framework The
implementation of many optimization techniques are orthogonal and could
be supported concurrently by the ScatterFlow Framework. However, this ex-
pansion of Framework resources cannot be boundless without affecting some
of the attractive latency and complexity properties. Therefore, an advanced
ScatterFlow tuning system would allow only a subset of the techniques to be
active at any given time. The ScatterFlow Framework can provide this service
by dedicating fields within a history data packet to track performance and
bottleneck indicators. Figure 10.1 presents a possible block-level view of the
flexible dynamic tuning system.
retired instructions
commands from SW
profile data to SW
Fill Unit
Coprocessor
SelectLines
Execution Core
Trace Cache
instruction traces
instruction history data
History Storage
of history dataSupports fixed amount
with selectable history data accumulation
History
& per−instruction history data
Figure 10.1: Flexible Dynamic Tuning Using the ScatterFlow Framework
Performance gains of history-driven techniques often vary from bench-
mark to benchmark. In the same way, the ideal history-driven techniques vary
for each instruction. This flexible framework allows dynamic optimizations
to be selectively applied at the instruction level, potentially saving energy
as well as improving performance. To support this flexibility, the fill unit is
171

transformed into a more powerful piece of hardware (e.g., a programmable co-
processor or separate hardware engine) that controls the dynamic execution
behavior captured by the history data packets and the retire-time updates.
The proposed system is similar to microprocessor performance event coun-
ters, where numerous events are constantly being monitored, but storage and
routing resources are only supplied to a subset of the counters at any given
time.
Tightly-Coupled Feedback to High-Level Analyzers Feedback to history-
driven high-level software and specialized hardware is another interesting di-
rection in which the ScatterFlow Framework can evolve. In Chapter 3, inter-
facing of the ScatterFlow Framework with high-level analyzers is discussed,
and Chapter 8 shows the potential of the ScatterFlow Framework as a history
capture mechanism in a profiling environment. However, the implementation
and the precise benefits of interfacing with specific high-level analyzers are
not explored. Dynamic compilers, just-in-time compilers, optimizing operat-
ing systems, support micro-threads, profiling co-processors, and profile-driven
software are all candidates to take advantage of the high instruction coverage
provided by the ScatterFlow Framework.
Increasing the Scope The illustrated uses of the ScatterFlow Framework in
this dissertation concentrate primarily on increasing accurate speculation and
improving instruction-level parallelism in a wide-issue microprocessor. How-
ever, the use of easily accessible per-instruction history data could be studied
in other contexts.
• Simultaneous multithreading (SMT) allows multiple thread contexts to
172

share the resources of one wide-issue processor [72, 117]. In an SMT pro-
cessor, the ScatterFlow history data packets can reduce inter-thread his-
tory collection conflicts by eliminating global history tables. In addition,
the Framework allows realistic monitoring of instruction-level thread in-
teractions.
• Architecture-level dynamic power reduction techniques are often trig-
gered based on execution history [13, 18, 43]. Instruction-level, history-
based power techniques are less common because traditional implemen-
tations would lead to more energy consumption overhead than savings.
However, instruction-level power indicators can be part of the Scatter-
Flow history data packets, allowing more fine-grain, energy-efficient con-
trol over dynamic power adjustments.
• Chip multiprocessors place multiple wide-issue cores on one die [84].
This strategy increases the communication between the cores and al-
lows multi-threaded applications to communicate more quickly. If the
ScatterFlow Framework propagates per-instruction history through the
memory hierarchy, the instruction-level execution history data can be
shared between the on-chip cores.
173

Bibliography
[1] Alpha Architecture Reference Manual. Digital Press, Boston, MA, 3rd
edition, 1998.
[2] V. Agarwal, M. S. Hrishikesh, S. W. Keckler, and D. Burger. Clock rate
versus IPC: The end of the road for conventional microarchitectures.
In 27th International Symposium on Computer Architecture, pages 248–
259, June 2000.
[3] J. Auslander, M. Philipose, C. Chambers, S.J. Eggers, and B.N. Bershad.
Fast, effective dynamic compilation. In ACM SIGPLAN Conference
on Programming Language Design and Implementation, pages 149–159,
May 1996.
[4] R. I. Bahar and S. Manne. Power and energy reduction via pipeline
balancing. In 28th International Symposium on Computer architecture,
pages 218–229, May 2001.
[5] R. Bhargava and L. K. John. Cluster assignment strategies for a clus-
tered trace cache processor. Technical Report TR-030331-01, The Uni-
versity of Texas at Austin, Laboratory For Computer Architecture, Mar
2003.
[6] R. Bhargava and L. K. John. Improving dynamic cluster assignment for
clustered trace cache processors. In 30th International Symposium on
Computer Architecture, pages 264–274, June 2003.
174

[7] Ravi Bhargava and Lizy K. John. Latency and energy aware value pre-
diction for high-frequency processors. In 16th International Conference
on Supercomputing, pages 45–56, June 2002.
[8] Ravi Bhargava and Lizy K. John. Value predictor design for high-
frequency microprocessors. Technical Report TR-020508-01, The Uni-
versity of Texas at Austin, Laboratory for Computer Architecture, May
2002.
[9] Ravi Bhargava and Lizy K. John. Performance and energy impact
of instruction-level value predictor filtering. In First Value Prediction
Workshop, pages 71–78, June 2003. Held in conjunction with ISCA’03.
[10] Ravi Bhargava, Lizy Kurian John, and Francisco Matus. Accurately
modeling speculative instruction fetching in trace-driven simulation. In
International Performance, Computing, and Communications Confer-
ence, pages 65–71, Feb 1999.
[11] B. Black, B. Rychlik, and J. P. Shen. The block-based trace cache.
In 26th International Symposium on Computer Architecture, pages 196–
207, May 1999.
[12] M. Bohr. Silicon trends and limits for advanced microprocessors. Com-
munications of the ACM, 41(3):80–87, March 1998.
[13] D. Brooks and M. Martonosi. Dynamic thermal management for high-
performance microprocessors. In 7th International Symposium on High
Performance Computer Architecture, 2001.
175

[14] D. Brooks, V. Tiwari, and M. Martonosi. Wattch: A framework for
architectural-level power analysis and optimizations. In 27th Interna-
tional Symposium on Computer Architecture, pages 83–94, June 2000.
[15] D. Burger and J. Goodman. Billion-transistor architectures. Computer,
pages 46–49, September 1997.
[16] Doug Burger, Todd Austin, and Steve Bennett. Evaluating future mi-
croprocessors: The simplescalar tool set. Technical report, University
of Wisconsin, Madison, WI, 1997.
[17] R. G. Burger and R. K. Dybvig. An infrastructure for profile-driven
dynamic recompilation. In International Conference on Computer Lan-
guages, pages 240–251, May 1998.
[18] G. Cai. Architectural level power/performance optimization and dy-
namic power estimation. In CoolChips tutorial. An Industrial Per-
spective on Low Power Processor Design in conjunction with MICRO32,
1999.
[19] B. Calder, G. Reinman, and D. M. Tullsen. Selective value prediction.
In 25th International Symposium on Computer Architecture, pages 64–
74, May 1999.
[20] R. Canal, J-M. Pacerisa, and A. Gonzalez. A cost-effective clustered
architecture. In International Conference on Parallel Architectures and
Compilation Techniques, pages 160–168, Oct 1999.
[21] C. Chambers. The Design and Implementation of the SELF Compiler,
an Optimizing Compiler for Object-Oriented Programming Languages.
PhD thesis, Stanford University, April 1992.
176

[22] P. Chang, M. Evers, and Y. N. Patt. Improving branch prediction
accuracy by reducing pattern history table interference. In International
Conference on Parallel Architectures and Compilation Techniques, Oct
1996.
[23] P. Chang, E. Hao, T. Yeh, and Y. Patt. Branch classification: A new
mechanism for improving branch predictor performance. In 27th Inter-
national Symposium on Microarchitecture, pages 22–31, Nov 1994.
[24] M. Charney and T. Puzak. Prefetching and memory system behavior
of the spec95 benchmark suite. IBM Journal of Research and Develop-
ment, 41(3):265–286, May 1997.
[25] J. B. Chen, Anita Borg, and N. P. Jouppi. A simulation based study
of tlb performance. In 19th International Symposium on Computer
architecture, pages 114 – 123, April 1992.
[26] G. Chrysos, J. Dean, J. Hicks, and C. Waldspurger. Apparatus for
sampling instruction operands or result values in a processor pipeline.
US Patent 5923872, July 1999.
[27] G. Z. Chrysos and J. S. Emer. Memory dependence prediction using
store sets. In 25th International Symposium on Computer Architecture,
pages 142–153, June 1998.
[28] T. Conte, K. Menezes, and M. A. Hirsch. Accurate and practical profile-
driven compilation using the profile buffer. In 29th International Sym-
posium on Microarchitecture, pages 36–45, Dec 1996.
177

[29] T. M. Conte, B. A. Patel, and J. S. Cox. Using branch handling hard-
ware to support profile-driven optimization. In 27th International Sym-
posium on Microarchitecture, pages 12–21, Nov 1994.
[30] T. Cramer, R. Friedman, T. Miller, D. Seberger, R. Wilson, and M.Wolczko.
Compiling Java just in time. IEEE Micro, 17(3):36–43, May/June 1997.
[31] J. Dean, J. Hicks, C. Waldspurger, W. Weihl, and G. Chrysos. Pro-
fileme: Hardware support for instruction-level profiling on out-of-order
processors. In 30th International Symposium on Microarchitecture,
pages 294–303, June 1997.
[32] K. Ebcioglu and E. Altman. Daisy: Dynamic compilation for 100% ar-
chitectural compatibility. Technical Report RC20538, IBM T. J. Watson
Research Center, Yorktown Heights, NY, 1996.
[33] J. H. Edmondson et al. Internal organization of the Alpha 21164, a 300-
mhz 64-bit quad-issue CMOS RISC microprocessor. digital technical
journal online, 7(1), 1995.
[34] K. I. Farkas, P. Chow, N. P. Jouppi, and Z. Vranesic. The multicluster
architecture: Reducing cycle time through partitioning. In 30th Inter-
national Symposium on Microarchitecture, pages 149–159, Dec. 1997.
[35] B. Fields, S. Rubin, and R. Bodik. Focusing processor policies via
critical-path prediction. In 28th International Symposium on Computer
Architecture, pages 74–85, July 2001.
[36] M. Franklin. The Multiscalar Architecture. PhD thesis, Univ. of
Wisconsin-Madison, 1993.
178

[37] M. Franklin and M. Smotherman. The fill-unit approach to multiple in-
struction issue. In 27th International Symposium on Microarchitecture,
pages 162–171, Nov 1994.
[38] D. H. Friendly, S. J. Patel, and Y. N. Patt. Alternative fetch and
issue policies for the trace cache fetch mechanism. In 30th International
Symposium on Microarchitecture, pages 24–33, Dec. 1997.
[39] D. H. Friendly, S. J. Patel, and Y. N. Patt. Putting the fill unit to work:
Dynamic optimizations for trace cache processors. In 31st International
Symposium on Microarchitecture, pages 173–181, Dallas, TX, November
1998.
[40] F. Gabbay and A. Mendelson. Speculative execution based on value
prediction. Technical Report 1080, Technion - Israel Institute of Tech-
nology, Nov 1996.
[41] F. Gabbay and A. Mendelson. The effect of instruction fetch bandwidth
on value prediction. In 25th International Symposium on Computer
Architecture, pages 272–281, June 1998.
[42] D. M. Gallagher, W. Y. Chen, S. A. Mahlke, J. C. Gyllenhaal, and
W. W. Hwu. Dynamic memory disambiguation using the memory con-
flict buffer. In 6th International Conference on Architectural Support
for Programming Languages and Operating Systems, pages 183–193, Oc-
tober 1994.
[43] S. Ghiasi, J. Casmira, and D. Grunwald. Using IPC variation in work-
loads with externally specified rates to reduce power consumption. In
Workshop on ComplexityEffective Design, June 2000.
179

[44] M. Gowan, L. Biro, and D. Jackson. Power considerations in the de-
sign of the Alpha 21264 microprocessor. In 35th Design Automation
Conference, pages 726–731, June 1998.
[45] L. Gwennap. Digital 21264 sets new standard. Microprocessor Report,
10(14), Oct 1996.
[46] T. Heil and J. Smith. Relational profiling: Enabling thread-level par-
allelism in virtual machines. In 33rd International Symposium on Mi-
croarchitecture, Dec 2000.
[47] S. Heo, R. Krashinsky, and K. Asanovic. Activity-sensitive flip-flop
and latch selection for reduced energy. In 19th Conference on Advanced
Research in VLSI, pages 59–74, March 2001.
[48] G. Hinton, D. Sager, M. Upton, D. Boggs, D. Carmean, A. Kyker, and
P. Roussel. The microarchitecture of the Pentium 4 processor. Intel
Technology Journal, Q1 2001.
[49] U. Holze and D. Ungar. Optimizing dynamically-dispatched calls with
run-time type feedback. In Conference on Programming Language De-
sign and Implementation, pages 326–335, June 1994.
[50] Q. Jacobson, E. Rotenberg, and J. E. Smith. Path-based next trace pre-
diction. In 30th International Symposium on Microarchitecture, pages
14–23, Dec. 1997.
[51] Q. Jacobson and J. E. Smith. Instruction pre-processing in trace pro-
cessors. In International Symposium of High Performance Computer
Architecture, Jan 1999.
180

[52] D. A. Jimenez, S. W. Keckler, and C. Lin. The impact of delay on
the design of branch predictors. In 33rd International Symposium on
Microarchitecture, Dec 2000.
[53] J. D. Johnson. Expansion caches for superscalar microprocessors. Tech-
nical Report CSL-TR-94-630, Stanford University, Palo Alto, CA, June
1994.
[54] Mike Johnson. Superscalar Microprocessor Design. Prentice Hall, 1990.
[55] N.P. Jouppi. Improving direct-mapped cache performance by the ad-
dition of a small fully-associative cache and prefetch buffers. In 17th
International Symposium on Computer Architecture, pages 28–31, May
1990.
[56] C. N. Keltcher, K. J. McGrath, A. Ahmed, and P. Conway. The AMD
Opteron processor for multiprocessor servers. IEEE Micro, 23(2):66–76,
March/April 2003.
[57] R. E. Kessler. The Alpha 21264 microprocessor. IEEE Micro, 19(2):24–
36, Mar/Apr 1999.
[58] C. Kim, D. Burger, and S. W. Keckler. An adaptive, non-uniform cache
structure for wire-delay dominated on-chip caches. In 10th International
Conference on Architectural Support for Programming Languages and
Operating Systems, pages 211 – 222, October 2002.
[59] I. Kim and M. Lipasti. Implementing optimizations at decode time.
In International Symposium on Computer Architecture, pages 221–232,
May 2002.
181

[60] A. Klaiber. The technology behind crusoe processors. Technical report,
Transmeta Corp., Santa Clara, CA., Jan 2000.
[61] A.J. KleinOsowski and D.J. Lilja. MinneSPEC: A new SPEC bench-
mark workload for simulation-based computer architecture research. Com-
puter Architecture Letters, 1, June 2002.
[62] J. K. L. Lee and A. J. Smith. Branch prediction strategies and branch
target buffer. Computer, 17(1), Jan 1984.
[63] S. Lee, Y. Wang, and P Yew. Decoupled value prediction on trace pro-
cessors. In 6th International Symposium on High Performance Com-
puter Architecture, pages 231–240, Jan 2000.
[64] S. Lee and P. Yew. On some implementation issues for value prediction
on wide-issue ILP processors. In International Conference on Parallel
Architectures and Compilation Techniques, pages 145–156, Oct 2000.
[65] S. Lee and P. Yew. On table bandwidth and its update delay for value
prediction on wide-issue ilp processors. IEEE Transaction on Comput-
ers, 50(8):847–852, August 2001.
[66] Mark Leone and R. Kent Dybvig. Dynamo: A staged compiler ar-
chitecture for dynamic program optimization. Technical Report #490,
Department of Computer Science, Indiana University, Sep 1997.
[67] M. H. Lipasti and J. P. Shen. Exceeding the dataflow limit via value
prediction. In 29th International Symposium on Microarchitectures,
pages 226–237, Dec 1996.
182

[68] M. H. Lipasti and J. P. Shen. Superspeculative microarchitecture for
beyond AD 2000. Computer, pages 59–66, Sep 1997.
[69] M. H. Lipasti, C. B. Wilkerson, and J. P. Shen. Value locality and
load value prediction. In 7th International Conference on Architectural
Support for Programming Languages and Operating Systems, pages 138–
147, Oct 1996.
[70] G. H. Loh. Exploiting data-width locality to increase superscalar execu-
tion bandwidth. In 35th International Symposium on Microarchitecture,
pages 395–406, November 2002.
[71] G. H. Loh. Width prediction for reducing value predictor size and power.
In First Value Prediction Workshop, pages 86–93, June 2003. Held in
conjunction with ISCA’03.
[72] D. T. Marr, F. Binns, D. L. Hill, G. Hinton, D. A. Koufaty, J. A. Miller,
and M. Upton. Hyper-threading technology architecture and microar-
chitecture. Intel Technology Journal, 6(1), February 2002. (online).
[73] D. Matzke. Will physical scalability sabotage performance gains? Com-
puter, pages 37–39, Sep 1997.
[74] S. McFarling. Combining branch predictors. Technical Report TN-36,
Digital Western Research Labs, Palo Alto, Calif., June 1993.
[75] C. McNairy and D. Soltis. Itanium 2 processor microarchitecture. IEEE
Micro, 23(2):56–65, March/April 2003.
183

[76] S. Melvin, M. Shebanow, and Y. Patt. Hardware support for large
atomic units in dynamically scheduled machines. In 21st International
Symposium on Microarchitecture, pages 60–63, Dec 1988.
[77] M. C. Merten, A. R. Trick, C. N. George, J. C. Gyllenhaal, and W. W.
Hwu. A hardware-driven profiling scheme for identifying hot spots to
support runtime optimization. In 26th International Symposium on
Computer Architecture, pages 136–147, May 1999.
[78] M. C. Merten, A. R. Trick, E. M. Nystrom, R. D. Barnes, and W. W.
Hwu. A hardware mechanism for dynamic execution and relayout of
program hot spots. In 27th International Symposium on Computer
Architecture, pages 47–58, June 2000.
[79] R. Moreno, L Pinuel, S. del Pino, and F. Tirado. A power perspective
of value speculation for superscalar microprocessors. In International
Conference on Computer Design, pages 147–154, Sep 2000.
[80] A. Moshovos. Dynamic speculation and synchronization of data depen-
dencies. In 24th International Symposium on Computer Architecture,
pages 181–193, June 1997.
[81] A. Moshovos and G. S. Sohi. Streamlining inter-operation memory
communication via data dependence prediction. In 30th International
Symposium on Microarchitecture, pages 235–245, Dec. 1997.
[82] R. Nair. Dynamic path-based branch correlation. In 28th International
Symposium on Microarchitecture, pages 15–23, Nov 1995.
[83] S. Narayanasamy, T. Sherwood, S. Sair, B. Calder, and G. Varghese.
Catching accurate profiles in hardware. In 9th International Symposium
184
on High-Performance Computer Architecture, pages 269–280, February
2003.
[84] B. A. Nayfeh and K. Olukotun. A single-chip multiprocessor. Com-
puter, pages 79–85, September 1997.
[85] S. Palacharla, N. P. Jouppi, and J. E. Smith. Complexity-effective
superscalar processors. In 24th International Symposium on Computer
Architecture, pages 206–218, June 1997.
[86] J-M. Parcerisa, J. Sahuquilla, A. Gonzalez, and J. Duato. Efficient inter-
connects for clustered microarchitectures. In International Conference
on Parallel Architectures and Compilation Techniques, pages 291–300,
Sep. 2002.
[87] S. J. Patel. Trace Cache Design for Wide-Issue Superscalar Processors.
PhD thesis, The University of Michigan, 1999.
[88] S. J. Patel, M. Evers, and Y. N. Patt. Improving trace cache effective-
ness with branch promotion and trace packing. In 25th International
Symposium on Computer Architecture, pages 262–271, June 1998.
[89] S. J. Patel, D. H. Friendly, and Y. N. Patt. Critical issues regarding the
trace catch fetch mechanism. Technical report, University of Michigan,
1997.
[90] S. J. Patel and S. S. Lumetta. rePLay : A hardware framework for
dynamic program optimization. Technical Report CRHC-99-16, The
University of Illinois at Urbana-Champaign, Dec 1999.
185

[91] Y. Patt, S. J. Patel, M. Evers, D. Friendly, and J. Stark. One billion
transistors, one uniprocessor, one chip. Computer, pages 51–57, Sep
1997.
[92] Y. N. Patt, S. W. Melvin, W.-M. Hwu, M. C. Shebanow, C. Chen, and
J. We. Run-time generation of HPS microinstructions from a VAX
instruction stream. In 19th Annual International Symposium on Mi-
croarchitecture, pages 75–81, October 1986.
[93] A. Peleg and U. Weiser. Dynamic flow instruction cache memory orga-
nized around trace segments independent of virtual address line. U.S.
Patent Number 5,381,533, 1994.
[94] S. S. Pinter and A. Yoaz. Tango: a hardware-based data prefetching
technique for superscalar processors. In 29th International Symposium
on Microarchitecture, pages 214–225, Dec 1996.
[95] A. Gonzalez R. Canal, J-M. Parcerisa. Dynamic cluster assignment
mechanisms. In 6th International Symposium on High Performance
Computer Architecture, pages 132–142, Jan 2000.
[96] R. Rakvic, B. Black, and J. P. Shen. Completion time multiple branch
prediction for enhancing trace cache performance. In 27th International
Symposium on Computer Architecture, pages 47–58, June 2000.
[97] A. Ramirez, J. Larriba-Pey, C. Navarro, J. Torrellas, and M. Valero.
Software trace cache. In International Conference on Supercomputing,
pages 119–126, June 1999.
186
[98] A. Ramirez, J. L. Larriba-Pey, and Mateo Valero. Trace cache re-
dundancy: Red & blue traces. 6th International Symposium on High-
Performance Computer Architecture, pages 325–336, January 2000.
[99] P. Ranganathan, S. Adve, and N. P. Jouppi. Reconfigurable caches and
their application to media processing. In 27th International Symposium
on Computer Architecture, pages 214 – 224, May 2000.
[100] G. Reinman, T. Austin, and B. Calder. A scalable front-end architec-
ture for fast instruction delivery. In 26th International Symposium on
Computer Architecture, pages 234–245, May 1999.
[101] G. Reinman and N. Jouppi. An integrated cache timing and power
model, 1999. COMPAQ Western Research Lab.
[102] J. Rivers, G. Tyson, E. Davidson, and T. Austin. Data cache design for
multi-issue processors. In 30th International Symposium on Microarchi-
tecture, pages 46–56, 1997.
[103] E. Rotenberg, S. Bennett, and J. E. Smith. Trace cache: a low latency
approach to high bandwidth instruction fetching. In 29th International
Symposium on Microarchitecture, pages 24–34, Dec. 1996.
[104] E. Rotenberg, Q. Jacobson, Y. Sazeides, and J. E. Smith. Trace proces-
sors. In 30th International Symposium on Microarchitecture, pages 138
– 148, Dec. 1997.
[105] B. Rychlik, J. Faistl, B. Krug, and J. P.Shen. Efficacy and performance
impact of value prediction. In International Conference on Parallel
Architectures and Compilation Techniques, pages 148–154, Oct 1998.
187
[106] B. Rychlik, J. W. Faistl, B. P. Krug, A. Y. Kurland, J. J. Sung, M. N.
Velev, and J. P. Shen. Efficient and accurate value prediction using
dynamic classification. Technical report, Carnegie Mellon University,
1998.
[107] Y. Sazeides and J. E. Smith. The predictability of data values. In
30th International Symposium on Microarchitecture, pages 248–258, Dec
1997.
[108] Semiconductor Industry Association. The national technology roadmap
for semiconductors, 1999.
[109] J. E. Smith. A study of branch prediction strategies. In 8th Interna-
tional Symposium on Computer Architecture, pages 135–148, May 1981.
[110] G. S. Sohi and M. Franklin. High-bandwidth data memory systems for
superscalar processors. In 4th International Conference on Architectural
Support for Programming Languages and Operating Systems, pages 53–
62, April 1991.
[111] Srikanth Srinivasan and Alvin Lebeck. Load latency tolerance in dy-
namically scheduled processors. In 31st International Symposium on
Microarchitecture, pages 148–159, Nov 1998.
[112] Standard Performance Evaluation Corporation. SPEC CPU2000 Bench-
marks. http://www.spec.org/osg/cpu2000/.
[113] J.A. Swensen and Y.N. Patt. Hierarchical registers for scientific com-
puters. In International Conference on Supercomputing, pages 346–353,
1988.
188
[114] A. R. Talcott, M. Nemirovsky, and R. C. Wood. The influence of branch
prediction table interference on branch prediction scheme performance.
In International Conference on Parallel Architectures and Compilation
Techniques, pages 89–98, June 1995.
[115] V. Tiwari, D. Singh, S. Rajgopal, G. Mehta, R. Patel, and F. Baez.
Reducing power in high-performance microprocessors. In 35th Design
Automation Conference, pages 732–737, June 1998.
[116] D. M. Tullsen, S. J. Eggers, J. S. Emer, H. M. Levy, J. L. Lo, and R. L.
Stamm. Exploiting choice: instruction fetch and issue on an imple-
mentable simultaneous multithreading processor. In 23rd International
Symposium on Computer architecture, pages 191 – 202, May 1996.
[117] D. M. Tullsen, S. J. Eggers, and H. M. Levy. Simultaneous multithread-
ing: maximizing on-chip parallelism. In 22nd International Symposium
on Computer Architecture, pages 392–403, May 1995.
[118] D. M. Tullsen and J. S. Seng. Storageless value prediction using prior
register values. In 25th International Symposium on Computer Archi-
tecture, pages 270–279, May 1999.
[119] E. Tune, D. Liang, D. M. Tullsen, and B. Calder. Dynamic prediction
of critical path instructions. In 7th International Symposium on High
Performance Computer Architecture, Jan 2001.
[120] G. S. Tyson and T. M. Austin. Improving the accuracy and performance
of memory communications through renaming. In 30th International
Symposium on Microarchitecture, pages 218–227, Dec. 1997.
189

[121] K. Wang and M. Franklin. Highly accurate data value prediction using
hybrid predictors. In 30th International Symposium on Microarchitec-
ture, pages 281–290, Dec 1997.
[122] David L. Weaver and Tom Germond. The SPARC Architecture Manual
(Version 9). Sparc International, Englewood Cliffs, NJ, USA, 1995.
[123] T. Y. Yeh and Y. N. Patt. Alternative implementations of two-level
adaptive branch prediction. In 19th International Symposium on Com-
puter Architecture, pages 124–134, May 1992.
[124] C. Young, N. Gloy, and M. D. Smith. A comparative analysis of schemes
for correlated branch prediction. In 22nd International Symposium on
Computer Architecture, pages 276–286, June 1995.
[125] C. B. Ziles and G. S. Sohi. A programmable co-processor for profil-
ing. In 7th International Symposium on High Performance Computer
Architecture, Jan 2001.
[126] V. V. Zyuban and P. M. Kogge. Inherently lower-power high-performance
superscalar architectures. IEEE Transactions on Computers, 50(3):268–
285, Mar 2001.
190

Vita
Ravindra (Ravi) Nath Bhargava was born in Akron, Ohio on April 10,
1975 to Dr. T. N. and Mrs. Christine Bhargava of Kent, Ohio. He lived in
Kent until graduating from Kent Theodore Roosevelt High School in June of
1993. The following August he entered Duke University in Durham, North
Carolina. In the summer of 1996, he completed an internship with Lucent
Technologies in Allentown, PA. He graduated with Distinction from the Duke
School of Engineering in May 1997 with a B.S.E. in Electrical Engineering
and a second major in Computer Science. The following fall Ravi entered the
Graduate School at The University of Texas at Austin. He gained computer
industry experience through local summer internships at Advanced Micro De-
vices and Intel Corporation. In August 2000, he received his M.S.E. from The
University of Texas at Austin in Electrical and Computer Engineering, com-
pleting a Master’s thesis entitled “Understanding and Designing for Dependent
Store/Load Pairs in High Performance Microprocessors”. Ravi’s graduate ed-
ucation was supported by an Intel Masters Fellowship, University of Texas
Graduate fellowships, an Intel Foundation Ph.D. Graduate Fellowship Award,
University teaching assistantships, and University research assistantships. He
married Lindsay Johnson Bhargava in August 2001. He was a student member
of IEEE, IEEE Computer Society, ACM, and ACM Sigarch.
Permanent address: 606 West Lynn Street #10, Austin, Texas 78703
This dissertation was typed by the author.
191