copyright by michael lee evans 2012
TRANSCRIPT

Copyright
by
Michael Lee Evans
2012

THE REPORT COMMITTEE FOR MICHAEL LEE EVANS
CERTIFIES THAT THIS IS THE APPROVED VERSION OF THE FOLLOWING
REPORT:
REDESIGN OF THE HELMET DESIGN CAPSTONE PROJECT
APPROVED BY
SUPERVISING COMMITTEE:
Richard Crawford
Leema Berland
Supervisor:

REDESIGN OF THE HELMET DESIGN CAPSTONE PROJECT
by
MICHAEL LEE EVANS, BS
REPORT
Presented to the Faculty of the Graduate School of
The University of Texas at Austin
in Partial Fulfillment
of the Requirements
for the Degree of
MASTER OF ARTS
THE UNIVERSITY OF TEXAS AT AUSTIN
AUGUST 2012

Dedication
This report is dedicated to my wife, Sharon, and my two children Danyelle and Brooke.

v
Acknowledgements
I would like to acknowledge the faculty and staff of UTeachEngineering for their
encouragement and assistance.
vi
Abstract
REDESIGN OF THE HELMET DESIGN CAPSTONE PROJECT
Michael Lee Evans, MA
The University of Texas at Austin, 2012
Supervisor: Richard Crawford
Abstract
This report is the culmination of a master’s program resulting in a Master of Arts in
Science Technology Engineering Mathematics (STEM) Education. The author is a
veteran high school physics teacher who has participated in the ongoing development of
the Engineering Design and Problem Solving Course created by UTeachEngineering and
The University of Texas at Austin.
As a pilot instructor teaching this course, the author has experienced the teething
problems common to radically new curriculum. The trials and tribulations of a twelve-
week capstone design project, that was the last engineering challenge of the inaugural
year of the course, are discussed. Reasons for the module’s failure and modifications for
improvement are suggested and supported by a survey of current literature.
The author uses the engineering design process to reengineer the Helmet DesignCapstone
Project. This report identifies the needs of the teachers and students who are, in fact, the
customers of the redesign, and provides a step-by-step plan for improving the project to
make it easier for the teachers and more engaging for the students. All of the instructions
and material lists needed to build the testing devices and conduct the student activities are
presented in detail.
vii
In this second iteration of the project, the design challenge for the students will be to
evaluate the impact performance of a skateboard-type helmet and use simple tests to
characterize the impact performance of various foam types. Using the insights gained by
the characterization of the foam, students will design and install foam composite padding
into the helmet. The engineering principle that is being stressed is the use of data
acquisition for making informed design decisions, rather than trial and error testing. The
report concludes with some reflections by the author about the lessons learned while
developing this project and the impact they will have on his classroom practices.
viii
Table of Contents
Abstract ....................................................................................................................................................................... vi List of Tables ............................................................................................................................................................... x List of Figures ............................................................................................................................................................ xi Chapter 1 ...................................................................................................................................................................... 1 INTRODUCTION ........................................................................................................................................................ 1 Chapter 2 ...................................................................................................................................................................... 3 LITERATURE REVIEW ............................................................................................................................................ 3
2.1 Pedagogy ......................................................................................................................................................... 3 2.2 Technical Background .............................................................................................................................. 6
Chapter 3 ................................................................................................................................................................... 13 Lessons learned from FIRST YEAR OF PILOT COURSE .......................................................................... 13
3.1 Test Stand Construction ......................................................................................................................... 14 3.2 Problems Encountered during Testing ........................................................................................... 18 3.3 Student Experience during the Project ........................................................................................... 19 3.4 Beginning the Redesign .......................................................................................................................... 21 3.5 Conclusions Drawn From the Experience ...................................................................................... 24
CHAPTER 4 ............................................................................................................................................................... 25 TEST STAND REDESIGN ..................................................................................................................................... 25
4.1 Impact Piston and Piston Guide Redesigns ................................................................................... 25 4.2 Lower Test Stand Redesign ................................................................................................................... 29 4.4 Spring Plate Analysis and Assessment ............................................................................................. 38 ............................................................................................................................................................................................ 41 4.5 Redesigned Test Stand Setup ............................................................................................................... 41 4.6 Placement of Sonic Range Finders .................................................................................................... 42
CHAPTER 5 ............................................................................................................................................................... 45 USE OF THE REDESIGNED TEST STAND ..................................................................................................... 45
5.1 Protocol for testing with the Redesigned Test Stand................................................................ 45 5.3 Description of Test Helmet ............................................................................................................................. 49 5.3 Preparation of the Helmet Liner for Testing ......................................................................................... 51 5.4 Preparation of Foam Samples ............................................................................................................. 54 5.5 Foam Selection..................................................................................................................................................... 55 5.6 Foam Characterization .......................................................................................................................... 55 5.7 Learning Module Structure .................................................................................................................. 61 5.8 Lesson Sequence Road Map ........................................................................................................................... 65
CHAPTER 6 ............................................................................................................................................................... 67 SUMMARY AND CONCLUSIONS ....................................................................................................................... 67
6.2 Helmet Comparison .......................................................................................................................................... 68 6.3 Future Study ......................................................................................................................................................... 69 6.1 Application to Practice .................................................................................................................................... 69
Appendix A ............................................................................................................................................................... 72 Appendix B ............................................................................................................................................................... 74 Appendix C................................................................................................................................................................ 79

ix
Appendix D ............................................................................................................................................................... 82 References ................................................................................................................................................................ 84

x
List of Tables
Table 1 Sample Data of Helmet Test ................................................................................................................................... 47

xi
List of Figures
Figure 1 Failure stand ............................................................................................................................................................... 15 Figure 2 Working stand ............................................................................................................................................................ 15 Figure 3 Spring plate and potentiometer ......................................................................................................................... 16 Figure 4 Top of spring plate.................................................................................................................................................... 17 Figure 5 Damaged Head Form ............................................................................................................................................... 18 Figure 6 Piston Guide ................................................................................................................................................................ 20 Figure 7 Second iteration of the test stand .................................................................................................................... 22 Figure 8 Impact piston .............................................................................................................................................................. 26 Figure 9 Piston head .................................................................................................................................................................. 26 Figure 10 Soil compactor/piston ......................................................................................................................................... 26 Figure 11 Guide in ceiling ........................................................................................................................................................ 27 Figure12 Parts for the spring plate base ........................................................................................................................... 30 Figure 13 Spring plate platform on Workmate 125 ..................................................................................................... 31 Figure 14 Helmet Testing ........................................................................................................................................................ 31 Figure 15 Spring plate parts ................................................................................................................................................... 33 Figure 16 Completed spring plate........................................................................................................................................ 35 Figure 17 Hole guide .................................................................................................................................................................. 35 Figure 18 Spring plate ............................................................................................................................................................... 41 Figure 19 Stand and spring plate ......................................................................................................................................... 43 Figure 20 Bottom mounted detector .................................................................................................................................. 43 Figure 21 Upper detector......................................................................................................................................................... 44 Figure 22 Test Helmet ............................................................................................................................................................... 50 Figure 23 View of inside the helmet ................................................................................................................................... 51 Figure 24 Helmet Parts ............................................................................................................................................................. 51 Figure 25 Using a template to mark the test site .......................................................................................................... 52 Figure 26 Template and liner ................................................................................................................................................. 53 Figure 27 Hot wire cutter ........................................................................................................................................................ 54 Figure 28 Cutting foam sample ............................................................................................................................................. 55 Figure 29 Simple compression device made from weight stage ............................................................................ 56 Figure 30 Compression device with hook removed .................................................................................................... 57 Figure 31 Force versus compression plot ........................................................................................................................ 58 Figure 32 Foam samples .......................................................................................................................................................... 59 Figure 33 Deflection device .................................................................................................................................................... 61 Figure 34 Force vs Displacement ......................................................................................................................................... 64 Figure 35 Comparison of soft pad to stock helmet padding ..................................................................................... 65

1
Chapter 1
INTRODUCTION
The topic of this master’s report is the redesign of the Helmet Design Capstone Project
(HDCP). This design project was developed by the UTeachEngineering program with
support from a grant from the National Science Foundation to The University of Texas at
Austin, Cockrell School of Engineering. UTeachEngineering produced the HDCP, a
program directed by The University of Texas College of Natural Sciences. The of the
goals of UTeachEngineering is to create a high school engineering course aimed at
seniors and to increase student interest in pursuing science and engineering careers.
Named “Engineering Design and Problem Solving”, this course uses a Project-Based
Learning (PBL) framework to teach the engineering design process and skills in a way
that emphasizes the fun and creativity of engineering.
In parallel with the course development UTeachEngineering has actively prepared and
nurtured a cadre of secondary school teachers. A second goal of UTeachEngineering is to
prepare teachers to deliver design-based engineering concepts and to inject engineering
principles into their math and science curriculum.
As a twenty-year veteran of teaching high school physics I took part in
UTeachEngineering’s first summer institute in 2009. In the next few years there was
additional involvement in the development of the engineering design course, mostly to
provide a high school teacher’s perspective to the proceedings. It is from the high school
experience with the Helmet Design Capstone Project that the necessity for the redesign of
this project arose. Unfortunately, this project did not meet with success and has been
dropped from the second version of the course. It is my intent to make changes to this
project that will create a version of the original that is easier for the teacher and far more
engaging for the students. The revisions and modifications fall into two distinct
categories: pedagogical changes and modifications of a physical and technical nature. In

2
both cases the “voice of the customer” and customer needs are the sources of these
changes and modifications.
The appropriateness of the twelve-week scope of the original version and the relevance of
the capstone project concept are scrutinized. The issues of timing and student apathy and
their effects on the first version will also be addressed.
Several novel devices created to transform the project’s measurable quantities are
described and test results provided and documented. The fundamental method of
measurement used in the original is scrapped and details of a much more user-friendly
system are given. In each modification, ease of use, student interest and cost were
considered. Finally, a cheaper, less labor-intensive test stand design is presented and its
usefulness tested.
The author has undertaken these design challenges and this topic because this helmet
project promises to provide a high interest opportunity for students to express their
creativity and use the design skills and cooperative collaboration on an authentic
engineering design challenge. (Lam, Tack & Gates, Deanna, 2010; last2, 2001)

3
Chapter 2
LITERATURE REVIEW
This report details alterations to the project that are based on pedagogy and the need to
address student apathy while suggesting several changes that are based on creating
logical measurement processes and materials for the physical parts of the Helmet Design
Project. Thus, two different areas of literature are reviewed in this chapter. The review
will first discuss the pedagogy background and then present the technical background.
2.1 Pedagogy
The process of creating a productive learning environment in any classroom begins on
the first day of class and continues each day throughout the school year. Every teacher
learns what a moving target student involvement is. Not every student comes to school
each day with a desire to cooperate with the plan for his or her education. This can
happen for a multitude of reasons. Some are personal in nature and tend to affect
individual students. At times it may be school activities or world events that subvert the
day’s lesson plan. The savvy educator will adapt and modify to get the best he can when
students are being people instead of raw material.
The last year of high school is a unique time for students and their teachers. Students see
the end in sight. There are new pressures to have a plan in place for their futures. For the
higher achieving students there are Advanced Placement classes and tests. College
applications present deadlines with dire consequences for failure to get them done.
Planning for graduation, prom, and spring break are seen as well earned perks by the
senior class of year X. “In short the second half of the last year of high school is kind of a
waiting room for the next step in life (Time Magazine, 2006) The year challenges senior
students to stay focused on their coursework and many develop apathy for school.
“Besides feeling entitled as seniors yet bored with familiar school routines, they
acknowledged feelings of uncertainty and confusion about the future.” (Dreis and
Rehage, 2008) This malaise is identified as “senioritis.” The Merriam-Webster
4
Dictionary defines “Senioritis” as “an ebbing of motivation and effort by school seniors
as evidenced by tardiness, absences and lower grades.” (Merriam-Webster 2012)
The Helmet Design Capstone Project HDCP was conducted during the last twelve weeks
of the students’ senior year. During this period all students experience senioritis to some
extent. The lack of learning “buy in” is not unique to high schools. It has been noted by
researchers studying the development of interaction skills through teaching applied skills
and “how people work” discussions, that the techniques are far less successful when
taught to college engineering students in the last semester of their senior year. (Seat &
Lord, 1999)
The HDCP is an activity designed to advance STEM education through project-based
learning (PBL). The intent is to combine scientific study, technology application,
engineering design, and mathematical analysis. (Shi Jer Lou, et al. FEB.2010) One of the
arguments for PBL is that when done correctly there is a high degree of student effort
because they feel they are working on something that is real and matters to them in their
lives. The intent is to engage students in the design process by presenting them with an
open-ended, real world, customer-driven problem and to have them work in collaborative
groups to explore possible solutions, evaluate the pros and cons of the various solution
possibilities, collectively select the best solution and engineer a prototype manifesting
their solution. Also called Model-Eliciting Activities (MEA), such projects are purported
to improve conceptual learning and problem solving skills. (Yildirium, et al., 2009)
The learner-centered PBL and MEA curriculum allows learners to self-monitor, clarify
the subject at hand, construct goals, plan tasks, control their schedules, accomplish their
work, and acquire useful skills. Students thus become project designers, developers,
executors, presenters, and evaluators. (Shyu, 2001) One of the main keys for success in
PBL is actively engaging the pupils in the assessment process. (Doppelt, 2004)
Research by Shi Jer Lou et al, (2010) showed that PBL as a learning behavioral model
has a “positive influence on student’s behavior in the form of cognition and behavioral
intentions.” The researchers noted that “Students displayed a positive attitude, attained
integrated conceptual and procedural knowledge, and demonstrated active behavioral
intentions through STEM in PBL.”
5
The most crucial aspect of the learner-centered curriculum project is the selection of the
topic. The students must find the subject of the project personally meaningful and
authentic. The HDCP was not completely successful at this aspect. The focus placed on
redesigning construction helmets failed to connect with its high school student audience.
When asked if any student in the class had ever used a construction helmet, none had.
Hence, the HDCP did not meet the relevance to the learner required for student “buy in.”
When asked if any of the students had experienced a head injury, a large majority said
they had. Further questioning revealed most head traumas occurred as the result of some
form of play activity. Shifting the subject of study from construction helmets to a sports
protection helmets could tap into the students’ “need to know” a fundamental step to
creating a meaningful PBL.
PBL as discussed by Larmer and Mergendoller ( 2010), should have the following parts:
1. A need to know on the part of the students.
2. A driving question that clearly creates a sense of purpose for the challenge and
spells out what the students will learn from this project.
3. Students must have an active voice in decisions about what and how they will
approach solving the challenge.
4. The project must give students opportunities to practice skills they will need in
their future endeavors. These include skills like collaboration, communication,
critical thinking, problem solving, and the use of appropriate technology. The
future usefulness of these skills adds to the students’ feeling that this is an
authentic and worthwhile activity.
5. The project should stimulate inquiry by the students as they see the need to know
the facts that surround the driving question. There should be an opportunity for
student innovation and creativity.
6. The project should include the process by which students will get feedback on the
success of their proposed solutions. They should have multiple opportunities to
revise their work and plans.
7. The project should require public presentation of the students’ work or product.
“Schoolwork is more meaningful when it’s not done for the teacher or the test.

6
When students present their work to a real audience, they care more about its
quality.”
“The current climate of high-stakes testing and accountability to standards leaves
little room to incorporate engineering design into K-12 classrooms.”(Apedoe, et
al. 2008) Despite that, it is important that students also develop real-world skills.
“In the future children must enter the workforce in which they will be judged on
their performance. They will be evaluated not only on their outcomes, but also on
their collaborative, negotiating, planning, and organizational skills. By
implementing PBL, we are preparing our students to meet the twenty-first century
with preparedness and a repertoire of skills they can use successfully.” (Bell,
2010)
The redesign of the HDCP activities will seek to address the failures of the project as it
was implemented in the first year by making the project more suited to the customer:
seniors finishing their high school years.
2.2 Technical Background
The reason for donning a helmet has not changed since the first Sumerian warriors wore
them in battle 2500 years BCE. (Gabriel and Metz, 1992) The prevention of head trauma
continues to be a work in progress. The development of synthetic plastics and foam has
replaced the bronze and leather lining used in the earliest head protection. Today there is
a multitude of specialty helmets whose designs address the dangers associated with
activities engaged in by modern man. These helmet types fall into three broad categories:
the helmets designed for work related hazards, the helmets used by the military, and the
helmets used to improve the safety of sport activities. In all of these helmets the goals are
the same: prevention of skull fracture and the significant reduction of traumatic brain
injury. The design challenges come from the wide variety of impact hazards and
conditions associated with the use environments of these categories of helmet.
The goal of preventing skull fracture is fairly straightforward. The skull is a robust
container and in most collisions simply spreading the force is sufficient to prevent

7
fracturing. The dynamic high-energy projectile impacts on military helmets and the
prevention of penetration-caused skull fracture are exceptions to this statement and
present profound design challenges that are beyond the scope of this project. (Moss &
King)
The goal of reducing injury to the brain is far more complicated. Cantu (1996) points out
that in collisions the brain undergoes a variety of stresses as the result of acceleration.
The first two types of stress, compression and tensile (stretching), are relatively well
tolerated by the brain. This is because of the presence of cerebrospinal fluid that
surrounds the brain and acts as a shock absorbing mechanism as it flows around the
convoluted contours of the brain during its response to the impact acceleration. The third
type of stress endured by the brain during head-collision acceleration is shearing.
Shearing stress is caused by rotational force exerted on the head that is transmitted to the
asymmetrical brain. The resulting torque causes the brain to twist. This creates a shearing
force that damages the brain tissue. Additional damage can be caused as the sliding brain
rubs on irregular surfaces present on the inside surface of the skull. “Uniform
compressive and tensile forces are relatively well tolerated by neural tissue but shearing
forces are extremely poorly tolerated.” (Cantu, 1996)
The measurement of these forces and the resulting expected brain injury is currently the
topic of much scientific inquiry as the result of high-profile injuries to professional
football players. The National Football League (NFL) and the NFL Players Association
have spurred helmet manufacturers to prove the quality of their products. The National
Operating Committee on Standards for Athletic Equipment (NOCSAE) certifies the
helmets used in the NFL. The standards and testing protocol of the NOCSAE have
improved helmet testing and manufacturers have improved designs to create better
helmets. However, the evolution of head trauma mitigation is far from complete. Some
complain that the standards may be where they are because those making the standards
are reluctant to establish pass/fail criteria that cannot be met by most of the existing
helmet manufacturing industry. (Coben, 2002) In spite of disagreements in design and
methodology, all seem to agree that reduction of the energy transferred to the head results
in less damaging head collisions.
8
This redesign of HDCP is focused on transitioning from using construction helmets from
the work-related category, to using skateboard helmets from the sports-activity category.
Both the construction helmet and the skateboard helmet have a rigid external shell that
resists and deflects blows to the head. The greatest difference between the two is in the
way they “fit” onto the head. The standard construction “hard hat” uses a plastic
suspension system while the skateboard helmet is foam filled. The foam is shaped to fit
the curvature of the wearer’s skull.
The widespread use of construction helmets resulted from the passage of the
Occupational Health and Safety Act of 1983. Under this act, it became a violation of
federal law for employers not to ensure that a safety helmet is worn on a construction site
where a person might be struck by a falling object, strike their head on a fixed object, or
make contact with an electrical hazard. This act imposed the “Duty of Care” upon the
employers to provide helmets that conform to the standards outlined in the Code of
Federal Regulation (CFR) Title 29 OSHA’s guidelines foe Occupational Head Protection
(1901.135). (OSHA)
There are no federal laws that require their use of skateboard and bicycle helmets.
Individuals that use helmets in these sports do so because they are informed of the
dangers and consequences of collisions that are beyond their control. The first line of
defense is safe operational practices that prevent head impacts. “Not hitting something
hard is infinitely better than hitting with a helmet on!” (Bicycle Helmet Safety Institute)
Head injuries are a common cause of sport-related death. “Furthermore, injury to the
head takes on singular importance when we realize the brain is neither capable of
regeneration nor, unlike other body parts and organs, of transplantation. Every effort
must be made to protect the athlete’s head as injury can lead to dementia, epilepsy,
paralysis, and death.”(Cantu, 1996)
The importance of this protection leads to the question of what makes an effective
helmet. There are several organizations that have tested sports-activity helmets and
publish standards for helmet performance. These include the American Society for
Testing and Materials (ASTM), the National Operating Committee for Sports and
Athletic Equipment (NOCSAE) and the American National Standards Institute (ANSI).
Motorcycle helmets are required in several states and the performance characteristics

9
these helmets must meet are established in the Federal Motor Vehicle Safety Standard
(FMVSS)-218 requirements. (National Highway Traffic Safety Administration (2006)
The key ingredient to design success of helmets is the reduction of transferred energy
resulting from collisions between the helmet and other objects. According to Coben
(2002):
For helmet design, the factors that play a protective role and help control impact
energy include:
The deflective component of the shell, allowing the redirection of impact
energy and the use of this load spreading component to reduce the
localization of the force;
Deformation and yielding of a liner material to convert input energy to
heat or mechanical work;
Coverage of vulnerable regions of the head;
A retention system that keeps the helmet in place to avoid exposing
vulnerable areas of the head to impact.
In contrast with construction “hard hats,” sports helmets are not designed for all-day use.
In many cases the level of physical activity makes heavy perspiration unavoidable and so
ventilation, while important, is secondary to energy absorption in the helmet’s design. In
the sport helmet category various types and arrangements of foam are fitted inside the
rigid shell to absorb impact energy. The shells are smooth to allow the surface to slide
relative to the impacting object so the head does not stop abruptly. The helmet sliding
helps prevent rotational forces from occurring. In addition the shell holds the foam’s
shape so the impact force is distributed over a larger surface of the skull thus lowering the
force per area.
The primary function of the foam is to lower transferred impact energy by compression
of the foam material. The force that compresses the foam does work on the foam and the
energy used to do this work is thereby not transmitted to the skull. The compression of
the foam extends the time over which the head is changing its motion. Thicker foam is
better because it takes longer to compress and thus lowers the impact force exerted to
change the motion of the head. This results in lower acceleration of the brain. “Basic laws

10
of physics result in more force to the brain if the stopping distance is shorter, whatever
the ‘miracle’ foam may be.” (Bicycle Helmet Safety Institute)
Selection of the correct foam for padding in helmets is crucial to the design’s
effectiveness. Tests on football helmets show that the transferred energy rapidly increases
when the foam in a helmet “bottoms out.”(Pellman et al, 2006) If the foam is too stiff, it
does not compress until a large impulse has already been transferred to the head.
The quest for having foam pads that are soft enough to cushion impacts yet stiff enough
to avoid “bottoming out” has led to the development of sandwiched foam composites.
Measuring, characterizing and constructing these foam composites are the key student
activities in the redesign of HDCP. The goal is to have a series of tests, conducted by
students on a variety of foam types, that will allow them to design and construct a
padding system based on the predicted performance of foam wafers assembled by the
students. The development of systems and measurement protocols that will allow the
students to characterize foam performance and to make informed decisions about the
foam types they want to use in their helmet redesign is mission critical for this report.
“All cushion systems can be analyzed as mechanical springs: that is, they compress in
response to an applied load.”(Khangaldy and Schueneman, 2000) The applied load is
produces stress in the material, and resulting deformation is used to compute the strain.
The ratio of stress to strain is found to be constant for small stress levels, a form of
Hooke’s law. The proportionality constant is called the elastic modulus or Young’s
modulus. (Serway, 1996) It has been observed that many types of foam exhibit a uniform
compression to an applied load through a short range of deformation and thus follow
Hooke’s Law, as revealed by the linear relationship of stress to strain. This elastic
response is followed by a flattening of the slope of the stress to strain ratio. This is
referred to as the force plateau. In this part of the foam’s reaction to the impact, the
internal structure of the foam is collapsing. In this collapsing process, some foam
products will be flattened and then spring back after the load is removed. (Khangaldy &
Schueneman) The measure of how well a foam returns to its original condition is a likely
topic for testing by the students involved in the helmet redesign project.
Another useful metric that can be used to evaluate foam’s performance is its coefficient
of restitution. The coefficient of restitution is a measure of how well the foam alters

11
impact speed. The ratio of the rebound speed of an object to its impact speed is its
coefficient of restitution. A perfectly elastic collision has a coefficient of 1 and an
inelastic collision with no rebound has a coefficient of 0. A low coefficient of restitution
value is typical of designs that give good first-impact shock protection. The low
coefficient of restitution comes from the permanent collapse of the foam and requires that
the helmet be discarded after the impact. As with most materials, there are trade-offs
inherent in the selection of foam type.
In a series of tests, executed by Lawrence Livermore National Laboratory (LLNL), to
compare the impact response of NFL helmet pad systems and U.S. Army pad systems
used in combat helmets, Moss and King (2011) concluded the following:
The performance of a pad depends on the range of impact velocities. At lower
impact, softer pads perform better. At higher impact velocity, harder pads perform
better.
Thicker pads perform better at all velocities, but especially at high velocities.
They went on to state that the amount of energy a pad can absorb before it densifies is
strongly dependent on thickness. Thicker pads employ a greater “stopping distance” and
can dissipate a given amount of energy with less force. (Moss and King, 2011)
Students will be forced to “design under constraint” because the pad thickness will be
mandated by the gap between the helmet shell and the head. In addition, student
designers will have to assess the impact they are designing the helmet to withstand. The
LLNL study points out that “For a given impact energy, there is a limit to the benefit
imparted by thickening the pads.”
While many of the impact tests conducted by the LLNL involve complex and expensive
testing devices and are therefore not suited to the high school classroom, they show
clearly that foam performance can be characterized and predicted. One test that can be
imitated in this redesign is the Cylinder Impact Test. This test involves dropping a metal
cylinder on foam samples and measuring the compression distance. In addition the
acceleration of the cylinder is measured. With the known mass and acceleration values,
force is calculated and a model of force to compression developed. This test was used to
compare the impact mitigation performance of foam types.
12
The Cylinder Impact Test revealed that all foams tested had a brief elastic response and
then the force leveled off in a “crush plateau”. This plateau shows that as the structure of
the foam collapses, the work done on the foam to cause this collapse is dissipating the
energy of impact. In soft foam the force is low, and in hard foam the force is higher. The
ideal foam would be as soft as possible but at the same time would dissipate all the
impact energy through crushing before bottoming out. The conclusion of the LLNL
researchers is that, “A single foam will be optimal for only one specific amount of
impact.” (Moss and King (2011) The need for energy absorption over a wide variety of
impacts will point out to the students that sandwiched foam composites provide a wider
range of impact mitigation. The choices students make in designing their pads will
determine the success of their helmet redesign project.
13
Chapter 3
Lessons Learned from FIRST YEAR OF PILOT COURSE
The engineering design and problem solving class at Bowie High School is a fourth year
elective course that fulfills the fourth science credit requirement mandated for the
advanced graduation plan promulgated by the Texas Education Agency. A consortium of
faculty from The University of Texas, Cockrell School of Engineering and Austin area
high school educators created the course curriculum developed under a grant from the
National Science Foundation. Officially known as UTeachEngineering, the program’s
goal is to create a course that will introduce students to the engineering design process
and the necessary habits of mind in a way that will inspire students to pursue engineering
and related fields as they enter their college years. The hope is that by careful attention to
keeping the cost of providing this course low, and by illustrating the benefits to the
students derived from this experience, that this course will become a widely accepted
template for engineering education at the high school level.
The 2010 – 2011 school year was the first year that the high school engineering course
was implemented in several schools in the Austin, TX area. The author participated as
one of seven pilot teachers and taught the course in one section of eighteen senior-class
students at James Bowie High School (Austin, TX). Bowie is a generally high-
performing school whose students are from middle to upper-middle socioeconomic
backgrounds. The class was generally successful in each of the design units and as one
would expect, the pilot teacher was an active learner throughout the year. The focus of
this chapter is on the final engineering challenge of the school year. This challenge was
intended to be a “capstone” project that would encourage the students to apply the
processes, knowledge, and skills learned during the course. This approach is successfully
used by colleges of engineering to showcase the skills of their students.
The project was presented to the students in a handout that outlined the unit. It stated:

14
For the next 12 weeks you will be working on a specific Design Challenge. The challenge
is stated as follows:
Design an innovative suspension system out of supplied materials for a standard
construction helmet that performs better than the off-the-shelf helmet suspension system
and satisfies the following constraints:
Specific customer needs
Better performance (i.e., 10% better absorption of energy) on the “drop impact
test” than the standard construction helmet
Removable
Comfortable to wear over long periods of time
3.1 Test Stand Construction
The helmet redesign project began for the pilot teachers several weeks before the
students. We met at the J. J. Pickle Research Center in Austin with Bill Humphries, a
master teacher with UTeachEngineering, Dr. Ken Diller, Professor of Biomedical
Engienering, and his graduate assistant, Steve Embleton. At this meeting, Dr. Diller gave
us an overview of the science behind the challenge and we were led through the
construction of the test stands to be used for the “drop tests” to assess the quality of the
student redesign strategies. We constructed two different stands for the challenge. The
first was a copy of the first iteration of the test stand created by Steve Embleton. This
stand was not rigid enough to make reproducible impacts on the helmet. The intent of
building and having the students use this “failure” was to have them determine that the
results they were getting were not consistent and that a better stand was needed. The
script called for us to reveal the second ‘improved’ test stand at this point and have
students compare the results.

15
Figure 1 Failure stand
Figure 2 Working stand

16
The construction of the test
stands took far longer than expected. Despite being built of wood that was already cut so
the stand only needed to be assembled, we had not completed any of the second
“working” test stands by the end of a very long day.
We determined that the second stand required around 150 wood screws to assemble. The
stand is 7 feet tall and 2 feet square. Note the level adjustment screw on the front left leg.
Figure 3 Spring plate and potentiometer
Two of the sub-assemblies required extra care during assembly. The first was the spring
platform system. The purpose of this platform is to secure the head form and helmet in
position below the weighted piston that impacts the crown of the helmet during testing.
The maximum downward displacement of the platform is measured to determine the
energy transformed into potential energy stored briefly in the springs. This is a platform
that is “floating” on three tension type springs. There is a large dowel that passes through
the middle of the spring platform. The top end of this dowel is where the resin head form
is held and the bottom of the dowel rests on the sliding arm of a potentiometer. There is a
9 volt battery attached to the circuit containing the variable resistance potentiometer.
The helmet is attached to the head form and when the weight is dropped on the helmet,
the resistance in the circuit changes as the dowel pushes down on the slide arm of the
variable resistance potentiometer. The changing current indirectly measures the

17
displacement of the springs. The fact that the slide on the potentiometer only sticks out
about one quarter of an inch makes the mounting position of this device and the
alignment of the spring plate critical. Each spring is attached to an eyehook screwed into
the bottom of the plywood shelf that is positioned about twenty inches above the floor.
The other end of each spring is attached to an eyehook that is screwed into a half-inch
diameter dowel that extends from the bottom of the spring platform through the shelf via
holes drilled in the shelf. The effect of this arrangement is that the platform is suspended
on these three springs and the center dowel is resting on the upper end of the
potentiometer arm. We were given a diagram showing how to change the position of the
platform by screwing the eye-screws in or out to center the platform. This required
repeatedly removing and reinstalling the springs, which was difficult and tedious.
Figure 4 Top of spring plate

18
3.2 Problems Encountered during Testing
Note the screws (see Fig.4) inserted into the dowel at the point where it enters the
platform. These were added during testing to correct movement of the dowel resulting
from failure of the glue that joined the dowel and the plywood. The repeated impact of
the five-pound weight plus piston to the top of the helmeted head form acted to drive the
dowel through the platform and defeated all attempts to glue this joint. In addition the
plywood platform that formed the impact end of the piston, upon which the five-pound
weight rested, was separated from the 4-foot long wooden piston dowel. The joint where
the platform attaches to the dowel broke free repeatedly. Failure of this joint was never
completely solved.
During early testing a student dropped the piston onto the head form without a helmet in
place. This resulted in a part of the head form shattering. Since the suspension of the
Figure 5 Damaged Head Form

19
construction helmets was not affected by this damage, the head form was still usable. The
problem of the head form fracturing was the result of the head form being cast with two
pours of resin into the mold. The difference in catalyst to resin ratio, and the resulting
difference in curing temperature between the two resin pours, resulted in a fissure in the
head form. The surface shattered along one of the fissure lines. This problem could be
solved by placing some fiberglass cloth in the bottom of the head form mold before
pouring in the resin and by mixing a sufficient quantity of resin to fill the mold
completely in one pour.
3.3 Student Experience during the Project
If one views the students as the customers for this activity, several problems are apparent.
One problem was that the activity did not fit its audience. The students did not relate well
to construction helmets. When asked, none of the students had ever worn a construction
helmet. Another customer issue was timing. This activity was intended to be a twelve-
week capstone project. The goal was to provide an engineering challenge that would
allow students to use and showcase the engineering principles and skills they had learned
throughout the year. However, due to time overruns on previous challenges, when we
started the project we had ten weeks left before finals began. In a university setting,
senior students in the competitive environment of a top engineering school see the
capstone project as a showpiece for impressing potential employers. In contrast, the best
students in my class have already been accepted to the university or college of their
choice and the others just want to get out of high school. The end result was that many
students had ‘checked out’ and had little buy-in to the project.
The research portion used to familiarize the students with customer needs and the state of
the art went well. The next problem came when we placed the construction helmets on
the resin head form. The helmets were too big even when they were on the smallest size
setting. Adding tape or cardboard to the brow band helped, but the students never were
happy with the fit on the head form. Some pointed out that if there was an inconsistency
in the fit, then the results of the tests would be useless.

20
We began testing on the “failure” stand and the students quickly saw the stand as a waste
of time and insisted that we get on with the “real” stand. As described above, the working
stand is about six feet high and is designed to drop a five pound weight that rides on a
plunger made of a plywood plate that has a four and a half foot long, one inch diameter
wooden dowel attached that guides the weight’s fall and prevents the weight from sliding
off the helmet. The dowel of the plunger is, in turn, guided by sliding through a section of
PVC pipe secured to the upper part of the test stand. The weighted plunger falls about
two feet onto the top of the helmet that is attached to the head form that rests on the
central dowel of the spring platform. To gather meaningful data the test stand must be
plumb so that all movements are aligned with the direction of the gravitational force. At
the start of each test run the plunger is lifted up and held in place by a metal link pin that
is inserted through the side of the PVC pipe into a hole in the plunger dowel.
Figure 6 Piston Guide
To collect the data on velocity, acceleration, and spring displacement the students
attached a National Instruments (Austin, TX) myDAQ to the potentiometer. The myDAQ
converts the analog signal from the potentiometer into a digital signal. With this signal
fed into the computer we ran our first test. We soon discovered that the pin did not
release smoothly and ultimately resorted to having one of the team hold the plunger by

21
hand and just let go on commend. This we found resulted in less friction during the time
the plunger dowel was traveling through the PVC pipe.
The next problem we encountered was with the data coming from the potentiometer. We
were getting readings that indicated that the springs were being displaced 10 cm. This
was clearly impossible because the spring plate would bottom out on the shelf at 8 cm.
Even when we tried dropping from a lower height, the potentiometer was sliding to the
bottom. We assumed that the slide was continuing to the bottom as the result of
momentum and rigged a way to attach the slide arm to the lower end of the central dowel
of the spring platform. When this was done the spring plate was somehow twisting and
jumping off the arm of the slide. These problem-solving sessions happened over several
classes and since no successful testing was occurring, many students were left waiting
with little to do. The fact that there was only one test stand for six teams had always been
a concern and because most of the modifications required the participants to lay on the
floor under the stand, the remainder of the class lost interest. After several unsuccessful
attempts, we finally got the arm firmly attached to the bottom of the center dowel of the
spring plate. This success lasted a total of two test drops and then the potentiometer slide
arm sheared off and the stand was out of commission.
3.4 Beginning the Redesign
At this low point, feeling that I had lost the vast majority of the class and frustrated the
few that had tried to problem solve with me, I decided to take a fresh look at the
collection of data from the test stand. A review of the stand’s function revealed that
primarily we needed to find the final speed of the plunger as it struck the top of the
helmet, and secondly, we needed to accurately measure the maximum displacement of
the spring plate. The now destroyed potentiometer was doing this by measuring the
relative current and the computer program measured the elapsed time. I realized I could
accomplish the same measurements using sonic range finders and Venier (Beaverton,
OR) LabQuests.
By setting the range finders on the narrow beam setting and aiming one at the top of the
falling five-pound weight, the LabQuest can determine the maximum speed of the falling
22
piston. One could assume the maximum speed occurs just prior to impact. We removed
and measured the mass of the piston. With the mass and final velocity, we calculated the
kinetic energy that the piston delivered to the crown of the helmet.
Next, we addressed the spring plate. The springs were removed from both the “failure”
stand and the troublesome “working” test stand. During the next class I had the teams
attach the springs to ring stands and using slotted weights to provide a variety of forces to
each spring and carefully measure the displacement of the springs to determine the spring
constant of each spring. Each group then traded springs with another group and tested
different springs to check the validity of the each group’s test. We then picked three
springs with the closest spring constants and I assigned one group to reinstall the springs.
After teaching a short lesson on Hooke’s Law and discussing how springs installed in
parallel have their spring constants added to determine overall spring constant, I led a
whole class activity to test the spring constant of the spring platform. Satisfied our
calculations were correct, we set up a test drop and discussed the test protocol needed
using the LabQuests and the rangefinders.
Next we measured the distance that the plunger fell before striking the top of the helmet
and calculated the theoretical speed that the plunger reaches during the fall so we could
check the reasonableness of the data we collected. We performed a test drop and found
our number was remarkably close to the predicted speed. The student’s confidence
soared. The spring displacement was also reasonable as it fell in the 6 to 7 cm range.
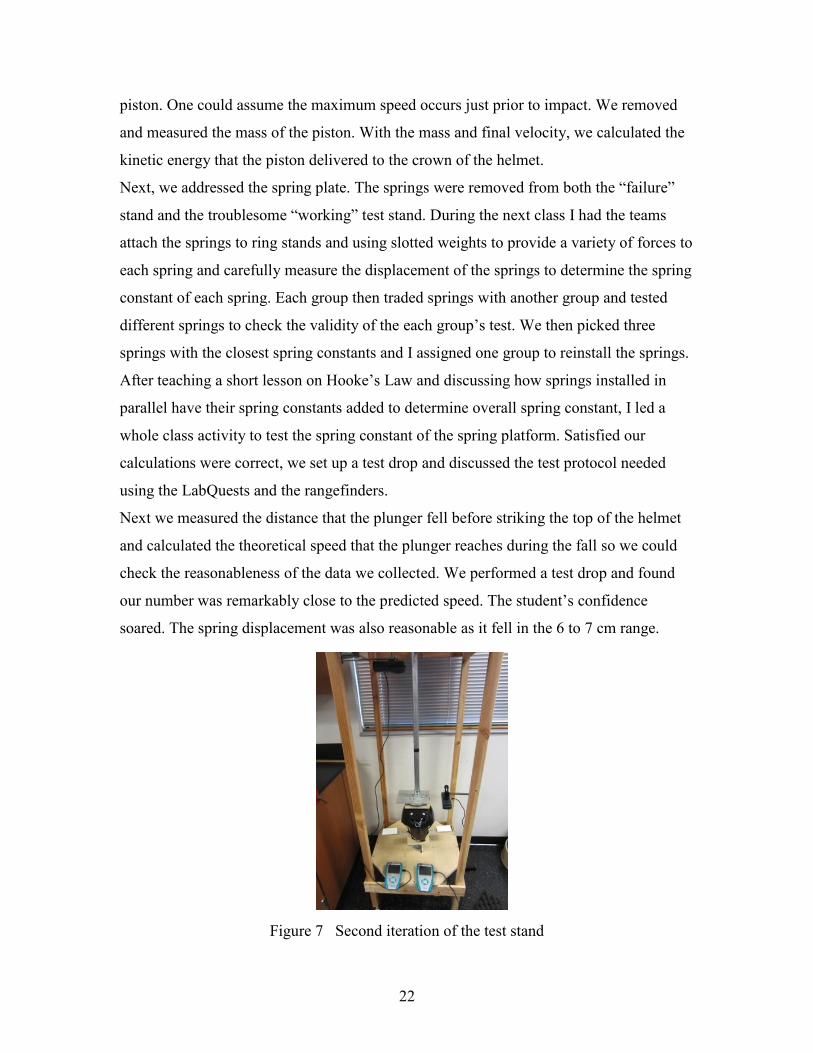
Figure 7 Second iteration of the test stand
23
With these two measurements we made the following calculations. With the maximum
velocity and the mass of the weight and plunger we calculated the kinetic energy that was
delivered to the top of the helmet. With the displacement of the spring plate and the
spring constant of the spring plate, we calculated the elastic potential energy transferred
to the springs. We assumed the difference between the kinetic and the elastic potential
energy was the quantity of energy absorbed by the helmet and the head. It was not until a
post mortem of this activity that I discovered that our assumption failed to include the
gravitational potential energy of the plunger as part of the energy input. In the end, this
failure did not matter since the challenge was to redesign the helmet to absorb 10% more
of the kinetic energy. The energy added as the result of the gravitational energy from the
plunger remained essentially constant and the effect on the ratio was to over-predict the
absorbed energy. This meant that the challenge of improving helmet performance 10%
was in actuality met by improving the kinetic energy absorption by almost 15%. This
“mea culpa” aside, the students determined the ratio of the kinetic energy in to the elastic
energy transferred and said that improving that ratio by 10% the performance metric that
would determine success. It was further agreed that this improvement would have to be
maintained for three consecutive test drops.
Using a ratio of the input kinetic energy to the potential energy transferred to the spring
plate made it much easier to conduct testing because changes in the test stand or the angle
of the plunger fall do not affect the ratio. Students already had experience with the
LabQuest system and quickly gathered the baseline measurements for the helmet given to
their group for testing and redesign.
Back on track, the class dived into removing and evaluating the suspension of the
helmets. It soon became apparent that the students did not have the material or equipment
to make any meaningful changes to the existing suspension. Replacing the suspension
with foam did not meet the constraint of long term wear ability due to heat retention. In
the end, one of the groups used a lattice of rubber bands to create a suspension of sorts.
This redesign did improve the energy absorption beyond the 10% target; however, the
design required a chinstrap to prevent it from rebounding off the head form.
24
3.5 Conclusions Drawn From the Experience
It is the opinion of the author that this design challenge has the potential to be
exceptionally effective in teaching the redesign process and, with the modifications
proposed in this report, will be interesting and provide students with the opportunity to be
innovative in a carefully studied way .In order to realize the beneficial outcomes that the
Helmet Redesign Project can produce, several additional modifications are needed.
Primarily, one needs to listen to the voice of the customer. Select a helmet that students
have used or will use. Provide more things with which they can measure and create.
Provide remodel opportunities that are doable in the classroom, safely and economically.
Simplify the test stand design so it is easy to build and store. The designing and testing of
solutions to these challenges is the goal of this project and this report.

25
CHAPTER 4
TEST STAND REDESIGN
In planning the redesign of the test stand, I identified the customer as the teacher who
will have to build, use, and store the test stand. A successful redesign must meet the
following customer needs:
The teachers will be able to build the test stand and learn how to use it
successfully in a single day “make and take” training session.
Parts for the construction of the test stand must be available locally.
The test stand must fit in a compact car so it can be transported easily.
The stand must be simple to assemble and disassemble.
The spring plate and impact piston must be robust and durable.
The test stand must give consistent impacts to the head-helmet component.
When not in use, the test stand must be easy to store.
The test stand must be safe and easy to use by students.
Students can collect accurate and meaningful data using the test stand.
4.1 Impact Piston and Piston Guide Redesigns
The initial emphasis of the test stand redesign revolved around making the plunger more
robust and simpler to build, and improving the plunger’s performance as a target for the
range finder. The first iteration was constructed using metal parts instead of wood. The
long wooden dowel of the original design was replaced with electrical metal tubing
(EMT). Using 1” EMT and a threaded coupling screwed into a 1” floor flange that was
then attached to the five pound weight, a metal target plate, and finally, a 4” square of
plywood resulted in a redesigned plunger that was very durable. The addition of an
expanded target surface enhanced the sonic rangefinder’s performance. This improved
component was renamed the impact piston.
26
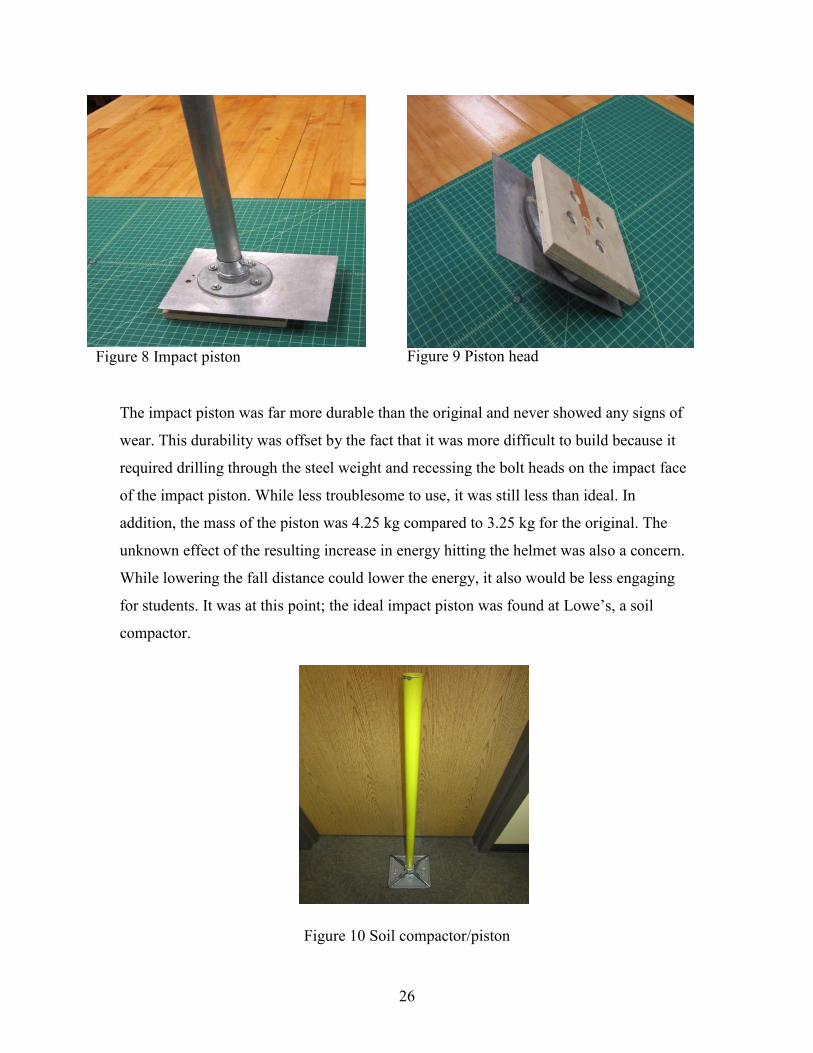
The impact piston was far more durable than the original and never showed any signs of
wear. This durability was offset by the fact that it was more difficult to build because it
required drilling through the steel weight and recessing the bolt heads on the impact face
of the impact piston. While less troublesome to use, it was still less than ideal. In
addition, the mass of the piston was 4.25 kg compared to 3.25 kg for the original. The
unknown effect of the resulting increase in energy hitting the helmet was also a concern.
While lowering the fall distance could lower the energy, it also would be less engaging
for students. It was at this point; the ideal impact piston was found at Lowe’s, a soil
compactor.
Figure 10 Soil compactor/piston
Figure 8 Impact piston Figure 9 Piston head
27
Soil compactors are designed to flatten and compact the subsurface soil beneath brick
paver stones. It has a 1” metal tube handle and a one-foot square steel tamping plate. This
tool is made to withstand repeated hammering and provides a flat surface for impacting
the helmet. Its wide surface provides a good target for the sonic rangefinder. This tool
costs about $25, which is not much more than the parts in the impact pistons described
above. No assembly is required and it is unquestionably durable. Its mass is 3.9 kg.,
which is the drop mass for testing children’s helmets specified by the Consumer Product
Safety Commission.
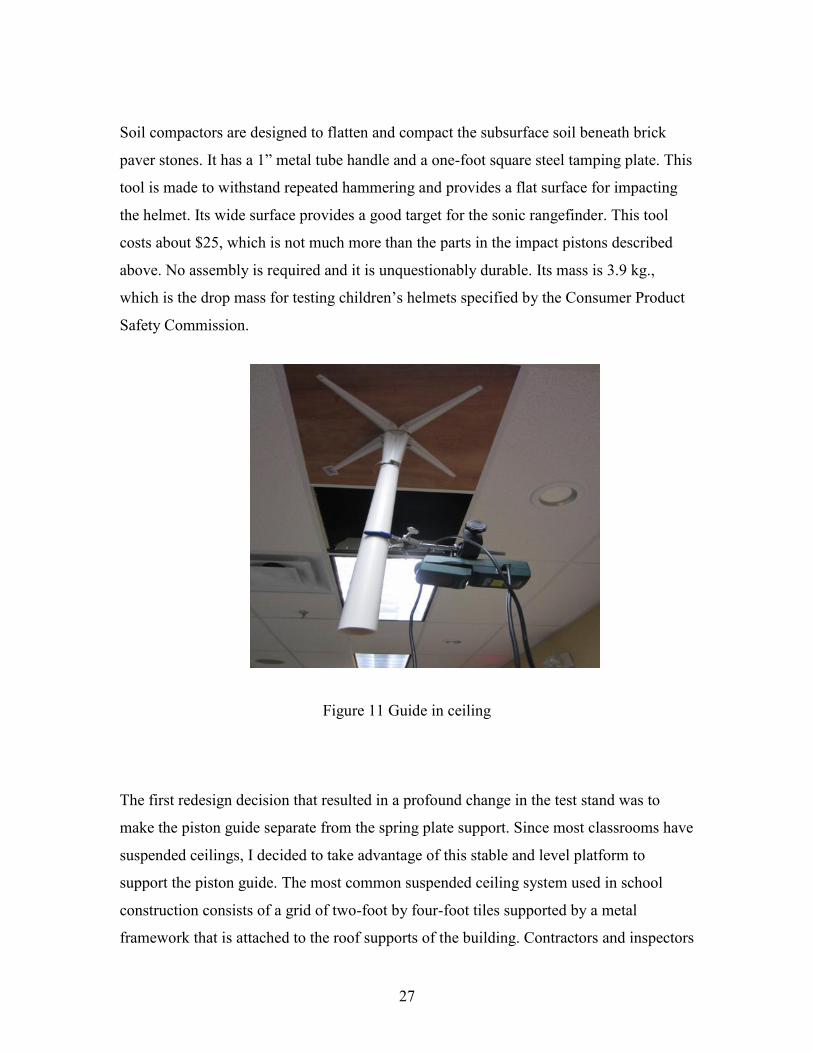
Figure 11 Guide in ceiling
The first redesign decision that resulted in a profound change in the test stand was to
make the piston guide separate from the spring plate support. Since most classrooms have
suspended ceilings, I decided to take advantage of this stable and level platform to
support the piston guide. The most common suspended ceiling system used in school
construction consists of a grid of two-foot by four-foot tiles supported by a metal
framework that is attached to the roof supports of the building. Contractors and inspectors
28
go to great lengths to make sure these ceilings are level and that the wire supports are
placed so that the ceiling can support the weight of light fixtures, air conditioning
diffusers, and ductwork.
The materials needed for this portion of the stand are as follows:
24-3/4”x 24-3/4” ¾”plywood (Available at Lowe’s pre-cut for around $8)
Four 12”x 14” shelf brackets (Available at Lowe’s for under $2 each)
Two 2” hose clamps (Also at Lowe’s)
One 10’ PVC pipe 1-1/8” in diameter (Lowe’s)
½” wood screws
One ceiling grid T-bar section 24” long. (Lowe’s under $2)
One sub-soil tamper. ( Pictured above) The preferred tamper has a metal tube
handle with a rubber cap. This type of tamper was only found at Lowe’s. The
tamper with a wooden handle would require replacing the handle with a piece of
1” electrical metal tubing.
The assembly requires a 1-5/8” hole saw or paddle bit to drill a hole in the center of the
plywood. One may need to sand the hole a little so the PVC pipe will slide through the
hole. Cut the PVC pipe into a four feet length and, with the plywood on a flat surface,
place the end of the pipe in the hole. Note that the length of the pipe may need to be
longer or shorter depending on the ceiling height in the classroom. Position the four shelf
brackets so they radiate outward at right angles to one another and with the 12” length
facing outward onto the plywood. Using the 1/2” wood screws secure the brackets to the
plywood. Slide the hose clamps down over the shelf brackets. The clamps secure the pipe
to the brackets. One clamp should be placed near the end of the brackets to provide a firm
grip on the pipe. By loosening the clamps the PVC pipe can be moved up or down to
adjust the height of the guide. The guide is now ready to be placed in the ceiling.
To place the impact piston guide in the ceiling, first select a location that will allow
students enough space to gather so that they will be able to observe the tests. Another
important consideration is the location of air conditioning ducts, public address speakers
and lights. The sounds and electric fields may inhibit data collection since sonic range-
finding devices will be used to gather test results. Data collection and trouble-shooting
will be discussed more thoroughly later.
29
Once a suitable location is chosen, carefully push up the ceiling tile, tilt it and lower it
through the grid. Next, take the 24” T-bar section and place the tabs that extend at each
end of this piece into the slots located at the mid-point of the four feet sides. This creates
two 2’x 2’ openings. Select the opening you wish to use for the guide and, holding the
guide assembly by the pipe, tilt and lift up the plywood through the grid and maneuver it
into place. The pipe clamps can be loosened to allow the height of the guide to be
adjusted. The other 2’x 2’ opening can be filled with a piece of cardboard or foam board
cut to 23-3/4” x 23-3/4”.
Preparation of the impact piston requires the removal of the rubber cap. In most cases,
this is accomplished by pulling up on the rubber cap while standing on the tamp plate. If
this does not work, simply use a razor blade to cut a slit on one side of the cap and then
remove it. After removing the cap, remove the labels on the pipe handle. Removing the
glue may require a solvent. It is important that the pipe be clear of all glue and anything
that would prevent the pipe from sliding freely in the guide’s PVC pipe. The tamper plate
is cast steel and provides a good flat surface for reflecting the sound energy used by the
sonic range finding device. The result is accurate and replicable position and velocity
readings as this piston is dropped on the helmet-head target.
4.2 Lower Test Stand Redesign
The next aspect of the test stand I evaluated was the structure supporting the spring plate.
In the original design, the deck to which the spring plate was attached also provided
torsional rigidity to the tower structure upon which the impact piston guide was mounted.
By attaching the guide to the ceiling grid, primary function for the stand for the spring
plate becomes positioning and leveling the spring plate independently. The stand must be
sturdy enough to withstand repeated impacts, while also being easy to store and
construct. I evaluated a variety of commercially available workbenches and discovered
that the simplest version of the Black and Decker Workmate 125 meets all the design
needs at a cost of $35. This was not much more than the wood required for building a
deck, and the construction time is only about twenty minutes. For a teacher, the added
bonus of being foldable means far less space for storage. The functioning vise also will
30
be a useful addition to facilitate other engineering activities. The Black and Decker
Workmate is available from Target online only ( www.target.com). The easy to follow
instructions are included with the Workmate.
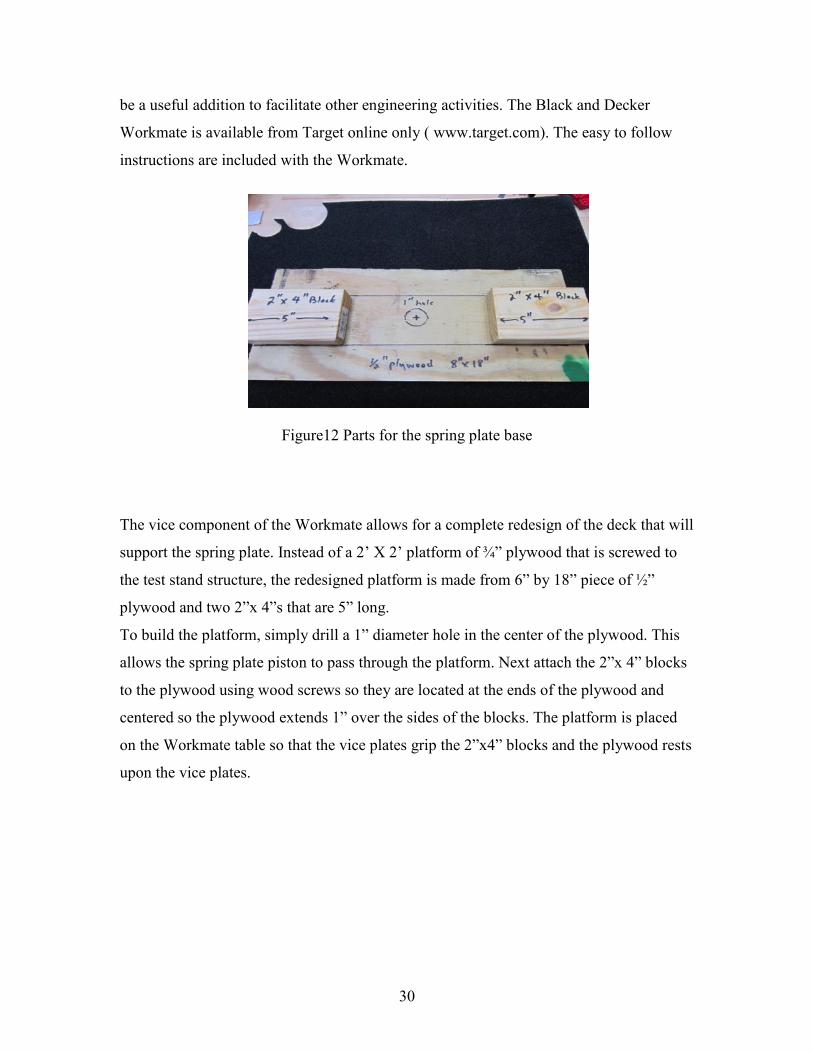
Figure12 Parts for the spring plate base
The vice component of the Workmate allows for a complete redesign of the deck that will
support the spring plate. Instead of a 2’ X 2’ platform of ¾” plywood that is screwed to
the test stand structure, the redesigned platform is made from 6” by 18” piece of ½”
plywood and two 2”x 4”s that are 5” long.
To build the platform, simply drill a 1” diameter hole in the center of the plywood. This
allows the spring plate piston to pass through the platform. Next attach the 2”x 4” blocks
to the plywood using wood screws so they are located at the ends of the plywood and
centered so the plywood extends 1” over the sides of the blocks. The platform is placed
on the Workmate table so that the vice plates grip the 2”x4” blocks and the plywood rests
upon the vice plates.

31
Figure 13 Spring plate platform on Workmate 125
Figure 14 Helmet Testing

32
4.3 Spring Plate Redesign
The spring plate assembly that bolts on to the platform described above has gone through
several modifications and redesigns. Initially, modifications were made to allow the sonic
rangefinders to “see” the spring plate. The first solution was to nail a board to the top of
the wooden platform upon which the head form rested and staple a piece of cardboard to
it. The board and card extended out beyond the head form so that a rangefinder
positioned above the cardboard could record changes in the card’s position. It was
observed that the wind drag on the card was causing the platform to tilt as it was pushed
down during impacts upon the helmet. The platform targets were remade to create less
drag and, by extending on both sides, no net torque would be developed as the spring
plate was compressed. Figure 14 shows a test being performed on a helmet using the
impact piston made from the subsoil tamper. The test is being performed on the original
test stand using the second iteration of sonic target platforms described above.
The construction of the original spring plate requires careful drilling and a great deal of
glue drying time. The suspension of the plate assembly, so that the four wooden dowels
are properly located and the three springs are tensioned, is equally tricky and labor-
intensive. The redesign focused on making the system easier to build and use. As before,
metal components were chosen wherever possible. This assures that the design is durable.
The goal was, again, to have all the parts of the spring plate available at the local
hardware store. Below is a list of the parts needed:
33
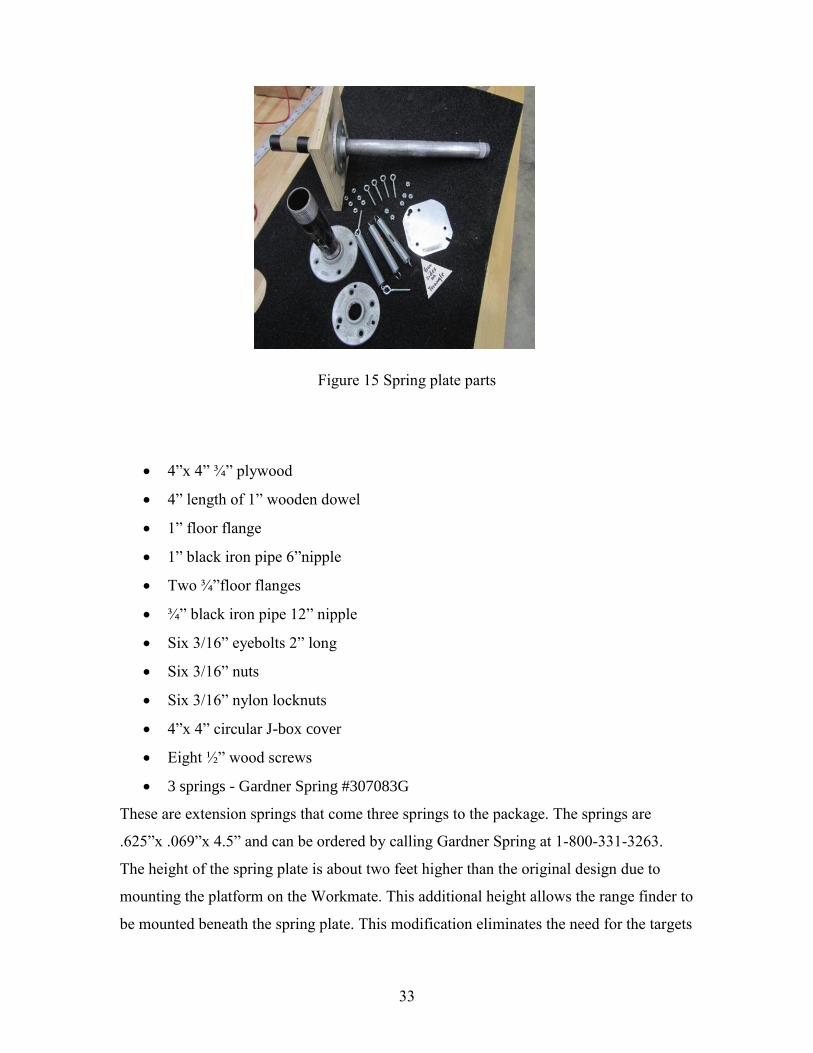
Figure 15 Spring plate parts
4”x 4” ¾” plywood
4” length of 1” wooden dowel
1” floor flange
1” black iron pipe 6”nipple
Two ¾”floor flanges
¾” black iron pipe 12” nipple
Six 3/16” eyebolts 2” long
Six 3/16” nuts
Six 3/16” nylon locknuts
4”x 4” circular J-box cover
Eight ½” wood screws
3 springs - Gardner Spring #307083G
These are extension springs that come three springs to the package. The springs are
.625”x .069”x 4.5” and can be ordered by calling Gardner Spring at 1-800-331-3263.
The height of the spring plate is about two feet higher than the original design due to
mounting the platform on the Workmate. This additional height allows the range finder to
be mounted beneath the spring plate. This modification eliminates the need for the targets

34
attached to the top spring plate and greatly simplifies the target position. In the newest
design, a metal junction box (J-box) cover is fixed to the bottom of the spring piston and
the range finder is positioned pointing upward at this target. Attachment of the range
finder requires fewer parts and is less likely to be moved during testing.
The basis of the design is that a ¾” pipe will slide through a 1” pipe. Black iron pipe was
selected because it is the least expensive and can be easily sanded and polished to reduce
friction. When purchased, the fact is that a 3/4 “ pipe will not pass through the 1” pipe
because of the seam on the inside of the 1” pipe where the metal is joined to form the
tube. To remove this ridge inside the pipe, one can use a round file inserted into a
variable speed hand held electric drill. The file is inserted into the pipe to grind off the
steel ridge. Once this ridge is removed and the ¾” pipe is cleaned and polished, it will
slide through without difficulty. After completing this part, the remainder of the device is
easy.

35
Figure 16 Completed spring plate
Figure 17 Hole guide

36
The center pipe is attached to the wooden plate and dowel with a floor flange. The pipe
then passes through the 1” floor flange, which is attached to the platform in the center.
Figure 16. (Making this platform is described above) The center pipe passes through and
is guided by a 1” pipe nipple that extends up through the 1’ hole in the platform and is
attached to the 1” floor flange. At the bottom of the center pipe another ¾” floor flange is
attached. Using eyebolts, the three springs are attached at 120 degrees apart. To
determine the placement of the holes on the ¾” floor flange, draw on a piece of paper an
equilateral triangle whose sides are 6cm. in length. Cut out the triangle and place it on the
flat side of the floor flange. Arrange the tips of the triangle so that they are equal
distances from the outer edge of the floor flange base, and not touching any of the screw
holes in the flange. Using a permanent marker, make a dot on the flange at the end of
each tip of the triangle. Drill 1/8” holes at each dot; this will place the holes 120 degrees
apart. Next, center the ¾” floor flange on the bottom of the 1” floor flange. Use the
drilled holes to mark the positions of the holes to be drilled in the 1’ flange. Drill 1/8”
holes in these locations. Place a mark on the outer edge of both flanges to line the holes
up when the springs are attached. Again, place the ¾” floor flange on the round cover
plate, and use the hole to mark the locations for drilling matching holes in the cover plate.
This cover plate will be attached to the bottom of the ¾ floor flange to provide a flat
target area for the sonic range finder.
Before continuing to assemble the spring plate, it is important to determine the mass of
the piston components of the spring plate. Accurately knowing the mass is essential to
determining the spring constant of the spring plate. Before assembly, measure the mass of
the wooden dowel and plate, the center ¾” pipe, both ¾” floor flanges, the cover plate,
three of the eyebolts with nuts, and three locknuts. Record the total of these masses as the
mass of the spring plate piston. With the mass recorded, the final assembly can begin.
Assembly instructions:
Determine the center of the 4”x 4” plywood plate by drawing a diagonal line from
corner to corner. The intersection of the lines is the center of the plate. Do this on
both sides.
Drill a 15/16” hole halfway through the center of the 4”x 4” ¾” plywood plate.
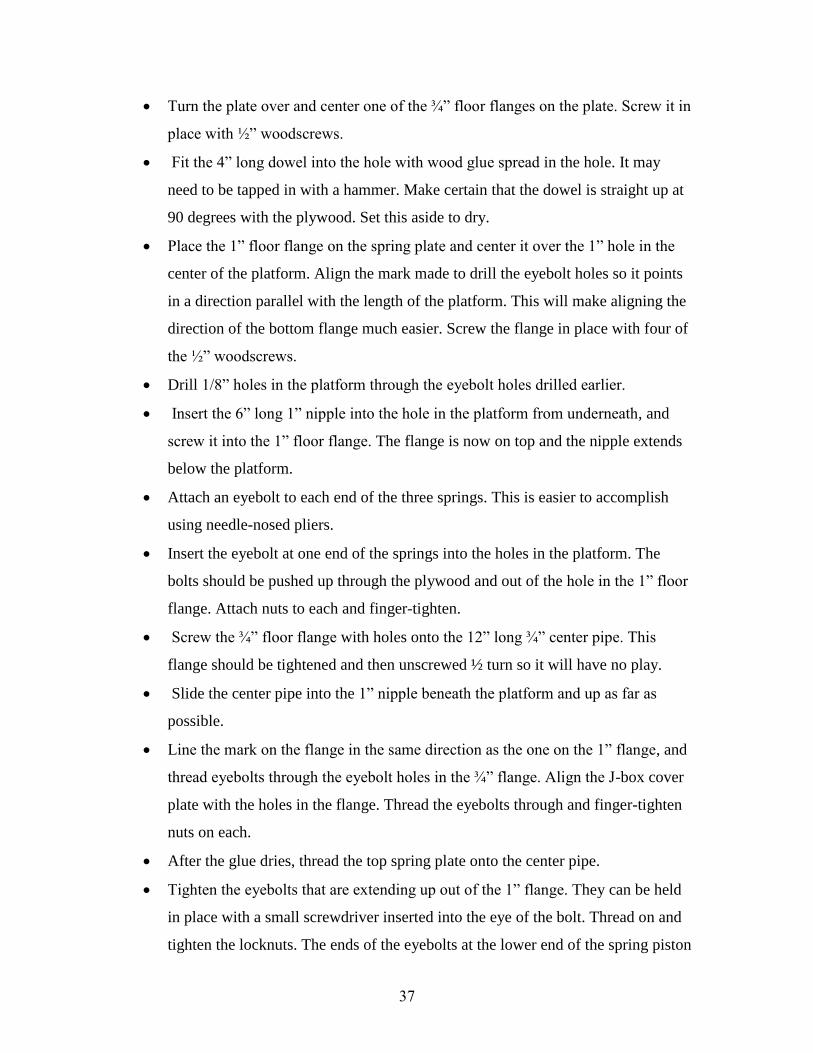
37
Turn the plate over and center one of the ¾” floor flanges on the plate. Screw it in
place with ½” woodscrews.
Fit the 4” long dowel into the hole with wood glue spread in the hole. It may
need to be tapped in with a hammer. Make certain that the dowel is straight up at
90 degrees with the plywood. Set this aside to dry.
Place the 1” floor flange on the spring plate and center it over the 1” hole in the
center of the platform. Align the mark made to drill the eyebolt holes so it points
in a direction parallel with the length of the platform. This will make aligning the
direction of the bottom flange much easier. Screw the flange in place with four of
the ½” woodscrews.
Drill 1/8” holes in the platform through the eyebolt holes drilled earlier.
Insert the 6” long 1” nipple into the hole in the platform from underneath, and
screw it into the 1” floor flange. The flange is now on top and the nipple extends
below the platform.
Attach an eyebolt to each end of the three springs. This is easier to accomplish
using needle-nosed pliers.
Insert the eyebolt at one end of the springs into the holes in the platform. The
bolts should be pushed up through the plywood and out of the hole in the 1” floor
flange. Attach nuts to each and finger-tighten.
Screw the ¾” floor flange with holes onto the 12” long ¾” center pipe. This
flange should be tightened and then unscrewed ½ turn so it will have no play.
Slide the center pipe into the 1” nipple beneath the platform and up as far as
possible.
Line the mark on the flange in the same direction as the one on the 1” flange, and
thread eyebolts through the eyebolt holes in the ¾” flange. Align the J-box cover
plate with the holes in the flange. Thread the eyebolts through and finger-tighten
nuts on each.
After the glue dries, thread the top spring plate onto the center pipe.
Tighten the eyebolts that are extending up out of the 1” flange. They can be held
in place with a small screwdriver inserted into the eye of the bolt. Thread on and
tighten the locknuts. The ends of the eyebolts at the lower end of the spring piston
38
will be adjusted later to zero out the spring plate. The spring plate is now ready to
be clamped on the Workmate.
4.4 Spring Plate Analysis and Assessment
The purpose of the spring plate in the test stand is to measure how much energy is
transmitted from the falling impact piston to the helmet/head combination. In this
engineering challenge, students need to calculate the ratio of the energy absorbed by the
helmet/head to the kinetic energy that hits the helmet when it is struck by the impact
piston. If the spring plate is pre-tensioned to “tare” the weight of the spring piston and the
weight of the helmet and head, then the energy in, minus the change in the elastic
potential energy stored in the spring plate, equals the energy transmitted to the
head/helmet combination. When the students modify the foam inside the helmet, they
will select foam designs that will increase the work done on the foam by the kinetic
energy. The evidence for improved energy mitigation will be an increase in the relative
amount of energy absorbed by the head/helmet. The increase in the ratio of energy
transmitted to the helmet/head is attributed to the improved foam structure created by the
students. For the sake of simplicity, thermal energy losses resulting from the collision
will be ignored along with the lost sound energy. The formula for the energy transferred
to the helmet /head is as follows:
ΔUHELMET/HEAD= KEIN+ MASSIMPACT PISTON x gΔX
The change in x is measured by the sonic range finder focused on the plate on the bottom
of the spring piston. The change in the potential energy stored in the spring plate is found
using the formula below:
ΔΡΕ = ½ kx2
The variable k is the spring constant of the spring plate.

39
The method for determining the spring constant of the spring plate has gone through a
series of evaluations and redesigns. Initially, a Hooke’s Law approach was used. As
discussed previously, one of the “on the fly” modifications was to have the students
disassemble the spring plate and hang masses on individual springs to measure the force
verses the spring elongation. The slope of the graph of the force versus elongation is the
spring constant. Since the springs were attached to the spring plate in parallel, we simply
added the constants together to derive the overall spring constant. This gave us a number
to work with and we assumed it was good enough.
In the research for this report, the spring plate was evaluated again using a Hooke’s Law
method. This time, the spring plate was left in a completed condition, a series of barbell
weights were placed on the spring platform, and the displacement carefully measured.
This analysis revealed that the springs of the spring plate did not exhibit the classic
Hooke’s Law constant. The springs, in effect, softened as they stretched. This resulted in
a lower spring constant as more weight was added. This discovery, while inconvenient
for the purpose of finding the change in spring potential energy, was not a total surprise.
The research for this report revealed that most springs have bimodal stress to strain force-
elongation relationships. A study of the data from the test showed that the spring force to
elongation relationship became more linear for weights above 132N. This data is found in
Appendix A.
Testing of the original spring plate that the weights loaded the springs unevenly. This
caused listing of the spring plate when under a load. Due to the nature of the three-dowel
design of the original spring plate, balancing the springs is difficult. I decided to cease
testing the original system and, instead, construct a prototype of the redesigned spring
plate and then resume testing for the spring constant. The new spring plate design
positions the springs close to the sliding piston, and the 1” pipe sleeve prevents the spring
plate from listing. This creates a nearly uniform force exerted on each spring. With the
new spring plate in place, testing was again conducted using barbell weights. Again the
springs showed a very stiff initial response to load and a more linear force-elongation
relationship beyond 132 N. The test data is found in Appendix B.
Next, pre-tensioning of the springs was tried. The intent of pre-tensioning of the springs
was to stretch out the springs so that additional force would result in stretching the
40
springs more linearly. To pre-tension the springs, the spring eyebolts were tightened until
the bottom plate of the spring piston touched the bottom of the sleeve. Then each spring
was tightened further as the eyebolt nuts were tightened so that 0.5 cm of additional
eyebolt threads were exposed above each nut. Again, the barbell weights were used and
the elongation of the springs was measured. The results were encouraging and the almost
linear relationship allowed the calculation of a spring constant.
Armed with a workable, if not perfect, spring constant, the redesigned test stand was
assembled in a classroom using the suspended ceiling to support the piston guide and the
Black and Decker Workmate to support the spring plate. Using the LabQuest device and
LoggerPro program to collect and display the data collected by the sonic range finders,
several helmet impact tests were conducted to assess the quality of the test stands data.
During a review of graphs of the data, it was observed that there was a classic sine wave
showing the oscillation as the spring plate was dampening the energy from the collision
of the impact piston and the helmet. The period of this harmonic motion can be used to
calculate the spring constant. The period (T) of oscillation of a mass spring system is
mathematically described as follows:
√
This equation can be solved for the spring constant:
To calculate the spring constant in this manner required some additional modifications.
To use the formula above requires that the mass remain constant during the oscillations.
It was observed that the impact piston lifted off the helmet at the top of the first
oscillation. To correct this, Velcro was attached to the bottom of the impact piston and to
the top of the helmet. The chinstrap was tightened to prevent the helmet from lifting off
the head form and, finally, Velcro was placed between the head form and the spring plate
top plate to secure the head form to the plate. The average period of oscillation over the
multiple days and was .44 seconds. The total mass that is oscillating on the springs
includes the spring piston (1.3 kg), the helmet/head (4.45kg), and the impact piston
(3.9kg). Thus, the total mass is 9.65kg. Inserting this mass and the .44 second period into
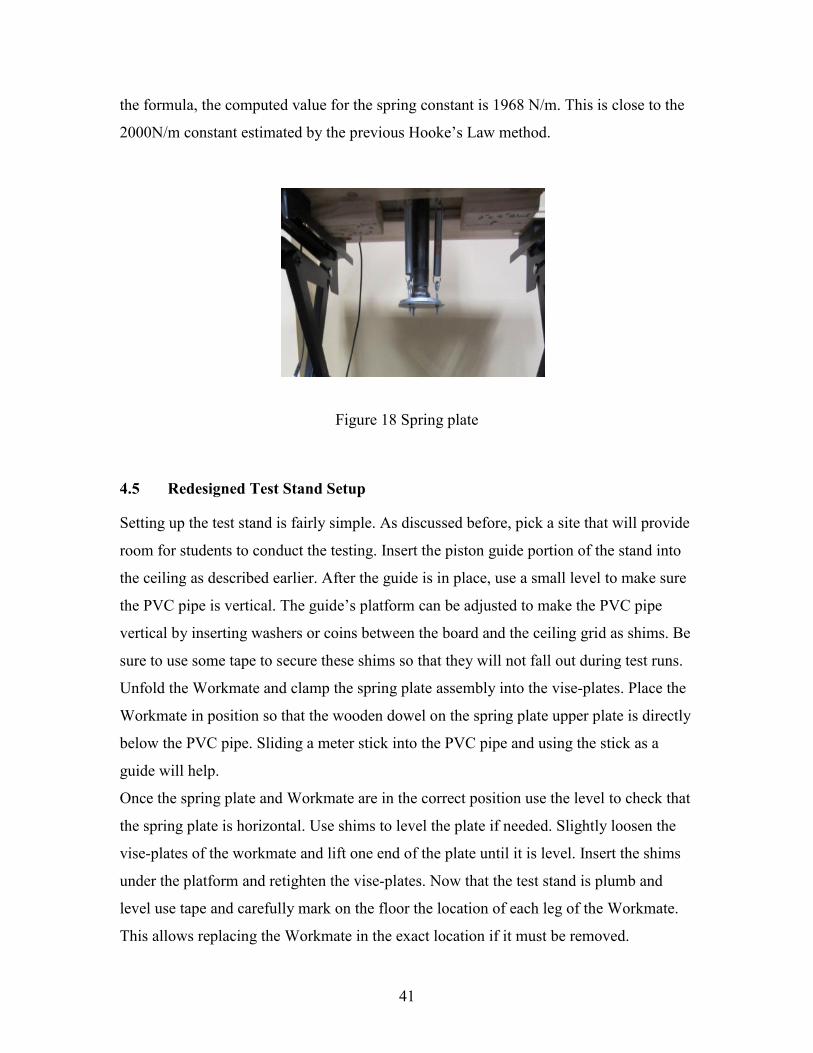
41
the formula, the computed value for the spring constant is 1968 N/m. This is close to the
2000N/m constant estimated by the previous Hooke’s Law method.
Figure 18 Spring plate
4.5 Redesigned Test Stand Setup
Setting up the test stand is fairly simple. As discussed before, pick a site that will provide
room for students to conduct the testing. Insert the piston guide portion of the stand into
the ceiling as described earlier. After the guide is in place, use a small level to make sure
the PVC pipe is vertical. The guide’s platform can be adjusted to make the PVC pipe
vertical by inserting washers or coins between the board and the ceiling grid as shims. Be
sure to use some tape to secure these shims so that they will not fall out during test runs.
Unfold the Workmate and clamp the spring plate assembly into the vise-plates. Place the
Workmate in position so that the wooden dowel on the spring plate upper plate is directly
below the PVC pipe. Sliding a meter stick into the PVC pipe and using the stick as a
guide will help.
Once the spring plate and Workmate are in the correct position use the level to check that
the spring plate is horizontal. Use shims to level the plate if needed. Slightly loosen the
vise-plates of the workmate and lift one end of the plate until it is level. Insert the shims
under the platform and retighten the vise-plates. Now that the test stand is plumb and
level use tape and carefully mark on the floor the location of each leg of the Workmate.
This allows replacing the Workmate in the exact location if it must be removed.

42
At this point, the spring plate spring pre-tension should be adjusted to zero the weight of
the helmet/head. To do this, first place the head form on the spring plate top plate. Place
the test helmet onto the head form. Using a small screwdriver inserted through the eye of
one of the eyebolts at the bottom of the spring piston, tighten the nut as far as the threads
on the eyebolt will allow. Repeat this on each of the springs. At this point, the spring
plate is supporting the helmet/head combination and the spring piston is pulled up by the
springs as far as it can go. Next, start loosening each eyebolt nut two turns at a time,
adjusting the spring tension a little at a time so each spring is tensioned the same. Loosen
the nuts on the three eyebolts until the spring piston starts to move downward under the
weight of the helmet/head. Adjust the nuts so that the piston just touches the bottom of
the guide sleeve and will start to move if any additional force is applied to the top of the
helmet. The spring plate is now zeroed. Attach the friction nuts and carefully snug them
up to the adjustment nuts so the spring eyebolts will not vibrate loose during testing.
Next, adjust the height of the PVC pipe guide. Loosen the hose clamps on the pipe braces
and slide the pipe so that it is 65cm above the upper end of the wooden dowel on the
spring plate, and retighten the clamps. Recheck to make certain the pipe is vertical. It is
important that the pipe is not too high because the impact piston can crack the outer shell
of the test helmet if it falls farther than the recommended distance.
Insert the impact piston into the piston guide. It may be necessary to move the lower part
of the stand to allow room for the piston. After inserting the impact piston, slide the lower
part of the test stand back into the position marked earlier.
4.6 Placement of Sonic Range Finders
The sonic range finders work by emitting brief spurts of sound energy. Ultrasonic waves
produced by the device travel out in a cone pattern and are reflected when they strike an
object. The sonic range finder measures the time between emission and return, and using
the speed of sound multiplied by the elapsed time, yields the distance the sound has
travelled. This relationship is illustrated by the equation below:
Half this distance is the distance to the object.

43
In this redesign, Vernier Motion Detector 2 model range finders were used. This model of
motion detector has an operational range between 15cm and 6m. The Motion Detector 2
has two levels of sensitivity, normal and track. The track setting is more sensitive and is
designed to measure the motion of low friction carts on a grooved track. This setting has
a very narrow emission pattern and has provided impressive data collection during the
helmet testing with the test stand. The devices are mounted so one is focused on the plate
of the tamper impact piston. This detector is attached to the piston guide and is pointed
downward. The second detector is attached to the lower crossmember of the Workmate
and is aimed upward and focused on the J-box cover plate on the bottom of the spring
The locations of each of these motion detectors allow the detectors to operate within their
optimal ranges, that is about 20 cm at the minimum distance and 90cm at the maximum
distance.
Figure 19 Stand and spring plate
Figure 20 Bottom mounted detector
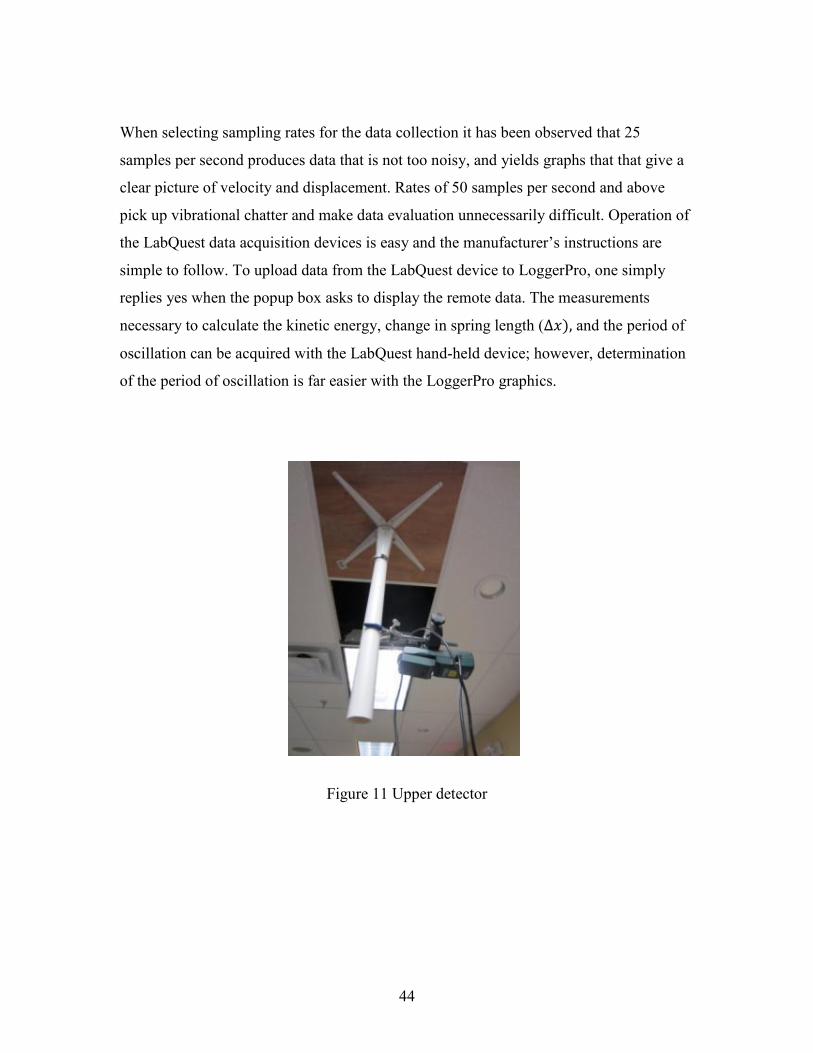
44
When selecting sampling rates for the data collection it has been observed that 25
samples per second produces data that is not too noisy, and yields graphs that that give a
clear picture of velocity and displacement. Rates of 50 samples per second and above
pick up vibrational chatter and make data evaluation unnecessarily difficult. Operation of
the LabQuest data acquisition devices is easy and the manufacturer’s instructions are
simple to follow. To upload data from the LabQuest device to LoggerPro, one simply
replies yes when the popup box asks to display the remote data. The measurements
necessary to calculate the kinetic energy, change in spring length ( and the period of
oscillation can be acquired with the LabQuest hand-held device; however, determination
of the period of oscillation is far easier with the LoggerPro graphics.
Figure 11 Upper detector

45
CHAPTER 5
USE OF THE REDESIGNED TEST STAND
The previous chapter described the redesigned test stand, giving details of its
construction. This chapter presents the use of the test stand. First, a sample protocol for
using the apparatus is presented. Next data collected using this protocol and the
redesigned test stand is presented. The data is then used to show the calculations students
will make to analyse and evaluate the test results.…
5.1 Protocol for testing with the Redesigned Test Stand
The purpose of the test stand redesign is to make data collection accurate and easy for the
students. It is important to review the functioning of the test stand with the students and
have them develop a testing protocol. Students may wish to identify roles and develop a
team strategy for conducting the tests. Below are some suggested items that students may
wish to include in a checklist as they develop their protocol.
Before starting a test check the following:
The helmet should be centered on the head form and the chinstrap should be
adjusted so there is a snug fit.
The motion detectors should be connected to the LabQuests and the sensors
properly aimed to record the movement of the impact piston and the spring piston.
Check that the LabQuests are turned on and are displaying the position readings
for both range finders.
Lift the impact piston by grasping the edge of the bottom plate and raising the
piston until it meets the bottom of the PVC pipe guide.
Check the position reading on the upper LabQuest to make certain that the
distance from the motion detector to the piston plate is at least 20cm.
Push the start data collection button on the LabQuest. Wait one second and
release the impact piston. The data will be recorded and displayed on the

46
LabQuest. This data can then be transferred to the LoggerPro program for
analysis.
Note that the Velcro on the bottom of the impact piston and the crown of the
helmet should stick together on every impact.
The table below contains data and graphs generated from a helmet impact test. . The
impact piston velocity is the column designated as v1 in the table. The maximum
displacement of the spring plate is found on the column labeled x2. The change in x is
found by calculating the initial position of the spring plate minus the maximum
displacement. Finally, using the crest points of the spring plate velocity line, Velocity 2
on the lower graph, during the dampening phase of the spring plate’s movement, one can
calculate the elapsed time between crests and, by averaging the periods, develop an
average oscillation period.
During this part of the project, the student design groups should gather the data necessary
to determine the spring constant (k) of the spring plate and to characterize the impact
performance of the stock helmet. Each group must test its helmet and establish the ratio
of energy absorbed by the helmet and head form to the energy delivered to the system by
the impact piston. Students must establish this benchmark before they modify the
helmet to allow pad testing!
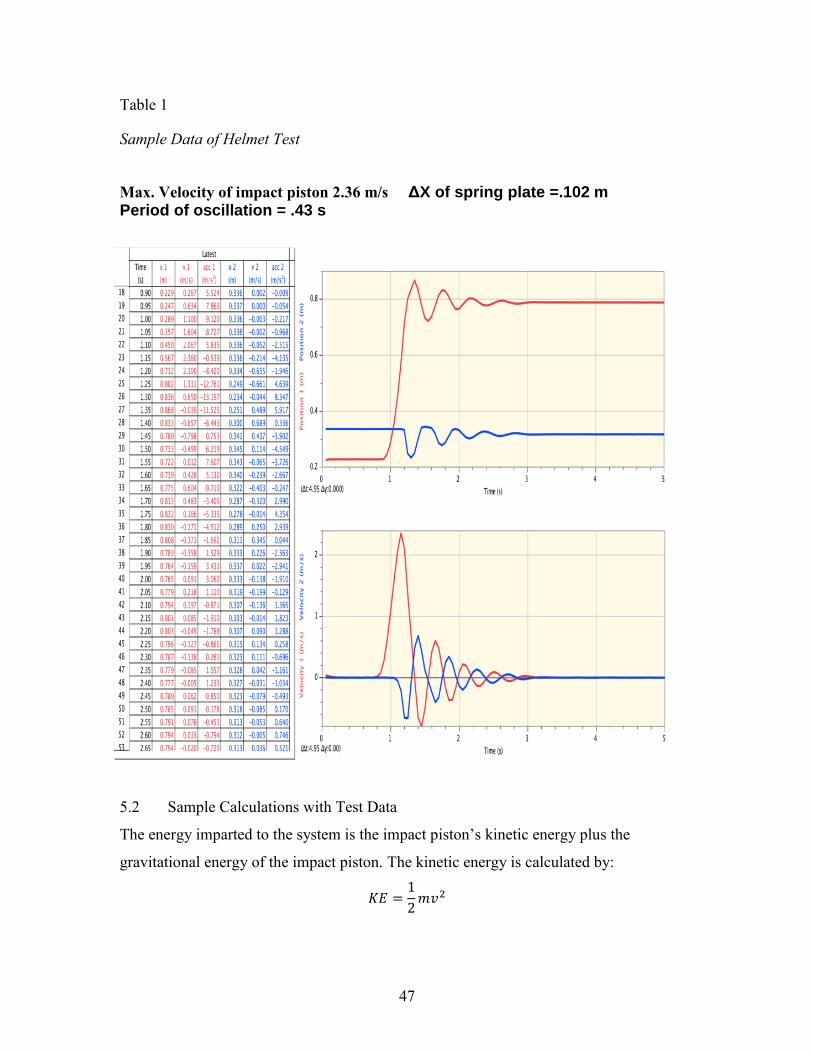
47
Table 1
Sample Data of Helmet Test
Max. Velocity of impact piston 2.36 m/s ΔX of spring plate =.102 m Period of oscillation = .43 s
5.2 Sample Calculations with Test Data
The energy imparted to the system is the impact piston’s kinetic energy plus the
gravitational energy of the impact piston. The kinetic energy is calculated by:
48
The mass of the impact piston is 3.9 kg, and velocity at impact is 2.26 m/s. Thus the
kinetic energy is:
KE = ½ (3.9kg)(2.26m/s)2 = 9.96 J
The potential energy is calculated by:
PEg =mgh
The change in height is:
| |
| |= .102m
Thus the potential energy is
PEg = (3.9kg)(9.81m/s2)(.102m) = 3.90
The total energy in is the sum of kinetic and potential energy:
Utotal = KE + PEg = 9.96 J + 3.90 J = 13.86 J
The elapsed times at which the crests of the oscillations of the spring plate occur are 2.7s,
2.26s, 1.85s and 1.41s. The average elapsed time between these cycles is .43s.
The period (T) is related to the mass-spring system by:
√
Solving this equation for the spring constant gives:
)(9.65 kg)/ (.43s)2
k = 2060 N/m
Once the spring constant (k) and the change in spring plate position are known, the
energy transferred to the spring plate as elastic potential energy (ΔPEe) can be calculated
using the formula:
ΔΡΕe = ½ kx2
ΔPEe=1/2(2060N/m)(.102m)2
ΔPEe= 10.72J
The energy transferred to the helmet and head form from the impact piston is found by
subtracting the change in the spring plate’s potential energy from the total energy put into
the system by the falling impact piston.
ΔUhead/helmet = Utotal - ΔΡEe
3.14J=13.86J- 10.72J

49
The ratio of the change in energy of the helmet/head to the kinetic energy into the system
is:
3.14J/9.96J = .315
This ratio indicates that the helmet/head absorbs 31.5% of the kinetic energy of the
impact between the impact piston and the helmet.In this redesigned activity, students will
seek to improve this ratio by 10%. This will be accomplished by replacing a portion of
the helmet’s foam liner with a student designed foam pad.
5.3 Description of Test Helmet
In the redesign of this project, the choice of the helmet to be used for student evaluation
and redesign was influenced by lessons learned in the implementation of the original
HDCP. The need for student connection to the helmet-type guided the selection of a
skateboard/ BMX helmet. These are the kind of helmets worn by X-Games contestants
and are familiar to most students. Most students, when asked, indicated they had been
required by their parents when they were younger to wear helmets while riding their
bicycles. Some lead-in questions could start with an informal survey of helmet use by the
students. Ask the students to state the reasons for making them wear helmets. Are those
reasons still valid? What injury was the helmet protecting them from? A discussion of the
foam they have removed from the helmet should reveal that the helmet does little to
cushion the impact. Instead it is meant to spread the force over a larger area. Question the
students about what they think could be done to improve the helmets performance. Have
them get in their design groups and brainstorm ideas that they enter into their engineering
notebooks.
When the teenager-sized helmet was placed on the head form, the helmet was too large
for an adequate fit. Since the redesign was predicated on using the existing head form, a
smaller child’s helmet was selected to assure a snug fit as called for by the helmet
manufacturer. Comparing the teen helmet to the child’s helmet revealed the construction
was identical and was simply scaled down for child-sized heads. The helmet selected is
intended for ages 5 and up. It has a tag on the inside that states it meets CPSC standards.
The Consumer Product Safety Commission standards are expansive but, in short, call for
helmets to withstand impacts from a 3.9 kg mass falling 60 cm. In addition, they call for
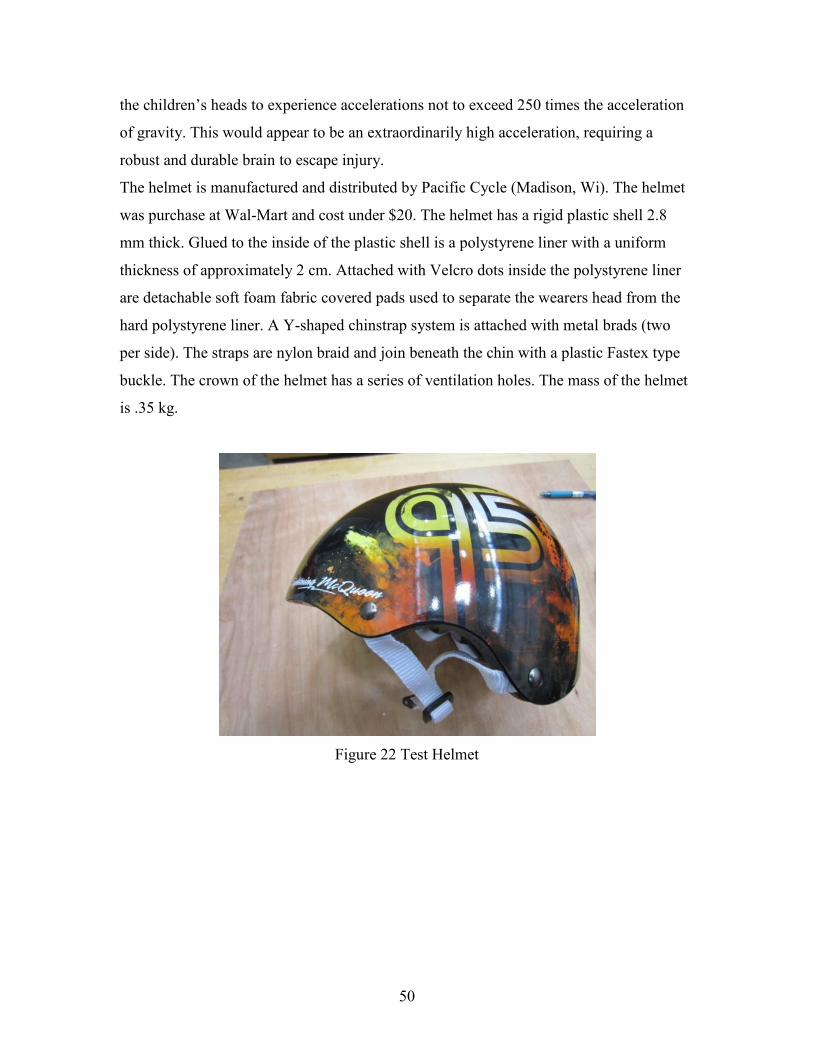
50
the children’s heads to experience accelerations not to exceed 250 times the acceleration
of gravity. This would appear to be an extraordinarily high acceleration, requiring a
robust and durable brain to escape injury.
The helmet is manufactured and distributed by Pacific Cycle (Madison, Wi). The helmet
was purchase at Wal-Mart and cost under $20. The helmet has a rigid plastic shell 2.8
mm thick. Glued to the inside of the plastic shell is a polystyrene liner with a uniform
thickness of approximately 2 cm. Attached with Velcro dots inside the polystyrene liner
are detachable soft foam fabric covered pads used to separate the wearers head from the
hard polystyrene liner. A Y-shaped chinstrap system is attached with metal brads (two
per side). The straps are nylon braid and join beneath the chin with a plastic Fastex type
buckle. The crown of the helmet has a series of ventilation holes. The mass of the helmet
is .35 kg.
Figure 22 Test Helmet

51
Figure 23 View of inside the helmet
Figure 24 Helmet Parts
5.3 Preparation of the Helmet Liner for Testing
The intent of the student engineering challenge is to develop an alternative inner foam
liner that will have improved impact attenuation. No modification of the helmet shell will
be allowed. In effect, this design constraint will have profound consequences for student
redesign strategy. By virtue of the shell size, the distance for foam compression is limited
to 2.5 cm. The amount of energy absorbed by the foam is equal to the work done on the
foam. The quantity of work is a function of the force needed to compress the foam pad

52
multiplied by the compression distance. The spring plate limits the amount of force that
can be used. If the force transmitted to the head is too large then the spring plate begins to
move instead of the foam being compressed. Students will experience first-hand that
engineering designs are almost always compromises made necessary by factors beyond
their control.
Removing the foam liner from the helmet shell requires some concerted effort. I have
done this several times and have found the easiest method is to use a small hand saw that
has a metal cutting saw blade. The helmets that have been disassembled have all had
small amounts of mastic securing the foam liner to the shell. The location of the glue has
varied with each helmet. In every case, however, there has been a small amount of mastic
in only two places and the procedure for getting the liner out is the same.
With the inside of the helmet facing upward, insert the saw blade between the shell and
the foam. Slide the saw blade around the helmet until a glue spot is encountered. Try to
saw into the glue. I have found that spraying some automotive starter fluid helps to soften
the glue without hurting the shell or the foam. Protect hands with rubber gloves. The
starter fluid should not be used near ignition sources. This operation should be performed
under a vent hood to control the volatile fumes. Continue the sawing until the glule is
separated from the foam. Repeat this on the other side. Once the glue spots have been
severed, the liner should just lift out.
Figure 25 Using a template to mark the test site
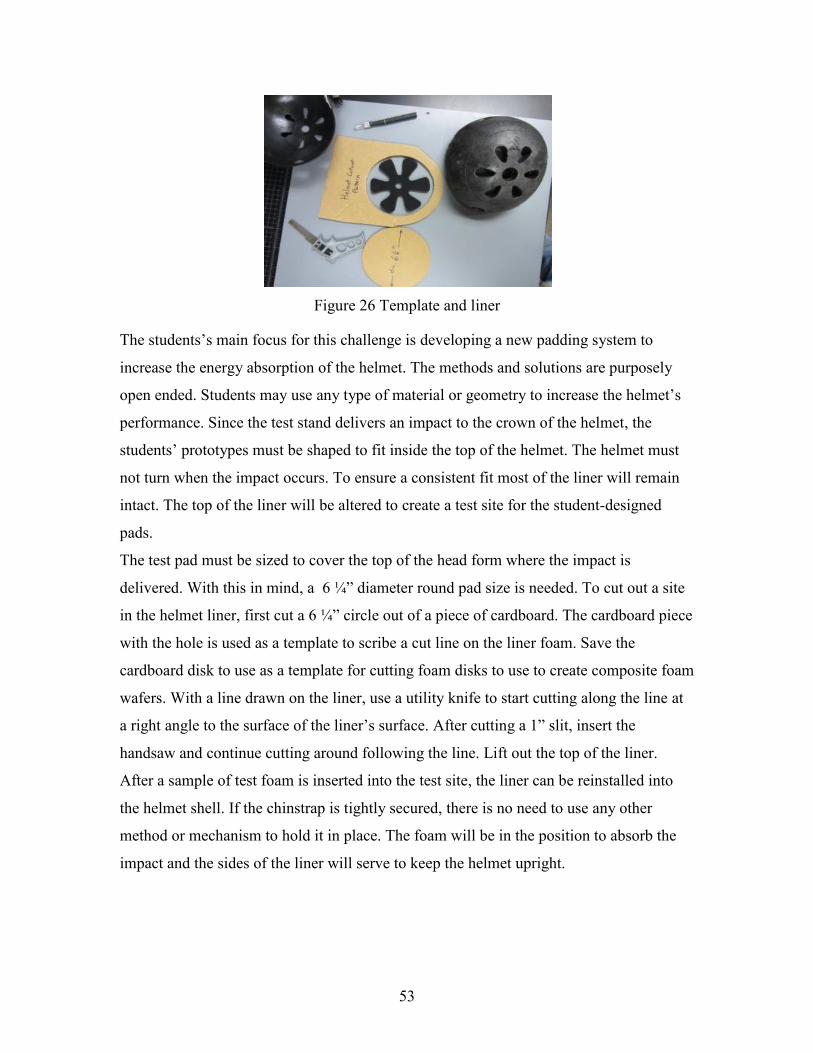
53
Figure 26 Template and liner
The students’s main focus for this challenge is developing a new padding system to
increase the energy absorption of the helmet. The methods and solutions are purposely
open ended. Students may use any type of material or geometry to increase the helmet’s
performance. Since the test stand delivers an impact to the crown of the helmet, the
students’ prototypes must be shaped to fit inside the top of the helmet. The helmet must
not turn when the impact occurs. To ensure a consistent fit most of the liner will remain
intact. The top of the liner will be altered to create a test site for the student-designed
pads.
The test pad must be sized to cover the top of the head form where the impact is
delivered. With this in mind, a 6 ¼” diameter round pad size is needed. To cut out a site
in the helmet liner, first cut a 6 ¼” circle out of a piece of cardboard. The cardboard piece
with the hole is used as a template to scribe a cut line on the liner foam. Save the
cardboard disk to use as a template for cutting foam disks to use to create composite foam
wafers. With a line drawn on the liner, use a utility knife to start cutting along the line at
a right angle to the surface of the liner’s surface. After cutting a 1” slit, insert the
handsaw and continue cutting around following the line. Lift out the top of the liner.
After a sample of test foam is inserted into the test site, the liner can be reinstalled into
the helmet shell. If the chinstrap is tightly secured, there is no need to use any other
method or mechanism to hold it in place. The foam will be in the position to absorb the
impact and the sides of the liner will serve to keep the helmet upright.

54
5.4 Preparation of Foam Samples
Cutting foam samples is much simpler with a foam cutting hot knife. These are easy to
build and may make a good project for students. Step by step instructions can be found at
http://www.fastelectrics.net/hwc.php. Below is a picture of a cutter built from these
instructions. The Ni-Chrome wire is salvaged from the heating element found in a hair
dryer. The pad is used to clean the wire as soon as one finishes cutting a sample. Foam
cutting is best done under a vent hood so that one does not inhale the fumes caused by the
hot knife.
A template should be used to cut uniform foam samples. In the next photograph, a sample
is being cut using the cardboard cutout from the helmet-cutting template. A wood screw
is screwed through the cardboard into the foam to hold it in place and then the foam is
simply rolled through the hot wire. Wear leather gloves (not shown in figure 28) to
prevent accidental burns.
Figure 27 Hot wire cutter
Foam can also be cut using a sharp utility knife or even scissors. The key is to create
uniform samples that can be tested using the methods discussed below. The purpose of
foam testing is to compare the expected performance of the foam so that students can use
this information to make design decisions.
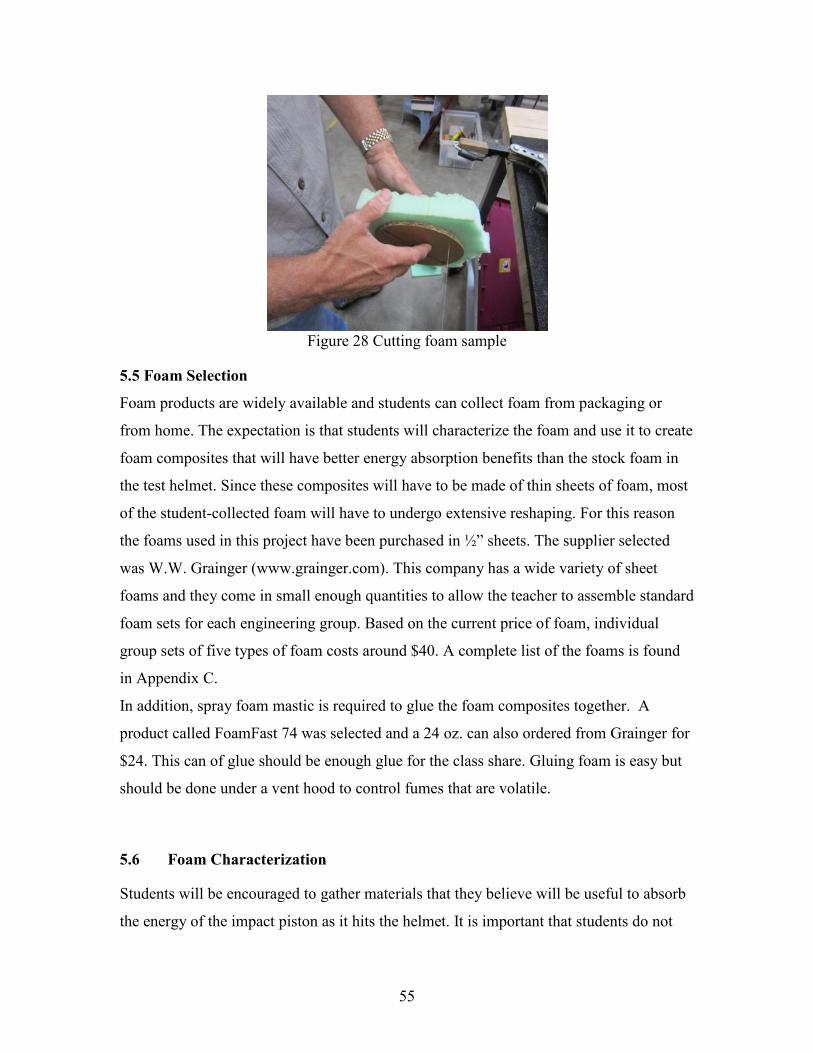
55
Figure 28 Cutting foam sample
5.5 Foam Selection
Foam products are widely available and students can collect foam from packaging or
from home. The expectation is that students will characterize the foam and use it to create
foam composites that will have better energy absorption benefits than the stock foam in
the test helmet. Since these composites will have to be made of thin sheets of foam, most
of the student-collected foam will have to undergo extensive reshaping. For this reason
the foams used in this project have been purchased in ½” sheets. The supplier selected
was W.W. Grainger (www.grainger.com). This company has a wide variety of sheet
foams and they come in small enough quantities to allow the teacher to assemble standard
foam sets for each engineering group. Based on the current price of foam, individual
group sets of five types of foam costs around $40. A complete list of the foams is found
in Appendix C.
In addition, spray foam mastic is required to glue the foam composites together. A
product called FoamFast 74 was selected and a 24 oz. can also ordered from Grainger for
$24. This can of glue should be enough glue for the class share. Gluing foam is easy but
should be done under a vent hood to control fumes that are volatile.
5.6 Foam Characterization
Students will be encouraged to gather materials that they believe will be useful to absorb
the energy of the impact piston as it hits the helmet. It is important that students do not
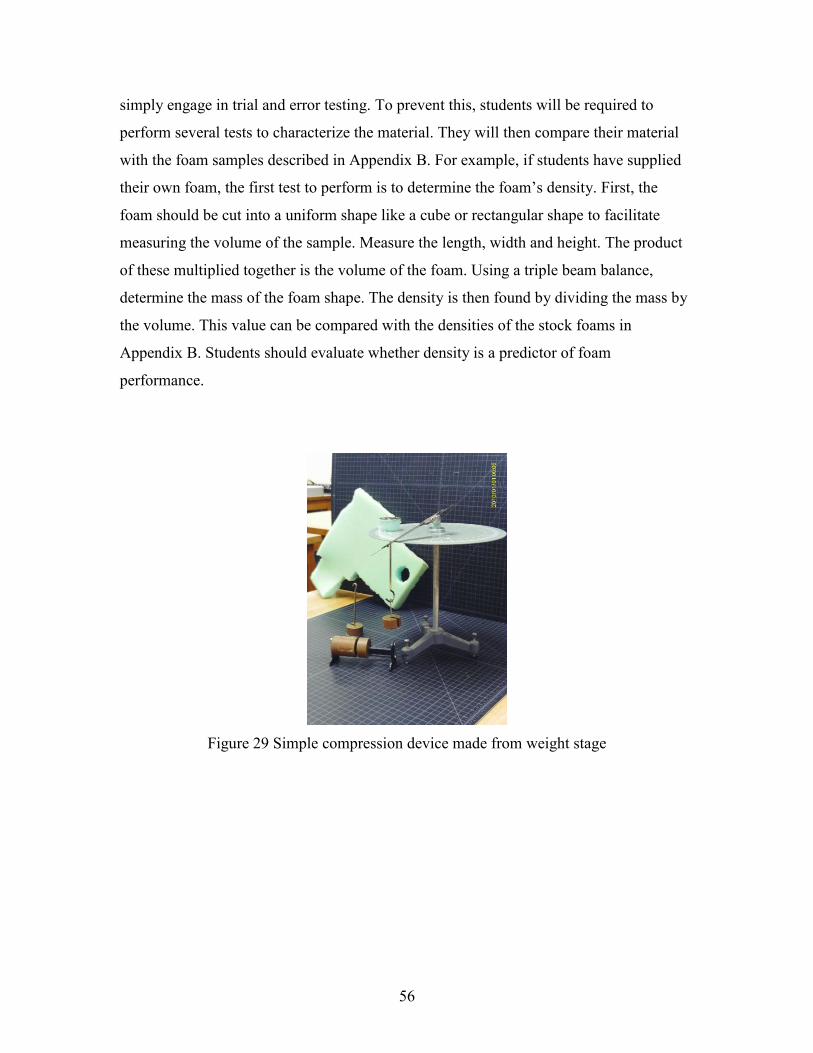
56
simply engage in trial and error testing. To prevent this, students will be required to
perform several tests to characterize the material. They will then compare their material
with the foam samples described in Appendix B. For example, if students have supplied
their own foam, the first test to perform is to determine the foam’s density. First, the
foam should be cut into a uniform shape like a cube or rectangular shape to facilitate
measuring the volume of the sample. Measure the length, width and height. The product
of these multiplied together is the volume of the foam. Using a triple beam balance,
determine the mass of the foam shape. The density is then found by dividing the mass by
the volume. This value can be compared with the densities of the stock foams in
Appendix B. Students should evaluate whether density is a predictor of foam
performance.
Figure 29 Simple compression device made from weight stage

57
Figure 30 Compression device with hook removed
The second test conducted on the foam is to determine the ratio of force to
displacement. The reaction of the foam to force (weight) is to compress (displace) and is
clearly an indicator of foam’s performance. This is much like the spring constant of a
spring being used to measure weight in a spring balance. To measure this, a simple foam
compression device can be created (figure 29). Using a 50g weight stage and a flat plate
as a base, a test platform can be set up and a Vermeer caliper used to measure the
compression. In figure 30, the weight stage is shown with the hooked-end removed and
the shank of the weight stage threaded to accept a 1/8’ nut. A hook was then made from a
large picture hanger wall hook. This allows the weight stage to be threaded through the
foam sample to be tested and then the wall hook to be attached so masses can be hung
from the inverted weight stage. Note that the shank passes through a hole in the table.
This was necessary because some foam requires quite a bit of force and the original
support stand was not robust enough. Suspended above the weight stage on top of the test
foam is a displacement indicator gauge. The one pictured is a digital model and costs
about $29 at Harbor Freight (www.HarborFreight.com). An analog version of this gauge
is $15. One can carefully measure using a ruler, but these gauges allow measurements
accurate to hundredths of a millimeter. The foam’s compression as a change in height is
measured as more mass is added to the weight stage. The masses are then converted into
Newtons and the weight versus the change in height is plotted. The slope of this graph is

58
the “spring constant” of the foam. The area under this graph is the amount of work done
on the foam as it is crushed. This part of the graph data will be helpful to students as they
predict their foam composites’ performance.
Figure 31 Force versus compression plot
An example plot is shown in Figure 31. This was very soft foam. The foam’s response to
the load was briefly linear as the force stretches the cell-like structure of the foam. At
approximately 30N the cell walls begin to collapse. The flattening of force needed to
compress the foam shows that energy is converted to work on the foam structure without
the exertion of much additional force. This is referred to as a force plateau. This is a
desirable state for the absorption of energy by the foam in a helmet. The foam is
absorbing impact energy without transmitting greater force to the head of the helmet
wearer. At around 45N the foam has collapsed into an ever more dense state. At this point
the force transmitted to the head increases rapidly until the foam “bottoms out”. The
result of this is a sharp spike in the acceleration of the head.
The ideal foam pad design is for part of the foam composite to quickly reach a force
plateau and then design the second foam type in the composite to reach its force plateau
as the first foam becomes dense and the transmitted force starts to climb. If the foam
composite is constructed with several layers each, will take its turn in this process. In the
0
10
20
30
40
50
60
0 0.002 0.004 0.006 0.008
Weight (N)
Elongation (m)
Foam 5GCG3
Weight (N)

59
end, the composite will cause the impact energy to impart more of the work on the foam
while transmitting the lowest force to the head form.
The sample foams in the pictures below were all tested and the results are shown in
Appendix B.
Care must be taken to cut the foam so that it fits under the base of the inverted weight
stage. Several samples are shown in Figure 32 below. Each type of foam samples cut to
produce two samples of different sizes. The weight stage was used as a template to cut
circular samples exactly the diameter of the weight stage. The second set of samples was
made using a 3” diameter cardboard disk as a template. The sample on the left is made
from the foam shell of the stock helmet.
Figure 32 Foam samples

60
Another common measurement of foam performance is the resistance of the foam at the
point where it has been compressed so that its thickness has been reduced by 25%. This is
known as “Firmness at 25% Deflection” and is measured in pounds per square inch. To
make this measurement, a device was created to compress the foam using a hydraulic
jack that was fitted with a pressure gauge. The foam sample heights were measured
before they were placed between two metal plates. The hydraulic jack was then used to
compress the foam to 75% of its original height. Upon reaching the 25% deflection point
the jack pressure was allowed to come to equilibrium and the firmness value recorded in
psi. With this value the students can calculate how much force will be exerted on the
head form when the foam is 25% compressed. The pressure divided by the foam’s
surface area equals the force. Firmness data is included in the descriptions of the test
foams found in Appendix B.
It is important to note that the tests described above can be conducted by some of the
team members while others use the test stand. This, along with construction of the foam
pads, will provide roles for each team to assign to individual members and should keep
all the students engaged in some meaningful part of the design process. Having the
students record and reflect on their activities daily will provide the teacher with a method
to assess individual participation.

61
Figure 33 Deflection device
When the stock helmet foam was tested for firmness at 25% deflection, it yielded an
impressive 450psi. This is fifty times greater than the firmest foam in the test group.
5.7 Learning Module Structure
Part of the student preparation for designing helmet padding is the characterization of the
foam. A force (weight) versus compression graph of a sample of polyethylene foam
purchased from a local hobby store is shown in the figure below. This is an example of
the kind of data and modeling that the students should generate and use to make design
choices. This type of information should be gathered by the students for each kind of
foam they wish to consider for their composite pad design. The student design team
should add masses to the foam compression device until the foam bottoms out. This is the
point were the foam cells have collapsed, and adding additional mass does not result in
additional compression. After graphing weight versus compression, the team will analyze
the curve to determine the range in which the foam will collapse without a significant
increase in force. Looking at the foam performance data from each of the foam types
accounting for the distance constraint imposed by the space between the helmet shell and
the head form, the design team will select the types of foam for their composite foam pad

62
design. The students should be reminded that increasing the kinetic energy from the
impact piston that is used to do work collapsing the foam pad will reduce the energy that
will be transmitted to the head, and ultimately to the spring plate. In addition, it should be
emphasized that work is the product of force exerted on the foam multiplied by the
distance the foam is compressed.
Once the design team has developed a rationale for their design and written this rationale
into their engineering notebooks, they should start constructing a prototype for testing.
They should follow the foam preparation techniques outlined above. Once they have a
design prototype, the composite’s performance should be evaluated in the context of the
helmet’s ability to absorb the impact energy as measured by the ratio of the energy
absorbed by the helmet/head to the energy put into the system by the impact piston. A
10% increase in this ratio compared to the ratio of the stock helmet indicates a successful
design.
The figures below present data from two test runs. Figure 33 shows the force versus
displacement relationship of a particular foam material. Figure 34 shows velocity data
from the two tests. The velocity of the stock helmet is the red graph, while the black
graph shows the velocity of the modified helmet. The dark blue graph displays the
velocity of the spring plate during the impact sequence on the stock helmet. The light
blue graph is the spring plate velocity for the modified helmet. The position that the
piston strikes the helmet is the same in both cases. Note that the stock helmet produces a
sharp change in the velocity. This indicates that there was no detectable compression of
its foam. The modified helmet shows a period of deceleration and then an abrupt change
in velocity. This indicates that initially the foam was compressing due to work done by
the impact piston. In a classic example of Newton’s Third Law, when the piston pushes
on the foam, the foam pushes back on the piston. This reduces the net downward force on
the piston and slows the acceleration of the piston. The foam quickly collapses because of
its soft structure and, at the point it becomes fully compressed, the force exerted by the
piston is transmitted directly to the head form and rapid deceleration of the piston
follows. This, in turn, results in rapid acceleration of the head. These two situations
illustrate the two extremes that the student design teams want to address in the evaluation
of their pad designs. The pad they design must be soft enough to slow the impact, but

63
stiff enough to mitigate the effects of the pad bottoming out. Samples of Data from
composite foam tests are included in Appendix D

64
Compression (m) Weight (N)
0 0
0.0013 1.47
0.0022 2.45
0.0035 2.94
0.0048 3.48
0.007 3.92
0.0113 4.91
0.01335 5.4
0.01525 6.38
0.0168 8.34
0.0177 10.3
0.0182 11.28
0.01851 12.26
0.01883 14.22
0.01919 16.19
0.0193 17.17
0.01946 18.15
0.0197 20.11
0.01991 23.05
Figure 34 Force vs Displacement
0
5
10
15
20
25
0 0.005 0.01 0.015 0.02 0.025
Weight (N)
Compression (m)
Polyethylene Foam From Hobby Lobby

65
Figure 35 Comparison of soft pad to stock helmet padding
5.8 Lesson Sequence Road Map
This chapter described a sequence of specific activities that the students will perform
using the redesigned test stand described in chapter 4 and other test equipment developed
as part of this project. An overview of the entire design challenge is given below:
1. The redesigned HDCP starts the students exploring the subject of sports helmet
technology. They give a short oral report to the class. Design teams are assigned
66
different sports that require helmets and asked to inform the group about the state-
of-the-art for this kind of helmet.
2. Next students aregiven the skateboard helmet and asked to interview individuals
that might use or buy a similar helmet. This leads to a customer needs analysis.
3. The design challenge is presented to the studentsand the measures of success are
discussed. The general scientific principles are discussed. The data and
calculations to be performed areexplained and students participate in guided
practice.
4. The students are trained on the devices used to characterize foam and given
guided practice. Students are shown how to use this information to make design
decisions.
5. The test stand protocols and use are displayed and students are given guided
practice in the methods of data collection and evaluation.
6. Students perform benchmark testing of the stock helmet.
7. Design teams characterize foam and brainstorming design solutions.
8. Design teams develop designs for proto-type testing.
9. Students construct and test pad designs. A cycle of iterative concept generation,
prototyping, and testing follows as the design teams perfect their design.
10. Each design team performs a final demonstration test and delivers a group
presentation.
11. Each group submits a final report that includes relevant data and conclusions
based on testing.

67
CHAPTER 6
SUMMARY AND CONCLUSIONS
The Helmet Design Capstone Project used as a culminating activity of the inaugural year
of the Engineering Design class failed to produce the desired learning objectives. The
issues that led to that failure and the subsequent removal of the project from the year two
curriculum were discussed. The author believes that the HDCP can be successfully
implemented if modifications are made to the project. The post mortem of the first year
revealed that the problems with this module fell into two broad categories. The first were
problems surrounding the test stand’s construction and use. The second category of issues
resulted from the use of construction helmets as the objects of test and redesign by the
students. The redesign of this module focused on modifications to the test stand and to
developing a more engaging redesign opportunity for the students using.
6.1 Test Stand
The construction of the original test stand required two Saturdays to assemble by the pilot
teachers. This was in addition to many hours of pre-assembly cutting and pre-gluing of
subassemblies by the UTeachEngineering staff. In the redesigned version most parts can
be purchased from local home improvement stores and require no preassembly by staff.
The assembly is appropriate for a ”Make and Take” afternoon session in conjunction with
teacher curriculum familiarization training. This results from elimination of the failure
test stand and dividing the working test stand into three parts. The top piston guide is
designed to fit into an existing ceiling grid. It consists of seven parts and requires no
special skill to build. The original spring plate required pre-gluing, cutting, and drilling of
several parts. The new design is built from off-the-shelf metal pipe components. The
spring plate in the new design is clamped into a Black and Decker WorkMate bench. This
allows all assembly and spring plate adjustments to be completed at the workbench rather
than on the floor under the test stand as the original required. The assembly of the
WorkMate, which folds up for storage, is simple and requires about twenty minutes. The
fact that the stand is divided into three subassemblies allows it to be transported in a
compact car rather than the full sized pickup truck needed to carry the original stand. The
68
construction of the impact piston has been eliminated by the substitution of an off-the-
shelf soil tamper. This also solved the durability issue of the original.
Data collection using the test stand has been modified to eliminate the use of the National
Instruments myDAQ interface by replacing it with sonic motion sensors and Lab Quest
laboratory data systems. This makes collection of data simple, accurate, and fast. The
ease and speed of this system will decrease the time students have to wait to use the
stand. This will not completely eliminate bottlenecks but should improve the situation
greatly. The ease of construction and storability of the new stand may allow teachers to
acquire more than one stand.
6.2 Helmet Comparison
A skateboard helmet was substituted for the original construction helmet for two reasons.
The first is that most students have worn or are now using helmets similar to the type
suggested for testing. The process of assessing customer needs is far easier because
students can survey their peers and parents. Researching state-of-the-art helmet designs
will help students understand the functionality and limitations of the helmets they see and
wear. It is hoped that this improved awareness will stimulate increased helmet use by the
students.
The second reason to use this type of helmet is that the foam material used to absorb
impact energy in this helmet is far easier to modify than the plastic straps of the
construction helmet’s suspension. Foam is widely available and inexpensive. The ease
with which it can be shaped and layered allows students to design creative alternative
solutions to the engineering challenge. In addition the simple devices used to characterize
foam that are described in this report provide multiple activities that will aid in keeping
more students actively engaged in hands on activities. The instrumentation used in this
module provides meaningful data and graphs that students can use to make informed
design decisions.

69
6.3 Future Study
The redesign of the HDCP addresses the needs of the teachers and students that were not
met in the original design. The next step is to try it first on teachers and then on students.
This redesign is not meant to stand by itself. It will be inserted into the original
curriculum module to modify rather than replace it. To make this insertion seamless some
of the lesson plans contained in the original module will require changes.
Testing the effectiveness of the redesign will require students actually doing the project
in my classroom. I am confident that the changes that have been made will work but
know from experience that there will be unexpected challenges and discoveries. It is my
hope that I can conduct this activity in my classroom in the future.
6.4 Application to Practice
During the process of creating this project redesign, there have been a number of “Ah
Ha” moments. These new understandings of what it is to be an engineer has come from a
variety of sources and events. In every case, however, they have been the result of
implementing the same design process that I have been teaching to my students.
Work on the prototypes and testing instrumentation was performed at the J.J. Pickle
Research Center. While working at the center, I had the opportunity to witness engineers
doing what engineers do. I was struck by the steady, studied and tireless way these
engineers crafted their projects. It was evident in the impromptu brainstorming sessions,
where the merits of each idea and suggestion were openly discussed, that this was a team
effort. In the end, a decision was made and the team continued work toward a common
goal. When I address the need for improved collaborative effort from my students during
a student design challenge, I will now be armed with observations of its importance in the
real world.
I find, upon reflection, that the coursework that I thought was designed to stimulate my
thinking was also designed to teach a studied approach to solving problems. Without
being aware of the change, I find that I no longer make decisions without examining the
facts and questioning what I think I know in light of what the facts indicate. During this
project, for instance, I thought I knew that all springs have to have a spring constant. In
testing the spring plate to ascertain its constant, I discovered the data did not fit my

70
preconceived knowledge. In the past, I would have looked for errors and not for a new
understanding. In my classroom, I can tell students that they may find things that change
what they think they know. I can urge them to celebrate the surprises rather than suppress
the unusual because it challenges your current understanding.
The scope and multifaceted challenges with which I have dealt while working on this
project and this report forced me to document everything. There was just too much
information and too many ideas to remember. My brain would work out the details even
as I slept. I often would awaken in the night with a possible answer or avenue of study to
try conjured by my subconscious engineering self. I developed the habit of keeping a
notepad by my bed and would immediately write out or sketch each new insight.
I discussed my ideas with anyone who would listen, finding that presenting my ideas
helped define and refine my emerging understanding. In some cases, the person I talked
with presented facts I never considered and flaws in my model were revealed.
Maintaining an engineering notebook, in which I wrote everything I did and thought
along with the things to consider another time, allowed me to switch from one aspect of
my research to another and still always know where I left off.
My experience with data collection in the high school classroom left me with the feeling
that if it was bad data, at least the students learned that bad data has consequences. In this
project, the critical nature of reliable data became real for me. I realized if my data is
faulty, I have nothing upon which to base the science of the project. This fear of failure
had the effect of making the collection of measurements a rigorous and careful endeavor.
The design process has become a familiar mantra for me during the last two years of
teaching the Engineering Design and Problem Solving class to students. In a reversal of
the hated saying “Those that can’t do teach,” I, who teach, was forced ‘to do’. I can truly
say that the engineering design method was easy to use because it is a practical way to
bring order out of chaos.
I started by defining the problem. The original helmet design module did not work. It was
hard on the teacher and did not engage the students. I evaluated the hardware issues and
asked the students what they thought of the activity. I even interviewed three teens I saw
riding bicycles with skateboard type helmets. Along with listening to the customers, I
asked myself as a teacher how much time and effort would I be willing to invest to

71
implement this module in my classroom. This process evolved into the goals I had for the
project.
I evaluated and decided what I wanted the test stand to do and what the students would
do. This meant that there was a mechanical part to the project and a lesson plan
pedagogy portion. A series of testing devices were designed, built and tested. The stand
went through several iterations, each with tests and redesigns. As soon as the test stand
met the criteria I had developed in the goal setting, the student activities portion was
designed and tested. The student engineering challenge was purposely left open to real
time modification. From years of experience teaching lab based activities, I have
observed that if I let the students create the ways to accomplish a challenging goal, they
are more engaged in the endeavor. The ‘more than one right answer is possible’ approach
is one of the strengths of the student part of this activity. That said, if I had the time, I
would have liked to first test this activity out on my fellow teachers and then on a small
group of students.
It is my hope that I will be able to try this module out in my engineering class. I would
not recommend this as a twelve-week capstone project. In reality, I do not believe, based
on my research, that a twelve-week stand-alone project for high school seniors is doable
or appropriate. This project would be better if it is infused into the curriculum as a
platform to teach data acquisition and design by evaluation through the lens of materials
science.
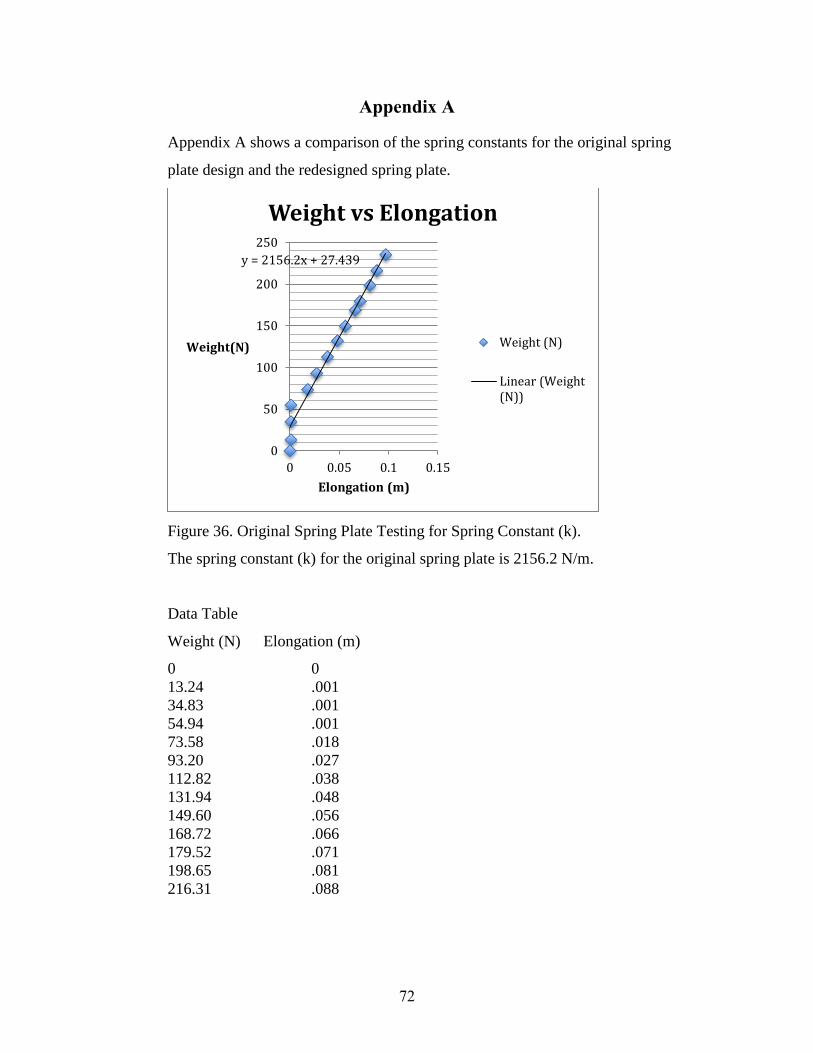
72
Appendix A
Appendix A shows a comparison of the spring constants for the original spring
plate design and the redesigned spring plate.
Figure 36. Original Spring Plate Testing for Spring Constant (k).
The spring constant (k) for the original spring plate is 2156.2 N/m.
Data Table
Weight (N) Elongation (m)
0 0
13.24 .001
34.83 .001
54.94 .001
73.58 .018
93.20 .027
112.82 .038
131.94 .048
149.60 .056
168.72 .066
179.52 .071
198.65 .081
216.31 .088
y = 2156.2x + 27.439
0
50
100
150
200
250
0 0.05 0.1 0.15
Weight(N)
Elongation (m)
Weight vs Elongation
Weight (N)
Linear (Weight(N))
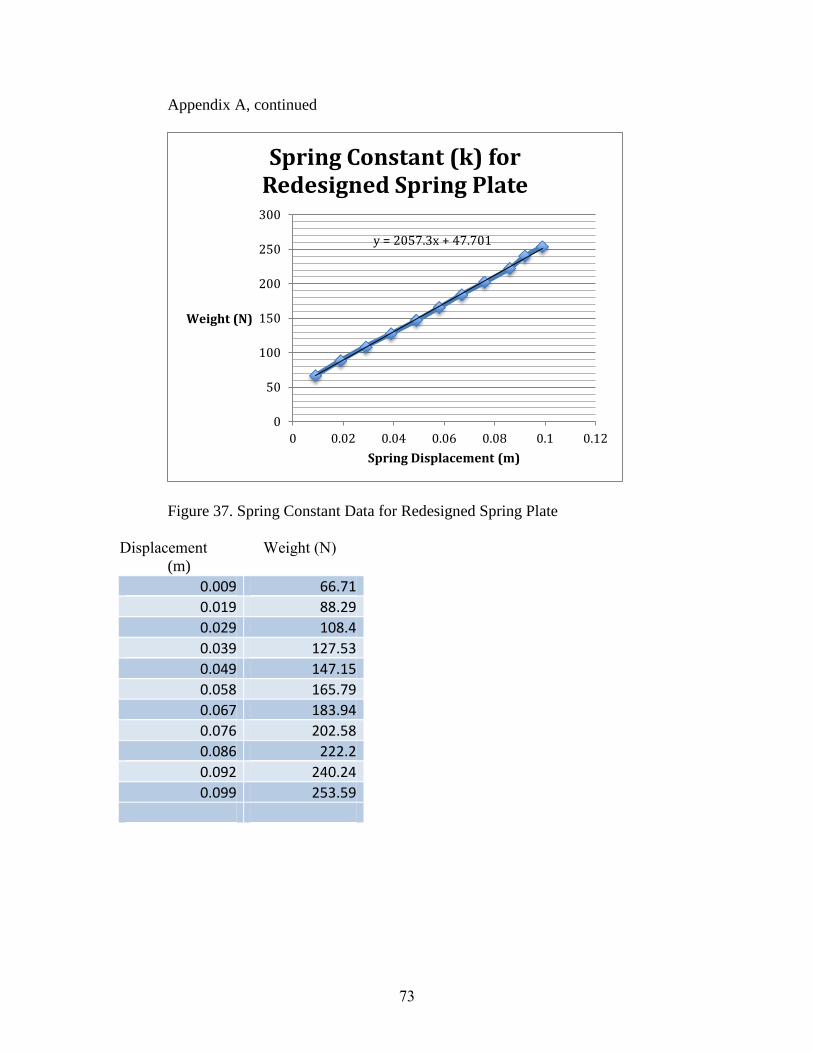
73
Appendix A, continued
Figure 37. Spring Constant Data for Redesigned Spring Plate
Displacement Weight (N)
(m)
0.009 66.71
0.019 88.29
0.029 108.4
0.039 127.53
0.049 147.15
0.058 165.79
0.067 183.94
0.076 202.58
0.086 222.2
0.092 240.24
0.099 253.59
y = 2057.3x + 47.701
0
50
100
150
200
250
300
0 0.02 0.04 0.06 0.08 0.1 0.12
Weight (N)
Spring Displacement (m)
Spring Constant (k) for Redesigned Spring Plate

74
Appendix B
This appendix contains Force vs. Compression evaluations of test foams acquired
as part of this project.
Weight (N) Compression (m)
0 1.48
0.00003 2.45
0.00004 3.43
0.00007 5.4
0.0001 6.38
0.00014 8.34
0.00017 10.3
0.00019 13.24
0.00024 16.19
0.00026 18.15
0.00028 20.11
0.00036 22.56
0.0004 24.53
0.00045 26.49
0.00097 31.39
0.00391 34.83
0.00601 40.22
0.00679 44.15
0.00717 48.07
0.00739 50.03
0
10
20
30
40
50
60
0 0.002 0.004 0.006 0.008
Weight (N)
Compression (m)
Foam 5GCG3
Weight (N)
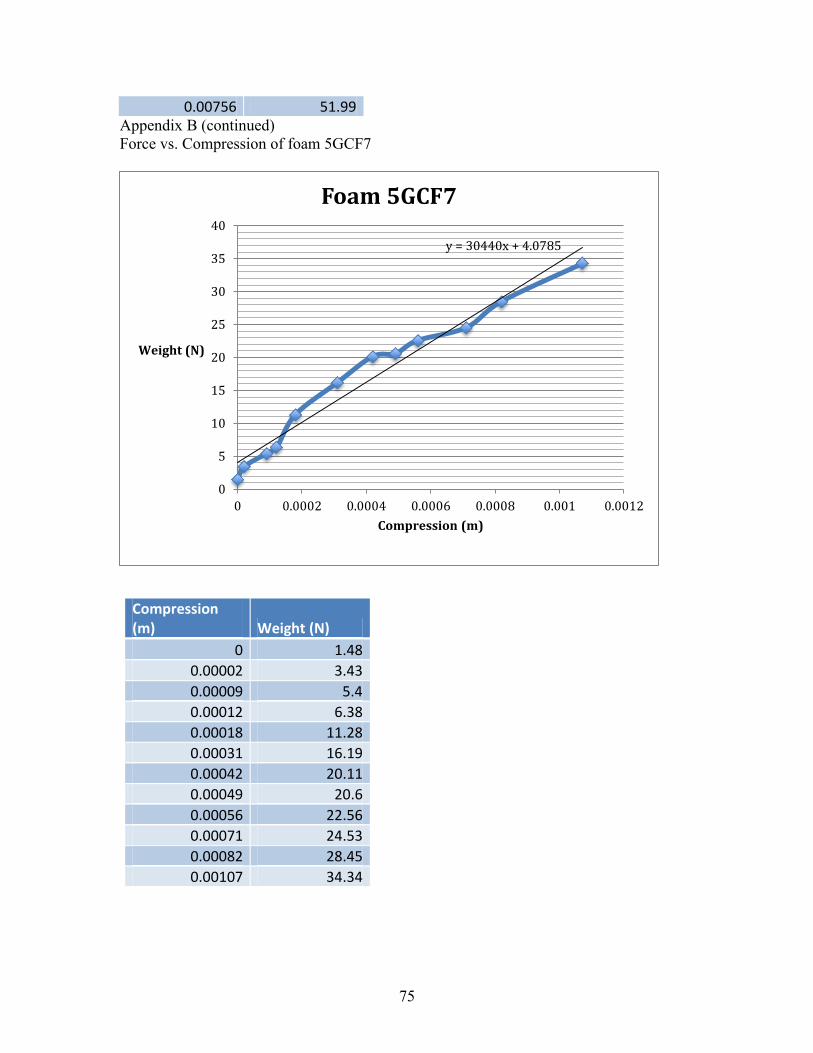
75
0.00756 51.99 Appendix B (continued)
Force vs. Compression of foam 5GCF7
y = 30440x + 4.0785
0
5
10
15
20
25
30
35
40
0 0.0002 0.0004 0.0006 0.0008 0.001 0.0012
Weight (N)
Compression (m)
Foam 5GCF7
Compression (m) Weight (N)
0 1.48
0.00002 3.43
0.00009 5.4
0.00012 6.38
0.00018 11.28
0.00031 16.19
0.00042 20.11
0.00049 20.6
0.00056 22.56
0.00071 24.53
0.00082 28.45
0.00107 34.34

76
Appendix B
Foam Test Force vs. Compression of 5GCF4
y = 17638x + 3.8606
0
10
20
30
40
0 5 10 15 20
Weight (N)
Compression(m)
Foam 5GCF4
Compression (m) Weight (N)
0.00006 1.96
0.00012 3.92
0.00018 5.89
0.00024 7.85
0.00031 9.81
0.00056 14.72
0.00066 16.67
0.00076 18.64
0.00082 19.62
0.00093 21.58
0.00104 23.54
0.00116 25.51
0.00124 26.49
0.00136 28.45
0.00151 30.41
0.00165 33.35
0.00188 36.3
0.00204 38.26
0.00218 40.22

77
Appendix B Force Vs. Compression
Compression (m) Weight (N)
0.00011 1.96
0.0002 3.92
0.00029 5.89
0.00038 7.85
0.0005 9.81
0.0006 11.77
0.0007 13.73
0.00078 15.7
0.00088 17.66
0.00098 19.62
0.00112 21.58
0.00128 23.54
0.00145 25.51
0.00161 27.47
0.00178 29.43
0.00196 31.39
0.00215 32.38
0.0023 34.34
0.00248 36.3
0.0026 37.28
0.00272 39.24
0.0029 41.2
0.00321 46.11
y = 13435x + 3.9395
0
10
20
30
40
50
0 0.001 0.002 0.003 0.004
Weight (N)
Compression (m)
Foam 5GCF3
Weight (N)
Linear (Weight (N))

78
Appendix B, Continued
Force vs. Compression of foam 5GCR9
Compression (m) Weight (N)
0.00003 1.96
0.00007 3.92
0.00017 5.89
0.00019 7.85
0.00021 9.81
0.00026 11.77
0.0003 13.73
0.00034 15.7
0.00039 17.66
0.00045 19.62
0.00051 21.58
0.00055 23.54
0.00061 25.51
0.00067 27.47
0.00074 29.43
0.00082 31.39
0.00089 33.35
0.00098 35.32
0.00106 37.28
0.00114 39.24
y = 34319x + 2.7894
0
10
20
30
40
50
0 0.0005 0.001 0.0015
Weight(N)e
Compression (m)
Foam 5GCR9
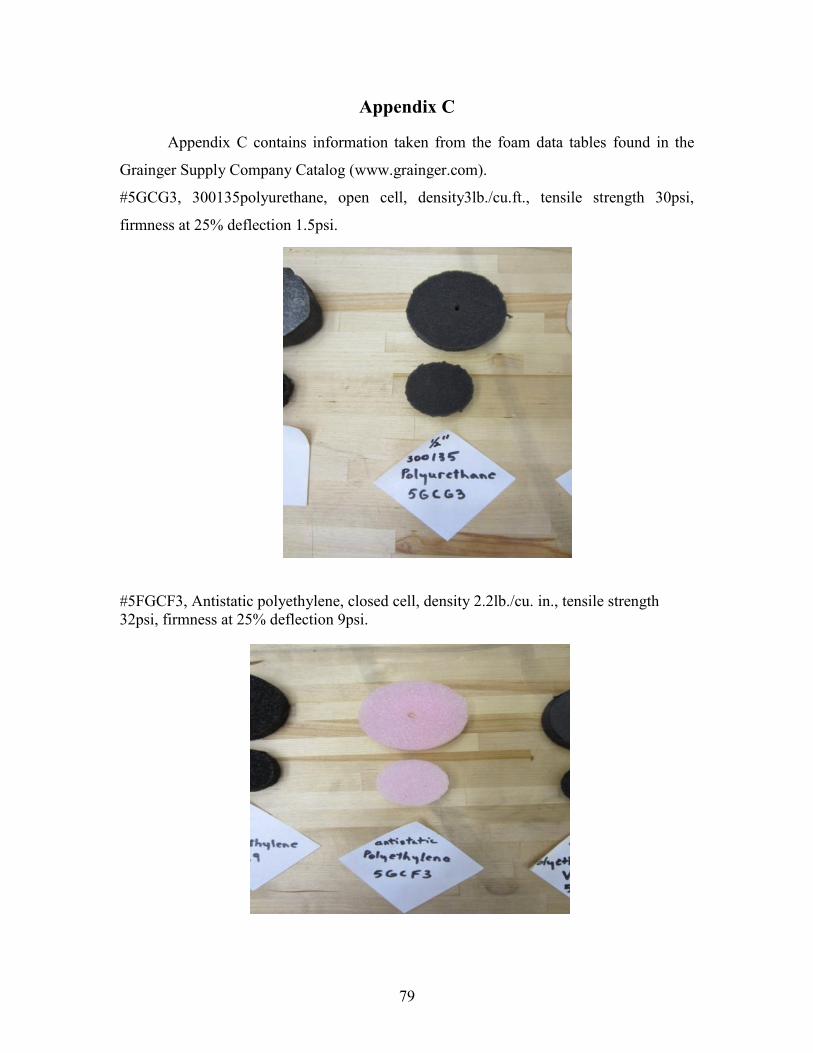
79
Appendix C
Appendix C contains information taken from the foam data tables found in the
Grainger Supply Company Catalog (www.grainger.com).
#5GCG3, 300135polyurethane, open cell, density3lb./cu.ft., tensile strength 30psi,
firmness at 25% deflection 1.5psi.
#5FGCF3, Antistatic polyethylene, closed cell, density 2.2lb./cu. in., tensile strength
32psi, firmness at 25% deflection 9psi.
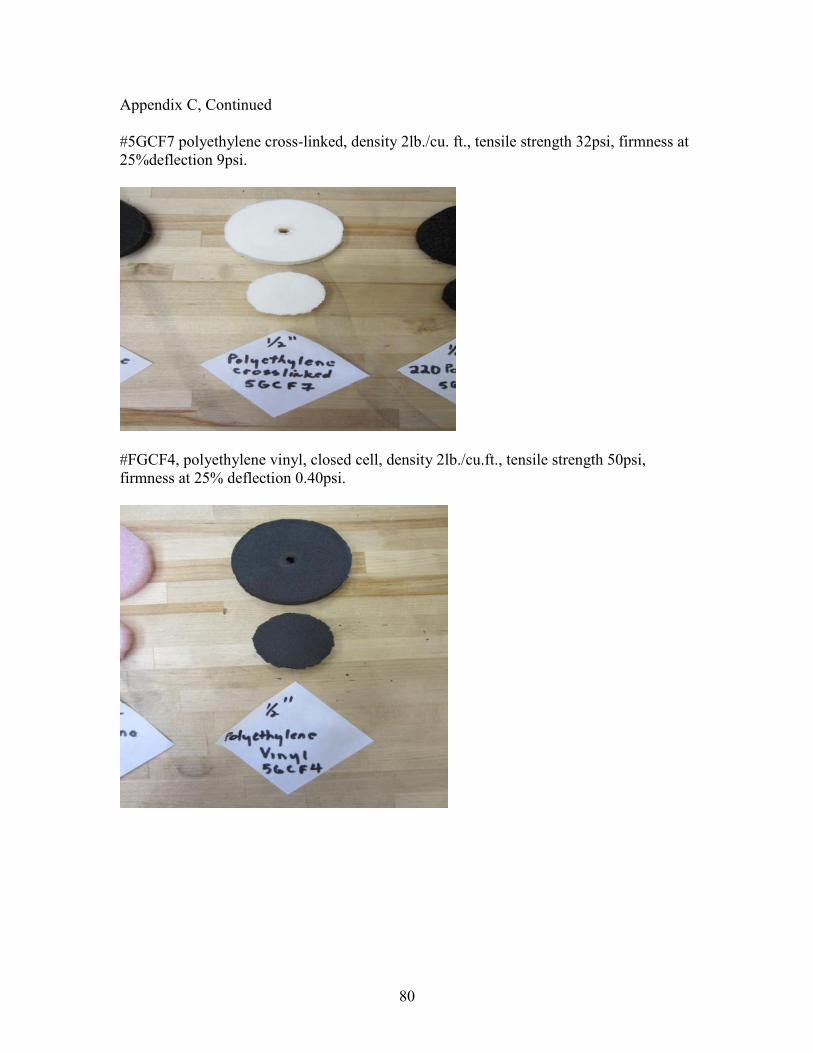
80
Appendix C, Continued
#5GCF7 polyethylene cross-linked, density 2lb./cu. ft., tensile strength 32psi, firmness at
25%deflection 9psi.
#FGCF4, polyethylene vinyl, closed cell, density 2lb./cu.ft., tensile strength 50psi,
firmness at 25% deflection 0.40psi.

81
Appendix C, Continued
#5GCR9, 220 polyethylene, closed cell, density 2.2lb/cu.ft, tensile strength 32psi,
firmness at 25% deflection 9psi.
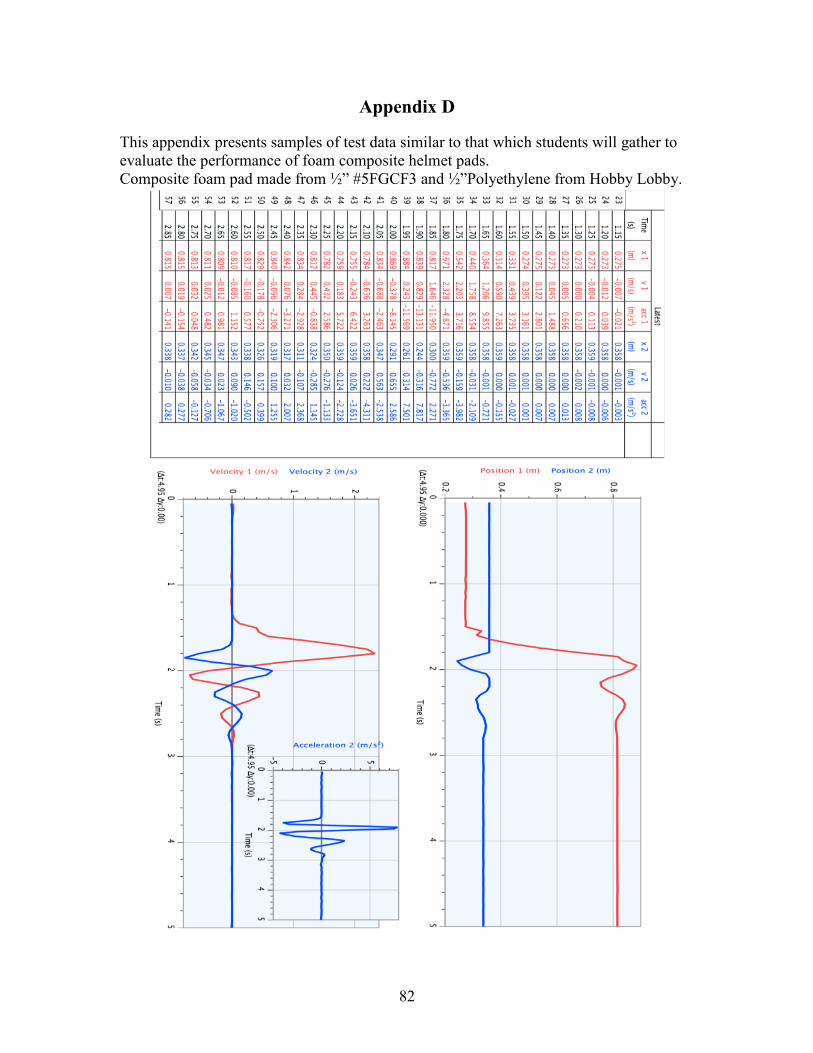
82
Appendix D
This appendix presents samples of test data similar to that which students will gather to
evaluate the performance of foam composite helmet pads.
Composite foam pad made from ½” #5FGCF3 and ½”Polyethylene from Hobby Lobby.

83
AppendixD, Continued
Composite made from 1/2”#5GCF7 and ½”#5GCF4
84
References
1. Apedoe, X. S., Reynolds, B., Ellefson, M. R., Schunn, C. D., (2008) Bringing
Engineering into High School Science Classrooms: The Heating/Cooling Unit.
Journal of Science Education and Technology, 2008,17:454-465 DOI 10.1007/s
10956-008-9114-6
2. Bell, Stephanie. (2010) Project-Based Learning for the 21st Century: Skills for the
Future. The Clearing House, 83: 39-43, 2010. ISSN: 0009-8655 print, DOI:
10.1080/00098650903505415
3. Bicycle Helmet Safety Institute, Helmets: How they Work and What Standards
Do. Online www.bhsi.org/general.htm
4. Cantu, C. C., Head Injuries in Sport. British Journal of Sports Medicine (1996)
30: 289-296
5. Coben, L. E., (2002) Helmet Protection: Why Not More? SAE International.
ISSN 0148-7191, Copyright 2002 SAE International
6. Consumer Product Safety Commission, Safety Standard for Bicycle Helmets
(1998) Federal Register/ Vol. 63, No. 46/ March 10, 1998/ Rules and Regulations
7. Doppelt, Yaron. (2009) Assessing Creative Thinking in Design-Based Learning.
International Journal of Design Education (2009) 19:55-65, DOI 10.1007/s10798-
006-9008-y
8. Dreis, Janice, and Larry Rehage. 2008. Recasting the Senior Year. Principal
Leadership, 8 (February 2008), 16-20 Published by the National Association of
Secondary School Principals (NASSP).
9. Lam, Tack, and Deanna Gates. 2010. Repeated Impacts on a Motorcycle Helmet:
What Happens After a Significant Impact? SAE International, ISSN 0148-7191.
doi: 10.4271/2010-01-1016.
10. Larmer, J, and John Mergendoller. 2010. Essentials for Project-Based Learning.
Educational Leadership, (September 2010) 34-37, Association for Supervision &
Curriculum Development.
11. Lou, Shi Jer, YI Hui Liu, et al. 2010. The Senior High School Student’s
Behavioral Model of STEM in PBL. International Journal of Technology and
Design Education. Springer Science + Business Media B.V. 2010,

85
10.1007/s10798-010-9112-x, published online 24 February 2010.
http:www.springerlink.com.
12. MacIsaac, D., Hamalainen, A., (2002) Physics and Technical Characteristics of
Ultrasonic Sonar Systems. The Physics Teacher/ Vol. 40, January 2002,
pgs. 39- 46
13. Merriam-Webster Dictionary, Senioritis, (2012) online: www.merriam-
webster.com/dictionary
14. Moss, W.C., M. J. King. (2011) Impact response of US Army and National
Football League helmet pad systems. Lawrence Livermore National Laboratory,
Livermore, CA, LLNL-SR-464951, January 2011
15. 18. Assessing the Need for Personal Protective Equipment: A Guide for
Employers (1997) Small Business Safety Management Series, U.S. Department
of Labor, Occupational Safety and Health Administration, OSHA 3151, 1997
16. Seat, Elaine, and Susan M. Lord. 1999. Enabling Effective Engineering Teams: A
program for Teaching Interaction Skills. Journal of Engineering Education,
(October, 1999) 385-390.
17. Shyu, S. Y. (2001). How to Turn the Students Into Research Masters by Internet-
online Project Learning and Instructional Innovation. Taiwan Education, 607, 25-
34
18. Time Magazine, (2006) How to Combat Senioritis. May 08, 2006