© copyright 2013 nora lee
TRANSCRIPT

© Copyright 2013
Nora Lee

The Role of Organic Cation Transporter 3 in Metformin Disposition during
Pregnancy
Nora Lee
A dissertation
submitted in partial fulfillment of the
requirements for the degree of
Doctor of Philosophy
University of Washington
2013
Reading Committee:
Joanne Wang, Chair
Kenneth E. Thummel
Mary F. Hebert
Program Authorized to Offer Degree:
Pharmaceutics

University of Washington
Abstract
The Role of Organic Cation Transporter 3 in Metformin Disposition during Pregnancy
Nora Lee
Chair of the Supervisory Committee:
Professor Joanne Wang
Department of Pharmaceutics
Metformin, a front line drug for type 2 diabetes mellitus, has been recently introduced as
an alternative therapy for insulin in treatment of gestational diabetes mellitus. Despite clinical
enthusiasm for the drug, there are still concerns about the effects of metformin on maternal and
neonatal outcomes. A clinical study conducted by Obstetric-fetal Pharmacology Research
Network showed that metformin renal clearance was significantly increased during pregnancy.
Moreover, metformin readily crosses the placental barrier and its concentration in fetal
circulation can be as high as maternal concentrations. The overall goal of this dissertation is to
understand mechanisms involved in maternal and fetal disposition of metformin. The studies
were designed to 1) determine the mechanism of altered maternal metformin disposition during
pregnancy; 2) elucidate the role of OCT3 in fetal exposure to metformin and in tissue
distribution of metformin in both pregnant and non-pregnant states.
To evaluate the effect of pregnancy on expression of polyspecific organic cation
transporters, we measured mRNA and protein expression of major organic cation transporters in

kidney, liver and placenta in pregnant mice and in human placentas. The overall effect of
pregnancy on renal and hepatic expression of organic cation transporters was moderate,
suggesting that increased renal clearance of metformin in pregnant women might be due to other
pregnancy-associated changes. OCT3/Oct3 were highly expressed in human and mouse
placentas. Interestingly, the expression of mouse placental Oct3 significantly increased from
mid gestational stage to term whereas OCT3 in human placenta only showed a moderate increase
in mid-to-late pregnancy. The role of OCT3/Oct3 in metformin tissue specific distribution was
determined by performing an in vivo study in Oct3 gene deletion mice. The in vivo study results
suggest that Oct3 profoundly affects metformin plasma kinetics and distribution in peripheral
tissues including salivary gland, heart and skeletal muscle, which highly express OCT3/Oct3.
Our findings demonstrate that OCT3/Oct3 is responsible for high accumulation of metformin in
the salivary glands, which potentially accounts for the taste disturbance caused by metformin in
type 2 diabetic patients taking this drug. In order to determine the role of OCT3 in fetal
exposure to metformin, immunolocalization study in human term placenta and in vivo study in
pregnant Oct3-/-
mice were carried out. OCT3 was concentrated to the basal membrane of
syncytiotrophoblast in human placenta. Pregnant Oct3-/-
mice showed reduced fetal exposure to
metformin, suggesting that OCT3/Oct3 facilitates transport of metformin from the placenta to the
fetal compartment.
In summary, findings from this dissertation research have greatly contributed our
understanding of the mechanisms involved in maternal and fetal disposition of metformin.
Importantly, our studies uncovered a novel molecular mechanism underlying taste disturbance
caused by metformin and identified OCT3 as an important determinant of fetal exposure to
metformin.

i
Table of Contents
List of figures…………………………………………………………………………………... iv
List of tables……………………………………………………………………………………. vi
Chapter 1. Introduction ….......................................................................................................... 1
1.1. Background ………………………………………………………………………………... 1
1.1.1. Pharmacotherapy in pregnant women …………………………………………...…. 1
1.1.2. Gestational diabetes mellitus and metformin ……………………………………..... 3
1.1.3. Metformin disposition during pregnancy ………………………………………...… 6
1.1.3.1. Polyspecific organic cation transporters and the roles in metformin PK/PD….. 6
1.1.3.2. Metformin maternal and fetal disposition during pregnancy …………………. 9
1.1.3.3. Potential importance of OCT3 in metformin disposition ……………………. 10
1.2. Hypothesis and Specific Aims ………………………………………………………... 11
1.3. Research Focus and Overall Significance …………………………………………… 12
Chapter 2. Pregnancy induced metformin pharmacokinetic change in a mouse model …. 18
2.1. Introduction ………………………………………………………………………….... 18
2.2. Materials and methods ……………………………………………………………….. 19
2.2.1. Animals ……………………………………………………………………………. 20
2.2.2. In vivo study ……………………………………………………………………….. 20
2.2.3. Statistical and pharmacokinetics analysis …………………………………………. 20
2.3. Results ……………………………………………………………………….………… 21
2.4. Discussion ………………………………………………………………...………….... 22
Chapter 3. Effect of gestational age on mRNA and protein expression of polyspecific
organic cation transporters during pregnancy ……………………………………………... 26
3.1. Introduction …………………………………………………………………………… 26
3.2. Materials and methods ……………………………………………………………….. 28
3.2.1. Animals and tissue harvest ……………………………………………………..…. 28
3.2.2. Human placenta source ………………………………………………………....…. 29
3.2.3. RNA isolation, cDNA synthesis and quantitative real-time PCR assays …………. 29

ii
3.2.4. Membrane protein preparation and quantification of transporters by LC-MS/MS
analysis ...……………………………………………………………………………….. 31
3.2.5. Data analysis ……………..………………………………………………………... 33
3.3. Results ………...……………………………………………………………………….. 33
3.3.1. Fluctuation of house-keeping genes in various tissues during pregnancy ………… 33
3.3.2. mRNA quantification of renal and hepatic mOct and mMate transporters in non-
pregnant and pregnant mice at different gestational ages ………………………….….. 34
3.3.3. Protein quantification of renal and hepatic mOct and mMate transporters in non-
pregnant and pregnant mice at different gestational age……………………………...... 35
3.3.4. mRNA expression pattern of OC transporters in human and mouse placenta .....… 35
3.3.5. mOct3 mRNA and protein expression in mouse placenta at various gestational
stages ..………………………………………………………………………………..... 36
3.3.6. hOCT3 mRNA and protein expression in human placenta at different trimesters .. 37
3.4. Discussion……………………………………………………………………………… 38
Chapter 4. Taste of pill: Organic cation transporter 3 mediates salivary gland
accumulation of metformin ……………………………………………………………….….. 50
4.1. Introduction …………………………………………………………………………… 50
4.2. Materials and methods ……………………………………………………………….. 51
4.2.1. Animals ……………………………………………………..……………..….…… 51
4.2.2. Human salivary glands ………………………………………………………....….. 51
4.2.3. RNA preparation and real-time PCR …………………………………………….... 52
4.2.4. Drug uptake in hOCT3 expressing cells .………………………………………….. 52
4.2.5. Membrane protein preparation and LC-MS/MS analysis ….…………………….... 53
4.2.6. In vivo study in mice ……………...……………………………………………….. 54
4.2.7. Immunofluorescent labeling of hOCT3 in human submandibular salivary glands…56
4.2.8. Pharmacokinetic data analysis ……………..……………………………………… 57
4.2.9. Statistical analysis …………………………………………………………………. 57
4.3. Results ………...……………………………………………………………………….. 58
4.3.1. Metformin transport kinetics by OCT3………………………………………….… 59
4.3.2. Predominant expression of OCT3 in salivary glands ………………………….….. 59
4.3.3. OCT3 protein expression and localization in salivary glands …………………….. 60

iii
4.3.4. Altered metformin pharmacokinetics in Oct3-/-
mice …..…………………….…… 61
4.3.5. Depleted metformin accumulation in salivary glands of Oct3-/-
mice …....……...... 62
4.4. Discussion ...…………………………………………………………………………… 63
Chapter 5. Organic cation transporter 3 facilitates fetal disposition of metformin during
pregnancy ………………………………………………….…………………………………... 81
5.1. Introduction …………………………………………………………………………… 81
5.2. Materials and methods ……………………………………………………………….. 81
5.2.1. Animals and tissue harvest ..………………………………..……………………… 83
5.2.2. Human placenta source …...…………………………………………………....….. 83
5.2.3. Immunolocalization studies in human placenta ………………………………….... 83
5.2.4. Expression of organic cation transporters and monoamine transporters in mouse
placenta .………………………………………………………………………………... 84
5.2.5. In vivo study .….………………………………………………………………... .... 84
5.2.6. Pharmacokinetic data analysis ……….……...…………………………………….. 85
5.3. Results ………...……………………………………………………………………….. 86
5.3.1. Localization of OCT3 in human term placenta ………………………………….… 88
5.3.2. Expression of polyspecific organic cation transporters and monoamine transporters
in placenta of pregnant Oct3+/+
and Oct3-/-
mice …………………………………...….. 88
5.3.3. Maternal plasma kinetics of metformin in Oct3+/+
and Oct3-/-
mice …………..….. 88
5.3.4. Fetal exposure to metformin in Oct3+/+
and Oct3-/-
mice …..……………...……… 89
5.3.5. Peripheral tissue distribution of metformin in Oct3+/+
and Oct3-/-
mice ….……..... 90
5.4. Discussion ……..……...……………………………………………………...……...… 90
Chapter 6. Conclusions and future direction ……………………………………………… 103
Bibliography …………………………………………………………………………………. 106

iv
List of figures
Figure 1.1 Cellular models of renal (A) and hepatic (B) organic cation transport ……............. 15
Figure 2.1. Dose-normalized plasma concentration-time profile of metformin in wild-type FVB
non-pregnant (□) and pregnant (■) mice ………………………………………………………. 25
Figure 3.1. Ct values of different housekeeping genes in kidney and liver from pregnant mice at
different gestational ages ………………………………………………………………………. 44
Figure 3.2. mRNA and protein expression of mouse OC transporters in kidney (A and C) and
liver (B and D) at different gestational ages ..………………………….………………………. 45
Figure 3.3. mRNA expression of various OC transporters in human term placenta (A) and
mouse placenta at gd 19 (B) ………………………………………………………………....… 46
Figure 3.4. mOct3 mRNA and protein expression in mouse placenta at different gestational ages
…………………………………………………………………………………………………... 47
Figure 3.5. Quantification of hOCT3 mRNA (A) and protein (B) in human placentas at different
gestational stages and correlation analysis of mRNA and protein expression (C) …………….. 48
Figure 4.1. Metformin transport kinetics in human OCT3-expressing HEK cells …………….. 70
Figure 4.2. Expression of polyspecific organic cation transporters in various tissues of Oct3+/+
(solid bar) and Oct3-/-
(open bar) mice …………………………………………………………. 71
Figure 4.3. Oct3 mRNA expression in various mouse tissues (A) and mRNA expression of
various transporters in mouse salivary glands (B) ..……………………………………………. 72
Figure 4.4. mRNA expression of various transporters in human salivary glands (A) and OCT3
mRNA expression in three human salivary gland regions (B)…………………………………. 73
Figure 4.5. Protein expression of OCT3 in three human salivary glands regions ……...……… 74
Figure 4.6. Dual-color immunofluorescence staining in human submandibular glands ...……. 75
Figure 4.7. Metformin plasma kinetics in female Oct3+/+
and Oct3-/-
mice ………...…….…… 76
Figure 4.8. Metformin plasma kinetics in male Oct3+/+
and Oct3-/-
mice ………...…………… 77
v
Figure 4.9. Accumulation of metformin in salivary glands of female and male Oct3+/+
and Oct3-/-
mice ………………………………………………………………………………….…………. 78
Figure 4.10. Plasma and salivary glands metformin concentration in female and male Oct3+/+
(A) and Oct3-/-
(B) mice ..……...……………………………………………………………..… 79
Figure 4.11. Proposed model for OCT3-mediated organic cation transport in salivary gland
epithelial cells ………………………………………………………………………………….. 80
Figure 5.1. Dual-color immunofluorescence staining in human term placenta ……………….. 98
Figure 5.2. Expression of various organic cation transporters in the placentas of Oct3+/+
and
Oct3-/-
mice …..………………………………………………………………………………… 99
Figure 5.3. The plasma concentration-time curve of metformin after an oral dose in pregnant
Oct3+/+
mice (□) and Oct3-/-
mice (■) (n=3-5 at each time point) at gd 19 ..………………….. 100
Figure 5.4. Fetal concentration-time curve of metformin after an oral dose in pregnant Oct3+/+
mice (■) and Oct3-/-
mice (□) (n=3-5 at each time point) at gd 19 ….…...…………………… 101
Figure 5.5. Proposed cellular model of metformin transport at the maternal-fetal interface … 102

vi
List of tables
Table 1.1. Effect of physiological changes on pharmacokinetics during pregnancy ………….. 16
Table 1.2. Apparent binding affinities of OCT1-3, MATE1/2K and PMAT toward metformin
…………………………………………………………………………………………………... 17
Table 2.1. Dose-normalized pharmacokinetic parameters of metformin in pregnant and non-
pregnant wild-type FVB mice ………………………………………………………………….. 24
Table 3.1. Optimized MS/MS parameters of proteotypic peptides selected for targeted analysis of
mOct1, mOct2, mOct3, mMate1 and hOCT3 ..………………………………………………… 43
Table 3.2. hOCT3 mRNA and protein quantification in human placentas from first, second
trimesters and at term …………………………………………………………………………... 44
Table 4.1. Metformin pharmacokinetic parameters from female Oct3+/+
and Oct3-/-
mice ……. 67
Table 4.2. Metformin pharmacokinetic parameters from male Oct3+/+
and Oct3-/-
mice ……… 68
Table 4.3. Tissue AUC0-8hr from female and male Oct3+/+
and Oct3-/-
mice ...…………………. 69
Table 5.1. Maternal metformin pharmacokinetic parameters from pregnant Oct3+/+
and Oct3-/-
mice ………………………………………………………………………………………..…… 95
Table 5.2. Fetal exposure to metformin in Oct3+/+
and Oct3-/-
pregnant mice ……...…………. 96
Table 5.3. Various tissue AUCs in Oct3+/+
and Oct3-/-
pregnant mice ……………...…………. 97

vii
Acknowledgement
This dissertation is a milestone in my academic career. I have been fortunate to build a
solid foundation of scientific theories and skills which would have been impossible if I had not
met a number of people who have guided and supported me throughout my research journey.
Foremost, I would like to express my sincerest gratitude to my doctoral advisor, Dr.
Joanne Wang, for her everlasting patience, support and guidance. She has been a dedicated
scientific advisor as well as a great mentor on life and career. She knows and understands my
strengths and weaknesses, and has guided me to enhance my strengths and overcome my
weaknesses in a scientific context. I wound not have been able to successfully complete this
dissertation research and develop into a mature scientist without her unremitting dedication of
time and effort.
I would also like to offer my sincere appreciation to my doctoral supervisory committee:
Drs. Thummel, Hebert, Shen, Mao and Rettie for their insights and guidance on my dissertation
research. I am deeply grateful for their questions, comments and suggestions that they provided
to me during the examinations. Their advice and comments have helped to drive my research to
move forward and have contributed to my scientific development.
In my daily work, I have been fortunate to be surrounded by a friendly group of
experienced scientist and researchers. My sincere thanks especially go to Dr. Horace Ho and Dr.
Haichuan Duan, who are always willing to help me to learn new scientific techniques and
provide insightful discussion and comments on my research design and data interpretation.
viii
Lastly, I would like to thank the faculty, staff and students in the Departments of
Pharmaceutics and Medicinal Chemistry who have supported and encouraged me to believe in
myself and my own abilities. They have helped me through various situations, allowing me to
reach this accomplishment.

ix
Dedication
To my mom and dad,
Thank you for your unconditional love and support through not only my graduate study,
but also my entire life. Your sincerity and diligence always inspire me to become a better person.
To my sister Hanna,
We were apart for many years, but you are always in my thoughts. Thank you for your
love and advice on my career.
To Michelle and Clara,
I feel lucky that I have encountered you two dearest friends in Seattle. I will always
cherish the time that we spent together for the past five years.
To Peter, Eunice, Hyojung, Sylvia, Minkyung, Jinhyun, Kyunghwa, Yoojung, Jennifer,
Sunhyung, and Hyeyeon,
Thank you all for always being there for me no matter where you are and helping me
through this long journey.

1
Chapter 1. Introduction
1.1. Background
1.1.1. Pharmacotherapy in pregnant women
About 60% of pregnant women in the United States take at least one prescription
medication other than a vitamin or mineral supplement and majority of these prescribed drugs
are category C drugs, drugs for which human safety during pregnancy has not been established
(Adam et al., 2011; Andrade et al., 2004; Glover et al., 2003). Due to safety concerns for both
pregnant women and their developing fetuses, many drugs have never been tested in the pregnant
population. Therefore, information on the pharmacokinetics (PK) and pharmacodynamics (PD)
of many drugs in pregnant women, as well as potential effect on the fetus, are rather limited.
Because of the lack of PK/PD data in the pregnant population, drug selection and dosage
regimens for pregnant women are mostly empirically derived and based on information obtained
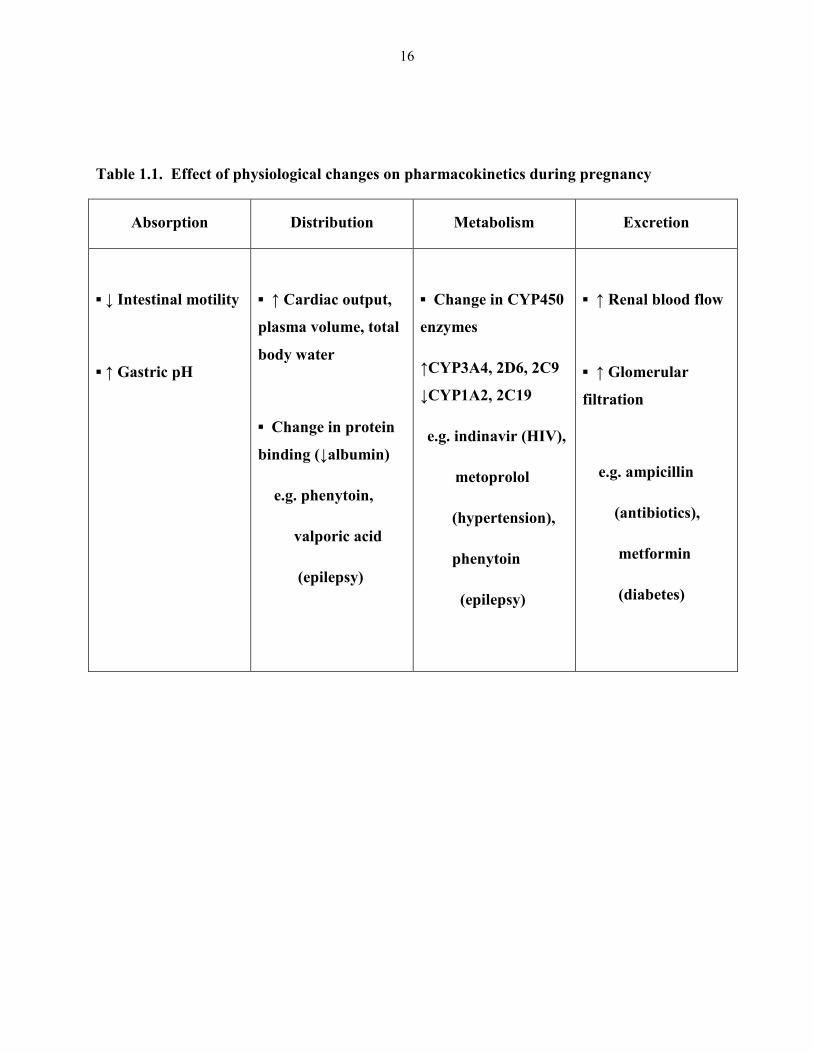
from non-pregnant population. However, during pregnancy there are extensive physiological
changes occurring that could alter maternal drug absorption, distribution, metabolism and
excretion (Table 1.1), which presents complexity and challenges for pharmacotherapy during
pregnanancy. Pregnancy-associated physiological changes include decreased intestinal motility,
increased gastric pH, an increase in cardiac output and plasma volume, reduced plasma albumin
concentrations, and increased renal blood flow and glomerular filtration rate (Isoherranen and
Thummel, 2013). In addition, there are substantial changes in the expression and activity of drug
metabolizing enzymes including cytochrome P450 (CYP) and UDP glucuronosyltransferase
(UGT) and drug transporters in a gestational age-dependent manner during pregnancy
(Isoherranen and Thummel, 2013). For instance, it was previously reported that clearance of

2
midazolam was greater in third trimester of pregnancy than postpartum, suggesting an increased
CYP3A4 activity in pregnancy (Hebert et al., 2008). In contrast, the activity of CYP1A2 was
shown to decrease throughout pregnancy (Tracy et al., 2005). Other drug metabolizing enzymes
including CYP2B6, 2D6 and 2C9 and UGT1A4 and 2B7 are also shown to be influenced by
pregnancy (Isoherranen and Thummel, 2013). Although the effect of pregnancy on the
expression and activity of drug transporters is less known, several studies have shown that drug
transporters can be also affected by pregnancy. Previously, it was reported that renal secretion
clearance of digoxin increased in pregnant women, indicating an increased P-glycoprotein (P-gp)
activity during pregnancy (Hebert et al., 2008). In a mouse model, the expression of placental P-
gp was found to be dependent on gestational age. (Mathias et al., 2005). Also, a recent clinical
study showed increased renal clearance of metformin in pregnant women, suggesting possible
alteration of renal organic cation transporter (OCT) by pregnancy (Eyal et al., 2010).
Another aspect that challenges drug therapy in pregnant women is the potential harmful
effect of drugs on the developing fetus. The cases of thalidomide and isotretinoin have clearly
demonstrated that fetal exposure to certain drugs can cause detrimental birth defects (Shehata
and Nelson-Piercy, 2001). Nevertheless, the fetal exposure and teratogenic risks for more than
90% of drugs have not been determined in humans (Adam et al., 2011). There have been
considerable efforts made by government agencies, pharmaceutical industries and academic
researchers to gather information about the potential teratogenic risks of prescription drugs and
prevent the adverse birth defects from use of drugs in pregnancy (Adam et al., 2011). Despite
these efforts, the available data on fetal exposure and drug teratogenicity are still very limited;
therefore leaving the developing embryo and fetus at risk to the vast majority of drugs used
during pregnancy.

3
Pregnancy-induced changes in drug disposition and potential teratogenicity make safe
and effective drug therapy in pregnant women challenging. However, it is almost impossible to
entirely avoid drug treatment during pregnancy because maternal illnesses including
hypertension, pre-eclampsia and gestational diabetes mellitus can endanger both the mother and
the fetus if they are not treated properly. Thus, it is important to understand maternal and fetal
drug disposition and response during pregnancy, which would inform rational drug selection and
dosage for pregnant women to achieve optimal drug efficacy while minimizing toxicity. Basic
research to elucidate the molecular mechanisms of altered drug disposition, response and
teratogenic effects during pregnancy is indispensable. These research based studies can further
provide information on potential pregnancy-induced changes in PK/PD and teratogenicity in
order to optimize drug therapy and prevent adverse events that may occur while utilizing
pharmacotherapy during pregnancy.
1.1.2. Gestational diabetes mellitus and metformin
Diabetes mellitus, or simply diabetes, is a major metabolic disease affecting an estimated
285 million people worldwide (Qaseem et al., 2012). In the United States, diabetes is the
seventh leading cause of death, and its incidence is increasing substantially due to an increasing
obesity rate (Qaseem et al., 2012). Diabetes is classified into four broad categories: type 1, type
2, gestational diabetes and other specific types, with type 2 being the most common form making
up about 90% of all cases (Qaseem et al., 2012). Diabetes increase the risk of long-term
complications, including microvascular (retinopathy, nephropathy and neuropathy) and
macrovascular (coronary artery, cerebrovascular, and peripheral vascular disease) complications
(Qaseem et al., 2012). Gestational diabetes mellitus (GDM) is characterized by glucose

4
intolerance that starts or is first diagnosed during pregnancy. GDM complicates about 5% of
pregnancies. Women with uncontrolled GDM can be at increased risk of cesarean delivery, pre-
eclampsia, and long-term diabetes and her offspring are prone to develop childhood obesity and
type 2 diabetes (Langer et al., 2005). In the non-pregnant diabetic population, the standard
therapy is insulin. Oral glucose lowering agents have also been widely used to achieve glycemic
control, especially in type 2 diabetes. Similar to type 2 diabetes, the hallmark of GDM is insulin
resistance which is likely resulted by placental hormones including human placental lactogen,
cortisol, estrogen, progestrogen, and tumor necrosis factor α (Berggren and Boggess, 2013).
Insulin is the only Federal Drug Administration-approved therapy for GMD treatment yet
(Berggren and Boggess, 2013) and has been the mainstay of GDM treatment. However, recently
oral hypoglycemic agents received attention and are increasingly used as alternatives to insulin
therapy due to lower cost, no need for self-injections, and comparable efficacy (Berggren and
Boggess, 2013).
Metformin is an oral hypoglycemic drug used as a front line drug for the treatment of
type 2 diabetes (Johnson et al., 2002). Meformin is an ‘insulin sensitizer’, because it decreases
glucose levels without increasing insulin secretion. Its major mechanism of action involves
suppression of hepatic glucose production by stimulating AMP-activated protein kinase (AMPK)
and inhibiting complex 1 of the mitochondrial respiratory chain (Hundal and Inzucchi, 2003). In
addition, metformin stimulates peripheral glucose uptake by skeletal muscle and adipose tissue,
decreases intestinal glucose absorption, and improves insulin secretion by pancreatic β cells
(Hundal and Inzucchi, 2003).
Metformin is a polar and water soluble biguanide with a log P of -0.5 and pKa of 12.4. It
has an oral bioavailability of 40-60 %, a wide volume of distribution (63-276 L), and minimal

5
protein binding (Scheen, 1996). This drug is known to be highly accumulated in the tissues
including liver, kidney, small intestine and salivary glands (Hundal and Inzucchi, 2003; Scheen,
1996). Metformin does not undergo hepatic metabolism and is predominantly eliminated by
kidney (Hundal and Inzucchi, 2003; Scheen, 1996) with renal clearance (335-615 mL/min) about
four times glomerular filtration rate (GFR) (Scheen, 1996). The most common side effect of
metformin is gastrointestinal upset, which occurs in 20-30 % of patients (Zolk, 2012).
Clinically, there are large variations in the patient-to-patient pharmacokinetics and antidiabetic
response to metformin (Tzvetkov et al., 2009; Zolk, 2012).
Recently, metformin has been introduced as an alternative therapy to insulin in GDM
treatment due to its comparable efficacy and safety, easier route of administration, lower cost, as
well as improved patient’s satisfaction (Langer et al., 2000; Rowan et al., 2008). In the treatment
of GDM, metformin can be used as monotherapy or in combination with insulin. Some patients
with multiple risk factors for insulin resistance (e.g higher body mass index (BMI), higher
baseline glucose) may require supplementary insulin to meet the treatment goals (Lautatzis et al.,
2013; Rowan et al., 2008). Although its use in pregnancy is on the rise, there are concerns
because of the limited data on metformin’s effect on maternal and neonatal outcomes (Gui et al.,
2013; Mesdaghinia et al., 2013). Metformin disposition in pregnant population was shown to be
profoundly different from that in non-pregnant population (Eyal et al., 2010). Metformin renal
clearance was increased significantly in mid- and late- pregnancy compared with postpartum
(Eyal et al., 2010). These findings suggest that dose may need to be adjusted upward in pregnant
women to achieve sufficient glycemic control. Metformin readily crosses the placental barrier
and metformin concentration in fetal circulation can reach as high as maternal concentrations
(Eyal et al., 2010; Kovo et al., 2008). In contrast, infant exposure to metformin by breastfeeding
6
is low (Eyal et al., 2010). Theoretically metformin could increase fetal insulin sensitivity and
consequently reduce fetal insulin production, an effect that might restrict the fetal growth and
cause neonatal hypoglycemia (Kovo et al., 2008; Vanky et al., 2005). So far, no adverse fetal
effects have been reported among women treated with metformin during pregnancy. However,
long-term outcome and complications of exposed fetuses requires further evaluation. For the
safe and effective use of metformin in pregnant women, mechanistic studies are required to
better understand maternal and fetal disposition of metformin, as well as its potential
teratogenicity and long-term effects.
1.1.3. Metformin disposition during pregnancy
1.1.3.1. Polyspecific organic cation transporters and the roles in metformin PK/PD
Organic cation transporters (OCTs) in the solute carrier 22 (SLC22) family play an
important role in the disposition and detoxification of various endogenous compounds and
xenobiotics. OCTs transport relatively small and hydrophilic organic cations with diverse
chemical structures. OCT-mediated transport is electrogenic, Na+ independent and bi-directional
(Koepsell et al., 2003; Wright and Dantzler, 2004). The classic OCT substrates include MPP+
(1-methyl-4-phenyl-pyridinium), TEA (tetraethylammonium), biogenic amines, and a number of
clinically used drugs (Wright and Dantzler, 2004). The three major OCT isoforms, OCT1-3,
display a large overlap in substrate and inhibitor specificity. In humans, OCT1 is mainly
expressed in the liver. Localized to the sinusoidal membrane of hepatocytes, OCT1 mediates
organic cation uptake from the blood into hepatocytes (Fig. 1.1) (Koepsell, 2004). OCT2 is
primarily expressed in the kidney and is localized to the basolateral membrane of renal proximal
tubular cells. By transporting organic cations from the blood into the proximal tubular cells,
7
OCT2 mediates the first step in renal secretion of many cation drugs (Fig. 1.1) (Koepsell, 2004).
OCT3 is highly expressed in the placenta and also widely distributed in various tissues. OCT3
has been implicated in the clearance of endogenous monoamines, but its roles in transport of
xenobiotic OCs have not been adequately investigated.
After being transported into the hepatocytes (by OCT1) or renal tubular cells (by OCT2),
organic cations are further excreted into the bile or urine by the multidrug and toxin extrusion
(MATE) proteins in SLC47 family (Fig. 1.1) (Moriyama et al., 2008). In humans, there are two
isoforms: hMATE1 (SLC 47A1) and hMATE2-K (SLC47A2) (Masuda et al., 2006; Otsuka et
al., 2005; Tsuda et al., 2009b). MATE1 is highly expressed in the kidney, adrenal gland, liver,
skeletal muscle and several other tissues, whereas MATE2-K is kidney specific (Otsuka et al.,
2005). The MATEs are H+/OC antiporters and mediate electroneutral exchange of H
+ and an OC
substrate. The MATE proteins are localized on the apical membrane of renal and hepatic cells,
and are responsible for the final step of excretion of OCs (Otsuka et al., 2005). Not surprisingly,
the MATEs share a large substrate overlap with the OCTs (Hiasa et al., 2006; Otsuka et al.,
2005).
In addition to OCTs and MATEs, a novel polyspecific organic cation transporter, plasma
membrane monoamine transporter (PMAT), was cloned and characterized by our laboratory
(Engel and Wang, 2005; Engel et al., 2004; Xia et al., 2007; Zhou et al., 2007). The substrates
and inhibitors specificity of PAMT largely overlap with those of the OCTs (Engel and Wang,
2005). PMAT mRNA is widely expressed in a number of human tissues including small
intestine, brain, kidney, liver and heart (Barnes et al., 2006; Engel et al., 2004; Xia et al., 2007).
Currently, the role and significance of PMAT in organic cation disposition is largely unknown.

8
In vitro studies have demonstrated that metformin is a substrate for OCT1-3, MATE1-2,
and PMAT (Dresser et al., 2002; Kimura et al., 2005; Masuda et al., 2006; Nies et al., 2009;
Suhre et al., 2005; Zhou et al., 2007). The apparent binding affinities (Km) of these transporters
towards metformin are summarized in Table 1.2. OCT1-3, PMAT and MATE2-K have similar
Km values towards metformin, in low mM range, whereas MATE1 has a relatively higher
affinity. The therapeutic concentrations of metformin was reported to range between 3 ~12 μM
(Scheen, 1996). OCT1 transports metformin into the hepatocyte, which is the major site of
metformin action. It was reported that patients with low-activity genetic variants of OCT1
(SLC22A1) (R61C, G401S, M420del, or G465R) had a reduced therapeutic response to
metformin due to a decreased hepatic uptake, suggesting that OCT1-mediated hepatic uptake is
an important determinant of the glucose-lowering effect of metformin (Shu et al., 2008; Shu et
al., 2007). The renal clearance of metformin is about 4 times GFR, suggesting that active tubular
secretion is the major route for metformin elimination (Dunn and Peters, 1995; Li et al., 2006).
OCT2, expressed at the basolateral membrane of renal proximal tubular cell, mediates metformin
uptake from the peritubular capillary blood into the tubular cells (Fujita et al., 2006; Wright and
Dantzler, 2004). Once inside the cells, metformin is further transported into the tubular lumen
by the apical MATE1 and MATE2-K (Tsuda et al., 2009b). It was reported that in carriers of a
variant form of the OCT2 gene (SLC22A2), metformin renal clearance and its area under the
concentration-time curve (AUC) were altered (Chen et al., 2009; Song et al., 2008; Wang et al.,
2008). More recently, Choi et al. reported that a common 5’-UTR (untranslated region) variant
in MATE2-K gene is associated with poor response to metformin (Choi et al., 2011). However,
conflicting results were also reported and genetic polymorphisms in OCT1-2 and MATE genes
alone cannot fully explain the large inter-individual differences in metformin PK/PD observed

9
clinically (Chen et al., 2009; Song et al., 2008; Tzvetkov et al., 2009; Wang et al., 2008; Zolk,
2012).
1.1.3.2. Metformin maternal and fetal disposition during pregnancy
Recently, a clinical study in pregnant women has been conducted by the Obstetric-Fetal
Pharmacology Research Unit (OPRU) at the University of Washington. Metformin renal
clearance was found to be significantly increased in mid (by 52 %) and late (by 31 %) pregnancy
compared with postpartum (Eyal et al., 2010). Creatinine clearance and net secretion clearance
of metformin increased during pregnancy (Eyal et al., 2010), suggesting that the altered
metformin PK in pregnant women can be attributed to changes in renal filtration and tubular
secretion of metformin during pregnancy. Enhanced metformin tubular secretion during
pregnancy could be due to altered expression and activity of renal organic cation transporters.
However, currently little is known about the expression and activity of polyspecific organic
cation transporters during pregnancy.
Clinical studies and ex vivo perfusion study have also shown that metformin crosses the
human placenta, and its fetal blood concentrations at delivery can reach the maternal
concentrations (Charles et al., 2006; Eyal et al., 2010; Kovo et al., 2008; Vanky et al., 2005).
While a carrier-mediated pathway has been suggested (Kovo et al., 2008), the molecular
mechanisms of metformin transport at the placental barrier is unclear. Among all known
metformin transporters, only OCT3 is highly expressed in human placenta (Otsuka et al., 2005).
The localization of OCT3 in the human placental syncytiotrophoblast has not been clearly
defined, yet it is suggested to be localized to the basal membrane facing the fetal blood (Sata et
al., 2005; Vahakangas and Myllynen, 2009). Results from an ex vivo perfusion study indicate

10
that metformin transport across the placenta is concentration-dependent, saturable and possibly
mediated by a bi-directional organic cation transporter (Kovo et al., 2008). When pregnant Oct3
(-/-) mice were given an intravenous dose of MPP+, a 3-fold reduction in fetal MPP+
accumulation was observed in homozygous Oct3(-/-), compared to wild-type, embryos (Zwart et
al., 2001b), suggesting that OCT3 mediates maternal-to-fetal transport of OCs. However, in
contrast, results from a recent study in a rat model showed high expression of rMate1 in the rat
placenta and suggested that rOct3 and rMate1 work together sequentially to mediate fetal-to-
maternal transport of MPP+ (Ahmadimoghaddam et al., 2012). These mixed results compel
further investigation to elucidate the precise transport mechanism of metformin and other OCs at
the human placental barrier.
1.1.3.3. Potential importance of OCT3 in metformin disposition
OCT3, also known as the extraneuronal monoamine transporter (EMT), is generally
believed to play a role in extraneuronal uptake of monoamine neurotransmitters. OCT3 is
expressed in the placenta, liver, kidney, small intestine, skeletal muscle, heart, lung, brain and
salivary glands. Similar to OCT1-2, OCT3 transports MPP+, catecholamines, and other type I
OCs (Koepsell et al., 2003). A previous in vivo study with Oct3 (-/-) mice using MPP+ as a
prototypical substrate suggests that Oct3 may also play a role in disposition of xenobiotic organic
cations (Zwart et al., 2001b). We and others recently showed that metfomin is transported by
hOCT3 with apparent affinity (Km) comparable to those reported for hOCT1 and hOCT2 (Chen
et al., 2010; Nies et al., 2009) (Lee and Wang, unpublished data). However, the exact in vivo
role of OCT3 in metformin disposition and action has not yet been established. Interestingly, in
addition to the placenta, OCT3 is also highly expressed in those tissues known to highly

11
accumulate metformin that include liver, kidney, small intestine and salivary glands. Moreover,
OCT3 is expressed in skeletal muscle cells, which is a secondary site of metformin action.
Based upon these observations, OCT3 may play an important role not only in of the transport of
metformin across the placental barrier and into the fetus, but also in tissue-specific distribution of
metformin, which may in turn affect metformin pharmacology in vivo.
1.2. Hypothesis and specific aims
The goal of my thesis research is to improve our understanding of the role of OCT3 in metformin
disposition, especially under the pregnant state. To that end, the following three hypotheses will
be tested the execution of the associated specific aims:
Hypothesis 1. Expression of renal/hepatic organic cation transporters is altered during
pregnancy, affecting maternal metformin pharmacokinetic (PK) behavior.
Specific aim 1.1. To confirm that mouse pregnancy can recapitulate metformin PK in
human pregnancy.
Specific aim 1.2. To determine if the mRNA/protein expression of organic cation
transporters in kidney, liver and placenta is up-regulated by pregnancy.
Hypothesis 2. OCT3 plays an important role in the tissue-specific distribution of metformin,
which influences metformin pharmacokinetics and pharmacodynamic response in vivo.
Specific aim 2.1. To determine metformin transport kinetics by hOCT3 stably expressed
HEK293 cells.
Specific aim 2.2. To determine the expression profile and localization of Oct3 in mice.

12
Specific aim 2.3. To determine if metfomin PK is altered in the Oct3 knockout mouse
model.
Hypothesis 3. OCT3 plays an important role in placental transport and fetal exposure to
metformin during pregnancy.
Specific aim 3.1.To determine the membrane localization of OCT3 in human term
placenta.
Specific aim 3.2. To determine if fetal exposure to metformin is reduced in pregnant Oct3
knockout mice.
1.3. Research focus and overall significance
The first goal of my thesis research is to determine if the expression of polyspecific
organic cation transporters is altered during pregnancy that may affect metformin and other
cationic drug disposition during pregnancy. Because obtaining tissues from pregnant women is
not feasible, we used a mouse model with timed-pregnancy to evaluate the effect of pregnancy
on the expression of various organic cation transporters. In order to validate the animal model,
and show that pregnancy has a similar effect on metformin disposition in human and mice, we
first characterized metformin disposition in vivo in non-pregnant and pregnant mice. Our results
presented in Chapter 2 confirmed that pregnancy altered metformin PK in pregnant mice in a
manner similar to that seen in humans, demonstrating that mouse pregnancy can recapitulate
metformin PK changes observed in human pregnancy.

13
In Chapter 3, we determined the effect of pregnancy and gestational age on mRNA and
protein expression of major organic cation transporters in kidney, liver and placenta in pregnant
mice and human placentas using quantitative real-time PCR and LC-MS/MS targeted proteomics.
Overall, the effect of pregnancy on the expression of renal and hepatic organic cation
transporters was moderate and non-significant with the exception of reduced mMate1 expression
in mouse kidney during pregnancy.
OCT3/Oct3 were highly (and selectively) expressed in human and mouse placenta.
Moreover, the expression of mouse placental mOct3 greatly increased after gestational day (gd)
10, whereas human placenta only showed a moderate increase in the expression of OCT3 in mid-
and late- pregnancy. These data suggest an important role of OCT3 in OC transporter at the
maternal-fetal placental interface. In addition, our results suggest that an altered renal expression
of OC transporters may not be the reason underlying the observed increase in renal clearance of
metformin during pregnancy. Other pregnancy-associated changes, such as elevations in renal
blood flow and glomerular filtration, might better explain the increased total renal clearance of
metformin in pregnancy.
The second goal my dissertation research is to investigate the role of OCT3 in tissue
specific distribution of metformin. As reported in Chapter 4, we determined the expression
profile of Oct3 in various mouse tissues and investigated its role in metformin disposition in vivo
using wild-type and Oct3 gene deletion mice. The results suggest that OCT3 profoundly affects
metformin plasma PK and its distribution in peripheral tissues including salivary gland, heart and
skeletal muscle, which all show high expression of OCT3. Importantly, our in vivo study
revealed that OCT3 is responsible for high accumulation of metformin in the salivary glands,

14
which underlies the taste disturbance effect of metformin, a commonly reported adverse effect of
the drug.
In Chapter 5, we determined the role of OCT3 in maternal and fetal disposition of
metformin during pregnancy and elucidated the mechanism governing fetal exposure to
metformin. We first determined the membrane localization of OCT3 in human placenta and
showed that the transporter is primarily localized to the basal membrane of placental
syncytiotrophoblast cells and in placental endothelial cells of fetal origin. We then determined
the in vivo impact of Oct3 in metformin disposition across the placental barrier using pregnant
Oct3 knockout and wild-type mice. Our data showed that the overall fetal exposure to
metformin was reduced in pregnant Oct3-/-
mice, even after normalizing to maternal plasma
AUC. These results suggest that OCT3 facilitates metformin entry from maternal side into the
fetal compartment and is an important determinant of fetal exposure to metformin and possibly
other organic cation drugs.
Findings from this dissertation research improve our mechanistic understanding of how
pregnancy affects the expression of polyspecific organic cation transporter. Moreover, the
current studies provide novel information regarding the role and in vivo significance of OCT3 in
the distribution and pharmacological response of metformin in both non-pregnant and pregnant
states. Importantly, our studies uncovered a novel molecular mechanism underlying taste
disturbance of metformin and revealed OCT3 as a key factor influencing fetal exposure to
metformin. Together, these results greatly enhance our understanding of the mechanisms
involved in the maternal and fetal disposition of metformin. Knowledge gained from these
studies will help to pave the way for optimizing metformin pharmacotherapy in the treatment of
type 2 diabetes as well as GDM in pregnant women.

15
Figure 1.1. Cellular models of renal (A) and hepatic (B) organic cation transport.
OCT1
hMATE1
OC+
OC+ H+
Sinusoidal membrane
Bile canaliculus
B. A. Kidney Liver
16
Table 1.1. Effect of physiological changes on pharmacokinetics during pregnancy
Absorption Distribution Metabolism Excretion
▪ ↓ Intestinal motility
▪ ↑ Gastric pH
▪ ↑ Cardiac output,
plasma volume, total
body water
▪ Change in protein
binding (↓albumin)
e.g. phenytoin,
valporic acid
(epilepsy)
▪ Change in CYP450
enzymes
↑CYP3A4, 2D6, 2C9
↓CYP1A2, 2C19
e.g. indinavir (HIV),
metoprolol
(hypertension),
phenytoin
(epilepsy)
▪ ↑ Renal blood flow
▪ ↑ Glomerular
filtration
e.g. ampicillin
(antibiotics),
metformin
(diabetes)

17
Table 1.2. Apparent binding affinities of OCT1-3, MATE1/2K and PMAT toward
metformin.
Km (μM)
hOCT1 1,470 (Kimura et al., 2005)
hOCT2 990, 1,380 (Dresser et al., 2002; Kimura et al., 2005)
hOCT3 2,260, 1,090 (Chen et al., 2010; Nies et al., 2009)
MATE1 212 (Chen et al., 2007)
MATE2-K 1,050 (Masuda et al., 2006)
PMAT 1,320 (Zhou et al., 2007)
18
Chapter 2. Pregnancy induced metformin pharmacokinetic change in a
mouse model
2.1. Introduction
In a recent clinical study performed by the Obstetric Pharmacology Research Unit
(OPRU) at the University of Washington, investigators reported a change in metformin
pharmacokinetics in pregnant women (Eyal et al., 2010). Metformin renal clearance increased
significantly in mid (723 + 243 ml/min, P < 0.01) and late pregnancy (625 + 130 ml/min, P <
0.01) compared with postpartum (477 + 132 ml/min) (Eyal et al., 2010). This increased renal
clearance of metformin in pregnant women is likely to the result of increases in renal filtration
and tubular secretion of metformin. The molecular mechanisms underlying these changes during
pregnancy are unclear. Because transepithelial transport of metformin in the nephron tubules is
mediated by the sequential action of polyspecific organic cation transporter 2 (OCT2) and the
multidrug and toxin extrusion proteins (MATEs), the increased secretory clearance may be due
to increased expression and activity of these renal transporters in pregnancy. A major goal of my
dissertation research is to determine whether expression of polyspecific organic cation
transporters is altered during pregnancy, thereby affecting cationic drug disposition during
pregnancy. Because it is unrealistic to directly examine gene expression in kidney and liver
tissues collected from pregnant women, mice with timed-pregnancy will be used to investigate
the effect of pregnancy on the expression of polyspecific organic cation transporters.
Mice with timed-pregnancy are commonly used as an animal model of human pregnancy
– specifically for in vivo characterization of drug disposition and ex vivo gene profiling. For
example, P-gp expression in human placenta was shown to be up-regulated in early pregnancy,

19
and a similar trend was found in mouse placenta showing highest placental P-gp expression at
gestational day (gd) 10 (Zhang et al., 2008). Also, the expression of hepatic Cyp3a isoforms
increased in pregnant mice, which is consistent with an increased CYP3A activity in human
pregnancy (Zhang et al., 2008). The increased Cyp3a expression in mice was at least in part
responsible for the increased systemic clearance of glyburide in pregnant mice, providing a
molecular understanding for pregnancy-induced pharmacokinetic (PK) alterations of glyburide in
pregnant women (Koh et al., 2011; Zhou et al., 2008). These findings suggest that mice can
serve as an appropriate animal model to evaluate the pregnancy effect on certain CYP enzymes
and drug transporters. Moreover, the availability of mice with targeted gene deletion provides a
unique opportunity to dissect the molecular mechanism involved in drug handling in vivo.
Our genes of interest are polyspecific organic cation transporters including OCT1-3,
MATE1-2K and PMAT. Little is known about the regulation of organic cation transporters
during pregnancy. In order to examine the effect of pregnancy on these transporters and
elucidate the mechanisms behind the increased clearance of metformin in pregnancy, our studies
were designed to first characterize renal expression of various polyspecific organic cation
transporters in tissues from pregnant mice during timed-pregnancies. However, it is important to
validate that the alterations in metformin disposition in human pregnancy is appropriately
replicated in pregnant mice. Therefore, we first carried out a metformin in vivo PK study in non-
pregnant and pregnant mice to evaluate the effect of pregnancy on metformin disposition and to
determine if the changes observed in mice recapitulate the PK changes seen in human pregnancy.
2.2. Materials and methods

20
2.2.1. Animals
Adult (8-10 weeks of age) wild-type FVB mice (Taconic) were housed in the specific
pathogen free (SPF) facility at the University of Washington. The animal studies were approved
by the Institutional Animal Care and Use Committee (IACUC) of the University of Washington.
To obtain pregnant mice at gestational day (gd) 19 (term in mice is ~20-21 days), timed mating
was carried out. The date that a vaginal plug was observed was assigned as gestational day 1.
2.2.2. In vivo study
Non-pregnant (virgin) and pregnant mice at gd 19 were fasted for 5-10 hours and
administered 15 mg/kg metformin containing 0.2 mCi/kg of [14
C] labeled metformin by oral
gavage. At 15, 30, 45, 60, 120, 180, 240, and 480 min, blood was collected. For each time
point, 3-5 mice were used. The non-pregnant and pregnant mice were sacrificed using CO2. The
blood samples were obtained in heparinized microhematocrit capillary tubes (Fisher) by cardiac
puncture and plasma was separated by centrifugation for 1 minute at 5000 x g. Metformin
concentrations in the plasma were determined by scintillation counting using the method
described by Wilcock et al. with minor modification (Wilcock and Bailey, 1994). In brief,
plasma samples were placed in scintillation vials with 1 mL 1 M NaOH and incubated at 55~70˚
C for 1~2 hours. After cooling, H2O2 was added to decolorize the samples. After several hours,
15 mL of Eco-scintillation buffer was added first, followed by 1 mL 1 M HCL to neutralize the
solutions. The samples were stored overnight before counting. The amounts of radioactivity
were expressed as ng/ml for plasma.
2.2.3. Statistical and pharmacokinetics analysis.

21
Non-compartment analysis was conducted using WinNonlin 5.2 (Pharsight Corporation,
Moutian View, CA) to estimate the drug pharmacokinetic parameters. Metformin was
administered to non-pregnant and pregnant mice based on body weight (mg per kg body weight).
The average body weights for non-pregnant and pregnant mice were 20 g and 35 g respectively.
Due to the difference in body weights between the two mouse groups, the dose given to the
pregnant mice was about 1.8 times greater than that given to the non-pregnant mice. Therefore,
we calculated the dose-normalized area under the concentration-time curve (AUC) and oral
clearance using the following equations (Zhou et al., 2010):
AUCdose-normalized = AUC0-8h/(mean dose for respective mouse group)
CL/F = mean dose for respective mouse group/AUC0-8h
The data are expressed as mean + S.D. Statistical significance was determined by Student’s t test
using n=3 for each time point. A p-value less than 0.05 was considered significant.
2.3. Results
The plasma concentration-time profile of metformin following an oral 15 mg/kg dose in
non-pregnant and pregnant mice is shown in Figure 2.1. The dose-normalized plasma
concentrations at most time points in pregnant mice were lower than those in non-pregnant mice.
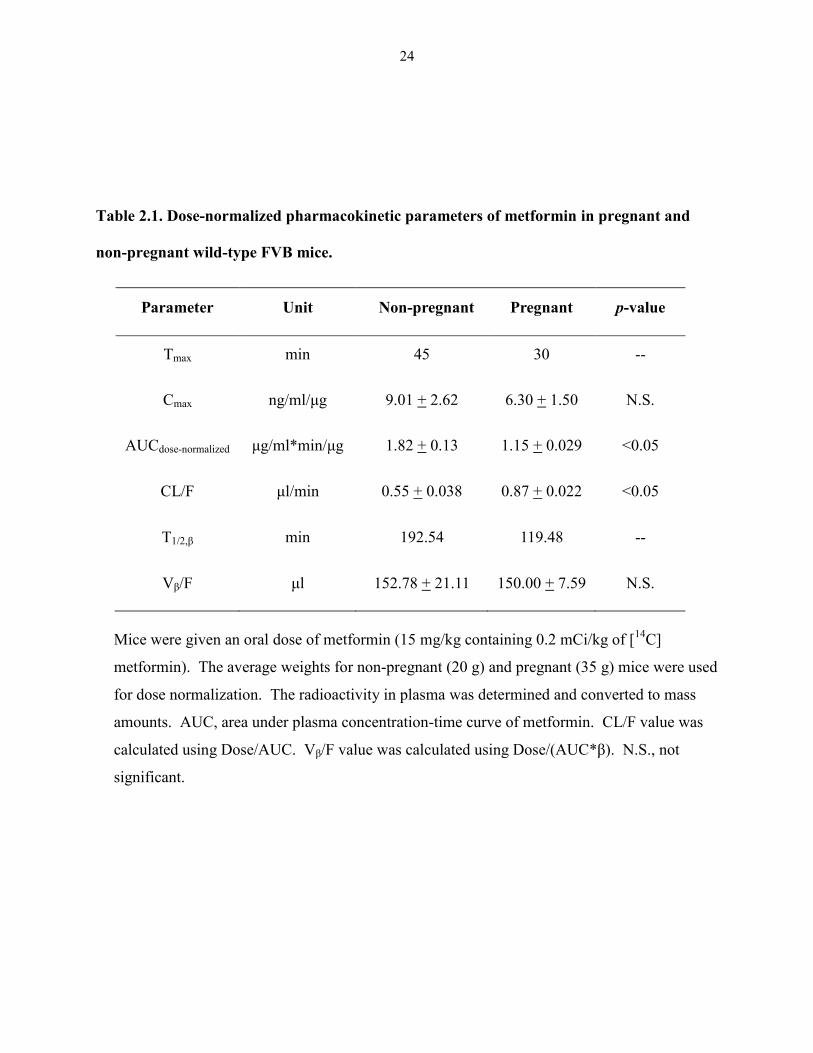
Pharmacokinetic parameters of metformin are summarized in Table 2.1. The dose normalized
AUC and Cmax in pregnant mice was 37% and 30% lower than those in non-pregnant mice,
respectively. The calculated oral clearance (Cl/F) in the pregnant mouse showed a 57% increase,
compared to the non-pregnant state. In contrast, the terminal half-life (T1/2, β) and oral volume of
distribution (Vβ /F) in pregnant and non-pregnant mice was not significantly different.

22
2.4. Discussion
In a recent clinical study performed by OPRU investigators at the University of
Washington, women were given 500 mg of metformin twice daily during their pregnancy and
postpartum, for therapeutic reasons that included preexisting diabetes, gestational diabetes, and
polycystic ovary syndrome (PCOS) (Eyal et al., 2010). When plasma steady-state PK
parameters were determined, metformin AUCs in early-, mid- and late-pregnancy were
respectively 33%, 37% and 29% lower than those postpartum (Eyal et al., 2010). Consequently,
the apparent oral clearances were increased by 57%, 76% and 38% in early, mid and late
pregnancy respectively (Eyal et al., 2010). The overall renal clearance was found be increased
by 26-71% throughout gestation (Eyal et al., 2010).
In the current study, the wild-type FVB pregnant mice at gd 19 showed a 37% decrease
in the dose normalized AUC and a 57% increase in oral clearance of metformin compared to the
non-pregnant mice. The magnitude of the changes in dose-normalized AUC and oral clearance
of metformin in the pregnant mice was found to be comparable to those in the pregnant women
receiving a standard dose of 500 mg. These data suggest that pregnancy has a similar effect on
plasma metformin PK in humans and mice. Due to technical challenges, we did not measure
renal clearance in the mouse study. However, similar to human, metformin is primarily
eliminated by the kidney via filtration and OCT/MATE mediated tubular secretion in mice.
Assuming no changes in oral bioavailability, the increased oral clearance of metformin during
mouse pregnancy most likely resulted from an increase in renal clearance of the drug.
Multiple polyspecific organic cation transporters are known to play important roles in
metformin tissue distribution and renal excretion, affecting metformin response in both humans
23
and mice. It is unknown whether these transporters are regulated in a similar manner during
human and mouse pregnancy. However, because our data showed that pregnancy has a similar
effect on plasma metformin PK in humans and mice, the mechanisms involved in metformin
disposition are likely to be similar and affected by pregnancy in a similar manner. Moreover, the
availability of mice with targeted deletion of individual organic cation transporters provides an
added strength for using this animal model to understand drug transport mechanisms in vivo.
Thus, the mouse may represent a valid animal model to study the effect of pregnancy on the
expression of various polyspecific organic cation transporters involved in metformin disposition
during pregnancy.
24
Table 2.1. Dose-normalized pharmacokinetic parameters of metformin in pregnant and
non-pregnant wild-type FVB mice.
Parameter Unit Non-pregnant Pregnant p-value
Tmax min 45 30 --
Cmax ng/ml/μg 9.01 + 2.62 6.30 + 1.50 N.S.
AUCdose-normalized μg/ml*min/μg 1.82 + 0.13 1.15 + 0.029 <0.05
CL/F μl/min 0.55 + 0.038 0.87 + 0.022 <0.05
T1/2,β min 192.54 119.48 --
Vβ/F μl 152.78 + 21.11 150.00 + 7.59 N.S.
Mice were given an oral dose of metformin (15 mg/kg containing 0.2 mCi/kg of [14
C]
metformin). The average weights for non-pregnant (20 g) and pregnant (35 g) mice were used
for dose normalization. The radioactivity in plasma was determined and converted to mass
amounts. AUC, area under plasma concentration-time curve of metformin. CL/F value was
calculated using Dose/AUC. Vβ/F value was calculated using Dose/(AUC*β). N.S., not
significant.

25
Figure 2.1. Dose-normalized plasma concentration-time profile of metformin in wild-type
FVB non-pregnant (□) and pregnant (■) mice. Pregnant mice at gd 19 and non-pregnant
(virgin) mice (8-10 weeks of age) were administered metformin (15 mg/kg metformin containing
0.2 mCi/kg of [14
C] labeled metformin) by oral gavage. Inset is the logarithmic plot. Data
represented as mean + S.D. (n=3-5 mice at each time point).
Non-pregnant
Pregnant
Time (min)
Me
tfo
rmin
co
nc
en
tra
tio
n
(ng
/ml/
ug
do
se
)
0 60 120
180
240
300
360
420
480
0
5
10
15
0 60 120
180
240
300
360
420
480
0.1
1
10
100

26
Chapter 3. Effect of gestational age on mRNA and protein expression of
polyspecific organic cation transporters during pregnancy
(This work was published in Drug Metabolism and Disposition 41(12): 2225-2232, 2013)
3.1. Introduction
Many drugs and toxins, such as metformin, histamine H2 receptor blockers, and 1-
methyl-4-phenylpyridinium (MPP+) and paraquat, are hydrophilic OCs that do not readily cross
cell membranes by passive diffusion. Polyspecific OC transporters play important roles in the
disposition, efficacy and toxicity of these cationic xenobiotics (Giacomini et al., 2010; Koepsell
et al., 2007; Wright and Dantzler, 2004). These transporters are also likely to be involved in
various physiological pathways through their action on endogenous bioactive amines (Giacomini
et al., 2010; Koepsell et al., 2007; Wright and Dantzler, 2004). Known polyspecific OC
transporters include the electrogenic organic cation transporters 1-3 (OCT1-3, SLC22A1-3), the
proton/cation antiporters termed as multidrug and toxin extrusion proteins 1-2 (MATE1/2,
SLC47A1/2), and the plasma membrane monoamine transporter (PMAT, SLC29A4). These
transporters have largely overlapping substrate specificities and frequently work in concert to
mediate transepithelial flux of OCs.
In humans, hOCT1 is predominantly expressed in the liver on the sinusoidal membrane
of hepatocytes, mediating OC uptake into the hepatocytes (Giacomini et al., 2010). hMATE1,
expressed at the canalicular membrane, further effluxes the OCs into the bile (Giacomini et al.,
2010). In the human kidney, hOCT2 is primarily expressed and localized to the basolateral
membrane of renal proximal tubular cells (Giacomini et al., 2010). hOCT2 concentrates OCs
into the proximal tubular cells, where OCs can be further excreted into the urine by hMATE1

27
and hMATE2-K at the apical membrane. The third member of the human OCT family, hOCT3,
is broadly distributed in tissues including placenta, skeletal muscle, heart, brain, kidney, liver,
lung, and intestine (Koepsell et al., 2007). hOCT3 has been implicated in the clearance of
endogenous monoamines, but could also be involved in transport of xenobiotic OCs. A new
polyspecific OC transporter, termed the plasma membrane monoamine transporter (PMAT), is
widely expressed in various tissues and has largely overlapping substrates and inhibitors with
those of OCTs (Engel and Wang, 2005; Engel et al., 2004). hPMAT has been implicated in
intestinal absorption of OCs (Zhou et al., 2007).
A number of medications used by pregnant women are substrates of the polyspecific OC
transporters. For example, metformin, a positively charged biguanide transported by hOCT1-3,
hMATE1/2, and hPMAT (Kimura et al., 2005; Nies et al., 2009; Tanihara et al., 2007; Zhou et
al., 2007), is used to treat gestational diabetes mellitus in pregnant women (Eyal et al., 2010;
Wensel, 2009). OCT1-mediated hepatic uptake of metformin is an important determinant of its
glucose lowering effect as liver is the primary target of metformin action (Shu et al., 2007).
Meanwhile, metformin is primarily eliminated by renal secretion via the OCT2/MATE1 pathway
(Chen et al., 2009; Tsuda et al., 2009a). Metformin has been shown to cross the placenta barrier
(Kovo et al., 2008), which most likely also involves specific OC transporters. Pregnant women
undergo extensive physiological and hormonal changes not experienced by non-pregnant
patients, making them unique with respect to drug therapy selection, dosage, efficacy and safety.
Medication used during pregnancy may also cross the placenta and potentially result in fetal
exposure and teratogenicity. Considerable data in the literature suggests that expression and
activity of important drug metabolizing enzymes (e.g., hepatic CYP3A4, CYP2D6, CYP2C9)
and transporters (e.g. placental P-gp and BCRP) are altered during pregnancy in a gestational

28
age-dependent manner (Hebert et al., 2008; Hodge and Tracy, 2007; Isoherranen and Thummel,
2013; Mathias et al., 2005). In a recent study performed by the Obstetric-fetal Pharmacology
Research Unit Network at the University of Washington, a significant gestational stage-
dependent change in metformin pharmacokinetics was seen during pregnancy (Eyal et al., 2010),
suggesting a possibility that the expression of OC transporters in organs important for metformin
disposition may be altered by pregnancy.
Little is known about the effect of pregnancy on the expression of polyspecific OC
transporters in various tissues. Although the effect of pregnancy on mRNA expression of drug
transporters has been analyzed in large scale microarray studies and/or in tissue-specific manners
in pregnant animal models (Shuster et al., 2013; Yacovino et al., 2013), comprehensive and
quantitative mRNA analysis of polyspecific OC transporters has not been performed.
Furthermore, few studies have quantified and compared the protein levels of OC transporters
between non-pregnant and pregnant states. In this study, we aim to investigate the effect of
pregnancy and gestational age on mRNA expression of polyspecific OC transporters in pregnant
mice and human placentas at various gestational stages. A quantitative liquid chromatography
coupled with tandem mass spectrometry (LC–MS/MS) proteomics was used to quantify
membrane expression of polyspecific OC transporter proteins in both mouse and human tissues.
3.2. Materials and methods
3.2.1. Animals and tissue harvest
Adult (8-10 weeks of age) wild-type FVB mice (Taconic) were housed in the specific
pathogen free (SPF) facility at the University of Washington. The animal studies were approved
29
by the Institutional Animal Care and Use committee (IACUC) of the University of Washington.
To obtain pregnant mice, timed mating was carried out. The date that a vaginal plug was
observed was assigned as gestational day 1. Pregnant mice were sacrificed by gassing with CO2.
The kidneys, livers and placentas from pregnant mice at gestational days (gd) 10, 15, and 19
(term in mice is ~20-21 days) were immediately dissected, collected, and flash-frozen in liquid
N2. Tissues were stored at -80°C until use. Tissues from age-matched virgin mice were used as
the non-pregnant control.
3.2.2. Human placenta source
The use of human placentae as biological specimens was approved by the Institutional
Review Board at the University of Washington. Human term placentae from normal pregnancy
were obtained from the Labor and Delivery Unit at the University of Washington. Normal first
trimester (week 6-12) and second trimester (week 13-25) placentae were provided by the Birth
Defects Research Laboratory at the University of Washington, which has Institutional Review
Board approval to collect and distribute normal and diseased conceptual tissues for research use.
All placental tissues were from healthy uncomplicated pregnancies and obtained from women
(70% Caucasians and 30% other ethnicity) aged 16-38 years. Upon collection, a placenta was
immediately snap frozen and stored at -80°C until use. The time interval from surgery or
delivery to tissue preparation did not exceed 60-90 min, in order to minimize RNA degradation.
3.2.3. RNA isolation, cDNA synthesis and quantitative real-time PCR assays
Total RNA was extracted from the tissues using Trizol reagent (Invitrogen, Inc) or
Qiagen Mini RNeasy kit according to the manufacturer’s instruction. RNA integrity and purity
30
were verified by gel electrophoresis and UV spectrophotometry. Total RNA (2 μg) was reverse
transcribed to first-strand cDNA using Superscript III reverse transcriptase (Invitrogen)
according to the manufacturer’s instructions and all cDNA samples were prepared in a final
volume of 100 μl. Taqman real-time PCR reagents, assay primers and probes for human
hOCT1-3 (SLC22A1-3), hMATE1 (SLC47A1), hPMAT (SLC29A4), hGUSB (beta
glucronidase), hGAPDH, mouse mOct1-3 (Slc22a1-3), mMate1-2 (Slc47a1-2), mPmat
(Slc29a4), mGusb, mGapdh (glyceraldehyde 3-phosphate dehydrogenase), and mbeta-actin were
purchased from Applied Biosystems. Taqman real-time PCR assays were carried out on an
Applied Biosystems 7900HT fast real-time PCR system as described previously (Duan and
Wang, 2010). To ensure the same amount of cDNA was loaded to the 96 well plates for the
qRT-PCR analysis, 5 μl from each cDNA sample, which contains 100 ng RNA-equivalent
cDNA, was added to the real-time reaction that contains 10 μl of 2X TaqMan Universal PCR
Master Mix (Applied Biosystems), and 1 μl of 20x primer/probe mix in a final volume of 20 μl.
Each sample was analyzed in duplicate or triplicate. To quantify the transcript numbers of genes
of interest, comparative Ct method was used (Zhang et al., 2008). The mRNA levels of each
tested gene was normalized to a house keeping gene according to the following formula: Ct (test
gene) - Ct (housekeeping genes) = ∆Ct. Thereafter, the relative mRNA levels of each gene was
calculated using the ∆∆Ct method: ∆Ct (test gene) -∆Ct (test gene in the calibrator) =∆∆Ct (test
gene). The fold changes of mRNA levels were represented as a relative expression 2-∆∆Ct
. For
greater precision of the mRNA quantification by quantitative real-time PCR (qRT-PCR),
expression of the commonly used house-keeping genes (mGusb, mbeta actin and mGapdh) were
first analyzed in tissues at various gestational stages. Ct values of the house-keeping genes in the

31
tissues were determined and compared across the pregnancy stages using Student’s t test. The
house-keeping gene that showed least variation was chosen for normalization of target genes.
3.2.4. Membrane protein preparation and quantification of transporters by LC-MS/MS
analysis
Total membrane proteins were prepared from mouse (kidney, liver and placenta) and
human (placenta) tissues using the Proteo Extract native membrane protein extraction kit
(Calbiochem) according to the manufacturer’s instructions. Total membrane protein
concentration was determined by a BCA protein assay kit (Pierce). The membrane fraction was
digested by trypsin as per conditions described before (Prasad et al., 2013). Briefly, the isolated
membrane proteins were denatured at 95°C, reduced with dithiothreitol and alkylated with
iodoacetamide in ammonium bicarbonate buffer. The protein samples were digested at 37°C for
24 h by trypsin and the reaction was quenched and spiked with the internal standard (IS) solution
and centrifuged at 5000 g for 5 min before analysis. Protein quantification was based on unique
signature peptides as surrogates for quantification of these transporters and the corresponding
isotopically ([13
C6;15
N4]-arginine or [13
C6,15
N2] lysine) labeled peptides as IS. Selected unique
signature peptides for these transporters are shown in Table 3.1. These peptides were selected
based on criteria previously described (Kamiie et al., 2008). Peptides with predicted
transmembrane regions, single nucleotide polymorphisms (SNPs), posttranslational
modifications or those susceptible to degradation were excluded. Continuous R and K
sequences, i.e., RR, RK, KR and KK, were excluded to avoid miscleavages. Other
characteristics, like stability and LC retention were also taken into consideration during peptide
selection. LC-MS/MS parameters were optimized to quantify selected peptides in the tissues
32
samples. The analysis was performed using Agilent 6460A triple-quadrupole mass spectrometer
coupled to Agilent 1290 Infinity LC system (Agilent Technologies, Santa Clara, CA) operated in
ESI positive ionization mode. Approximately 2 µg of the trypsin digest (5 µl of LC injection
volume) was injected onto the column (Kinetex™ 2.6 µm, C18, 100 x 3 mm, Phenomenex,
Torrance, CA). The LC flow rate was 0.4 ml/min, while two different mobile phase gradient
programs were used to quantify above transporters. For mOct1, mOct2 and mMate1, the
gradient program was: 97% A (water containing 0.1% v/v formic acid) and 3% B (acetonitrile
containing 0.1% v/v formic acid) held for 4 min, followed by three steps of linear gradient of
mobile phase B concentration of 3% to 12%, 12% to 25% and 25% to 30% over 4-8 min, 8-10
min and 10-14 min. This was followed by the washing step (90% mobile phase B) for 0.9 min,
and re-equilibration for 4.5 min. Similarly, for mOct3 and hOCT3, the gradient program was:
97% A and 3% B held for 4.5 min, followed by two steps of linear gradient of mobile phase B
concentration of 3% to 18% and 18% to 24% over 4.5-7.5 min and 7.5-11.5 min. This was
followed by the washing step (80% mobile phase B) for 1 min, and re-equilibration for 5 min.
The doubly charged parent to singly charged product transitions for the analyte peptides and their
respective stable isotope labeled peptides were monitored using optimized MS/MS parameters
(Table 3.1). The data were processed by integration of the peak areas generated from the
reconstructed ion chromatograms for the analyte peptides and their respective IS using the
MassHunter software (Agilent Technologies, Santa Clara, CA). For data analysis, peak response
of multiple reaction monitoring (MRM) transitions from each peptide was averaged and the area
ratio of analyte peptide versus IS peptide was obtained. Relative protein expression of individual
OC transporters was presented as the area ratio of analyte peptide over IS peptide normalized by
the total membrane protein amount in the injected tryptic digests. For absolute quantification of

33
hOCT3 in human placenta, the non-labeled signature peptide was synthesized as a calibrator.
The amount of hOCT3 protein was calculated from the standard curve obtained from the
quantitative data generated with the calibrator peptide.
3.2.5. Data analysis
For each mRNA or protein expression data point, data were obtained from mouse tissues
from 3-6 animals and expressed as mean + S.D. Statistical significance in the expression in
various mouse tissues was determined by unpaired Student’s t test (GraphPad Prism 5.04, La
Jolla, CA). The mRNA and protein expression were correlated using a linear regression, and the
corresponding r2 and p values were calculated. Expression data in human placentas was obtained
from 6-16 placenta tissues per gestational stage. Due to the small sample size for each group,
difference in the human placental expression was determined by a nonparametric method, Mann-
Whitney U test (GraphPad Prism 5.04, La Jolla, CA). A p-value less than 0.05 was considered
statistically significant.
3.3. Results
3.3.1. Fluctuation of house-keeping genes in various tissues during pregnancy
For greater precision of the mRNA quantification by qRT-PCR, we first determined the
absolute Ct values for the house keeping genes in mouse kidney and liver from non-pregnant and
pregnant mice at gd 10, 15 and 19 (Figure 3.1). The data showed that in the kidney mGusb
expression was not affected by pregnancy and therefore was used for normalization for kidney
expression. In the liver, mGapdh and mbeta actin were relatively stable and we used mGapdh
for normalization. In human and mouse placentas, hGUSB/mGusb and hGAPDH/mGapdh were

34
both stable across gestational ages (data not shown). hGUSB for human placenta and either
mGusb or mGapdh for mouse placenta were used for data normalization.
3.3.2. mRNA quantification of renal and hepatic mOct and mMate transporters in non-
pregnant and pregnant mice at different gestational ages
Mice with timed pregnancies were used to investigate the influence of pregnancy and
gestational age on OC transporter expression in the kidney and liver. It is not feasible to gather
the same tissues from a human pregnancy. While many of the functional characteristics and
tissue-distribution patterns of OC transporters are conserved between humans and rodents, there
are also some species differences. Most notably, the human kidney predominantly expresses
hOCT2 whereas both mOct1 and mOct2 are expressed in the rodent kidneys (Koepsell et al.,
2007). In addition, the human kidney expresses both hMATE1 and hMATE2-K whereas mouse
kidney expresses mMate1 only (Lickteig et al., 2008). As expected, qRT-PCR results showed
that mOct1, mOct2 and mMate1 were highly expressed in the kidneys from non-pregnant and
pregnant mice (Fig. 3.2A). In contrast, no significant expression was observed for mOct3,
mMate2 or mPmat. There was no significant difference in renal mOct1 mRNA expression
between non-pregnant and pregnant mice at gd 10, 15 and 19 (Fig. 3.2A). A trend of slight
decrease in renal mOct2 mRNA expression was observed during pregnancy, but the decrease
only became statistically significant (p < 0.05) at gd 10. A small but significant decrease (~
30%) in renal mMate1 mRNA expression was observed at gd 10 and 15 (Fig. 3.2A).
In the mouse liver, mOct1 and mMate1 mRNA was highly expressed; whereas mRNA
expression of other transporters (mOct2, mOct3, mMate2 and mPmat) was minimal or
undetectable. Compared to non-pregnant mice, there were slight decreases in hepatic expression
35
of mOct1 mRNA at all three stages of pregnancy, but only the decrease at gd 15 (equivalent to
the end of the second trimester in humans) was statistically significant (Fig. 3.2B). No
significant change was observed in hepatic mMate1 mRNA expression from the pregnant mice
as compared to the non-pregnant mice.
3.3.3. Protein quantification of renal and hepatic mOct and mMate transporters in non-
pregnant and pregnant mice at different gestational ages
Next we used a novel LC-MS/MS targeted proteomics approach to determine the
influence of pregnancy on renal and hepatic expression of mOct1, mOct2 and mMate1 proteins.
Relative protein expression of each individual mouse OC transporters was measured across
gestational age using transporter unique signature peptides (Table 3.1) and LC-MS/MS as
detailed in Materials and Methods section. As shown in Fig. 3.2C, a marginal reduction in
mOct1 and mOct2 proteins was observed in pregnant mouse kidneys, with gd 15 showing the
most significant decrease. Notably, renal mMate1 protein expression showed 22%, 36% and
29% decrease at gd 10, 15 and 19 respectively. In the mouse liver, expression of Oct2 protein
was negligible (Fig. 3.2D). mOct1 protein showed a minimal (10-15%) decrease at gd 15 and
gd 19 whereas Mate1 protein expression was not affected by pregnancy (Fig. 3.2D). The overall
impact of pregnancy on the expression of mOct and mMate proteins was consistent with mRNA
expression of individual transporters during pregnancy (Fig. 3.2).
3.3.4. mRNA expression pattern of OC transporters in human and mouse placenta
Previous studies suggested a high expression of hOCT3/mOct3 in the placenta (Kekuda
et al., 1998; Sata et al., 2005). However, the quantitative expression of other OC transporters in

36
the placenta has not been thoroughly investigated. Here, our qRT-PCR data showed that hOCT3
is expressed at a much greater level (> 30-fold) than any other OC transporters (Fig. 3.3A).
Similar expression pattern was also observed in late stage (gd 19) mouse placenta (Fig. 3.3B).
Together, these data clearly demonstrated that in both humans and mice, hOCT3/mOct3 is the
predominant polyspecific OC transporter expressed in term or near term placentas.
3.3.5. mOct3 mRNA and protein expression in mouse placenta at various gestational stages
The above study confirmed that mOct3 is the predominant polyspecific OC transporter in
the mouse placenta. We next investigated whether placental mRNA expression levels of mOct3
change with gestational stages. The mRNA expressions of placental mOct3 at gd 15 and 19
were respectively 37-fold and 46-fold greater than that at gd 10 (Fig. 3.4A). Consistently, much
stronger bands were observed at gd 15 and 19 when mOct3 transcripts were amplified from the
mouse placentas by semi-quantitative PCR, (Fig. 3.4A). We then quantified the relative
expression of mOct3 protein using LC-MS/MS. In agreement with the mRNA expression
results, protein expressions of mOct3 at gd 15 and 19 were increased by 56- and 128-fold
respectively (Fig 3B). The mOct3 mRNA expression at gd 19 appeared slightly higher than that
at gd 15, but the difference was not statistically significant (Fig 3.4A). However, mOct3 protein
expression at gd 19 was significantly higher than that at gd15 (Fig 3.4B). These data suggest
that expression of the mOct3 gene in the mouse placenta is gestational-age dependent, and the
expression of mOct3 mRNA and protein is greatly increased after gd 10 and reaches maximum
at mid-to-late pregnancy. In addition to mOct3, we also examined the protein expression of
mMate1 in the mouse placentas at gd 10, 15 and 19. Consistent with the mMate1 mRNA
expression in mouse placenta at gd 19 (Fig 3.3B), there was no detectable mMate1 protein

37
expression in any of the placenta samples at all gestational ages (data not shown), further
supporting that OCT3 protein is the major OC transporter in the placenta.
3.3.6. hOCT3 mRNA and protein expression in human placenta at different trimesters
The influence of gestational age on hOCT3 mRNA and protein expression in human
placentas was measured in first trimester (T1, n=11), second trimester (T2, n=16), and term
(n=6) placentas from normal uncomplicated pregnancies. To eliminate potential regional
differences in hOCT3 mRNA expression, tissues from the outer surface (villus parenchyma) of
the placenta were used in the study, as preliminary analysis showed little regional variation in
hOCT3 mRNA expression in this area (data not shown). Different from the mouse, hOCT3
mRNA expression in human placentas did not show a significant increase in mid and late
pregnancy (Fig. 3.5A), although there appeared a slight increase in hOCT3 mRNA expression in
T2 placentas as compared to T1. A large inter-individual variability (> 20 fold) of hOCT3
mRNA expression was found in the placentas, especially those from T1 and T2 trimesters (Table
3.2). We then quantified the absolute amount of hOCT3 protein by LC-MS/MS in six randomly
chosen placenta samples at each gestational age. The mean hOCT3 protein in T1, T2 and term
placentas was quantified and found to be 0.23 + 0.033, 0.38 + 0.072 and 0.36 + 0.099 fmol/μg
membrane protein respectively (Fig. 3.5B and Table 3.2). Compared to T1, hOCT3 protein
levels showed ~65% and 56% increase at T2 and term respectively. In contrast to the large inter-
individual variability in hOCT3 mRNA levels, a smaller variability (< 3 fold) was observed for
hOCT3 protein in the human placenta samples. When comparative analysis was performed,
protein levels were positively correlated with mRNA levels (Fig. 3.5C). However, the

38
correlation between hOCT3 mRNA and protein levels was weak, with an r2 value of 0.21.
Moreover, the slope deviated significantly from zero, with a p value of 0.049.
3.4. Discussion
This study evaluated the effects of pregnancy on mRNA and protein expression of
polyspecific OC transporters in the kidney, liver and placenta, organs that are important for
maternal disposition and fetal exposure to OC drugs. Since livers and kidneys of pregnant
women are unavailable for gene analysis, we used a mouse model with timed pregnancies for our
study. The gestational ages (gd 10, 15, 19) selected in this study represent critical times for
placental and fetal development, and have been previously used to mimic the early, middle and
late stages in human pregnancy (Wang et al., 2006; Zhang et al., 2008). For placenta, both
human and mouse tissues at various gestational stages were analyzed and compared.
Our study showed that mRNA and protein expressions of mOct1 and mOct2 in the mouse
kidney are marginally affected by pregnancy (Fig. 3.2A and 3.2C). Similarly, hepatic expression
of mOct1 and mMate1 mRNA and protein is also minimally affected by pregnancy (Fig. 3.2B
and 3.2D). However, in the kidney, mMate1 mRNA and protein expressions significantly
declined by 20-40% throughout pregnancy with maximum down-regulation of mMate1
membrane protein observed at mid pregnancy (Fig. 3.2C). Our results are consistent with a
recent report that also showed a down-regulation of renal apical drug efflux transporters (Mrp2,
Mrp4, Mate1) in pregnant mice (Yacovino et al., 2013). The down-regulation of apical drug
efflux transporters is anticipated to result in a reduced tubular secretory capacity during
pregnancy. In addition, the significant down-regulation of apical efflux transporter (i.e. Mate1)

39
accompanied by less changes in the basolateral uptake transporters (i.e. Oct1/2) during
pregnancy may, theoretically, lead to renal drug accumulation and increased risk of
nephrotoxicity. These findings are somewhat counterintuitive, as urinary excretion of
xenobiotics is generally enhanced during pregnancy in humans and rodents. We previously
reported that metformin renal clearance increased significantly in mid- and late pregnancy as
compared to postpartum (Eyal et al., 2010). Since we did not see an increase in Oct or Mate
renal expression, altered renal expression of OC transporters may not be the reason underlying
the observed increase in renal clearance of metformin during pregnancy. Other pregnancy-
associated changes, such as elevations in renal blood flow and glomerular filtration, may
contribute to the increased total renal clearance of metformin in pregnancy. However, it should
be noted that since our study was conducted in mice, we cannot exclude the possibility that
expression of hOCT2, hMATE1/2-K in the kidney is uniquely affected by human pregnancy.
Although OCT3/Oct3 is known for its high expression in placenta (Kekuda et al., 1998;
Sata et al., 2005), the presence of other OC transporters in the placenta has been less well
studied. Previous northern analysis found no expression of hMATE1 in the human placenta
(Otsuka et al., 2005) whereas a high level of rMate1 expression was reported in the rat placenta
(Ahmadimoghaddam et al., 2012; Terada et al., 2006). Here, we comprehensively analyzed the
expression profiles of OCT1-3, MATE1-2 and PMAT in the same placental tissues obtained
from healthy term human placenta and in mouse placenta at gd 19. Our data clearly showed that
OCT3 is the predominant OC transporter expressed in the human and mouse placentas (Fig. 3.3).
Previous membrane vesicle and immunostaining studies suggested a basal membrane
localization of OCT3/Oct3 proteins in human and rat placentas (Ahmadimoghaddam et al., 2012;
Sata et al., 2005). The precise role of OCT3 in OC transport at the placental barrier is presently

40
unclear. When pregnant Oct3-null mice were given intravenous MPP+, a model substrate for all
OC transporters, a significant reduction in MPP+ accumulation was observed in homozygous
Oct3-/-
embryos (Zwart et al., 2001b), suggesting that mOct3 mediates maternal-to-fetal OC
transport. In contrast, Ahmadimoghaddam et al. showed high expression of rMate1in rat
placenta and suggested that rOct3 and rMate1 work together to sequentially mediate fetal-to-
maternal transport of MPP+ (Ahmadimoghaddam et al., 2012). Here, we found that
MATE1/Mate1 mRNA and protein are minimally expressed in mouse and human placentas (Fig.
3.3), which challenges an OCT3/MATE tandem transport model in these species. Clearly, more
work is needed to elucidate OC transport mechanisms at the human placental barrier.
Recent studies showed that the placental expression of drug efflux transporters (e.g. P-gp,
BCRP) change with gestational age, which may influence fetal drug exposure in a gestational-
age dependent manner (Zhang et al., 2008; Zhou et al., 2008). Our data showed that mOct3
mRNA in mouse placenta at gd 15 and 19 was more than 35-fold higher than that seen at gd 10
(Fig. 3.4A). This apparent activation of mOct3 mRNA transcription in mouse placenta between
early and mid pregnancy was also previously noticed by other investigators (Shuster et al., 2013;
Zwart et al., 2001b). Using LC-MS/MS, we further showed that mOct3 protein levels in the
mouse placenta also increased dramatically at gd 15 and 19 (Fig. 3.4B). Interestingly, such a
dramatic change was not observed for hOCT3 in human placenta (Fig. 3.5). Despite a large
inter-individual variation of mRNA levels, the mean hOCT3 mRNA expression did not show a
gestational age-dependent change (Fig. 3.5A). When the absolute amount of protein was
quantified, T2 and term human placenta only showed a moderate increase in hOCT3 protein
(Fig. 3.5B). Together our data suggest while human and mouse term placenta share a similar
expression pattern of polyspecific OC transporters and predominantly express OCT3/Oct3,
41
placental expression of the mouse mOct3 gene is regulated by gestational age and is
transcriptionally activated after gd 10. Recently, the absolute membrane protein levels of drug
transporters have been determined in several human tissues, especially the liver (Ohtsuki et al.,
2012; Prasad et al., 2013; Uchida et al., 2011). The protein levels for the well-established drug
transporters hOCT1, hMATE1, P-gp and BCRP in the human liver ranged from 0.14 to 7.35
fmol/μg by the LC-MS/MS method (Ohtsuki et al., 2012; Prasad et al., 2013). The hOCT3
protein amount in the human placenta determined in this study was 0.2-0.4 fmol/μg membrane
protein. This value is comparable to those reported for the hepatic drug transporters. However,
our absolute quantification of hOCT3 protein was performed using a single target peptide. We
acknowledge that protein quantification by the LC-MS/MS method can be peptide-dependent, as
variability in trypsin digestion might result in different protein yield when quantified using
different target peptides. Nevertheless, this is the first report for absolute protein quantification
for a human placental drug transporter by LC-MS/MS to our knowledge. Since it is more costly
and time-consuming to measure absolute protein amount, only relative protein expression was
performed for mOct1, mOct2, mOct3 and mMate1. While informative on pregnancy-induced
changes in protein expression of a specific transporter, in the absence of authentic full-length
protein standards, this value may not be used quantitatively for cross-comparison between
different transporters, due to the peptide-dependent nature of the LC-MS/MS method.
Levels of mRNA expression have been widely used as a surrogate for protein expression
or activity in biological samples. In this study, the overall patterns of OC transporter mRNA
expression are generally consistent with their protein expression, especially in various mouse
tissues that are collected and processed under highly controlled conditions. Transporters that
were not detectable at the mRNA level were also not detected at the protein level (Figures 3.2

42
and 3.4). In human placenta, we observed a trend of increase of hOCT3 protein with its mRNA
levels. However, the correlation between hOCT3 mRNA and protein levels was relatively weak
(Fig. 3.5C). Poor correlations were also reported for other drug transporters in the human liver
(Ohtsuki et al., 2012). A closer examination of Figure 4 revealed that the weak correlation can
be traced down to a large variability (> 20 fold) in mRNA levels but a relatively small (< 3 fold)
variability in hOCT3 protein levels in the human placenta samples. This may reflect the fact that
proteins are more stable, whereas mRNAs are more prone to degradation during human sample
preparation. mRNA instability could lead to noise in the correlation analysis. In addition, poor
correlations might be due to the fact that mRNA is extracted from total lysate of tissue whereas
protein is isolated plasma membrane fraction, as previously suggested (Ohtsuki et al., 2012).
In summary, we have determined the impact of pregnancy on mRNA and protein
expression of polyspecific OC transporters in kidney, liver, and placenta. In mice, pregnancy has
a marginal effect on renal expression of mOct1/2, but reduces mMate1 mRNA and protein
expression by 20-40%. Hepatic expression of mOct1 and mMate1 were minimally affected by
pregnancy. In the placenta, OCT3/Oct3 was the predominant isoform expressed in both human
and mouse placentae. Oct3 expression in mouse placenta was gestational age-dependent and its
expression is activated between early and mid-pregnancy. In contrast, expression of hOCT3 was
high even in early stage human placenta, and hOCT3 protein only showed a moderate increase in
second trimester and term placentas. Together, our studies provide new insights into the effect
of pregnancy on the expression of polyspecific OC transporters and supported an important role
of OCT3 in OC transport at the magternal-fetal interface.

43
Table 3.1. Optimized MS/MS parameters of proteotypic peptides selected for targeted
analysis of mOct1, mOct2, mOct3, mMate1 and hOCT3.
Transporter Peptide Precursor
Ion
Product
Ions Fragmentor
Collision
Energy
mOct1 GVALPETIEEAENLGR 849.5 1357.7 160 20
849.5 679.3 160 20
mOct1 (IS) GVALPETIEEAENLGR 854.5 1367.7 160 20
854.5 684.3 160 20
mOct2 LNPSFLDLVR 587.3 228.13 140 15
587.3 946.54 140 15
mOct2 (IS) LNPSFLDLVR 592.34 956.54 140 15
592.34 228.13 140 15
mMate1 TEESAPGPGGADAASER 801.4 1084.5 160 18
801.4 542.7 160 18
mMate1 (IS) TEESAPGPGGADAASER 806.4 1094.5 160 18
806.4 547.8 160 18
mOct3 GIALPETVEDVEK 700.4 1158.6 140 16
700.4 1045.5 140 16
700.4 579.8 140 18
mOct3 (IS) GIALPETVDDVEK 697.5 1039.3 140 16
hOCT3 GIALPETVDDVEK 693.5 1031.3 140 16
693.5 516.1 140 18
693.5 355.1 140 13
hOCT3 (IS) GIALPETVDDVEK 697.5 1039.3 140 16
IS = internal standard; arginine-13
C6,15
N4 and lysine13
C6,15
N2 labeled residues are shown in bold and italic.
Because mouse and human Oct3/OCT3 surrogate peptides showed similar characteristics, single IS was
used for both transporters.

44
Figure 3.1. Ct values of different housekeeping genes in kidney and liver from pregnant
mice at different gestational ages. The results represent mean + S.D for 3-6 mice at different
gestational ages. Ct value of mGusb in mouse liver at gd 10 was not determined. * indicates a
significant difference from the Ct values of non-pregnant mice (p <0.05).
Kidney
Ct
valu
e
mGusb
mbet
a ac
tin
mGap
dh
16
18
20
22
24
26Non-pregnant
gd 10
gd 15
gd 19
A
*
*
Liver
Ct
valu
e
mGusb
mbet
a ac
tin
mGap
dh
16
18
20
22
24
26 Non-pregnant
gd 10
gd 15
gd 19
B
*

45
Figure 3.2. mRNA and protein expression of mouse OC transporters in kidney (A and C)
and liver (B and D) at different gestational ages. Total RNA isolated from the kidneys and
livers of non-pregnant (virgin) and pregnant mice at gd 10, 15 and 19 was reverse transcribed
and mRNA levels of six OC transporters were determined by qRT-PCR. Relative protein
expression of individual transporters across different gestational age was measured in the
membrane protein prepared from kidney and liver using LC-MS/MS. The mRNA expression is
normalized to mGusb in kidney and to mGapdh in liver. Data are expressed as mean + S.D from
3-6 mice at each gestational age. * indicates a significant difference from the expression at non-
pregnant state (p <0.05).
Kidney
Re
lati
ve
mR
NA
exp
res
sio
n
no
rmalize
d t
o m
Gu
sb
mOct
1
mOct
2
mOct
3
mM
ate1
mM
ate2
mPm
at0
100
200
300
400
500
600Non-pregnantgd 10
gd 15
gd 19
A
** *
Liver
Re
lati
ve
mR
NA
exp
res
sio
n
no
rmalize
d t
o m
Gap
dh
mOct
1
mOct
2
mOct
3
mM
ate1
mM
ate2
mPm
at0
50
100
150
200
250Non-pregnantgd 10
gd 15
gd 19
B
*
Kidney
Re
lati
ve
pro
tein
exp
res
sio
n
mOct
1
mOct
2
mM
ate1
0.00
0.05
0.10
0.15
gd 15
Non-pregnantgd 10
gd 19
C
*
**
** *
* *
Liver
Re
lati
ve
pro
tein
exp
res
sio
n
mOct
1
mOct
2
mM
ate1
0.00
0.01
0.02
0.03Non-pregnantgd 10
gd 15
gd 19
D
* **

46
Figure 3.3. mRNA expression of various OC transporters in human term placenta (A) and
mouse placenta at gd 19 (B). Total RNA was isolated from human term placentas (n=6) and
mouse placentas at gd 19 (n=3). cDNA was synthesized by reverse transcriptase, and mRNA
levels of hOCT1-3/mOct1-3, hMATE1/2/mMate1/2, and hPMAT/mPmat were determined by
qRT-PCR. The results were normalized to hGUSB or mGusb and represent mean + S.D.
Human term placenta
Re
lati
ve
mR
NA
exp
res
sio
n
no
rmalize
d t
o h
GU
SB
hOCT1
hOCT2
hOCT3
hMATE1
hMATE2
hPMAT
0
20
40
60
A
Mouse placenta at gd 19
Re
lati
ve
mR
NA
exp
res
sio
n
no
rmalize
d t
o m
Gu
sb
mOct
1
mOct
2
mOct
3
mM
ate1
mM
ate2
mPm
at0
500
1000
1500
B

47
Figure 3.4. mOct3 mRNA and protein expression in mouse placenta at different gestational
ages. Total RNA isolated from the placenta of non-pregnant (virgin) and pregnant mice at gd 10,
15 and 19 was reverse transcribed and mRNA levels of Oct3 were determined by semi-
quantitative reverse transcriptase PCR and qRT-PCR (A). Relative protein expression of mOct3
in isolated membrane protein of mouse placentas was measured using LC-MS/MS (B). The
mRNA levels determined by qRT-PCR were normalized to mGapdh. Data are mean + S.D (n=3
per group). * indicates a significant difference from the expression at gd 10 (p <0.05).
Re
lati
ve
mO
ct3
mR
NA
exp
res
sio
n
no
rmalize
d t
o m
Gap
dh
gd 10
gd 15
gd 19
0
10
20
30
40
*
*
Mouse placenta
A
Re
lati
ve
mO
ct3
pro
tein
exp
res
sio
n
gd 10
gd 15
gd 19
0.0
0.5
1.0
1.5
2.0
2.5Mouse placenta
*
*
B
| | mOct3
mGapdh

48
Figure 3.5. Quantification of hOCT3 mRNA (A) and protein (B) in human placentas at
different gestational stages and correlation analysis of mRNA and protein expression (C).
Total RNA was isolated from first trimester (T1, n=11), second trimester (T2, n=16) and term
(n=6) placentas, and mRNA levels were determined by qRT-PCR and normalized to hGUSB.
Membrane protein was isolated from T1, T2 and term placentas (n=6 for each gestation age
placenta). hOCT3 protein levels were quantified using a LC-MS/MS method. Each data point
represents an individual placenta. mRNA and protein expression of hOCT3 were correlated
using linear regression.
Re
lati
ve
hO
CT
3 m
RN
Ae
xp
res
sio
n
no
rmalize
d t
o h
GU
SB
T1 T2
Term
0
50
100
150
A Human placenta
hO
CT
3 p
rote
in e
xp
res
sio
n
(fm
ol/
g o
f m
em
bra
ne
pro
tein
)
T1 T2
Term
0.0
0.2
0.4
0.6* *
BHuman placenta
hOCT3 mRNA expression
hO
CT
3 p
rote
in e
xp
res
sio
n
0 50 100 150
0.0
0.2
0.4
0.6r2= 0.21
C

49
Table 3.2. hOCT3 mRNA and protein quantification in human placentas from first,
second trimesters and at term. Data are expressed as mean + S.D. Difference in the human
placental expression was determined by nonparametric Mann-Whitney U test. * indicates a
significant difference from the expression at T1 (p <0.05).
Gestational
Age
hOCT3 Transcript Expression
mRNA/GUSB (arbitrary unit)
hOCT3 Protein Quantification
(fmol/ μg membrane protein)
Mean + S.D Range Mean + S.D Range
T1 36.79 + 17.82
(n=11)
5.81 – 63.41
0.23 + 0.033
(n=6)
0.18 – 0.26
T2 58.93 + 33.22
(n=16)
21.20 – 137.40
0.38 + 0.072*
(n=6)
0.25 – 0.48
Term 38.57 + 13.49
(n=6)
26.23 – 64.32
0.36 + 0.099*
(n=6)
0.18 – 0.47

50
Chapter 4. Taste of pill: Organic cation transporter 3 mediates salivary
gland accumulation of metformin
4.1. Introduction
Many medications, including antihypertensives, antidiabetics, antimicrobials and
antidepressants, have the potential to adversely influence a patient's sense of taste and smell. In
some cases, drug-induced chemosensory disturbances are persistent and cannot be quickly
reversed by drug cessation. Taste-related adverse effects can significantly impact patient's
quality of life, dietary choices, appetite, emotional state and compliance with medication
regimens.
One medication that causes taste disturbance is metformin, a first line oral hypoglycemic
widely prescribed for the treatment of type 2 diabetes mellitus (Hundal and Inzucchi, 2003; Lord
et al., 2003; Wensel, 2009). As the prevalence of obesity and diabetes increases worldwide,
metformin use also increases and has recently made it to the list of top 15 prescribed drugs in the
US. Metformin acts as an insulin sensitizer and lowers blood glucose levels by suppressing
hepatic gluconeogenesis, reducing intestinal glucose absorption, and stimulating glucose uptake
and utilization in skeletal muscle and adipose tissues (Hundal and Inzucchi, 2003). The
glycemic response to metformin is variable, with some patients responding extremely well
whereas others showing no benefit (Inzucchi, 2002). The drug rarely causes lactic acidosis and
has minimal risk of inducing hypoglycemia. The most common adverse effects of metformin are
gastrointestinal in nature, including diarrhea, nausea, abdominal pain, taste disturbance and loss
of appetite (Melchior and Jaber, 1996; Zolk, 2012). In particular, patients taking metformin

51
frequently complain of metallic and bitter taste in the mouth, which interferes with their normal
sensation of food and quality of life.
The taste disturbance induced by metformin appears to result from a low but persistent
secretion of the drug into the saliva which continually bathes the taste buds and receptors located
on the upper surface of the tongue, soft palate, and upper esophagus. After a single oral or
intravenous dose in man, metformin is easily detectable in the saliva (Pentikainen et al., 1979).
The concentration of metformin in the saliva is considerably lower than that in the blood but
declines much more slowly (Pentikainen et al., 1979). Animal studies further revealed that after
metformin administration the drug is highly accumulated in salivary glands (Wilcock and Bailey,
1994). .
In this Chapter, we report that OCT3/Oct3 (SLC22A3/Slc22a3), a member of the
polyspecific organic cation transporter family, is responsible for the high accumulation of
metformin in the salivary glands and might underly its adverse taste disturbance. We also show
that OCT3/Oct3 impacts metformin pharmacokinetics and influence its distribution into other
peripheral tissues including sites of metformin action. Together, our studies uncovered a unique
molecular mechanism underlying drug-induced taste disturbance and identified an additional
genetic factor that may contribute to variable disposition and response to a first line treatment
drug for type 2 diabetes.
4.2. Methods and materials
4.2.1. Animals

52
The Oct3 (Slc22a3) null mice of the FVB inbred strain (Zwart et al., 2001b) were
developed by Dr. Denise Barlow at the University of Vienna and maintained by Dr. Alfred
Schinkel of the Netherlands Cancer Institute. After re-derivation in the Charles River
Laboratories, a colony of Oct3-/-
and wild type (Oct3+/+
) inbred FVB mice were kindly provided
to us by Dr. John Markowitz at the University of Florida with the consent of Dr. Schinkel. These
mice were housed in the specific pathogen free (SPF) facility at the University of Washington.
All animal studies were approved by the Institutional Animal Care and Use Committee (IACUC)
at the University of Washington.
4.2.2. Human salivary glands
Human salivary gland total RNA (Clontech, Mountain View, CA), pooled from 24 male
and female Caucasians with age of 16-60, was used for real-time PCR analysis. For
immunostaining and protein quantification studies, freshly frozen salivary gland tissue, including
parotid, submandibular, and subligual glands, from a single healthy female donor (age 30) with
no medical history was provided to us by National Disease Resource Interchange (NDRI).
4.2.3. RNA preparation and real-time PCR
For mRNA expression, 10-12 week old female Oct3 +/+ and Oct3 -/- mice were used
(n=4). Liver, kidney, small intestine, heart, salivary gland, and skeletal muscle were collected
and the tissues were flash-frozen in liquid N2 and stored at -80°C until use.
Total RNA was extracted from mouse and human tissues using Trizol reagent
(Invitrogen, Inc) or Qiagen Mini RNeasy Kit according to the manufacturer’s instructions. RNA
integrity and purity were verified by gel electrophoresis and UV spectrophotometer. Mouse and
53
human total RNA (1-2 μg) was reverse transcribed to first-strand cDNA using Superscript III
reverse transcriptase (Invitrogen) according to the manufacturer’s instructions. Taqman real-
time PCR reagents, assay primers and probes for human and mouse OCT1/Oct1
(SLC22A1/Slc22a21), hOCT2/mOct2 (SLC22A2/Slc22a2), hOCT3/mOct3 (SLC22A3/Slc22a3),
hMATE1/mMate1 (SLC47A1/Slc47a1), hPMAT/mPmat (SLC29A4/Slc29a4), and
hGUSB/mGusb (beta glucuronidase), were purchased from Applied Biosystems (Foster City,
CA). Taqman real-time PCR assays were carried out according to the manufacturer’s protocols
on an Applied Biosystems 7900HT fast real-time PCR system. The real-time reaction contained
10 μl of 2X TaqMan Universal PCR Master Mix (Applied Biosystems), 20 ng of RNA-
equivalent cDNA, and 1 μl of 20x primer/probe mix in a final volume of 20 μl. Each sample was
analyzed in triplicate. To quantify the transcript numbers of genes of interest, the comparative
CT method was used (Zhang et al., 2008). The mRNA levels of each test gene was normalized
to hGUSB/mGusb, according to the following formula: CT (test gene) - CT (mGusb) = ∆CT.
Thereafter, the relative mRNA levels of each gene was calculated using the ∆∆CT method: ∆CT
(test gene) -∆CT (test gene in the calibrator) =∆∆CT (test gene). The fold changes of mRNA
levels were represented as a relative expression 2-∆∆CT
.
4.2.4. Drug uptake in hOCT3 expressing cells
Human OCT3-expressing HEK cells (Flp-In-293) were previously generated (Duan and
Wang, 2010). Cells were maintained in D-MEM media containing 10% fetal bovine serum, 1%
L-Glutamine, 1% penicillin/streptomycin, and hygromycin B (150 μg/ml) at 37 ˚C in 5% CO2
and 95% humidity. Cells were seeded in 24-well plates and allowed to grow for 2-3 days.
Growth medium was aspirated and each well was rinsed with Krebs-Rinber-Henseleit (KRH)
54
buffer (5.6 mM glucose, 125 mM NaCl, 4.8 mM KCl, 1.2 mM KH2PO4, 1.2 mM CaCl2, 1.2 mM
MgSO4, and 25 mM HEPES), and preincubated in KRH buffer for 15 min at 37˚C and pH 7.4.
Transport was started by the addition of [14
C] labeled metformin (Moravek Biochemicals and
Radiochemicals, Brea, CA) and terminated by washing the cells three times with ice-cold KRH
buffer. Cells were then solubilized with 1N NaOH, and neutralized with 1 N HCl. Radioactivity
was quantified by liquid scintillation counting, and the protein content was measured using BCA
protein assay kit (Pierce). Time-dependant uptake was carried out with 10 μM of metformin to
identify initial rate period and verify the linear range uptake of metformin. Then, 4-5 min uptake
was chosen, and kinetic studies were performed with various concentrations of metformin.
Specific uptake activity was calculated by subtracting the uptake in the pcDNA5 vector
transfected cells. Using GraphPad Prism (version 5: GraphPad Software, La Jolla, CA), the
kinetic parameters Vmax and Km were determined by nonlinear least square regression by fitting
the data to the Michaelis-Menten equation: V=Vmax*[S]/(Km+[S]), where [S] is the substrate
concentration, and V is the initial rate of uptake. Vmax is the maximum rate of uptake, expressed
as pmol/min/mg or nmol/min/mg; and Km, expressed as mM, is the concentration where the rate
of uptake is a half of Vmax.
4.2.5. Membrane protein preparation and LC-MS/MS analysis
Total membrane proteins were isolated from the human salivary glands including parotid,
submandibular, and sublingual glands and hOCT3 stably transfected cells using the Proteo
Extract native membrane protein extraction kit (Calbiochem) according to the manufacturer’s
instructions (Prasad et al., 2013). Total protein concentration was determined by the BCA
protein assay kit (Pierce). The membrane fraction was digested by trypsin as per conditions
55
described before (Prasad et al., 2013). Briefly, the isolated membrane proteins were denatured at
95° C, reduced with dithiothreitol and alkylated with iodoacetamide in ammonium bicarbonate
buffer. The protein samples were digested at 37°C for 24 h by trypsin and the reaction was
quenched by adding internal standard (IS) solution and centrifuged at 5000 g for 5 min before
LC-MS/MS analysis.
Absolute quantification of OCT3 in total membrane fraction isolated from the hOCT3
expressed cells and human salivary glands was performed using an unique signature peptide as a
surrogate and the corresponding isotopically ([13
C6,15
N2] lysine) labeled peptide as IS. The
signature peptide was selected based on criteria previously discussed (Kamiie et al., 2008). The
selected peptide was GIALPETVDDVEK and used as a calibrator. The LC-MS/MS parameters
were optimized to quantify the selected peptide in the tissues samples. The analysis was
performed using an Agilent 6460A triple-quadrupole mass spectrometer coupled to an Agilent
1290 Infinity LC system (Agilent Technologies, Santa Clara, CA) operated in ESI positive
ionization mode. Approximately 2 µg (or less) of the trypsin digest (5 µl of LC injection
volume) was injected onto the column (Kinetex™ 2.6 µm, C18, 100 x 3 mm, Phenomenex,
Torrance, CA). The LC flow rate was 0.4 ml/min. The gradient program was: 97% A and 3% B
held for 4.5 min, followed by two steps of linear gradient of mobile phase B concentration of 3%
to 18% and 18% to 24% over 4.5-7.5 min and 7.5-11.5 min. This was followed by the washing
step (80% mobile phase B) for 1 min, and re-equilibration for 5 min. The parent-to-product
transitions for the OCT3 peptide monitored were doubly charged parent ion of m/z 700.4 or
693.5 to single-charged product ions of m/z 1031.3, 516.1 and 355.1. The transitions selected
for the stable isotope labeled peptides (SIL) peptide were m/z 697.5 (parent) to m/z of 1039.3
(product). The data were processed by integrating the peak areas generated from the ion

56
chromatograms for the analyte peptides and their respective internal standards using the
MassHunter software (Agilent Technologies, Santa Clara, CA). For data analysis, peak response
of MRM transitions from each peptide was averaged and the area ratio of analyte peptide vs IS
peptide was performed. The measurements were performed in triplicate.
4.2.6. In vivo study in mice
To determine pharmacokinetics and tissue distribution of metformin in the absence of
Oct3, 10-12 week old female and male Oct3+/+
and Oct3-/-
mice were used (n=3-5 per time
points). The mice were fasted for 5-10 hours and administered 15 mg/kg metformin containing
0.2 mCi/kg of [14
C] labeled metformin by oral gavage. At time points of 10, 15, 30, 45, 60, 90,
120, 180, 240, and 480 min, animals were sacrificed by CO2. Blood samples were obtained by
cardiac puncture using the heparin coated syringe (Smiths Medical) and plasma was separated by
centrifugation for 5 minute at 5000 x g. Tissues including liver, kidney, skeletal muscle, heart,
salivary gland and brain were collected at each time point.
Metformin concentrations in the plasma and tissues were determined by scintillation
counting using the method described by Wilcock et al. with minor modification (Wilcock and
Bailey, 1994). In brief, plasma and tissues were placed in scintillation vials with 1 mL 1 M
NaOH and incubated at 55~70˚C for 1~2 hours. After cooling, H2O2 was added to decolorize the
samples. After several hours, 15 mL of Eco-scintillation buffer was added first, and then 1 mL 1
M HCL was added to neutralize the solutions. The samples were stored overnight before
counting. The amounts of radioactivity were expressed as ng/g tissue for tissues and ng/ml for
plasma.
57
4.2.7. Immunofluorescent labeling of hOCT3 in human submandibular salivary gland
Snap frozen human submandibular glands were processed to frozen section by the
Pathology Research Services at the University of Washington. The sections were fixed in ice-
cold acetone for 5 min and immersed in PBS for 5 min. The sections were blocked in PBS
containing 5% goat serum for 45 min at room temperature. Then, the sections were incubated
overnight at 4˚C with polyclonal rabbit anti-OCT3 (1:125) (Genway), co-labeled with anti-
human Na+/K
+-ATPase α subunit (1:500) (Sigma). After antibody incubation, the sections were
washed with PBS; and Alexa Fluor tagged secondary antibodies, Alexa 488 and Alexa 568
(1:500), were applied for 1 hr at room temperature. After washing with PBS, ProLong Gold
antifade medium with DAPI was mounted on the slides and cover-slipped. The fluorescence
images were obtained with a Zeiss Axiovert 200 fluorscence microscope.
4.2.8. Pharmacokinetic data analysis
For one point sampling data (one blood sample from one individual mouse), we used a
bootstrap method to obtain confidence intervals for pharmacokinetic parameter estimates of
maternal plasma and fetal tissue. Area under the curve (AUC), oral clearance (CL/F), terminal
half-life (t1/2, β), and volume of distribution at terminal phase (Vβ) were calculated using the
following equations,

58
Terminal slope (β) was calculated by performing a linear regression of concentrations at the last
three to five time points. T indicates last time point (i.e. 480 min), and C(T) is the concentration
at the last time point. The 95% confidence intervals for PK parameters were generated using the
bootstrap method as described by Mager and Göller (Mager and Göller, 1998) with modification.
Briefly, plasma or tissue concentrations were resampled with random replacement of 26 mice.
This resampling with random replacement was performed using the R program developed by
Jason Liang in the Department of Biostatistics at the University of Washington. The resampling
was repeated 10,000 times to create 10,000 pseudo concentration-time profiles. For each profile,
the concentrations at each nominal time point were averaged and the PK parameters were
calculated using the equations defined above. The 95% confidence intervals for each parameter
were calculated by taking the 2.5% and 97.5% quantiles, i.e. the 251th and 97501th AUC values
of 10,000 bootstrap AUC values.
4.2.9. Statistical analysis
Data are expressed as mean + S.D or S.E. Uptake experiments were performed in
triplicate and repeated at least three times. Statistical significance for uptake experiments was
determined by Student’s t test. A p-value less than 0.05 was considered significant. In vivo

59
study data were analyzed and 95% confidence intervals for each PK parameter were determined
using the bootstrap method as described in the previous section.
4.3. Results
4.3.1. Metformin transport kinetics by OCT3
When time dependent uptake of [14
C] metformin was examined at 10 μM, human OCT3-
mediated metformin uptake was linear up to 5 min. hOCT3-expressing cells exhibited
significantly greater uptake activity as compared to the empty vector transfected cells (Figure
4.1A). Based on these data, kinetic studies with various metformin concentrations were carried
out using 4-5 min as the incubation time. hOCT3-mediated metformin uptake was saturable with
an apparent affinity (Km) of 3.67 + 0.25 mM, which is comparable to those of previous reports of
metformin Km in hOCT1 or hOCT2 expressing cells (Figure 4.1B) (Dresser et al., 2002; Kimura
et al., 2005; Suhre et al., 2005; Wang et al., 2002). A maximum velocity (Vmax) was estimated to
be 43.37 ± 4.14 pmol/µg membrane protein/min. Using a LC-MS/MS targeted proteomics
method, hOCT3 protein expression in the cells was determined to be 21.44 ± 3.00 fmol/µg
membrane protein. Accordingly, the maximum metformin turnover number (kcat) for OCT3 was
calculated to be 33.71 ± 7.00 s-1
and the single transporter catalytic efficiency (kcat/Km) was 9.19
± 2.37 s-1
mM-1
.
4.3.2. Predominant expression of OCT3 in salivary glands
Previous expression profiling studies in human tissues reported a wide distribution of
OCT3 mRNA in various human tissues with major expression found in skeletal muscle, cardiac
myocytes, placenta, liver, adrenal gland, salivary gland, and prostate (Wu et al., 2000). As Oct3

60
expression was less studied in mice, we first quantified mRNA expression of Oct3 and other
known metformin transporters (Oct1, Oct2, Mate1, Pmat) in various mouse tissues that are most
relevant to metformin disposition, response and adverse reactions. As previously reported
(Koepsell et al., 2007), mouse liver predominantly expressed Oct1 and Mate1 and mouse kidney
predominantly expressed Oct1, Oct2 and Mate1 (Fig. 4.2). In the small intestine, Oct1 and
Mate1 predominated in all segments although Oct3 and Pmat were also significantly expressed
in the ileum (Fig. 4.2). Mouse heart and skeletal muscle had a very high expression of Mate1
together with a significant expression of Oct3 (Fig. 4.2). Among the mouse tissue analyzed, the
highest expression of Oct3 was observed in salivary glands (Fig. 4.3A), where other organic
cation and biogenic amine transporters, including Oct1, Oct2, Mate1, Pmat, Sert, Net, and Dat,
were minimally expressed (Fig.4.3B). A similar and predominant expression of OCT3 was also
observed in human salivary glands (Fig. 4.4A). A further analysis revealed that OCT3 mRNA is
expressed in all three major locations of human salivary glands including parotid, sublingual and
submandibular glands (Fig. 4.4B). Among the different types of salivary glands, the
submandibular gland, which is responsible for generating 70% of all saliva produced in the oral
cavity, has the highest OCT3 expression.
4.3.3. OCT3 protein expression and localization in salivary glands
Using targeted proteomics, hOCT3 protein in human parotid, submandibular, and
sublingual glands were quantified to be 0.42 ± 0.11, 1.53 ± 0.015 and 0.43± 0.29 fmol per μg
total membrane protein respectively (Fig. 4.5A). Consistent with mRNA data, OCT3 protein in
submandibular gland was higher than in parotid and sublingual glands. Human submandibular
gland cryostat section was immunolabeled for OCT3 and Na+/K
+-ATPase. hOCT3 staining was

61
primarily found on the plasma membranes of acinar and ductal epithelial cells, and largely
overlapped with the basolateral membrane marker Na+/K
+-ATPase (Fig. 4.5B). Besides
basolateral membrane labeling, strong immunostaining was also observed on the apical
membrane lining the canaliculi of acinar cells. These data revealed that OCT3 is present on both
the basolateral (blood-facing) and the apical (salivary fluid-facing) membranes of the secretory
cells of the salivary glands. A cellular model was presented to show OCT3 location and
transport direction in the salivary epithelial cells (Fig. 4.11).
4.3.4. Altered metformin pharmacokinetics in Oct3-/-
mice
To assess the role of Oct3 in metformin disposition in vivo, we determined metformin
pharmacokinetics and tissue distribution in Oct3+/+
and Oct3-/-
mice. Prior to the in vivo studies,
we confirmed by qRT-PCR that there were no significant compensatory changes in the
expression of other metformin transporters (Oct1, Oct2, Mate1, Pmat) in tissues of interest in
Oct3-/-
mice (Fig. 4.2). Age- and gender-matched Oct3+/+
and Oct3-/-
mice were given 15 mg/kg
metformin containing a trace amount of 14
C-metformin by oral gavage. Mice (n=3-5) were
scarified at each time point, and metformin plasma and tissue concentrations were determined.
The plasma concentration-time profiles and the pharmacokinetic parameters of metformin in
female Oct3+/+
and Oct3-/-
mice were shown in Fig. 4.7 and Table 4.1. While the overall
systemic exposure (AUC0-480 min) was comparable between Oct3+/+
and Oct3-/-
mice, clear
difference was observed in metformin plasma levels in the first 60 min between the two
genotypes (Fig 4.7B). The peak concentration (Cmax) of metformin in female Oct3-/-
mice
increased by 67% and AUC0-60 min increased by 41% (Table 4.1). Similar pharmacokinetic
changes were also observed in male Oct3-/-
mice (Fig. 4.8 and Table 4.2). These data suggest
62
that Oct3 influences metformin disposition in vivo and has a significant impact on metformin
plasma levels in the early exposure phase following drug administration.
4.3.5. Depleted metformin accumulation in salivary glands of Oct3-/-
mice
We next examined metformin concentrations in salivary glands of Oct3+/+
and Oct3-/-
mice. Because rodent salivary glands exhibit significant sexual dimorphism (Pinkstaff, 1998),
metformin concentration was measured in two separate cohorts of male and female adult
animals. Metformin concentrations were much lower in salivary glands of Oct3-/-
mice in both
females and males at all time-points between 15-480 min (Fig. 4.9). At 60 min post dosing,
average metformin concentration in the salivary glands of Oct3-/-
mice was only one sixth of that
in wild type mice. Compared to Oct3+/+
mice, tissue metformin exposure (AUC0-480 min) in
salivary glands showed 65% and 54% reduction in female and male Oct3-/-
mice, respectively
(Table 4.3). These data suggest that Oct3 actively transports metformin from blood into salivary
glands. The concentrative nature of this process is evident when metformin concentrations were
compared between salivary glands and plasma. In wild type mice, metformin tissue
concentrations in salivary glands peaked around 60-90 min and then started to decline after 120
min. However, salivary gland metformin concentrations (ng/g tissue) in both male and female
mice were consistently higher (2-4 fold) than its corresponding plasma concentrations (ng/mL)
after 30 min (Fig. 4.10A), suggesting an active, uphill transport process from the blood into the
salivary gland epithelial cell. The intracellular metformin concentrations could be even greater
after adjusting to cytosolic volume or tissue water contents which typically range between 67-
73% in mouse salivary glands (Menghi et al., 1989). In contrast, this concentrative transport

63
process is abolished in Oct3-/-
mice as metformin salivary gland concentrations rarely exceeded
its plasma concentrations in the knockout mice (Fig. 4.10B).
In addition to salivary glands, Oct3-/-
mice also exhibited altered metformin exposure in
several other tissues (Table 4.3). Consistent with a significant expression of Oct3 in the heart
(Fig. 4.2), metformin AUC0-480 min in this tissue was reduced by 34-35% (p <0.05) in both male
and female Oct3-/-
mice (Table 4.3). Male and female Oct3-/-
mice also showed 34% (not
significant; N.S.) and 10% (N.S.) reduction in metformin exposure in skeletal muscle,
respectively. Unexpectedly, liver metformin exposure increased by 36% (p <0.05) and 12%
(N.S.) in male and female Oct3-/-
mice, respectively. No significant change in metformin AUC0-
480 min was observed in the kidney. Tissue exposure in the gastrointestinal track could not be
accurately measured due to significant contamination of unabsorbed metformin that remained in
the intestinal lumen.
4.4. Discussion
Patients receiving medications frequently report a variety of drug-induced adverse effects
including taste disturbance. In most cases there is limited mechanistic information regarding
drug-induced taste disturbance. In order to minimize or prevent this problem, it is important to
identify the underlying molecular mechanisms leading to this adverse effect. In this Chapter, we
uncovered a novel molecular mechanism leading to taste disturbance of metformin. We also
demonstrated the in vivo roles of OCT3 in tissue distribution of metformin.

64
Metformin, a first-line oral therapy for the treatment of type 2 diabetes, has several
common side effects that include gastrointestinal upset and taste disturbance (Melchior and
Jaber, 1996; Zolk, 2012). This drug is also known to highly accumulate in various tissues
including liver, kidney, small intestine and salivary glands (Hundal and Inzucchi, 2003; Scheen,
1996; Wilcock and Bailey, 1994). In addition, there are large variations in interpatient
pharmacokinetics and response to metformin.
Metformin, a polar soluble biguanide, is a substrate of multiple polyspecific organic
cation transporters. Our study and others demonstrated that metformin can be transported by
OCT3 (Chen et al., 2010; Nies et al., 2009). OCT3 is known to be expressed in various tissues
including placenta, skeletal muscle, kidney, liver, heart, lung, and brain. In our study, we found
high expression of OCT3/Oct3 in human and mouse salivary glands in both mRNA and protein
levels. Using LC-MS/MS method, our group quantified the absolute OCT3 protein expression in
the human salivary glands and estimated its catalytic efficiency. OCT3 protein expression in the
human submandibular glands was 1.53 fmol/μg membrane protein. In agreement with the OCT3
expression data in salivary glands, there was markedly reduced metformin accumulation in
salivary glands in both female and male Oct3-/-
mice. Our immunolocalization data in human
submandibular glands suggest that OCT3 is expressed at both apical and basolateral membranes
of salivary gland epithelial cells. This localization would suggest that driven by the inside-
negative membrane potential, OCT3 on the basolateral membrane actively concentrates
metformin from the blood into the salivary gland epithelial cells, resulting in high accumulation
of metformin in the salivary glands. However, once metformin is highly concentrated inside the
cells, due to the bi-directional nature of OCT3, a fraction of metformin inside the salivary gland

65
cells can be further effluxed into the saliva by apically localized OCT3, leading to metformin’s
presence in the saliva fluid and its taste disturbance.
In addition to salivary glands, Oct3-/-
mice also exhibited altered metformin exposure in
several other tissues. Consistent with a significant expression of Oct3 in the heart, the AUCs of
metformin was reduced in both female and male Oct3-/-
mice. Similarly, in a previous study
Oct3-/-
mice showed decreased MPP+ uptake in the heart when mice were given MPP+
intravenously (Zwart et al., 2001b). Another tissue that showed altered metformin exposure was
skeletal muscle. Both male and female Oct3-/-
mouse skeletal muscle showed reduction in its
AUCs although statistical difference was not significant. While metformin exerts its
pharmacological effect primarily in the liver, other peripheral tissues including the skeletal
muscle are also known as secondary sites of action. Chen et al. reported that the cells expressing
OCT3 genetic variants showed decreased uptake activity and inhibition of OCT3 resulted in
reduced phosphorylation of AMP-activated protein kinase (AMPK) in the skeletal muscle cells
treated with metformin (Chen et al., 2010). Thus, altered metformin exposure in skeletal muscle
in the absence of OCT3 or by OCT3 genetic polymorphisms may affect metformin response.
Collectively, our data suggest that OCT3/Oct3 is an important determinant of metformin uptake
into peripheral tissues.
Oct3-/-
mice also exhibited altered plasma kinetics of metformin. Although the overall
exposure of metformin did not change, peak concentration (Cmax) and early exposure (AUC0-60
min) to metformin significantly increased in Oct3-/-
mice greater in Oct3-/-
mice in early time
points. This finding may be clinically relevant if altered peak concentration and time to peak
concentration affect the onset of metformin action. The change in plasma kinetics in early time
66
points could be due to change in tissue distribution or/and intestinal absorption. In our study,
Oct3-/-
mice showed reduced metformin exposures in various tissues. Most distinctively, we
found significant decrease in salivary concentration in Oct3-/-
mice. Like liver, kidney and small
intestine, the salivary glands may serve as a deep compartment, and a change in distribution in
these peripheral tissues may affect volume of distribution and alter the plasma pharmacokinetic
profiles. Another possible explanation for the observed change in early plasma kinetic could be
due to a change in rate of absorption of metformin. In our study, tissue exposure in the
gastrointestinal track could not be accurately measured due to significant contamination of
unabsorbed metformin that remained in the intestinal lumen. Further study will be necessary in
order to elucidate whether Oct3 plays a role in intestinal absorption of metformin.
In summary, we demonstrated that OCT3 mediates metformin accumulation in salivary
gland and is an important determinant of peripheral metformin uptake and distribution.
Together, our studies identified a novel molecular mechanism underlying drug-induced taste
disturbance and provided an additional genetic factor that may contribute to variable disposition
and response to metformin.

67
Table 4.1. Metformin pharmacokinetic parameters from female Oct3+/+
and Oct3-/-
mice.
Parameters Oct3+/+
Oct3-/-
% change p-value
Cmax (μg/ml) 2.70 + 0.79 4.51 + 0.99 67%↑ <0.05
AUC 0-1hr
(μg/ml*min)
135.85
(118.79, 155.07)
190.95
(169.60, 210.87) 41%↑ <0.05
AUC 0-8hr
(μg/ml*min)
545.75
(475.08, 598.84)
553.36
(494.17, 601.66) -- N.S.
CL/F
(ml/min/kg)a
27.49
(25.05, 31.57)
27.11
(24.93, 30.35) -- N.S.
Terminal t1/2
(min)
164.20
(125.60, 283.68)
113.01
(89.39, 141.53) -- N.S.
V/F
(L/kg)b
6.51
(4.83, 11.04)
4.42
(3.45, 5.94) -- N.S.
Data are presented as mean + SD (Cmax) or with 95 % confidence interval in the parenthesis. AUC, area
under the plasma concentration-time curve of metformin. a CL/F value was calculated using Dose/AUC0-
8hr. b
V/F is terminal volume of distribution. N.S., not significant.

68
Table 4.2. Metformin pharmacokinetic parameters from male Oct3+/+
and Oct3-/-
mice.
Parameters Oct3+/+
Oct3-/-
% change p-value
Cmax (μg/ml) 2.63 + 1.33 4.23 + 0.26 61%↑ <0.05
AUC 0-1hr
(μg/ml*min)
139.00
(124.56, 154.19)
167.03
(145.08, 181.08) 20%↑
<0.05
AUC 0-8hr
(μg/ml*min)
529.28
(383.84, 569.16)
432.82
(373.18, 494.66) --
N.S.
CL/F
(ml/min/kg)a
28.34
(26.35, 39.08)
34.66
(30.32, 47.36) --
N.S.
Terminal t1/2
(min)
143.10
(114.85, 182.54)
98.10
(71.21, 124.47) -- <0.05
V/F
(L/kg)b
5.85
(4.68, 8.06)
4.91
(3.71, 6.19) -- N.S.
Data are presented as mean + SD (Cmax) or with 95% confidence interval in the parenthesis. AUC, area
under the curve of plasma concentration-time of metformin. a CL/F value was calculated using
Dose/AUC0-8hr. b
V/F is terminal volume of distribution. N.S., not significant.

69
Table 4.3. Tissue AUC0-8hr from female and male Oct3+/+
and Oct3-/-
mice.
Tissues Gender Oct3+/+
Oct3-/-
% change p-value
Salivary
gland
Female
Male
1881.35 (1671.53, 2087.20)
1374.89 (921.00, 1508.84)
677.26 (593.44, 756.54)
629.85 (422.01, 772.24)
↓64
↓54
<0.05
<0.05
Heart Female
Male
389.13 (350.61, 426.09)
316.74 (226.53, 339.99)
261.74 (228.65, 291.36)
208.14 (170.51, 260.11)
↓33
↓34
<0.05
<0.05
Skeletal
muscle
Female
Male
318.20 (268.62, 364.77)
283.57 (145.55, 317.51)
285.70 (234.83, 326.35)
188.20 (121.76, 223.48)
↓10
↓34
N.S.
N.S.
Liver Female
Male
995.05 (849.49, 1123.01)
912.40 (730.20, 1028.80)
1110.75 (982.70, 1241.99)
1242.41 (1044.62, 1411.73)
--
↑36
N.S.
<0.05
Kidney Female
Male
1938.48 (1724.90, 2143.43)
1770.01 (1215.02, 1994.06)
1761.07 (1486.04, 2076.49)
1722.93 (1417.29, 2015.32)
--
--
N.S.
N.S.
Data are presented mean with 95% confidence interval in the parenthesis. The units of AUCs is μg/g*min.
N.S., not significant.

70
Figure 4.1. Metformin transport kinetics in human OCT3-expressing HEK cells. The
uptake experiments were carried in hOCT3 or pcDNA transfected cells at 10 μM of metformin in
a time-dependent manner (A). The kinetic experiments were performed with various
concentrations for 4-5 minutes and the specific uptake was calculated by subtracting the
transport activity in control cells (B). Using Michaelis-Menten equation, the kinetic parameters
of Km and Vmax were respectively determined as 3.67 + 0.25 mM and 43.37 ± 4.14 pmol/µg
membrane protein/min.
Time (min)
[14C
] m
etf
orm
in u
pta
ke
(pm
ol/
mg
pro
tein
)
0 5 10 15 20
0
50
100
150
200
hOCT3pcDNA5
A
Concentration (mM)S
pe
cif
ic [
14C
] m
etf
orm
in
up
tak
e (
nm
ol/
mg
pro
tein
/min
)
0 2 4 6 8 10 12
0
2
4
6
8
10
B

71
Figure 4.2. Expression of polyspecific organic cation transporters in various tissues of
Oct3+/+
(solid bar) and Oct3-/-
(open bar) mice. Total RNA of eight tissues, including salivary
gland, heart, skeletal muscle, liver, kidney, duodenum, jejunum, and ileum, were isolated from
female Oct3+/+
and Oct3-/-
mice (n=4 per group), and reverse transcribed to cDNA. mRNA
expressions of Oct1, Oct2, Mate1, and Pmat were determined using real-time PCR and
normalized by Gusb.
Salivary gland
Re
lati
ve
exp
res
sio
n
no
rmalize
d t
o G
us
b
Oct
1
Oct
2
Mat
e1
Pm
at
0
10
20
30
40
50
Oct3+/+Oct3-/-
Heart
Re
lati
ve
exp
res
sio
n
no
rmalize
d t
o G
us
b
Oct
1
Oct
2
Mat
e1
Pm
at
0
500
1000
1500 Skeletal muscle
Re
lati
ve
exp
res
sio
n
no
rmalize
d t
o G
us
b
Oct
1
Oct
2
Mat
e1
Pm
at
0
1000
2000
3000
Liver
Re
lati
ve
exp
res
sio
n
no
rmalize
d t
o G
us
b
Oct
1
Oct
2
Mat
e1
Pm
at
0
10000
20000
30000 Kidney
Re
lati
ve
exp
res
sio
n
no
rmalize
d t
o G
us
b
Oct
1
Oct
2
Mat
e1
Pm
at
0
5000
10000
15000
Duodenum
Re
lati
ve
exp
res
sio
n
no
rmalize
d t
o G
us
b
Oct
1
Oct
2
Mat
e1
Pm
at
0
1000
2000
3000 Jejunum
Re
lati
ve
exp
res
sio
n
no
rmalize
d t
o G
us
b
Oct
1
Oct
2
Mat
e1
Pm
at
0
1000
2000
3000
4000 Ileum
Re
lati
ve
exp
res
sio
n
no
rmalize
d t
o G
us
b
Oct
1
Oct
2
Mat
e1
Pm
at
0
500
1000
1500
2000
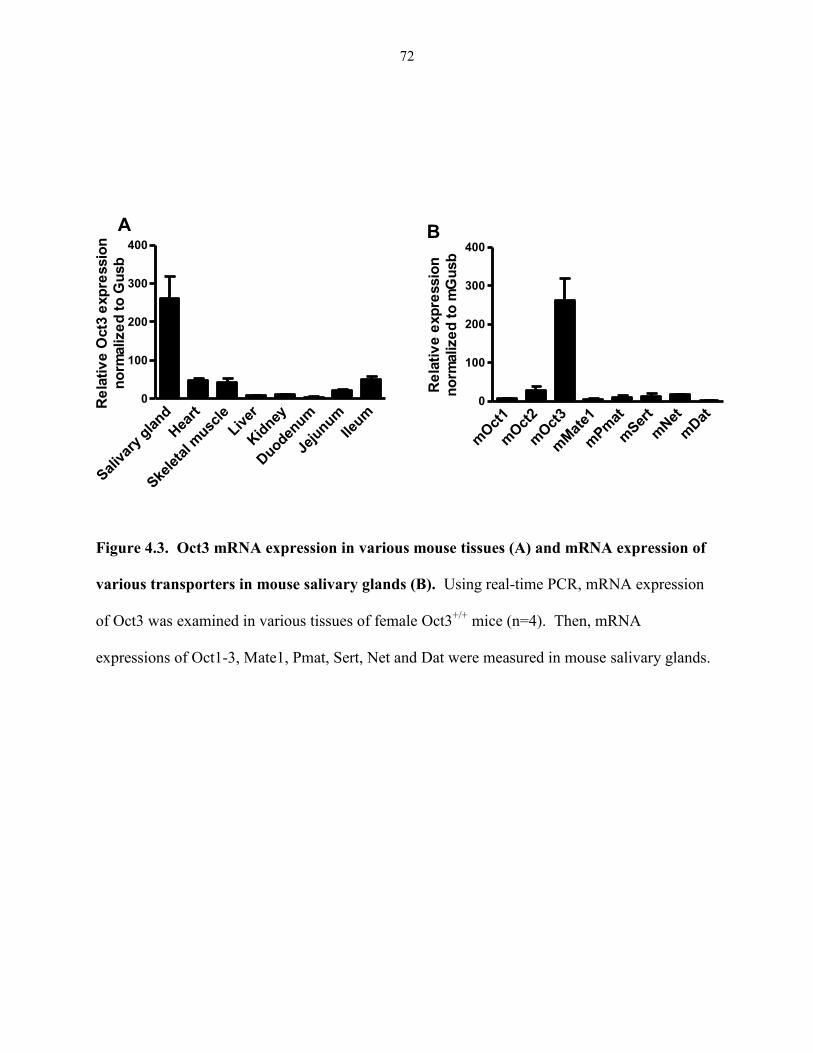
72
Figure 4.3. Oct3 mRNA expression in various mouse tissues (A) and mRNA expression of
various transporters in mouse salivary glands (B). Using real-time PCR, mRNA expression
of Oct3 was examined in various tissues of female Oct3+/+
mice (n=4). Then, mRNA
expressions of Oct1-3, Mate1, Pmat, Sert, Net and Dat were measured in mouse salivary glands.
Re
lati
ve
Oct3
exp
ressio
n
no
rmalize
d t
o G
usb
Sal
ivar
y gla
nd
Hea
rt
Ske
leta
l musc
le
Liver
Kid
ney
Duoden
um
Jeju
num
Ileum
0
100
200
300
400
A
Re
lati
ve
exp
ressio
n
no
rmalize
d t
o m
Gu
sb
mOct
1
mOct
2
mOct
3
mM
ate1
mPm
at
mSer
t
mNet
mDat
0
100
200
300
400B

73
Figure 4.4. mRNA expression of various transporters in human salivary glands (A) and
OCT3 mRNA expression in three human salivary gland regions (B). In (A), mRNA
expressions of OCT1-3, MATE1, PMAT, SERT, NET and DAT were determined in pooled
(n=24) human salivary glands using real-time PCR. In (B), mRNA expression of OCT3 was
examined in parotid, submandibular, and sublingual glands obtained from a single donor.
Re
lati
ve
exp
ressio
n
no
rmalize
d t
o h
GU
SB
hOCT1
hOCT2
hOCT3
hMATE1
hPMAT
hSERT
hNET
hDAT
0
100
200
300
400
A
Re
lati
ve
hO
CT
3 e
xp
ressio
n
no
ram
lize
d t
o h
GU
SB
Parotid
Subman
dibula
r
Sublingual
0
10
20
30
B

74
Figure 4.5. Protein expression of OCT3 in three human salivary glands regions. Using LC-
MS/MS method, absolute protein expression of OCT3 was quantified in parotid, submandibular,
and sublingual glands from a single donor. The protein levels were determined to be 0.42 ±
0.11, 1.53 ± 0.015 and 0.43± 0.29 fmol per μg total membrane protein in parotid, submandibualr
and sublingual glands respectively.
hO
CT
3 p
rote
in e
xp
ressio
n
(fm
ol/
g m
em
bra
ne p
rote
in)
Par
otid
Subm
andib
ular
Sublin
gual0.0
0.5
1.0
1.5
2.0

75
Figure 4.6. Dual-color immunofluorescence staining in human submandibular glands.
Human submandibular glands sections were co-labeled with OCT3 shown in green (A) and a
basolateral membrane marker, Na+/K
+-ATPase shown in red (B). The nuclei are shown in blue
(C). In a merged image (D), arrows and arrow heads respectively indicate the basolateral
membrane and apical membrane of epithelial cells.

76
Figure 4.7. Metformin plasma kinetics in female Oct3+/+
and Oct3-/-
mice. Female mice (n =
3-5 per group at each time point) were given an oral dose of 15 mg/kg containing 0.2 mCi/kg of
[14
C] metformin, and the plasma concentrations of metformin were measured from 0 to 8 hours
(A) or 0 to 2 hours (B) after metformin treatment. The radioactivity in plasma was determined
by scintillation counting and converted to mass amounts. Data represent mean + SE.
Female
0 60 120
180
240
300
360
420
480
0
2000
4000
6000
Oct3+/+
Oct3-/-
Time (min)
Pla
msa m
etf
orm
in
co
nce
ntr
ati
on
(ng
/ml)
A Female
0 60 120
0
2000
4000
6000
Oct3+/+
Oct3-/-
Time (min)
Pla
sm
a m
etf
orm
in
co
nce
ntr
ati
on
(n
g/m
l)
B

77
Figure 4.8. Metformin plasma kinetics in male Oct3+/+
and Oct3-/-
mice. Male mice (n = 3-5
per group at each time point) were given an oral dose of 15 mg/kg containing 0.2 mCi/kg of
[14
C] metformin, and the plasma concentrations of metformin were measured from 0 to 8 hours
(A) or 0 to 2 hours (B) after metformin treatment. The radioactivity in plasma was determined
by scintillation counting and converted to mass amounts. Data represent mean + SE.
Male
0 60 120
180
240
300
360
420
480
0
2000
4000
6000
Oct3+/+
Oct3-/-
Time (min)
Pla
sm
a m
etf
orm
in
co
nce
ntr
ati
on
(n
g/m
l)
Male
0 60 120
0
2000
4000
6000
Oct3+/+
Oct3-/-
Time (min)
Pla
sm
a m
etf
orm
in
co
nce
ntr
ati
on
(n
g/m
l)

78
Figure 4.9. Accumulation of metformin in salivary glands of female and male Oct3+/+
and
Oct3-/-
mice. Female and male mice (n = 3-5 per group at each time point) were given an oral
dose of 15 mg/kg containing 0.2 mCi/kg of [14
C] metformin. At each time point, salivary glands
were collected and the metformin concentrations were measured. The radioactivity in plasma
was determined by scintillation counting and converted to mass amounts. Data represent mean +
SE.
Salivary gland
Metf
orm
in c
on
cen
trati
on
(n
g/g
)
10 15 30 45 60 90 120 180 240 4800
2000
4000
6000
8000
10000
Oct3+/+ female
Oct3-/- female
Oct3-/- male
Oct3+/+ male
Time (min)

79
Figure 4.10. Plasma and salivary glands metformin concentration in female and male
Oct3+/+
(A) and Oct3-/-
(B) mice. Female and male mice (n = 3-5 per group at each time point)
were given an oral dose of 15 mg/kg containing 0.2 mCi/kg of [14
C] metformin. Metformin
concentrations in plasma and salivary glands were measured from 0-8 hours. The radioactivity
in plasma was determined by scintillation counting and converted to mass amounts. Data
represent mean + SE.
0 60 120
180
240
300
360
420
480
0
2000
4000
6000
8000
10000
Plasma Female
Salivary Gland Female
Time (min)
Me
tfo
rmin
co
nc
en
tra
tio
n
(ng
/ml
or
ng
/g)
Oct3-/-
Plasma Male
Salivary Gland Male
B
0 60 120
180
240
300
360
420
480
0
2000
4000
6000
8000
10000
Plasma Female
Salivary Gland Female
Time (min)
Me
tfo
rmin
co
nc
en
tra
tio
n
(ng
/ml
or
ng
/g)
Oct3+/+
Plasma Male
Salivary Gland Male
A

80
Figure 4.11. Proposed model for OCT3-mediated organic cation transport in salivary gland
epithelial cells. OCT3 on the basolateral membrane of epithelial cells mediates metformin
uptake from the blood into the cells. Once metformin is highly concentrated inside the cells,
OCT3 on the apical membrane facilitates excretion of metformin into the saliva.

81
Chapter 5. Organic cation transporter 3 facilitates fetal disposition of
metformin during pregnancy
5.1. Introduction
The biguanide derivative, metformin is an oral hypoglycemic drug widely used in the
treatment of type 2 diabetes (Hundal and Inzucchi, 2003). Metformin has recently been used to
treat polycystic ovary syndrome (PCOS) and gestational diabetes mellitus (GDM) in pregnant
women (Lord et al., 2003; Wensel, 2009). Oral antihyperglycemic agents such as glyburide and
metformin have been recently considered alternative therapy for insulin in achievement of
glycemic control in the pregnant diabetic population. However, there are challenges in the safe
and effective use of these agents in pregnant women due to the large variability in response and
pharmacokinetic changes of drugs. Furthermore, fetal drug exposure during pregnancy needs to
be considered as it may have harmful effects to the developing fetus.
Previous clinical studies have shown that metformin concentrations at the time of
delivery in umbilical cord plasma can be as high as maternal concentrations, suggesting that
metformin crosses the placental barrier and is transferred to the fetal compartment (Charles et al.,
2006; Eyal et al., 2010; Vanky et al., 2005). Insulin is known to be an important factor for fetal
growth during pregnancy. Metformin can increase insulin sensitivity and it is unclear how this
can affect the fetal growth and development. In addition, long-term outcome and complications
following in utero exposure to metformin remain to be evaluated.
Metformin, which is polar and positively charged at physiological pH, has very low
passive membrane permeability and requires carrier-mediated transport to penetrate the cell
membrane. Metformin is a known substrate for multiple polyspecific organic cation transporters

82
including the organic cation transporters (OCT)1-3, and multi-drug and toxin extrusion
transporter (MATE)1-2 (Kimura et al., 2005; Masuda et al., 2006; Tanihara et al., 2007). The
drug is predominantly eliminated by the kidney with negligible hepatic metabolism and exerts its
pharmacological effect mainly in the liver (Hundal and Inzucchi, 2003). OCT2 and MATE1/2
play an important role in secretion of metformin in the kidney because OCT2 mediates
metformin uptake from the blood to the kidney cells and MATE1/2 complete the excretion
process by effluxing the drug from the renal cells into the urine. OCT1, which mediates hepatic
uptake of metformin has a direct influence on metformin’s glucose lowering effect (Shu et al.,
2008; Shu et al., 2007; Wang et al., 2002). In recent studies, MATE1/2 are also shown to be
important determinants of metformin response (Choi et al., 2011; Stocker et al., 2013).
OCT3, a third member of SLC22A family, is a bi-directional transporter and displays
substrate specificity similar to OCT1 and OCT2 (Wu et al., 2000). OCT3 is broadly expressed in
various tissues including placenta (Wu et al., 2000). Among all known organic cation
transporters, OCT3 is the one most highly expressed in human placenta (Lee et al., 2013).
However, the role of OCT3 in metformin fetal disposition is unknown. In an ex vivo perfusion
study, meformin was shown to freely cross the human placenta through a carrier-mediated
pathway (Kovo et al., 2008). When pregnant Oct3 knockout mice were administered
intravenously with MPP+, a model substrate for Oct1-3, there was an decrease in MPP+
concentration in the fetus, suggesting a possible involvement of Oct3 in transport of organic
cations at the maternal-fetal interface (Zwart et al., 2001a). Yet, the role of OCT3 in metformin
disposition across the placental barrier has not been established.
In this Chapter, to investigate the molecular and cellular mechanism of metformin
transport at the placental barrier, we first determined the membrane localization of OCT3 in

83
human term placenta using immunofluorescence labeling. This work was followed by a
pharmacokinetic study in pregnant Oct3+/+
and Oct3-/-
mice to assess the in vivo significance of
Oct3 in the fetal disposition of metformin.
5.2. Materials and methods
5.2.1. Animals and tissue harvest
For gene expression profiling, adult (8-10 weeks of age) wild-type FVB mice were
purchased from Taconic. Oct3+/+
and Oct3-/-
mice, originally generated by Dr. Denise Barlow at
the University of Vienna and back-crossed to FVB strain (Zwart et al., 2001a). This mouse
strain was maintained by Dr. Alfred Schinkel of the Netherlands Cancer Institute and generously
provided to us by Dr. John Markowitz from the University of Florida. These mice were housed
in the specific pathogen free (SPF) facility at University of Washington. The animal studies
were approved by the Institutional Animal Care and Use committee (IACUC) at the University
of Washington. To obtain pregnant mice at gestational day (gd) 19 (term in mice is ~20-21days),
timed mating was carried out. The date that a vaginal plug was observed was assigned as
gestational day 1. For placental tissue collection, wild type FVB pregnant mice at gd 19 were
sacrificed using CO2, and the placentas were immediately collected and flash-frozen in liquid N2.
Tissues were stored at -80°C until use.
5.2.2. Human placenta source
The use of biological specimen was approved by the Institutional Review Board at the
University of Washington. Six human term placentas were obtained at the University of
Washington medical center Labor and Delivery Unit. All placenta tissues were from healthy

84
uncomplicated pregnancies. Placenta tissue was processed within 60-90 min after delivery. The
umbilical cords and large vessels were removed and the placenta was rinsed with ice cold
phosphate buffered saline (PBS) 1-2 times. The parenchyma of placenta was cut to a large piece
of about 100-150 g (10 cm x 5 cm). The cut tissue was immediately wrapped with the aluminum
foil and was immersed in the liquid nitrogen. The tissue was stored at -80°C until use.
5.2.3. Immunolocalization studies in human placenta
Snap-frozen human term placentas underwent frozen section by the Pathology Research
Services at the University of Washington. The human term placenta sections were fixed in ice
cold acetone for 5 min and immersed in PBS for 5 min. The sections were blocked in PBS
containing 5% goat serum for 45 min at room temperature. Then, the sections were incubated
overnight at 4˚C with polyclonal rabbit anti-OCT3 (1:125) (Genway), co-labeled with either anti-
human CD31-PECAM1 (1:50) (R&D Systems), anti-human laminin (1:1000) (Sigma), or anti-
human CD71 (transferrin receptor) (1:200) (Abbiotec). After antibody incubation, the sections
were washed with PBS, and florescent secondary antibodies Alexa 488 and Alexa 568 (1:500)
were applied for 1 hr at room temperature. After washing with PBS, ProLong Gold antifade
medium with DAPI was mounted on the slides and cover-slipped. The fluorescence images were
obtained with a Zeiss Axiovert 200 fluorescence microscope.
5.2.4. Expression of organic cation transporters and monoamine transporters in mouse
placenta
Total RNA was extracted from Oct3+/+
and Oct3-/-
mouse placentas using Trizol reagent
(Invitrogen, Inc) or Qiagen Mini RNeasy Kit according to the manufacturer’s instructions. RNA

85
integrity and purity were verified by gel electrophoresis and UV spectrophotometry. Total RNA
(2 μg) was reverse transcribed to first-strand cDNA using Superscript III reverse transcriptase
(Invitrogen) according to the manufacturer’s instructions. Taqman real-time PCR reagents,
assay primers and probes for mouse Oct1-3 (Slc22a1-3), mMate1-2 (Slc47a1-2), mPmat
(Slc29a4), mSert (Slc6a4), mNet (Slc6a2), and mDat (Slc6a3), and mGusb were purchased from
Applied Biosystems (Foster City, CA). Taqman real-time PCR assays were carried out
according to the manufacturer’s protocols on an Applied Biosystems 7900HT fast real-time PCR
system as described previously (Duan and Wang, 2010). The real-time reaction contained 10 μl
of 2X TaqMan Universal PCR Master Mix (Applied Biosystems), 5 μl of RNA-equivalent
cDNA (100 ng), and 1 μl of 20x primer/probe mix in a final volume of 20 μl. Each sample was
analyzed in duplicate or triplicate. To quantify the transcript expression levels of genes of
interest, comparative CT method was used (Zhang et al., 2008). The mRNA levels of each test
gene was normalized to either hGUSB or mGusb, according to the following formula: CT (test
gene) - CT (house keeping genes) = ∆CT. Thereafter, the relative mRNA levels of each gene
was calculated using the ∆∆CT method: ∆CT (test gene) -∆CT (test gene in the calibrator)
=∆∆CT (test gene). The fold changes of mRNA levels were represented as a relative expression
2-∆∆CT
.
5.2.5. In vivo study
Pregnant Oct3+/+
and Oct3-/-
mice at gd 19 were fasted for 5-10 hours and administered
15 mg/kg metformin containing 0.2 mCi/kg of [14
C] labeled metformin by oral gavage. At 15,
30, 45, 60, 120, 180, 240, and 480 min, animals were euthanized by CO2. The blood samples
were collected in heparinized microhematocrit capillary tubes (Fisher) by cardiac puncture and

86
plasma was separated by centrifugation for 1 minute at 5000 x g. Fetus, placenta and other
tissues (heart, skeletal muscle, salivary gland, liver, and kidney) were collected at each time
point. The metformin concentrations in the plasma and tissues were determined by scintillation
counting using the method described by Wilcock et al. with minor modification (Wilcock etl al.,
1994). In brief, plasma and tissues were placed in scintillation vials with 1 mL 1M NaOH and
incubated at 55~70 ˚C for 1~2 hours. After cooling, H2O2 was added to decolorize the samples.
After several hours, 15 mL of Eco-scintillation buffer was added first, and then 1 mL 1 M HCL
was added to neutralize the solutions. The samples were stored overnight before counting. The
amounts of radioactivity were expressed as ng/g tissue for tissues and ng/ml for plasma. For
each time point, 3-5 mice were used and a total of 26 mice were used for each genotype group.
5.2.6. Pharmacokinetic data analysis
For one point sampling data (one blood sample from each mouse), we used a bootstrap
method to obtain confidence intervals for pharmacokinetic parameter estimates of maternal
plasma and fetal tissue. Area under the curve (AUC), oral clearance (CL/F), terminal half-life
(t1/2, β), volume of distribution at terminal phase (Vβ), area under the moment curve (AUMC), and
mean residence time (MRT) were calculated using the following equations,

87
Terminal slope (β) was calculated by performing a linear regression of concentrations at the last
three to five time points. T indicates last time point (i.e. 480 min), and C(T) is the concentration
at the last time point. The 95% confidence intervals for PK parameters were generated using the
bootstrap method as described by Mager and Göller (Mager and Göller, 1998) with modification.
Briefly, plasma or tissue concentrations were resampled with random replacement of 26 mice.
This resampling with random replacement was performed using the R program developed by
Jason Liang in the Department of Biostatistics at the University of Washington. The resampling
was repeated 10,000 times to create 10,000 pseudo concentration-time profiles. For each profile,
the concentrations at each nominal time point were averaged and the PK parameters were
calculated using the equations defined above. The 95 % confidence intervals for each parameter
were calculated by taking the 2.5% and 97.5% quantiles, i.e. the 251th and 97501th AUC values
of 10,000 bootstrap AUC values.

88
5.3. Results
5.3.1. Localization of OCT3 in human term placenta. To identify the membrane localization
of OCT3 in human placenta, frozen sections of human term placentas were prepared and stained
with anti-OCT3 together with cellular membrane markers for endothelium, basolateral and apical
membranes. CD31-PECAM1 is known to be expressed in fetal vascular endothelium, and
laminin is expressed in the basal membrane of syncytiotrophoblast and fetal vascular
endothelium (Figure 5.1C and G). The transferrin receptor is localized to the apical membrane
of syncytiotrophoblast (Figure 5.1K). When the sections were co-labeled with an OCT3
antibody, co-localization was observed at the fetal vascular endothelium and basal membrane of
syncytiotrophoblast (Figure 5.1D and H). On the other hand, OCT3 did not co-localize with the
transferrin receptor (Figure 5.1L). These data suggest that OCT3 is localized to the basal
membrane of placental epithelial cells and is also expressed in fetal vascular endothelium.
5.3.2. Expression of polyspecific organic cation transporters and monoamine transporters
in placenta of pregnant Oct3+/+
and Oct3-/-
mice
Before carrying out in vivo study, mRNA expression of various organic cation and
monoamine transporters was measured in the placentas of pregnant Oct3+/+
and Oct3-/-
mice at gd
19. Consistent with our previous findings (Lee et al., 2013), wild type mice showed predominant
placental expression of Oct3 with lower or minimal expression of other organic cation and
monoamine transporters. When the placental expressions of other transporters including Oct1-2,
Mate1-2, Pmat, Set and Dat were compared between Oct3+/+
and Oct3-/-
mice, placental
expression was not significantly different between the Oct3+/+
and Oct3-/-
genotype, suggesting

89
that there is no compensatory change in the expression of other organic cation transporters and
monoamine transporters in the placenta of the knockout mice (Figure 5.2).
5.3.3. Maternal plasma kinetics of metformin in Oct3+/+
and Oct3-/-
mice
To determine the role of OCT3 in metformin disposition at the maternal-fetal interface,
pregnant Oct3+/+
and Oct3-/-
mice were administered [14
C] labeled metformin by oral gavage, and
maternal and fetal concentrations of metformin were measured at various time points. Consistent
with our previous findings from in vivo study (Chapter 4), the pregnant Oct3-/-
mice exhibited
higher peak concentration (Cmax) and early exposure (0-1hr). The overall AUC (AUC0-480min)
was slightly lower in the pregnant Oct3-/-
mice as compared to the pregnant Oct3+/+
mice (Figure
5.3 and Table 5.1). Other PK parameters including CL/F, terminal half life, Vβ, AUMC, and
MRT were also estimated. Most of estimates of these parameters were comparable between
pregnant Oct3+/+
and Oct3-/-
mice with exception for AUMC, which was found to be higher in
the pregnant Oct3+/+
mice (Table 5.1).
5.3.4. Fetal exposure to metformin in Oct3+/+
and Oct3-/-
mice
Fetal concentrations of metformin in Oct3-/-
mice were lower than those in Oct3+/+
mice
throughout the time course (Figure 5.4). At 2 and 3 hour time points, fetal concentrations from
Oct3-/-
mice were about 2 fold lower than those from Oct3+/+
mice. Fetal metformin AUC0-480 min
in the Oct3-/-
mice decreased by about 40% as compared with that in the Oct3+/+
mice. When
fetal AUC was extrapolated to infinity, there was about 47% reduction in fetal AUC0- in Oct3-/-
mice. Even after normalizing to maternal AUCs, Oct3-/-
mice still showed a 30% and 44%

90
decrease in fetal AUC0-480 min and AUC0- respectively as compared with Oct3+/+
mice (Table
5.2).
5.3.5. Peripheral tissue distribution of metformin in Oct3+/+
and Oct3-/-
mice
Metformin concentrations in other tissues including placenta, heart, salivary gland,
skeletal muscle, liver and kidney were also measured and AUCs (AUC0-480min and AUC0-infinity)
were calculated. Pregnant Oct3-/-
mice showed about a 30% decrease in placental AUC0-480min.
Consistent with the previous in vivo findings from the non-pregnant female or male mice
(Chapter 4), pregnant Oct3-/-
mice showed a 50% and 70% decrease in AUC0-480 min in heart and
salivary gland respectively. AUC0-480 min in the skeletal muscle and liver did not show significant
difference between the two genotypes during pregnancy. However, there was about a 20%
decrease in AUC0-480 min in the kidney of Oct3-/-
mice (Table 5.3). The magnitude of changes in
the tissue AUC0- between Oct3+/+
and Oct3-/-
mice was similar to the changes in tissue AUC0-480
min.
5.4. Discussion
Metformin, an oral hypoglycemic agent, is recently recognized as an alternative therapy
for the treatment of gestational diabetes mellitus. Because there are two lives represented in the
pregnant women, distribution of drug to and from the fetus must be evaluated to ensure its safety.
Previous clinical reports have shown that umbilical cord concentrations of metformin at the time
of delivery were comparable to maternal concentrations, suggesting an involvement of drug
transporters in metformin transport at the maternal-fetal interface. Here we hypothesized that
OCT3 in the placenta plays an important role in mediating metformin entry into the fetal

91
compartment, resulting in high concentrations of metformin in the fetal blood circulation during
pregnancy.
OCT3 is known to be expressed in various human tissues including placenta (Wu et al.,
2000). Consistently, our group found high expression of OCT3 mRNA and protein in human
term placentas (Lee et al., 2013). Placental expression of other functionally related transporters,
including OCT1, OCT2, MATE1, MATE2 and PMAT, was much lower than for OCT3. A
similar expression profile was observed in mouse placenta at gd 19. A recent study suggested a
high expression of Oct3 and Mate1 in rat placentas (Ahmadimoghaddam and Staud, 2013). In
contrast, we found little expression of MATE1 or Mate1 in human and mouse placentas (Lee et
al., 2013). Humans and mice seem to share a similar placental expression profile of organic
cation transporters, suggesting that mice may serve as a more relevant animal model to
investigate the mechanism of metformin transport at the maternal-fetal interface in humans.
To determine the exact role of OCT3 in metformin transport at the placental barrier, it is
important to know the membrane localization of OCT3 in the syncytiotrophoblast.
Syncytiotrophoblasts are multi-nucleated, terminally differentiated epithelial cells that form the
placental barrier between the maternal and the fetal circulations. These cells express a number of
drug transporters. In the brush border membrane facing the maternal blood, multiple transporters
including Pgp, BCRP, MRP2, OCTN2, ENT1, MCTs, SERT and NET are expressed (Ganapathy
et al., 2000; Vahakangas et al., 2009). The basal membrane facing the fetal blood is also known
to express several transporters including MRP1, MRP5, MCTs, OAT4, OATP 2B1, and RFT-1)
(Ganapathy et al., 2000; Vahakangas and Myllynen, 2009). OCT3 was generally thought to be
expressed on the basal membrane of syncytiotrophoblast; however, the exact membrane
localization of OCT3 in the human placenta has not been established. Previous membrane
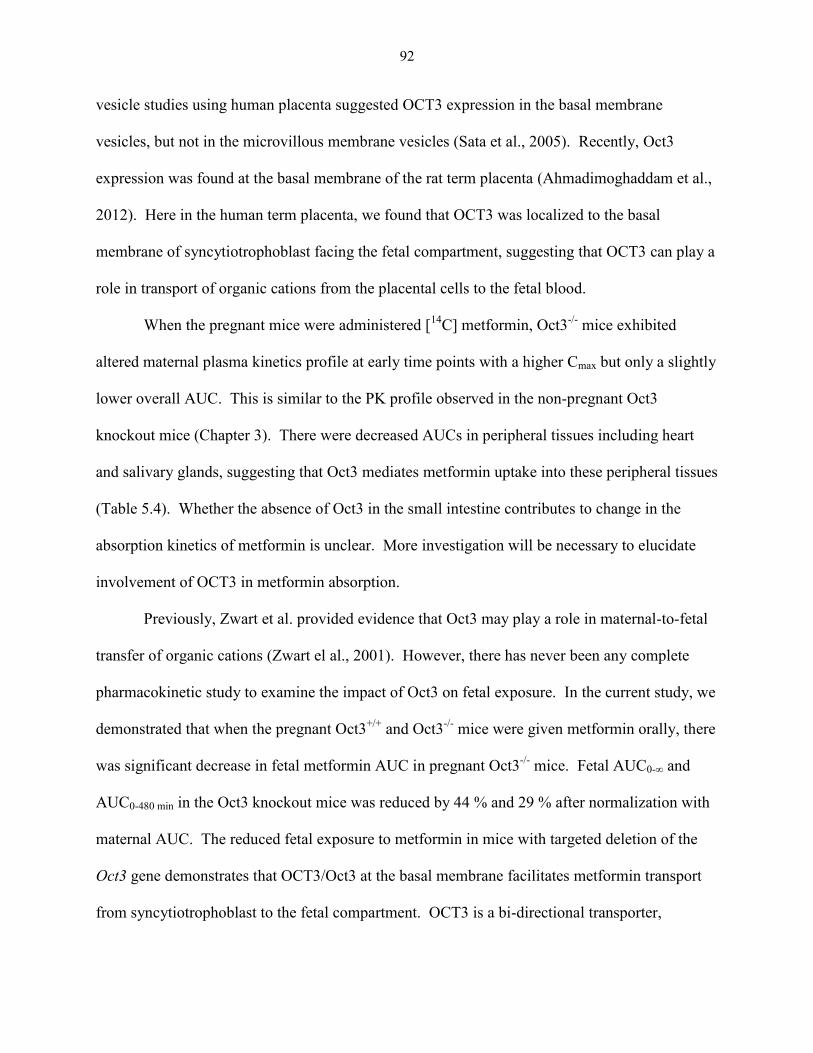
92
vesicle studies using human placenta suggested OCT3 expression in the basal membrane
vesicles, but not in the microvillous membrane vesicles (Sata et al., 2005). Recently, Oct3
expression was found at the basal membrane of the rat term placenta (Ahmadimoghaddam et al.,
2012). Here in the human term placenta, we found that OCT3 was localized to the basal
membrane of syncytiotrophoblast facing the fetal compartment, suggesting that OCT3 can play a
role in transport of organic cations from the placental cells to the fetal blood.
When the pregnant mice were administered [14
C] metformin, Oct3-/-
mice exhibited
altered maternal plasma kinetics profile at early time points with a higher Cmax but only a slightly
lower overall AUC. This is similar to the PK profile observed in the non-pregnant Oct3
knockout mice (Chapter 3). There were decreased AUCs in peripheral tissues including heart
and salivary glands, suggesting that Oct3 mediates metformin uptake into these peripheral tissues
(Table 5.4). Whether the absence of Oct3 in the small intestine contributes to change in the
absorption kinetics of metformin is unclear. More investigation will be necessary to elucidate
involvement of OCT3 in metformin absorption.
Previously, Zwart et al. provided evidence that Oct3 may play a role in maternal-to-fetal
transfer of organic cations (Zwart el al., 2001). However, there has never been any complete
pharmacokinetic study to examine the impact of Oct3 on fetal exposure. In the current study, we
demonstrated that when the pregnant Oct3+/+
and Oct3-/-
mice were given metformin orally, there
was significant decrease in fetal metformin AUC in pregnant Oct3-/-
mice. Fetal AUC0- and
AUC0-480 min in the Oct3 knockout mice was reduced by 44 % and 29 % after normalization with
maternal AUC. The reduced fetal exposure to metformin in mice with targeted deletion of the
Oct3 gene demonstrates that OCT3/Oct3 at the basal membrane facilitates metformin transport
from syncytiotrophoblast to the fetal compartment. OCT3 is a bi-directional transporter,

93
indicating that high intracellular concentration can drive OCT3 to mediate transport a substrate
from the cell interior to the extracellular space. To have high concentrations of metformin in the
syncytiotrophoblast, there has to be initial uptake of metformin from maternal blood to the
syncytiotrophoblast. The apical membrane transporters responsible for the transport of
metformin from the maternal blood to the placental cells are currently unknown. Our group
recently found that the apically localized SERT and NET can transport metformin in transfected
cells (unpublished data), suggesting that SERT or/and NET may mediate metformin transport at
the apical membrane of placental cells.
Ahmadimoghaddam et al. recently studied transport of metformin and MPP+ in the rat
term placenta using a perfused placenta model. Their results suggested a protective mechanism
as Oct3 takes up the molecules from fetal blood to the placental cells and Mate 1 at the apical
membrane effluxes them into the maternal blood (Ahmadimoghaddam et al., 2012;
Ahmadimoghaddam and Staud, 2013). However, in contrast to rat, the humans and mice showed
very low placental expression of MATE1/Mate1, indicating that the underlying mechanisms of
metformin placental transport differs between species. In addition, our findings are consistent
with previous clinical studies which reported high fetal metformin concentrations at the time of
delivery, suggesting a net flux of metformin from maternal blood to the fetal blood.
Recently, when we examined the OCT3/Oct3 expression in human and mouse placentas
at different gestational ages, both human and mouse placentas exhibited increased expression of
OCT3/Oct3 at mid-late pregnancy (Lee et al., 2013). These finding suggest that the developing
fetus may be susceptible to higher exposure to metformin and other organic cations at later
pregnancy than at early pregnancy. Further investigation will be necessary to fully understand

94
the mechanisms of metformin transport at the placental barrier and the effect of gestational age
on fetal exposure to metformin.
In conclusion, the current study demonstrated that OCT3 is expressed at the basal
membrane of syncytiotrophoblasts in human placenta and mice with targeted deletion of the
Oct3 gene exhibits reduced fetal exposure to metformin. Together, these results suggest that
OCT3/Oct3 in the placenta facilitates metformin transport from the placental cells to the fetal
compartment (Figure 5.5). This is the first study to clearly demonstrate the membrane
localization of OCT3 in human placenta and the impact of Oct3 in fetal disposition of metformin
in the Oct3 knockout mouse model. Our results provide strong evidence that OCT3 is an
important determinant of fetal exposure to metformin and possibly other organic cation drugs
during pregnancy. In the future, it would be interesting to evaluate whether gestational age-
dependent placental expression and genetic polymorphism of OCT3 could have an effect on the
extent to which the developing fetus are exposed to organic cation drugs during pregnancy.

95
Table 5.1. Maternal metformin pharmacokinetic parameters from pregnant Oct3+/+
and
Oct3-/-
mice. The mice were given an oral dose of metformin (15mg/kg body weight). AUC
from 0 to 480 min (AUC0-480min) and that from 0 to infinity (AUC0- ), CL/F, t1/2, β, Vβ, AUMC
and MRT were estimated using the equations as described under Materials and methods. Data
are mean with 95 % confidence intervals (CI). Using the bootstrap method, 95 % CI and p value
were calculated to assess the statistical significant difference of the pharmacokinetic parameters
between pregnant Oct3+/+
and Oct3-/-
mice.
Oct3+/+
Oct3-/-
p-value
AUC0-480min (μg/ml*min) 608.84 (564.42, 697.85) 512.88 (451.53, 569.35) <0.05
AUC0- (μg/ml*min) 661.17 (616.23, 752.54) 555.98 (493.81, 614.95) <0.05
CL/F (ml/min/kg) 24.64 (21.49, 26.58) 29.25 (26.35, 33.22) N.S.
t1/2, β (min) 118.50 (107.21, 194.71) 154.21 (99.20, 233.54) N.S.
Vβ (L/kg) 4.21 (3.60, 7.11) 6.51 (4.23, 10.32) N.S.
AUMC (mg/ml*min2) 81.30 (74.51, 95.85) 61.25 (50.46, 71.37) <0.05
MRT (min) 133.53 (125.64, 140.07) 119.43 (106.57, 130.10) N.S.
N.S., not significant.

96
Table 5.2. Fetal exposure to metformin in Oct3+/+
and Oct3-/-
pregnant mice. Fetal AUCs
and the ratio of fetal AUC to maternal AUC were calculated. Data are mean with 95%
confidence intervals (CI). Using the bootstrap method, 95% CI, % change and p value were
calculated to assess the statistical significant differences in fetal metformin exposure between
Oct3+/+
and Oct3-/-
mice.
Oct3+/+
Oct3-/-
% change p-value
AUCfetal, 0-480min
(μg/g*min) 127.18 (82,63, 145.97) 77.16 (66.85, 87.40) ↓39% <0.05
AUCfetal, 0-
(μg/g*min) 181.09 (136.16, 204.25) 95.74 (86.19, 104.32) ↓47% <0.05
AUCfetal, 0-480min /
AUCmaternal, 0-480min 0.21 (0.14, 0.25) 0.15 (0.13, 0.18) ↓29% <0.05
AUCfetal, 0- /
AUCmaternal, 0- 0.27 (0.20, 0.32) 0.17 (0.15, 0.20) ↓44% <0.05

97
Table 5.3. Various tissue AUCs in Oct3+/+
and Oct3-/-
pregnant mice.
AUC0-480min (μg/g*min)
AUC 0- (μg/g*min) Oct3
+/+ Oct3
-/- % change p-value
Placenta
730.71 (603.75, 832.09)
1092.58 (806.02, 1771.21)
487.23 (444.40, 529.70)
558.78 (510.68, 619.07)
↓33%
↓49%
<0.05
<0.05
Heart
618.75 (534.23, 711.15)
704.11 (598.13, 792.53)
296.44 (250.63, 344.46)
339.72 (291.19, 401.63)
↓52%
↓52%
<0.05
<0.05
Salivary gland
2740.44 (2239.29, 3155.49)
3453.06 (2663.72, 5153.04)
830.99 (760.36, 893.74)
1309.47 (1043.77, 1699.99)
↓70%
↓62%
<0.05
<0.05
Skeletal muscle
447.73 (372.07, 522.17)
540.14 (474.06, 619.19)
367.57 (311.15, 424.68)
573.61 (398.97, 1730.19)
--
--
N.S.
N.S.
Liver
875.55 (711.08, 1051.32)
948.68 (788.67, 1171.27)
1033.66 (858.00, 1215.27)
1080.49 (904.08, 1268.00)
--
--
N.S.
N.S.
Kidney
2241.05 (2024.75, 2416.32)
2730.23 (2413.30, 3133.49)
1756.10 (1505.10, 1968.37)
1872.33 (1640.83, 2092.90)
↓22%
↓31%
<0.05
<0.05
N.S., not significant.

98
Figure 5.1. Dual-color immunofluorescence staining in human term placenta. Human term
placenta sections were co-labeled with OCT3 and membrane markers including CD31-PECAM1
(endothelium), laminin (basal membrane and endothelium), and CD71-transferrin receptor
(apical membrane). The nuclei were shown in blue (A, E, and I). OCT3 was labeled with green
fluorescence (B, F, and J). The membrane markers were labeled with red fluorescence (C, G,
and K). Merged images are shown in D, H, and L.

99
Figure 5.2. Expression of various organic cation transporters in the placentas of Oct3+/+
and Oct3-/-
mice. mRNA transcript expression of various organic cation transporters in the
Oct3+/+
(n=3) and Oct3-/-
(n=3) mouse placentas at gd 19 was determined using real-time PCR.
Rela
tive e
xp
ressio
n
no
rmalized
to
mG
usb
Oct
1Oct
2Oct
3
Mat
e1
Mat
e2
Pm
atSer
tNet
Dat
0
200
400
600
800
gd19 OCT3 +/+
gd19 OCT3 -/-
Placenta
100
Maternal plasma
Time (min)
Co
nc
en
tra
tio
n (
ng
/ml)
0 60 120
180
240
300
360
420
480
0
2000
4000
6000
gd19 Oct3+/+
gd19 Oct3-/-
Figure 5.3. The plasma concentration-time curve of metformin after an oral dose in
pregnant Oct3+/+
mice (□) and Oct3-/-
mice (■) (n=3-5 at each time point) at gd 19. The
pregnant mice at 19 days of gestation were given an oral dose of 15 mg/kg metformin containing
0.2 mCi/kg of [14
C] metformin. Plasma was collected up to 8 hours, and metformin
concentrations were measured by liquid scintillation counter. Data represent mean ± SD.

101
Fetus
Time (min)
Co
nc
en
tra
tio
n (
ng
/g)
0 60 120
180
240
300
360
420
480
0
100
200
300
400
500
gd19 Oct3+/+
gd19 Oct3-/-
Figure 5.4. Fetal concentration-time curve of metformin after an oral dose in pregnant
Oct3+/+
mice (■) and Oct3-/-
mice (□) (n=3-5 at each time point) at gd 19. The pregnant mice
at 19 days of gestation were given an oral dose of 15 mg/kg with 0.2 mCi/kg of [14
C] metformin.
Fetus was collected up to 8 hours, and metformin concentrations were measured by liquid
scintillation counter. Data represent mean ± SD.

102
Figure 5.5. Proposed cellular model of metformin transport at the maternal-fetal interface.
OCT3 is shown in the basal membrane of syncytiotrophoblast cells and facilitates metformin
transport from the placental cells to the fetal blood circulation. An unknown transporter depicted
in the apical membrane of syncytiotrophoblast may transport metformin from the maternal blood
circulation into the syncytiotrophoblast cell.

103
Chapter 6. Conclusions and future direction
Pregnancy-induced changes in drug disposition and potential teratogenicity present
unique challenges for safe and effective drug therapy in pregnant women. Understanding the
changes in drug metabolism and transport during pregnancy is important for optimizing drug
efficacy and minimizing potential adverse effects for pregnant women and their developing
fetuses. This dissertation research was focused on understanding mechanisms that influence
maternal and fetal exposure to metformin, a drug currently used to treat gestational diabetes
mellitus. The studies were designed to 1) determine the mechanism of altered maternal
metformin disposition during pregnancy; 2) elucidate the role of OCT3 in fetal metformin
disposition and in metformin tissue distribution in both pregnant and non-pregnant states.
In Chapter 2, we showed that similar to human pregnancy pregnant mice had increased
apparent oral clearance of metformin, suggesting that mechanisms involved in metformin
disposition are similarly affected by pregnancy in the two species. Therefore, the mouse may
represent a reasonable animal model to study the effect of pregnancy on the expression of
various polyspecific organic cation transporters involved in metformin disposition during
pregnancy. In Chapter 3, we examined mRNA and protein expression levels of Oct1-2, Mate1-2,
and Pmat in the kidneys and livers of pregnant mice at different gestational ages. Our results
revealed that mRNA and protein expressions of mOct1 and mOct2 in the mouse kidney are
marginally affected by pregnancy. Similarly, hepatic expression of mOct1 and mMate1 mRNA
and protein is also minimally affected by pregnancy. However, in the kidney, mMate1 mRNA
and protein expressions significantly declined by 20%–40% throughout pregnancy, with
maximum down-regulation of mMate1 membrane protein observed at mid-pregnancy. Because
we did not observe an increase in Oct or Mate renal expression, altered renal expression of

104
organic cation transporters may not be the reason underlying the observed increase in renal
clearance of metformin during pregnancy. Other pregnancy-associated changes, such as
elevation in renal blood flow and glomerular filtration, may contribute to the increased total renal
clearance of metformin in pregnancy. However, it should be noted that our study was conducted
in mice, so we cannot exclude the possibility that expressions of hOCT2 and hMATE1/2-K in
the human kidney are uniquely affected by pregnancy.
With regard to fetal metformin disposition, we particularly focused on OCT3 (Chapters 3
and 5). Both human and mouse placentas showed high expression of OCT3/Oct3 with minimal
expression of other organic cation transporters. Interestingly, mouse placental Oct3 expression
significantly increased after early gestational age while OCT3 expression in human placenta
showed a modest increase in mid-to-late pregnancy. In human term placenta, OCT3 was
localized to the basal membrane of syntiotrophoblast cells, facing the fetal compartment. Our in
vivo study further showed a significant decrease in metformin fetal exposure in pregnant Oct3
knockout mice. Together our data suggest that OCT3/Oct3 facilitates metformin transport from
placental epithelial cells to the fetus and is an important determinant for fetal exposure to
metformin and possibly other organic cation drugs. To fully understand the molecular
mechanism of fetal disposition of metformin from maternal-to-fetal compartments, future
research should be directed towards identifying the apical membrane transporter(s) responsible
for metformin uptake from the maternal blood into the placental cells. In addition, in vivo
studies may be necessary to examine if the increased Oct3 placental expression in mid-to-late
pregnancy translates to an increase in fetal exposure to metformin at the later stage of gestation.
In this dissertation research, we examined the role of OCT3 in fetal disposition of
metformin during pregnancy, as well as investigated the significance of OCT3 in tissue

105
distribution of metformin in non-pregnant state (Chapter 4). Results from an in vivo study in non
pregnant wild type and Oct3 knockout mice suggested that OCT3/Oct3 plays an important role in
the plasma PK and peripheral tissue distribution of metformin. Oct3 knockout mice exhibited
altered plasma concentrations during the first 1 hour following dosing and showed reduced
metformin accumulation in heart, salivary gland and skeletal muscle. The change in salivary
gland concentration was remarkable, suggesting that OCT3/Oct3 is responsible for high
accumulation of metformin in the salivary glands, potentially leading to the taste disturbance, a
common adverse effect of metformin. It would be interesting to know if OCT3 plays a
physiological role in salivary glands (e.g. saliva generation, salivary recycling, etc); and if OCT3
is also involved in the taste disturbance of other organic cation drugs.
In conclusion, my dissertation research has contributed greatly to our understanding of
the role of OCT3 in metformin disposition. My research has demonstrated that OCT3 facilitates
the metformin disposition from the placenta to the fetal compartment and plays an important role
in peripheral tissue distribution of metformin. In particular, OCT3-mediated high accumulation
of metformin in the salivary glands potentially underlies taste disturbance of metformin. Several
genetic polymorphisms of the OCT3 gene have been reported. In the future, it would be
important to determine if genetic variants of OCT3 contribute to inter-individual variations in
metformin disposition, response and adverse reactions. In addition, my thesis research provided
the first ever information on the effect of pregnancy on mRNA and protein expression of various
polyspecific organic cation transporters in kidney, liver and placenta. These findings contribute
to our understanding of molecular mechanisms involved in maternal and fetal disposition of
metformin and will help to pave the way for optimizing metformin pharmacotherapy to treat
gestational diabetes mellitus in the pregnant population.
106
Bibliography
Adam MP, Polifka JE and Friedman JM (2011) Evolving knowledge of the teratogenicity of medications
in human pregnancy. American journal of medical genetics Part C, Seminars in medical genetics
157(3): 175-182.
Ahmadimoghaddam D, Hofman J, Zemankova L, Nachtigal P, Dolezelova E, Cerveny L, Ceckova M,
Micuda S and Staud F (2012) Synchronized Activity of Organic Cation Transporter 3
(Oct3/Slc22a3) and Multidrug and Toxin Extrusion 1 (Mate1/Slc47a1) Transporter in
Transplacental Passage of MPP+ in Rat. Toxicol Sci 128(2): 471-481.
Ahmadimoghaddam D and Staud F (2013) Transfer of metformin across the rat placenta is mediated by
organic cation transporter 3 (OCT3/SLC22A3) and multidrug and toxin extrusion 1
(MATE1/SLC47A1) protein. Reprod Toxicol 39: 17-22.
Andrade SE, Gurwitz JH, Davis RL, Chan KA, Finkelstein JA, Fortman K, McPhillips H, Raebel MA,
Roblin D, Smith DH, Yood MU, Morse AN and Platt R (2004) Prescription drug use in
pregnancy. American journal of obstetrics and gynecology 191(2): 398-407.
Barnes K, Dobrzynski H, Foppolo S, Beal PR, Ismat F, Scullion ER, Sun L, Tellez J, Ritzel MW,
Claycomb WC, Cass CE, Young JD, Billeter-Clark R, Boyett MR and Baldwin SA (2006)
Distribution and functional characterization of equilibrative nucleoside transporter-4, a novel
cardiac adenosine transporter activated at acidic pH. Circ Res 99(5): 510-519.
Berggren EK and Boggess KA (2013) Oral Agents for the Management of Gestational Diabetes. Clinical
obstetrics and gynecology.
Charles B, Norris R, Xiao X and Hague W (2006) Population pharmacokinetics of metformin in late
pregnancy. Ther Drug Monit 28(1): 67-72.
Chen L, Pawlikowski B, Schlessinger A, More SS, Stryke D, Johns SJ, Portman MA, Chen E, Ferrin TE,
Sali A and Giacomini KM (2010) Role of organic cation transporter 3 (SLC22A3) and its
missense variants in the pharmacologic action of metformin. Pharmacogenet Genomics 20(11):
687-699.
Chen Y, Li S, Brown C, Cheatham S, Castro RA, Leabman MK, Urban TJ, Chen L, Yee SW, Choi JH,
Huang Y, Brett CM, Burchard EG and Giacomini KM (2009) Effect of genetic variation in the
organic cation transporter 2 on the renal elimination of metformin. Pharmacogenet Genomics
19(7): 497-504.
Chen Y, Zhang S, Sorani M and Giacomini KM (2007) Transport of paraquat by human organic cation
transporters and multidrug and toxic compound extrusion family. J Pharmacol Exp Ther 322(2):
695-700.
Choi JH, Yee SW, Ramirez AH, Morrissey KM, Jang GH, Joski PJ, Mefford JA, Hesselson SE,
Schlessinger A, Jenkins G, Castro RA, Johns SJ, Stryke D, Sali A, Ferrin TE, Witte JS, Kwok
PY, Roden DM, Wilke RA, McCarty CA, Davis RL and Giacomini KM (2011) A common 5'-
UTR variant in MATE2-K is associated with poor response to metformin. Clin Pharmacol Ther
90(5): 674-684.
Dresser MJ, Xiao G, Leabman MK, Gray AT and Giacomini KM (2002) Interactions of n-
tetraalkylammonium compounds and biguanides with a human renal organic cation transporter
(hOCT2). Pharm Res 19(8): 1244-1247.
Duan H and Wang J (2010) Selective transport of monoamine neurotransmitters by human plasma
membrane monoamine transporter and organic cation transporter 3. J Pharmacol Exp Ther
335(3): 743-753.
Dunn CJ and Peters DH (1995) Metformin. A review of its pharmacological properties and therapeutic
use in non-insulin-dependent diabetes mellitus. Drugs 49(5): 721-749.
Engel K and Wang J (2005) Interaction of organic cations with a newly identified plasma membrane
monoamine transporter. Mol Pharmacol 68(5): 1397-1407.

107
Engel K, Zhou M and Wang J (2004) Identification and characterization of a novel monoamine
transporter in the human brain. J Biol Chem 279(48): 50042-50049.
Eyal S, Easterling TR, Carr D, Umans JG, Miodovnik M, Hankins GD, Clark SM, Risler L, Wang J,
Kelly EJ, Shen DD and Hebert MF (2010) Pharmacokinetics of metformin during pregnancy.
Drug metabolism and disposition: the biological fate of chemicals 38(5): 833-840.
Fujita T, Urban TJ, Leabman MK, Fujita K and Giacomini KM (2006) Transport of drugs in the kidney
by the human organic cation transporter, OCT2 and its genetic variants. J Pharm Sci 95(1): 25-
36.
Ganapathy V, Prasad PD, Ganapathy ME and Leibach FH (2000) Placental transporters relevant to drug
distribution across the maternal-fetal interface. J Pharmacol Exp Ther 294(2): 413-420.
Giacomini KM, Huang SM, Tweedie DJ, Benet LZ, Brouwer KL, Chu X, Dahlin A, Evers R, Fischer V,
Hillgren KM, Hoffmaster KA, Ishikawa T, Keppler D, Kim RB, Lee CA, Niemi M, Polli JW,
Sugiyama Y, Swaan PW, Ware JA, Wright SH, Yee SW, Zamek-Gliszczynski MJ, Zhang L and
Consortium IT (2010) Membrane transporters in drug development. Nat Rev Drug Discov 9(3):
215-236.
Glover DD, Amonkar M, Rybeck BF and Tracy TS (2003) Prescription, over-the-counter, and herbal
medicine use in a rural, obstetric population. American journal of obstetrics and gynecology
188(4): 1039-1045.
Gui J, Liu Q and Feng L (2013) Metformin vs insulin in the management of gestational diabetes: a meta-
analysis. PloS one 8(5): e64585.
Hebert MF, Easterling TR, Kirby B, Carr DB, Buchanan ML, Rutherford T, Thummel KE, Fishbein DP
and Unadkat JD (2008) Effects of pregnancy on CYP3A and P-glycoprotein activities as
measured by disposition of midazolam and digoxin: a University of Washington specialized
center of research study. Clin Pharmacol Ther 84(2): 248-253.
Hiasa M, Matsumoto T, Komatsu T and Moriyama Y (2006) Wide variety of locations for rodent
MATE1, a transporter protein that mediates the final excretion step for toxic organic cations. Am
J Physiol Cell Physiol 291(4): C678-686.
Hodge LS and Tracy TS (2007) Alterations in drug disposition during pregnancy: implications for drug
therapy. Expert Opin Drug Metab Toxicol 3(4): 557-571.
Hundal RS and Inzucchi SE (2003) Metformin: new understandings, new uses. Drugs 63(18): 1879-1894.
Inzucchi SE (2002) Oral antihyperglycemic therapy for type 2 diabetes: scientific review. JAMA : the
journal of the American Medical Association 287(3): 360-372.
Isoherranen N and Thummel KE (2013) Drug metabolism and transport during pregnancy: how does drug
disposition change during pregnancy and what are the mechanisms that cause such changes?
Drug metabolism and disposition: the biological fate of chemicals 41(2): 256-262.
Johnson JA, Majumdar SR, Simpson SH and Toth EL (2002) Decreased mortality associated with the use
of metformin compared with sulfonylurea monotherapy in type 2 diabetes. Diabetes Care 25(12):
2244-2248.
Kamiie J, Ohtsuki S, Iwase R, Ohmine K, Katsukura Y, Yanai K, Sekine Y, Uchida Y, Ito S and Terasaki
T (2008) Quantitative atlas of membrane transporter proteins: development and application of a
highly sensitive simultaneous LC/MS/MS method combined with novel in-silico peptide
selection criteria. Pharm Res 25(6): 1469-1483.
Kekuda R, Prasad PD, Wu X, Wang H, Fei YJ, Leibach FH and Ganapathy V (1998) Cloning and
functional characterization of a potential-sensitive, polyspecific organic cation transporter
(OCT3) most abundantly expressed in placenta. J Biol Chem 273(26): 15971-15979.
Kimura N, Masuda S, Tanihara Y, Ueo H, Okuda M, Katsura T and Inui K (2005) Metformin is a
superior substrate for renal organic cation transporter OCT2 rather than hepatic OCT1. Drug
Metab Pharmacokinet 20(5): 379-386.
Koepsell H (2004) Polyspecific organic cation transporters: their functions and interactions with drugs.
Trends Pharmacol Sci 25(7): 375-381.

108
Koepsell H, Lips K and Volk C (2007) Polyspecific organic cation transporters: structure, function,
physiological roles, and biopharmaceutical implications. Pharm Res 24(7): 1227-1251.
Koepsell H, Schmitt BM and Gorboulev V (2003) Organic cation transporters. Rev Physiol Biochem
Pharmacol 150: 36-90.
Koh KH, Xie H, Yu AM and Jeong H (2011) Altered cytochrome P450 expression in mice during
pregnancy. Drug metabolism and disposition: the biological fate of chemicals 39(2): 165-169.
Kovo M, Kogman N, Ovadia O, Nakash I, Golan A and Hoffman A (2008) Carrier-mediated transport of
metformin across the human placenta determined by using the ex vivo perfusion of the placental
cotyledon model. Prenat Diagn 28(6): 544-548.
Langer O, Conway DL, Berkus MD, Xenakis EM and Gonzales O (2000) A comparison of glyburide and
insulin in women with gestational diabetes mellitus. N Engl J Med 343(16): 1134-1138.
Langer O, Yogev Y, Most O and Xenakis EM (2005) Gestational diabetes: the consequences of not
treating. American journal of obstetrics and gynecology 192(4): 989-997.
Lautatzis ME, Goulis DG and Vrontakis M (2013) Efficacy and safety of metformin during pregnancy in
women with gestational diabetes mellitus or polycystic ovary syndrome: A systematic review.
Metabolism: clinical and experimental.
Lee N, Hebert MF, Prasad B, Easterling TR, Kelly EJ, Unadkat JD and Wang J (2013) Effect of
Gestational Age on mRNA and Protein Expression of Polyspecific Organic Cation Transporters
during Pregnancy. Drug metabolism and disposition: the biological fate of chemicals 41(12):
2225-2232.
Li M, Anderson GD and Wang J (2006) Drug-drug interactions involving membrane transporters in the
human kidney. Expert Opin Drug Metab Toxicol 2(4): 505-532.
Lickteig AJ, Cheng X, Augustine LM, Klaassen CD and Cherrington NJ (2008) Tissue distribution,
ontogeny and induction of the transporters Multidrug and toxin extrusion (MATE) 1 and MATE2
mRNA expression levels in mice. Life Sci 83(1-2): 59-64.
Lord JM, Flight IH and Norman RJ (2003) Metformin in polycystic ovary syndrome: systematic review
and meta-analysis. BMJ 327(7421): 951-953.
Mager H and Göller G (1998) Resampling methods in sparse sampling situations in preclinical
pharmacokinetic studies. J Pharm Sci 87(3): 372-378.
Masuda S, Terada T, Yonezawa A, Tanihara Y, Kishimoto K, Katsura T, Ogawa O and Inui K (2006)
Identification and functional characterization of a new human kidney-specific H+/organic cation
antiporter, kidney-specific multidrug and toxin extrusion 2. J Am Soc Nephrol 17(8): 2127-2135.
Mathias AA, Hitti J and Unadkat JD (2005) P-glycoprotein and breast cancer resistance protein
expression in human placentae of various gestational ages. American journal of physiology
Regulatory, integrative and comparative physiology 289(4): R963-969.
Melchior WR and Jaber LA (1996) Metformin: an antihyperglycemic agent for treatment of type II
diabetes. Ann Pharmacother 30(2): 158-164.
Menghi G, Curini R and Materazzi S (1989) Characterization of mouse salivary glands by water content
and type. Cellular and molecular biology 35(4): 391-398.
Mesdaghinia E, Samimi M, Homaei Z, Saberi F, Moosavi SG and Yaribakht M (2013) Comparison of
newborn outcomes in women with gestational diabetes mellitus treated with metformin or insulin:
a randomised blinded trial. International journal of preventive medicine 4(3): 327-333.
Moriyama Y, Hiasa M, Matsumoto T and Omote H (2008) Multidrug and toxic compound extrusion
(MATE)-type proteins as anchor transporters for the excretion of metabolic waste products and
xenobiotics. Xenobiotica; the fate of foreign compounds in biological systems 38(7-8): 1107-
1118.
Nies AT, Koepsell H, Winter S, Burk O, Klein K, Kerb R, Zanger UM, Keppler D, Schwab M and
Schaeffeler E (2009) Expression of organic cation transporters OCT1 (SLC22A1) and OCT3
(SLC22A3) is affected by genetic factors and cholestasis in human liver. Hepatology 50(4): 1227-
1240.
109
Ohtsuki S, Schaefer O, Kawakami H, Inoue T, Liehner S, Saito A, Ishiguro N, Kishimoto W, Ludwig-
Schwellinger E, Ebner T and Terasaki T (2012) Simultaneous absolute protein quantification of
transporters, cytochromes P450, and UDP-glucuronosyltransferases as a novel approach for the
characterization of individual human liver: comparison with mRNA levels and activities. Drug
metabolism and disposition: the biological fate of chemicals 40(1): 83-92.
Otsuka M, Matsumoto T, Morimoto R, Arioka S, Omote H and Moriyama Y (2005) A human transporter
protein that mediates the final excretion step for toxic organic cations. Proc Natl Acad Sci U S A
102(50): 17923-17928.
Pentikainen PJ, Neuvonen PJ and Penttila A (1979) Pharmacokinetics of metformin after intravenous and
oral administration to man. Eur J Clin Pharmacol 16(3): 195-202.
Pinkstaff CA (1998) Salivary gland sexual dimorphism: a brief review. European journal of morphology
36 Suppl: 31-34.
Prasad B, Lai Y, Lin Y and Unadkat JD (2013) Interindividual variability in the hepatic expression of the
human breast cancer resistance protein (BCRP/ABCG2): effect of age, sex, and genotype. J
Pharm Sci 102(3): 787-793.
Qaseem A, Humphrey LL, Sweet DE, Starkey M and Shekelle P (2012) Oral pharmacologic treatment of
type 2 diabetes mellitus: a clinical practice guideline from the American College of Physicians.
Ann Intern Med 156(3): 218-231.
Rowan JA, Hague WM, Gao W, Battin MR and Moore MP (2008) Metformin versus insulin for the
treatment of gestational diabetes. N Engl J Med 358(19): 2003-2015.
Sata R, Ohtani H, Tsujimoto M, Murakami H, Koyabu N, Nakamura T, Uchiumi T, Kuwano M, Nagata
H, Tsukimori K, Nakano H and Sawada Y (2005) Functional analysis of organic cation
transporter 3 expressed in human placenta. J Pharmacol Exp Ther 315(2): 888-895.
Scheen AJ (1996) Clinical pharmacokinetics of metformin. Clin Pharmacokinet 30(5): 359-371.
Shehata HA and Nelson-Piercy C (2001) Drugs in pregnancy. Drugs to avoid. Best practice & research
Clinical obstetrics & gynaecology 15(6): 971-986.
Shu Y, Brown C, Castro RA, Shi RJ, Lin ET, Owen RP, Sheardown SA, Yue L, Burchard EG, Brett CM
and Giacomini KM (2008) Effect of genetic variation in the organic cation transporter 1, OCT1,
on metformin pharmacokinetics. Clin Pharmacol Ther 83(2): 273-280.
Shu Y, Sheardown SA, Brown C, Owen RP, Zhang S, Castro RA, Ianculescu AG, Yue L, Lo JC,
Burchard EG, Brett CM and Giacomini KM (2007) Effect of genetic variation in the organic
cation transporter 1 (OCT1) on metformin action. J Clin Invest 117(5): 1422-1431.
Shuster DL, Bammler TK, Beyer RP, Macdonald JW, Tsai JM, Farin FM, Hebert MF, Thummel KE and
Mao Q (2013) Gestational age-dependent changes in gene expression of metabolic enzymes and
transporters in pregnant mice. Drug Metab Dispos 41(2): 332-342.
Song IS, Shin HJ, Shim EJ, Jung IS, Kim WY, Shon JH and Shin JG (2008) Genetic variants of the
organic cation transporter 2 influence the disposition of metformin. Clin Pharmacol Ther 84(5):
559-562.
Stocker SL, Morrissey KM, Yee SW, Castro RA, Xu L, Dahlin A, Ramirez AH, Roden DM, Wilke RA,
McCarty CA, Davis RL, Brett CM and Giacomini KM (2013) The effect of novel promoter
variants in MATE1 and MATE2 on the pharmacokinetics and pharmacodynamics of metformin.
Clin Pharmacol Ther 93(2): 186-194.
Suhre WM, Ekins S, Chang C, Swaan PW and Wright SH (2005) Molecular determinants of
substrate/inhibitor binding to the human and rabbit renal organic cation transporters hOCT2 and
rbOCT2. Molecular pharmacology 67(4): 1067-1077.
Tanihara Y, Masuda S, Sato T, Katsura T, Ogawa O and Inui K (2007) Substrate specificity of MATE1
and MATE2-K, human multidrug and toxin extrusions/H(+)-organic cation antiporters. Biochem
Pharmacol 74(2): 359-371.
Terada T, Masuda S, Asaka J, Tsuda M, Katsura T and Inui K (2006) Molecular cloning, functional
characterization and tissue distribution of rat H+/organic cation antiporter MATE1. Pharm Res
23(8): 1696-1701.

110
Tracy TS, Venkataramanan R, Glover DD, Caritis SN, National Institute for Child H and Human
Development Network of Maternal-Fetal-Medicine U (2005) Temporal changes in drug
metabolism (CYP1A2, CYP2D6 and CYP3A Activity) during pregnancy. American journal of
obstetrics and gynecology 192(2): 633-639.
Tsuda M, Terada T, Mizuno T, Katsura T, Shimakura J and Inui K (2009a) Targeted disruption of the
multidrug and toxin extrusion 1 (mate1) gene in mice reduces renal secretion of metformin.
Molecular pharmacology 75(6): 1280-1286.
Tsuda M, Terada T, Ueba M, Sato T, Masuda S, Katsura T and Inui K (2009b) Involvement of human
multidrug and toxin extrusion 1 in the drug interaction between cimetidine and metformin in renal
epithelial cells. J Pharmacol Exp Ther 329(1): 185-191.
Tzvetkov MV, Vormfelde SV, Balen D, Meineke I, Schmidt T, Sehrt D, Sabolic I, Koepsell H and
Brockmoller J (2009) The effects of genetic polymorphisms in the organic cation transporters
OCT1, OCT2, and OCT3 on the renal clearance of metformin. Clin Pharmacol Ther 86(3): 299-
306.
Uchida Y, Ohtsuki S, Katsukura Y, Ikeda C, Suzuki T, Kamiie J and Terasaki T (2011) Quantitative
targeted absolute proteomics of human blood-brain barrier transporters and receptors. J
Neurochem 117(2): 333-345.
Vahakangas K and Myllynen P (2009) Drug transporters in the human blood-placental barrier. Br J
Pharmacol 158(3): 665-678.
Vanky E, Zahlsen K, Spigset O and Carlsen SM (2005) Placental passage of metformin in women with
polycystic ovary syndrome. Fertil Steril 83(5): 1575-1578.
Wang DS, Jonker JW, Kato Y, Kusuhara H, Schinkel AH and Sugiyama Y (2002) Involvement of
organic cation transporter 1 in hepatic and intestinal distribution of metformin. J Pharmacol Exp
Ther 302(2): 510-515.
Wang H, Wu X, Hudkins K, Mikheev A, Zhang H, Gupta A, Unadkat JD and Mao Q (2006) Expression
of the breast cancer resistance protein (Bcrp1/Abcg2) in tissues from pregnant mice: effects of
pregnancy and correlations with nuclear receptors. Am J Physiol Endocrinol Metab 291(6):
E1295-1304.
Wang ZJ, Yin OQ, Tomlinson B and Chow MS (2008) OCT2 polymorphisms and in-vivo renal
functional consequence: studies with metformin and cimetidine. Pharmacogenet Genomics 18(7):
637-645.
Wensel TM (2009) Role of metformin in the treatment of gestational diabetes. Ann Pharmacother 43(5):
939-943.
Wilcock C and Bailey CJ (1994) Accumulation of metformin by tissues of the normal and diabetic
mouse. Xenobiotica; the fate of foreign compounds in biological systems 24(1): 49-57.
Wright SH and Dantzler WH (2004) Molecular and cellular physiology of renal organic cation and anion
transport. Physiol Rev 84(3): 987-1049.
Wu X, Huang W, Ganapathy ME, Wang H, Kekuda R, Conway SJ, Leibach FH and Ganapathy V (2000)
Structure, function, and regional distribution of the organic cation transporter OCT3 in the
kidney. Am J Physiol Renal Physiol 279(3): F449-458.
Xia L, Engel K, Zhou M and Wang J (2007) Membrane localization and pH-dependent transport of a
newly cloned organic cation transporter (PMAT) in kidney cells. Am J Physiol Renal Physiol
292(2): F682-690.
Yacovino LL, Gibson CJ and Aleksunes LM (2013) Down-regulation of brush border efflux transporter
expression in the kidneys of pregnant mice. Drug Metab Dispos 41(2): 320-325.
Zhang H, Wu X, Wang H, Mikheev AM, Mao Q and Unadkat JD (2008) Effect of pregnancy on
cytochrome P450 3a and P-glycoprotein expression and activity in the mouse: mechanisms, tissue
specificity, and time course. Mol Pharmacol 74(3): 714-723.
Zhou L, Naraharisetti SB, Wang H, Unadkat JD, Hebert MF and Mao Q (2008) The breast cancer
resistance protein (Bcrp1/Abcg2) limits fetal distribution of glyburide in the pregnant mouse: an

111
Obstetric-Fetal Pharmacology Research Unit Network and University of Washington Specialized
Center of Research Study. Mol Pharmacol 73(3): 949-959.
Zhou L, Zhang Y, Hebert MF, Unadkat JD and Mao Q (2010) Increased glyburide clearance in the
pregnant mouse model. Drug metabolism and disposition: the biological fate of chemicals 38(9):
1403-1406.
Zhou M, Xia L and Wang J (2007) Metformin transport by a newly cloned proton-stimulated organic
cation transporter (plasma membrane monoamine transporter) expressed in human intestine. Drug
metabolism and disposition: the biological fate of chemicals 35(10): 1956-1962.
Zolk O (2012) Disposition of metformin: variability due to polymorphisms of organic cation transporters.
Ann Med 44(2): 119-129.
Zwart R, Sleutels F, Wutz A, Schinkel AH and Barlow DP (2001a) Bidirectional action of the Igf2r
imprint control element on upstream and downstream imprinted genes. Genes Dev 15(18): 2361-
2366.
Zwart R, Verhaagh S, Buitelaar M, Popp-Snijders C and Barlow DP (2001b) Impaired activity of the
extraneuronal monoamine transporter system known as uptake-2 in Orct3/Slc22a3-deficient mice.
Mol Cell Biol 21(13): 4188-4196.