copyright by mayank srivastava 2010
TRANSCRIPT

Copyright
by
Mayank Srivastava
2010

The Dissertation Committee for Mayank Srivastava Certifies that this is the
approved version of the following dissertation
FOAM ASSISTED LOW INTERFACIAL TENSION ENHANCED
OIL RECOVERY
Committee:
Quoc P. Nguyen, Supervisor
Gary A. Pope
Russel T. Johns
Sanjay Srinivasan
Roger T. Bonnecaze

FOAM ASSISTED LOW INTERFACIAL TENSION ENHANCED
OIL RECOVERY
by
Mayank Srivastava, B.Tech; M.S.
Dissertation
Presented to the Faculty of the Graduate School of
The University of Texas at Austin
in Partial Fulfillment
of the Requirements
for the Degree of
Doctor of Philosophy
The University of Texas at Austin
May, 2010

Dedication
To my wife Pallavi and my parents, Usha and Bipin

v
Acknowledgements
I would like to express my deep sense of gratitude to Dr Quoc P. Nguyen. I am
grateful for the things he taught me; things not just related to research but also related to
life. There is absolutely no doubt in my mind that without his constant motivation, this
journey would have been an extremely difficult one. The one thing I admire most in him
is his patience. To constantly stand behind a restive, and sometimes difficult, person like
me requires enormous amount of patience and benevolence. I am fortunate to have him as
a mentor, a guide, and a friend.
Special thanks go to Dr Gary Pope. In spite of being extremely busy, he always
found time to answer my queries. The insightful discussions I had with him helped me in
formulating a basic understanding of Chemical-EOR processes. I would also like to thank
Dr. Sanjay Srinivasan, Dr. Russel T. Johns, and Dr. Roger Bonnecaze for serving on my
dissertation committee. A special word of appreciation goes to Dr. Kishore Mohanty and
Dr. Upali P. Weerasooriya for their suggestions and guidance. I would like to thank Cano
Petroleum for providing economic and material aid for the Foam Research project.
No amount of appreciation and thanks can be enough for Mr. Glen Baum, Mr.
Harry Linnemeyer, Mr. Gary Miscoe, and Mr. Tony Bermudez. They were always there
to help me with the experimental set-up, instrumentation, and material procurement.
I would like to thank Foam Research team members: Dr Sujeewa, Oscar Llama,
Nuyt Nguyen, Naveed Arsalan, Guanwei Ren, Jane, Megan, Anthony Ho, Sanjar, Hang,
and Viet Q. Le, for their help and companionship. I would like to thank my friends,
Navanit, Raman, Gautam, Neeraj, Ankesh, Sayantan, Lokendra, Ankur, Abhishek, Vinay,
Nitish, Faiz, and Ritesh for making this journey enjoyable.

vi
I would like to thank my loving wife Pallavi for the unconditional love she
showered on me and for standing by me through good and not so good times. I must also
thank my parents for the sacrifices they made so that I can have a purposeful and
meaningful life.
Finally, I would like to thank God for giving me the tenacity to see this journey
through. All good or bad things come to an end; it is this tenacity that keeps us steadfast
in pursuit of our goals and gives us the strength to not give up.

vii
Foam Assisted Low Interfacial Tension Enhanced Oil Recovery Process
Publication No.
Mayank Srivastava, Ph.D. The University of Texas Austin, 2010
Supervisor: Quoc P. Nguyen
Alkali-Surfactant-Polymer (ASP) or Surfactant-Polymer (SP) flooding are
attractive chemical enhanced oil recovery (EOR) methods. However, some reservoir
conditions are not favorable for the use of polymers or their use would not be
economically attractive due to low permeability, high salinity, or some other unfavorable
factors. In such conditions, gas can be an alternative to polymer for improving
displacement efficiency in chemical-EOR processes. The co-injection or alternate
injection of gas and chemical slug results in the formation of foam. Foam reduces the
relative permeability of injected chemical solutions that form microemulsion at ultra-low
interfacial tension (IFT) conditions and generates sufficient viscous pressure gradient to
drive the foamed chemical slug. We have named this technique of foam assisted
enhanced oil recovery as Alkali/Surfactant/Gas (ASG) process. The concept of ASG
flooding as an enhanced oil recovery technique is relatively new, with very little
experimental and theoretical work available on the subject. This dissertation presents a
systematic study of ASG process and its potential as an EOR method.

viii
We performed a series of high performance surfactant-gas tertiary recovery
corefloods on different core samples, under different rock, fluid, and process conditions.
In each coreflood, foamed chemical slug was chased by foamed chemical drive. The level
of mobility control in corefloods was evaluated on the basis of pressure, oil recovery, and
effluent data. Several promising surfactants, with dual properties of foaming and
emulsification, were identified and used in the coreflood experiments. We observed a
strong synergic effect of foam and ultra-low IFT conditions on oil recovery in ASG
corefloods. Oil recoveries in ASG corefloods compared reasonably well with oil
recoveries in ASP corefloods, when both were conducted under similar conditions. We
found that the negative salinity gradient concept, generally applied to chemical floods,
compliments ASG process by increasing foam strength in displacing fluids (slug and
drive). A characteristic increase in foam strength was observed, in nearly all ASG
corefloods conducted in this study, as the salinity first changed from Type II(+) to Type
III environment and then from Type III to Type II(-) environment.
We performed foaming and gas-microemulsion flow experiments to study foam
stability in different microemulsion environments encountered in chemical flooding.
Results showed that foam in oil/water microemulsion (Type II(-)) is the most stable,
followed by foam in Type III microemulsion. Foam stability is extremely poor (or non-
existent) in water/oil microemulsion (Type II (+)).
We investigated the effects of permeability, gas and liquid injection rates
(injection foam quality), chemical slug size, and surfactant type on ASG process. The
level of mobility control in ASG process increased with the increase in permeability; high
permeability ASG corefloods resulting in higher oil recovery due to stronger foam
propagation than low permeability corefloods. The displacement efficiency was found to
decrease with the increase in injection foam quality.

ix
We studied the effect of pressure on ASG process by conducting corefloods at an
elevated pressure of 400 psi. Pressure affects ASG process by influencing factors that
control foam stability, surfactant phase behavior, and rock-fluid interactions. High
solubility of carbon dioxide (CO2) in the aqueous phase and accompanying alkali
consumption by carbonic acid, which is formed when dissolved CO2 reacts with water,
reduces the displacement efficiency of the process. Due to their low solubility and less
reactivity in aqueous phase, Nitrogen (N2) forms stronger foam than CO2.
Finally, we implemented a simple model for foam flow in low-IFT microemulsion
environment. The model takes into account the effect of solubilized oil on gas mobility in
the presence of foam in low-IFT microemulsion environment.

x
TABLE OF CONTENTS
TABLE OF CONTENTS X
LIST OF TABLES XVI
LIST OF FIGURES XVIII
CHAPTER 1 1
Introduction ..............................................................................................................1 1.1 Overview ................................................................................................1 1.2 Scope of Research ..................................................................................4 1.3 Research Objectives ...............................................................................5 1.4 Research Methodology ..........................................................................6 1.5 Organization of Chapters .......................................................................6
CHAPTER 2 8
A Review of Foam and Chemical EOR Process ......................................................8 2.1 Foam: Basic Concepts ............................................................................8
2.1.1 Foam Classification ......................................................................9 2.1.2 Flow Characteristics of Foam in Porous Media ..........................10
2.1.2.1 Effect of Foam on Gas Mobility ..................................11 2.1.2.2 Effect of Foam on Liquid Mobility ..............................12
2.1.3 Main Foam Parameters ...............................................................13 2.1.3.1 Foam Texture ...............................................................13 2.1.3.2 Foam Quality ...............................................................14
2.1.4 Mechanisms of Foam Generation in Porous Media ....................16 2.1.4.1 Leave-behind ................................................................16 2.1.4.2 Lamella Division ..........................................................17 2.1.4.3 Snap-off........................................................................18
2.1.5 Factors Influencing Foam Stability .............................................20 2.1.5.1 Capillary and Gravity Drainage ...................................20 2.1.5.2 Gas Diffusion ...............................................................22

xi
2.1.5.3 Disjoining Pressure ......................................................22 2.1.5.4 Anti-foaming Effect of Oil...........................................25 2.1.5.5 Salinity .........................................................................28 2.1.5.6 Surfactant Concentration .............................................28 2.1.5.7 Other Mechanisms Influencing Foam Stability ...........29
2.2 Chemical Flooding ...............................................................................29 2.2.1 Capillary Number........................................................................30 2.2.2 Chemicals ....................................................................................31
2.2.2.1 Surfactants....................................................................32 2.2.2.2 Alkali............................................................................33 2.2.2.3 Polymer ........................................................................35 2.2.2.4 Co-solvent ....................................................................36
2.2.3 Microemulsion Phase Behavior ..................................................37 2.2.4 Phase Behavior and Interfacial Tension .....................................40
2.2.4.1 Healy and Reed's Model ..............................................41 2.2.4.2 Chun-Huh Model .........................................................43
2.2.5 Mobilization and Displacement of Residual Oil .........................43 2.2.6 Salinity Gradient Concept ...........................................................44
2.3 Alkali/Surfactant/Gas (ASG) Process ..................................................45 2.3.1 Literature Review of ASG Process .............................................46 2.3.2 Summary of ASG Literature Review ..........................................48
2.4 Chapter Summary ................................................................................49
CHAPTER 3 50
Demonstration of Enhanced Oil Recovery Potential of Alkali/Surfactant/Gas Process.......................................................................................................................50 3.1 Introduction ..........................................................................................50 3.2 Experimental Material .........................................................................51
3.2.1 Chemicals and Fluids ..................................................................51 3.2.1.1 Formation Brine and Crude Oil ...................................51 3.2.1.2 Surfactants....................................................................52 3.2.1.3 Alkali............................................................................52

xii
3.2.1.4 Co-solvents ..................................................................54 3.2.1.5 Polymer ........................................................................54
3.2.2 Coreflood System........................................................................55 3.2.2.1 Liquid Injection Pump .................................................55 3.2.2.2 Back Pressure Regulator (BPR) ...................................55 3.2.2.3 Mass Flow Controller ..................................................56 3.2.2.4 Pressure Transducers ...................................................57 3.2.2.5 Coreholder....................................................................57
3.3 Experimental Procedures .....................................................................59 3.3.1 Aqueous Stability and Phase Behavior Procedures ....................59 3.3.2 Foaming Test Procedure .............................................................60 3.3.3 Coreflood Procedure ...................................................................61
3.4 Discussion of experimental results ......................................................63 3.4.1 Results of Phase Behavior and Aqueous Stability Tests ............63 3.4.2 Results of Foaming Test .............................................................68 3.4.3 Results of Corefloods ..................................................................69
3.4.3.1 Results of ASP corefloods ...........................................72 3.4.3.2 Results of ASG corefloods...........................................76
3.4.4 Mobility control by foam in ASG process ..................................83 3.4.5 Microscopic and Macroscopic Displacement of Oil in ASG process
87 3.5 Chapter Summary ................................................................................91
CHAPTER 4 93
Main Factors Influencing ASG Process .................................................................93 4.1 Introduction ..........................................................................................93 4.2 Effect of Permeability ..........................................................................94 4.3 Effect of Gas and Chemical Injection Rates (Injection Foam Quality)103 4.4 Effect of Chemical Slug Size .............................................................108 4.5 Surfactant Type ..................................................................................112 4.6 Chapter Summary ..............................................................................116

xiii
CHAPTER 5 118
ASG Process at Elevated Pressure .......................................................................118 5.1 Introduction ........................................................................................118 5.2 Background ........................................................................................120
5.2.1 Effect of Pressure on Factors Influencing Foam Stability and Generation in ASG Process with Non-Reactive Crude Oils .....121 5.2.1.1 Gas compressibility ....................................................121 5.2.1.2 Gas Solubility in Aqueous Phase ...............................122 5.2.1.3 Gas Diffusion .............................................................125 5.2.1.4 Gas–Water Interfacial Tension ..................................126 5.2.1.5 pH ...............................................................................127
5.2.2 Effect of Pressure on Factors Influencing Phase Behavior in ASG Process 129
5.2.3 Effect of Pressure on Factors Influencing Rock-Fluid Interaction in ASG Process ...............................................................................................135
5.3 Experimental Description ..................................................................136 5.3.1 Experimental Scheme ...............................................................136 5.3.2 Rock and fluids .........................................................................137 5.3.3 Phase Behavior and Chemical Formulation ..............................138
5.4 Results of ASG Corefloods ................................................................141 5.4.1 Comparison of Low and High Pressure CO2 ASG Corefloods 142 5.4.2 Comparison of CO2 and N2 ASG Corefloods ...........................146 5.4.3 High Quality and High Surfactant Concentration CO2-ASG
Corefloods .................................................................................150 5.5 Chapter summary ...............................................................................154
CHAPTER 6 156
ASG Modeling .....................................................................................................156 6.1 Introduction ........................................................................................156 6.2 Foam in microemulsion environment ................................................157
6.2.1 Microemulsion Foaming Tests .................................................162 6.2.2 Microemulsion Sandpack Tests ................................................167
6.3 ASG Model ........................................................................................174

xiv
6.4 ASG Model Fitting ............................................................................176 6.5 An Approximate Method for ASG Simulations ................................178 6.6 Chapter Summary ..............................................................................185
CHAPTER 7 187
Summary and Recommendations ........................................................................187 7.1 Summary ............................................................................................187 7.2 Recommendations for Future Work ...................................................190
APPENDIX –A 192
Summary of coreflood results and waterflood pressure data ...............................192 A 1 ASP Sandstone Coreflood (Chapter 3) ..............................................192 A 2 ASP Dolomite Coreflood (Chapter 3)................................................193 A 3 ASG Sandstone Coreflood (Chapter 3)..............................................194 A 4 ASG Dolomite Coreflood (Chapter 3) and Low Injection Quality ASG
Coreflood (Chapter 4) ........................................................................195 A 5 High Quality ASG Dolomite Coreflood (Chapter 4) .........................196 A 6 Medium Permeability and Medium Quality ASG Dolomite Coreflood
(Chapter 4) .........................................................................................197 A 7 High Permeability ASG Dolomite Coreflood (Chapter 4) ................198 A 8 Low Permeability ASG Dolomite Coreflood (Chapter 4) .................199 A 9 Small Slug Size (0.15 PV) ASG Dolomite Coreflood (Chapter 4) ....200 A 10 Low Pressure CO2- ASG Dolomite Coreflood (Chapter 5) ...............201 A 11 High Pressure CO2-ASG Sandstone Coreflood (Chapter 5) ..............202 A 12 Low Pressure N2-ASG Sandstone Coreflood (Chapter 5) .................203 A 13 High Pressure N2-ASG SANDSTONE COREFLOOD (Chapter 5) .204 A 14 High Quality CO2- ASG SANDSTONE COREFLOOD (Chapter 5)205 A 15 High Pressure CO2-ASG Sandstone Coreflood with High Surfactant
Concentration in the Slug (Chapter 5) ...............................................206

xv
GLOSSARY 207
BIBLIOGRAPHY 209
VITA 216

xvi
LIST OF TABLES
Table 3.1: Ionic composition of synthetic reservoir brines ...........................52 Table 3.2: Chemical formulation for sandstone and dolomite corefloods ....64 Table 3.3: Composition of optimum formulations identified from aqueous
stability and phase behavior tests .........................................................64 Table 3.4: Results of phase behavior test using Formulation-A ...................65 Table 3.5: Results of phase behavior test using Formulation-B1 .................66 Table 3.6: Results of phase behavior test using Formulation-B2 .................67 Table 3.7: Slug and drive composition for ASP corefloods .........................70 Table 3.8: Slug and drive composition for ASG corefloods .........................70 Table 3.9: Main details of ASP and ASG corefloods ...................................71 Table 3.10: Main results from ASP and ASG corefloods .............................71 Table 4.1: Details of corefloods carried out to study the effect of permeability
on ASG process....................................................................................96 Table 4.2: Results of corefloods carried out to study the effect of permeability
on ASG process....................................................................................97 Table 4.3: Details of corefloods carried out to study the effect of foam quality
on ASG process..................................................................................103 Table 4.4: Results of corefloods carried out to study the effect of foam quality
on ASG process..................................................................................104 Table 4.5: Details of corefloods carried out to study the effect of slug size on
ASG process.......................................................................................109 Table 4.6:Results of corefloods carried out to study the effect of slug size on
ASG process.......................................................................................109 Table 4.7: Details of corefloods ASG_SCD4 and ASG_SCD7 carried out to
study the effect of surfactant type on ASG process. ..........................114 Table 4.8: Results of corefloods ASG_SCD4 and ASG_SCD7 carried out to
study the effect of surfactant type on ASG process ...........................114 Table 5.1: Values of Henry’s constant for CO2 and N2 .............................125 Table 5.2: Equilibrium concentration of CO2 and N2 in aqueous phase at
experimental conditions. ....................................................................135 Table 5.3: Description of ASG corefloods carried out to study the effect of
pressure. .............................................................................................137 Table 5.4: Brine composition used in ASG corefloods ..............................138

xvii
Table 5.5: Results of phase behavior test ....................................................140 Table 5.6: Slug and drive composition in ASG corefloods carried out to study
the effect of pressure. .........................................................................141 Table 5.7: Details of ASG corefloods carried out to study the effects of pressure
142 Table 5.8: Results of ASG corefloods carried out to study the effects of
pressure. .............................................................................................142 Table 6.1: Details of microemulsion systems used for sandpack tests. ......169 Table 6.2: Main simulation input parameters used in history matching ASG
coreflood results. ................................................................................177 Table 6.3: Main input specifications for core scale ASG simulation used to
compare full scale and approximate approach ...................................182 Table A1: Results ASP_SCD1....................................................................192 Table A2: Results ASP_DCP1....................................................................193 Table A3: Results ASG_SCD7 ...................................................................194 Table A4: Results ASG_DCP15 .................................................................195 Table A5: Results ASG_DCP2 ...................................................................196 Table A6: Results ASG_DCP8 ...................................................................197 Table A7: Results ASG_DCP9 ...................................................................198 Table A8: Results ASG_DCP10 .................................................................199 Table A9: Results ASG_DCP11 .................................................................200 Table A10: Results ASG_LP_CO2 ............................................................201 Table A11: Results ASG_HP_CO2 ............................................................202 Table A12: Results ASG_LP_N2 ...............................................................203 Table A13: Results ASG_HP_N2 ...............................................................204 Table A14: Results ASG_HP_CO2_HQ ....................................................205 Table A15: Results ASG_HP_CO2_2% .....................................................206

xviii
LIST OF FIGURES
Figure 2.1: A schematic of three bubbles meeting at a plateau border. The thickness of lamella is greatly exaggerated in this figure. .....................8
Figure 2.2: Distibution of wetting and non-wetting fluids in cornered pores. (Kovscek and Radke, 1994) .................................................................10
Figure 2.3: Schematic of continuous and discontinuous gas channels in porous media (Tanzil, 2001) ............................................................................11
Figure 2.4: Foam quality versus foam viscosity (adapted from Bullen, 1975)15 Figure 2.5: Schematic of lamellae creation by Leave-Behind Method. Rock
grains are represented in lined circles, liquid in gray color, and gas in white color. ..........................................................................................17
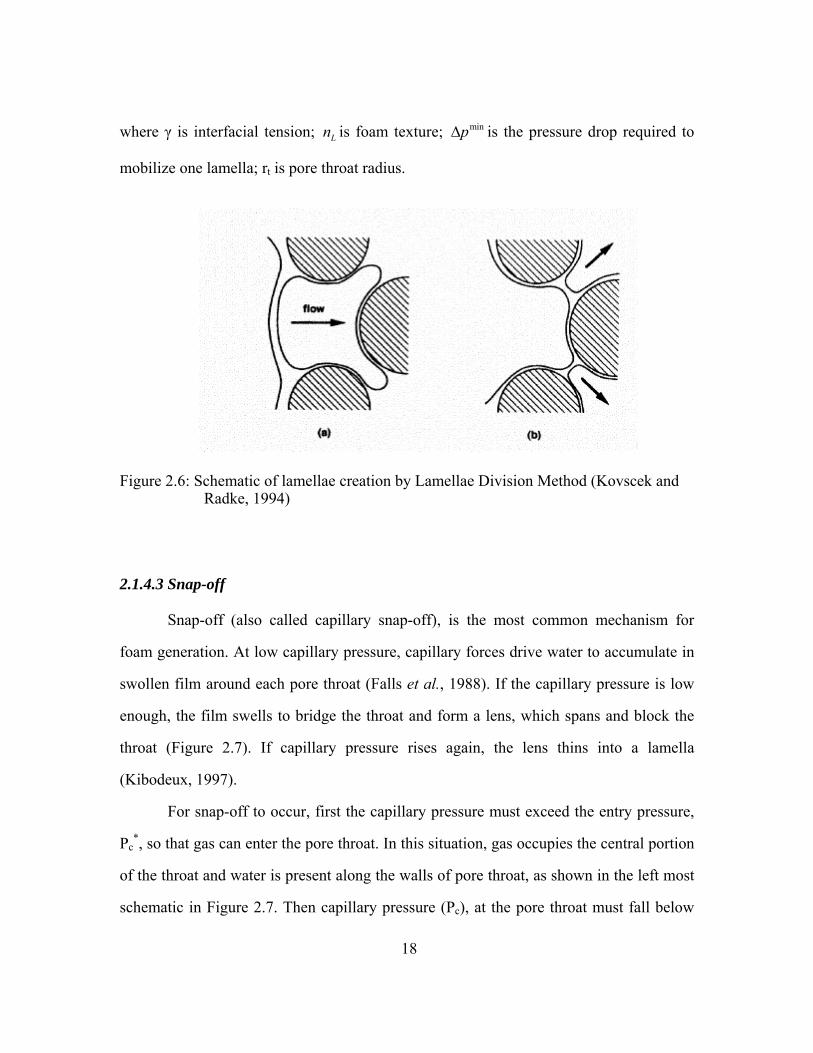
Figure 2.6: Schematic of lamellae creation by Lamellae Division Method (Kovscek and Radke, 1994) .................................................................18
Figure 2.7: Snap-off mechanism of lamella creation. (a) gas entry into liquid filled pores; (b) swelling of films to bridge the throat; (c) liquid lens bridging the throat after snap-off (Kovscek and Radke, 1994) ...........19
Figure 2.8: Pressure difference across curved surface in a foam lamella. Radius of curvature at the center (R1A) is greater than radius of curvature at the Plateau border (R1B) Pressure at the center of lamellae (PA) is greater than pressure at Plateau borders (PB) , thus resulting in liquid drainage from the center of film to Plateau borders (Schramm and Wassmuth, 1994). ...................................................................................................21
Figure 2.9: Disjoining pressure acting in a lamella (Alvarez, 1998). ...........24 Figure 2.10: Disjoining pressure curve .........................................................25 Figure 2.11: Configuration of the oil at gas-aqueous interface. a) oil drop inside
the solution; b)oil drop at the surface separated by the pseudoemulsion film; c)oil lens; and d) spread oil layer at the surface. (From Wasan, 1992) 27
Figure 2.12: Suggested bridging mechanism of antifoaming in foam films by oil (Borrowed from Frye and Berg, 1989). ...............................................28
Figure 2.13: Residual oil saturation as a function of capillary number (Nca). Figure copied from Green and Willhite (1998). ..................................31
Figure 2.14: Molecular structure of anionic surfactant .................................32 Figure 2.15: Microemulsion phase behavior representation by ternary diagram (
Saad, 1989) ..........................................................................................39 Figure 2.16: Effect of salinity on microemulsion phase behavior ................39

xix
Figure 2.17: Interfacial tension and solubilization parameter as a function of salinity (Healy and Reed, 1976)...........................................................41
Figure 3.1: Stability of sodium metaborate in the presence of Ca++ ions. ...53 Figure 3.2: Polymer (Floppam 3330S) viscosity versus polymer concentration
data… ...................................................................................................54 Figure 3.3: A schematic of coreflood apparatus. ..........................................58 Figure 3.4: Oil and water solubilization ratios versus TDS concentration in
phase behavior test carried out with Formulation-A (for sandstone corefloods) ...........................................................................................65
Figure 3.5: Oil and water solubilization ratios versus TDS concentration in phase behavior test carried out with Formulation-B1 (for dolomite corefloods) ...........................................................................................66
Figure 3.6: Oil and water solubilization ratios versus TDS concentration in phase behavior test carried out with Formulation-B2 (for dolomite corefloods) ...........................................................................................67
Figure 3.7: Height of foam column versus time obtained from foaming test carried out to determine the ability of selected surfactants to form stable foam. ....................................................................................................69
Figure 3.8: Pressure drop during ASP sandstone coreflood (ASP_SCD1). .73 Figure 3.9: Pressure drop during ASP dolomite coreflood (ASP_DCP1) ....74 Figure 3.10: Oil recovery and oil cut during ASP sandstone coreflood
(ASP_SCD1) ........................................................................................75 Figure 3.11: Oil recovery and oil cut during ASP dolomite coreflood
(ASP_DCP1) ........................................................................................76 Figure 3.12: Pressure drop during ASG sandstone coreflood (ASG_SCD7).78 Figure 3.13: Pressure drop during ASG dolomite coreflood (ASG_DCP15).78 Figure 3.14: Pressure drop and effluent salinity versus injected pore volume in
ASG sandstone coreflood (ASG_SCD7). ............................................79 Figure 3.15: Pressure drop and effluent salinity versus injected pore volume in
ASG dolomite coreflood (ASG_DCP15). ...........................................80 Figure 3.16: Oil recovery and oil cut during ASG sandstone coreflood
(ASG_SCD7) .......................................................................................82 Figure 3.17: Oil recovery and oil cut during ASG dolomite coreflood
(ASG_DCP15). ....................................................................................82 Figure 3.18: Idealized sectional pressure drop in ASG/ ASP floods under
conditions of favorable mobility ratio ..................................................84

xx
Figure 3.19: Pressure drop profile in Section 3 in ASP sandstone coreflood (ASP_SCD1). .......................................................................................85
Figure 3.20: Pressure drop data from Section 3 in ASG sandstone coreflood (ASG_SCD7). The bold line shows the idealized trend of the pressure drop. 86
Figure 3.21: The effect of foam on the mobility of injected fluids in ASG process..................................................................................................87
Figure 3.22: Pore level schematic of foam in porous media. ........................89 Figure 3.23: Displacement process in ASG flooding. ..................................91 Figure 4.1: Pressure response in high permeability ASG coreflood
(ASG_DCP9). ......................................................................................98 Figure 4.2: Oil recovery and oil cut data from high permeability ASG coreflood
(ASG_DCP9). ......................................................................................98 Figure 4.3: Pressure response in medium permeability ASG coreflood
(ASG_DCP8). ....................................................................................101 Figure 4.4: Oil recovery and oil cut data from medium permeability ASG
coreflood (ASG_DCP8). ....................................................................101 Figure 4.5: Pressure response in low permeability ASG coreflood
(ASG_DCP10). The increasing pressure trend during foam-drive is absent.. ...............................................................................................102
Figure 4.6: Oil recovery and oil cut data from low permeability ASG coreflood (ASG_DCP10) ...................................................................................102
Figure 4.7: Pressure drop in high foam quality ASG coreflood (ASG_DCP2). 106
Figure 4.8: Oil recovery and oil cut in high quality ASG coreflood (ASG_DCP2). ....................................................................................106
Figure 4.9: Pressure drop in low foam quality ASG coreflood (ASG_DCP15)….. .............................................................................107
Figure 4.10: Oil recovery and oil cut in low foam quality ASG coreflood (ASG_DCP15). ..................................................................................107
Figure 4.11: Pressure drop in ASG_DCP11. The chemical slug size in ASG_DCP11 was 0.15 PV. ...............................................................111
Figure 4.12: Oil recoveries in ASG_DCP11 and ASG_DCP9. A smaller slug size (0.15 PV) was injected in ASG_DCP11 compared to ASG_DCP9 (Slug size: 0.3 PV). ............................................................................111
Figure 4.13: Effluent gas rate and surfactant concentration in ASG_DCP11. Gas breakthrough coincided with surfactant breakthrough indicating absence of gas viscous fingering through the oil bank. ...................................112
xxi
Figure 4.14: A comparison of pressure drop data from ASG_SCD4 and ASG_SCD7 to study the effect of surfactant type on ASG process ..115
Figure 4.15: A comparison of oil recovery data from ASG_SCD4 and ASG_SCD7 to study the effect of surfactant type on ASG process. .115
Figure 5.1: Henry's Constant for Carbon Dioxide in water - from Carroll et al. The value of Henry’s constant presented in the figure is in the form of Kinv (Equation 5.3) ...........................................................................124
Figure 5.2: Variation of brine-CO2 IFT with pressure at brine salinity of 75000 ppm (Bachu and Bennion, 2009). ......................................................127
Figure 5.3: Variation in reaction rate (hydrolysis of SDS) with temperature. The experimental temperature in corefloods presented later in this chapter was 52oC, which corresponds to the X-axis value of 0.003 in the above plot. 129
Figure 5.4: Concentration of carbonate species in solution versus pH (Orrego, 2004) ..................................................................................................131
Figure 5.5: Change in solubilization parameters as a function of alkali concentration (Martin and Oxley, 1985). ...........................................133
Figure 5.6: Oil and water solubilization ratios versus NaCl concentration (wt%) obtained in phase behavior test carried out to identify optimal formulation for ASG corefloods presented in this chapter. ...................................139
Figure 5.7: Results of phase behavior experiments with and without alkali (Na2CO3) ...........................................................................................140
Figure 5.8: Comparison of pressure drop across the core data from low and high pressure CO2-ASG corefloods. .........................................................143
Figure 5.9: Comparison of oil recoveries of low and high pressure CO2 ASG corefloods. ..........................................................................................145
Figure 5.10: Effluent pH data from low pressure CO2 ASG corefloods. ...145 Figure 5.11: Change in solubilization parameters as a function of alkali
concentration (Martin and Oxley, 1985). ...........................................146 Figure 5.12: Comparison of pressure drop data across the core of low pressure
CO2 and low pressure N2 ASG corefloods. ......................................147 Figure 5.13: Comparison of pressure drop data across the core from high
pressure CO2 and high pressure N2 ASG corefloods. .......................148 Figure 5.14: Comparison of oil recovery data from low pressure CO2 ASG
coreflood and low pressure N2 ASG coreflood. ................................148 Figure 5.15: Comparison of oil recovery data from high pressure CO2 ASG
coreflood and high pressure N2 ASG coreflood. ...............................149

xxii
Figure 5.16: Comparison of pH data from low pressure CO2 and low pressure N2 ASG corefloods. ...........................................................................149
Figure 5.17: Comparison of pressure drop data across the core from 50% and 80% foam quality CO2 ASG corefloods carried out at high pressure.151
Figure 5.18: Comparison of oil recoveries of low and high foam quality CO2 ASG corefloods. Both corefloods were carried out at 400 psi to study whether increased foam quality improves foam stability by compensating the loss of CO2 due to its dissolution in water. .................................152
Figure 5.19: Comparison of oil recovery data from high pressure CO2 ASG coreflood and high pressure CO2 ASG coreflood with 2 wt% surfactant concentration in the slug. ...................................................................153
Figure 5.20: Comparison of pressure drop data across the core from DSDM_HP_CO2 and DSDM_HP_CO2_2%. ...................................153
Figure 6.1: a) Internal layering of micelles (stratifications) inside the foam film at high surfactant concentrations. Figure 6.1b and 6.1c show layer by layer thinning of micellar foam films (Wasan et al., 1992) ........................159
Figure 6.2: Photomicrograph of a two dimensional foam (macroemulsion foam) in which oil drops has drained from foam films to the Plateau border (Wasan et al., 1992) ...........................................................................160
Figure 6.3: a) Inverse micelle. Inverse micelle is formed in Type II(+) microemulsion ; b) micelle formed in aqueous solution. Straight micelles are formed in Type II(-) microemulsion. ...........................................161
Figure 6.4: Phase behavior of water-oil-surfactant system illustrating the effect of changing salinity. ...........................................................................164
Figure 6.5: Variation in foam height versus elapsed time in foaming test conducted on microemulsion phases from Type II(-) and Type III environment and excess phases from Type III and Type II(+) environment. 164
Figure 6.6: Pipette on the left contains Type II(-) microemulsion system. Pipette on the right contains Type II(-) microemulsion separated from the excess oleic phase ..........................................................................................165
Figure 6.7: Pipette on the left contains Type II(+) microemulsion system. Pipette on the right contains excess aqueous phase separated from Type II(+) microemulsion system ...............................................................165
Figure 6.8: Pipette on the left contains Type III microemulsion system. Pipette on the right contains Type III microemulsion separated from the excess oleic phase and excess aqueous phases ..............................................165
Figure 6.9: Pipette on the left contains Type III microemulsion system. Pipette on the right contains excess aqueous phases separated from Type III microemulsion system. ......................................................................166

xxiii
Figure 6.10: (A): Foam in pipette containing Type II(-) microemulsion; (B): Foaming in pipette containing excess aqueous phase from Type III microemulsion. (C) Foam in pipette containing Type III microemulsion; (4) Foam in pipette containing excess aqueous phase from Type II (+) microemulsion. All pictures are taken immediately after shaking the pipettes. ..............................................................................................166
Figure 6.11: Height of foam column in pipettes 15 minutes after shaking the pipettes (pipette description is given in Figure 6.6) ...........................167
Figure 6.12: Bottles containing Type II(-) and Type III microemulsion systems arranged in the order of increasing salinity. Microemulsion systems were used in sandpack tests carried out to study foam stability .................169
Figure 6.13: A, B, C, D , E: Results of the sandpack tests carried out by coinjection of gas (CO2) and saturated microemulsion phase at various salinities, in Type II(+) and Type III region. MRF increased with the decrease in salinity and amount of solubilized oil. ............................172
Figure 6.14: Mobility reduction factor of microemulsion foam versus microemulsion salinity .......................................................................173
Figure 6.15: Mobility reduction factor (MRF) of microemulsion foam versus (CSEU-CSE)/CSE plot. Microemulsion foam strength exhibits a direct relation to the parameter (CSEU-CSE)/CSE. The value 0 on the X-axis implies salinity equal to CSEU, whereas, the value 1 on the X-axis implies zero salinity. MRF increases with the decrease in salinity. ...............174
Figure 6.16: Comparison of experimental and simulated oil recovery. Simulation included the effect of salinity on foam strength. .............177
Figure 6.17: History match of experimental pressure drop across the core in ASG coreflood. The pressure drop data obtained from ASG model that accounts for the salinity effect is a better match to experimental data.178
Figure 6.18: Surfactant/oil/water phase behavior match obtained by using Hand’s equation. The parameter HBNC is varied to match experimental data. The lower and upper salinity limits are at 29000 ppm and 52000 ppm, respectively. ..............................................................................180
Figure 6.19: Surfactant/oil/water phase behavior match obtained by using Hand’s equation. The parameter HBNC is varied to match experimental data. The lower salinity limit (CSEL) is increased and made equal to CSEU. Only Type II(-) and Type II(+) regions exist.........................181
Figure 6.20: Comparison of oil recovery and oil cut data from SP flooding simulation using full scale approach and approximate approach. The results from simulations show good agreement. ................................183
Figure 6.21: Comparison of oil recovery and oil cut data from ASG flooding simulation using full scale approach and approximate approach. The results from simulations show good agreement .................................184

xxiv
Figure 6.22: Comparison of effluent microemulsion cut data from ASP simulations using full scale and approximate approaches. The microemulsion cut data in simulation using full scale approach shows some fluctuation, which is due to numerical instability. ...................184
Figure 6.23: Comparison of effluent microemulsion cut data from ASG simulations using full scale and approximate approaches. ................185
Figure A1: Waterflood pressure data (ASP_SCD1) ...................................192 Figure A2: Waterflood pressure data (ASP_DCP1) ...................................193 Figure A3: Waterflood pressure data (ASG_SCD7) ..................................194 Figure A4: Waterflood pressure data (ASG_DCP15) ................................195 Figure A5: Waterflood pressure data (ASG_DCP2) ..................................196 Figure A6: Waterflood pressure data (ASG_DCP8) ..................................197 Figure A7: Waterflood pressure data (ASG_DCP9) ..................................198 Figure A8: Waterflood pressure data (ASG_DCP10) ................................199 Figure A9: Waterflood pressure data (ASG_DCP11) ................................200 Figure A10: Waterflood pressure data (ASG_LP_CO2) ............................201 Figure A11: Waterflood pressure data (ASG_HP_CO2) ............................202 Figure A12: Waterflood pressure data (ASG_LP_N2) ...............................203 Figure A13: Waterflood pressure data (ASG_HP_N2) ..............................204 Figure A14: Waterflood pressure data (ASG_HP_CO2_HQ) ....................205 Figure A15: Waterflood pressure data (ASG_HP_CO2_2%) ....................206

1
CHAPTER 1
Introduction
1.1 OVERVIEW
Oil plays an instrumental role in global economics. The increasing demand and
shrinking resource base of hydrocarbon fuels has put emphasis on identifying
economically and technically feasible oil recovery techniques. In addition, many oil
fields around the world have reached maturity and are in declining production phase. It is
estimated that a one percent increase of global oil recovery efficiency would bring forth
88 Billion barrels (BBLS) of expanded conventional oil reserves, sufficient to replace
three years of world production at a rate of 27 billion barrels per year. According to the
Oil and Gas Journal’s Worldwide EOR Surveys (2006), volume of oil produced by EOR
increased four times from 1982 (0.6 MMBPD) to 2006 (to 2.5 MMBPD). In 2006, there
were approximately 300 active EOR projects worldwide with countries like the U.S.,
Canada, Venezuela, and China accounting for nearly 90% of those projects. In the United
States (U.S.) EOR production is roughly 14% of the total oil production.
EOR techniques can increase oil production and oil recovery efficiency to
economic levels in matured or underperforming reservoirs. Hence, they are essential to
meet future demands of energy. At present, the oil and gas industry is putting a lot of
emphasis on the development, optimization, and implementation of new EOR methods.
The use of foamed-gas in low interfacial tension (IFT) chemical-EOR applications is one
such novel technique that has the potential to improve oil recovery. In literature, this
technique of foam assisted low IFT enhanced oil recovery is often referred as Alkali/
Surfactant/ Polymer/ Foam (ASPF) flooding, or Alkali/ Surfactant/ Foam (ASF) flooding,

2
or Alkali/ Surfactant/ Gas (ASG) flooding (Wang, 2006; Srivastava et al., 2009). The
acronym ASG is used in this dissertation for foam assisted low IFT enhanced oil
recovery.
Conventional chemical EOR methods, for e.g. Alkali/Surfactant/ Polymer (ASP)
flooding or Surfactant/Polymer (SP) flooding, involve injection of an optimal volume of
high performance surfactants (also referred as slug) that mobilizes residual oil and results
in the formation of oil bank. The oil-bank and chemical slug is then displaced by chase
fluid (also referred to as the drive). Polymer is mixed in both slug and drive fluids to
increase viscosity and provide favorable mobility-ratio (i.e. a mobility ratio less than 1)
between displaced and displacing phases, i.e. between oil bank and slug and also between
slug and drive. However, there are several disadvantages of using polymer. Some of the
major disadvantages are:
1. High molecular weight polymers can plug rocks with very low permeability, or if a
lower molecular weight polymer is used to avoid plugging, then the cost of using
polymer increases and eventually becomes uneconomic.
2. Many of the commercially available EOR polymers can be unstable at high
temperature. HPAM (partially hydrolyzed polyacrylamide), the most commonly used
polymer in EOR applications, undergoes thermal oxidation at temperatures above
600C and loses its viscosity. As a consequence, higher concentration of polymer is
required in actual application to compensate for the loss of viscosity (Niu et al.,
2001).
3. Many EOR polymers are also unstable at high salinity (Green and Willhite, 1998;
Baviere, 1991). The electrostatic repulsion between the negatively charged groups
(macro-ion) in the polymer, for example carboxyl (COO-) group in HPAM, extends
the molecular chains of polymer, and this extension enlarges the volume of the

3
polymer and increases its viscosity. If the salinity is high, the repulsion between
negatively charged group ions is weakened by the formation of a double layer of
electrolytes and extension is reduced, which causes polymer chain to coil-up. This
coiling-up of polymer chain causes a decrease in its volume and hence in the viscosity
of polymer solution. The effect of divalent ions (Ca++, Mg++) on polymer viscosity is
more pronounced than the effect of monovalent ions (Na+, K+). Divalent ions bond
readily to the negatively charged macro-ion in preference to monovalent ions.
4. Some polymers can mechanically degrade due to high shear stress through chokes or
perforations at high flow rate.
5. There can be other problems with polymers under some conditions associated with
unfavorable interactions with surfactants.
One potential alternative to polymer in chemical-EOR applications, for providing
mobility control, is to use gas (ASG flooding). The coinjection or alternate injection of
gas and chemical slug results in the formation of foam. Foam reduces gas mobility and
traps a fraction of flowing gas, resulting in the increased gas saturation in porous
medium. As a consequence of increased gas saturation, the liquid relative permeability is
reduced. The reduction in relative permeability lowers the mobility of displacing fluids
and thus improves displacement efficiency of the process.
The use of gas for mobility control may widen the applicability of chemical-EOR
methods to conditions not feasible for polymer applications. For example, in carbonate
reservoirs, where the dissolution of calcite (CaCO3) or dolomite (CaMg(CO3)2) increases
the concentration of divalent ions in the solution, gas can be used for mobility control.
Also, in high temperature or low permeability reservoirs, gas can be a potential
alternative to polymer for mobility control.

4
Since mechanisms involved in both chemical flooding and foam flooding are
present in ASG process, it should possess attributes that are favorable to both processes.
Those attributes are: a) ultra low IFT between displaced (oil) and displacing phases
(slug), and b) desired foam propagation, in slug and drive, for effective mobility control.
ASG flooding, however, is a relatively less investigated technique and mechanisms
involved in it are not well understood. Therefore, its EOR potential under different rock,
fluid, and process conditions needs to be ascertained before it can qualify as a viable
EOR method.
1.2 SCOPE OF RESEARCH
Stable foam propagation in the environments that are normally encountered in
chemical-EOR processes is important for the success of ASG process. In chemical EOR
processes, surfactant/oil/brine phase behavior varies with salinity, which results in the
formation of Type II(-), Type III, or Type II(+) microemulsion systems. Thus, foam
needs to retain its mobility reduction characteristics in different microemulsion
environments in order to provide effective mobility control. The design of chemical EOR
process may also involve imposing a negative salinity gradient (Baviere and Pope, 1991)
in injected fluids. For applying a negative salinity gradient, the slug formulation is
selected in such a way that optimal salinity is lower than the in situ reservoir brine
salinity. The slug is followed by drive whose salinity is lower than the salinity of slug.
The decreasing trend in salinity reduces surfactant entrapment in immobile phases and
leads to the improvement in oil recovery. The negative salinity gradient concept is
increasingly becoming an accepted paradigm for designing chemical-EOR processes.
Therefore, the impact of negative salinity gradient on foam properties, and thus ASG
process, needs to be studied.

5
The properties of foam vary with rock, fluid, and process control parameters.
Foam stability exhibits strong dependence on permeability, wettability, surfactant type,
surfactant concentration, fluid injection rates, etc. Therefore, these parameters also affect
the performance of ASG process and therefore should be investigated.
Pressure has a pronounced effect on foam behavior. Chemical and physical
properties of gases vary with pressure. Solubility of gases in both aqueous and
hydrocarbon phases is a strong function of pressure. As a consequence, foam strength and
foam propagation are affected by the solubility of foaming gas in the liquid. In addition,
some gases also react with water on dissolution. For example, a fraction of dissolved CO2
in water forms carbonic acid and lowers pH of the aqueous phase. A change in pH may
affect stability of chemical species present in the aqueous phase and also the stability of
foam films. Therefore, effects of pressure on ASG process are important and need to be
studied.
UTCHEM, a chemical simulator developed at the University of Texas at Austin,
is the only simulator available in public domain that can model foam and chemical
floods. The foam model in UTCHEM, however, lacks the functionality to model ASG
flooding as it does not take into account effects solubilized oil and different
microemulsion environment on foam. Therefore, a model for gas mobility in ASG
flooding needs to be implemented in UTCHEM to augment its functionality to ASG
simulations.
1.3 RESEARCH OBJECTIVES
The present research was performed with following objectives:
1. To demonstrate the potential of ASG flooding as an EOR technique.

6
2. To identify parameters that influence ASG process, and study physical
and chemical mechanisms involved in ASG flooding.
3. To develop a model for gas mobility in low –IFT chemical flooding.
1.4 RESEARCH METHODOLOGY
The research primarily involved feasibility studies of ASG process. As a first step,
the EOR potential of ASG process was demonstrated by conducting tertiary oil recovery
corefloods in which gas was used for mobility control. The materials, experiments, and
procedures required in ASG flooding were identified. The results of ASG corefloods
were analyzed and compared with ASP corefloods, carried out under similar conditions,
to obtain a comparative assessment of the EOR potential of ASG process.
Once a preliminary estimate of the EOR potential of ASG process was obtained,
ASG corefloods were performed under different conditions of rock, fluid, and process
design parameters; and the feasibility of ASG flooding under different conditions was
ascertained.
Finally, a simple model for gas mobility in chemical flooding was developed. In
addition, an approximate approach to simulate foamed gas flow in chemical floods was
tested. The approximate approach includes modeling ASG process in only Type II(-) and
Type II(+) microemulsion environments while retaining the effects of Type III
microemulsion environment on oil mobilization.
1.5 ORGANIZATION OF CHAPTERS
Chapter 2 presents background studies on both foam and chemical enhanced oil
recovery processes. First, a detailed review of foam properties and flow characteristics is

7
presented. Second, main mechanisms involved in chemical-EOR are reviewed. Finally,
the potential of combining chemical and foam flooding is discussed.
Chapter 3 demonstrates the EOR potential of ASG process. Results of chemical
screening tests and ASG coreflood experiments are analyzed and characteristics of oil
displacement process in ASG process are studied. A comparison of ASP and ASG
corefloods, conducted under similar conditions, is included.
Chapter 4 focuses on the main parameters that affect ASG process. Main
parameters studied were permeability, fluid injection rates, slug size, and surfactant type.
The effects of above-mentioned parameters on mobility control in ASG process are
examined, and conditions for optimal ASG performance are identified.
Chapter 5 presents the study on the effect of pressure on ASG process. The effects
of pressure on foam, as well as surfactant phase behavior, in ASG flooding are studied.
Chapter 6 describes a simple model for gas mobility in the presence of foam in
ASG flooding. The results of experimental study carried out to study foam strength in
different microemulsion environment are presented. Also, a simplified approach to model
ASG process in UTCHEM is discussed.
Finally, Chapter 7 presents an overall summary of the research and provides
recommendations for future work.

8
CHAPTER 2
A Review of Foam and Chemical EOR Process
This chapter reviews technical concepts related to both foam and chemical EOR
processes. The review was done to enhance the understanding of various mechanisms
involved in the two processes. After presenting basic concepts in foam and chemical
EOR, the chapter discusses the potential of foam for mobility control in chemical-EOR.
2.1 FOAM: BASIC CONCEPTS
Foam is a dispersion of gas in liquid (Bickerman, 1973). The dispersed phase is
sometimes referred as the internal or discontinuous phase, and the liquid phase as the
external or continuous phase. In foam, gas bubbles are separated by thin film of fluid
called lamella. Lamellae contact each other or the solid pore walls at a region called
‘Plateau border’. The lamella surrounding gas bubbles are normally unstable and break
very quickly. However, the presence of surface active agents (surfactants) stabilizes the
lamellae, thus improving foam stability.
Figure 2.1: A schematic of three bubbles meeting at a plateau border. The thickness of lamella is greatly exaggerated in this figure.

9
The significance of foam in petroleum industry mainly arises from its applications
in 1) enhanced oil recovery (EOR), 2) acid diversion in well stimulation, 3) well drilling
and fracturing, and 4) recovery of waste in environmental remediation.
In gas-EOR applications, foam is used to control gas mobility. Gas flooding
suffers from poor sweep efficiency due to the low density and viscosity of gas. Low
density of gas causes gravity segregation and gravity override. Low gas viscosity results
in viscous fingering and unfavorable mobility ratio. Foam reduces gas mobility by
increasing its apparent viscosity and reducing its relative permeability. The lower
mobility of gas improves its volumetric sweep efficiency.
2.1.1 Foam Classification
Foam can be divided into two main groups: bulk foam and foam in porous media.
Bulk foam is formed when the volume in which foam resides is much larger than the
individual bubbles (Rossen, 1996). Because bubbles in bulk foam are relatively small in
comparison to flow channels, the velocities of gas and liquid phases are very similar.
Bulk foam, therefore, can be considered as a single homogeneous phase.
On the other hand, the size of foam bubble in porous media is limited by the size
of pores. Foam behavior in porous media is characterized by the pore size distribution as
well as the pore throat distribution (Yan, 2006). The individual bubbles may occupy one
or several pore bodies (Ettinger and Radke, 1992). Foam is present as a discontinuous
phase in which gas bubbles are separated from each other by lamellae and from the pore
wall by liquid films. The flow of gas and liquid takes place through separate channels.
Gas flows through the larger pores, while liquid flows along the surface of rock grains
and through network of lamellae separating the gas bubbles. Foam does not behave as a
continuous and homogeneous phase in a porous medium.

10
2.1.2 Flow Characteristics of Foam in Porous Media
In porous media, foam flow is characterized by the location of wetting and non-
wetting phases in pores (Figure 2.). The non-wetting phase resides in the central portion
of the large pores, while wetting phase resides in corner of the gas-occupied pores and in
thin wetting films coating the pore walls.
Figure 2.2: Distibution of wetting and non-wetting fluids in cornered pores. (Kovscek and Radke, 1994)
During the flow of foam in porous media, gas can be trapped, or flowing as a
continuous or discontinuous phase (Figure 2.3). In continuous-gas flow, the porous media
contains some channels uninterrupted by lamella. In discontinuous-gas flow, the entire
gas phase is made discontinuous by lamellae, and no gas channels are continuous over
macroscopic distances. Discontinuous foam is usually associated with stronger foam
strength. All three types of channels can be present in the porous medium during foam
flow.

11
Figure 2.3: Schematic of continuous and discontinuous gas channels in porous media (Tanzil, 2001)
Foam affects both gas and liquid mobility in a porous medium, but in different
ways.
2.1.2.1 Effect of Foam on Gas Mobility
As mentioned above, in foam, gas bubbles are surrounded by thin films of liquid
called lamella. Lamella surrounding foam bubbles may be stationary or moving. The gas
trapped by stationary lamellae is immobilized (Friedmann et a.l, 1991), resulting in the
reduction of mobile gas saturation. Stationary lamella blocks gas flow and alters gas flow
paths, thus affecting the gas relative permeability function. On the other hand, moving
lamellae experience a drag force when they slide along the pore walls. The flowing

12
fraction of gas experiences increased resistance to flow. This effect is similar to
increasing gas viscosity, since it increases the resistance to flow of the flowing portion of
the gas. Since the actual viscosity of gas is not increased by foam, the effect of increased
resistance to gas flow due to the presence of lamellae is termed ‘increase in apparent gas
viscosity’. Thus foam modifies gas mobility by reducing gas relative permeability and
increasing apparent gas viscosity.
2.1.2.2 Effect of Foam on Liquid Mobility
Foam indirectly affects liquid relative permeability by affecting liquid saturation
in pore spaces. Since foam reduces gas mobility, gas saturation in pores is increased. The
increased gas saturation implies a lower liquid saturation, which results in a lower value
of liquid relative permeability. Thus foam reduces liquid relative permeability not by
changing the krw(Sw) relationship, but by changing water saturation (Sw) itself; lower
values of Sw implies lower water relative permeability (krw) .
The fact that water relative permeability function remains unchanged by foam can
be used to calculate gas mobility in the presence of foam. One can calculate foam
mobility by water flow rate (qw) and pressure gradient ( wp∇ ) in the presence of foam, if
the water relative permeability function (krw(Sw)) in the absence of foam and water
saturation (Sw) in the presence of foam is known, using Darcy’s law.
( )rw w w
ww
k S kA pqμ
− ∇= 2.1
where k is the rock permeability, wμ is water viscosity, and A is the cross-sectional area
to flow. Applying Darcy’s law to gas phase in the presence of foam, the gas relative
mobility is given by

13
g rg gq kA pλ= ∇ 2.2
, :
( )
( ),
assuming capillary pressure gradient, P , 0, .
from equation 2-1
rg
frg g
rgg
frg g g
rgg g
c g w
where foam mobility given by
k S
k S qTherefore
kA p
equal to i e p p
λ
λμ
λμ
=
=
= =∇
Δ Δ = Δ
( )g g rw wrg
g w w
q q k SkA p q
λμ
= =∇
2.3
Equation 2.3 shows that if one knows water flow rate, gas flow rate, and water relative
permeability in the presence of foam, one can calculate mobility of gas in the presence of
foam.
2.1.3 Main Foam Parameters
Two main parameters that are used to characterize foam are 1) foam texture and
2) foam quality.
2.1.3.1 Foam Texture
Foam texture is characterized by the bubble size distribution. When the bubble
size distribution is narrow, foam is said to have a ‘fine texture’. On the other hand, when
the bubble size distribution is wide, foam is said to have a ‘coarse texture’. Friedman and
Jensen (1986) compared foam stability on the basis of bubble size distribution, and
concluded that foam with narrow bubble size distribution was more stable than wide size

14
distribution. Stable fine textured foam possesses a low mobility resulting from both
reduced gas relative permeability and increased effective viscosity. Foam texture is a
function of surfactant concentration, surfactant type, pore structure, pressure, and
injection rates. In general, for a constant volume of fluid, foam with smaller bubble size
is more viscous.
2.1.3.2 Foam Quality
Foam quality is the volume fraction of the foam which contains gas. It is defined
as: gas volumeFoam quality = ×100%
gas volume + liquid volume 2.4
The measurement of in-situ foam quality is difficult. In corefloods, injection foam
quality is more often used. It is defined as:
gas injection rateinjection foam quality = ×100%
gas injection rate + liquid injection rate 2.5
Several studies have tried to relate foam quality to foam mobility (Blauer, 1974;
Mitchell, 1970). These studies indicate that there is a certain range of foam quality within
which foam exhibits mobility reduction characteristics, and that range of foam quality
varies with rock, chemical and fluid properties, as well as with injection methodology
and rates. Several authors have estimated that range to be between 40 to 95% foam
qualities (Chang et al., 1999; Hutchins et al., 2005).
Based on experimental results, Blauer (1974) described the effect of foam quality
on viscosity by dividing the range of foam qualities into regions of different bubble
interactions. The first region exists between 0 to 52% foam qualities, characterized by

15
spherical bubbles uniformly dispersed throughout the foam volume; the bubbles are not
in contact with one another, and the flow is Newtonian. Above 53% foam quality,
spherical bubbles are loosely packed in a cubic arrangement and contact one another
during flow, resulting in an increase in viscosity. Above foam quality of 74%, the
bubbles deform from spheres to parallelepipeds during flow. Maximum foam viscosities
occur in this range. Figure 2.4 plots foam quality versus foam viscosity (Bullen et al.,
1975). The curve is skewed towards right with higher foam viscosities at foam qualities
between 50% and 95%. Above quality of 95%, foams are no longer stable; liquid become
the dispersed phase, like a mist. On the other end of the curve, at very low foam qualities
(typically below 40%), gas exists as dispersed pockets (of gas) in the liquid. Foam is
highly unstable at such low or high foam qualities; thus mobility reduction is not
achieved at such qualities. Mitchell (1970) showed that foam below a quality of 55%
behaves like a Newtonian fluid, and foam with quality above 55% exhibits shear thinning
properties.
Figure 2.4: Foam quality versus foam viscosity (adapted from Bullen, 1975)

16
Viscosity of low quality foam is less sensitive to size changes. This is because for
a constant volume of liquid, an equivalent reduction in bubble size causes more severe
increase in the surface area and number of links in a polyhedral bubble (higher quality
foam) than in a spherical one (lower quality foam).
2.1.4 Mechanisms of Foam Generation in Porous Media
Foam generation is caused by lamella creation in the porous medium. The
generation of lamella is accompanied by transition of gas mobility from relatively high to
relatively low values. The three main mechanisms of lamella creation are: leave-behind,
lamella division, and snap-off.
2.1.4.1 Leave-behind
When gas enters a porous medium initially saturated with wetting phase, it leaves
lamellae in pore throats between the pore bodies entered by the gas (Figure 2.5). This
process is called leave-behind. This mechanism happens only during drainage. A number
of lamellae can be created by leave-behind. The lamella once formed can divide into
more lamellae by lamella division.

17
Figure 2.5: Schematic of lamellae creation by Leave-Behind Method. Rock grains are represented in lined circles, liquid in gray color, and gas in white color.
2.1.4.2 Lamella Division
Lamella division is an effective foam generation mechanism if lamellae already
exist and are stable enough to endure movement through pore bodies, and the pressure
gradient is high enough for the lamellae to be displaced out of their static positions in the
pore throat. Mobilization of lamellae depends upon the initial value of pressure gradient,
which is the minimum pressure gradient for mobilization of the stationary lamella (Falls
et. al., 1989). The minimum pressure gradient is directly proportional to the interfacial
tension and inversely proportional to the pore-throat radius.
( )min min LL
t
np p nrγ
∇ = Δ − 2.6
18
where γ is interfacial tension; Ln is foam texture; minpΔ is the pressure drop required to
mobilize one lamella; rt is pore throat radius.
Figure 2.6: Schematic of lamellae creation by Lamellae Division Method (Kovscek and Radke, 1994)
2.1.4.3 Snap-off
Snap-off (also called capillary snap-off), is the most common mechanism for
foam generation. At low capillary pressure, capillary forces drive water to accumulate in
swollen film around each pore throat (Falls et al., 1988). If the capillary pressure is low
enough, the film swells to bridge the throat and form a lens, which spans and block the
throat (Figure 2.7). If capillary pressure rises again, the lens thins into a lamella
(Kibodeux, 1997).
For snap-off to occur, first the capillary pressure must exceed the entry pressure,
Pc*, so that gas can enter the pore throat. In this situation, gas occupies the central portion
of the throat and water is present along the walls of pore throat, as shown in the left most
schematic in Figure 2.7. Then capillary pressure (Pc), at the pore throat must fall below

19
the critical capillary pressure for the snap-off (Pcsn),, so that the liquid film can swell and
bridge the pore throat (as shown in the right most schematic in Figure 2.7). For straight
cylindrical throats, Pcsn = Pc
*/2. Falls et al. (1988) demonstrated experimentally that the
critical capillary pressure for snap-off in bead packs is also close to this value.
Rossen et al. (1996) documented ways by which capillary pressure can fall from
Pc* to Pc
sn to allow snap-off. They are: 1) macroscopic imbibition, 2) fluctuations in
capillary pressure as individual bubbles respond to changing lamella curvatures, with
movement through complex pore network (Rossen, 1990), 3) low capillary pressure at the
rear of the bubble, due to differing pressure gradient between gas and water phases,
especially in long bubbles, 4) low capillary pressure in the high permeability region at a
sharp transition from low permeability to high permeability (Yortos and Chang, 1990),
and 5) formation of a liquid lens behind a gas bubble due to liquid sweeping back when
gas invades liquid-filled pore body during drainage (Roof, 1970,; Ransoff and Radke,
1988; Chambers and Radke, 1990).
Figure 2.7: Snap-off mechanism of lamella creation. (a) gas entry into liquid filled pores; (b) swelling of films to bridge the throat; (c) liquid lens bridging the throat after snap-off (Kovscek and Radke, 1994)

20
2.1.5 Factors Influencing Foam Stability
Foams are thermodynamically unstable. Foam stability is a function of lamella
stability. In turn lamella stability depends on rate of capillary drainage, gas diffusion,
disjoining pressure, anti-foaming effect of oil, surfactant concentration, aqueous phase
salinity, and mechanical deformations.
2.1.5.1 Capillary and Gravity Drainage
The extent and rate of drainage of surplus solution from the interior of the lamellae is one
of the important factors determining foam stability (Rosen, 2004), since drainage causes
thinning of the film, and when the film reaches critical thickness (50-500A), the film may
rupture spontaneously. Drainage of the film occurs under two influences: gravity and
pressure difference.
Drainage by gravity is important mainly in very thick lamellae, such as are present when
foam is first formed (Rosen, 2004). The bulk viscosity of the foaming solution is the
major factor in determining the rate of drainage by gravity in thick lamellae. Any additive
that increases the bulk viscosity of the foaming solution, for example polymers,
electrolytes, organic additive, decreases the rate of drainage of liquid in the lamellae.
Capillary pressure is the main driving force for liquid drainage from the thin lamella. In
foam, capillary pressure is defined as the difference between gas-phase pressure and
water-phase pressure. At the center of lamella, where the two interfaces are almost
parallel, the radius of curvature is large compared to the radius of curvature at the Plateau
borders. Hence, according to Young-Laplace equation (Equation 2.7), the capillary
pressure is very small at the center of lamella, i.e. pressure in the lamella is almost equal
to the pressure in the gas-phase. On the other hand, due to small radius of curvature at
Plateau borders, the capillary pressure is high. Since the gas pressure inside the bubble is
same throughout, the liquid within the plateau border is at lower pressure than the liquid

21
inside lamella (Figure 2.8). This pressure difference drives liquid out of the lamella, thus
reducing its thickness and causing it to rupture. Thus capillary pressure destabilizes the
lamella; lower the capillary pressure, more stable is the lamella.
2 cos
c g wP P PR
σ θ= − = 2.7
where R= radius of curvature, σ = interfacial tension
Figure 2.8: Pressure difference across curved surface in a foam lamella. Radius of curvature at the center (R1A) is greater than radius of curvature at the Plateau border (R1B) Pressure at the center of lamellae (PA) is greater than pressure at Plateau borders (PB) , thus resulting in liquid drainage from the center of film to Plateau borders (Schramm and Wassmuth, 1994)

22
2.1.5.2 Gas Diffusion
According to Young-Laplace equation, gas in a smaller bubble is at higher
pressure, and hence higher chemical potential, than gas in a larger bubble. Driven by this
difference in chemical potential, diffusion of gas to takes place through the lamella from
smaller bubble to larger bubbles. As a result, a smaller bubble shrinks and disappears
while the larger bubble grows. The diffusion rate JDi of component i across the lamella
can be expressed as
i i iD jJ k P= Δ 2.8
where kji and ΔPi are the effective mass transfer coefficient and difference in
partial pressure of component i across the lamella, respectively.
The inter-bubble diffusion within the trapped gas in foam may lead to two
important effects. On one hand, the coarsening of trapped foam reduces the average yield
stress of stationary lamellae, potentially triggering lamella mobilization. On the other
hand, if required mobilization pressure gradient is not exceeded, gas diffusion will
enhance the stability of trapped gas by rearranging curved stationary lamellae into their
nearest pore throats, where the pressure necessary for mobilization of a single lamella is
highest. However, the process of gas diffusion ceases once bubbles are all at least roughly
equal to pore size (Rossen, 1996)
2.1.5.3 Disjoining Pressure
Disjoining pressure is the sum of forces that are molecular in origin and
represents excess pressure acting normal to a film interface that results from the overlap
of molecular interactions between the interfacial layers. Disjoining pressure is a function
of the film thickness. The three primary components of the disjoining pressure are van

23
der Waals force, electrical double layer repulsion, and short range-repulsive steric or
hydration forces.
van der Waals force is the force of attraction that neutral molecules exert on each
other. It acts to thin a liquid film. Pressure ( vwΠ ) exerted on the thin film by van der
Waals force is expressed as:
36 (2 )vwA
hπΠ = − 2.9
where A is the Hamaker constant; h is the film thickness.
The second component of the disjoining pressure is the electrical double-layer
repulsion. If a foam film is stabilized by ionic surfactants, the adsorbed surfactant ions
induce a surface charge on the interface. The repulsion between surfactant molecules on
opposite gas-water interfaces across a lamella gives rise to electrostatic force, which is
the primary stabilizing force for a lamella. Having a charged interface also influences the
distribution of nearby ions in a polar medium. Ions of opposite charge are attracted to the
surface, while those of like charge are repelled. An electric double layer, which is diffuse
because of mixing caused by thermal motion, is thus formed. Gas bubbles and liquid
films between them would be stabilized entirely by the repulsive forces created when two
charged interfaces approaches each other and their electric double layer overall. The
repulsive energy for the double layers at each interface in the thin film is given
approximately as:
1 exp( )RV V tκ= − 2.10

24
where t is the film thickness, V1 is the constant of proportionality and depends on the
particular system.
Figure 2.9: Disjoining pressure acting in a lamella (Alvarez, 1998).
The third component of the disjoining pressure is the short range-repulsive forces
called steric forces, which also prevent thinning of the lamella like the electrical repulsive
force. The sum of these three pressures is the disjoining pressure. If the sum of disjoining
forces balance the thinning forces produced by capillary pressure, a stable film is
obtained. Higher capillary forces causes lamella to thin further until disjoining pressure
approaches a critical value (Πmax) above which the film either ruptures or jump into a
metastable state. Therefore, there is critical film thickness associated with a maximum
capillary pressure equal to Πmax, known as the critical capillary pressure. Below this
critical thickness, the lamella ruptures.

25
Figure 2.10: Disjoining pressure curve
2.1.5.4 Anti-foaming Effect of Oil
The effect of oil on foam stability is of primary importance because oil can
stabilize or destabilize foam films (Schramm, 1994). Two scenarios can be present when
oil comes in contact with foaming surfactant solution; either oil is solubilized or it is
emulsified in the solution. The solubilization of oil takes place when surfactant
concentration is usually high, i.e. above critical micelle concentration CMC. Above its
CMC value, surfactant molecules aggregate to form micelles. These micelles are present
as a structured layer in foam films and causes foam films to thin in stepwise transition.
Solubilized oil in the micelles decreases the stability of foam by accelerating the stepwise
foam film thinning. The effect of solubilized oil of foam film thinning is discussed in
detail in Chapter 6.

26
The stability of foam film in the presence of emulsified oil depends on the
stability of peusdoemulsion films that form between the oil and gas phase. If
pseudoemulsion film ruptures, the oil drops may enter the gas-aqueous surface and forms
an oil lens, which may then spread on the surface. Therefore, stability of foam in the
presence of emulsified oil depends first on the stability of pseudoemulsion film and then
on the ability of oil to enter the foam film surface and spread on it. The potential of oil
drop to enter lamella is given by entry coefficient E (Robinson and Woods, 1948):
GW OW GOE γ γ γ= + − 2.11
where γGW , γOW, γGO are gas-water, oil-water, and oil-gas interfacial tensions, respectively.
If the entry coefficient is positive, oil-drop is expected to enter the gas-water interface.
Once the oil-drop enters the interface, its effect on foam stability is a function of its
spreading coefficient. Spreading coefficient (S) is given by (Harkins, 1941):
G W O W G OS γ γ γ= − − 2.12

27
Figure 2.11: Configuration of the oil at gas-aqueous interface. a) oil drop inside the solution; b)oil drop at the surface separated by the pseudoemulsion film; c)oil lens; and d) spread oil layer at the surface. (From Wasan, 1992)
The oil spreads if S >0, carrying along some water and thereby producing local thinning
of the foam film which can lead to rupture. Even when S <0, so that oil drops do not
spread over gas-water interface, the oil can destabilize foam by forming a lens at the air-
water surface. The foam becomes unstable once the drop spans the film to form a bridge.
The bridging coefficient B is given by:
2 2 2G W O W G O
B γ γ γ= + − 2.13
Oil Oil
a b
c
Pseudoemulsion film
Aqueous film

28
Figure 2.12: Suggested bridging mechanism of antifoaming in foam films by oil
(Borrowed from Frye and Berg, 1989).
2.1.5.5 Salinity
At low salinity levels, increase in the concentration of divalent or monovalent
ions reduces repulsion between adjacent surfactant ions on the gas-liquid interface, thus
promoting surfactant adsorption on the interface (Schramm, 1994). The increased
surfactant adsorption results in increased foam stability. At high salinities, however, the
presence of ions in the bulk fluid decreases surface potential on the gas-liquid interfaces,
and thus decreases the double layer repulsion. The reduction in double layer repulsion,
due to increased salinity, promotes liquid drainage from lamella. Therefore increase in
salinity, at higher salinity levels, reduces foam stability.
2.1.5.6 Surfactant Concentration
Foam stability increases with increasing surfactant concentration up to a certain
limit, above which stability is not improved even if surfactant concentration is increased.
As long as surfactant molecules form a monolayer on the gas-liquid interface, foam
stability is improved with increasing surfactant concentration. When surfactant
concentration reaches a critical concentration and there is no more room for molecules at
the surface of the interface, the surfactant molecules tend to aggregate in water and form
Oil drop
Oildrop
a b
c d
Oil Bridge
Pseudoemulsion film
Oil Lens

29
micelles. The concentration at which surfactant molecules start forming micelles is called
critical micelle concentration (CMC) for that surfactant. Several studies have shown that
below CMC, foam strength increases with increasing surfactant concentration (Schramm,
1994).
2.1.5.7 Other Mechanisms Influencing Foam Stability
Apart from the above mentioned factors, some other phenomena also affect foam
stability when lamella is in motion. The stability of moving lamella depends on its ability
to withstand both stretching and mechanical disturbances. The stretching of lamella
causes it to thin. If the thinning is severe, then the lamella may rupture. However, the
thinning of lamella is resisted by the associated increase in disjoining pressure. Moving
lamella can thus withstand the thinning effect of stretching, when in motion, if a quick
liquid influx into the lamella takes place. Because of stretching and thinning, the capillary
pressure at which moving lamella breaks is lower than at which the static lamella breaks.
Lamella stretching and thinning also causes a local decrease in the concentration
of the surfactant adsorbed on the lamella surface. The reduction in surface surfactant
concentration produces an increase in the local surface tension gradient. This increase in
surface tension opposes the thinning of the film by causing surfactant movement from the
low-tension area to the high-tension area, dragging liquid along with it. Eventually, the
equilibrium surfactant concentration is restored and liquid flow stops. This time
dependent restoring force is known as Marangoni effect (Marangoni, 1872).
2.2 CHEMICAL FLOODING
This section presents the basic concepts involved in chemical flooding. It reviews
main concepts and mechanisms involved in chemical-EOR, such as capillary number,
surfactant phase behavior, interfacial tension (IFT), etc. It also discusses the main

30
chemicals used in chemical flooding process, for example surfactants, alkali, polymer,
and alcohols.
2.2.1 Capillary Number
The presence of capillary forces in porous media results in poor displacement
efficiency of oil by water. The displacement of residual oil is related to the competition
between viscous and capillary forces, usually expressed by capillary number. Using any
sets of consistent units, the capillary number is described as:
cak pNσ∇
= 2.14
where,
k=permeability,
∇ p= pressure gradient
σ= interfacial tension
Figure 2.13 relates residual oil saturation to capillary number. It can be seen that
reduction in residual oil cannot be achieved until the value of capillary number increases
to a critical value. Typical water-oil IFT during waterflood is about 10 to 30 dynes/cm,
and it must be reduced to about 10-3 to 10-2 dynes/cm to achieve any significant
mobilization of waterflood residual oil. Reducing the interfacial tension between oil and
water increases the value of capillary number (Equation 2.13).
Equation 2.14 shows that capillary number can be increased by increasing viscous
forces ( p∇ ) or by reducing IFT (σ). However, there is a limit to which viscous pressure
can be applied in a reservoir and to bring two or three order of magnitude increase in
capillary number, the amount of viscous pressure required would be impractical for real

31
field application. Therefore, lowering IFT is the only feasible method of increasing the
capillary number substantially.
Figure 2.13: Residual oil saturation as a function of capillary number (Nca). Figure copied from Green and Willhite (1998).
2.2.2 Chemicals
The main chemicals used in chemical EOR processes are surfactants, alkali,
polymer, and co-solvents.

32
2.2.2.1 Surfactants
Surfactants, or surface active materials, are chemical substances that adsorb on a
surface or fluid/fluid interface when present in low quantities (Green and Willhite, 1998).
They alter the interfacial properties of the surface by decreasing the interfacial tension, or
IFT. Surfactants consist of one or more hydrophilic and one or more hydrophobic groups
in a single molecule (Figure 2.14). The hydrophilic portion is often called the “head” and
hydrophobic portion is often called the “tail”. Surfactants can be classified into four
groups: anionic (example: sodium dodecyl sulfate, C12H25SO4-Na+), cationic (example:
dodecyltrimethyl ammonium bromide, (C12H25N+Me3Br-), non-ionic
(dodecylhexaoxyetheleneglycolmonoether, C12H25 [OCH2CH2]6OH), and zwitterionic
(3-dimethyldodecylamine propane sulfonate). Most anionic surfactants are used for
chemical EOR due to their low adsorption on negatively charged sandstone rocks.
Carbonate rocks also have a negative charge on their surface at higher values of pH
(>8.5).
Figure 2.14: Molecular structure of anionic surfactant
In chemical EOR, surfactants cause formation of microemulsion in which water
and/or oil are solubilized. Under optimal condition of temperature and salinity,

33
microemulsion exhibits very low IFT with oil and water. The lowering of IFT results in
the mobilization of oil and water. EOR surfactants can be classified into two types:
primary surfactant and co-surfactant. The primary surfactant is directly involved in
microemulsion formation. Co-surfactant improves the action of primary surfactant.
Sometimes, other neutral (neither hydrophilic nor hydrophobic), intermediate
groups are added to surfactant structure. Intermediate groups join the hydrocarbon tail to
hydrophobic head. Addition of intermediate groups such as ethylene oxide (EO) and
propylene oxide (PO) have shown to provide hardness and salinity tolerance to
surfactants (Pope, 2005). Increasing the number of EO groups on surfactant molecule can
increase its hydrophobic character, causing oil in water microemulsion stability at higher
salinities, and ultimately increasing optimal salinity of the phase behavior (Flatten, 2008).
EO groups also improve the hardness tolerance of the surfactant. PO groups, on the other
hand, are slightly hydrophobic and tend to stabilize surfactant at lower salinities. They
also improve the performance of surfactants in the presence of natural surfactants formed
by alkali. Natural surfactants are hydrophobic. PO groups decreases Hydrophile-
Lipophile Balance (HLB) of surfactants and improve their performance in the presence of
natural soaps (Zhang, 2006).
2.2.2.2 Alkali
Alkali reacts with acid species present in the crude oil to form soaps. The process
of in-situ generation of soap by alkali – acid reaction is called saponification. The natural
surfactant generated from the reaction is capable of reducing IFT. Besides forming in-situ
soap, the use of alkali also results in wettability alteration and reduction in surfactant
adsorption. The main alkali materials used in chemical-EOR are sodium carbonate
(Na2CO3), sodium hydroxide (NaOH), ammonium hydroxide (NH4OH), and sodium

34
silicate (Na2SiO3). Amount of soap generated by alkali is denoted by Acid Number,
which is defined as the milligram of KOH required to neutralize 1 gram of crude oil.
Alkali provides OH- ions that react with natural acids present in crude oil to
generate soap. For example, Na2CO3 (the alkali used in this study), reacts in aqueous
solution, making it alkaline. The reaction is as follows:
First sodium carbonate dissociates in the solution.
2
2 3 32Na CO Na CO+ −→ +
Then carbonate ion is hydrolyzed.
3
23 2CO H O HCO OH− − −+ → +
The hydroxide ion then reacts with the acid species present in the aqueous phase. The
acid present in the crude oil partitions into the aqueous phase, upon coming in contact
with water, according to its partitioning constant (KD) , i.e.
DKo wHA HA←⎯⎯→
where HAo and HAw is the acid species concentration in the oleic phase and aqueous
phase, respectively.
HAw then dissociates into its ionic components in the following way:
wwHA H A+ −↔ +
where Ka is the reaction constant.
The extent of dissociation in the aqueous phase is governed by the pH of the system. This
reaction is one of the sources of alkali consumption as the hydroxide ion reacts with acids
species partitioned into the aqueous phase to form natural soaps.
2wHA OH A H O− −+ ↔ +

35
where the species A- is an anionic surfactant (soap).
Sodium carbonate is better than other alkalis in terms of reduced consumption and
less reactivity with sandstone, dolomite, limestone and other formations. When reacting
with divalent cations (Ca++, Mg++), sodium carbonate causes less permeability damage
due to precipitation, compared to sodium hydroxide and sodium silicate. Sodium
carbonate also suppresses Ca++ concentration in the solution and promotes water-wet
conditions (Zhang, 2006)
A new type of alkali, sodium metaborate (Na2B2O4) has gained interest in recent
years (Zhang et. al., 2008). Sodium metaborate offers similar advantages as sodium
carbonate in terms of saponification, reduction in surfactant adsorption, and quicker
equilibration time. Sodium metaborate, however, can also offer the additional advantage
of preventing precipitate formation in certain carbonate rocks. When gypsum or anhydrite
(CaSO4) deposits exist in reservoir rock, an EOR aqueous solution can often solubilize
some of these deposits, and enable calcium ions to be present in solution. If the
traditional sodium carbonate alkali is present, the carbonate ions will form a precipitate
with these calcium ions, which can lead to formation damage. The advantage of sodium
metaborate is that the metaborate ions will not form a precipitate with dissolved calcium
ions, and therefore formation damage can be avoided.
2.2.2.3 Polymer
Polymers are used in the chemical slug and polymer drive to prevent fingering,
channeling in layered systems, and increase sweep efficiency in heterogeneous reservoirs.
The use of high performance surfactants in chemical EOR results in reduction of
interfacial tension and capillary forces. As IFT is reduced, chemical slug tends to finger
though the oil bank. The use of high molecular weight, water-soluble polymers increases
slug viscosity, thus improving mobility control in the process (Sorbie, 1991; Lake, 1989).

36
It is important in chemical flooding that the surfactant-oil bank front is stable; the size of
chemical slug is usually small (0.3 to 0.5 PV), and cannot tolerate even small amount of
fingering.
Since oil bank and chemical slug are pushed by polymer drive, the mobility of the
drive should be lower than that of the slug. Hydrolyzed polyacrylamides (HPAM) are a
common class of polymers widely used in enhanced oil recovery. The molecular weight
of the polymer is selected based on reservoir permeability, rock characteristics and
desired slug viscosity. Levitt et al. (2008) presented an extensive summary on selection
and screening of polymers for enhanced oil recovery.
2.2.2.4 Co-solvent
Co-solvents, usually alcohols, have been investigated for their use in enhanced oil
recovery for over 40 years. Historically co-solvents were used to help surfactant
solubility and alter the system viscosity. But it was soon realized that co-solvents have
the ability to partition into aqueous, oleic and microemulsion phases. The ability to
partition between the three phases allows co-solvent to alter microemulsion phase
behavior, by controlling the amount of brine and/or hydrocarbon that a microemulsion
can solubilize, hence having an effect on optimal salinity and interfacial tension.
Co-solvents are small carbon chain alcohol molecules that act at the oil-water
interface of the microemulsion droplets, between oriented surfactant hydrophobes, and
add entropy to the system to reduce microemulsion viscosity and gel formation [Sanz and
Pope, 1995; Levitt et al., 2006; Flatten et al., 2008]. High performance surfactant
formulations require co-solvents to reduce formation of gels, liquid crystals and
macroemulsions, and to promote rapid equilibration and formation of low-viscosity
microemulsions, hence ensuring surfactant-polymer-electrolyte compatibility [Levitt el
al., 2006; Flaaten et al., 2008]. High carbon number crude oils require higher carbon

37
number surfactants to solubilize the oil and hence higher carbon number co-solvents to
give the desired phase behavior and roughly equal partitioning between the oil and brine
[Zhao et al., 2008]. The addition of hydrophilic co-solvents improves the aqueous
solubility of the surfactant solution but at the same time lowers the solubilization ratio at
optimal salinity. [Zhao et al., 2008; Dwarakanath et al., 2008]
2.2.3 Microemulsion Phase Behavior
Microemulsion phase behavior governs the IFT between microemulsion and
excess phases (oil and water) in a chemical-EOR process. For chemical-EOR
applications, microemulsion phase behavior as a function of aqueous phase salinity is of
interest. Based on salinity, surfactant phase behavior can be modeled into three classes
(Healy et al., 1976, Nelson and Pope, 1977; Nelson, 1979). At low salinity, the surfactant
exhibits good aqueous phase solubility and stays in the aqueous phase. The surfactant
forms water-external microemulsion which contains some amount of solubilized oil. The
microemulsion phase coexists with excess oleic phase. This type of microemulsion is
often referred to as lower phase microemulsion or oil in water microemulsion. At high
salinities, electrostatic forces dramatically decrease surfactant solubility in aqueous
phase, and surfactant is driven into oil phase to form oil-external microemulsion, which
coexists with excess aqueous phase. This type of microemulsion is referred to as upper
phase microemulsion or water in oil microemulsion. At intermediate salinity, a bi-
continuous microemulsion is formed, which is in equilibrium with both excess aqueous
phase and excess oleic phase. This type of microemulsion is referred to as middle phase
microemulsion or bi-continuous phase microemulsion.
The microemulsion phase behavior can be represented by ternary phase diagrams
(Healy et al., 1976; Nelson et al., 1977) as shown in Figure 2.15. Since the slope of tie

38
lines are negative for lower phase microemulsion, it is also called Type II(-)
microemulsion. Similarly, the upper phase microemulsion is called Type II(+)
microemulsion as the slope of tie lines are positive. The middle phase microemulsion has
three phases, so it is also called Type III microemulsion.
Figure 2.16 shows the effect of salinity on microemulsion phase behavior. It can
be seen that as salinity increases, transition from Type II(-) to Type III microemulsion
takes place. The salinity at which the phase transition from Type II(-) to Type III
microemulsion takes place is termed as lower limit of effective salinity (CSEL). As
salinity increases further, transition from Type III to Type II(+) microemulsion takes
place. The salinity at which Type III to Type II(+) transition takes place is termed as
upper limit of effective salinity (CSEU)

39
Figure 2.15: Microemulsion phase behavior representation by ternary diagram ( Saad, 1989)
Figure 2.16: Effect of salinity on microemulsion phase behavior

40
2.2.4 Phase Behavior and Interfacial Tension
Another important aspect of microemulsion phase behavior is the correlation
between IFT and salinity. Since microemulsion phase behavior is also correlated to
salinity, there exists a relation between microemulsion phase behavior and IFT too. Healy
and Reed (1974) first highlighted the relationship between microemulsion phase behavior
and interfacial tension. They found that just like microemulsion phase behavior,
interfacial tension also changes with salinity. Figure 2.17 plots IFT between equilibrium
phases as a function of salinity. It can be seen that oil-microemulsion IFT decreases and
water-microemulsion IFT increases as salinity increases. The salinity at which the two
IFT curves cross each other is the optimal salinity for IFT.
The decrease in IFT between excess phases and microemulsion results in
increased solubilization of oil and water. This is highlighted by plotting solubilization
parameters for oil and water versus salinity (Figure 2.17). Solubilization parameter (SP)
is defined as volumetric ratio of oil (or water) in the microemulsion, to surfactant in the
microemulsion phase.
O
OILS
wWATER
S
V Volumeof oil in the microemulsion phaseSP = =V Volumeof surfactant in the microemulsion phase
V Volumeof water in the microemulsion phaseSP = =V Volumeof surfactant in the microemulsion phase
The solubilization parameter for oil, VO/VS, increases as salinity increases and
solubilization parameter for water, Vw/VS decreases as salinity increases (Figure 2.17).
The salinity at which the VO/VS = Vw/VS is called optimal salinity for phase behavior.

41
Figure 2.17: Interfacial tension and solubilization parameter as a function of salinity (Healy and Reed, 1976)
The optimal salinity for phase behavior is very close to the optimal salinity for
IFT, and this fact is useful in determining IFT from solubilization parameter.
Measurement of IFT is relatively difficult, while the measurement of solubilization
parameter is easy. Thus for a specific system one can determine optimal solubilization
parameter from phase behavior relatively easily, and then correlate it to IFT. Two models
are generally used to correlate IFT to solubilization parameters. They are the Healy and
Reed Model (1974) and the Huh Model (1979)
2.2.4.1 Healy and Reed's Model The first IFT model is based on Hirasaki's modification (1981) of the model of
Healy and Reed (1974). Once the phase compositions have been determined, the

42
interfacial tensions between microemulsion and the excess phases (σ13, σ23) are
calculated as functions of solubilization parameters:
110 3 10 2 3
3 3
110 3 10 3 10 ow 3 2 3
3
Glog log F G forR 1
1 G Rfor 1,2
Glog log F (1 R )log R (G ) forR 1
1 G
⎧σ = + + ≥⎪
+⎪=⎨
⎪ σ = + − σ + + <⎪ +⎩
2.15
where 1 2 3G ,G and G are input parameters. 3R is the solubilization ratio ( 3
33
C
C).
The first subscript ( ) denotes component.(1 is for water, 2 is for oil). The second
subscript (j) denotes phase (1 denotes aqueous phase, 2 denotes oleic phase, and 3
denotes microemulsion phase).For example, 3C is concentration of component is
microemulsion phase.
The correction factor introduced by Hirasaki (1981), F , ensures that the IFT at
the plait point is zero and is given as
con j
2
32
j 31
1 eF for 1,21 e
where
con (C C )
j
j
−
−
=
−= =
−
= −∑
2.16
and in the absence of surfactant or with surfactant concentration below CMC, the IFT is
equal to σow. j denotes the phase.
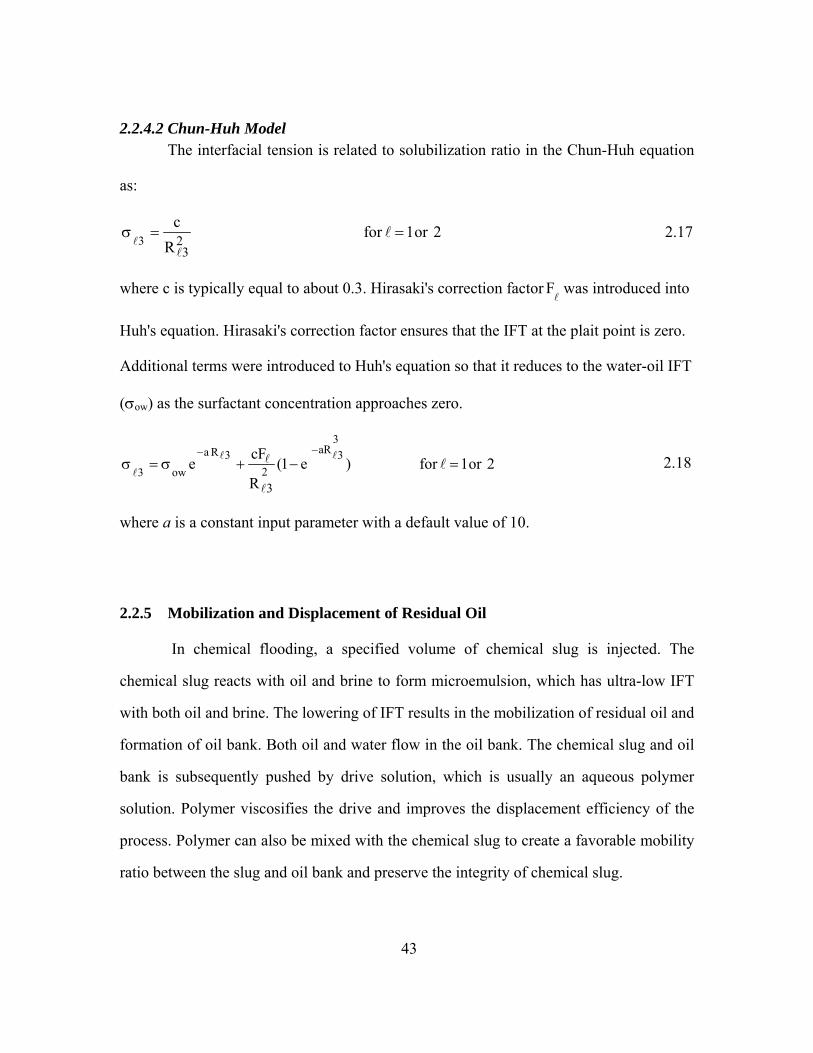
43
2.2.4.2 Chun-Huh Model The interfacial tension is related to solubilization ratio in the Chun-Huh equation
as:
3 23
c for 1or 2R
σ = = 2.17
where c is typically equal to about 0.3. Hirasaki's correction factor F was introduced into
Huh's equation. Hirasaki's correction factor ensures that the IFT at the plait point is zero.
Additional terms were introduced to Huh's equation so that it reduces to the water-oil IFT
(σow) as the surfactant concentration approaches zero.
3aRa R 3 3
23 ow3
cFe (1 e ) for 1or 2R
−−σ = σ + − = 2.18
where a is a constant input parameter with a default value of 10.
2.2.5 Mobilization and Displacement of Residual Oil
In chemical flooding, a specified volume of chemical slug is injected. The
chemical slug reacts with oil and brine to form microemulsion, which has ultra-low IFT
with both oil and brine. The lowering of IFT results in the mobilization of residual oil and
formation of oil bank. Both oil and water flow in the oil bank. The chemical slug and oil
bank is subsequently pushed by drive solution, which is usually an aqueous polymer
solution. Polymer viscosifies the drive and improves the displacement efficiency of the
process. Polymer can also be mixed with the chemical slug to create a favorable mobility
ratio between the slug and oil bank and preserve the integrity of chemical slug.

44
2.2.6 Salinity Gradient Concept
Typically, design of chemical flooding involves imposing a negative salinity
gradient to take advantage of the favorable properties of the surfactant first at high
salinities and then at low salinities (Pope and Baviere, 1991). The lowest oil-
microemulsion IFT occurs at salinity higher than optimal salinity and lowest surfactant
retention occurs at salinity lower than optimum salinity. Therefore, injecting at constant
optimum salinity throughout slug and drive injection phase would not be entirely
efficient.
In applying the salinity gradient concept, for a given reservoir salinity, a
formulation is identified whose optimal salinity is below the reservoir salinity. The slug is
injected at a salinity lower than the reservoir salinity (close to optimal salinity) and the
drive is injected at a salinity lower than slug salinity and usually below CSEL, i.e. in
Type II(-) region. Mixing in the reservoir results in gradually decreasing salinity gradient
and salinity in the reservoir varies from high salinity to low salinity. Thus benefits of both
high salinities i.e low oil-microemulsion IFT, and low salinities (low surfactant retention)
are achieved.
Pope and Baviere (1991) described the mechanism of surfactant retention in
chemical flooding and its prevention by imposing a negative salinity gradient. At the rear
of the microemulsion, the most important interfacial tension is between the polymer drive
and microemulsion, which will be the middle phase microemulsion if the salinity
environment is Type III. Interfacial tension will most likely not be low enough to prevent
trapping of microemulsion by brine and thus high retention of surfactant. If the polymer
drive salinity is in Type II(-) region , Type III behavior changes to Type II(-). Since
polymer slug is much larger than the surfactant slug, this lower salinity will then
eventually allow the polymer drive to miscibly displace the lower phase microemulsion,

45
so no trapping of the surfactant will occur. The adsorption of surfactant will also decrease
with the decreasing salinity.
The salinity gradient concept also takes care of spatial variation in reservoir
salinity. Designing a slug that is optimum for all of these conditions is very difficult, but
imposing a salinity gradient that passes through the various optimum surfactant
conditions for these variable properties will often be relatively easy. For all these reasons,
the probability of efficient displacement is much greater with salinity gradient than
without.
2.3 ALKALI/SURFACTANT/GAS (ASG) PROCESS The technical review of foam and chemical flooding highlights two points that
indicate the potential use of foam in chemical-EOR. They are:
1) Need for mobility control in chemical flooding.
2) Potential of foam in reducing liquid phase mobility and improving volumetric
displacement efficiency
Since surfactant is used in chemical flooding, the injection of gas results in the
foam formation, which can provide favorable mobility control to the process. The
significance of foam in chemical flooding is as an alternative to polymer. Polymer use is
restricted under certain conditions, for e.g. low permeability, unfavorable temperature
and salinity, chemical incompatibility with reservoir and reservoir fluids, etc. Under such
conditions, polymer either cannot be used or its use would not be economically feasible.
Foam can replace polymer in some of these conditions, such as low permeability, high
salinity, etc

46
The use of foam as a mobility control agent by co-injection or alternate injection
of gas and chemicals is termed Alkaline-Surfactant-Gas (ASG) Process. The concept of
foam assisted low IFT flooding (or ASG process) is relatively untested. Only a few
experimental and theoretical works have been accomplished on the subject. A review of
existing literature on ASG process is provided in the next section.
2.3.1 Literature Review of ASG Process One of the first studies on ASG process was conducted by Kamal and Marsden
(1973). They carried out ASG experiments on high permeability sandpacks. In their
experiments, they injected chemical slug and displaced it with a foam drive. Experiments
simulating both secondary and tertiary recovery process were conducted with 0.05 and
0.1 PV of chemical slug. The chemical slug was an aqueous solution of commercially
available surfactant and the slug size was either 0.05 or 0.1 PV. The concentration of
surfactant in the foam drive was 0.2%. In experiments simulating secondary recovery
process, the micellar slug was followed by foam in one set of experiments and polymer in
the other set. In tertiary recovery experiments, the system was waterflooded until oil was
no longer produced and then the procedure for secondary recovery process was followed.
The experiments using 0.1 PV chemical slug resulted in better oil recoveries, and were
comparable to oil recoveries in experiments with polymer. The authors concluded that
foam may have a cost advantage over polymer solutions as lesser amount of foaming
agent was required in the experiments.
Lawson and Riesberg (1980) studied the alternate injection of an inert gas and
surfactant solution as a method for providing mobility control in chemical floods. In their

47
coreflood experiments, chemical slug was displaced by alternate slugs of gas and
surfactant. The slug ratio was kept at 1:1. The size of chemical slug varied from 0.1 to
0.25 PV. The size of gas and surfactant slugs in the drive was maintained at 0.1 PV each.
Polymer was not added in the chemical slug to provide mobility control. Their work
highlighted two main points: 1) alternate injection of gas and surfactant solution can
generate foam, and 2) as long as gravity segregation and foam drainage is prevented, the
performance of alternate slugs of gas and dilute surfactants compares favorably with
water-soluble polymers.
Like Lawson and Riesberg, Li et al. (2008) also carried out alternate injection of
surfactant and gas. However, they carried out alternate injection of gas and surfactant in
both slug and drive injection phases. A blend of anionic surfactants was used in the slug.
Polymer was added to the slug only for foam stability purpose, as its concentration was
not high enough to provide favorable mobility control. The surfactant and gas ratio was
maintained at 1:1. An almost piston-like displacement of oil was observed in experiments
conducted on sandpacks.
Wang (2006) conducted ASG experiments on micromodels and sandpacks by
coinjecting ASP slug and gas. Micromodel experiments, although not representative of
porous media, provided visual observation of the process. They observed that the
coinjection of ASP slug and gas is more effective when the oil saturation is low. They
attributed this effectiveness to foam stability at low oil saturations. They found that ASG
process was more effective when alkali was added in the slug. Addition of alkali assists
in achieving low IFT conditions without adding extra surfactant and reduces surfactant
adsorption (Nelson, 1984).
48
The first field test that combined chemical and foam flooding for EOR was
carried out at Daqing oilfield in China (Wang, 2001; Wang et al. 2001). The injection
history of the pilot area included waterflood and water-alternating-gas (WAG) injection.
From log analysis and simulation data, the remaining oil saturation was estimated to be
49% of original oil in place (OOIP). A continuous coinjection of chemical and gas slug
was carried out for a period of approximately 20 months. The chemical slug comprised of
0.3 wt% of surfactant, 1.2 wt% of NaOH, and 1200 PPM of polymer. Injection foam
quality (i.e. the injection fractional flow of gas) in the slug was 25%, implying very wet
foam. After 20 months of injection, 16.7% of OOIP was recovered. The gas-oil ratio
(GOR) was also significantly lower than the GOR during WAG flooding.
2.3.2 Summary of ASG Literature Review
The following points summarize the review of ASG literature:
1. Most of the earlier studies on ASG process do not take into account current process
and design criteria applied in chemical flooding, e.g. identifying optimal chemical
formulation through phase behavior and imposing a salinity gradient. Therefore,
feasibility of ASG process in conditions (microemulsion phase transition and salinity
transition) encountered in chemical floods needs to be identified.
2. Recent studies on ASG process had been done on either sandpacks or micromodels
(Li, 2008; Wang, 2006). Micromodels and sandpacks are only approximate
representation of actual porous medium (rocks). Therefore, feasibility study of ASG
process on reservoir cores is important to study mechanisms involved in it and
ascertain its true potential.

49
3. A detailed feasibility study of ASG process under different conditions of rock and
process parameters has not been undertaken yet, and therefore needs to be carried out.
2.4 CHAPTER SUMMARY
A technical background of foam and chemical flooding was presented in this
chapter, and the potential for using foam for mobility control in chemical-EOR processes
was highlighted. The literature review of ASG flooding also underscores the EOR
potential of ASG process. The review of ASG literature highlights the need for a more
systematic study of the process. Thus, based on the information obtained from the
background study and ASG literature review, an experimental plan that includes
surfactant phase behavior and ASG coreflood studies was developed. The plan includes
coreflood experiments to demonstrate the EOR potential of ASG process and also study
the effects of various parameters, such as permeability, foam quality, slug-size, pressure,
and microemulsion type, on ASG process.

50
CHAPTER 3
Demonstration of Enhanced Oil Recovery Potential of Alkali/Surfactant/Gas Process
3.1 INTRODUCTION
The previous chapter discussed a potential method, namely alkali/surfactant/gas
(ASG) process, of using gas for mobility control in chemical flooding. ASG process, if
successful, will present an attractive substitute for polymer in conditions where the use of
polymer is not feasible. As mentioned in Chapter 1 (Sections 1.1), those conditions are
low permeability, high temperature, high salinity, and presence of divalent cations. In
such conditions, ASG process can be a good alternative to conventional chemical
enhanced oil recovery (EOR) methods, such as ASP or SP flooding.
The present chapter outlines steps involved in the design of ASG process and
highlights its EOR potential on the basis of tertiary oil recovery and pressure response
observed in corefloods. The coreflood data is also analyzed to identify various
mechanisms involved in ASG process and estimate the level of mobility control in the
displacement process. A comparative assessment of the effectiveness of ASG method as
an EOR technique is made by comparing the results of ASG and ASP corefloods that
were conducted under similar conditions. A detailed description of materials, equipments,
and experimental procedures is also presented. ASG experimental scheme involves
chemical screening and coreflood experiments. Chemical screening tests are done to
identify optimal chemical formulations that can perform the dual role of IFT reduction
and desired foam propagation. Chemical screening includes aqueous stability, phase
behavior, and foam stability tests. The identified chemical formulation is then used in

51
ASG corefloods. The understanding of ASG process developed from the experimental
work presented in this chapter forms the basis for further investigation into this novel
EOR technique, presented in subsequent chapters.
3.2 EXPERIMENTAL MATERIAL
3.2.1 Chemicals and Fluids
Surfactants, alkali, co-solvent, and polymer were the main chemicals used in this
study. Chemicals were screened for two crude oil-synthetic reservoir brine combinations.
A description of fluids and chemicals used in this study is presented below.
3.2.1.1 Formation Brine and Crude Oil
Two types of crude oils, one for sandstone corefloods and the other for dolomite
corefloods, were used. The crude oil used for sandstone corefloods has a viscosity and
density of 1.2 cP and 45 0 API, respectively. The crude used for dolomite corefloods has
a viscosity and density of 7.09 cP and 28 0 API, respectively.
Two types of synthetic formation brines (SFB), each representing formation fluid
of an actual reservoir, were used in the corefloods. SFB-A has a total dissolved solids
(TDS) concentration of 156,927 mg/L and SFB-B has a TDS concentration of 159,533
mg/L. Both, monovalent ions (Na+, Cl-) and divalent ions (Ca2+, Mg2+) contributed
towards TDS concentration (Table 3.).

52
Table 3.1: Ionic composition of synthetic reservoir brines
SFB-A SFB-B
Ca++ 6648 2080
Mg++ 2019 1098
Na+ 51288 54928
Cl- 96570 10000
3.2.1.2 Surfactants
Two surfactants, an alcohol propoxy sulfate (with C16-17 branched alcohol
hydrophobe and seven propylene oxide groups, C16-17-(PO)7-SO4-) and an internal olefin
sulfonate (with C1518 twin-tailed hydrophobe, C15-18IOS), were identified as main
surfactants for corefloods. C16-17-(PO)7-SO4- is a high performance surfactant in terms of
IFT reduction, but when used alone results in the formation of liquid crystals (Zhang et
al.., 2008). The addition of twin-tailed hydrophobe reduces the formation of liquid
crystals. Several studies (Levitt et al., 2006; Flatten et al.., 2008) have shown that the
blend of these two surfactants improves their salinity tolerance and gives the best result in
ASP corefloods conducted at low temperatures with light oil.
In addition, an alpha-olefin sulfonate surfactant (C14-16AOS) was tested as a
possible alternate foaming agent. C14-16AOS is a known good foamer and has been widely
used in foam studies (Brochardt, 1987).
3.2.1.3 Alkali
Alkali generates soap in the presence of reactive crude oil and reduces surfactant
adsorption on rock surfaces. Two alkalis, sodium carbonate (Na2CO3) and sodium
metaborate (Na2B2O4), were used in corefloods. Sodium carbonate is a conventional

53
alkali, and offers the additional advantage of speeding microemulsion equilibration,
resulting in quick mobilization of residual oil. It also aids in polymer hydration.
However, sodium carbonate can react with divalent cations in the solution (Ca2+ and
Mg2+) to form insoluble salts (carbonates or bicarbonates) that precipitate. Thus, sodium
carbonate cannot be used in reservoirs that have high concentrations of Ca2+ and Mg2+
ions in the formation brine, especially carbonate reservoirs. Zhang et al.. (2008) tested
sodium metaborate as a replacement for Na2CO3. They found that sodium metaborate can
complex with multivalent cations such as Ca2+ and Mg2+ to increase their effective
solubility in the aqueous phase (Figure 3.). Therefore, Na2B2O4 was selected for
carbonate (dolomite) corefloods.
Figure 3.1: Stability of sodium metaborate in the presence of Ca++ ions.

54
3.2.1.4 Co-solvents
Ethylene glycol butyl ether (EGBE) and butyl alcohol were selected for the phase
behavior experiments. Co-solvents reduce microemulsion equilibration time and prevent
gellation. On the other hand, alcohols reduce foam stability. Therefore, co-solvents
should be used only if their use is necessary for optimal phase behavior in ASG process.
3.2.1.5 Polymer
Floppam® 3330S polymer was used in ASP corefloods. Flopaam® 3330S is 30%
hydrolyzed polyacrylamide (HPAM) with a molecular weight of 8 million Daltons.
Concentrations from 2500 to 3500 ppm provided sufficient viscosity to injected ASP
slugs and polymer drive in core flood applications.
Figure 3.2 plots Floppam® 3330S viscosity versus polymer concentration data at
52 0C and 5000 ppm NaCl salinity. (Corefloods were conducted at 520C).
Figure 3.2: Polymer (Floppam 3330S) viscosity versus polymer concentration data.

55
3.2.2 Coreflood System
This section presents a description of main equipments used in the coreflood set-
up. Figure 3.3 is the schematic of the setup used for ASG corefloods. Gas and liquid were
mixed in a T-section right before the core inlet. Pressure was measured at the inlet, across
three sections of the core, and at the outlet. Fluid injection was carried out from the
bottom of the core. The coreflood system consisted of a liquid pump, mass flow
controller, back-pressure regulators, coreholder, pressure transducers, data acquisition
system, and heat oven.
3.2.2.1 Liquid Injection Pump
A liquid syringe pump (Model: ISCO LC-5000) was used for coreflood
experiments. Piston column of the pump was filled with mineral oil. The injected liquid
was first filled in a stainless steel column and then injected into the core by displacement
with mineral oil.
3.2.2.2 Back Pressure Regulator (BPR)
A back-pressure regulator (BPR) maintains a constant pressure upstream of the
BPR by blocking flow until upstream pressure reaches the set pressure. Two types of
BPR were used; one was dome-pressure loaded and the other was spring loaded.
For the corefloods carried out at high pressure, the dome-BPR was placed
downstream of the core. The dome-pressure (set pressure) was set equal to the pressure at
which experiment was to be conducted. Higher the back-pressure, lower is the effect of
gas expansion for the same pressure drop across the core. The back-pressure on the core
was maintained at 400 psi, for corefloods conducted at elevated pressure, which is also
the pressure of reservoir for which this study was undertaken. It was observed that dome-
BPR fluctuates during multi-phase flow, especially when gas flows through it. The

56
fluctuations were reduced by placing the BPR in the oven and thus heating it uniformly.
Heating reduced dome-BPR fluctuations considerably.
The spring loaded BPR was placed downstream of mass flow controller (MFC).
The spring loaded BPR was used to provide constant pressure resistance downstream of
the MFC. The dome-BPR and spring loaded BPR were manufactured by Tesco and
Tesscom, respectively.
3.2.2.3 Mass Flow Controller
A mass flow controller was used to control gas injection rates in corefloods. Mass
flow controller uses specific heat of a gas to control its flow rate. It has a thermal sensor,
which consist of a small bore tube with two resistance-thermometer elements wound
around the outside of the tube. The sensor tube is heated by applying an electric current
to the element. A constant proportion of gas flows through the sensor tube, and the
cooling effect creates a pressure differential between the two elements. The change in the
resistance due to the temperature differential is measured as an electrical signal. The
temperature differential created between the elements is a function of gas density,
specific heat, and flow rate. Mass flow is normally displayed in terms of volume of gas at
standard cubic centimeter per minute.
Mass flow controllers are calibrated for a set pressure and pressure drop, across
the controller. Performance of the mass flow controller is most accurate at calibrated
conditions of pressure and pressure drop. Therefore, calibration pressure of MFC should
be as close as possible to the experimental pressure. In order to maintain a constant
pressure drop across the mass flow controller, a back pressure regulator (spring loaded
BPR) was used downstream of the controller. The inlet gas pressure in the controller was
maintained at calibration pressure, and the BPR was set to a pressure so that pressure
drop across the controller remained close to the calibrated pressure drop (50 psi). During

57
co-injection of liquid and gas, caution needs to be taken to avoid building pressure
downstream of the controller to a value higher than that upstream. This is possible if the
flow encounters extremely high resistance (due to strong foam formation or plug up).
Under such conditions, continuing liquid injection can force liquid flow back into the
mass flow controller and may damage it.
The mass flow controllers used for the corefloods were either manufactured by
Brooks (Model: SLA 5850) or Matheson (Model: 8272).
3.2.2.4 Pressure Transducers
Gage pressure transducers (Model: Rosemount 2088) were used for pressure
measurements. The transducers have maximum pressure range of 4000 psi, with a
turndown ratio of 20:1. For low-pressure experiments, a turndown ratio of 20 was used,
which made the transducers’ functional range 0-200 psi.
3.2.2.5 Coreholder
A Hassler type core holder, manufactured by Phoenix Instruments Inc., is used in
the corefloods. The coreholder can be used for cores up to 12 inches in length and 2
inches in diameter. The coreholder is placed vertically during experiments, and injection
is carried out from the bottom. The coreholder has three pressure taps placed at 3, 6, and
9 inches from the ends, respectively. A rubber sleeve lines the inner surface of the
coreholder. The pressure taps on the rubber sleeve protrude out from the pressure ports of
the coreholder. Pressure transducers are connected to pressure ports. The confining
pressure on the core is provided by injecting mineral oil in the annular space between
coreholder and rubber sleeve.

58
Figure 3.3: A schematic of coreflood apparatus.

59
3.3 EXPERIMENTAL PROCEDURES
3.3.1 Aqueous Stability and Phase Behavior Procedures
Aqueous stability tests are carried out to test the stability of chemicals in the
electrolyte solution at salinities encountered during corefloods. In aqueous stability tests,
concentrated stock solutions of surfactants, alkali, alcohol, and/or brine are mixed in a
glass vial, agitated, and then allowed to settle for one hour. If the chemicals are unstable
in the aqueous solution at a given salinity and temperature, they will either deposit or
separate into a distinct dispersed phase. Aqueous stability tests provide an upper value of
salinity below which all chemical constituents can coexist in the aqueous phase.
Phase behavior experiments are carried out to obtain an appropriate mixture of
chemicals (surfactants and/or alkali and/or alcohol) that can be used in EOR applications.
Surfactant interaction with oil varies with the system salinity (Section 2.2.3). The ranges
of salinities in which a surfactant-oil-brine system exhibits Type II(-), Type III, and Type
II(+) behavior are identified through phase behavior experiments (Nelson and Pope,
1978; Healy and Reed, 1976). At optimum salinity, which falls in the Type III region,
both oil and water solubilization ratios in the microemulsion are equal.
A phase behavior experiment involves mixing certain proportions of an aqueous
chemical EOR solution, salinated water, and crude oil in an array of pipettes (Flatten,
2008). The array of pipettes serves to create a salinity gradient, where different volumes
of salinated water are added to each pipette to give different salinities. Additionally,
equal volumes of aqueous chemical EOR solution is added to each pipette. The aqueous
chemical solution has a fixed concentration of surfactant, co-surfactant, co-solvent,
polymer, and/or alkali. Equal amount of crude oil is added to each pipette. Then, the
pipettes are heat-sealed. Following heat-sealing, the pipettes are allowed time to cool
before being slowly inverted 12 times to allow the oil and aqueous phase mixing. The

60
intention of pipette mixing is to increase contact between the aqueous and oil phases such
that fluid mixing is not entirely dependent on diffusion across the small oil/aqueous
cross-sectional contact area. Reading of aqueous/microemulsion and microemulsion/oil
levels, and top fluid level in the pipettes are recorded with time (usually days). When no
further change in phase levels is observed, the experiment is considered to be over and no
further readings are taken.
A detailed description of procedures involved in phase behavior tests can be
found in Flatten et al.(2008)
3.3.2 Foaming Test Procedure
In the design of ASG process, foaming tests provide quick and preliminary
estimate of the ability of selected surfactants to form stable foam. Foaming tests are
simple to conduct and yield quick results. First, aqueous solutions of selected surfactants
are prepared. Equal volume from each surfactant solution is dispensed into separate
pipettes. Equal amount of oil is then added to each pipette. Then the pipettes are shaken
with equal intensity, resulting in the formation of foam at the top of liquid column. The
variation in the height of foam column is measured with time. Surfactant with the best
foaming ability in the presence of oil will exhibit lowest rate of foam destruction, i.e. the
ratio of height of foam column at any time to initial height of foam column will decrease
slowest with time.
Foaming tests in pipettes are, at best, only a preliminary indicator of surfactant
ability to stabilize foam. In pipettes, unlike in porous media, phenomenon like capillary
effects, dispersion, and adsorption are absent, and thus their effect on foam stability
cannot be ascertained.

61
3.3.3 Coreflood Procedure
Core slabs are initially drilled to obtain core samples about 11 inches (28 cm)
long and 1.83 inches (5 cm) in diameter. Two conical-parallelepiped shaped (end
diameters - 2 inches and 1.83 inches, respectively) distributing caps are placed at each
end of the core. The caps have a half inch diameter hole in the centre and concentric
groves etched on one side (in contact with the core). The concentric grooves allow
injected fluid to be distributed uniformly over the end face of the core. Since the core
holder inner diameter is 2 inches, larger than the diameter of the core (1.83 inches), the
conical shape of distributing caps enables a smooth and gradual contact between the core
and rubber sleeve. If the curved surface of distributing plates is straight, then there is a
sudden change in diameter; from 2 inches to 1.83 inches. Under such conditions, the
contact surface becomes uneven and rubber sleeve does not contact the core completely,
thus allowing fluid leaks from the sides.
The core, along with distributive end plates on each end, is first wrapped in a
layer of silver foil and then in a layer of plastic heat-shrink tubing. The silver foil
prevents CO2 from coming in contact with the viton-rubber sleeve. Carbon dioxide can
damage the viton rubber sleeve by diffusing into it.
After the core is wrapped in silver foil and heat-shrink tube, it is placed in the
coreholder and axial pressure is applied it. After applying the axial pressure, holes are
drilled in the core through coreholder pressure ports. The holes are cleared of debris by
flowing air through the pressure ports. Then, confining pressure is applied by pumping
mechanical oil in the annular space between rubber sleeve and coreholder. During the
course of coreflood, it should be ensured that the confining pressure is always higher than
the fluid pressure in the core. Otherwise, flow of fluids from the curved surface of the
core will occur. After confining pressure is applied, coreholder is placed in the oven, and

62
the oven is set to experimental temperature. All flow tubing connections are made and the
system is checked for leaks.
Before commencing fluid injection, core is first vacuumed for several hours and
then CO2 is injected into it. CO2, being heavier than air, displaces the remaining air out of
the core. Then the core is vacuumed again for several hours to remove CO2.
Once the core is properly vacuumed, fluid injection is initiated. Fluid injection, in
ASG process, consists of following sequence: 1) brine saturation, 2) oil flood, 3)
brineflood (waterflood), 4) foamed chemical slug injection, and 5) foamed drive
injection. During brine saturation, core is 100% saturated with the synthetic reservoir
brine. Porosity and absolute permeability of the core is determined from brine saturation
data. Porosity is determined by performing a material balance on injected and produced
brine or by tracer methods. After brine saturation, core is saturated with oil. Oil saturation
continues till 100% oil cut in the effluent and stable pressure drop across each section of
the core is achieved. At the end of oil saturation step, residual water saturation (Swr) and
oil relative permeability at Swr (i.e. Korw) are calculated. Oil flood is followed by
waterflood (or brineflood). Waterflood injection is carried out at interstitial velocities of
approximately 1-2 ft/day, which is the range of waterflood velocities encountered in
actual field applications (Green and Willite, 1998). Residual oil saturation (Sor) and water
relative permeability at Sor (i.e. Krwo) are calculated at the end of waterflood. After
waterflood, a pre-determined volume of ASG slug is injected. ASG slug consist of high
performance surfactant capable of producing ultra-low interfacial tension and gas (either
CO2 or N2). ASG slug is injected by coinjecting chemicals and gas into the core. ASG
slug is followed by ASG drive. ASG drive consists of an aqueous solution of low
surfactant concentration and gas. ASG drive is injected till no more oil is produced in the
effluent.

63
During each fluid injection step, effluent samples are collected at regular
intervals, and analyzed for salinity and pH. In addition, effluent surfactant concentrations
are measured during foam-slug and foam-drive.
3.4 DISCUSSION OF EXPERIMENTAL RESULTS
3.4.1 Results of Phase Behavior and Aqueous Stability Tests
Series of phase behavior and aqueous stability tests were conducted to identify
optimal chemical formulations that can be used in corefloods. Surfactant, alkali, and
alcohol concentrations were varied, and formulations that yielded optimum results were
selected. Two formulations were identified (Table 3.2), one for the sandstone corefloods
(Formulation-A) and other for the dolomite corefloods (Formulation-B1). Same
surfactants, C16-17-(PO)7-SO4- and C15-18IOS, were used in both formulations.
Formulation-A used Na2CO3 and ethylene glycol butyl ether (EGBE) for alkali and co-
solvent, respectively. Formulation-B1 used sodium metaborate (Na2B2O4) and butyl
alcohol for alkali and co-solvent, respectively. An additional formulation (Formulation-
B2) was also identified for carbonate corefloods. Formulation-B2 did not contain any
alkali (Na2B2O4). Table 3.3 contains compositions of the above three formulations.
Figure 3.4 to Figure 3.6 plots oil and water solubilization ratios versus TDS
concentration. Table 3.4 and Table 3.6 contain results of a phase behavior tests in the
tabulated form.
A solubilization ratio of 16, at an optimum salinity of 52500 ppm, was obtained
with Formulation-A. Formulation-B1 yielded an optimum solubilization ratio of 12 at a
salinity of 51000 ppm. The removal of alkali from Formulation-B2 resulted in the slight
reduction of optimum solubilization ratio from 12 to 11. The changes in optimal
solubilization ratios and salinity with and without the use of alkali were not significant,

64
which implies that oil used in dolomite corefloods was not acidic (acid number for the oil
was not measured).
Table 3.2: Chemical formulation for sandstone and dolomite corefloods
Method Sandstone Dolomite
ASP Formulation A Formulation B1
ASG Formulation A Formulation B1
Table 3.3: Composition of optimum formulations identified from aqueous stability and phase behavior tests
Formulation-A Formulation-B1 Formulation-B2
C16-17-(PO)7-SO4- (wt%) 0.5 0.75 0.75
C15-18IOS (wt%) 0.5 0.25 0.25
Na2CO3 (wt%) 1 X X
Na2B2O4 (wt%) X 0.3 X
Ethylene glycol butyl ether
(wt%) X 1 X
Butyl alcohol (wt%) X X 1
Polymer* (ppm) 1500 1500 X
*Polymer was used in aqueous stability tests carried out for ASP corefloods.

65
Figure 3.4: Oil and water solubilization ratios versus TDS concentration in phase behavior test carried out with Formulation-A (for sandstone corefloods)
Table 3.4: Results of phase behavior test using Formulation-A
Parameter Value
Optimal salinity (TDS, ppm) 51000
Solubilization ratio at optimum salinity (cc/cc) 16
Aqueous stability limit (TDS, ppm) 65000
Salinity range for Type III microemulsion (TDS, ppm) 42500-55000

66
Figure 3.5: Oil and water solubilization ratios versus TDS concentration in phase behavior test carried out with Formulation-B1 (for dolomite corefloods)
Table 3.5: Results of phase behavior test using Formulation-B1
Parameter Value
Optimal salinity (TDS, ppm) 51000
Solubilization ratio at optimum salinity (cc/cc) 11
Aqueous stability limit (TDS, ppm) 70000
Salinity range for Type III microemulsion (TDS, ppm) 44000-53000

67
Figure 3.6: Oil and water solubilization ratios versus TDS concentration in phase behavior test carried out with Formulation-B2 (for dolomite corefloods)
Table 3.6: Results of phase behavior test using Formulation-B2
Parameter Value
Optimal salinity (TDS, ppm) 50000
Solubilization ratio at optimum salinity (cc/cc) 11
Aqueous stability limit (TDS, ppm) 60000
Salinity range for Type III microemulsion (TDS, ppm) 45000-50000

68
3.4.2 Results of Foaming Test
C16-17-(PO)7-SO4- and C15-18IOS showed good IFT reduction characteristics in
phase behavior tests. The above two surfactants, along with C14-16AOS, were then tested
for their foaming characteristics. Figure 3.7 shows the result of foaming test conducted at
the TDS concentration of 50,000 ppm. C14-16AOS gave the best result in terms of foam
stability followed by C15-18IOS. C16-17-(PO)7-SO4-, which is a strong hydrophobe, resulted
in relatively weaker foam.
As determined from phase behavior tests, C16-17-(PO)7-SO4- and C15-18IOS were
the surfactants in the slug. Since C15-18IOS exhibited relatively good foaming ability, it
was the main foaming surfactant in the slug. Although C16-17-(PO)7-SO4- is not a good
foaming agent, its presence in the slug helped in foaming by preventing precipitation of
C15-18IOS at higher salinities. C15-18IOS is not stable at higher values of salinities and
precipitates from the solution. The mixture of C16-17-(PO)7-SO4- and C15-18IOS is more
tolerant to higher values of salinity (Zhang, 2006).
Due to relatively good foaming ability of C15-18IOS, it was selected as the foamer
for the drive. Lower salinity of the drive solution, compared to the slug, improved the
stability of C15-18IOS in the aqueous solution.
Since C14-16AOS gave the best result in the foaming test, another possibility could
have been to use it as a foamer in the drive. But due to compatibility of C15-18IOS and
C16-17-(PO)7-SO4- at salinities encountered in the coreflood, only these two surfactants
were selected to be used in corefloods. The slug contained both C16-17-(PO)7-SO4- and
C15-18IOS, and drive contained only C15-18IOS.
In Chapter 5, the result of a coreflood that used C14-16AOS in the drive, in place of
C15-18IOS, is presented.

69
Figure 3.7: Height of foam column versus time obtained from foaming test carried out to determine the ability of selected surfactants to form stable foam
3.4.3 Results of Corefloods
ASG and ASP corefloods were conducted on sandstone and dolomite cores. ASP
corefloods provided a basis for comparing the results of ASG corefloods. The
experimental conditions were kept same in the ASG and ASP corefloods that were
compared with each other. Formulation-A (Table 3.4) was used in sandstone corefloods
and Formulation-B1 (Table 3.5) was used in dolomite corefloods. Table 3.7 presents slug
and drive composition in ASP corefloods.
Table 3.8 presents slug and drive composition in ASG corefloods. The use of gas
for mobility control (in ASG corefloods) was the only difference between the ASP and
ASG corefloods that were compared with each other.

70
Table 3.7: Slug and drive composition for ASP corefloods
Sandstone corefloods
Dolomite corefloods
ASP Slug
C14-16(PO)7-SO4- (primary surfactant) 0.5 wt% 0.75 wt%
C15-18IOS (secondary surfactant) 0.5 wt% 0.25 wt% Na2CO3 (alkali) 1 wt% X Na2B2O4 (alkali) X 0.3 wt%
NaCl (electrolyte) 5.25 wt% 5.25 wt% Floppam 3330S (polymer) 2500 ppm 3500 ppm
ASP Drive
NaCl (electrolyte) 3.5 wt% 2.9 wt%
Floppam 3330S (polymer) 2500 PPM 3500 ppm
Table 3.8: Slug and drive composition for ASG corefloods
Sandstone corefloods
Dolomite corefloods
ASG Slug
C14-16(PO)7-SO4- (primary surfactant) 0.5 wt% 0.75 wt%
C15-18IOS (secondary surfactant) 0.5 wt% 0.25 wt% Na2CO3 (alkali) 1 wt% X Na2B2O4 (alkali) X 0.33 wt%
NaCl (electrolyte) 5.25 wt% 5.25 wt% CO2 (Gas) 83% foam quality 35% foam quality
ASG Drive
NaCl (electrolyte) 3.5 wt% 2.9 wt% CO2 (Gas) 83% foam quality 35% foam quality
As mentioned earlier, the viscosity of crude oil used in sandstone and dolomite
corefloods was 1.2 cP and 7.05 cP, respectively. The concentration of polymer in ASP
sandstone and ASP dolomite coreflood were 2500 ppm and 3500 ppm, respectively. At
these polymer concentrations, slug and drive solutions were viscous enough to create a
favorable mobility ratio in the coreflood.

71
Polymer viscosity versus polymer concentration data at a temperature of 520C and
a salinity of 50,000 ppm is shown in Figure 3.2. Salinity of slug in both sandstone and
dolomite corefloods was approximately 50000 ppm. Thus Figure 3.2 can be used to get
an approximate estimate of slug viscosity in both sandstone and dolomite corefloods.
Table 3.9 and Table 3.10 present main details and main results, respectively, of
the four corefloods.
Table 3.9: Main details of ASP and ASG corefloods
ASP corefloods ASG corefloods
ASP_SCD1 ASP_DCP1 ASG_SCD7 ASG_DCP15
Porosity (%) 16 17 17.4 14
Brine permeability (md) 1097 40 168 188
Slug and drive liquid injection velocity (ft/day) 2.2 1.5 2.2 2.2
Slug and drive gas injection velocity (ft/day) X X 11 1.2
Injection foam quality (%) X X 83 35
Table 3.10: Main results from ASP and ASG corefloods
ASP corefloods ASG corefloods
ASP_SCD1 ASP_DCP1 ASG_SCD7 ASG_DCP15
Waterflood residual oil saturation (%) 35 22 28 18
Oil recovery (% of ROIP) 88 91 68 95
Oil recovery in oil bank (% of ROIP) 40 60 52 56

72
3.4.3.1 Results of ASP corefloods
3.4.3.1.1 ASP pressure data
Figure 3.8 and Figure 3.9 show pressure response from ASP sandstone and ASP
dolomite corefloods, respectively. Both corefloods exhibited the typical pressure
response observed in ASP corefloods, which is an increasing pressure drop across the
core until oil bank breaks through, followed by pressure drop stabilizing to a steady state
value associated with continuous polymer drive injection. The pressure drop first
increases due to mobilization of trapped oil. The mobilized oil forms an oil bank ahead of
the slug; both oil and water flow in the oil bank. If the displacement front is stable, the
size of oil bank grows as it is displaced along the core. Since both oil and water flow in
the oil bank, the fraction of core with two-phase (oil and water) flow condition increases
as the oil bank propagates towards the outlet. Thus pressure drop continues to increase till
oil bank breaks through and then gradually stabilizes to a quasi-steady state value
associated with continuous polymer drive injection. As oil bank and microemulsion are
produced, the condition in the core changes to single phase flow, i.e. only aqueous
polymer solution flows in the core. Therefore, pressure drop in the core becomes a
function of polymer drive mobility at residual saturations of oil and microemulsion.
The successive start of increase in pressure drop in three sections of the core
indicates propagation of oil bank within the core. Pressure drop stabilized to a steady
state value associated with continuous polymer drive, which was lower than the
maximum pressure drop observed during slug injection. The pressure gradient during
polymer drive in ASP sandstone and ASP dolomite corefloods, scaled to an injection
velocity of 1 ft/day, was 0.3 psi/ft and 10 psi/ft, respectively. High pressure gradient in
ASP_DCP1 is due to low permeability of the core. Although polymer did not cause

73
plugging in ASP_DCP1, high pressure drop observed in the coreflood highlights
limitations of using polymer in low permeability medium.
Figure 3.8: Pressure drop during ASP sandstone coreflood (ASP_SCD1).

74
Figure 3.9: Pressure drop during ASP dolomite coreflood (ASP_DCP1)
3.4.3.1.2 ASP oil recovery data
Figure 3.10 and Figure 3.11 show the oil recovery from the two ASP corefloods.
In ASP sandstone coreflood, final oil recovery was 88% of the remaining oil in place
(ROIP) after waterflood, and oil recovery in the form of pure oil in oil bank was 40% of
ROIP. In ASP dolomite coreflood, final oil recovery was 91% of ROIP, and oil recovery
in the form of pure oil in oil bank was 60% of ROIP
The pure oil fraction reflects the size of oil bank. The size of oil bank depends on
IFT and favorable mobility ratio between displaced and displacing fluids. Since same
chemical formulation was injected in ASP and ASG corefloods conducted on a particular
rock type, it is reasonable to assume that IFT between displaced and displacing fluid is
same in the two processes. Therefore, the difference in the size of oil bank arises from the
level of mobility control in the process. If the mobility ratio is favorable, i.e. less than or

75
close to 1, mixing between the displacing fluid (slug and drive) and oil bank is less. Thus
the size of oil bank is not affected by mixing. On the other hand if the mobility ratio is
not favorable, displacing fluids will dilute the oil bank and reduce the fraction of total
recovery obtained in the oil bank, i.e. fraction of oil produced as solubilized oil in
microemulsion will increase.
From a practical view point, it is beneficial to have most of the oil recovery in the
form of oil produced in oil bank as it would reduce the need for breaking microemulsion
to recover the solubilized oil. Hence oil recovery in the oil bank, rather than total oil
production, is a better indicator of displacement efficiency in the process.
Figure 3.10: Oil recovery and oil cut during ASP sandstone coreflood (ASP_SCD1)

76
Figure 3.11: Oil recovery and oil cut during ASP dolomite coreflood (ASP_DCP1)
3.4.3.2 Results of ASG corefloods
3.4.3.2.1 ASG pressure data
Figure 3.12 and Figure 3.13 show pressure response from ASG sandstone and
ASG dolomite corefloods, respectively. Successive increase in sectional pressure drop
data indicates formation and propagation of oil bank in the core. Similar to ASP
corefloods, pressure drop exhibited an increasing trend until oil bank breakthrough
occurred. However, the pressure drop profile in post oil bank breakthrough period is
different than ASP coreflood. Pressure drop initially decreased, like ASP corefloods, but
then exhibited an increasing trend before stabilizing to a steady state value associated
with continuous ASG drive injection. This increase in pressure during ASG drive
injection is a distinct characteristic of the ASG process and is observed in nearly all ASG

77
corefloods conducted in this research. The increase in pressure drop is attributed to
conditions developing in the core, as the flood progresses, which are favorable to foam
stability and stable foam propagation. Those conditions are: a) increase in aqueous
surfactant concentration, b) low electrolyte concentration, and c) low oil saturation. Since
a negative salinity gradient was imposed in corefloods, the slug was injected in Type III
salinity and the drive in Type II(-) salinity. At the rear end of the slug, the most important
interfacial tension is the one between surfactant drive and the microemulsion, which is
the Type III microemulsion. Interfacial tensions are not likely to be low enough to
prevent trapping of the microemulsion by the drive and thus very high retention of
surfactant (Pope and Baviere, 1991). As salinity decreases below the lower critical
salinity value, Type III microemulsion changes to Type II(-) microemulsion. Since
surfactant drive is much larger than the slug, the lower salinity eventually allows the
surfactant drive to miscibly displace Type II(-) microemulsion. Thus more surfactant is
mobilized into the drive solution, resulting in an increase in foam stability and strength.
Surfactant desorption is also a possible contributing factor in increased foam strength
during the drive, assuming adsorption to be reversible. As salinity decreases, surfactant
desorbs into mobile aqueous phase, resulting in an increase in foam strength. Lower
electrolyte concentration in the drive also improves stability of foam by increasing
electrostatic repulsion between foam films, i.e. an increase in disjoining pressure
(Israelachvilli, 1992). Lastly, low oil saturation behind the slug also improves foam
stability as destabilizing effect of oil on foam film stability decreases. The beneficial
effect of all the above factors on foam stability and strength is reflected in the form of
increase in the flow resistance and thus pressure drop across the core during drive
injection.

78
Figure 3.12: Pressure drop during ASG sandstone coreflood (ASG_SCD7).
Figure 3.13: Pressure drop during ASG dolomite coreflood (ASG_DCP15).

79
Figure 3.14 and Figure 3.15 plot effluent-salinity and pressure drop across the
core versus injected pore volumes in ASG sandstone and ASG dolomite corefloods,
respectively. The effluent salinity can be considered as an indicator of varying salinity
conditions in the core. It can be seen that the increase in pressure drop correlates to the
decrease in salinity. As the salinity condition in the core changes to Type II(-) region,
pressure drop starts to exhibit an increasing trend.
The concept of negative salinity gradient, commonly applied in chemical flooding
for improved displacement efficiency, is also favorable to the ASG process in terms of
improving foam stability and strength. The increase in foam strength results in better
displacement efficiency in the coreflood.
Figure 3.14: Pressure drop and effluent salinity versus injected pore volume in ASG sandstone coreflood (ASG_SCD7).

80
Figure 3.15: Pressure drop and effluent salinity versus injected pore volume in ASG dolomite coreflood (ASG_DCP15).
3.4.3.2.2 ASG oil recovery data
Figure 3.16 and Figure 3.17 show the oil recovery in ASG sandstone and ASG
dolomite corefloods, respectively. In ASG sandstone coreflood, final oil recovery was
68% of ROIP after waterflood, and oil recovery in the form of pure oil in the oil bank
was 50% of ROIP. In ASG dolomite coreflood, final oil recovery was 95% of ROIP, and
oil recovery in the form of pure oil in the oil bank was 60% of ROIP. The oil recoveries
obtained from ASG corefloods (68% and 95%) highlight the EOR potential of the
process. High fraction of oil recovery in the oil bank indicates that gas was able to
provide sufficient mobility control during the slug and drive injection. Comparable oil
81
recoveries obtained in ASP and ASG corefloods also highlight the potential of gas as a
possible alternative to polymer for mobility control in chemical EOR applications.
Foam quality in ASG sandstone coreflood (83%) was higher than ASG dolomite
coreflood (35%). This implies that after same amount of liquid injection (for e.g. after 0.5
PV of liquid injection), the total fluid injection in ASG sandstone coreflood was higher
(2.9 PV) than ASG dolomite coreflood (0.77 PV). Oil recovery in both ASG corefloods
exhibited a dependence on only liquid (surfactant) injection; ASG_SCD7 did not exhibit
faster recovery due to higher rate of fluid injection. This is because in ASG flooding
mobilization of residual oil is done mainly by the injected aqueous surfactant solution.
Since both ASG corefloods were conducted under the condition of gas immiscibility in
oil, gas injection did not directly aid the mobilization of residual oil. Gas, however,
helped in the displacement process by reducing the mobility of injected chemicals and
increasing contact between low-IFT chemicals and residual oil.

82
Figure 3.16: Oil recovery and oil cut during ASG sandstone coreflood (ASG_SCD7)
Figure 3.17: Oil recovery and oil cut during ASG dolomite coreflood (ASG_DCP15).

83
3.4.4 Mobility control by foam in ASG process
Mobility ratio between oil-bank and displacing fluids, and mobility reduction
factor of foam are two main indicators of mobility control in ASG corefloods. The
displacement process should be designed in such a way that there is a favorable mobility
ratio between the oil bank and slug and between leading edge of the drive and slug.
Mobility ratio between displaced and displacing phases can be calculated from sectional
pressure drop data obtained from corefloods. Figure 3.18 represents an idealized pressure
drop response in a section of the core, under the assumption that favorable mobility ratio
between displaced and displacing fluids exists, i.e. λoilbank > λslug > λdrive (λ is mobility),
and also piston-like displacement occurs. Different line segments denote pressure drop, in
a section of the core, during different fluid flow stages. For example:
A-B is the steady state pressure drop when only water, ahead of the oil bank, flows in the
section.
C-D is the steady state pressure drop when only oil bank flow in the section.
E-F is the steady state pressure drop when only slug flows in the section.
G-H is the steady state pressure drop when only drive flows in the section
The length of CD and EF depends on the size of flowing phases; for example if the size
of oil bank is large, segment CD will be longer and vice-versa. Since 1( )mobilityp
λ αΔ
,
the ratio of pressure drop during C-D to pressure drop during E-F is the mobility ratio
between slug and oil bank.

84
Both ASP and ASG corefloods, presented earlier, experienced a decrease in pressure drop
after oil bank exited the core. This is because behind the oil-bank, oil saturation is very
low and only single phase flow of displacing fluid occurs; mobility of the slug increases
due to relative permeability effect. In retrospect, it can be said that the design of ASP and
ASG corefloods should have accounted for the increase in the mobility of displacing
fluids due to relative permeability effects.
Figure 3.18: Idealized sectional pressure drop in ASG/ ASP floods under conditions of favorable mobility ratio
Figure 3.20 present the pressure drop in Section 3 of ASP sandstone coreflood
(ASP_SCD1). Taking the average pressure drop value during the flow of displacing
phases (slug and drive), the mobility ratio between oil bank and displacing phase is
calculated as 1.37.. Similarly mobility ratio between oil bank and displacing phases in
sandstone ASG coreflood is 1.38 (Figure 3.20). The pressure trend is not as stable as
depicted in the idealized case (Figure 3.18) or as in the ASP case. This is due to the
nature of foam flow in porous media. Foam continuously form and coalesce as it

85
propagates in pore channels, which is why steady pressure drop is not observed. The
pressure drop segment denoted by C-D in the two figures denotes the size of oil bank.
The length of this segment depends on overall displacement efficiency of the process. It
can be seen that in both ASP and ASG corefloods, injected slug and drive fluid mobilized
and displaced residual oil, resulting in the formation and propagation of oil bank.
Figure 3.19: Pressure drop profile in Section 3 in ASP sandstone coreflood (ASP_SCD1).

86
Figure 3.20: Pressure drop data from Section 3 in ASG sandstone coreflood (ASG_SCD7). The bold line shows the idealized trend of the pressure drop.
To further substantiate the fact that presence of foam was responsible for mobility
reduction in injected fluids, pressure drop across the core with and without foam was
compared. After drive injection was over in ASG_SCD7, gas and brine coinjection was
carried out at the same injection rates and salinity as in the drive. The continuous
coinjection of gas and brine resulted in destabilization of foam and thus increased gas and
liquid mobilities. Figure 3.21 presents pressure drop across the core in ASG_SCD7. The
ratio of stable pressure drop during ASG drive and gas-brine coinjection is the mobility
reduction factor (MRF) of foam, given as:nofoam
foam
pp
Δ
Δ. The MRF in ASG_SCD7 is
approximately 2. The MRF value greater than 1 indicates that mobilities of injected fluids
are less in the presence of foam than in its absence.

87
Figure 3.21: The effect of foam on the mobility of injected fluids in ASG process.
3.4.5 Microscopic and Macroscopic Displacement of Oil in ASG process
Foam is not a separate phase by itself (Tanzil, 2001). Therefore, foam flow must
be considered separate flows of gas and liquid. During foam flow, some of the gas is
flowing either as continuous or discontinuous phase, while the rest is trapped. In “weak”
foams – foams that cause only small reduction in mobility, like those observed in ASG
corefloods, a large fraction of gas flows as a continuous phase or a discontinuous phase;
fraction of gas trapped is low otherwise higher pressure gradient would have been
observed in corefloods.
Since “weak” foam formed in ASG corefloods presented earlier, gas either flowed
as a continuous phase or a discontinuous phase. If the fraction of continuous gas channels
is high, gas mobility is high and hence mobility control is poor due to gas fingering.
88
Continuous gas channels are channels in which stable foam cannot form, for example
channels with large oil-foam contact, interstitial gas velocity being higher than that of
liquid, or poor local fluctuation of capillary pressures for foam generation by snap-off,
etc. On the other hand, foam is stronger in pore channels having low oil saturation and in
those channels foam flows as a discontinuous phase. It is more likely that these pore
channels are already swept during waterflood. Thus stronger foam formed in pore
channels with low oil saturation diverts the injected liquid to pores having higher oil
saturation. In addition, foam propagation is more robust in higher permeability channels,
and vice-versa (Djabbarah et. al., 1988, Bertin et al., 2000, Nguyen et al, 2005). This
implies that flow resistance is higher in high permeability channels than in low
permeability channels. As a result, foam diverts injected liquid and gas to low
permeability channels, which results in the improved conformance control and
volumetric sweep efficiency in the process. Significant amount of residual oil can be
present in low permeability channels after secondary flooding. The benefit of
conformance control is generally not achieved in polymer flooding; mobility reduction
characteristic of polymer is not a strong function of permeability.
The description of foam flow and foam strength in different flow channels
presented above is confirmed by micromodel studies conducted by various researchers.
Dong et al.(2002) observed that gas, when injected into a micromodel reduced to
waterflood residual oil saturation, mainly flows in oil channels and large water channels
(high permeability channels). Gas in large water channels blocked the incoming injected
water and diverted it into the oil channels. The same flow behavior can be applied in the
case of ASG flooding. Gas being non-wetting phase will flow in large channels and
liquid will flow in small channels and along the surface of large channels (Schramm,
1994). Once foam is formed in channels in which gas flows, flow resistance will increase

89
in those channels, and injected fluid will be diverted to small channels (low permeability
channels).
Figure 3.22: Pore level schematic of foam in porous media.
Figure 3.23 illustrates the displacement process in ASG flooding on a
macroscopic scale. The macroscopic model of oil displacement in ASG process helps in
identifying criteria for efficient displacement of oil. They are:
1. Low IFT between the slug and the oil bank for efficient mobilization of residual
oil.
2. Low IFT between the slug and the drive to reduce surfactant trapping in the
microemulsion
3. Favorable mobility ratio between the slug and the oil bank
4. Favorable mobility ratio between the drive and the slug.
90
5. Maintenance of chemical integrity of the slug as it propagates in the porous
medium.
The injection of low-IFT chemical slug results in the formation of oil bank. At the
leading and trailing ends of the slug, mixing with resident brine and ASG drive,
respectively, results in the formation of two mixing zones. If negative salinity gradient is
imposed in the coreflood, the salinity in the mixing zone at the leading end (first mixing
zone denoted by M(II+)) is higher than the optimal salinity. Type II(+) microemulsion
environment is likely to exist in this mixing zone. Since slug is injected at optimal
salinity, Type III microemulsion environment exists in the portion of slug not affected by
mixing. Salinity in the mixing zone at the trailing end of the slug (second mixing zone) is
lower than the optimal salinity; the conditions in this mixing zone are likely Type II(-).
Behind the mixing zone at the trailing end of slug, the injected liquid is not affected by
the mixing and has the composition of the ASG drive. In this region, almost negligible
microemulsion is present and foam is formed in surfactant laden aqueous phase.
The macroscopic displacement model of ASG flooding highlights the importance
of foam stability in different zones present behind the oil bank. Therefore, strength of
foam in different microemulsion environments, i.e. Type II(+), Type III, and Type (II-),
needs to be studied. Based on composition of the three microemulsion types, a hypothesis
can be put forward on the relative strength of foam in Type II(+), Type III and Type II(-)
systems. Since the amount of oil present in the surfactant bearing phase (or phases) in
Type II(+) , Type III and Type II(-) systems decreases in the given order, the strength of
the foam progressively increases from the first mixing zone to ASG drive. This
hypothesis, however, needs to be proved experimentally by comparing strength of foam
generated in the three microemulsion environments. It should be mentioned that the
initial decreasing trend observed in sectional pressure drop in ASG corefloods, after the

91
entry of drive is not due to foam being weaker in the drive but due to Type III
microemulsion formed in the slug being more viscous than the drive. The above assertion
is supported by experiments, presented in Chapter 4, which investigate foam strength in
different microemulsion environments.
Figure 3.23: Displacement process in ASG flooding.
3.5 CHAPTER SUMMARY
Results presented in this chapter highlight the potential of ASG process as an
EOR method. ASG coreflood was successfully conducted on low to medium permeability
sandstone and dolomite cores. The effectiveness of foamed gas in providing mobility
control is evident by the oil recovery and pressure response observed in the ASG
corefloods. In addition, oil recoveries in ASG corefloods were comparable to oil
recoveries in ASP corefloods carried out under similar conditions. Sectional pressure
drop values in ASG sandstone coreflood show that mobilities of slug and drive fluids
were close to the mobility of oil bank, in spite of no polymer being used in displacing
fluids.
Displacement efficiency, both microscopic and macroscopic, in ASG process,
depends upon chemical formulation of slug and drive. The main feature of ASG chemical
formulation is using a surfactant, or a blend of surfactants, that can perform the dual role
ASG Drive
ASG Slug (III)
M(II+) M(II-) Oil
Oil
BrineBrine
Oil Bank

92
of reducing IFT and generating stable foam. Therefore, phase behavior and foaming test
are needed to identify the optimal chemical formulation.
The negative salinity gradient commonly applied in chemical floods is also
beneficial in ASG flooding. Foam stability is improved as salinity of the system
decreases. Trapped surfactant in viscous microemulsion phase is mobilized into ASG
drive, thus increasing foam strength in the drive. This is an important observation, as
strong foam is required during drive injection for good mobility and conformance
control.
The rate of oil recovery in ASG process exhibits dependence on only liquid
injection, i.e. oil recovery is unaffected by the amount of gas injection. This is because
mobilization of oil through IFT reduction is accomplished by the liquid phase. Gas assists
in the displacement process by providing mobility and conformance control.

93
CHAPTER 4
Main Factors Influencing ASG Process
4.1 INTRODUCTION
The previous chapter investigated the potential of ASG process as an enhanced oil
recovery (EOR) technique. It compared ASG coreflood results with the results of ASP
corefloods to obtain a comparative assessment of displacement efficiency is ASG
process. Coreflood results presented in Chapter 3 demonstrated that the use of gas in
chemical floods can provide mobility control and improve displacement efficiency of the
process. Although results presented in Chapter 3 are promising, performance of ASG
process needs to be further evaluated in order to establish it as a feasible EOR method.
Low interfacial tension and mobility control due to stable foam propagation are
two main requirements for a successful ASG application. IFT between displaced and
displacing phases is determined by surfactant/brine/oil phase behavior and is mostly
independent of rock and process parameters. On the contrary, foam stability and
propagation is significantly affected by both rock and process control parameters.
Permeability is the most important rock parameter that control mobility reduction
characteristics of foam in porous media. On the other hand, injection foam quality,
chemical slug size, and foaming surfactant type are main process control parameters that
influence foam behavior. Therefore, effects of above parameters on the performance of
ASG process needs to be ascertained in order to determine its applicability in different
conditions.

94
Main parameters that influence ASG process are investigated in this chapter. The
effect of permeability, injection foam quality, chemical slug size and foaming surfactant
type on mobility control, in ASG process, are studied. Total oil recovery, size of oil bank
(or recovery in the form of pure oil), and gas relative mobility, λrg (calculated at the
quasi-steady state during drive injection) are main indicators of the level of mobility
control in corefloods. Gas relative mobility is defined as:
rg
u 1 k /
g
p xλ
⎛ ⎞= − ⎜ ⎟Δ Δ⎝ ⎠
4.1
where ug is the superficial gas velocity, and Δp/Δx is the stabilized pressure drop
during the foamed drive. In the absence of significant compression, ug is calculated at the
injection conditions.
Corefloods presented in this chapter were conducted on Silurian dolomite and
Berea sandstone rocks. Formulation-B2 was used for dolomite ASG corefloods and
Formulation-A was used for sandstone ASG corefloods (Chapter 3, Table 3.2). Coreflood
procedure (Chapter 3, Section 3.3.3) was same in all corefloods.
4.2 EFFECT OF PERMEABILITY
Experimental evidence indicates that foam reduces gas mobility more in high
permeability medium than in low permeability medium. For instance, Casteel and
Djabbarah (1988) examined CO2 displacement efficiency with foaming agents in parallel
one dimensional porous medium with different permeabilities. They found that foam
increased resistance to flow in high permeability layer and diverted injected CO2 to low

95
permeable porous medium. Bertin et al. (2000) constructed a heterogeneous porous
medium with permeable sand surrounding a sandstone core. The permeability contrast
was about 70:1. In the absence of foam, very little gas flowed into low permeability
sandstone core. In the presence of foam, a significant portion of injected gas was
diverted. Tsau and Heller (1996) also found that effective viscosity of foam increases
with permeability, and termed this behavior of foam as ‘selective mobility reduction’.
The selective mobility reduction, if exhibited by foam in ASG flooding, would aid in
achieving better conformance control in ASG process. Benefits of selective mobility
reduction are not achieved in polymer applications because its mobility reduction
characteristic is not a strong function of permeability. On the basis of previous studies on
the effect of permeability on foam, it is reasonable to assume that mobility control in
ASG process is more robust in a high permeability medium compared to a low
permeability medium.
Performance of ASG flooding in low permeability medium gains importance due
to the fact that polymer has limited applicability in low permeable rocks. High molecular
weight polymers can plug rocks with very low permeability, or if a lower molecular
weight polymer is used to avoid plugging, then the cost of using polymer increases and
the process eventually becomes uneconomic. Gas can be an alternative to polymer in
providing mobility control in low permeability chemical EOR applications. Therefore,
effects of low permeability on foam behavior and mobility control needs to be studied to
ascertain applicability of ASG process in low permeability reservoirs.
In order to study effects of permeability on foam characteristics in ASG process,
the results of three ASG corefloods performed on high (ASG_DCP9), medium
(ASG_DCP8), and low (ASG_DCP10) permeability dolomite cores were compared.

96
Table 4. presents details of these three corefloods. The experimental conditions
were same in each corefloods, except for the core permeability. Gas and liquid injection
velocities (during slug and drive injection), in high and medium permeability ASG
corefloods, were maintained at 2 ft/day. Gas and liquid injection velocities in the low
permeability ASG coreflood were kept slightly lower at 1 ft/day, in order to avoid high
pressure drop across the core during the coreflood. The injection foam quality was
maintained at 50% in all three corefloods. Table 4.2 contains main results from the three
corefloods.
Table 4.1: Details of corefloods carried out to study the effect of permeability on ASG process.
High
Permeability (ASG_DCP9)
Medium Permeability (ASG_DCP8)
Low Permeability
(ASG_DCP10)
Permeability (md) 447 114 2
Foam quality (%) 50 50 50
Liquid injection velocity in slug and drive
(ft/day) 2 2 1
Gas injection velocity in slug and drive (ft/day) 2 2 1

97
Table 4.2: Results of corefloods carried out to study the effect of permeability on ASG process
High
Permeability (ASG_DCP9)
Medium Permeability
(ASG_DCP8)
Low Permeability
(ASG_DCP10)Foam relative mobility at stabilized pressure drop during foamed drive
(cP)-1 0.135 0.245 2.3
Final recovery (% of remaining oil in place) 87 90 78
Recovery in the form of pure oil (% of ROIP) 52 40 20
Figure 4.1 and Figure 4.2 show pressure drop and oil production data,
respectively, obtained from the high permeability ASG coreflood (ASG_DCP9). The
overall pressure drop data is similar to pressure response typically observed in ASP/SP
corefloods, which is initial increase in pressure drop across the core until oil bank breaks
through followed by pressure drop stabilizing to a steady state value. Pressure drop in
ASG_DCP9 also exhibited the characteristic trend associated with ASG flooding, i.e.
increasing pressure drop during drive injection due to increase in foam propagation as
salinity in the core transitions to Type II(-) environment (Srivastava et al., 2009). The oil
recovery at the end of coreflood was 87% of remaining oil in place (ROIP) after
waterflood. The oil production in the form of pure oil in oil bank was 52% of ROIP and
rest of the oil was produced as solubilized oil in the microemulsion.

98
Figure 4.1: Pressure response in high permeability ASG coreflood (ASG_DCP9).
Figure 4.2: Oil recovery and oil cut data from high permeability ASG coreflood (ASG_DCP9).

99
The medium permeability ASG coreflood (ASG_DCP8) also exhibited increasing
pressure trend during drive injection (Figure 4.3). The final oil recovery in ASG_DCP8
was 90% of ROIP, and 40% of ROIP was recovered in the oil bank (Figure 4.4). The low
permeability coreflood (ASG_DCP10), however, did not exhibit an increase in pressure
drop during drive injection (Figure 4.5). The final oil recovery in the coreflood was 78%
of ROIP, and only 20% of ROIP was recovered in the oil bank (Figure 4.6). Gas relative
mobility values calculated at the end of drive injection, when both pressure drop and gas
and liquid production rates have relatively stabilized, are indicator of foam strength in the
corefloods. Using Equation 4.1, gas relative mobility in high, medium, and low
permeability corefloods are calculated to be 0.27 cP-1, 0.49 cP-1, and 4.59 cP-1,
respectively. Since the pressure drop did not reach quasi-steady state in ASG_DCP10, the
actual foam relative mobility is most likely higher than 4.59 cP-1. Nevertheless, higher
gas relative mobility value in low permeability ASG coreflood indicates relatively
weaker foam. Gas relative mobility values from the three corefloods highlight the strong
dependence of foam propagation in ASG process on rock permeability. This foam
robustness-permeability relationship demonstrates the great potential of good
conformance control in ASG process.
The pure oil fraction reflects the size of oil bank. If the mobility ratio between the
slug and oil bank is favorable (i.e. <1), mixing between gas, chemical slug, and oil is less
and size of the oil bank is large. On the other hand, if the mobility ratio is not favorable,
displacing fluids will dilute the oil bank and reduce the fraction of total recovery obtained
in the oil bank i.e. fraction of oil produced as solubilized oil in microemulsion will
increase. Therefore, oil recovery in the oil bank, rather than total oil production, is a
correct indicator of mobility control in the process. The production data from the three
corefloods indicate that displacement of mobilized oil was most efficient in high

100
permeability ASG coreflood, as the size of oil bank was largest in that coreflood. The
magnitude of mixing between chemical slug and mobilized oil increased with the
decrease in permeability. Very weak foam in ASG_DCP10 resulted in poor mobility
control and increased mixing between the slug and oil bank.
Although mobility control in ASG_DCP10 was not as efficient as the other two
corefloods carried out at higher permeabilities, the fact that foam did not cause plugging
in a very low permeability carbonate core (2 md) highlights the potential of ASG
application in very low permeability rocks. At such low permeability values, use of
polymer (Floppam 3330S in this study) at concentrations required to provide sufficient
mobility control (3500 PPM), will result in significantly higher pressure gradients and
may cause plugging. This inference is supported by ASP coreflood (ASP_DCP1), which
is presented in Chapter 3 (Figure 3.8). ASP_DCP1 was carried out on a 40 md dolomite
core and use of polymer instead of gas is the only difference between ASP_DCP1 and
ASG_DCP10. In spite of core permeability being 20 times higher in ASP_DCP1, higher
pressure gradients were observed in ASP_DCP1 compared to pressure gradients observed
in ASG_DCP10.

101
Figure 4.3: Pressure response in medium permeability ASG coreflood (ASG_DCP8).
Figure 4.4: Oil recovery and oil cut data from medium permeability ASG coreflood (ASG_DCP8).

102
Figure 4.5: Pressure response in low permeability ASG coreflood (ASG_DCP10). The increasing pressure trend during foam-drive is absent.
Figure 4.6: Oil recovery and oil cut data from low permeability ASG coreflood (ASG_DCP10)

103
4.3 EFFECT OF GAS AND CHEMICAL INJECTION RATES (INJECTION FOAM QUALITY)
Gas and chemical (surfactant solution) injection rates are closely related to insitu
foam quality and stability of the displacement front. Injection rates should be such that
gas and surfactant solution form a stable displacement front in which gas is uniformly
dispersed in surfactant solution. This will prevent one phase from moving ahead of the
other, and as a result mobilities of injected fluids will remain relatively low. In order to
study the effect of injection foam quality, three respective ASG corefloods with low
(35%), medium (50%), and high (83%) foam qualities were conducted. Table 4.3 and
Table 4.4 present details and results, respectively, of the three ASG corefloods.
Table 4.3: Details of corefloods carried out to study the effect of foam quality on ASG process.
High foam
quality (ASG_DCP2)
Medium foam quality
(ASG_DCP8)
Low foam quality
(ASG_DCP15)
Permeability (md) 208 114 188
Liquid injection rate in slug and drive (ft/day) 2 2 2.4
Gas injection rate in slug and drive (ft/day) 10 2 1.4
Foam quality (%) 83 50 35

104
Table 4.4: Results of corefloods carried out to study the effect of foam quality on ASG process.
High foam
quality (ASG_DCP2)
Medium foam quality
(ASG_DCP8)
Low foam quality
(ASG_DCP15) Foam relative mobility at the
stabilized pressure drop during drive (cP)-1
1.03 0.245 0.168
Oil recovery (% of ROIP) 86 90 97
Recovery in the form of pure oil (% of ROIP) 42 40 56
Figure 4.7 and Figure 4.8 show pressure and oil recovery data, respectively, from
high foam quality ASG coreflood (ASG_DCP2). Figure 4.9 and Figure 4.10 show
pressure and oil recovery data, respectively, from low foam quality ASG coreflood
(ASG_DCP15). The result of medium foam quality (ASG_DCP8) coreflood has already
been presented in the previous section (Figure 4.3 and Figure 4.4). It can be seen that
typical pressure trend associated with ASG flooding was observed in all three corefloods
and foam only resulted in small pressure gradients. Gas relative mobility calculated in
low, medium, and high foam quality ASG coreflood are 0.168 cP-1, 0.245 cP-1, and 1.03
cP-1, respectively. Gas relative mobility increased with the increase in foam quality at
fixed liquid rate. The 50% and 83% qualities in ASG_DCP8 and ASG_DCP2,
respectively, are well in the range in which researchers have reported increase in foam
strength with the increase in foam quality (Blauer, 1974; Schramm, 1994). However, no
such foam quality-foam strength dependence was observed in ASG corefloods. The most
likely reason for the above behavior is stability of foam being adversely affected by
higher gas velocities. In the three ASG corefloods carried out to study the effect of foam

105
quality, the gas injection rate was also increased with foam quality. The gas injection rate
was highest in high quality ASG coreflood and lowest in low quality ASG coreflood.
Hirasaki et al. (1985) reported that resistance to flow per moving lamella decreases as gas
velocity is increased. Nguyen (2004) reported lamella destabilization at higher gas
velocities, causing foam bubbles to break and coalesce. The higher velocity of gas
resulted in gas moving ahead of liquid and fingering into oil bank. As a result oil
recovery in the high foam quality coreflood was relatively poor.
Among the three corefloods, low quality coreflood (ASG_DCP15) resulted in the
highest oil recovery, i.e. 97% of remaining oil to waterflood. The percentage of residual
oil recovered in oil bank was also highest in ASG_DCP15. Higher oil recovery in
ASG_DCP15 can be attributed to lower gas velocity resulting in lower foam mobility,
compared to other two corefloods (ASG_DCP2 and ASG_DCP8).
Based on pressure drop and production data from the corefloods, it can be
concluded that at fluid velocities and conditions typically encountered in EOR
applications, gas velocity is an important factor in determining the extent of foam
propagation. Lower gas velocity results in more stable foam and thus better foam
propagation.

106
Figure 4.7: Pressure drop in high foam quality ASG coreflood (ASG_DCP2).
Figure 4.8: Oil recovery and oil cut in high quality ASG coreflood (ASG_DCP2).

107
Figure 4.9: Pressure drop in low foam quality ASG coreflood (ASG_DCP15).
Figure 4.10: Oil recovery and oil cut in low foam quality ASG coreflood (ASG_DCP15).

108
4.4 EFFECT OF CHEMICAL SLUG SIZE
The size of chemical slug is an important design criterion in chemical flooding.
The chemical integrity of the slug has to be maintained in order to achieve low IFT
conditions. In ASG process the size of chemical slug is also important due to the fact that
it is a factor controlling the slug mobility and hence the displacement efficiency of the
process. Based on the results of ASP coreflood studies (Flatten et al., 2008; Zhang et al.,
2008), which used same surfactants/brine/oil system as used in this study, 0.3 PV of
chemical slug was found adequate to mobilize residual oil in corefloods. The coreflood
results presented in previous two sections show the performance of ASG process with a
chemical slug size of 0.3 PV (i.e. volume of liquid). In order to study the effects of slug
size on foam propagation, and hence on the displacement efficiency, coreflood
ASG_DCP11 was conducted in which 0.15 PV of liquid chemical slug was injected in
the core. The coreflood was conducted on a medium permeability core, at an injection
foam quality of 50% (Table 4.5). ASG_DCP9, in which the size of chemical slug was 0.3
PV, was used as the base case for comparing the results of ASG_DCP11. Gas rate at the
effluent was monitored throughout the coreflood. Gas breakthrough time is a good
indicator of foam induced mobility control. Table 4.6 compares the results of
ASG_DCP9 and ASG_DCP11.

109
Table 4.5: Details of corefloods carried out to study the effect of slug size on ASG process
ASG_DCP9 ASG_DCP11
Permeability (md) 447 327
Liquid injection rate in slug and drive (ft/day) 2 2
Gas injection rate in slug and drive (ft/day) 2 2
Injection foam quality (%) 50 50
Table 4.6:Results of corefloods carried out to study the effect of slug size on ASG process.
ASG_DCP9 ASG_DCP11
Foam relative mobility calculated at the stabilized pressure drop (cP)-1 0.135 0.07
Gas breakthrough (at injected liquid PV) 0.52 0.4
Final oil recovery (% of ROIP) 87 64
Recovery in the form of pure oil (% of ROIP) 52 32
The pressure drop data in ASG_DCP11 was similar to other ASG corefloods
presented in this paper (Figure 4.9). The increasing pressure drop during drive injection
was observed in the coreflood. The final recovery in ASG_DCP11 was 64% of ROIP,
lower than 87% of ROIP recovered in ASG_DCP9 (Figure 4.10). Lower recovery
observed in ASP_DCP11 was not due to poor mobility control but due to less surfactant

110
injection in the coreflood (only 0.15 PV). Since amount of surfactant available for oil
mobilization in ASG_DCP11 was less compared to ASG_DCP9, relatively less oil was
mobilized. The above argument can be supported by analyzing the gas breakthrough data
in ASG_DCP11. Figure 4.13 presents the effluent surfactant concentration and effluent
gas rate data obtained from ASG_DCP11. Gas and surfactant break through occurred
approximately at the same time (at 0.4 PV of liquid injection), suggesting a stable
displacement front and absence of gas fingering through the oil bank. The late gas
production is a strong indicator of foam reducing gas mobility in the coreflood.
Reduction in slug size did not adversely affect mobility control in the coreflood and foam
reduced the mobility of displacing fluids, thus providing good mobility control.
ASG_DCP11 demonstrates the potential of ASG process in conditions that require
injection of small slug sizes. Typically in chemical EOR applications, the size of
chemical slug varies from 0.1 PV to 0.3 PV.
For a given slug size, surfactant concentration is another influencing factor in
characterization of foam stability. Unlike polymer, whose viscosity is a strong function of
its concentration in the solution, foam strength is almost insensitive to surfactant
concentration as the amount of surfactant exceeds a certain critical concentration. Such
critical surfactant concentration is determined merely by surfactant molecular structure,
and it is close to the critical micelle concentration (CMC) for several surfactants. Foam
strength increases with surfactant concentrations below CMC because of increase in foam
stability. The CMC is relatively low (<1000ppm) for most commonly used foaming and
high performance surfactants, including those used in this work. Therefore, lowering IFT
due to emulsification accounts mainly for the amount of surfactant required for oil
mobilization.

111
Figure 4.11: Pressure drop in ASG_DCP11. The chemical slug size in ASG_DCP11 was 0.15 PV.
Figure 4.12: Oil recoveries in ASG_DCP11 and ASG_DCP9. A smaller slug size (0.15 PV) was injected in ASG_DCP11 compared to ASG_DCP9 (Slug size: 0.3 PV).

112
Figure 4.13: Effluent gas rate and surfactant concentration in ASG_DCP11. Gas breakthrough coincided with surfactant breakthrough indicating absence of gas viscous fingering through the oil bank.
4.5 SURFACTANT TYPE
Foaming tests, presented in Chapter 3, indicate that C14-16AOS is a better foamer
than C16-17-(PO)7-SO4- and C15-18IOS. However, foaming tests were carried out in
pipettes, at room temperature, with no surfactant adsorption and capillary forces to
destabilize foam. In order to test the effectiveness of C14-16AOS, coreflood ASG_SCD4
was conducted with C14-16AOS replacing C15-18IOS in the drive. The only difference
between ASG_SCD4 and ASG_SCD7 was the use of C14-16AOS in the foamed drive in
the former coreflood. The results of ASG_SCD7 are already presented in Chapter 3. Both
corefloods were conducted on Berea sandstone rock and employed an injection foam
quality of 83%. Table 4.7 presents main details of the two corefloods. Figure 4.14

113
compares the pressure data of ASG_SCD4 and ASG_SCD7. The use of C14-16AOS did
not result in any significant increase in the pressure drop across the core. The apparent
viscosity of foam in ASG_SCD7 and ASG_SCD4 were 0.82 cP and 0.47 cP,
respectively. The strength of foam was relatively higher in ASG_SCD7. Pressure
increase during drive injection occurred at a much later stage (after 2.2 PV of liquid
injection) in ASG_SCD4 than ASG_SCD7. Figure 4.15 compares the production data
from the two corefloods. The recovery profile and oil recovery is almost similar in the
two corefloods. Thus no improvement in oil recovery was observed by using C14-16AOS
in the foamed drive.
The results of ASG_SCD7 and ASG_SCD4 do not conform to foaming test
presented in Chapter 3, which indicated C14-16AOS to be a far better foamer than C15-
18IOS. The most likely reasons for relatively lower strength of foam with using C14-
16AOS are surfactant adsorption and/or effect of microemulsion environment. Since C14-
16AOS was not used in the slug, it may have taken longer to satisfy its adsorption
requirement on the rock. Foaming tests presented in Chapter 3 were simplistic tests, in
which foam stability was tested in pipettes containing oil and aqueous surfactant
solution.. Therefore, to get the true estimate of surfactant potential for ASG flooding,
foaming tests should be carried out in the presence of microemulsion environment. A
detailed description of procedures involved in microemulsion foaming test is presented in
Chapter 6. ASG_SCD4 and ASG_SCD7 highlights the complexities involved in selecting
a foaming agent for ASG process.

114
Table 4.7: Details of corefloods ASG_SCD4 and ASG_SCD7 carried out to study the effect of surfactant type on ASG process.
Parameter ASG_SCD7 ASG_SCD4 Permeability
(md) 168 152
Liquid injection velocity in slug and drive (ft/day) 2.2 2.2
Gas injection velocity in slug and drive (ft/day) 11 11
Injection foam quality (%) 83 83
Table 4.8: Results of corefloods ASG_SCD4 and ASG_SCD7 carried out to study the effect of surfactant type on ASG process
Parameter ASG_SCD7 ASG_SCD4
Apparent gas viscosity at the stabilized pressure drop during foamed drive (cP)
0.82 0.47
Final oil recovery (% of ROIP) 67 62
Recovery in the form of pure oil (% of ROIP) 40 35

115
Figure 4.14: A comparison of pressure drop data from ASG_SCD4 and ASG_SCD7 to study the effect of surfactant type on ASG process
Figure 4.15: A comparison of oil recovery data from ASG_SCD4 and ASG_SCD7 to study the effect of surfactant type on ASG process.

116
4.6 CHAPTER SUMMARY
Oil recovery and pressure data from corefloods highlight the feasibility of ASG
process under different conditions of permeability, fluid injection velocity (injection
foam quality), and at slug size as small as 0.15 PV. The level of mobility control, and
hence displacement efficiency, is better at higher permeability values. Similarly, low gas
injection velocities resulted in more stable foam propagation. The size of oil bank for
successful ASG corefloods varied from 40% to 56% of ROIP, thus indicating a degree of
mobility control in the displacement of mobilized oil.
An important advantage of ASG process, over ASP/SP processes, is the improved
conformance control. Foam has higher apparent viscosity (lower foam mobility) in high
permeability region than in low permeability region. Due to significant flow resistance
exerted by foam in high permeability regions, the injected fluid will be diverted to low
permeability regions, resulting in the improvement in volumetric sweep efficiency.
Furthermore, the absence of plugging highlights the potential of applying ASG process in
low permeability rocks.
Mobility control in ASG process is greatly affected by gas injection rates. In
corefloods presented in this chapter, lower gas velocities resulted in better displacement
efficiency. Gas velocity, appears to be main influencing parameter controlling the
mobility control in the process. For the fixed liquid rate, the increase in foam propagation
(or foam strength) was not observed with the increase in foam quality.
The reduction in the size of chemical slug, from 0.3 PV to 0.15 PV did not have a
significant impact on foam propagation. Early gas breakthrough was not observed as
chemical slug size was reduced by 50%, indicating relatively stable foam in the slug and
drive.

117
The use of C14-16AOS, a better foaming surfactant than C15-18IOS, in the foamed
drive did not result in any improvement in oil recovery. This may be due to higher
adsorption of C14-16AOS on rock surface. Results presented in this chapter further
highlight the potential of ASG process as an EOR technique.

118
CHAPTER 5
ASG Process at Elevated Pressure
5.1 INTRODUCTION
Stable foam propagation and optimal surfactant/oil/brine phase behavior are the
two main requirements for efficient mobilization and displacement of oil in ASG process.
Pressure affects both foam and surfactant phase behavior characteristics in ASG process.
Gas-water interfacial tension, gas compressibility, gas diffusion through foam films, gas
solubility in aqueous and hydrocarbon phases, surfactant adsorption, and foam-oil
interactions are the main pressure dependant physical properties and processes that
determine foam stability and in-situ generation. The effect of pressure on surfactant phase
behavior is through gas solubility and reactivity in the aqueous phase. For example, in
CO2 ASG process, pressure affects surfactant/brine/oil phase behavior by influencing
CO2 solubility in the aqueous phase. Solubilization of CO2 in water results in the
formation of carbonic acid. If alkali is used in ASG process, the presence of carbonic acid
results in alkali consumption (through acid-base reaction). If the oil is acidic,
consumption of alkali reduces the amount of soap that is generated from the reaction
between alkali and acid species present in crude oil. Alkali consumption may also
increase surfactant adsorption. Thus amount of surfactant available for oil mobilization
and foam stabilization decreases with the consumption of alkali. Moreover, removal of
alkali shifts optimal salinity to higher salinity values and also influences oil and water
solubilization ratios. Carbonic acid also reacts with rock matrix, resulting in mineral
dissolution and changes in rock permeability. Thus, pressure influence ASG process in
mainly three ways: a) by influencing factors affecting foam stability and in-situ

119
generation, b) by influencing factors affecting surfactant/oil/brine phase, and c) behavior
by influencing factors affecting rock-fluid reactions (geo-chemistry). The last two effect
are mainly associated with CO2 ASG process, particularly with reactive crude oils (i.e.
having high active acid number)
This chapter presents results of experimental work carried out to study the effect
of pressure on ASG process. ASG corefloods were conducted at both elevated and
atmospheric pressure, using either CO2 foams or N2 foams. ASG corefloods at elevated
pressure were carried out at the outlet pressure of 400 psi and temperature of 520C. The
outlet pressure of 400 psi is below the average reservoir pressure of most hydrocarbon
reservoirs. However, the main objective of this study was to observe the effect of
pressure on ASG process in the form of residual oil displacement efficiency. At these
temperature and pressure conditions, miscibility of CO2 in oil is not significant.
Therefore, CO2 miscibility in oil did not play any significant role in oil recovery, and the
displacement efficiency remained a function of stable foam propagation and optimal
phase behavior (optimal phase behavior implies equal oil and water solubilization ratios
and equal oil/microemulsion and water/microemulsion interfacial tensions). This allowed
comparison between low and high pressure CO2 ASG corefloods on the basis of foam
stability and surfactant/oil/brine phase behavior at the two pressures.
In this chapter, first, a literature review on the effect of pressure on foam stability
is presented. Second, various pressure dependant mechanisms that can influence ASG
process are reviewed. Finally, results of ASG corefloods carried out at atmospheric and
elevated pressure are presented and analyzed.

120
5.2 BACKGROUND
Several authors have studied the effect of pressure on foam strength and flow
characteristics. Harris (1989) observed increase in apparent viscosity of foam at a same
shear rate with the increase in pressure, whereas, Cawizel et al. (1987) found apparent
viscosity of foam to decrease with the increase in pressure. Maini (1988) observed that
both the drainage half life and half life of foam volume decay increased with increasing
pressure, indicating an increase in foam stability with the increase in pressure. Holt et al.
(1996) studied the effect of pressure on foam stability in the presence and absence of oil.
They found that in the absence of oil foam strength increases with the increase in
pressure. They explained this observation on the basis of Fixed-Pc Model (Rossen, 1995).
Their experimental data showed that water saturation at critical capillary pressure (Pc*) at
which foam collapse shifts to lower water saturation values with the increase in pressure.
They attributed this behavior to the reduction in gas-water IFT with the increase in
pressure. From their experiments carried out in the presence of oil, they concluded effect
of pressure on foam stability varies with surfactant-oil-gas systems and depends on oil
spreading and entering coefficients for that particular surfactant-oil-gas combination.
They calculated spreading and entering coefficient of oil in foam films for two different
oils at both low and high pressures. They found entering and spreading coefficients, for
one of the oil, to decrease with the increase in pressure, thus implying increase in the
stability of foam, formed in the presence that oil, with the increase in pressure. Farazadeh
et al. (2009) studied the effect of CO2 and N2 solubility in aqueous phase on their
foaming characteristics. They observed that if solubility of gas in aqueous phase is
significant, foam strength is adversely affected with the increase in pressure. Since
solubility of gases in the aqueous phase increases with pressure, if gas solubility is
significant, foam strength is expected to decrease with the increase in pressure.
121
The review of pertinent literature reveals that results of studies on the effect of
pressure on foam strength are conflicting. For example, greater mechanical interaction
between the foam bubbles at increased pressure may lead to increase in foam viscosity
(or reduction in gas and liquid mobilities). On the other hand, increase in pressure can
also lead to increased gas solubility in the aqueous and hydrocarbon phases and lower
gas-water IFT, both of which can decrease foam strength. Therefore, it is reasonable to
conclude that effect of pressure on foam stability is complex and vary case by case basis.
Pressure may increase or decrease foam strength depending up on which pressure
dependant factors dominates the process.
5.2.1 Effect of Pressure on Factors Influencing Foam Stability and Generation in ASG Process with Non-Reactive Crude Oils
The characteristics of several factors influencing stable foam propagation varies
with pressure. These pressure dependent factors are gas compressibility, gas solubility in
aqueous phase, gas-water IFT, gas diffusion through foam films, foam destabilization by
oil, and pH. Any change in pressure causes these parameters to change in varying
magnitude, thus affecting foam propagation. In this section, these parameters are
discussed in detail.
5.2.1.1 Gas compressibility
Gas compressibility affects foam texture and foam quality. As foam flows
downstream, the compressible foam bubbles expand increasing their velocity. Hirasaki
and Lawson (1985) showed that for bubbles in cylindrical capillaries, flow resistance per
unit lamella is inversely proportional to gas velocity and is given as:

122
1 2flow resistance ,3 3
x
g
xvσα
⎛ ⎞⟨ ⟨⎜ ⎟⎜ ⎟
⎝ ⎠ 5.1
where , vg is gas velocity, σ is interfacial tension
Therefore, increase in gas velocity results in reduction in foam resistance to flow
(i.e shear thinning behavior). The increased velocity triggers increased foam coalescence
and more coarsely textured foam is formed (Kovscek et al., 1997). Since gas
compressibility decreases with increasing pressure (in the pressure range relevant for this
study), the increase in gas velocity as foam flows downstream in high pressure corefloods
is less; therefore, foam may remain stable at high pressures.
5.2.1.2 Gas Solubility in Aqueous Phase
Solubilities of CO2 and N2, the two gases commonly used in foam applications, in
aqueous phase increases with the increase in pressure. The increased solubility of gas in
aqueous phase implies less gas available for foaming. Farazadeh et al. (2009) conducted
a CT scan study of corefloods in which gas (either CO2 or N2) was injected into the core
pre-saturated with surfactant solution. They observed that in CO2 corefloods higher pore
volumes of gas, compared to N2 corefloods, was injected before gas became visible in the
core, i.e. gas saturation became high enough to be detected by x-ray chromatography.
They attributed this observation to higher solubility of CO2 in the aqueous phase
compared to N2. At their experimental conditions, solubility of CO2 was approximately
55 times higher than N2. Therefore, a fraction of injected CO2 solubilized into the
aqueous phase (surfactant solution), which retarded the rate of increase of gaseous CO2
saturation in the core, and as a result CO2 saturation remained below detectable levels for
a longer period of time compared to N2.

123
Solubility of gas in aqueous phase can be calculated by Henry’s law, which
describes the equilibrium between vapor and liquid. Henry’s law is given as:
kH = Ca/Pgas 5.2
where,
Pgas = partial pressure of gas in the bulk atmosphere (atm)
Ca = equilibrium concentration of gas in the aqueous phase (M) (M = moles/m3)
K= Henry’s constant (M/atm).
A fraction of dissolved CO2, however, reacts with water to form carbonic acid
(H2CO3). Therefore, for CO2, Henry’s law has to be modified to take into account
reaction between CO2 and water. Carrol and Mather (1992) proposed a form of Henry’s
law that takes into account CO2 reactivity in water and can be used for modeling
solubility of CO2 in water for pressures up to 10 MPa. Carrol and Mather presented
Henry’s law as:
gas
inv
PK
Xa
= 5.3
where, Xa = equilibrium mole fraction of dissolved gas in aqueous phase, Kinv is Henry’s
law constant (MPa/molefraction).
Equation 5.2 and 5.3 are essentially the same equation. Former is presented in the
form of molar concentration and latter in the form of mole fraction. Kinv and kH are
related as: kH=molar density/kinv. Figure 5. present values of Henry’s constant for carbon
dioxide, at different temperatures, calculated using modified form of Henry’s law, as

124
proposed by Carrol and Mather. Sanders (1999) presented a comprehensive list of
Henry’s constant of various inorganic and organic species. Using published data from
Carrol and Mather (1992) and Sanders (1999), the calculated values of Henry’s constant
for CO2 and N2, at atmospheric pressure and 400 psi, are presented in Table 5.1. It can be
seen that at the experimental temperature (520C) maintained for this study, CO2 is 38
times more soluble in water than N2.
Figure 5.1: Henry's Constant for Carbon Dioxide in water - from Carroll et al. The value of Henry’s constant presented in the figure is in the form of Kinv (Equation 5.3)

125
Table 5.1: Values of Henry’s constant for CO2 and N2
Temperature Henry’s Constant CO2 (M/atm)
Henry’s Constant N2 (M/atm)
Solubility Ratio(CO2/N2)
250C 3.4x10⁻² 6.5x10⁻⁴ 52 520C 6.63x10⁻² 9.3x10⁻⁴ 38
5.2.1.3 Gas Diffusion
Pressure difference between bubbles of unequal sizes induces gas transfer from
smaller to larger bubbles. The rate of diffusion of gas through foam films is given as:
J k P= Δ
where J is the diffusion rate, and k is the film permeability.
k is defined as:
2 /H
w ml
k Dkh D k
=+
5.4
where, D is the diffusion coefficient of gas in the liquid phase, kH is the Henry’s
coefficient, kml is the permeability of the surfactant monolayer to gas and hw is the
thickness of the liquid film.
Gas permeability of the foam films essentially depends on the solubility of gas in
aqueous phase (Farajadeh, 2009) and film surface structure (Nguyen, 2002). The
increased solubility results in decreased film thickness (hw), which further leads to
increased gas mass transfer rate (k), increased foam coalescence rate and decreased foam
stability.

126
Since the ratio of Henry constant value between CO2 and N2 (kH,CO2/kH,N2) at
250C is 52, mass transfer rate of CO2 through foam film is much higher than of N2. Thus
CO2 foam is expected to be weaker than N2 foam at similar conditions.
5.2.1.4 Gas–Water Interfacial Tension
The interfacial tension of gas-water system plays important role in determining
foam stability and generation in porous media, and is a function of pressure. Figure 5.2
presents IFT vs. pressure values for CO2-water system at 410C and 75000 ppm of NaCl.
Both temperature and salinity values are close to experimental conditions that were
maintained in corefloods presented later in this chapter. It can be seen that the increase in
pressure results in the decrease in CO2-water interfacial tension. This dependence is due
to CO2 solubility effects. As CO2 solubility increases with increasing pressure, it affects
the IFT, which directionally in opposite direction. On the contrary, the interfacial tension
of N2-water system does not vary considerably with pressure and can be assumed
constant.
Lower interfacial tension has opposing dual effects. Lower capillary pressure due
to lower interfacial tension results in increased foam stability. If no other effects are
associated with lowering of IFT, this would tend to make foam stronger. But resistance to
flow per unit lamella and minimum pressure gradient required to mobilize a stationary
lamella decreases as IFT is reduced, tending to make foam weaker. Reduced IFT also
promotes the formation of gas liquid interfaces, and thus foam generation.

127
Figure 5.2: Variation of brine-CO2 IFT with pressure at brine salinity of 75000 ppm (Bachu and Bennion, 2009).
5.2.1.5 pH
Pressure indirectly affects ASG process by affecting pH of aqueous phase in CO2-
ASG process. The pH of aqueous phase affects foam stability by influencing surfactant
adsorption and surfactant stability. The effect of pH on the performance of ASG process
is especially important in CO2-ASG process, as CO2 forms carbonic acid and reduces pH
of the system.
The surface potential and total interaction potential are functions of the pH of the
solution. If the surface charge is negative, for example in sandstone, the value of zeta
potential will become increasingly negative with the increase in pH, resulting in greater
electrostatic repulsion between surfactant and the rock surface. Therefore, increase in pH
results in lower adsorption of anionic surfactants, and thus increased foam stability. The
decrease in pH due to formation of carbonic acid results in increase in adsorption.

128
The stability of surfactants is also influenced by pH. At low pH values,
surfactants (mostly sulfates) can be hydrolyzed, resulting in their possible degradation,
precipitation, or loss of activity. The result of sulfate surfactant hydrolyses is formation
of alcohol and acid. The hydrolysis reaction of sulfates is as follows:
4 2 2 4R SO H O R O H H SO−− + → − + R 5.1
Talley (1988) studied the pH dependence of rate of hydrolysis on alkyl sulfates.
He observed significant dependence of rate constant on pH at low pH values, asymptotic
dependence at neutral pH values, and no detectable dependence at high pH values.
Since C14-16(PO)7-SO4-, an alcohol propoxy sulfate, is used in this study,
surfactant hydrolysis can be a factor determining displacement efficiency in CO2-ASG
corefloods. The temperature, however, plays an important role in hydrolysis reaction.
Talley (1988) studied variation in the rate of hydrolysis reaction with temperature for the
surfactant sodium dodecyl sulfate (SDS). He found that rate of hydrolysis reaction to be
indirectly proportional to temperature (Figure 5.3).

129
Figure 5.3: Variation in reaction rate (hydrolysis of SDS) with temperature. The experimental temperature in corefloods presented later in this chapter was 52oC, which corresponds to the X-axis value of 0.003 in the above plot.
5.2.2 Effect of Pressure on Factors Influencing Phase Behavior in ASG Process
The effect of pressure on surfactant/oil/brine phase behavior is limited to CO2
ASG process (at least in this study). Pressure indirectly affects phase behavior in ASG
process by influencing CO2 solubility in aqueous phase. As mentioned above, a fraction
of dissolved carbon dioxide reacts with water to form carbonic acid. Carbonic acid can
react with injected chemicals, components of rock matrix, and ions present in the
reservoir brine and alter the chemical environment. CO2 dissolves in the aqueous phase at
rate governed by number of physical and chemical parameters. CO2 dissolution rate is not
proportional to partial pressure of CO2 (as defined by Henry’s Law) but greater because

130
some of the CO2 combines chemically with water to form carbonic acid. This reaction is
reversible and is as follows:
[ ]( )
2 2 2 3
2 3 3
2
CO ( ) + H O ( ) H CO ( )
H COK 1.73x10
CO−
⇔
= =⎡ ⎤⎣ ⎦
R 5.2
The above reaction is kinetically slow. At equilibrium, only a small fraction of the
dissolved CO2 is actually converted to H2CO3. Most of the CO2 remains as solvated
molecular CO2. Carbonic acid is a weak acid and it can dissociate into carbonate and
bicarbonate anions. R 5.3 and R 5.4 show steps involved in the dissociation of H2CO3.
3
6.352 3 (aq ) 1H CO H HCO K 10+ − −⇔ + =
R 5.3
3
10.333 (aq) 2HCO H CO K 10− + − −⇔ + = R 5.4
Because equilibrium constant K2 is smaller than equilibrium constant K1, the amount of
bicarbonate ions (HCO3-) in the solution available for reaction are higher than carbonate
ions. K1 and K2 equilibrium constant determines the range in which different carbonate
species dominate in the solution (Figure 5.4). Carbonic acid dominates the solution below
pH of 6.33; bicarbonate ions dominate at pH values between 6.35 and 10.33; carbonate
ions dominate the solution above the pH value of 10.33. Divalent cations like Ca2+ and
Mg2+ in reservoir brine react with carbonate ions to form salts, which precipitate when
their concentration exceeds their solubility limits.

131
Figure 5.4: Concentration of carbonate species in solution versus pH (Orrego, 2004)
In CO2-ASG process, formation of carbonic acid lowers the pH of the solution
and, if alkali is used, consumes hydroxide OH- ions. If crude oil is very reactive, the
consumption of alkali leads to reduced levels of natural soap generation and increase in
surfactant adsorption. The reduction of soap generation leads to sub-optimal performance
of the synthetic surfactant-soap mixture. As mentioned in Chapter 2, alkali provides OH-
ions that react with natural acids present in crude oil to generate surface active species, or
soap. Na2CO3, a basic salt, is a common alkali used in EOR applications. In solution,
sodium carbonate first dissociates into carbonate ions. Then carbonate ions are
hydrolyzed to give bicarbonate ions and hydroxide ions (R5.5 and R5.6).
2
2 3 32Na CO Na CO+ −→ + R 5.5.
3
23 2CO H O HCO OH− − −+ ⇔ + R 5.6

132
H2CO3 consumes hydroxide ions, thus reducing the pH of the system. At high pH values
(pH >10.33) carbonic acid gives two protons (H+) and a CO23- ion. Na+ ion present in the
solution combines with CO23- ions to form sodium carbonate. The complete reaction
between carbonic acid and alkali at high pH is as follows:
2 3 2 3 22 2H CO NaOH Na CO H O+ → + R 5.7
At medium pH values (6.3 <pH<10.33), carbonic acids deprotonate. The bicarbonate ion
associates with Na+ ion to form sodium bicarbonate
2 3 2 3 32Na CO H CO NaHCO+ → R 5.8
In both the cases, proton (H+), given by carbonic acid, reacts with hydroxide ion
to form water. The reaction between H+ and OH- is instantaneous, and active OH- ions
are rapidly consumed. Due to alkali consumption by H2CO3, intended beneficial effects
on oil recovery associated with alkali, for example optimal phase behavior and reduced
surfactant adsorption, are not achieved. The effect of alkali consumption on
surfactant/oil/brine phase behavior is demonstrated later in this chapter.
The consumption of alkali may change phase behavior properties (i.e. optimal
salinity and solubilization ratios at optimal salinity) considerably. Natural surfactant, or
soap, that is formed by the reaction of alkali and acidic species in oil, is hydrophobic in
nature. Thus formation of soap results in the reduction of Hydrophobic-Lipophilic
Balance (HLB). Higher the decrease in HLB, more is the shift in optimal phase behavior
(Type III region) to lower salinity values. Figure 5.5Figure 5.11 shows the change in
solubilization parameters as a function of alkali concentration. Amount of soap formation
increases in reactive crude oil with the increase in alkali concentration, i.e. HLB
decreases with increasing alkali concentration. It can be seen that optimal salinity shift to

133
lower salinity values with the increase in alkali concentration. Therefore, effect of alkali
consumption needs to be taken into account in CO2-ASG processes, when the use of
alkali is involved.
Figure 5.5: Change in solubilization parameters as a function of alkali concentration (Martin and Oxley, 1985).
The maximum total amount of CO2 that can dissolve in water is a function of pH.
This is because rate of dissolution of CO2 in aqueous phase is directly proportional to the
rate of removal of H2CO3 from solution. In turn, rate of removal of H2CO3 is directly
related to the presence of active hydroxide and divalent cations in the solution. The
presence of alkali in the aqueous phase increases the removal of H2CO3, which in turn
converts more dissolved CO2 (i.e. CO2 in liquid phase) into H2CO3, which in turn results
in partitioning of more gaseous CO2 into the aqueous phase (to maintain the equilibrium
concentration as defined by Henry’s law). Therefore, higher the pH of the solution,
higher is the amount of CO2 dissolved into liquid phase.

134
If Ca++ and Mg++ ions are present in the solution, they react with carbonate ions
(in the high pH range, R 5.9) to form insoluble carbonate salts. The formation of these
deposits is an additional driving force that can pull the equilibrium more to the right
(R5.1) resulting in the further acidification of water. In the medium pH range (6.33
<pH<10.33), Ca2+ and Mg2+ ions are present in the solution along with HCO3- ions.
3
2 23
2 23 3
Ca CO CaCO
Mg CO MgCO
+ −
+ −
+ → ↓
+ → ↓ (pH>10.33) R 5.9
Since solubility of CO2 in aqueous phase increases with pressure, concentration of
carbonic acid in the solution will also increase (R5.2). As a result, pH of aqueous phase
decreases with the increase in pressure. Using the value of Henry’s constant at 520C from
Figure 5., the solubility of CO2 in aqueous phase at different pressures can be calculated.
Table 5.2 presents equilibrium concentrations of CO2 at14.7 and 400 psi. Once
equilibrium concentrations are known at two pressures, pH of the aqueous phase can be
calculated using the following formula:
1 2( . )wx c K ck k= + +
where, x is concentration of H+ ion in the solution, c is the concentration of CO2 in the
aqueous phase, K1 and K2 are rate constant (R5.2 and R5.3), and kw is the dissociation
constant of water.
The calculated pH value of aqueous phase at 14.7 psi and 400 psi are given in Table 5.2.
It can be seen that the pH value of aqueous phase in equilibrium with CO2 phase
decreases from 5.43 at 14.7 psi to 4.71 at 400 psi.

135
Table 5.2: Equilibrium concentration of CO2 and N2 in aqueous phase at experimental conditions.
Pressure (psi) CO2 (moles/ltrs) pH 14.7 .018 5.43 400 .5 4.71
Due to increased CO2 solubility, alkali consumption is more severe at elevated
pressures than at low pressures. Therefore, high pressure CO2 corefloods are expected to
exhibit lower displacement efficiency compared to low pressure CO2 corefloods. In
addition, due to higher solubility of CO2 in aqueous phase compared to N2, ASG
corefloods performed with N2 are expected to perform better than CO2 corefloods. Alkali
consumption also influences electrolyte concentration, thus affecting the phase behavior.
5.2.3 Effect of Pressure on Factors Influencing Rock-Fluid Interaction in ASG Process
Formation of carbonic acid also results in dissolution of soluble rocks such as
dolomite (CaMg(CO3)2, calcite (CaCO3), siderite (FeCO3), gypsum (CaSO4.2H2O) and
/or anhydrite (CaSO4). Carbonate mineral reacts with carbonic acid in the following way:
2+
3 2 3 3CaCO + H CO Ca + 2HCO−⇔ R 5.10
The above reaction is a reversible reaction (Orrego, 2004). The forward reaction
indicates dissolution of CaCO3 that may lead to increase in permeability and porosity (by
formation of fissures, caves, wormholes, etc.). The reverse reaction is associated with
deposition and precipitation of CaCO3. The presence of gypsum and anhydrite results in
the formation and precipitation of calcite. The following reaction occurs when gypsum
and anhydrite come in contact with carbonic acid:

136
3 4 2 3 4 2 2HCO CaSO .2H O CaCO SO 2H O CO− −+ → ↓+ + + R 5.11
Although rock-fluid interaction increases at elevated pressures, it was not the
focus of this study. Carbonate rocks are more susceptible to dissolution reactions due to
acidic nature of injectants. ASG corefloods presented in this study were conducted on
Berea sandstone rock samples, thus rock-fluid interactions were not studied.
5.3 EXPERIMENTAL DESCRIPTION
5.3.1 Experimental Scheme
The main pressure dependent factors that could significantly affect ASG process
were investigated in this study. It is evident from the background review that the effect of
some pressure dependent factors, mentioned in Section 5.2, is less significant than others,
under the experimental conditions applied in this study. For example, compressibility of
CO2 and N2 changes only slightly from atmospheric pressure to 400 psi; therefore effect
of compressibility on foam properties in ASG corefloods at 400 psi is insignificant.
Similarly, change is gas-brine IFT from atmospheric pressure to 400 psi (2.7 MPa) is
very less (Figure 5.2). Gas solubility, alkali consumption and pH variations resulting
from increased CO2 solubility are the main pressure dependent factors likely to affect
ASG coreflood conducted at the elevated pressure of 400 psi. To study the impact of
these pressure dependent factors, series of ASG corefloods, at both low and high
pressures, were performed. Table 5.3 describes the objective of each coreflood. High and
low pressure CO2 corefloods were compared to study the affect of gas solubility and
alkali consumption on displacement efficiency in ASG process. Due to significant
contrast in solubility and reactivity characteristics of CO2 and N2, ASG corefloods

137
conducted with these two gases were also compared. The comparison of CO2 and N2-
ASG corefloods also provided a comparative assessment of the foaming characteristics of
these two gases and their relative efficiency as the foaming gas in ASG flooding.
Table 5.3: Description of ASG corefloods carried out to study the effect of pressure.
Coreflood ID Description
DSDM_LP_CO2 ASG coreflood, using CO2 for foam generation,
carried out at atmospheric pressure.
DSDM_LP_N2 ASG coreflood, using N2 for foam generation,
carried out at atmospheric pressure.
DSDM_HP_CO2 ASG coreflood carried out at an elevated pressure
of 400 psi.
DSDM_HP_N2 ASG coreflood carried out at an elevated pressure
of 400 psi.
DSDM_HP_HQ_CO2 ASG coreflood with 83% foam quality in the slug
and drive
DSDM_HP_CO2_2% ASG coreflood carried out with higher surfactant concentration (2%) in the slug compared to other ASG corefloods presented in this chapter
5.3.2 Rock and fluids
The coreflood were performed on Berea sandstone cores. The permeabilities of
cores were consistently between 600 to 700 md. A light crude oil with 1.2 cP viscosity at
520C was used in the corefloods. The composition of synthetic reservoir brine used in
corefloods is presented in Table 5.4. The brine salinity was approximately 65000 PPM,
with very high concentrations of divalent ions (Ca2+ and Mg2+).

138
Table 5.4: Brine composition used in ASG corefloods
Ions Concentration [mg/L]Ca2- 2418Mg2+ 451Na+ 23555Cl- 43900
A light crude oil with API gravity of 37 was used in the coreflood. The oil was
filtered in two stages, first through 1.2 micron filter paper and then through 0.45 micron
filter paper.
5.3.3 Phase Behavior and Chemical Formulation
Surfactant phase behavior tests were carried out to identify the optimal
formulation to be used in the corefloods. Figure 5.6 shows the oil and water solubilization
ratio obtained with the chemical formulation that was finally identified to be used for the
coreflood. Alkali was used in the phase behavior test shown in the Figure 5.9.

139
Figure 5.6: Oil and water solubilization ratios versus NaCl concentration (wt%) obtained in phase behavior test carried out to identify optimal formulation for ASG corefloods presented in this chapter.
Alkali consumption may also alter phase behavior of surfactant/oil/brine system.
In order to study the effect of alkali on surfactant/oil/brine phase behavior, an additional
phase behavior experiment was carried out without using alkali. Figure 5.7 compares the
results of the phase behavior experiments conducted with and without alkali. It can be
seen that removal of alkali did not result in any significant change in phase behavior
characteristics, indicating the reactivity of crude oil with alkali to be very low.

140
Figure 5.7: Results of phase behavior experiments with and without alkali (Na2CO3)
Table 5.5: Results of phase behavior test
Parameter Value
Optimal salinity (TDS,PPM) 65000
Solubilization ratio at optimum salinity (cc/cc) 15
Aqueous stability limit (TDS,PPM) 100000
Salinity range for Type III microemulsion (TDS,PPM) 40000-70000
Same combination of surfactants, used in corefloods presented in Chapter 3 and
Chapter 4, were used in ASG corefloods presented in this section. Table 5.6 contains the
composition of ASG slug and ASG drive fluids. Foam quality was maintained at 50%, in

141
all ASG corefloods, except in the high quality ASG coreflood (DSDM_HP_HQ_CO2) in
which injected foam quality was 83%.
Table 5.6: Slug and drive composition in ASG corefloods carried out to study the effect of pressure.
Chemicals Quantity
ASG Slug
C14-16(PO)7-SO4- (primary surfactant) 0.5 wt%
C15-18IOS (secondary surfactant) 0.5 wt% Na2CO3 (alkali) 1 wt%
NaCl (electrolyte) 5.25 wt% Gas (CO2 or N2) Varied
ASG Drive
C15-18IOS (secondary surfactant) 0.1
NaCl (electrolyte) 3.5 wt%
Gas (CO2 or N2) Varied
5.4 RESULTS OF ASG COREFLOODS
Table 5.7 and Table 5.8 present main details and results, respectively, of all ASG
corefloods performed for this study. Since permeability values were comparable and
injection conditions were same, it is reasonable to assume that differences in results in
corefloods are mainly due to pressure or pressure dependant factors.

142
Table 5.7: Details of ASG corefloods carried out to study the effects of pressure
Coreflood ID Pressure* (psi)
Permeability (md)
Gas rate** (ft/day)
Liquid rate
(ft/day)
Foam quality***
(%) DSDM_LP_CO2 14.7 648 2.2 2.2 50DSDM_LP_N2 14.7 627 2.2 2.2 50
DSDM_HP_CO2 400 681 2.2 2.2 50DSDM_HP_N2 400 681 2.2 2.2 50
DSDM_HP_CO2_ HQ 400 626 3.6 0.8 83DSDM_HP_CO2_2% 400 681 2.2 2.2 50* backpressure at core outlet ** at 400 psi *** at 400 psi
Table 5.8: Results of ASG corefloods carried out to study the effects of pressure
Coreflood ID
Remaining oil in
place to waterflood (ROIP, %)
Oil Recovery
(% of ROIP)
Oil recovery in the oil bank
(% of ROIP)
pH
DSDM_LP_CO2 32 75 40 ~7 DSDM_LP_N2 29 68 50 9-10
DSDM_HP_CO2 33 63 30 ~7 DSDM_HP_N2 29 72 50 9-10
DSDM_HP_CO2_ HQ 29 66 45 ~7 DSDM_HP_CO2_2% 29 96 83 ~7
*ROIP (remaining oil in place to waterflood)
5.4.1 Comparison of Low and High Pressure CO2 ASG Corefloods
Figure 5.8 compares the pressure drop data from low pressure (DSDM_LP_CO2)
and high pressure (DSDM_HP_CO2) CO2-ASG corefloods. Higher pressure drop in the
low pressure coreflood indicates formation of stronger foam. The fraction of pure oil
production in the oil bank, an indicator of displacement efficiency in the process, in low
pressure and high pressure CO2 corefloods was 40% and 35%, respectively. Relatively

143
stronger foam in low pressure CO2 coreflood is the reason for higher oil recovery
obtained in that coreflood compared to high pressure coreflood (Figure 5.9). Figure 5.10
show the effluent pH value in low pressure CO2 coreflood. It can be seen that pH value
stayed around 6. Since pH of the slug solution, with 1 wt% Na2CO3 concentration, was
10.73, low pH values in the effluent observed throughout the coreflood indicate loss of
alkali in the core.
Figure 5.8: Comparison of pressure drop across the core data from low and high pressure CO2-ASG corefloods.
The effluent pH values in the high pressure CO2 coreflood could not be measured
due to unavailability of pH probe that can measure pH values at 400 psi. Since CO2
escapes from the solution as effluent exits from the outlet back pressure regulator, the
effluent pH values measured at atmospheric pressure in the high pressure CO2 coreflood
do not correctly represent actual pH in the coreflood. However, on the basis of low

144
pressure coreflood results and calculation of aqueous phase pH in equilibrium with CO2
at 400 psi (Table 5.2), it can be inferred with reasonable confidence that in-situ pH values
in high pressure CO2 coreflood were lower than pH values observed in low pressure CO2
coreflood (i.e. less than 6).
Since injected CO2 (gas) and liquid flowed together (due to coinjection), first in
the injection line and then inside the core, the concentration of dissolved CO2 and hence
carbonic acid remained constant in the aqueous phase. Alkali consumption shifted
reactions R5.2 to the right and more CO2 dissolved into aqueous phase. This implies that
if CO2 and aqueous phase stays together long enough, all available OH- ions in the
solution can be consumed.
The effluent samples in both coreflood were not analyzed for surfactant
concentration. However, on the basis of previous studies carried on Berea rock samples,
it can be assumed that surfactant adsorption occurred in both corefloods and consumption
of alkali increased the amount of surfactant adsorbed. Zhang et al. (2006) measured
surfactant adsorption in the presence and absence of alkali. He observed that addition of
Na2CO3 reduced surfactant adsorption by a factor of 20, when compared to surfactant
adsorption in the absence of alkali (Zhang, 2006).
The phase behavior in CO2 ASG corefloods, presented in this chapter, was not
affected on the account of removal of alkali inhibiting soap formation (as oil was not
acidic). However, removal of alkali resulted in increased surfactant adsorption in both
low and high pressure CO2 corefloods. Relatively better oil recovery in low pressure
coreflood compared to high pressure CO2 coreflood can be attributed to foam stability.
Since gas solubility was less in low pressure CO2 ASG coreflood, foam was relatively
stable due to more amount of free gas (CO2) available for foaming.

145
Figure 5.9: Comparison of oil recoveries of low and high pressure CO2 ASG corefloods.
Figure 5.10: Effluent pH data from low pressure CO2 ASG corefloods.

146
Figure 5.11: Change in solubilization parameters as a function of alkali concentration (Martin and Oxley, 1985).
5.4.2 Comparison of CO2 and N2 ASG Corefloods
Figure 5.12 and Figure 5.13 compares the pressure drop data at low pressure and
high pressure, respectively, from CO2 and N2 corefloods. It can be seen that N2
corefloods resulted in stronger foam than CO2 corefloods. The fraction of oil recovery in
the form of pure oil in oil bank was higher in N2 corefloods, at both high and low
pressures (Figure 5.14 and Figure 5.15). Figure 5.16 compares the effluent pH data of
low pressure CO2 and N2 corefloods. The pH value in low pressure N2 coreflood
increased to 10, which is close to injected slug pH value of 10.73, indicating low level of
alkali consumption in the core. Since dissolution of N2 in water is very low and N2 does
not lower pH of aqueous phase by forming acid, alkali consumption in N2 corefloods is
only due to reaction with acid species present in the crude oil. Therefore, lower solubility

147
of N2 in the aqueous phase and lower adsorption in N2 corefloods due to absence of
severe alkali consumption are the reasons behind higher foam stability and better oil
recovery observed in N2 corefloods compared to CO2 corefloods. It should be noted that
final oil recovery in low pressure CO2 coreflood is higher than low pressure N2 coreflood,
but the size of oil bank was larger in N2 coreflood, which indicates less mixing between
the ASG slug and oil bank due to better mobility control in the low pressure N2-ASG
coreflood. Higher amount of oil mobilization in low pressure CO2 coreflood may be due
to some other factors which cannot be explained at this point and needs further
investigation.
Figure 5.12: Comparison of pressure drop data across the core of low pressure CO2 and low pressure N2 ASG corefloods.

148
Figure 5.13: Comparison of pressure drop data across the core from high pressure CO2 and high pressure N2 ASG corefloods.
Figure 5.14: Comparison of oil recovery data from low pressure CO2 ASG coreflood and low pressure N2 ASG coreflood.

149
Figure 5.15: Comparison of oil recovery data from high pressure CO2 ASG coreflood and high pressure N2 ASG coreflood.
Figure 5.16: Comparison of pH data from low pressure CO2 and low pressure N2 ASG corefloods.

150
5.4.3 High Quality and High Surfactant Concentration CO2-ASG Corefloods
The analysis of ASG corefloods reveal that gas solubility and alkali consumption
can significantly affect ASG process. Two CO2-ASG corefloods were planned and
conducted to identify ways to improve oil recovery. The first coreflood was designed to
reduce the effect of CO2 solubility on foam strength by increasing the injection foam
quality to 83%. The objective of increasing foam quality was to observe whether
increased fraction of CO2 gas in foam compensates for CO2 solubility in water. In the
second coreflood, surfactant loss due to adsorption was compensated by increasing the
concentration of surfactant in the slug to 2 wt%. The surfactant concentration was
increased so that enough surfactant remains available, after surfactant adsorption is
satisfied, for oil mobilization and foam stabilization.
Figure 5.17 present the comparison of pressure drop data from low quality and
high quality CO2-ASG coreflood, both performed at 400 psi. The total injection rate in
the high quality coreflood was kept same as other ASG corefloods, i.e. 4.4 ft/day. The gas
injection rate was 3.6 ft/day and liquid injection rate was 0.8 ft/day. The pressure data
shows that foam strength slightly increased with the increase in injection foam quality,
however, the increase is not significant to affect any substantial improvement in oil
recovery (Figure 5.18). The increase in foam strength can be attributed to higher amount
of injected gas fraction, which compensated for loss of CO2 because of its dissolution in
aqueous phase.

151
Figure 5.17: Comparison of pressure drop data across the core from 50% and 80% foam quality CO2 ASG corefloods carried out at high pressure.

152
Figure 5.18: Comparison of oil recoveries of low and high foam quality CO2 ASG corefloods. Both corefloods were carried out at 400 psi to study whether increased foam quality improves foam stability by compensating the loss of CO2 due to its dissolution in water.
Figure 5.19 compares the oil recovery data from high surfactant concentration
(DSDM_HP_2%) and high pressure CO2-ASG coreflood. A significant increase in oil
recovery was obtained in DSDM_HP_HQ compared to high pressure CO2-ASG
coreflood. Nearly 96% of remaining oil in place after waterflood was recovered (Figure
5.19). The increase in oil recovery can be attributed to availability of surfactant in the
core for oil mobilization and stable foam propagation. The results of DSDM_HP_HQ
substantiate the conclusion that increased surfactant adsorption, due to alkali
consumption, is the reason for low recoveries observed in CO2-ASG corefloods. The
strength of foam also increased by increasing surfactant concentration, as unadsorbed
surfactant contributed towards foam stabilization (Figure 5.20).

153
Figure 5.19: Comparison of oil recovery data from high pressure CO2 ASG coreflood and high pressure CO2 ASG coreflood with 2 wt% surfactant concentration in the slug.
Figure 5.20: Comparison of pressure drop data across the core from DSDM_HP_CO2 and DSDM_HP_CO2_2%.

154
5.5 CHAPTER SUMMARY
Results presented in this chapter highlight the significant impact of pressure on
the performance of CO2-ASG corefloods. Both low and high pressure CO2 corefloods are
adversely affected from increased surfactant adsorption and sub-optimal phase behavior
characteristics, resulting from alkali consumption. Increased CO2 solubility in aqueous
phase adversely affects foam generation and propagation by making less gas available for
foaming. Higher solubility of CO2 compared to N2 is the main reason behind N2 foams
being stronger than CO2 foams.
If alkali is used in the formulation, the application of CO2 as foaming gas is not
advantageous. CO2-ASG process is more suitable for conditions where alkali is not
required for lowering IFT and reducing surfactant adsorption. Coreflood experiments
presented in Chapter 4 were performed in the absence of alkali. Moreover, carbonate
rocks used in those corefloods did not exhibit significant surfactant adsorption. The
presence of clays in Berea sandstone rocks is the main reason for their increased
surfactant adsorption behavior. Shaw et al. (1991) performed x-ray diffraction analysis to
identify mineralogy of Berea sandstone rocks. The analysis showed that Kaolinite is the
major clay present in Berea rock. Surface charge on Kaolinite becomes more positive
with the decrease in pH (Bolland et. al., 1976). Therefore, surfactant adsorption in CO2
ASG coreflood increased even more during the course of coreflood as pH value
decreased.
Increasing surfactant concentration in CO2-ASG coreflood to 2% resulted in
significant improvement in oil recovery, thus implying that surfactant adsorption was the
most important factor behind lower oil recovery and foam strength observed in CO2 ASG
corefloods. Increasing surfactant concentration, however, is not cost effective. Therefore,
several other mechanisms need to be explored to improve the applicability of CO2 ASG

155
process in conditions where alkali is required. One possible way to reduce alkali
consumption is to inject only chemicals (surfactant + alkali) during slug injection, and
then displace the slug by coinjecting CO2 and surfactant. The absence of CO2 in the slug
will reduce alkali consumption. Another method for improving CO2 coreflood could be to
apply surfactant alternating gas injection scheme. In SAG method, the contact between
CO2 and alkali is reduced and hence alkali consumption. The above mentioned
techniques for improving the performance of CO2-ASG coreflood, by reducing alkali
consumption, were not investigated in this research and are recommended for future
work.

156
CHAPTER 6
ASG Modeling
6.1 INTRODUCTION
A model for foam flow in low-IFT microemulsion environment (ASG model) is
presented in this chapter. For simulating ASG process, a reservoir simulator needs
functionalities that enable it to model both chemical and foam flooding. UTCHEM,
developed at the University of Texas Austin, has the basic framework to model either
chemical or conventional foam flooding processes, but it cannot model both process
simultaneously.
UTCHEM has a conventional foam model (Rossen and Zhou, 1994) that modifies
gas phase relative permeability to model effect of foam on gas mobility. However,
existing foam model in UTCHEM was developed for studying strong foams in the
absence of microemulsion environment and it cannot be applied for modeling gas
mobility in ASG flooding. A simple model for gas phase mobility in low IFT
microemulsion environment is presented in this chapter. The model is based on
experimental studies carried out to investigate foam stability and mobility reduction
characteristics in different microemulsion environments.
Foaming of microemulsion is a complex phenomenon; it combines the colloid
chemistry of microemulsion with the surface chemistry of foam. The latter phenomenon
involves kinetics of surfactant partitioning into different phases present in the
microemulsion environment at equilibrium. Moreover, foam in microemulsion
environment, in context with chemical-EOR process, is relatively less researched area.

157
The knowledge of foam stability in different microemulsion environment is therefore
important for modeling mobility reduction characteristics of foam in ASG process.
Due to basic frame work of UTCHEM, which is mainly designed for flow
simulations of liquid chemicals, simulation of ASG process in UTCHEM presents some
unique challenges. For example, up to four phases can be present in the simulation, i.e.
water, oil, microemulsion, and gas, when gas and Type III microemulsion coexist. The
modeling of four phase flow is numerically expensive, and four phase simulations in
UTCHEM frequently run into numerical stability issues. Therefore, an approximate
approach for simulating ASG process is also presented in this chapter. The approximate
approach does not require inclusion of four phases in ASG simulations.
Throughout this chapter it is assumed that gas solubility in aqueous and
hydrocarbon phase does not affect foam strength and surfactant phase behavior. For ASG
corefloods carried out at atmospheric pressure, this assumption is reasonably true.
Therefore, we concentrate our simulation study to only low pressure ASG corefloods.
6.2 FOAM IN MICROEMULSION ENVIRONMENT
In ASG process, foam is formed in both microemulsion and aqueous phases. In
the absence of mixing, microemulsion environment in the slug is Type III; however, due
to mixing with the resident brine at the leading end and with the ASG drive at the trailing
end, Type II(+) and Type (II-) conditions can also occur in the slug (Chapter 3, Section
3.4.5). Thus foam in the slug mostly forms in microemulsion, i.e. liquid films
surrounding foam bubbles consist of solubilized oil in micelles. Depending upon the
salinity, microemulsion phase can be Type II(-), Type III, or Type II(+). Behind the
mixing zone, foam is formed in the aqueous ASG drive solution.

158
At low surfactant concentrations, the presence of adsorbed surfactant layer
stabilizes foam films by controlling the film surface mobility and, thereby, flows through
the lamella and their plateau border. At a concentration several times higher than the
CMC, the effect of surface rheological properties is less pronounced and plays a
secondary role in the film stability. However, foam stability increases with the surfactant
concentration even beyond CMC. The reason for this increase is another stabilizing
mechanism: ordered microstructure formation (stratification) in the draining foam films.
Nikolov et al. (1986) observed stratification phenomenon in micellar foams which leads
to step-wise thinning of foam films due to the formation of ordered micellar structure
within the foam films. According to them, micelles formed different stripes in foam
films, with each stripe containing different number of micelles. The micelles interact via
screened electrostatic repulsion forming ordered microstructure because of restricted
volume of the film. The thinning of this ordered microstructure occurs in layer by layer
manner until the foam film reaches equilibrium state (Figure 6.). This layer by layer
thinning of foam films increases the lifetime of foam and thus foam stability.
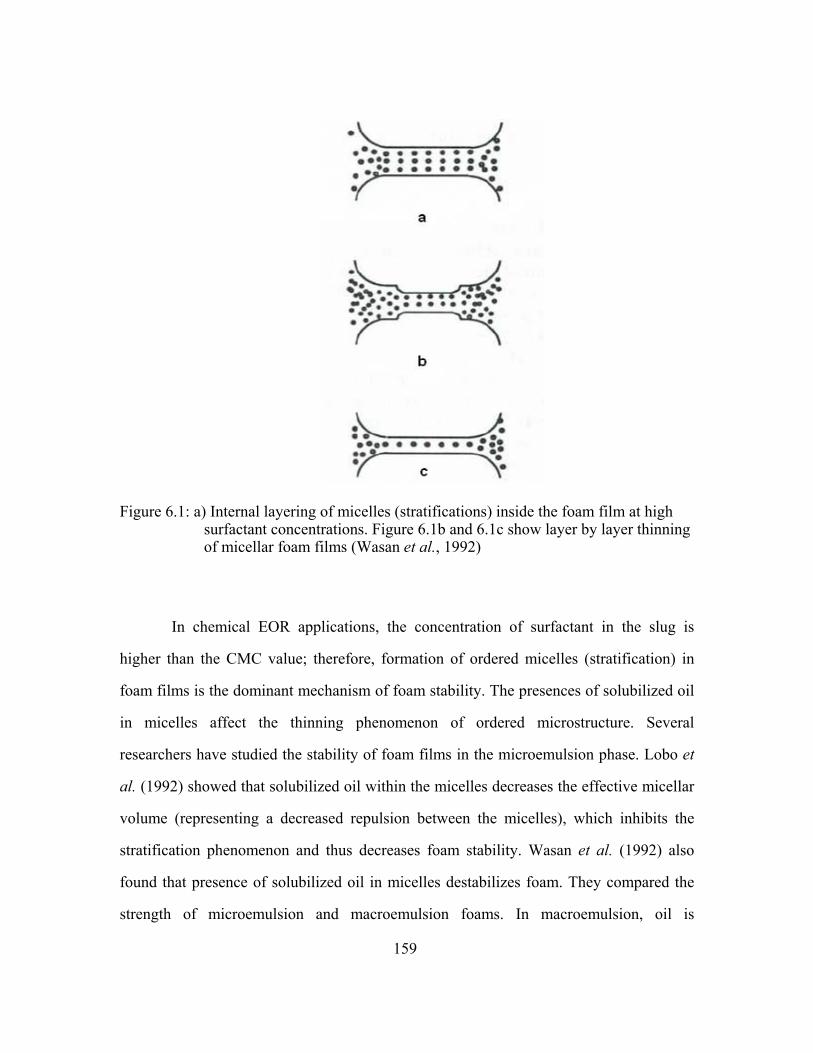
159
Figure 6.1: a) Internal layering of micelles (stratifications) inside the foam film at high surfactant concentrations. Figure 6.1b and 6.1c show layer by layer thinning of micellar foam films (Wasan et al., 1992)
In chemical EOR applications, the concentration of surfactant in the slug is
higher than the CMC value; therefore, formation of ordered micelles (stratification) in
foam films is the dominant mechanism of foam stability. The presences of solubilized oil
in micelles affect the thinning phenomenon of ordered microstructure. Several
researchers have studied the stability of foam films in the microemulsion phase. Lobo et
al. (1992) showed that solubilized oil within the micelles decreases the effective micellar
volume (representing a decreased repulsion between the micelles), which inhibits the
stratification phenomenon and thus decreases foam stability. Wasan et al. (1992) also
found that presence of solubilized oil in micelles destabilizes foam. They compared the
strength of microemulsion and macroemulsion foams. In macroemulsion, oil is

160
emulsified in the solution (not solubilized as in microemulsion). They found that
macroemulsion foam has higher stability than microemulsion foam at the same value of
oil concentration. The stability of macroemulsion foam is higher because oil drops collect
in the plateau border of the foam, and this packed macroemulsion inhibits the liquid
drainage through plateau border network due to increased hydrodynamic resistance
(Figure 6.2).
Figure 6.2: Photomicrograph of a two dimensional foam (macroemulsion foam) in which oil drops has drained from foam films to the Plateau border (Wasan et al., 1992)
Few researchers have investigated foam stability in different microemulsion
types. Torres et al. (1980) tested foam stability in O/W microemulsion (Type II(+)) and
W/O microemulsion (Type II(-)). They observed that no foam could be formed in Type
II(+) microemulsion, any bubble formed in the solution immediately broke; however,
kinetically stable foam formed in Type II(-) microemulsion. Tamamushi (1978) found
that the surface tension of inverse micellar solution (Figure 6.3), which is present in Type
II(+) microemulsion, varies only insignificantly with surfactant concentration. Under
such circumstances, the Marangoni and Gibbs film stabilization mechanisms are not
present, and thus stable foam films cannot form in Type II(+) microemulsion. Ahmad

161
(1971) and Friberg (1976) also investigated foam film stability in inverse micellar
solution, like Tamamushi (1978), but with no hydrocarbon present. Their results clearly
showed that an inverse micellar solution do not possess foam stability. Torres et al.
(1980), attributed stability of foam in Type II(-) microemulsion environment to the
formation of liquid crystals. Their analysis of liquid crystals showed a composition high
in surfactant concentration, which may have increased foam stability when liquid crystals
adsorbed on the film surface.
Figure 6.3: a) Inverse micelle. Inverse micelle is formed in Type II(+) microemulsion ; b) micelle formed in aqueous solution. Straight micelles are formed in Type II(-) microemulsion.
Thus, stability mechanisms in foam formed at high surfactant concentration
(micellar foam and microemulsion foam), are different from foam formed at low
surfactant concentration, where surface rheological properties, for example surface
elasticity and surface viscosity, are more important. Foam stability in microemulsion
environment depends on stratification of micelles (Nikolov et al., 1992), amount of
solubilized oil present in the micelles (Lobo et. al., 1992) and also on the microemulsion
type (Torres et al., 1980). The amount of solubilized oil in microemulsion varies with
Organic solvent
Hydrophilic head
Hydrophobic tail
Aqueous solution
a b

162
salinity. Since a salinity gradient is applied in ASG corefloods conducted in this research,
degree of oil solubilization affected foam strength in the slug, where microemulsion
environment exists. As shown earlier in Chapter 3 (Section 3.4.5), due to mixing with the
reservoir brine and drive solution, all three types of microemulsion environment may
exist during the propagation of slug in the core. Therefore, study of foam stability and
propagation in different microemulsion environment is important for modeling foam in
ASG process. In order to study foam stability and propagation characteristics in low-IFT
microemulsion environments, we carried out microemulsion foaming tests and
microemulsion flow experiments in a sandpack. The main objective of two study was to
observe ability of foam to form and foam strength in different microemulsion
environments, (Type II(-), Type III, Type II(+)). The exact mechanism of foam stability
in different microemulsion environments was not investigated.
6.2.1 Microemulsion Foaming Tests
Microemulsion foaming tests were carried out to test foam stability in different
microemulsion environments. For the foaming test, surfactant/oil/brine phase behavior
was carried out to identify salinity limits for the three microemulsion regions, i.e. upper
(CSEL) and lower (CSEU) salinity limits (Figure 6.4). The crude oil used in phase
behavior test was the same oil that was used in ASG corefloods presented in Chapter 5
(Section 5.6.3). Once CSEL and CSEU values were identified from the phase behavior
test, one salinity from each microemulsion type was selected and Type II(-), Type III, and
Type II(+) microemulsion systems were prepared in 30 cc pipettes by mixing surfactant,
oil, and electrolyte solution. After the attainment of phase equilibrium, microemulsion
phase was separated from excess phase (or phases). Finally, foaming test was conducted
on microemulsion phase taken from Type II(-) and Type III pipettes and excess aqueous

163
phase taken from Type III and Type II(+) pipettes (Figure 6.6 to Figure 6.9). For obvious
reasons, foaming test was not conducted on Type II(+) microemulsion system. Type II(+)
microemulsion is oil-continuous; stable foam is not formed in oleic phase when aqueous
soluble surfactant are used.
Each pipette was shaken with equal intensity, and variation in the height of foam
column (in a pipette) normalized by the initial height of foam column (in the same
pipette) versus elapsed time was plotted. It was observed that significant foaming
occurred in pipettes carrying Type II(-) and Type III microemulsion phase. There was no
foam in the pipette containing excess aqueous phases from Type III and Type II(+)
pipette (Figure 6.10). Foam formed in Type II(-) microemulsion phase was most stable,
followed by foam formed in Type III microemulsion phase. The results of foaming tests
showed that foam can form in Type II(-) and Type III microemulsion. However, foam did
not form in the excess aqueous phase of Type III and Type II(+) microemulsion; due to
surfactant partitioning in to the microemulsion phase, excess aqueous phase in Type III
and Type II(+) microemulsion had negligible surfactant concentration and thus no
foaming ability.
The result of microemulsion foaming test highlights two main points: a) foam can
form in Type II(-) and Type III microemulsion phases but not in Type II(+)
microemulsion phase, and b) foam is more stable in Type II(-) microemulsion than in
Type III microemulsion. The two reasons for the increase in foam stability in Type II(-)
microemulsion are: a) lower salinity and b) lower amount of solubilized oil in the
microemulsion. The effect of increased foam stability translates into increased resistance
to flow; this was verified by microemulsion sandpack tests (presented in the next
section).

164
Figure 6.4: Phase behavior of water-oil-surfactant system illustrating the effect of changing salinity.
Figure 6.5: Variation in foam height versus elapsed time in foaming test conducted on microemulsion phases from Type II(-) and Type III environment and excess phases from Type III and Type II(+) environment.
Type II (-) region Type III region Type II(+) region
Increasing salinity

165
Figure 6.6: Pipette on the left contains Type II(-) microemulsion system. Pipette on the right contains Type II(-) microemulsion separated from the excess oleic phase
Figure 6.7: Pipette on the left contains Type II(+) microemulsion system. Pipette on the right contains excess aqueous phase separated from Type II(+) microemulsion system
Figure 6.8: Pipette on the left contains Type III microemulsion system. Pipette on the right contains Type III microemulsion separated from the excess oleic phase and excess aqueous phases

166
Figure 6.9: Pipette on the left contains Type III microemulsion system. Pipette on the right contains excess aqueous phases separated from Type III microemulsion system.
Figure 6.10: (A): Foam in pipette containing Type II(-) microemulsion; (B): Foaming in pipette containing excess aqueous phase from Type III microemulsion. (C) Foam in pipette containing Type III microemulsion; (4) Foam in pipette containing excess aqueous phase from Type II (+) microemulsion. All pictures are taken immediately after shaking the pipettes.
A B C D

167
Figure 6.11: Height of foam column in pipettes 15 minutes after shaking the pipettes (pipette description is given in Figure 6.6)
6.2.2 Microemulsion Sandpack Tests
Sandpack tests were designed to further substantiate the observation made in
foaming tests that foam strength increases as salinity and amount of solubilized oil
decreases in the microemulsion phase. Microemulsion systems were prepared in 250cc
glass bottles with each bottle having a different salinity value. The maximum salinity was
lower than CSEU, i.e. only Type II(-) and Type III microemulsion systems were
prepared. Table 6. shows the salinity and microemulsion type in each bottle. Figure 6.12
shows the microemulsion solution prepared for sandpack tests. Microemulsion solution
were prepared by first dispensing aqueous solution of desired salinity in glass bottles and
adding oil to each bottle in steps of 0.5cc, while continuously stirring the mixture. After
each addition of oil, the solution was stirred till the oil layer at the top of liquid solution
was completely consumed, i.e. all the oil was solubilized. The addition of oil was stopped
A B C D

168
when a layer of oil at the top continued to persist even after stirring the solution for a
significant amount of time (approximately 2 days), thus implying that microemulsion is
saturated with oil at that salinity and surfactant concentration. Thereafter, the excess oil
layer was removed from the microemulsion, and microemulsion solution and gas were
co-injected into the sandpack. The following procedure was applied for sandpack tests:
1. Sandpack was saturated with brine having the same salinity as the salinity
of the microemulsion phase to be tested.
2. Gas and brine were coinjected into the sandpack. The injection rate of
both gas and brine was 12 cc/h, and coinjection was continued till the
steady state pressure drop was achieved across the sandpack.
3. Microemulsion phase and gas were coinjected into the sandpack, while
keeping the injection rate same as in Step 2, till the steady state pressure
drop is reached.
4. The ratio of steady state pressure drop in Step 3 and Step 2 is the mobility
reduction factor of foam.

169
Table 6.1: Details of microemulsion systems used for sandpack tests.
Salinity (TDS, PPM)
Microemulsion Type
Mobility reduction factor (MRF)
1 0 Macroemulsion 3.5
2 20000 Type II(-) 3.44
3 30000 Type II(-) 2.84
4 50000 Type III 1.74
5 60000 Type III 1.35
Figure 6.12: Bottles containing Type II(-) and Type III microemulsion systems arranged in the order of increasing salinity. Microemulsion systems were used in sandpack tests carried out to study foam stability
Type II(-) Type III

170
Figure 6.13 show the pressure drop data observed in different microemulsion
sandpack tests. It can be seen that MRF increased with the decrease in microemulsion
salinity. Since the amount of solubilized oil in microemulsion also decreases with
salinity, the increase in foam strength can be attributed to both decrease in salinity and
decrease in solubilized oil. The fact that solubilized oil in microemulsion is a function of
microemulsion salinity can be used in modeling of ASG process. In stead of making
mobility reduction factor of foam a function of both salinity and solubilized oil, it can be
treated as a function of only salinity, and the effect of solubilized oil on MRF can be
modeled through the salinity parameter.
(A)

171
(B)
(C)

172
(D)
(E)
Figure 6.13: A, B, C, D , E: Results of the sandpack tests carried out by coinjection of gas (CO2) and saturated microemulsion phase at various salinities, in Type II(+) and Type III region. MRF increased with the decrease in salinity and amount of solubilized oil.
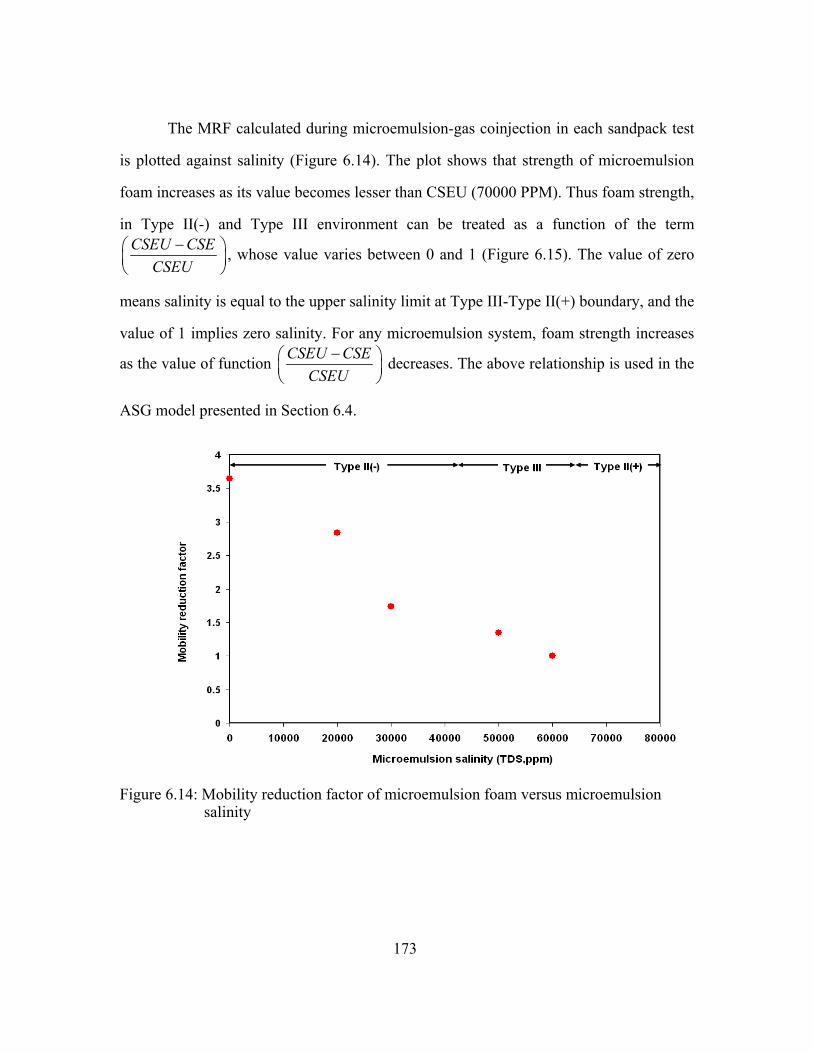
173
The MRF calculated during microemulsion-gas coinjection in each sandpack test
is plotted against salinity (Figure 6.14). The plot shows that strength of microemulsion
foam increases as its value becomes lesser than CSEU (70000 PPM). Thus foam strength,
in Type II(-) and Type III environment can be treated as a function of the term CSEU CSE
CSEU−⎛ ⎞
⎜ ⎟⎝ ⎠
, whose value varies between 0 and 1 (Figure 6.15). The value of zero
means salinity is equal to the upper salinity limit at Type III-Type II(+) boundary, and the
value of 1 implies zero salinity. For any microemulsion system, foam strength increases
as the value of function CSEU CSECSEU
−⎛ ⎞⎜ ⎟⎝ ⎠
decreases. The above relationship is used in the
ASG model presented in Section 6.4.
Figure 6.14: Mobility reduction factor of microemulsion foam versus microemulsion salinity
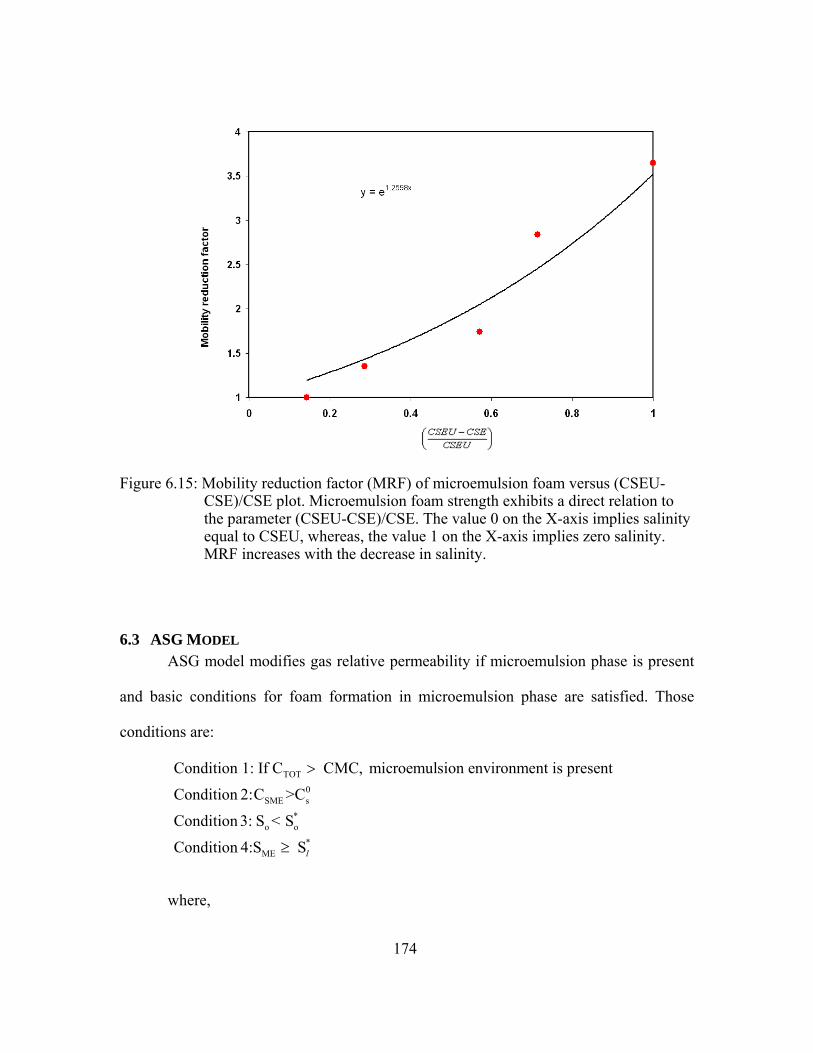
174
Figure 6.15: Mobility reduction factor (MRF) of microemulsion foam versus (CSEU-CSE)/CSE plot. Microemulsion foam strength exhibits a direct relation to the parameter (CSEU-CSE)/CSE. The value 0 on the X-axis implies salinity equal to CSEU, whereas, the value 1 on the X-axis implies zero salinity. MRF increases with the decrease in salinity.
6.3 ASG MODEL ASG model modifies gas relative permeability if microemulsion phase is present
and basic conditions for foam formation in microemulsion phase are satisfied. Those
conditions are:
TOT
0SME s
*o o
*ME
Condition 1: If C CMC, microemulsion environment is present
Condition 2:C >C
Condition 3: S < S
Condition 4:S Sl
>
≥
where,

175
CMC: critical micelle concentration
CTOT: total grid block surfactant concentration
CSME: surfactant concentration in microemulsion phase
Cso: critical surfactant concentration above which foam formation occurs
SME: saturation of microemulsion phase *lS : Minimum saturation of liquid phase required for foam formation. *oS : oil saturation above which foam is not stable
MRF= mobility reduction factor
If the above four conditions are satisfied, then foam mobility reduction factor
(MRF) is calculated in the following manner:
If CSE ≥ CSEU, then MRF=1 6.5
(Type II(+) condition is present and gas relative permeability is not modified)
If CSE < CSEU, (i.e. Type II(-) or Type III conditions can be present), then gas relative
permeability is modified as follows:
*
ME MECSEU-CSEIf S S then MRF exp F1×
CSEU⎛ ⎞⎛ ⎞> = ⎜ ⎟⎜ ⎟⎝ ⎠⎝ ⎠
6.6
To model the effect of foam, gas relative permeability is divided by MRF as follows: rgf
rg
kk
MRF= 6.7
where,
SME: microemulsion saturation (fraction)
CSME: surfactant concentration in microemulsion, volume fraction

176
CSE: effective salinity, milli-equivalents/ml
CSEU: upper limit of effective salinity, milli-equivalents/ml
F1: Model fitting parameter
The parameters F1 is the model fitting parameters and control the magnitude of increase
in foam strength as effective salinity decreases. The value of F1 varies with surfactant
and oil type and can be obtained by history matching the experimental data. When
microemulsion is not present but conditions for foam formation are present then MRF is
set equal to its maximum attainable value, which is at CSE equal to zero. Also, in
Condition 2 and Condition 4, concentration of surfactant in aqueous phase and aqueous
phase saturation is checked.
6.4 ASG MODEL FITTING
ASG model was implemented in UTCHEM and validated by history matching the
results of ASG corefloods. Table 6.2 contains main simulation input parameters. The
values of ASG model parameters were obtained from history matching the experimental
data Figure 6.16 and Figure 6.17 shows the history match of oil recovery and pressure
data, respectively, from an ASG coreflood. The simulation recovery and pressure drop
profiles matched well with the experimental data.

177
Table 6.2: Main simulation input parameters used in history matching ASG coreflood results.
Nx, Ny,Nz (model size) 20x1x1Dx, Dy, Dz (length, width,
depth) 1ft, 0.153ft, 0.153ft
CSEL (meq/ml) 0.544CSEU (meq/ml) 0.884
Initial salinity (meq/ml) 0.9ASG model parameters
Sl* 0.2
Cso 0.00015
F1 5
Figure 6.16: Comparison of experimental and simulated oil recovery. Simulation included the effect of salinity on foam strength.

178
Figure 6.17: History match of experimental pressure drop across the core in ASG coreflood. The pressure drop data obtained from ASG model that accounts for the salinity effect is a better match to experimental data.
6.5 AN APPROXIMATE METHOD FOR ASG SIMULATIONS
The simulation of ASG process may include modeling four-phase flow. The four
phases being aqueous, oleic, microemulsion, and gas. The simultaneous presence of four
phases in a grid block occurs when Type III system and gas coexist. Modeling of four
phase flow can result in large computation time and numerical instability in simulations.
Therefore, an approximate approach for modeling ASG process was studied. In the
approximate approach, the surfactant phase behavior is modeled in only Type II(-) and
Type II(+) regions. This is done by defining the lower phase salinity limit (CSEL) equal
to the upper phase salinity limit (CSEU). Thus, only Type II(-) and Type II(+)
microemulsion regions can exist in the simulation. However, main characteristics of Type

179
III microemulsion environment, i.e. high solubilization ratios or low interfacial tension,
are retained in the simulation by indirectly modifying the value of Hand’s rule empirical
parameter A.
At zero alcohol concentration, the value of Hand’s rule parameter A is directly
related to the intercept of maximum height of binodal curve, denoted by HBNC. The
values of HBNC at zero (HBNC70), optimal (HBNC71), and 2xoptimal salinity
(HBNC72) are input parameters in UTCHEM. These values are determined by history
matching the surfactant/water/oil phase behavior data. In the approximate approach, the
values of parameter HBNC is modified in such a way that solubilization ratio vs. salinity
relationship stays relatively unchanged even when upper and lower phase boundary limits
are made equal. As a consequence, the oil/microemulsion IFT vs. salinity values in Type
II(-) region in approximate and full scale simulations are similar (full scale simulation
implies including surfactant/oil/water phase behavior in Type III region in the
simulation). Similarly, water/microemulsion IFT vs. salinity values in Type II(+) region
in approximate and full scale simulations are similar.
The step-wise procedure for approximate ASG simulation approach is as follows:
Step 1: Obtain experimental data from phase behavior tests. The data contains oil/water
solubilization ratios and lower/upper salinity limits.
Step 2: Obtain values of HBNC by matching the experimental data (Figure 6.18).
Step 3: Increase the value of lower salinity limit (CSEL) and make it equal to upper
salinity limit (CSEU).
Step 4: Match the oil solubilization ratios in the Type II(-) region by varying the values
of parameters HBNC70, HBNC71, and HBNC72 (Figure 6.19).
Step 5: Use matched values obtained in Step 4 as input parameters in the simulation.

180
Figure 6.18 and Figure 6.19 match the solubilization ratio versus salinity data
obtained from lab experiments. In Figure 6.19, the value of CSEL is equal to CSEU
(approximate approach). It can be seen that the matched oil solubilization ratio values in
Type II(-) region in Figure 6.19 are approximately same as oil solubilization ratio values
in Type II(-) region in Figure 6.18. Similarly, matched water solubilization ratio values in
Type II(+) region in Figure 6.19 are approximately same as water solubilization ratio
values in Type II(+) region in Figure 6.18. Since solubilization ratios in Figure 6.19 and
Figure 6.18 are similar, the IFT values at different salinities should also be similar; IFT is
calculated from solubilization ratio in UTCHEM.
Figure 6.18: Surfactant/oil/water phase behavior match obtained by using Hand’s equation. The parameter HBNC is varied to match experimental data. The lower and upper salinity limits are at 29000 ppm and 52000 ppm, respectively.

181
Figure 6.19: Surfactant/oil/water phase behavior match obtained by using Hand’s equation. The parameter HBNC is varied to match experimental data. The lower salinity limit (CSEL) is increased and made equal to CSEU. Only Type II(-) and Type II(+) regions exist.
The phase saturations calculated in approximate approach and full scale approach
simulations are different from each other in the region where Type III salinity exists. The
magnitude of this difference in saturation distribution is a direct function of number of
grid blocks having Type III microemulsion environment. In one dimensional ASG
coreflood simulations, which this study is mainly focused on, only few grid blocks have
Type III microemulsion because of the size of the slug is kept small (0.3 PV). Therefore,
the effect of saturation distribution on simulation results would be insignificant.
In order to validate the approximate approach, simulations using approximate
approach were compared with simulation using full-scale approach. The comparison was
made on both one-dimensional surfactant-polymer (SP) and ASG cases. The only

182
difference between input data in approximate and full scale simulation was the values of
parameters HBNC70, HBNC71, and HBNC72. Figure 6.20 and Figure 6.21 compares the
oil recovery and oil cut data from SP and ASG cases, respectively. Figure 6.22 and
Figure 6.23 compares microemulsion cut data from SP and ASG cases, respectively. The
comparison shows good agreement between results from two approaches.
Table 6.3: Main input specifications for core scale ASG simulation used to compare full scale and approximate approach
Main input parameters SP Case ASG Case Nx, Ny, Nz (number of grid
blocks) 1,1,100 100,1,1
Dx, Dy, Dz (length, width, depth) 0.167ft, 0.167ft, 1ft 1ft,0.153ft,0.153ftPorosity 0.201 0.15
Permeability 356 md 327 Initial water saturation 0.665 0.7 Initial gas saturation X 0.0
CSEL 29000 ppm (0.65 meq/ml)
31645 ppm (0.544meq/ml)
CSEU 52000 ppm (0.9 meq/ml) 51424 ppm(0.885 meq/ml)
HBNC70,HBNC71,HBNC71 (full scale approach) 0.04, 0.03, 0.09 0.9, 0.01, 0.9
HBNC70,HBNC71,HBNC71 (approximate approach) 0.025, 0.01, 0.06 0.3, 0.01, 0.9
Injection foam quality X 50%

183
Figure 6.20: Comparison of oil recovery and oil cut data from SP flooding simulation using full scale approach and approximate approach. The results from simulations show good agreement.

184
Figure 6.21: Comparison of oil recovery and oil cut data from ASG flooding simulation using full scale approach and approximate approach. The results from simulations show good agreement
Figure 6.22: Comparison of effluent microemulsion cut data from ASP simulations using full scale and approximate approaches. The microemulsion cut data in simulation using full scale approach shows some fluctuation, which is due to numerical instability.

185
Figure 6.23: Comparison of effluent microemulsion cut data from ASG simulations using full scale and approximate approaches.
6.6 CHAPTER SUMMARY
Microemulsion foaming and gas-microemulsion flow tests indicate that the foam
strength and foam propagation is more robust in Type II(-) microemulsion, followed by
Type III microemulsion. Foam stability is extremely poor in Type II(+) microemulsion.
Also, foam did not form in the excess aqueous phase in Type III and Type II(+)
microemulsion environments, due to surfactant partitioning into the microemulsion
phase. The ASG model takes into account the effect of salinity and oil solubilization, for
a given injection quality and chemical formulation, on mobility reduction factor of foam.
The model was implemented in UTCHEM and ASG simulations were carried out to
history match coreflood data. The simulations were carried out with assumption that gas

186
solubility in aqueous phase is insignificant and gas does not affect the surfactant/oil/brine
phase behavior characteristics.

187
CHAPTER 7
Summary and Recommendations
This final chapter summarizes the findings of this research and makes
recommendations for future work.
7.1 SUMMARY
The technical feasibility of ASG process as an EOR method was investigated in
this research. Polymer was replaced by gas in the slug and the drive, which led to the
formation of foam and reduced the mobilities of injected fluids. ASG corefloods resulted
in efficient mobilization and displacement of remaining oil in place after waterflood. Oil
recoveries as high as 97% of ROIP were obtained in the corefloods, and the range of oil
recoveries varied from 60% to 97% of ROIP. The ability of gas in providing mobility
control is evident from the fraction of oil produced in the oil bank and pressure response
data. Mobility ratio calculated for one of the ASG coreflood was 1.4. Even without the
use of polymer, the value of mobility ratio close to unity is an indicator of mobility
reduction of the displacing phase by foam. Comparable oil recoveries observed in ASG
and ASP corefloods, carried out under similar conditions, also highlight the EOR
potential of ASG flooding.
The design of chemical formulation in ASG process involves selection of
surfactants that can perform the dual role of IFT reduction, and stable foam generation
and propagation. Therefore, aqueous stability, surfactant phase behavior and foaming
tests are needed to identify suitable chemicals for ASG flooding. A combination of
sulfate and internal olefin sulfonate (ISOS) surfactant was used in the slug. The sulfonate

188
surfactant was found to be a better foamer than sulfate surfactant, whereas, sulfate
surfactant resulted in increased stability and high solubilization ratios at higher salinity.
Due to better foaming potential of sulfonate surfactant, it was used as the foaming agent
in the drive.
The strength of foam in the drive increased in all ASG corefloods as the flood
progressed. This increasing trend can be attributed to negative salinity gradient applied in
corefloods; foam stability and strength increased as salinity of the system decreased. Due
to decrease in salinity, trapped surfactant in viscous microemulsion phase is mobilized
into ASG drive, thus increasing foam strength in the drive. The increase in foam strength
can also be attributed to lower salinity improving foam film stability and surfactant
desorption.
Foam strength, and hence the displacement efficiency, increased with the increase
in core permeability. The relative mobility of gas, at the quasi steady state, was lower in
high permeability ASG corefloods compared to low permeability ASG corefloods. Better
displacement efficiency was reflected in the form of increase in the oil bank size with the
increase in permeability.
The lower mobility of displacing fluids, in the presence of foam, at higher
permeability highlights the conformance control characteristics of foam. Due to
significant flow resistance exerted by foam in high permeability regions, the injected
fluid will be diverted to low permeability regions, resulting in the improvement in
volumetric sweep efficiency.
Gas and liquid injection rates (injection foam quality) also have an important
impact on stable foam propagation and displacement efficiency. The liquid injection
velocity was maintained at approximately 2 ft/day in ASG corefloods because in EOR
field applications, liquid velocity is approximately 1 -2 ft/day in the reservoir, away from

189
the well bore. Relative mobility of gas, calculated at quasi-steady state, was higher in
ASG corefloods with gas velocity higher than the liquid injection velocity (injection foam
quality). The size of the oil bank decreased with the increase in injection foam quality.
Higher gas velocity destabilized foam, and gas front moved ahead of liquid front due to
higher gas mobility. Thus benefits of mobility reduction due to two phase flow were not
achieved and the displacement front was not stable (indicated by early gas breakthrough,
smaller oil bank size).
The reduction in the size of chemical slug, from 0.3 PV to 0.15 PV did not have a
significant impact on foam propagation. Early gas breakthrough was not observed as
chemical slug size was reduced by 50%, indicating relatively stable foam in the slug and
drive.
Pressure can affect ASG process in multiple ways. The effect of pressure is more
pronounced when CO2 is used as the foaming gas. The high solubility of CO2 in the
aqueous phase and its reaction with water, which results in the formation of carbonic
acid, significantly impacts foam stability and surfactant phase behavior in ASG process.
High CO2 solubility in the aqueous phase adversely affects foam propagation by making
less gas available for foaming. Moreover, consumption of alkali by carbonic acid creates
sub-optimal conditions in the slug, which may lead to lower solubilization ratios and
increased surfactant adsorption. Under experimental conditions, N2-ASG corefloods
performed better than CO2-ASG corefloods. The size of oil bank and foam strength, as
indicated by the pressure drop data, was higher in the N2 ASG corefloods than in the
CO2-ASG corefloods. This can be attributed to large solubility contrast that exists
between CO2 and N2, and also to the absence of alkali consumption by acid in N2-ASG
corefloods.
190
Microemulsion foaming and gas-microemulsion flow tests indicate that the foam
strength and foam propagation is more robust in Type II(-) microemulsion, followed by
Type III microemulsion. Foam stability is extremely poor in Type II(+) microemulsion.
Also, foam did not form in the excess aqueous phase in Type III and Type II(+)
microemulsion environments, due to surfactant partitioning into the microemulsion
phase.
ASG model presented in Chapter 6 models the effect of salinity and oil
solubilization, for a given injection quality and chemical formulation, on mobility
reduction factor of foam. The model was implemented in UTCHEM and ASG
simulations were carried out to history match coreflood data.
7.2 RECOMMENDATIONS FOR FUTURE WORK
Based on the results and observation made in this research, here are some
recommendations for the future work:
1. Due to high solubility of CO2 in the aqueous phase, alternate injection of
CO2 and liquid chemicals (surfactant-alternating-gas) should be
investigated. This will reduce the contact between gas and liquid in the
injection line (or in the well bore in practical applications) and CO2 will
enter the reservoir in the gaseous state, not as the dissolved gas in aqueous
phase. Moreover, due to alternate injection, the portion of the reservoir
where gas slug is present will have low aqueous phase saturation;
therefore, amount of gas dissolution in the aqueous phase will be low.
2. In CO2-ASG coreflood, SAG injection technique also reduces the direct
contact between the chemical slug and CO2. Therefore, the level of alkali
consumption (if alkali is present in the slug) will be significantly low.

191
3. In ASG process, foaming in microemulsion is an important phenomenon
and determines the mobility ratio between the slug and oil bank. We tested
the stability and flow characteristics of microemulsion foam in different
microemulsion solutions formed with light oil. The impact of oil and
surfactant type on foaming ability of microemulsions should be
investigated. Factors that increase in the stratification of micelles in foam
films needs to be identified.
4. We presented a model for gas mobility in ASG process, for a given
injection foam quality, that takes into account the effect of salinity and
solubilized oil on foam strength. The model is a function of parameter ψ,
which is a measure of how lower the salinity is from Type II(+)-Type III
boundary for a given surfactant/oil system. Since foam strength is also a
function of injection foam quality, the model needs to be modified to
incorporate the effect of foam quality on mobility reduction characteristics
of foam.

192
APPENDIX –A
Summary of coreflood results and waterflood pressure data
A 1 ASP SANDSTONE COREFLOOD (CHAPTER 3)
Table A1: Results ASP_SCD1
Permeability (md) 1004.219Porosity (%) 16Endpoint oil relative permeabiltiy (Kro@Srw) 0.5392Endpoint water relative permeabiltiy (Krw@Sro) 0.1025Remaining oil in place (% of pore volume) 35.7Final oil recovery (% of ROIP) 88Oil recovery in the oil bank (% of ROIP) 40Insitu salinity after waterflood (TDS,ppm) 156000Injected slug salinity( TDS, ppm) 51000Injected drive salinity (TDS,ppm) 35000
ASP_SCD1
Figure A1: Waterflood pressure data (ASP_SCD1)

193
A 2 ASP DOLOMITE COREFLOOD (CHAPTER 3)
Table A2: Results ASP_DCP1
Permeability (md) 40Porosity (%) 16.9Endpoint oil relative permeabiltiy (Kro@Srw) 0.6873Endpoint water relative permeabiltiy (Krw@Sro) 0.106Remaining oil in place (% of pore volume) 22.3Final oil recovery (% of ROIP) 92Oil recovery in the oil bank (% of ROIP) 60Insitu salinity after waterflood (TDS,ppm) 84274Injected slug salinity( TDS, ppm) 51500Injected drive salinity (TDS,ppm) 31645
ASP_DCP1
0
2
4
6
8
10
12
0.0 0.2 0.4 0.6 0.8 1.0 1.2
Injected pore volumes
CoreX Section 1 Section 2 Section 3
Pres
sure
dro
p (p
si)
Waterflood injection velocity: 2 ft/day
Figure A2: Waterflood pressure data (ASP_DCP1)

194
A 3 ASG SANDSTONE COREFLOOD (CHAPTER 3)
Table A3: Results ASG_SCD7
Permeability (md) 168Porosity (%) 17.4Endpoint oil relative permeabiltiy (Kro@Srw) 0.85Endpoint water relative permeabiltiy (Krw@Sro) 0.05Remaining oil in place (% of pore volume) 28.4Final oil recovery (% of ROIP) 68Oil recovery in the oil bank (% of ROIP) 52Insitu salinity after waterflood (TDS,ppm) 156000Injected slug salinity( TDS, ppm) 51000Injected drive salinity (TDS,ppm) 35000
ASG_SCD7
0
0.5
1
1.5
2
2.5
3
3.5
4
4.5
5
0.0 0.5 1.0 1.5
CoreX Section 1 Section 2 Section 3
Pres
sure
dro
p (p
si)
Waterflood injection velocity : 2.2 ft/day
Injected pore volumes
Figure A3: Waterflood pressure data (ASG_SCD7)

195
A 4 ASG DOLOMITE COREFLOOD (CHAPTER 3) AND LOW INJECTION QUALITY ASG COREFLOOD (CHAPTER 4)
Table A4: Results ASG_DCP15
Permeability (md) 188.23Porosity (%) 13.6Endpoint oil relative permeability (Kro@Srw) 0.2422Endpoint water relative permeability (Krw@Sro) 0.0106Remaining oil in place (% of pore volume) 14Final oil recovery (% of ROIP) 97Oil recovery in the form of pure oil (% of ROIP) 42Insitu salinity after waterflood (TDS,ppm) 84274Injected drive salinity (TDS,ppm) 51500Injected drive salinity (TDS,ppm) 31645
ASG_DCP15
Figure A4: Waterflood pressure data (ASG_DCP15)
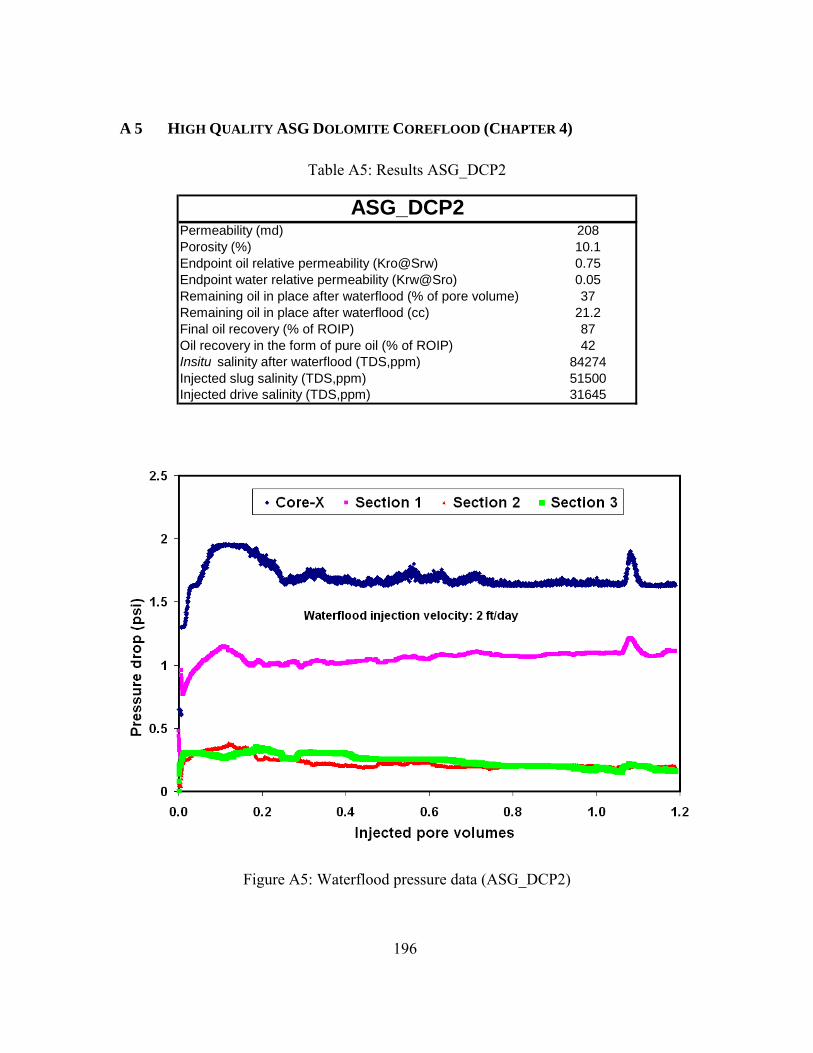
196
A 5 HIGH QUALITY ASG DOLOMITE COREFLOOD (CHAPTER 4)
Table A5: Results ASG_DCP2
Permeability (md) 208Porosity (%) 10.1Endpoint oil relative permeability (Kro@Srw) 0.75Endpoint water relative permeability (Krw@Sro) 0.05Remaining oil in place after waterflood (% of pore volume) 37Remaining oil in place after waterflood (cc) 21.2Final oil recovery (% of ROIP) 87Oil recovery in the form of pure oil (% of ROIP) 42Insitu salinity after waterflood (TDS,ppm) 84274Injected slug salinity (TDS,ppm) 51500Injected drive salinity (TDS,ppm) 31645
ASG_DCP2
Figure A5: Waterflood pressure data (ASG_DCP2)

197
A 6 MEDIUM PERMEABILITY AND MEDIUM QUALITY ASG DOLOMITE COREFLOOD (CHAPTER 4)
Table A6: Results ASG_DCP8
Permeability (md) 170.98Porosity (%) 13.6Endpoint oil relative permeabiltiy (Kro@Srw) 0.4452Endpoint water relative permeabiltiy (Krw@Sro) 0.011Remaining oil in place (% of pore volume) 19Final oil recovery (% of ROIP) 90Oil recovery in the oil bank (% of ROIP) 40Insitu salinity after waterflood (TDS,ppm) 84274Injected slug salinity (TDS,ppm) 51500Injected drive salinity (TDS,ppm) 31645
ASG_DCP8
Figure A6: Waterflood pressure data (ASG_DCP8)

198
A 7 HIGH PERMEABILITY ASG DOLOMITE COREFLOOD (CHAPTER 4)
Table A7: Results ASG_DCP9
Permeability (md) 447.45Porosity (%) 15.8Endpoint oil relative permeabiltiy (Kro@Srw) 0.2995Endpoint water relative permeabiltiy (Krw@Sro) 0.014Remaining oil in place (% of pore volume) 32Final oil recovery (% of ROIP) 85.4Recovery in the form of pure oil (% of ROIP) 52Insitu salinity after waterflood (TDS,ppm) 84274Injected slug salinity (TDS,ppm) 51500Injected drive salinity (TDS,ppm) 31645
ASG_DCP9
Figure A7: Waterflood pressure data (ASG_DCP9)

199
A 8 LOW PERMEABILITY ASG DOLOMITE COREFLOOD (CHAPTER 4)
Table A8: Results ASG_DCP10
Permeability (md) 2Porosity (%) 15.6Endpoint oil relative permeabiltiy (Kro@Srw) 1.4336Endpoint water relative permeabiltiy (Krw@Sro) 0.2655Remaining oil in place (% of pore volume) 19Final oil recovery (% of ROIP) 78Recovery in the form of pure oil (% of ROIP) 20Insitu salinity after waterflood (TDS,ppm) 84274Injected slug salinity (TDS, ppm) 51500Injected drive salinity (TDS,ppm) 31645
ASG_DCP10
Figure A8: Waterflood pressure data (ASG_DCP10)

200
A 9 SMALL SLUG SIZE (0.15 PV) ASG DOLOMITE COREFLOOD (CHAPTER 4)
Table A9: Results ASG_DCP11
Permeability (md) 327.52Porosity (%) 14.8Endpoint oil relative permeabiltiy (Kro@Srw) 0.2862Endpoint water relative permeabiltiy (Krw@Sro) 0.013Remaining oil in place (% of pore volume) 30Final oil recovery (% of ROIP) 63.6Oil recovery in the form of pure oil (% of ROIP) 32Insitu salinity after waterflood (TDS,ppm) 84274Injected slug salinity (TDS,ppm) 51500Injected drive salinity (TDS,ppm) 31645
ASG_DCP11
Figure A9: Waterflood pressure data (ASG_DCP11)

201
A 10 LOW PRESSURE CO2- ASG DOLOMITE COREFLOOD (CHAPTER 5)
Table A10: Results ASG_LP_CO2
Permeability (md) 648.8Porosity (%) 22Endpoint oil relative permeabiltiy (Kro@Srw) 0.2306Endpoint water relative permeabiltiy (Krw@Sro) 0.0332Remaining oil in place (% of pore volume) 32Final oil recovery (% of ROIP) 79Oil recovery in the form of pure oil (% of ROIP) 40Insitu salinity after waterflood (TDS,ppm) 65000Injected slug salinity( TDS, ppm) 65000Injected drive salinity (TDS,ppm) 35000
DSDM_LP_CO2
0
0.5
1
1.5
2
2.5
3
0.0 0.2 0.4 0.6 0.8 1.0 1.2 1.4 1.6Injected pore volumes
Pres
sure
dro
p (P
si)
Core-X Section 1 Section 2 Section 3
Figure A10: Waterflood pressure data (ASG_LP_CO2)

202
A 11 HIGH PRESSURE CO2-ASG SANDSTONE COREFLOOD (CHAPTER 5)
Table A11: Results ASG_HP_CO2
Permeability (md) 681.24Porosity (%) 20.4Endpoint oil relative permeabiltiy (Kro@Srw) 0.2143Endpoint water relative permeabiltiy (Krw@Sro) 0.0575Remaining oil in place (% of pore volume) 35Final oil recovery (% of ROIP) 59Oil recovery in the oil bank (% of ROIP) 30Insitu salinity after waterflood (TDS,ppm) 65000Injected slug salinity( TDS, ppm) 65000Injected drive salinity (TDS,ppm) 35000
DSDM_HP_CO2
Figure A11: Waterflood pressure data (ASG_HP_CO2)

203
A 12 LOW PRESSURE N2-ASG SANDSTONE COREFLOOD (CHAPTER 5)
Table A12: Results ASG_LP_N2
Permeability (md) 605.55Porosity (%) 23.1Endpoint oil relative permeabiltiy (Kro@Srw) 0.241Endpoint water relative permeabiltiy (Krw@Sro) 0.03Remaining oil in place (% of pore volume) 29Final oil recovery (% of ROIP) 66Oil recovery in the oil bank (% of ROIP) 50Insitu salinity after waterflood (TDS,ppm) 65000Injected slug salinity( TDS, ppm) 65000Injected drive salinity (TDS,ppm) 35000
DSDM_LP_N2
Figure A12: Waterflood pressure data (ASG_LP_N2)

204
A 13 HIGH PRESSURE N2-ASG SANDSTONE COREFLOOD (CHAPTER 5)
Table A13: Results ASG_HP_N2
Permeability (md) 681.24Porosity (%) 23.5Endpoint oil relative permeabiltiy (Kro@Srw) 0.2143Endpoint water relative permeabiltiy (Krw@Sro) 0.0595Remaining oil in place (% of pore volume) 29Final oil recovery (% of ROIP) 72Oil recovery in the oil bank (% of ROIP) 50Insitu salinity after waterflood (TDS,ppm) 65000Injected slug salinity( TDS, ppm) 65000Injected drive salinity (TDS,ppm) 35000
DSDM_HP_N2
0
2
4
0.0 0.2 0.4 0.6 0.9 1.1 1.3 1.5 1.7
Injected pore volumes
Pres
sure
dro
p (P
si)
Core-X Sec 1 Sec 2 Sec 3
Figure A13: Waterflood pressure data (ASG_HP_N2)

205
A 14 HIGH QUALITY CO2- ASG SANDSTONE COREFLOOD (CHAPTER 5)
Table A14: Results ASG_HP_CO2_HQ
Permeability (md) 648.8Porosity (%) 22.7Endpoint oil relative permeabiltiy (Kro@Srw) 0.18Endpoint water relative permeabiltiy (Krw@Sro) 0.0464Remaining oil in place (% of pore volume) 27Final oil recovery (% of ROIP) 64Oil recovery in the oil bank (% of ROIP) 45Insitu salinity after waterflood (TDS,ppm) 65000Injected slug salinity( TDS, ppm) 65000Injected drive salinity (TDS,ppm) 35000
DSDM_HP_CO2_HQ
0
2
4
0.0 0.2 0.4 0.6 0.9 1.1 1.3 1.5 1.7Injected pore volumes
Pres
sure
dro
p (P
si)
Core-X Section 1 Section 2 Section 3
Figure A14: Waterflood pressure data (ASG_HP_CO2_HQ)

206
A 15 HIGH PRESSURE CO2-ASG SANDSTONE COREFLOOD WITH HIGH SURFACTANT CONCENTRATION IN THE SLUG (CHAPTER 5)
Table A15: Results ASG_HP_CO2_2%
Permeability (md) 619.31Porosity (%) 22.7Endpoint oil relative permeabiltiy (Kro@Srw) 0.2095Endpoint water relative permeabiltiy (Krw@Sro) 0.122Remaining oil in place (% of pore volume) 29Final oil recovery (% of ROIP) 96Oil recovery in the oil bank (% of ROIP) 83Insitu salinity after waterflood (TDS,ppm) 65000Injected slug salinity( TDS, ppm) 65000Injected drive salinity (TDS,ppm) 35000
DSDM_HP_CO2_2%
0
2
4
0.0 0.2 0.4 0.6 0.9 1.1 1.3 1.5 1.7 1.9Injected pore volumes
Pres
sure
dro
p (P
si)
Core-X Section 1 Section 2 Section 3
waterflood injection velocity: 2 ft/day
Figure A15: Waterflood pressure data (ASG_HP_CO2_2%)

207
GLOSSARY
SYMBOLS:
qw = water flow rate [=] L3/t
qg = water flow rate [=] L3/t
ug = gas velocity [=] L/t
krw = relative permeability to water
krg = relative permeability to water
k = absolute permeability [=] L2
µw = water viscosity [=] ML-1T-1
µg = gas viscosity [=] ML-1T-1
Sw = water phase saturation (%)
Sg = gas phase saturation (%)
pw = pressure of water phase [=]ML-1T-2
pg = pressure of gas phase [=]ML-1T-2
pc = capillary pressure [=]ML-1T-2
λrg = foam mobility [=]L3T/M
A = cross sectional area [=] L2
σ = interfacial tension [=] M1T-2
nL = foam texture
rt = pore throat radius [=] L
Pcsn = critical pressure for snap off [=]ML-1T-2
R = radius of curvature [=] L
JDi = diffusion rate of component i [=] L2T-1
kji = effective mass transfer coefficient of component i [=] LT-1
A1 = hamaker constant
h = film thickness [=] L
Π= disjoining pressure [=] ML-1T-2
Nca = capillary number
Rl = solubilization ratio (vol/vol)

208
Fl = Hirasaki correction factor
Pgas = partial pressure of gas in the bulk atmosphere [=] ML-1T-2
Ca = equilibrium concentration of gas in the aqueous phase [=] moles/M3
kH = Henry’s constant [=] LT2
Xa = equilibrium mole fraction of dissolved gas in aqueous phase
D = diffusion coefficient of gas in the liquid phase [=] L2T-1
K = equilibrium constant of reaction

209
BIBLIOGRAPHY
Alvarez, J. M. (1998). Foam-Flow Behavior in Porous Media: Effects of Flow Regime
and Porous-Medium Heterogeneity. PhD dissertation, The University of Texas at Austin, Austin, Texas, USA.
Baviere, M. (1991). Basic concepts in Enhanced Oil Recovery Process. Critical Reports
on Applie Chemistry, Volume 33. Published by Elsevier Applied Science. Bachu, S. and Bennion, D.B. (2009). Dependence of CO2-Brine Interfacial Tension on
Aquifer Pressure, Temperature, and Water Salinity. Energy Procedia 1, 3157-3164. URL: http://dx.doi:10.1016/j.egypro.2009.02.098.
Bertin, H.J., Apaydin, O.G., Castanier, L.M., and Kovscek, A. R. (1998). Foam Flow in
Heterogeneous Porous Media: Effect of Crossflow. Paper SPE 39678 presented at SPE/DOE Improved Oil Recovery Symposium. Tulsa, Oklahoma, USA, April 19-22.
Bickerman, J.J. (1973). Foams, Springer Verlag, New York. Blauer, R.E. and Kohlhaas, C.A. (1974). Formation Fracturing with Foam. Paper SPE
5003 presented at the Fall Meeting of the Society of Petroleum Engineers of AIME. Houston, Texas, USA October 6-9.
Bullen, R.S. and Braturd, T.F. (1976). Fracturing with Foam. Journal of Canadian
Petroleum Technology, April-June, 15(2). Borchardt, J.K., Bright, D.B., Dickson, M.K., and Wellington, S.L. (1985). Surfactant for
CO2 Foam Flooding. Paper SPE 14394 presented at SPE Annual Technical Conference and Exhibition. Las Vegas, Nevada, USA, September 22-26.
Carrol, J.J. and Mather, A.E. (1992). The System of Carbon-dioxide-water and
Krichevsky-Kasarnovsky Equation. Journal of Solution Chemistry, 21(7), 607-621. Cawizel, K.E. and Niles, T.D. (1987). Rheological Properties of Foam Fracturing Fluids
under Down-hole Conditions. Paper SPE 16191 presented at SPE Production Operations Symposium. Oklahoma City, Oklahoma, USA, March 8-10.
Chambers, K.T. and Radke, C.J. (1991). Capillary Phenomenon in Foam Flow through
Porous Media. Printed in Interfacial Phenomenon in Petroleum Recovery. Morrow, N.R.(ed.), Marcel Dekker, New York, 191-255.
Chang, S.H. and Grid, R.B. (1999). Effects of Foam Quality and Flow Rate on the CO2-
Foam behavior at Reservoir Temperature and Pressure. Paper SPE 56856 presented

210
at the 1998 SPE/DOE Improved Oil Recovery Symposium. Tulsa, Oklahoma, USA, April 19-22.
Dong, M., Foraie, J.,Huang, S., and Chatzis, I. (2002). Analysis of Immiscible Water-
Alternating –Gas (WAG) injection Using Micromodel. Paper 2002-158 at Canadian International Petroleum Conference. Calgary, Alberta, Canada, June 11 - 13.
Djabbarah, N.F., Weber, S.L, Freeman, D.C., Muscateloo, J.A., and Covington, T.E.
(1990). Laboratory Design and Field Demonstration of Steam Diversion with Foam. Paper SPE 20067 presented at the 60th California Regional Meeting. Ventura, California, USA, April 4-6.
Dwarakanath, V., Chaturvedi, T., Jackson, A.C., Malik, T., Siregar, A., and Zhao, P.
(2008). Using Co-solvents to Provide Gradients and Improve Oil Recovery during Chemical Flooding in a Light Oil Reservoir. Paper SPE 113965 presented at the 2008 SPE Improved oil Recovery Symposium. Tulsa, Oklahoma, USA, April 19-23.
Ettinger, R. A. and Radke, C. J. (1992). Influence of Texture on Steady Foam Flow in
Berea Sandstone. Paper SPERE, Feb, 83-90. Falls, A. H., Hirasaki, G. J., Patzek, T. W., Gauglitz, P. A., Miller, D. D., and
Ratulowski, T. (1988). Development of a Mechanistic Foam Simulator: The Population Balance and Generation by Snap-off. SPERE, August, 884-892.
Falls, A. H., Musters, J. J., and Ratulowski, J. (1989). The Apparent Viscosity of Foams
in Homogeneous Bead Packs. SPERE, May, 155-164. Flaaten, A. K., Nguyen, Q. P., Pope, G. A., and Zhang, J. (2008). A Systematic
Laboratory Approach to Low-Cost, High-Performance Chemical Flooding. Paper SPE 113469 presented at the 2008 SPE Improved Oil Recovery Symposium. Tulsa, Oklahoma, USA, April 19-23.
Farajzadeh, R., Adrianov, A., Bruining, H., and Zitha, P.L.J. (2009). New Insight into
Application of Foam for Acid Diversion. Paper SPE 122133 presented at 2009 European Formation Damage Conference. Scheveningen, Netherlands, May 27-29.
Friedmann, F., Jensen, J.A. (1986). Some Parameters Influencing Formation and
Propagation of Foams in Porous Media. Paper SPE 15087 presented at the 1986 SPE California Regional Meeting. Oakland, USA, April 2-4.
Friberg, S. and Saito, H. (1976). Foams: Edited by E.J Akers. Academic Press London.
P.33. S., H. Saito, in: Foams (Ed. R. J. Akers), p. 33, Academic Press (London, 1976).

211
Frye, G.C. and Berg, J.C. (1989). Antifoam Action by Solid Particles. J. Colloid Interface Science, 127-222.
Harkins, W.D. (1941). A General Thermodynamic Theory of the Spreading of Liquids to
Form Duplex Films and of Liquids or Solids to Form Monolayers. Journal of Chemical Physics, 9, 552.
Harris, P.C. (1989). Effect of Texture on Rheology of Foam Fracturing Fluids. Paper
SPE 14257, SPE Production Engineering, 249-257. Hirasaki, G.J. and Lawson, J.B. (1985). Mechanism of Foam Flow in Porous Media:
Apparent Viscosity in Smooth Capillaries. Paper SPE J, April, 176-190. Hutchins, R.D. and Miller, M.J. (2003). A Circulating Foam Loop for Evaluating Foam at
Conditions of Use. Paper SPE 80242 presented at the 2003 APE International Symposium of Oil-Field Chemistry. Houston, USA, Feb. 5-8.
Healy, R.N. and Reed, R.L. (1974). Physiochemical Aspects of Microemulsion Flooding.
SPE J, 491-501. Healy, R.N., Reed, R.L. and Stenmark, D.K. (1976). Multiphase Microemulsion Systems.
SPE J, 16 (3), 147-160. SPE-5565-PA. Hirasaki, G.J. (1981). Application of the Theory of Multicomponent, Multiphase,
Displacement to Three-Component, Two-Phase Surfactant flooding. SPE J, 191-204. Holt, T. and Vassenden, T. (1996). Effects of Pressure on Foam Stability: Implications
for Foam Screening. Paper SPE 35398, presented at 10th Symposium of Improved Oil Recovery. Tulsa, OK, USA. April 21-24.
Huh, C. (1979). Interfacial tension and Solubilizing Ability of a Microemulsion Phase
that Coexists with Oil and Brine. J. Colloid Interface Science, 71, 408-428.
Kovscek, A.R., Patzek, T.W., and Radke, C.J. (1997). Mechanistic Foam Flow Simulation in Heterogeneous and Multidimensional Porous Media. SPE J, 2(4), 511-526.
Kibodeaux, K. R. (1997). Experimental and Theoretical Studies of Foam Mechanisms in
Enhanced Oil Recovery and matrix acidization Applications. PhD Dissertation, The University of Texas at Austin, Austin, Texas, USA.
Kamal, M. and Mardsen, Jr., S. S. (1973). Displacement of Micellar Slug Foam in
Unconsolidated Porous Media. Paper SPE 4584 presented at the 48th Annual Fall Meeting of the Society of Petroleum Engineers of AIME. Las Vegas, Nevada, Sep. 30 – Oct 3.

212
Kovscek, A. R., and Radke, C. J. (1994). Fundamentals of Foam Transport in Porous Media. Foams in Petroleum Industry, Schramm, L. L., Editor, American Chemical Society, Washington, D. C.
Lake, L.W. (1989). Enhanced Oil Recovery, Englewood Cliff, NJ: Prentice Hall. Lawson, J. B. and Reisberg, J. (1980). Alternate Slugs of Gas and Dilute Surfactant for
Mobility Control During Chemical Flooding. Paper SPE 8839 presented at the First Joint SPE/DOE Symposium on Enhanced Oil Recovery. Tulsa, Oklahoma, April 20-23.
Levitt, D.B., Jackson, A.C., Heinson, C., Britton, L.N., Malik, T., Dwarkanath, V., and Pope, G.A.(2006). Identification and Evaluation of high performance Surfactants. Paper SPE 100089 presented at the 2006 SPE/DOE Symposium on Improved Oil Recovery. Tulsa, Oklahoma, April 14-15. Levitt, D.B. and Pope, G.A. (2008). Selection and Screening of Polymers for Enhanced
Oil Recovery. Paper SPE 113845. Presented at SPE/DOE Symposium on Improved Oil Recovery. Tulsa, Oklahoma, April 20-23.
Li, R., Yan, W., Liu, S., and Hirasaki, G.J. (2008). Foam Mobility Control for Surfactant
EOR. Paper SPE 113910 presented at the 2008 SPE/DOE Improved Oil Recovery Symposium. Tulsa, Oklahoma, April 19-23.
Marangoni, C. G. M. , Il Nuovo cimento, Ser. 2, 5/6, 239 (1872) Martin, F.F. and Oxley, J.C. (1985). Effect of Various Alkaline Chemicals on Phase
Behavior of Surfactant/Brine/Oil Mixtures. Paper SPE 13575 presented at International Symposium of Oil Field and Geothermal Chemistry. Phoenix, Arizona, USA, April 9-11.
Mitchell, B.J. (1970). Ph.D. Dissertation, University of Oklahoma, Norman, Oklahoma. Nelson, R.C. and Pope, G.A. (1977). Phase Relationship in Chemical Flooding. Paper
SPE 6773 presented at 52nd Annual Fall technical Conference and Exhibition of Society of Petroleum Engineer of AIME. Denver, Colorado, USA, October.
Nelson, R. C., Lawson, J. B., Thigpen, D. R., and Stegemeier, G. L. (1984). Cosurfactant-
Enhanced Alkaline Flooding. Paper SPE 12672, presented at the Symposium on Improved Oil Recovery. Tulsa, Oklahoma, USA, April 15-18.
Nikolov, A.D., Wasan, D.T., Huang, D.W., Edwards, D.A. (1986). The Effect of Oil on
Foam Stability: Mechanisms and Implications for Oil Displacement by Foam in

213
Porous Media. Paper SPE 15443 presented at SPE Annual Technical Conference and Exhibition. New Orleans, Louisiana, USA, October 5-8.
Nikolov, A.D. and Wasan, D.T. (1992). Dispersion Stability due to Structural
Contributions to the Particle Interaction as Probed by Thin Liquid Film Dynamics. Langmuir (1992), 8, 2985 -2994.
Niu, Y., Ouyang, J., Zhu, Z., Wang, G., Sun, G., and Shi, L. (2001). Research on
Hydrophobically Associating water-soluble polymer used for EOR. Paper SPE 65378 presented at SPE International Symposium on Oilfield Chemistry. Houston, Texas, USA February 13-16.
Nguyen, Q.P., Zitha, P.L.J., and Currie, P.K. (2002). Effect of Foam Films on Gas
Diffusion. Journal of Colloid and Interface Science, 218(2), 467-476. Nguyen, Q.P. (2004). Dynamics of Foam in Porous Media. PhD Dissertation, Delft
University, Netherlands. Nguyen, Q.P., Zitha, P.L.J., and Currie, P.K. (2005). CT study of Liquid Diversion with
Foam. Paper SPE 94764 presented at SPE European Formation Damage Conference. Sheveningen, Netherlands, May 25-25.
Sanz, C.A. and Pope, G.A. (1995). Alcohol-Free Chemical Flooding: From Surfactant
Screening to Coreflood Design. Paper SPE 28956 presented at SPE International Symposium on Oilfield Chemistry. San Antonio, Texas, USA, February 14-17.
Tanzil, D. (2001). Foam Generation and Propagation in Heterogeneous Porous Media.
PhD Dissertation, Rice University, Houston, Texas, USA. Oil and Gas EOR Surveys (2006). Published by Oil and Gas Journal. Pope, G.A. and Nelson, R.C. (1978). A chemical Flooding Compositional Simulator.
SPE J, 18, 339-354. Ransohoff, T.C. and Radke C.J. (1988) Mechanism of foam generation in Glass Bead
Packs. SPERE,3(2),573-585, May . Robinson, S. and Woods, W.W. (1948). J. Soc. Chem. Ind., 67, 361. Roof, J.G. (1970). Snap-off of oil Droplets in Water-Wet Pores. SPE J, 85-90, March 10. Rossen, W.R. (1990). Minimum Pressure Gradient for foam Flow in Porous Media:
Effect of Interactions with Stationary Lamellae. Journal of Colloid and Interface Science. 139(2), 457-468, October.

214
Rossen, W.R. (1996). Foams in Enhanced Oil Recovery. Published in R. K. Prud'homme and S. Khan, ed., Foams: Theory, Measurements and Applications. Marcel Dekker, New York, 413-464.
Rossen, W.R. and Zhou, Z.H. (1995). Modeling Foam Mobility at the Limiting Capillary
Pressure. SPE Adv. Technology, 3, 146-152. Rossen, W.R., and Van Duijn, C.J. (2004). Gravity Segregation in Steady-State
Horizontal Flow in Homogeneous Reservoirs. J. Petr. Sci. Eng. 43, 99-111. Saad, N. (1989). Filed Scale Studies with a 3-D Chemical flooding Simulator. Ph.D
Dissertation. The University of Texas at Austin. Sander, R. (1999). Compilation of Henry's Law Constants for Inorganic and Organic
Species of Potential Importance in Environmental Chemistry (Version 3), http://www.henrys-law.org.
Schramm, L.L. and Wassmuth, F. (1994). Foams: Basic Principles. Article in Foams:
Fundamentals and Applications in the Petroleum Industry, Schramm, L. L., Editor, American Chemical Society, Washington, D. C.
Sorbie, K.S. (1991). Polymer-Improved Oil Recovery, CRC press Inc. Boca Raton,
Florida. Srivastava, M., Zhang, J., Nguyen, Q.P., and Pope, G. A. (2009). A Systematic Study of
Alkali Surfactant Gas Injection as an EOR Technique. Paper SPE 124752 presented at the 2009 SPE Annual Technical Conference and Exhibition.New Orleans, Louisiana, USA, October 4-7.
Talley, L.P. (1988). Hydrolytic Stability of Alkylethoxy Sulfates. SPERE, February. Colloid & Polymer Sci. 65, Tamamushi, B. I. (1978). Progress in Colloid & Polymer Sci. 65, 65(180). Tsau, Jyun-Syung, Heller, John P. (1996). How Can Selective Mobility Reduction of
CO2-Foam Assist in Reservoir Floods. Paper SPE 35168 presented at the Permian Basin Oil and Gas Recovery Conference. Midland, Texas, USA, March 27-29.
Torres, R., Podzimek, M., and Friberg, S.E. (1980). Foam in Microemulsions. I.
Microemulsions with Ionic Surfactants. Colloid and Polymer Science, 258, 855-863.
Wasan, D.T., Lobo, L.A., and Koczo, K. (1992). Effect of oil on Foam Stability:
Aqueous Foams Stabilized by Emulsions. Journal of colloid and Interface Science,150 (2).

215
Wang, L. (2006). MS Thesis. Alkali-Surfactant-Polymer Foams (ASPF): Laboratory
Investigation of Displacement Mechanisms. University of Calgary, Calgary, Alberta, Canada.
Wang, D., Cheng, J., Yang, Z., Li, Q., Wu, W., and Yu, H. (2001). Successful Field Test
of the First Ultra-Low Interfacial Tension Foam Flood. Paper SPE 72147 presented at the Improved Oil Recovery. Kuala Lumpur, Malaysia, October 8-9.
Yan, W. (2006). Foam for Mobility Control on Alkaline/Surfactant Enhanced Oil
Recovery Process. Ph.D Dissertation, Rice University, Houston, Texas, USA. Yortos, Y.C. and Chang, J. (1990). Capillary Effects in Steady State Flow in
Heterogeneous Cores. Transport in Porous Media, 5, 399-420. Zhang, L.D. and Hirasaki, G. J. (2006). Favorable Attributes of Alkali-Surfactant-
Polymer Flooding. Paper SPE 99744 presented at the Symposium of Improved Oil Recovery. Tulsa, Oklahoma, USA, April 22-26.
Zhang, J., Nguyen, Q. P., Flaaten, A. K., and Pope, G. A. (2008). Mechanisms of
Enhanced Natural Imbibation with Novel Chemicals. Paper SPE 113453 presented at the Improved Oil Recovery Symposium. Tulsa, Oklahoma, USA, April 21-23.
Zhao, P. Jackson, A., Britton, C., Kim, D., Britton, L.N., Levitt, D.B., and Pope,
G.A.(2008) Development of High Performance Surfactants for Difficult Oils. Paper SPE 113432, Oklahoma, USA, April 19-23.

216
VITA
Mayank Srivastava, the son of Bipin Bihari Srivastava and Usha Srivastava, was
born in Lucknow, India on October 3, 1977. He graduated with a Bachelor of Technology
degree in Mining Engineering from Indian School of Mines in June, 2000. He received a
Master of Science degree in Mining and Civil Engineering from Southern Illinois
University Carbondale in 2005. In June 2006, he enrolled in the graduate school at the
University of Texas at Austin to pursue a Ph.D degree in the Department of Petroleum
Engineering.
Permanent Address: C-21. Sector-C, Aliganj, Lucknow, Uttar Pradesh-226024, India.
This dissertation was typed by the author.