copyright by kristie dorothy chin 2015
TRANSCRIPT

Copyright
by
Kristie Dorothy Chin
2015
The Thesis Committee for Kristie Dorothy Chin
Certifies that this is the approved version of the following thesis:
Communicating Value to Stakeholders:
A Customer-Oriented KPI System for State DOTs
APPROVED BY
SUPERVISING COMMIDOTTEE:
Charles Michael Walton
Shelley Row
Supervisor:
Communicating Value to Stakeholders:
A Customer-Oriented KPI System for State DOTs
by
Kristie Dorothy Chin, AB HX Art & Arch; ScB & AB Eng; MArch
Thesis
Presented to the Faculty of the Graduate School of
The University of Texas at Austin
in Partial Fulfillment
of the Requirements
for the Degree of
Master of Science in Engineering
The University of Texas at Austin
December 2015

Dedication
To those who have made a world of difference in my life,
you inspire me to make a difference in the world.

v
Acknowledgements
For his continued support of my M.S./Ph.D. studies and related research for the
Texas Technology Task Force, I would like to express my sincere gratitude to my advisor
Dr. C. Michael Walton. His deep understanding of the relationships between policy and
transportation has underscored the importance of interdisciplinary work. I would also like
to recognize Shelley Row for guiding me throughout this process. Her expertise was key
to ensuring the translation of technical topics resonated with the respective stakeholders.
The insights she generously shared are deeply appreciated and have encouraged me to
pursue transportation in new contexts.
Furthermore, I would like to personally thank the following people: J.D. Stanley,
Commissioner Victor Vandergriff, Darran Anderson, Stacey Strittmatter, Kent Marquardt,
Yvette Flores, Amy Hawk, Kayleigh Axtell, Trent Thomas, Cory Henrickson, Bob
Kaufman, Jess Blackburn, Dana Glover, Dr. Randy Machemehl, and Andrea Gold for
sharing their time and perspectives. Special thanks to Vicki Simpson, who has diligently
provided assistance. Through the knowledge and expertise of this great team, this research
on developing a customer-oriented key performance indicator framework will serve as a
valuable reference document for the Texas Department of Transportation.

vi
Abstract
Communicating Value to Stakeholders:
A Customer-Oriented KPI System for State DOTs
Kristie Dorothy Chin, M.S.E.
The University of Texas at Austin, 2015
Supervisor: Charles Michael Walton
With the erosion of public trust, increasing shortfalls in funding, and continuous
forces of disruption, State Departments of Transportation (DOTs) can no longer afford to
rely upon traditional models of performance management that address all stakeholder
concerns with a single approach. A customer-oriented key performance indicator (KPI)
system offers a new paradigm and is based upon stakeholder segmentation and mapping.
The value of this system rests in its ability to communicate the right information to the
right decision-makers by aligning the customer’s needs with the organization’s mission
and other stakeholder priorities. This thesis synthesizes best practices used within and
outside the transportation industry in order to propose a recommended customer-oriented
KPI system for the Texas Department of Transportation (TxDOT). Feedback is collected
from each stakeholder group in an effort to validate the methodology. Results indicate the
customer-oriented KPI system is preferred over the current performance report for its
clarity, accessibility, and relevance.

vii
Table of Contents
List of Tables ...........................................................................................................x
List of Figures ........................................................................................................ xi
Chapter 1: Introduction ............................................................................................1
1.1 Problem Statement ....................................................................................2
1.2 Value Proposition......................................................................................3
1.3 Thesis Summary ........................................................................................3
Chapter 2: Background & Literature Review ..........................................................4
2.1 Motivation to Use Key Performance Indicators (KPIs) ............................4
2.1.1 Operational: Executing More Efficiently and Effectively ............5
2.1.2 Tactical: Improving Short-Range Decision Making .....................6
2.1.3 Strategic: Defining Agency Direction ..........................................8
2.1.4 Compliant: Demonstrating Transparency, Accountability, and Credibility ...................................................................................10
2.1.5 Influential: Encouraging Changes in Perception and Behavior ..12
2.2 Drivers of Change that Impact KPIs .......................................................14
2.2.1 Political .......................................................................................15
2.2.2 Institutional .................................................................................18
2.2.3 Cultural .......................................................................................19
2.2.4 Technological ..............................................................................20
2.2.5 Financial ......................................................................................21
2.3 Key Stakeholder Groups .........................................................................22
2.3.1 State DOT Executives .................................................................24
2.3.2 State Legislators and Governors .................................................24
2.3.3 Businesses ...................................................................................25
2.3.4 General Public .............................................................................26
2.4 First Principles of Performance Management .........................................28
2.4.1 What is “key”? ............................................................................28
2.4.2 Selecting Key Performance Indicators ........................................29
viii
2.4.2.1 Strategic ..........................................................................29
2.4.2.2 Measurable ......................................................................30
2.4.2.3 Accessible .......................................................................30
2.4.2.4 Relevant ..........................................................................31
2.4.2.5 Tangible ..........................................................................31
2.4.3 Communicating Key Performance Measures .............................32
2.4.3.1 Dashboards ......................................................................33
2.4.3.2 Reports and Scorecards ...................................................36
2.4.3.3 Traditional Media............................................................37
2.4.3.4 Websites ..........................................................................37
2.4.3.5 Open Data Portals ...........................................................39
2.4.3.6 Social Media ...................................................................39
2.5 The Evolution of Performance Management ..........................................40
2.5.1 First Generation: Traditional Infrastructure & Organizational Measurement ...............................................................................40
2.5.2 Second Generation: Hierarchy of Measurement .........................41
2.5.3 Third Generation: Catalyst-Driven Adaptation ..........................42
2.5.4 Fourth Generation: Customer-Oriented Paradigm ......................43
Chapter 3: Customer-Oriented KPI Development Approach ................................45
3.1 Performance Management Context in the State of Texas .......................46
3.1.1 Political Pressure .........................................................................47
3.1.2 Institutional Changes and Initiatives ...........................................49
3.1.3 Cultural Transformations and State of Public Trust ...................52
3.1.4 Technological Advancements .....................................................54
3.1.5 Financial Limitations ..................................................................56
3.2 Customer-Oriented KPI Framework Proposal for TxDOT ....................58
3.2.1 Stakeholder Profile: General Public ............................................59
3.2.1.1 Ask ..................................................................................59
3.2.1.2 Urban Customer Experience ...........................................59
3.2.1.3 Value Proposition............................................................60

ix
3.2.1.4 Proposed KPIs .................................................................61
3.2.2 Stakeholder Profile: State Legislator ..........................................62
3.2.2.1 Ask ..................................................................................62
3.2.2.2 Customer Experience ......................................................62
3.2.2.3 Value Proposition............................................................65
3.2.2.4 Proposed KPIs .................................................................66
3.2.3 Stakeholder Profile: Small Business ...........................................67
3.2.3.1 Ask ..................................................................................67
3.2.3.2 Customer Experience ......................................................67
3.2.2.3 Value Proposition............................................................68
3.2.3.4 Proposed KPIs .................................................................69
3.3 Analysis...................................................................................................70
3.3.1 TxDOT Leadership .....................................................................70
3.3.2 Public ..........................................................................................70
3.3.3 State Legislature ..........................................................................71
3.3.4 Businesses ...................................................................................71
Chapter 4: Recommendations ................................................................................72
4.1 Less is More ............................................................................................72
4.2 Design from the Outside In .....................................................................72
4.3 Power of Personalization ........................................................................73
4.4 Empower Stakeholders ...........................................................................73
4.5 Evolve or Risk Being Left Behind ..........................................................73
Chapter 5: Conclusion............................................................................................74
Appendix A: State DOT Scorecard Examples .......................................................75
Appendix B: TxDOT Stakeholder Profile Examples .............................................86
Bibliography ..........................................................................................................90
x
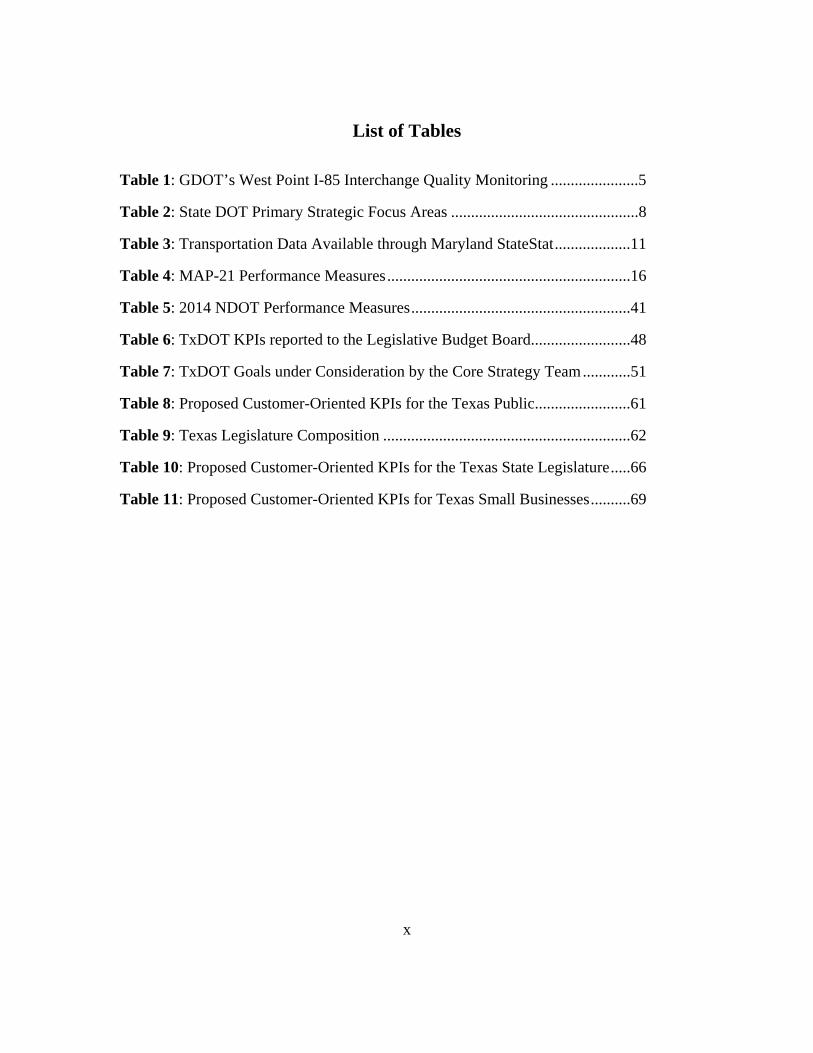
List of Tables
Table 1: GDOT’s West Point I-85 Interchange Quality Monitoring ......................5
Table 2: State DOT Primary Strategic Focus Areas ...............................................8
Table 3: Transportation Data Available through Maryland StateStat ...................11
Table 4: MAP-21 Performance Measures .............................................................16
Table 5: 2014 NDOT Performance Measures .......................................................41
Table 6: TxDOT KPIs reported to the Legislative Budget Board.........................48
Table 7: TxDOT Goals under Consideration by the Core Strategy Team ............51
Table 8: Proposed Customer-Oriented KPIs for the Texas Public ........................61
Table 9: Texas Legislature Composition ..............................................................62
Table 10: Proposed Customer-Oriented KPIs for the Texas State Legislature .....66
Table 11: Proposed Customer-Oriented KPIs for Texas Small Businesses ..........69
xi
List of Figures
Figure 1: Motivational Types of KPIs ....................................................................4
Figure 2: NCDOT Pre-Construction Project Status Dashboard KPIs ....................7
Figure 3: VDOT Trends for Transit Performance Indicators .................................9
Figure 4: ODOT KPI to Support Stewardship Goal .............................................10
Figure 5: Drivers of Change that Impact KPIs .....................................................14
Figure 6: WSDOT Performance Management Framework ..................................23
Figure 7: VDOT Performance Dashboard ............................................................33
Figure 8: UDOT Zero Fatalities Dashboard .........................................................34
Figure 9: Open Michigan Infrastructure Dashboard Sample ................................34
Figure 10: DOT&PF Dashboard Sample ..............................................................35
Figure 11: DelDOT Dashboard Sample ................................................................35
Figure 12: TxDOT Performance Results Summary Sample ................................38
Figure 13: Drivers of Change that Impact KPIs in Texas .....................................46
Figure 14: FDOT 2014 Performance Highlights ..................................................75
Figure 15A: CalTrans 2015 Q2 Mile Markers ......................................................76
Figure 15B: CalTrans 2015 Q2 Mile Markers ......................................................77
Figure 16A: MDOT 2015 MiScorecard Performance Summary ..........................78
Figure 16B: MDOT 2015 MiScorecard Performance Summary ..........................79
Figure 17A: MnDOT 2014 Transportation Results Scorecard .............................80
Figure 17B: MnDOT 2014 Transportation Results Scorecard .............................81
Figure 18A: ODOT 2015 Key Performance Measures ........................................82
Figure 18B: ODOT 2015 Key Performance Measures .........................................83
Figure 19A: VDOT 2015 Q4 Quarterly Report ....................................................84
xii
Figure 19B: VDOT 2015 Q4 Quarterly Report ....................................................85
Figure 20: Proposed TxDOT Stakeholder Profile for General Public ..................86
Figure 21: Proposed TxDOT Stakeholder Profile for State Legislature ...............87
Figure 22: Proposed TxDOT Stakeholder Profile for Small Business .................88
Figure 23: Proposed TxDOT KPI Report for Individual Commuter ....................89

1
Chapter 1: Introduction
With the erosion of public trust, increasing shortfalls in funding, and continuous
forces of disruption, State DOTs can no longer afford to rely upon traditional models of
performance management that address all stakeholder concerns with a single approach.
Conventional key performance indicator (KPI) systems are often complex, incoherent,
irrelevant, abstract, and disconnected from the organization’s strategic plan. The more
successful systems include an accompanying communications strategy, however it is rarely
tailored to the needs of specific stakeholder groups nor formatted to effectively influence
the respective stakeholder’s decision-making process. Furthermore, an infrastructure-
biased culture may be ingrained throughout the organization and in the public mindset to a
point where the agency struggles to overcome the inertia needed to advance multimodal
initiatives. Transportation agencies seeking to evolve their performance management
systems will need to overcome these challenges in order to prepare for the disruptions that
are taking place in the transportation sector.
Advances in technology enable transportation agencies to understand the customer
and the transportation experience at unprecedented levels of detail. By focusing on the
customer’s needs, State DOTs can develop a KPI system that aligns with the organization’s
mission and other stakeholder priorities. Customized communication strategies can build
awareness within each stakeholder group and constructively influence the decision-making
process. Potential benefits of a customer-oriented KPI system include improved
stakeholder engagement, budget justification, and the opportunity to incentivize changes
in travel behavior. This thesis contributes to the advancement of performance management
systems by demonstrating how customer segmentation and mapping may be applied as
effective strategies for communicating value to stakeholders.
2
1.1 PROBLEM STATEMENT
The conventional approach to performance management is ineffective – internal
and external priorities are often misaligned, measures are too complex, information is not
readily available, the data has limited meaning, and results are reported at a scale that is
considered too abstract. State DOTs have a tendency to concentrate on cascading KPIs
from strategic levels to internal operations of the organization; however, it is ultimately the
external stakeholders that provide trust, support, and funding. The states where funding
initiatives are defeated – such as the 2015 legislative plans in South Carolina, Tennessee,
and New Mexico – suffer from lack of trust, transparency, and accountability
(Transportation for America, 2015). Traditionally, performance management systems have
been designed from the inside out. This approach, however, has led to disconnects between
the agency and its stakeholders due to a lack of perspective and the inability to translate
technical needs into valuable, actionable decisions. As a result, a stakeholder is often
overwhelmed with an excess of irrelevant information – often paralyzing him from being
able to make the right decision within the right time frame (Turnbull, 2014).
3
1.2 VALUE PROPOSITION
Customer-oriented KPIs, on the other hand, empower the stakeholder to not only
make the right decision within the right time frame, but also to become an ambassador for
the agency. When properly designed, KPIs can be used to construct powerful narratives
that can influence stakeholders towards positive action. If steady progress is made towards
the stated goals, agencies will improve their public image and political position. The
integrity of the State DOT then becomes the basis for voters and legislators to approve
funding for transportation. The selection, organization, and presentation of KPIs can make
the difference between whether a State DOT is perceived as successful or incompetent. By
framing KPIs within the unique context of each stakeholder group, State DOTs can build
trust, garner support, and increase funding.
1.3 THESIS SUMMARY
This thesis synthesizes best practices from within and outside the transportation
industry based upon a series of key person interviews, analysis of existing State DOT
frameworks, and an assessment of stakeholder engagement tools. Chapter 2 describes the
principles of selecting and communicating KPIs as well as existing and proposed
methodologies. Chapter 3 describes the performance management context in the state of
Texas, generates three sample customer-oriented KPI frameworks for the Texas
Department of Transportation (TxDOT), and analyzes the feedback from each stakeholder
group to compare the proposed framework with the existing reporting techniques. Chapter
4 synthesizes the stakeholder feedback into a set of recommended best practices for State
DOTs seeking to implement customer-oriented KPI frameworks. Chapter 5 concludes by
summarizing the challenges and opportunities of performance management at the State
DOT level and suggests areas of future research.
4
Chapter 2: Background & Literature Review
2.1 MOTIVATION TO USE KEY PERFORMANCE INDICATORS (KPIS)
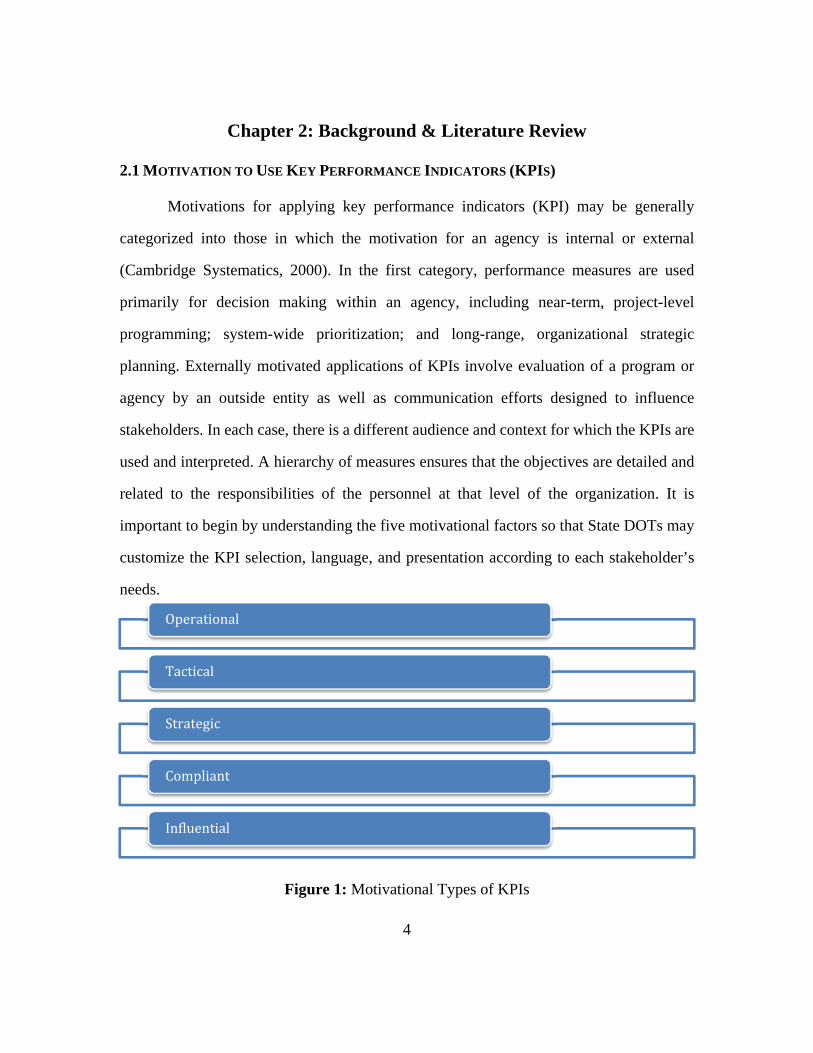
Motivations for applying key performance indicators (KPI) may be generally
categorized into those in which the motivation for an agency is internal or external
(Cambridge Systematics, 2000). In the first category, performance measures are used
primarily for decision making within an agency, including near-term, project-level
programming; system-wide prioritization; and long-range, organizational strategic
planning. Externally motivated applications of KPIs involve evaluation of a program or
agency by an outside entity as well as communication efforts designed to influence
stakeholders. In each case, there is a different audience and context for which the KPIs are
used and interpreted. A hierarchy of measures ensures that the objectives are detailed and
related to the responsibilities of the personnel at that level of the organization. It is
important to begin by understanding the five motivational factors so that State DOTs may
customize the KPI selection, language, and presentation according to each stakeholder’s
needs.
Figure 1: Motivational Types of KPIs
Operational
Tactical
Strategic
Compliant
Influential

5
2.1.1 Operational: Executing More Efficiently and Effectively
Operational KPIs include the most detail and focus on day-to-day improvement
opportunities in the field. Operational KPIs assist project managers and division heads in
monitoring immediate project-level and system-wide progress. Table 1 shows an example
of operational KPIs used to monitor the quality of Georgia DOT’s (GDOT) Interstate 85
Interchange project. The interface between the two levels must be aligned so that the
decisions at the site-specific level are consistent with those at the system-wide level. For
example, a decision to repair the pavement in an individual district should be consistent
with a system-wide priority program of preserving the state’s existing transportation
system. Factors that impact the selection of operational KPIs include standards and
specifications, budget limitations, and environmental constraints as well as agency
policies, financing, and human resource decisions.
Table 1: GDOT’s West Point I-85 Interchange Quality Monitoring
Performance Objective KPIs Targets 1. Promote Efficient System Management and Operation
Pavement Sound
Intensity Testing Results
HfL goal of 96.0 dB(A) or
less for all paved surfaces
2. Emphasize the Preservation of the Existing Transportation System
Pavement Smoothness
HfL goal of 43.8 in/mi (IRI) or less for all paved surfaces
Smoothness index of 900 or less for new construction
Smoothness index of 1,025 or less for corrective work
Profile index of 30 in/mi or less for bridge approaches
Hot-Mix Asphalt (HMA) Quality
HMA concrete thickness measurements
HMA concrete spread rates
IRI: International Roughness Index Source: Molenaar & Navarro, 2011
6
2.1.2 Tactical: Improving Short-Range Decision Making
Tactical KPIs focus on short-range planning and are designed to improve the
decision-making process of middle management. Short range is generally defined as a
period of time extending about one year or less in the future. Managers use tactical planning
to outline the actions various parts of the agency must do for the organization to be
successful. For example, the Office of Investment Management at Minnesota DOT
(MnDOT) develops plans and performance reports that reflect a performance-based
approach to planning and investment management (FHWA, 2011). This includes the
annual update of the four-year Statewide Transportation Improvement Program (STIP) and
capital program development processes. Transportation system and agency performance
reports are regularly reviewed by MnDOT management to actively guide decision-making.
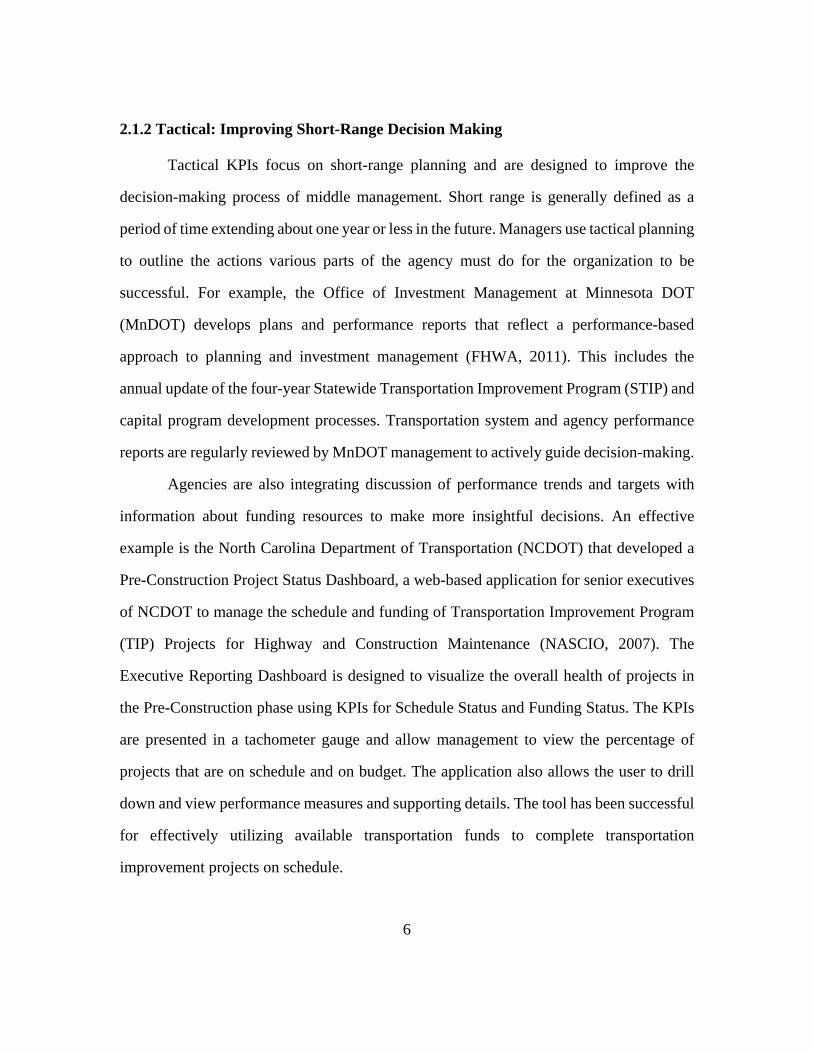
Agencies are also integrating discussion of performance trends and targets with
information about funding resources to make more insightful decisions. An effective
example is the North Carolina Department of Transportation (NCDOT) that developed a
Pre-Construction Project Status Dashboard, a web-based application for senior executives
of NCDOT to manage the schedule and funding of Transportation Improvement Program
(TIP) Projects for Highway and Construction Maintenance (NASCIO, 2007). The
Executive Reporting Dashboard is designed to visualize the overall health of projects in
the Pre-Construction phase using KPIs for Schedule Status and Funding Status. The KPIs
are presented in a tachometer gauge and allow management to view the percentage of
projects that are on schedule and on budget. The application also allows the user to drill
down and view performance measures and supporting details. The tool has been successful
for effectively utilizing available transportation funds to complete transportation
improvement projects on schedule.

7
Figure 2: NCDOT Pre-Construction Project Status Dashboard KPIs (Source: NASCIO, 2007)

8
2.1.3 Strategic: Defining Agency Direction
Strategic KPIs enable agency leadership to set priorities and define direction. They
serve as a critical pivot point by connecting the internal agency needs with those of its
external stakeholders. Executive leaders also use performance management to focus their
staff and hold them accountable. Generally three to seven strategic focus areas are selected
from the themes in Table 2:
Table 2: State DOT Primary Strategic Focus Areas
Strategic Focus Area Sample DOTs 1. Safety & Security
Caltrans, FDOT, GDOT, MDOT, MoDOT, ODOT, TxDOT, UDOT, VDOT, WSDOT
2. Economic Vitality or Competitiveness
Caltrans, FDOT, MoDOT, ODOT, WSDOT
3. Fiscal Stewardship
Caltrans, MDOT, MoDOT, ODOT, VDOT, WSDOT
4. Environment & Sustainability
Caltrans, FDOT, ODOT, WSDOT
5. Livability, Health, & Quality of Life
Caltrans, FDOT, ODOT
6. Preservation & Maintenance
FDOT, GDOT, MDOT, MoDOT, ODOT, TxDOT, UDOT, VDOT, WSDOT
7. Planning, Construction, & Project Delivery
GDOT, MoDOT, TxDOT
8. Mobility, Operations, & System Performance
Caltrans, FDOT, MDOT, ODOT, TxDOT, UDOT, VDOT, WSDOT
9. Organizational Excellence & Management
Caltrans, VDOT
10. Customer Service MDOT, MoDOT. VDOT
9
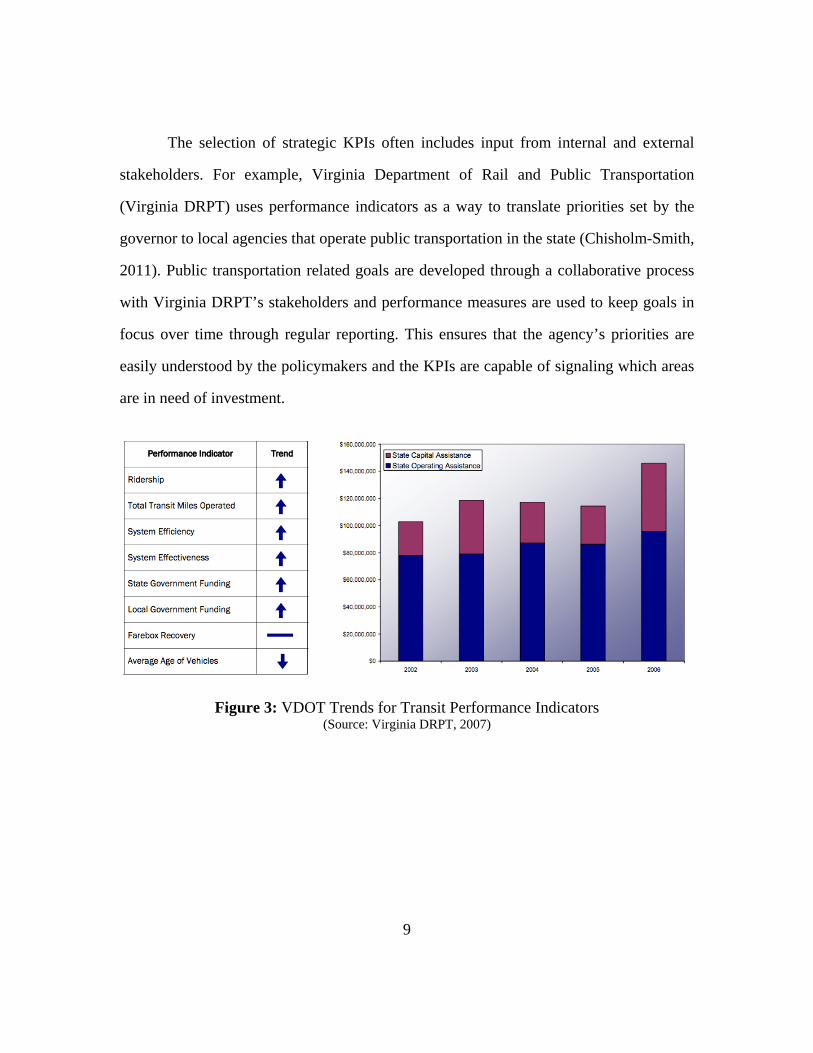
The selection of strategic KPIs often includes input from internal and external
stakeholders. For example, Virginia Department of Rail and Public Transportation
(Virginia DRPT) uses performance indicators as a way to translate priorities set by the
governor to local agencies that operate public transportation in the state (Chisholm-Smith,
2011). Public transportation related goals are developed through a collaborative process
with Virginia DRPT’s stakeholders and performance measures are used to keep goals in
focus over time through regular reporting. This ensures that the agency’s priorities are
easily understood by the policymakers and the KPIs are capable of signaling which areas
are in need of investment.
Figure 3: VDOT Trends for Transit Performance Indicators (Source: Virginia DRPT, 2007)

10
2.1.4 Compliant: Demonstrating Transparency, Accountability, and Credibility
Compliant KPIs satisfy requirements imposed by external entities, such as state and
federal legislatures, federal agencies, and professional organizations. Legislative
requirements often prescribe categories of measures or specific measures that must be used,
as well as reporting methods and frequency. Such external evaluations are often linked to
peer comparisons, agency audits, and budget allocations. For example, Oregon DOT is
legislatively mandated to produce an Annual Performance Progress Report that features
“Key Performance Measures” specified by the legislature (Chisholm-Smith, 2011). Figure
3 shows an example of a KPI that supports ODOT’s “Stewardship” goal to “Maximize
Value from Transportation Investments.” “On-Time” and “On-Budget” KPIs are most
effective for demonstrating fiscal responsibility. In Minnesota, early efforts using public
transportation performance measures focused on demonstrating progress toward a
legislatively mandated performance target of public transportation service for all counties.
MnDOT cites increased trust as one of the primary benefits of its KPI program, stating that
its efforts help elected officials view MnDOT as a trusted partner and work together on
challenging issues (MnDOT, 2014). Although these processes are often compulsory, State
DOTs have the ability to frame compliant KPIs within a context that demonstrates
transparency and accountability, ultimately engendering trust.
Figure 4: ODOT KPI to Support Stewardship Goal
(Source: Oregon, 2014)
11
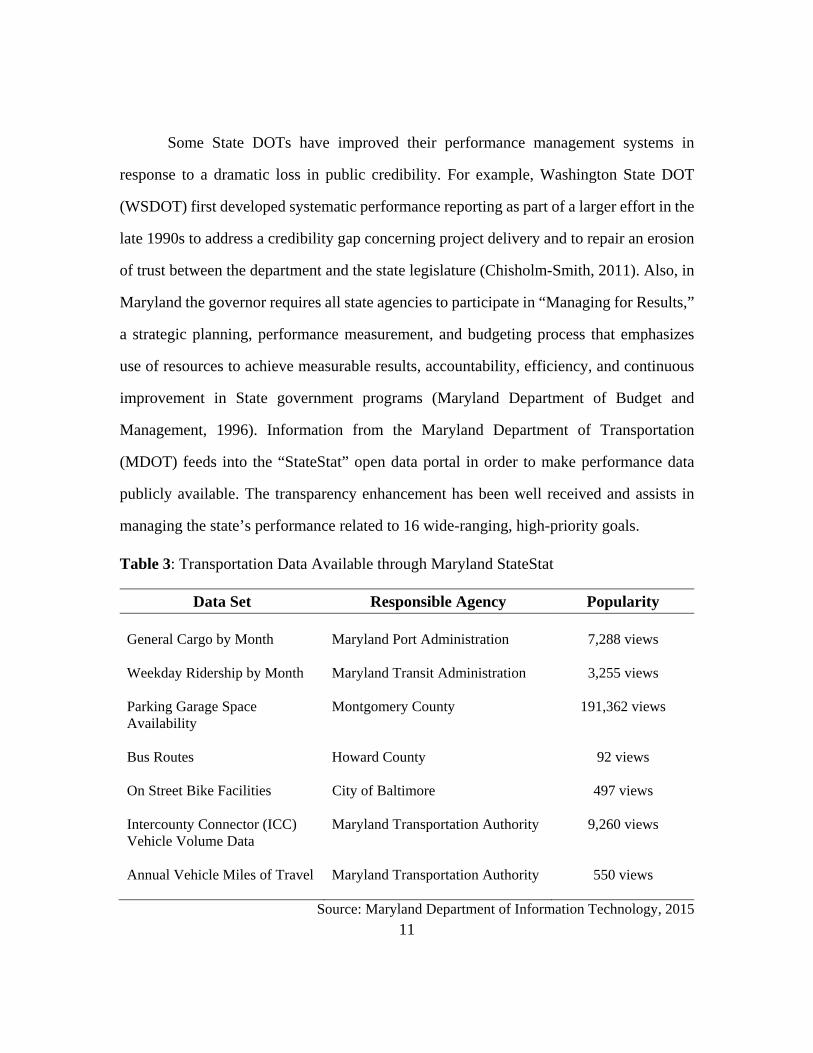
Some State DOTs have improved their performance management systems in
response to a dramatic loss in public credibility. For example, Washington State DOT
(WSDOT) first developed systematic performance reporting as part of a larger effort in the
late 1990s to address a credibility gap concerning project delivery and to repair an erosion
of trust between the department and the state legislature (Chisholm-Smith, 2011). Also, in
Maryland the governor requires all state agencies to participate in “Managing for Results,”
a strategic planning, performance measurement, and budgeting process that emphasizes
use of resources to achieve measurable results, accountability, efficiency, and continuous
improvement in State government programs (Maryland Department of Budget and
Management, 1996). Information from the Maryland Department of Transportation
(MDOT) feeds into the “StateStat” open data portal in order to make performance data
publicly available. The transparency enhancement has been well received and assists in
managing the state’s performance related to 16 wide-ranging, high-priority goals.
Table 3: Transportation Data Available through Maryland StateStat
Data Set Responsible Agency Popularity General Cargo by Month
Maryland Port Administration
7,288 views
Weekday Ridership by Month Maryland Transit Administration 3,255 views
Parking Garage Space Availability
Montgomery County 191,362 views
Bus Routes
Howard County 92 views
On Street Bike Facilities City of Baltimore 497 views Intercounty Connector (ICC) Vehicle Volume Data
Maryland Transportation Authority 9,260 views
Annual Vehicle Miles of Travel Maryland Transportation Authority 550 views
Source: Maryland Department of Information Technology, 2015
12
2.1.5 Influential: Encouraging Changes in Perception and Behavior
Influential KPIs are proactive in nature and encourage changes in the perceptions
and behaviors of external stakeholders. More than building awareness, influential KPIs
actively educate and engage with the stakeholder. For example, Google Now is capable of
learning about a user and his or her habits in order to provide relevant notifications (Google
Now, 2015). Based upon previous movements and searches, Google Now can inform the
user of his or her “Time to Work,” including real-time traffic and weather information.
This information provides value by empowering the user to make an informed decision
regarding his or her departure time, route selection, mode choice, or even telecommute
options.
When coupled with incentives, influential KPIS are capable of driving even greater
changes. Metropia is an app system that incentivizes commuters to choose departure times,
routes, and modes that help reduce and eliminate traffic congestion (Metropia, 2015).
Using an active demand management and data analytics platform, Metropia effectively
influences behavior through a social rewards-based ecosystem. Each user can track his or
her CO2 emissions, travel time saved, and driving score. Drivers earn points each time they
make smarter commute decisions based on Metropia’s suggestions, which can then be
redeemed for perks such as gift cards, discounts, and local retailer offers. During beta
testing in Austin with the Central Texas Regional Mobility Authority (CTRMA), Metropia
drivers saved 8,550 pounds of CO2, 211 hours in travel time, and planted 85 trees through
Metropia’s partnership with American Forests (Metropia, 2015). The company is also
partnering with local businesses to encourage flex scheduling among their employees.
Metropia helps employers measure the extent to which employees are meeting flex
schedule goals and alleviating peak hour congestion.

13
Influential KPIs may also be used to build the agency brand, which is important to
manage the perception of the State DOT and ultimately garner support. In particular, State
DOTs should seek to understand customer awareness, attitude, and habits. Knowing the
percentage and types of customers who recognize a brand enable the State DOT to focus
its campaign strategies. This becomes especially important when a State DOT wants to
differentiate itself from other state, regional, or local transportation agencies. By measuring
a customer’s belief or response to the agency brand, State DOTs can gauge the attitudes of
its customer base. If a State DOT wishes to be perceived as a leader, innovator, and good
steward of public funds, its KPI system should reflect these values. If customers, on the
other hand, consider the State DOT to be a follower, traditionalist, and fiscally
irresponsible, the State DOT should understand why there is a discrepancy between
perception and reality and work to bridge the gap in order to restore trust and integrity.
Analyzing customer habits can reveal patterns between a communications strategy
and responses in customer behavior. For example, the Ad Council’s “Buzzed Driving Is
Drunk Driving Campaign” that was launched in December 2005 successfully contributed
to saving lives (Ad Council, 2011). Performance metrics included: Opinion of the
Campaign, Importance of the Issue, Behaviors over the Holiday Season, and Ad
Effectiveness. In early January 2007, 17% of men age 21-34 said that in the past few weeks
they had decided to not drive after they had been drinking. Those who were aware of the
“Buzzed Driving” campaign were significantly more likely to report that they had recently
refrained from driving after drinking, stopped an impaired friend or family member from
driving, and discussed the risks of impaired driving with friends or family members. While
the public service announcements cannot claim to be the sole motivating factor behind
these behaviors, it is likely they played a large role.

14
2.2 DRIVERS OF CHANGE THAT IMPACT KPIS
State DOTs are operating in an environment of disruptive change, impacting how
agencies organize their performance measures and management processes. These include
leadership changes; legislative mandates; advances in technology; shifts in the customer
base; and funding stipulations. In order to develop a robust KPI system, it is imperative for
State DOTs to respond to, anticipate, and balance a variety of stakeholder priorities.
Figure 5: Drivers of Change that Impact KPIs
KPIs
Political
Institutional
CulturalTechnological
Financial

15
2.2.1 Political
Legislative oversight refers to the review and evaluation of selected executive
branch programs and activities, often creating political pressure to implement performance
reporting or enhance efforts in certain areas. Oversight takes place through many
mechanisms: legislative mandates, committee oversight, DOT leadership appointments,
review of administrative rules and regulations, program evaluation and sunset reviews,
reporting requirements, and requests for information (Rall et al., 2011). Most states use a
combination or all of these tools. The budget and appropriations process also includes
oversight activities, and in many cases is seen as the main forum for legislative oversight
of the DOT.
Legislative mandates for performance measurement and benchmarking can be
particularly challenging. When statutory requirements prescribe specific agency measures
or benchmarks, they may not be targeted to agency functions or management needs and are
difficult to refine or abandon once legislated (Bremmer et al., 2004). Data tracking and
reporting processes can consume valuable resources while the measures and its associated
data may lend little help to legislative bodies and the agency in managing programs more
efficiently. Agencies may not be able to influence such mandates, but legislative bodies
should be encouraged to give an agency flexibility in selecting measures or revising
measures if they do not prove useful. Agencies should also consider offering voluntary
performance reports to preempt such statutory requirements.
The Moving Ahead for Progress in the 21st Century Act (MAP-21) is the surface
transportation funding authorization. A key feature of MAP-21 is the establishment of a
performance- and outcome-based program for States to invest resources in projects that
collectively will make progress toward the achievement of the national goals (FHWA,
2013). National goal areas include: safety, infrastructure condition, congestion reduction,
16
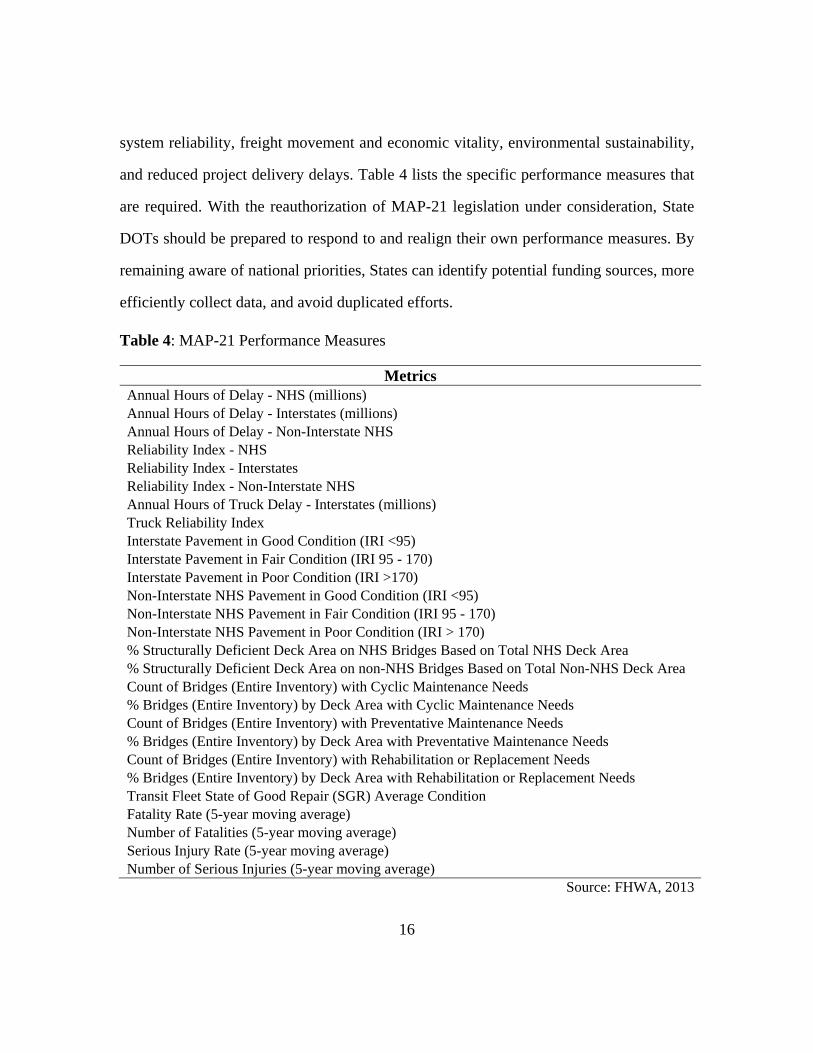
system reliability, freight movement and economic vitality, environmental sustainability,
and reduced project delivery delays. Table 4 lists the specific performance measures that
are required. With the reauthorization of MAP-21 legislation under consideration, State
DOTs should be prepared to respond to and realign their own performance measures. By
remaining aware of national priorities, States can identify potential funding sources, more
efficiently collect data, and avoid duplicated efforts.
Table 4: MAP-21 Performance Measures
Metrics Annual Hours of Delay - NHS (millions) Annual Hours of Delay - Interstates (millions) Annual Hours of Delay - Non-Interstate NHS Reliability Index - NHS Reliability Index - Interstates Reliability Index - Non-Interstate NHS Annual Hours of Truck Delay - Interstates (millions) Truck Reliability Index Interstate Pavement in Good Condition (IRI <95) Interstate Pavement in Fair Condition (IRI 95 - 170) Interstate Pavement in Poor Condition (IRI >170) Non-Interstate NHS Pavement in Good Condition (IRI <95) Non-Interstate NHS Pavement in Fair Condition (IRI 95 - 170) Non-Interstate NHS Pavement in Poor Condition (IRI > 170) % Structurally Deficient Deck Area on NHS Bridges Based on Total NHS Deck Area % Structurally Deficient Deck Area on non-NHS Bridges Based on Total Non-NHS Deck Area Count of Bridges (Entire Inventory) with Cyclic Maintenance Needs % Bridges (Entire Inventory) by Deck Area with Cyclic Maintenance Needs Count of Bridges (Entire Inventory) with Preventative Maintenance Needs % Bridges (Entire Inventory) by Deck Area with Preventative Maintenance Needs Count of Bridges (Entire Inventory) with Rehabilitation or Replacement Needs % Bridges (Entire Inventory) by Deck Area with Rehabilitation or Replacement Needs Transit Fleet State of Good Repair (SGR) Average Condition Fatality Rate (5-year moving average) Number of Fatalities (5-year moving average) Serious Injury Rate (5-year moving average) Number of Serious Injuries (5-year moving average)
Source: FHWA, 2013

17
Performance audits are designed to promote confidence and accountability in state
government through professional and independent assessment of state agencies and
activities, consistent with legislative intent. State DOTs need to understand the
requirements of state performance audits in order to proactively address gaps in current
performance procedures. In Georgia, the Georgia State Department of Audits and Accounts
(DOAA) conducts evaluations of state funded programs and activities to answer such
questions as: 1) Is this program achieving its goals and objectives? 2) How well does this
program do what it is intended to do? and 3) Is this program complying with all applicable
laws and regulations? (Amekudzi, 2011). Other State DOTs that have had early
experiences with some type of performance audit or performance review include Texas,
Delaware, California, Washington, New Mexico, Michigan, Kentucky, and Colorado
(Bremmer et al., 2004).
Sunset reviews evaluate the functions of a state entity to assess whether it should
continue to exist, and if so, how the agency can work better to save taxpayer money. In a
true sunset process, an entity is automatically abolished unless the legislature or responsible
legislative committee chooses to affirmatively continue it. Arizona, Florida, Louisiana,
Tennessee, and Texas perform regular sunset reviews of the DOT (Rall et al., 2011). In
most cases when the sunset process is applied, it is used primarily to add another layer of
accountability rather than to seriously consider their discontinuation. State DOTs should
work closely with legislators considering new investments to instill confidence in agency
decision-processes and results. In states where funding increases or fiscal management and
credibility issues take center stage, strategic KPIs should transform to address specific
needs and compliant KPIs should assist in strengthening the State DOT’s political position.

18
2.2.2 Institutional
Leadership changes at the executive levels of a State DOT can significantly alter
the agency’s performance measurement process. Depending on the incoming leader’s
background, he or she will have different motivations for implementing KPIs. While some
leaders may prioritize compliant KPIs to build credibility, others may emphasize tactical
KPIs to improve management decision-making. Although this may lead to fundamental
changes in performance measurement, it is important that the agency’s KPIs match the
sensibilities and experiences of the leadership. State DOTs that undergo frequent
leadership turnover should anticipate such changes and be prepared to make adjustments
accordingly. The process and measurement framework should have the flexibility to
quickly adapt to or incorporate new requirements.
VDOT has a sophisticated performance measurement system that was put in place
by former Commissioner Philip A. Shucet (Padgette, 2006). Prior to his arrival at VDOT,
no evaluation existed to measure internal agency performance, nor was any effort made to
disseminate information to the public. In establishing VDOT’s Dashboard system, Shucet
sought a means to communicate information in a way that the public could understand and
would serve employees as they managed and executed project delivery. The Dashboard is
a successful top-down initiative that provides a platform to measure, monitor, evaluate, and
report performance to the public and external stakeholders.
KPIs may also be used to establish a performance-driven culture within the
organization. Missouri DOT (MoDOT) launched a program in 2006 that is designed to
reward employee achievements. The Performance Plus program is designed to compensate
MoDOT employees up to $2,000 annually for going above and beyond normal duty to
increase agency productivity (MoDOT, 2007). It began with a pilot project to compensate
construction project office employees for achieving a final construction cost of one percent

19
or less above the contract award amount on projects in the STIP. The pilot program’s
success paved the way for Performance Plus to become a permanent program beginning in
February of 2007. In addition to what is now called the Construction Cost Savings
Incentive, a Project Scoping and Estimating Incentive has been added that benefits
employees who accurately estimate project costs so that project award amounts are within
one percent over or five percent under the STIP construction budget. By encouraging
employees to participate in this innovative process, MoDOT links performance to tangible
results in order to save taxpayer dollars.
2.2.3 Cultural
The continuous growth of a State DOT is inextricably linked to the continuous
growth of the context in which it operates. It is important to develop KPIs that reflect the
cultural values of the respective stakeholders. By studying the customer profile, State
DOTs can learn how population growth, age, diversity, urbanization, and other trends will
impact the future transportation system. It will also assist in providing the right information
through the appropriate communication channels.
Customers are also increasingly expecting a unique experience tailored to their
needs and wants. Personalization is the foundation of the dynamic customer experience.
For example, Pandora generates personalized music streams, Flipboard individualizes
consumption of the news, and Amazon has customized online shopping. The customer-
oriented State DOT personalizes the travel experience, providing highly contextualized
information and adjusting its offerings to strengthen customer engagement.
This is the era of “NOW.” Customers expect services to be available 24x7 and want
answers to their queries delivered on-demand. RideScout is a mobile app that shows the
customer information about transportation options that are available right now (RideScout,

20
2015). Users can see transit, bus, bike, taxi, car share, rideshare, parking, and walking
direction in a single view. By transforming data into valuable information, State DOTs can
provide customers with the appropriate tools to make informed decisions.
Inconsistent, wrong, or outdated information is unacceptable to customers.
Standardizing information ensures that answers are delivered quickly and accurately. Also,
communicating at the scale of highest interest to the customer – for example, providing
information about a personal route to work – allows the message to resonate. Applying a
local approach demonstrates the State DOT is vested in its customers’ interests.
2.2.4 Technological
The nature of data collection, analysis methods, and visualization tools is also
changing and impacting KPIs. Organized by the Transportation Research Board of the
National Academies, the Peer Exchange on Aligning Data Systems to Communicate with
Decision Makers convened in April of 2014 to focus on communicating with decision
makers on transportation asset management, economic development opportunities, and
system performance. The ability to use advanced technologies to enhance data collection
for asset management, performance measurement, and real-time operations was noted as a
major advancement. Participants also recognized the challenges of maintaining new
technologies in addition to training and retaining staff with the technical skills to use the
tools and technologies. Furthermore, there is a need to integrate new data collection
methods with data from legacy systems, across different agency divisions, and between
agencies. The Utah DOT UPlan geographic database is one example of an interactive
planning and analysis tool that integrates a wide range of data from Utah DOT and other
agencies into one system. Using the latest technology, State DOTs can leverage relevant
data to provide customers with a personal and valuable experience.
21
2.2.5 Financial
KPIs may be used to demonstrate that the State DOT is a good steward of public
funds. In particular, metrics such as percent of projects completed on-time and on-budget
are the most common measures used for accountability. State legislatures exercise
significant power over state revenue sources and appropriations. The real power of
legislatures to allocate state funds is bounded by restrictions on the use of transportation
revenues. For example, 23 states have constitutional provisions – and three have statutory
provisions – that restrict use of state fuel tax revenues exclusively to highway and road
purposes (Rall et al., 2011). While it is encouraged to consider the transportation system
as a whole, it is also important for State DOTs to select KPIs that enable legislators to
easily identify the part of the transportation system that is being affected. This ensures that
funds are allocated towards areas in which the legislators and their constituents agree are
vital.
Funding shortfalls have resulted in many State DOTs creating system performance
measurement programs or revising existing programs as a means of allocating funds more
effectively. Transportation funding needs across the nation for highways, bridges, and
transit are projected to be $163 billion annually from 2015 through 2020 (AASHTO, 2014).
The highway and bridge backlog required to restore the system to the level of condition
and performance required to meet today’s demand is $740 billion. KPIs provide a base
level of understanding used to determine opportunities where increased funding could be
leveraged to improve system performance. Performance-based planning includes the
adoption of strategic KPIs linking performance evaluation with policy and investment
decisions.

22
2.3 KEY STAKEHOLDER GROUPS
By tailoring KPIs to different levels and stakeholder groups, State DOTs can
convey the right information to the right stakeholder, enabling them to make well-informed
decisions. There are two processes used to understand key stakeholder interests and
experiences: 1) Stakeholder segmentation organizes stakeholders into groups to understand
the specific nature of their priorities; and 2) Stakeholder mapping arranges the stakeholder
segments to clarify their relationships to one another and to the agency. Both of these tools
assist in identifying what KPIs will be considered most meaningful to which stakeholder
group.
Some State DOTs have already applied customer segmentation in their
communications strategies. Minnesota DOT (MnDOT) has identified the following
specific customer segments: emergency vehicle operators, farmers, intermodal shippers,
commuters, personal users, local communities, and neighbors (Stein and Sloane, 2001).
Florida DOT (FDOT) has identified a slightly different set of customers: residential
travelers, commercial users, elected/government officials, visitors, special need residents,
and property owners (Stein and Sloane, 2001). Both MnDOT and FDOT carry out surveys
to understand their customer needs and priorities.

23
Benefits of implementing a customer-oriented KPI framework include increased
stakeholder engagement, strengthened credibility, and additional investment in a trusted
organization. Washington State DOT (WSDOT) has transitioned its traditional model to a
three-prong approach with encouraging results. Figure 4 shows the three key audiences on
which WSDOT focuses: 1) legislative and other oversight bodies who make funding
decisions; 2) the opinion-makers and media; and 3) internal agency management (Bremmer
et al., 2004). The agency uses a self-created Performance Journalism method of reporting
in its quarterly performance report, the Gray Notebook, which is the agency’s central tool
for reporting (WSDOT, 2015). This approach has been well received by legislators and
media and it has also become an effective agency management tool.
Figure 6: WSDOT Performance Management Framework (Source: Bremmer et al., 2004)

24
2.3.1 State DOT Executives
State DOT executives are the champions for the organization and must be aware of
internal and external motivational factors. Effective leadership provides higher quality and
more efficient delivery of services. It also provides a sense of cohesiveness, an overarching
sense of direction and vision, a resource for invigorating the organizational culture, and a
mechanism for developing relationships with external stakeholders (Van Wart, 2003). An
effective KPI system will assist State DOT executives in managing their relationships with
legislators, businesses, and the public. KPIs communicate the strategic direction of the
agency, its current goals, its progress towards meeting those goals, and its areas of need.
The KPIs should assist in constructing a compelling narrative that will resonate with the
values of each stakeholder.
KPIs are an effective tool for empowering stakeholders to become ambassadors of
the State DOT. Armed with the right narrative, State DOT executives can serve as effective
spokespersons, or champions, for the organization when communicating with legislators,
businesses, and the public. If a State DOT executive is successful in activating the
stakeholder base through the use of meaningful KPIs, these ambassadors become brand
advocates for the agency. As a result, State DOTs extend their agency brand reach while
generating trust, support, and investment.
2.3.2 State Legislators and Governors
To improve the bottom line, effective communications with the state legislature are
essential to establish a stance from which to tell the DOT’s story. Legislators need to be
convinced through performance data that the projects selected are the right investments to
meet the state’s needs. The task for the DOT is to gain credibility and to inform legislators,
in appropriate detail, what is planned for their individual districts – and then to deliver
results that will support the promises to their constituents. An agency’s good performance

25
is an element that should be communicated and utilized to support the agency’s position
with political leaders. Aggressive outreach to the state legislature is essential for DOTs,
either directly or indirectly through other public agencies, customer comments, or ratings
as shown by surveys.
A new funding package typically moves an agency in a project performance
tracking direction. Legislative bodies increasingly make project-based funding decisions
and State DOTs should respond by communicating frequent and detailed information on
scope, time, and budget. Describing on-time and on-budget progress is critical for
legislators to track how state dollars are spent. Furthermore, it builds credibility with the
legislature by demonstrating fiscal responsibility.
Oregon DOT (ODOT) is an example of how a State DOT successfully engaged the
legislature using performance data. ODOT uses “one-pagers,” which are one-page
documents outlining the basics of what the legislators need to know in order to make
decisions (Kase, 2015). ODOT was seeking additional funding to employ railway track
inspection workers, since many of their employees were leaving to find better paying jobs
with the federal government. The one-pager explained how the funding was related to
maintaining the safety of the railroads. Due in part to the one-pager, the legislators decided
to increase funding.
2.3.3 Businesses
The debate on future investment would benefit from a better understanding of the
implications of a well-performing transportation system on business costs, productivity,
and profitability (Litman, 2010). If a state is unable to address worsening traffic congestion,
businesses may move away, go out of business, or adjust to smaller market areas for
workers, suppliers, and customers. On the other hand, State DOTs can foster economic

26
competitiveness by attracting capital into the state. KPIs that demonstrate business
sensitivities to congestion can encourage growth along certain corridors, improve access
to markets, increase worker productivity, and support company-led telecommuting
policies. Although many factors contribute to business decisions, it is the responsibility of
the State DOT to work with businesses and the State Department of Commerce to make a
compelling case for the economic benefits of transportation.
In response to former Governor Huntsman’s statewide energy reduction platform
in 2007, UDOT undertook a nationwide research review and local employer focus groups
in order to determine how to structure a traffic demand management (TDM) program in
Utah (Chisholm-Smith, 2010). Concurrently, UDOT consultants reviewed TDM best
practices nationwide and developed the TravelWise plan. The focus groups included two
groups of 18-20 company executives in the Wasatch Front metro area. It concentrated on
their opinions regarding transportation issues, the reduction of traffic congestion, air
quality improvement, and reductions in energy consumption. One element of was
employee hiring and retention, particularly related to the high costs of transportation for
those employees. They were also interested in a single contact point: they wanted to work
directly with UDOT as a leader, rather than having to coordinate amongst multiple
agencies. The focus group played a fundamental role in shaping UDOT’s TDM strategies
and served as a basis for notable partnerships throughout the state.
2.3.4 General Public
Successful State DOTs provide services reflecting the needs of their customers. The
average person travels 36 miles per day, spending about one hour in a vehicle (NHTS,
2009). Managing how that time is spent determines if the customer has a positive or
negative experience. By providing quality traveler information, roadway maintenance, and
27
roadside assistance services, transportation agencies increase customer satisfaction.
Proactively communicating important information to customers improves relationships and
reduces potential dissatisfaction. For example, notifying travelers of scheduled
construction or lane closures allows customers to identify alternative routes. Anticipating
customer concerns reduces support calls and empowers the customer to become a brand
advocate.
Customers need to be valued. By listening to concerns regarding brand, products,
and services, a transportation agency can learn new insights, gain perspective, and adapt
its strategies accordingly. Kentucky’s Transportation Cabinet undertakes annual customer
satisfaction surveys to find customer needs and wants (Stein and Sloane, 2001). The
Cabinet uses the results to fashion its requests for program approvals and funding from the
legislature. The VDOT Dashboard is another great example of a campaign used to
communicate performance measures to the public. When it was released, VDOT invited
the media to come in and review it first, working closely with Communications in
following up on initial press releases and media inquiries (FHWA, 2015). By monitoring
all communication channels, transportation agencies are able to quickly resolve problems
and improve customer relationships.

28
2.4 FIRST PRINCIPLES OF PERFORMANCE MANAGEMENT
Clearly KPIs are essential to successful management of a State DOT for effective
communication with a range of stakeholders. There is much to consider in establishing a
KPI framework, including the selection and presentation of KPIs through appropriately
designed tools. Strategic planning guidelines for CEOs and executives are focused around
the following four core functions associated with performance management (TransTech
Management, 2003):
1. Internal Communication – Enables leaders to communicate strategic priorities
to their employees
2. Business Management – Provides and organizing theme and focus point for
management frameworks
3. Decision Support – Informs decision-makers about emergent problems and
needs within the transportation system
4. External Communication – Enables the agency to communicate with
stakeholders and customers about its priorities, accomplishments, and goals
2.4.1 What is “key”?
The starting point for choosing which performance measures are considered ‘key’
to a particular State DOT should be those that will best equip the Executive Leadership to
manage and represent the agency. Sometimes referred to as ‘Critical Success Factors,’
KPIs should be narrowed down to the vital few of no more than five to eight
(PricewaterhouseCoopers, 2007). Many State DOT Executives receive percent of bridges
rated in good or higher condition, even though they may be communicating strategies such
as fostering economic competitiveness. A challenge is whether the KPIs currently
presented to the Executive leadership are those that allow external stakeholders to assess
progress against state strategies.

29
2.4.2 Selecting Key Performance Indicators
Indicators address the following four questions: 1) Where are we now? 2) Where
do we want to be? 3) How do we get there? 4) How do we measure progress? The literature
recommends KPIs adhere to SMART criteria to hold agency personnel accountable for
delivery of outcomes: Specific, Measurable, Achievable, Relevant, and Time-Bound
(Rozner, 2013). Different sources will offer different definitions or characteristics for the
“SMART” acronym because in reality there are more than five attributes to consider when
evaluating the merits of one KPI or another. A modified version is proposed below to
support a customer-oriented approach:
(S) Strategic
(M) Measurable
(A) Accessible
(R) Relevant
(T) Tangible
2.4.2.1 Strategic
Ideally, agencies will align performance measures in relation to achieving the
agency’s vision, mission, and goals. This enables stakeholders to assess the strategies
adopted by the agency and their potential to succeed. By cascading KPIs, day-to-day
activities are connected with the agency’s strategic goals. By extending KPIs, the agency’s
strategic goals are connected with the stakeholder’s desired outcomes. KPIs should reflect
and measure key drivers of value that guarantee future success, such as high customer
satisfaction or excellent service quality. The largest challenge in this attribute is the
evolving and dynamic nature of the institutional and political environments.

30
2.4.2.2 Measurable
KPIs express progress in an objective and quantifiable form. State DOTs should
use reliable and available data that the agency can collect and analyze without straining its
resources. Furthermore, it should clearly explain the limitations of the data and any
assumptions made in generating the KPI. If data is not being collected in an area, funds
should be allocated to capture new data or clean existing data. In the absence of standards
for the measurement of industry-specific indicators, an explanation of the components of
the indicator and how it is calculated are vital. Success is defined through appropriate target
and benchmark setting. These goals should be identified so they are recognized as
important by the stakeholder community.
2.4.2.3 Accessible
KPIs must be easy to comprehend. If there are too many or they are too complex,
KPIs will lose their power to grab the attention of stakeholders and influence behavior.
Given the rapidly increasing usage of industry-specific terminology, technical jargon
should be avoided so that the KPIs may be easily understood. Clear definitions of
performance indicators add greatly to the reader’s understanding of exactly what is being
measured and allows comparisons between agencies.
Providing access to the information is also critical to developing an open and
transparent process. Open Michigan was implemented by Governor Rick Snyder to provide
a quick assessment of the state’s performance in key areas, including economic strength;
health and education; value for money government; quality of life; infrastructure; and
public safety (Michigan, 2015). The infrastructure dashboard includes metrics describing
economic growth, safety, accountability, mobility, and conditions. The tool was found to
successful in situating transportation within a bigger picture and catalyzing a movement
towards data-driven government.

31
2.4.2.4 Relevant
KPIs should be meaningful when viewed from the stakeholder’s perspective.
Relevant KPIs as defined by the Conference Board of Canada, provide information that is:
1) significant and useful to the reporting organization’s stakeholders an 2) attributable to
its activities (Office of the Auditor General of British Columbia, 2010). By evaluating KPI
results, stakeholders can understand whether their expectations of performance
management have been met. Communicating the most important elements that will
effectively inform the decision-making process of the respective stakeholder are likely to
lead to positive action.
2.4.2.5 Tangible
Report the results at a scale that will resonate with the respective stakeholder. For
example, the respective district level is most appropriate for reporting current construction
projects to a state legislator. Texas DOT (TxDOT) has designed a project reporting system
that enables state legislators to view projects by highway, project ID, and county; monitor
its status from planning to design to construction; and identify the construction
cost/estimate (TxDOT, 2015). Residents are most likely to be concerned about their
specific commute that they experience on a regular basis. Utah DOT (UDOT) in
partnership with Cisco Systems, Inc. developed CommuterLink, an ITS network of
resources designed to maximize the efficiency of transportation in the state and help
residents “Know Before You Go.” The transportation services information program is
designed to keep travelers updated about road conditions and delays specific to the
commuter. CommuterLink integrates more than 800 traffic signals, 1,400 detector stations,
250 closed-circuit television cameras, and 70 variable message signs; saving Utah travelers
$179 million and 9.8 million hours annually; and preventing 948 traffic accidents and 3
traffic-related deaths each year (Cisco, 2004).

32
2.4.3 Communicating Key Performance Measures
Crafting messages that resonate with stakeholders is important to connecting with
diverse audiences. Presenting information visually and in a narrative format rather than just
listing facts and figures is a more effective way to communicate ideas to stakeholders who
are less familiar with the data. The charged political context around accountability in
transportation makes performance communication one of the most salient issues in the
performance measurement field (Bremmer et al, 2004). States that are the most advanced
in addressing issues of communications, are focused on improving both internal
communications with staff and external communications with the public, elected officials,
and businesses through media relations. Some states are even rebranding themselves and
identifying ways in which to clarify and improve their credibility with the public,
recognizing that image enhancement and improved stakeholder communications may lead
to an improved position for the agency, new resources, and a more supportive voter base
for the agency’s work. Increasingly, State DOTs report that proactive efforts to better
communicate and to position the agency positively with stakeholders have led to increased
public support and legislative funding (Stein and Sloane, 2001).

33
2.4.3.1 Dashboards
Several states have established or are moving toward “dashboard” style reporting
to communicate progress at a glance. This snapshot view generally uses red, green, or
yellow lights to describe results or simple arrows to describe directional trends. Virginia
DOT is setting the standard for the interactive, on-line dashboard approach. VDOT’s
Dashboard includes performance, safety, condition, and finance information in addition to
management, project, and citizen survey results. Other states that have implemented
publicly available dashboards are Utah, Michigan, Alaska, Georgia, and Delaware.
Figure 7: VDOT Performance Dashboard
(Source: http://dashboard.virginiadot.org/)
Performance Safety Condition Projects Citizen Survey Finances Management

34
Figure 8: UDOT Zero Fatalities Dashboard
(Source: http://dashboard.zerofatalities.com/?year=2014)
Figure 9: Open Michigan Infrastructure Dashboard Sample
(Source: https://midashboard.michigan.gov/infrastructure)

35
Figure 10: DOT&PF Dashboard Sample (Source: http://dot.alaska.gov/performance-dash/index.shtml)
Figure 11: DelDOT Dashboard Sample (Source: http://www.deldot.gov/dashboard2/condition.shtml?99)

36
2.4.3.2 Reports and Scorecards
Several states have an externally oriented, highly visible performance reporting
process. Scorecards offer a quick summary and include basic information such as policy
goals, performance measures, targets, results, trends, analytical notes, and sometimes short
narratives. Florida DOT (FDOT) publishes annual performance highlights that include
both system and organizational core measures in the following areas: Safety, Maintenance,
Environment, Mobility, and Economy (FDOT, 2014). The print version is easily accessible
on the website and is formatted as a brochure. VDOT’s Quarterly Report Card, also
available online, shows the agency’s performance on its “core business outcomes,”
highlighting the percent of construction and maintenance contracts completed on-time and
on-budget (VDOT, 2014). Appendix A includes examples of State DOT scorecards.
Typically lengthier than a scorecard, reports provide another opportunity to build a
story around the performance measures by adding detail and context. The Florida
Transportation Commission produces an annual report for the governor and legislature
called the Performance and Production Review. The report contains 17 primary measures
and detailed project delivery information (Florida Transportation Commission, 2014).
More robust than the “Performance Highlights” brochure, the Review offers additional
depth and insight. Another successful document is the Utah DOT (UDOT) Strategic
Direction and Performance Measures Report. The document presents emphasis areas,
agency core values, and the major performance accomplishments related to UDOT’s four
strategic goals: Zero Crashes, Injuries, and Fatalities; Preserve Infrastructure; Optimize
Mobility; and Delivering Results (UDOT, 2015). Distributed at the beginning of each year
before the legislative session, the Strategic Direction report provides a consistent means of
communicating Utah DOT’s priorities and performance to policy makers and the public
(Turnbull, 2014).
37
2.4.3.3 Traditional Media
Traditional media – newspapers, radio, and television – are important to DOT
image. Nearly every DOT tracks news clips and broadcast media reports to gather some
notion of how the agency is being presented, often on a daily basis. New Mexico DOT
(NMDOT) aggressively seeks out media contacts in an open, proactive way, resulting in
positive feedback. In tracking media coverage regularly, NMDOT reports its rate of
positive stories is around 80 percent (Stein and Sloane, 2001).
Management concerns about negative media coverage led the internal staff in the
Caltrans district around Los Angeles to analyze several thousand clips from a single year
to assess the positive and negative media coverage of the agency. The staff analyzed
newspaper coverage, along with tapes of radio and television reportage, in terms of
negative/positive/neutral stances taken, and then measured each in terms of column inches
and minutes of radio or TV coverage. Contrary to expectations, the finding was that media
coverage was overwhelmingly positive, by a 15 to 1 proportion of positive to negative
coverage. Furthermore, these positive media accounts would have cost Caltrans over $1.5
million if the agency had purchased such coverage at moderate-sized newspaper or
broadcast prices (Stein and Sloane, 2001).
2.4.3.4 Websites
Many state agencies make their performance data available through a dedicated
website. At a minimum, agencies will dedicate a site for uploading performance reports
and other materials for viewing and downloading. TxDOT goes a step beyond by
publishing a Performance Results Summary, which is a simplified dashboard in table
format that contains the TxDOT budgetary performance measures as reported to the
Legislative Budget Board and organized by the agency’s budget structure. The ease and
availability of these tools contribute to their effectiveness in disseminating information.

38
Figure 12: TxDOT Performance Results Summary Sample
(Source: http://www.txdot.gov/government/legislative/state-affairs/performance-results.html)

39
2.4.3.5 Open Data Portals
Open data portals are platforms that offer consumers a better way to access and use
public information. In an effort to improve transparency, accountability, and
interoperability, cities and states are releasing government-produced, machine-readable
data sets through centralized repositories. By engaging with the community, public
agencies are enhancing quality of life and the delivery of government services.
Local leadership is acting as a catalyst to jumpstart the open data movement. Led
by Mayor Greg Fischer and the chief of the Office of Performance Improvement, Theresa
Reo-Wever, Louisville has positioned itself to use data in transformative ways. Fischer
signed into law an executive order mandating that data is open by default and launched the
LouieStat open data portal in 2012. As a result of the program, drop-off policies were
revised and Emergency Management Services delivered 18,000 more patients to the
hospital between September and December of 2013 as compared to the same time period
in 2012 (Govloop, 2014).
2.4.3.6 Social Media
State DOTs are making increased use of social media platforms such as Facebook
and Twitter in order to communicate success stories and educate the public regarding the
urgency of transportation funding. Tennessee DOT (TDOT) offers Twitter feeds by
roadway and location to report out construction, traffic, and incident information. State
DOT Facebook pages are target to specific audiences, primarily teens and young drivers.
Texas finds that the majority of their “fans” are educated professionals, ages 25-44
(AASHTO, 2010). Arizona targets its messages to drivers 16-35 (AASHTO, 2010). These
tools are useful for communicating KPIs to customers who are inclined towards technology
and social networking. State DOTs that successfully build a social network can leverage
followers into becoming brand advocates.

40
2.5 THE EVOLUTION OF PERFORMANCE MANAGEMENT
Performance management is an evolving practice. A typology of performance
management frameworks was developed by Bremmer et al. (2004) and serves as a way to
classify different models according to their primary purpose. Citing Baird and Stammer
(2000) in addition to Poister (2004), Bremmer et al. emphasize that while State DOTs have
a strong tradition of using KPIs as part of the engineering and planning processes, it is only
since the 1990s that KPIs are being used as a business management and accountability tool
to inform decisions. Some agencies are developing more strategic systems, integrating
KPIs into vision frameworks to drive organizational outcomes. Still more recent, the need
to focus on serving the customer has become integral to the performance management
practice. This thesis reviews State DOTs according to the three previously identified stages
of development and proposes the emerging typology of customer-oriented paradigms.
2.5.1 First Generation: Traditional Infrastructure & Organizational Measurement
First generation frameworks define progress in meeting specific program or project
goals; however they typically lack strategic direction and are not meaningfully linked to
other agency processes (Bremmer et al., 2004). Agencies develop first generation
frameworks often in response to internal Total Quality Management initiatives or specific
legislative requirements. Standard measures are developed to track basic system
performance and organizational process improvement, useful for internal, project-specific
decision-making purposes but not directly valuable to the agency’s stakeholders.
Nevada DOT (NDOT) is an example of a first generation agency. NDOT has
established 15 performance measures to track, monitor, and report performance of the
major divisions and program areas (NDOT, 2014). Although NDOT has a strong awareness
of performance measure statuses in relationship to desired targets, there is a lack of
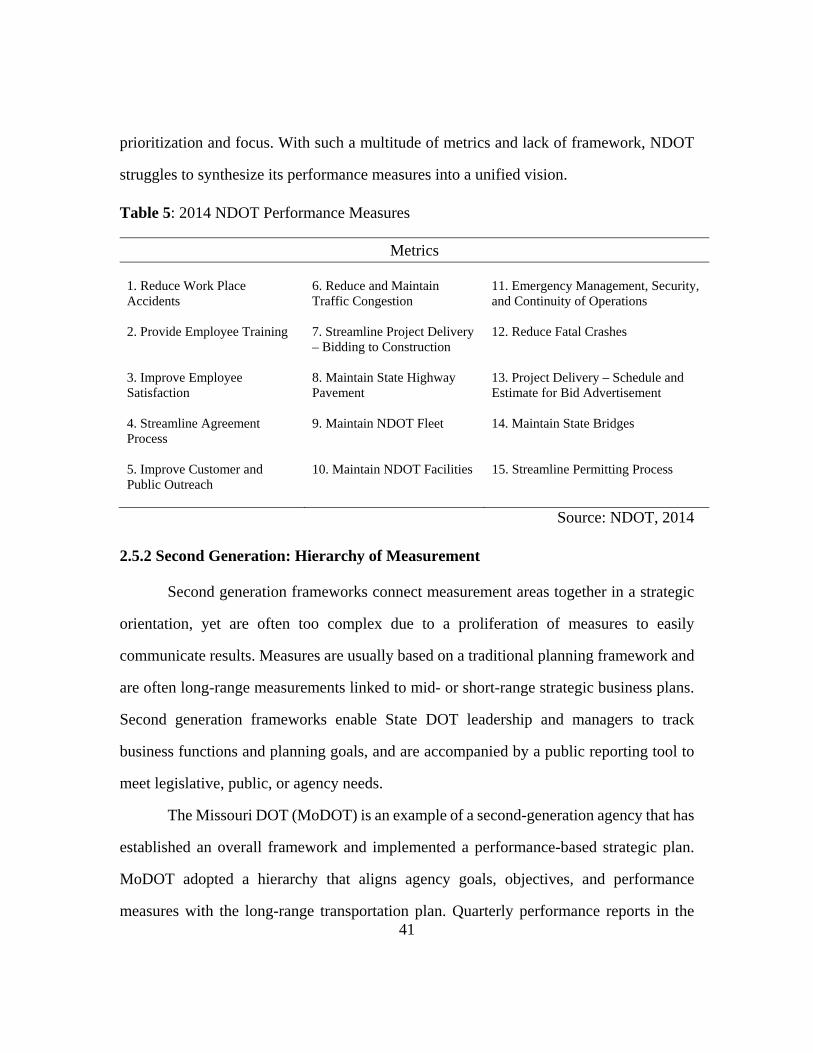
41
prioritization and focus. With such a multitude of metrics and lack of framework, NDOT
struggles to synthesize its performance measures into a unified vision.
Table 5: 2014 NDOT Performance Measures
Metrics 1. Reduce Work Place Accidents
6. Reduce and Maintain Traffic Congestion
11. Emergency Management, Security, and Continuity of Operations
2. Provide Employee Training 7. Streamline Project Delivery – Bidding to Construction
12. Reduce Fatal Crashes
3. Improve Employee Satisfaction
8. Maintain State Highway Pavement
13. Project Delivery – Schedule and Estimate for Bid Advertisement
4. Streamline Agreement Process
9. Maintain NDOT Fleet 14. Maintain State Bridges
5. Improve Customer and Public Outreach
10. Maintain NDOT Facilities 15. Streamline Permitting Process
Source: NDOT, 2014
2.5.2 Second Generation: Hierarchy of Measurement
Second generation frameworks connect measurement areas together in a strategic
orientation, yet are often too complex due to a proliferation of measures to easily
communicate results. Measures are usually based on a traditional planning framework and
are often long-range measurements linked to mid- or short-range strategic business plans.
Second generation frameworks enable State DOT leadership and managers to track
business functions and planning goals, and are accompanied by a public reporting tool to
meet legislative, public, or agency needs.
The Missouri DOT (MoDOT) is an example of a second-generation agency that has
established an overall framework and implemented a performance-based strategic plan.
MoDOT adopted a hierarchy that aligns agency goals, objectives, and performance
measures with the long-range transportation plan. Quarterly performance reports in the

42
MoDOT Tracker series are published to demonstrate progress toward the seven agency
priorities using 58 supporting metrics (MoDOT, 2015). Tracker thoroughly documents the
continued growth of the organization and appropriately addresses transportation funding
challenges, however, external stakeholders may feel overwhelmed or intimidated by the
130-page volume. Caltrans reports on 72 performance measures organized around five
goals, of which it elevates 26 as key (Caltrans, 2015). While the quantity and quality of the
goals are well focused, the documents are written from the DOT perspective, which has
led to equal weighting of internally and externally motivated KPIs.
2.5.3 Third Generation: Catalyst-Driven Adaptation
Third generation frameworks respond to changes in agency priorities and external
pressures to guide the strategic direction of the agency. KPIs are identified to focus on
building effective metrics and communication tools centered on agency responsibilities and
investment decision needs. To manage the complexity created within the second-
generation framework, agencies have explored alternative ways to measure and
communicate performance. This approach is dynamic and provides real-time information
responsive to the needs of agency leadership, the state’s political context, and public
opinion. Its greatest shortfall, however, is that third-generation frameworks are reactive.
State likes Ohio and Washington have responded to changing force by developing
third-generation frameworks. They have also tried to address the complexity of measures
created in their second-generation phase. The New Mexico DOT (NMDOT) retooled and
reorganized its previous performance report The Compass. The Compass was originally
designed to be an accountability tool, but was actually thought to be “data rich, but
information poor,” due to the sheer volume of measures and lack of a cohesive framework
dictating which measures were most important (Bremmer et al., 2004). It has since been

43
narrowed down to five strategic objectives supported by 40 measures, where each division
in the agency is responsible for developing a business plan to ensure success of the strategic
objectives.
2.5.4 Fourth Generation: Customer-Oriented Paradigm
Fourth-generation frameworks are proactive in nature and incentivize changes in
behavior. Similar to third generation models, fourth generation frameworks are dynamic
and readily adaptable; but rather than being catalyst-driven, fourth generation frameworks
actively influence change. Furthermore, these frameworks are accompanied by a well-
developed communications strategy that focuses its messaging on multiple customer
segments. The communications strategy is typically designed through stakeholder input
and focus groups. These frameworks are externally oriented and tend to prioritize strategic,
compliant, and influential KPIs. Agencies that implement fourth-generation frameworks
exhibit strong State DOT executive leadership who are cognizant of stakeholder interests
and forces of change. The customer-oriented KPIs become a tool that equips leaders with
the right information needed to construct appropriate narratives.
The online customer community, called Minnesota DOT Talk, is a randomly
selected market research panel of 450 Minnesota residents who participate in weekly online
surveys, discussion and brainstorming sessions, and chats on a range of transportation
topics (Turnbull, 2014). Members of the Online Customer Community are invited to serve
for one year and reflect the demographics of the 2010 Census. Questions can be targeted
toward subgroups—such as metropolitan area residents or workers who commute during
the peak hours—as needed. Information is used by groups throughout the agency, including
communications, planning, and operations. The ongoing feedback from the community
provides a deeper and richer understanding of transportation needs, preferences, and

44
reactions to proposed and new facilities, services, programs, and policies. Examples of
topics considered include active traffic management signs, approaches to improve work
zone safety, roundabouts, travel time information during freeway construction, financing
and funding alternatives, and financial accountability.

45
Chapter 3: Customer-Oriented KPI Development Approach
The background has thus far provided a solid foundation for understanding the
challenges and opportunities of developing highly impactful key performance indicators
(KPIs). Beginning with the motivation, this thesis demonstrated the power of using KPIs
to strengthen stakeholder relationships by building trust, garnering support, and
encouraging investment. Next, key stakeholder groups were identified along with their
respective priorities and relationships to the State DOT. Basic principles for selecting and
communicating KPIs were outlined to guide practitioners in marrying the right information
to the right stakeholder. Finally, a typology of KPI frameworks was described and extended
to include the emerging customer-oriented paradigm.
In order to apply the techniques previously described, a new customer-oriented KPI
framework will be developed for the Texas Department of Transportation (TxDOT). This
process begins with the analysis of the performance management context in the state of
Texas. Once grounded in the specific environment, three stakeholder profiles are developed
to equip the TxDOT leadership in effectively communicating the performance of the
agency and influencing stakeholders to take desired actions. Specific KPIs are proposed to
correspond with each stakeholder profile that may assist in generating a data-woven
narrative. In an effort to validate the success of the proposed framework, key person
interviews are conducted to gather feedback from each stakeholder group. The feedback is
then synthesized to produce a final set of key recommendations.

46
3.1 PERFORMANCE MANAGEMENT CONTEXT IN THE STATE OF TEXAS
While the principles outlined in the previous section are intended as general
guidelines, this section applies them specifically to Texas. TxDOT employs key
performance indicators (KPIs) to translate broad policy goals and objectives into actionable
programs, projects, and services. In particular, the Executive Administration and Texas
Transportation Commission use KPIs to build a unified vision, communicate the strategic
direction of the agency, promote TxDOT’s activities, justify project selection, and
influence investment decisions.
Figure 13: Drivers of Change that Impact KPIs in Texas
TxDOT KPIs
Cultural
Political
Financial
Institutional
Technological
SunsetReview PerformanceTargets HB20
LeadershipTurnover VisionReevaluation StrategicPlanning
DemographicChanges VehicleOwnership TrustErosion
Connectivity OmniChannel BigData
ConventionalFunding Proposition7 Proposition1

47
3.1.1 Political Pressure
A variety of political pressures are impacting the strategic direction of TxDOT,
leading to the most recent reevaluation of the Department’s vision, mission, values, and
goals, along with corresponding key performance metrics. As part of the 2010-2011 Sunset
Review Cycle of the 82nd Legislative Session Limited Scope Review, Texas SB 1420
continued TxDOT for four years to keep the agency under closer legislative scrutiny and
includes several changes to improve the transparency, accountability, and reliability of the
Department (Sunset Advisory Commission, 2011). The Legislature sought to increase
oversight to re-establish the Legislature’s and the public’s trust and confidence in the
Department. Furthermore, the Legislature modified the Chief Financial Officer’s duties to
include ensuring that the Department’s financial activities are conducted in a transparent
and reliable manner, and certifying that construction and maintenance contracts will not
create a state liability. SB 1420 also established the Unified Transportation Program (UTP)
covering a period of 10 years in statute to guide development and authorize construction
of transportation projects. The Commission must establish criteria for selecting projects;
definitions for program funding categories including safety, maintenance, and mobility;
and benchmarks for evaluating project progress and readiness to be implemented. The UTP
and summary documents must be published in appropriate media and on the agency’s
website. An online project information reporting system and a transportation expenditure
reporting system must also be developed as publicly available reporting tools. There are
additional provisions to improve TxDOT’s consistent, unbiased, and meaningful public
involvement. The bill requires the policy to include specific elements, such as using
techniques that target different groups and individuals, making efforts to clearly tie public
involvement to the decisions the Department makes, and applying the policy to all public
input with the Department.

48
Each biennium, the Texas Legislature establishes agency performance targets in the
General Appropriations Act. Table 6 outlines the TxDOT budgetary performance
measures, organized by the agency’s budget structure, for FY 2014-2015 biennium enacted
in HB 1 (83rd Regular Session, 2013) and reported to the Legislative Budget Board (LBB).
Table 6: TxDOT KPIs reported to the Legislative Budget Board
Metrics by Objective Provide Transportation Planning
Percent of Design Projects Delivered on Time Percent of Design Projects Delivered on Budget Number of Construction Project Preliminary Engineering Plans Completed Dollar Volume of Construction Contracts Awarded in Fiscal Year Number of Projects Awarded
Transportation Improvements
Percent of Construction Projects Completed on Budget Percent of Two-Lane Highways 26 Feet or Wider in Paved Width Percent of Construction Projects Completed on Time Percent of General Aviation Airport Pavement in Good or Excellent Condition Number of Grants Approved for Airports Selected for Financial Assistance
Preserve the Transportation System
Percent of Bridges Rated in Good Condition or Higher Percent of Highway Pavements in Good Condition or Better Statewide Maintenance Assessment Program Condition Score Statewide Traffic Assessment Program Condition Score Number of Lane Miles Contracted for Resurfacing Number of Highway Lane Miles Resurfaced by State Forces
Optimize Services and Systems
Percent Change in the Number of Small Urban and Rural Transit Trips Number of Fatalities per 100 Million Miles Traveled
Enhance Rail Transportation
Number of Federal Railroad Administration (FRA) Units Inspected
Source: TxDOT, 2015

49
Enacted in June of 2015, Texas HB 20 requires the commission by rule to develop
and implement performance metrics and performance measures as a part of the review of
strategic planning in the statewide transportation plan, rural transportation plans, and the
Unified Transportation Program (UTP); the evaluation of decision-making on projects
selected for funding in the UTP and Statewide Transportation Improvement Program
(STIP); and the evaluation of project delivery for projects in TxDOT’s letting schedule
(TxDOT, 2015). The bill also requires the commission by rule to adopt and periodically
review performance metrics and measures to assess how well the transportation system
performs and operates; provide TxDOT, the Legislature, stakeholders, and the public with
information to support decisions in a manner that is accessible and understandable to the
public; assess the effectiveness and efficiency of transportation projects and service;
demonstrate transparency and accountability; and address other issues the commission
considers necessary.
3.1.2 Institutional Changes and Initiatives
In 2015 TxDOT experienced an exceptionally high turnover in leadership, which
contributed to strategic ambiguity and a loss of institutional knowledge. In February, the
newly elected Governor appointed a Chairman and a Commissioner to the Texas
Transportation Commission. The Governor has declared reducing congestion to be a
priority of his administration and directed TxDOT to create a “focused initiative” to ensure
Texas’s most congested areas receive priority. In conjunction, the Chairman has charged
each of the commissioners with a specific customer concern to investigate and champion.
In particular, the five other commissioners are concentrating on 1) congestion relief
initiatives, 2) fiscal stewardship related to project selection, 3) performance measures, 4)
federal legislative affairs, and 5) implications of UAVs and other emerging technologies.

50
The diversification of priorities by the Commission has been successful in enabling them
to tackle a broad array of issues; the next step will be in synthesizing their initiatives into
a unified vision for the agency.
In addition to several on-boardings, there have been multiple resignations. In
August of 2015, the Deputy Executive Director submitted his resignation to end a nearly
30-year successful career with TxDOT. There was much concern that he would be the first
of many high-ranking officials to leave the state agency due to a provision in SB 20 (Texas
Government Insider, 2015). The bill stipulates that any state employee who was a decision-
maker in awarding a state contract to a vendor cannot be hired by that vendor until two
years after leaving the agency. Then in October of 2015, the Executive Director announced
just 18 months into his tenure that he would resign at the end of 2015. Weber’s resignation
means the Department will have its fourth Executive Director since 2011.
In the spring of 2015, TxDOT initiated a review of its vision, mission, values and
goals, and subsequently the initiatives, strategies, and associated key performance
measures used to guide the agency. A Core Strategy Team (CST), led by one of the
commissioners with Administration sponsorship, was formed to lead the effort. The team
is composed of 10 employees from various districts, divisions, and offices. The main
objective is to create a publicly available Commission Dashboard, designed to reflect the
agency’s progress toward departmental goals and strategic initiatives. The team sought
input throughout the process from employees who are closest to the work that TxDOT
performs as well as external stakeholders. The Core Strategy Team and the Office of
Strategic Planning conducted five focus groups around the state. The focus groups
consisted of district, division, and office personnel and were conducted in Austin, Bryan,
Paris, Lubbock, and Corpus Christi. The input is being used as input to enable the Core

51
Strategy Team to make a recommendation to Administration regarding the agency’s
Vision, Mission, and Values. Table 7 lists goals under consideration.
Table 7: TxDOT Goals under Consideration by the Core Strategy Team
Proposed Goals and Definitions
Focus on the Customer – People are at the center of everything we do
Deliver the Right Projects – Develop effective planning and forecasting processes
that deliver the right projects on-time and on-budget
Preserve our Assets – Deliver preventive care and maintenance for TxDOT’s
system and capital assets to optimize our investments
Promote Safety – Maintain a culture of safety first
Enhance System Performance – Develop and operate an interconnected
transportation system that provides reliable and accessible mobility enabling
economic growth
Value our Employees – Respect and care for the well-being and development of
our employees
Foster Stewardship – Ensure efficient use of state resources
Source: TxDOT, 2015

52
In the fall of 2015, the Office of Strategic Planning sought to develop an Integrated
Comprehensive Action Plan (ICAP) with the main objective of leveraging and identifying
collaborative activities to maximize asset use. Multiple workshops were held in order to
identify gaps and opportunities. The final proposed recommendations will go to the
Commission for approval in December 2015. During the workshops, two main points
arose: 1) the need for a unified, overarching communications strategy; and 2) the need for
a change in the funding structure to allow for holistic transportation projects beyond the
traditional segment-based highway and bridge projects. Customer-oriented KPIs can assist
with both of these.
3.1.3 Cultural Transformations and State of Public Trust
The population of Texas is growing rapidly – especially in a few already-congested
metropolitan and urban – thus taxing the existing transportation system. Population growth
is expected to continue outpacing the nation by a wide margin through 2040. The Texas
State Data Center projects that by 2040, Texas will add 13.5 million people to reach a total
population of 35.8 million (Potter and Hoque, 2014). Much of the population growth in
Texas is expected to come from the large urban counties of Harris, Dallas, Tarrant, Bexar,
and Travis, but the fastest growth will occur in the suburban rings surrounding these
counties. With such rapid growth, congestion is worsening and infrastructure maintenance
demands are increasing. In 1999, computer manufacturer Dell acknowledged that Central
Texas traffic contributed to its decision to expand in Tennessee rather than at its Round
Rock headquarters north of Austin (Batheja, 2014). Transportation and urban planners will
need to prepare for the state’s future to ensure that Texas continues to attract rather than
repel opportunities.

53
By 2050, one in five Texans is projected to be 65 and over (Potter and Hoque,
2014). More people will require quality public transit connections to medical and other
services. TxDOT will also need to be aware of cultural shifts, such as reduced vehicle
ownership and the shared economy, driven by the millennial generation. The sharing of
goods and services is disrupting traditional business models. Its rapid growth is rooted in
three factors:
Ability to leverage space capacity and expand systems without large investment
Exponential effect of collaborative experimentation and learning
Ubiquitous nature of distributed capacity
A typical car lies unused for approximately 23 hours a day (International
Transportation Forum 2015). Transportation network companies, such as Uber and Lyft,
are taking advantage of overcapacity to satisfy a demand for mobility. From 2007 to 2011,
vehicle ownership for people aged 18 to 34 fell almost 30% (NHTS, 2009). As a result, car
manufacturers and vehicle rental companies have introduced their own carsharing services,
including Daimler’s Car2Go, BMW’s DriveNow, and Avis’s ZipCar. Businesses are also
creating low-speed, shared vehicle fleets for employee use on campus and in neighborhood
communities. As cultural values continue to shift, it will be critical for TxDOT to design a
positive customer experience for all citizens.
Regarding the state of public trust in Texas, billing problems with TxDOT’s tolling
system operated by a private system integrator came to light in 2015. TxDOT will be
refunding about $1.7 million to tollway users who have been overbilled (Batheja, 2015).
The agency is continuing to find TxTag accounts that were improperly billed following
refunds to 31,000 accounts at the beginning of the year. In addition to billing issues, Texas
drivers have encountered trouble accessing accounts online and long wait times on
customer service calls. Although many of these problems have been blamed on the

54
company that the private system integrator was hired to replace, the public is still
attributing the errors to TxDOT. Due to this erosion in public trust, troubled state contracts
became a central topic of discussion with the House General Investigating Committee.
Consequently several bills were filed aimed at restricting TxDOT’s tolling operations, with
proposals ranging from restricting the agency’s ability to assess late fines to requiring it to
develop a plan to ultimately remove tolls from all Texas roads. As TxDOT develops its
new KPI framework, the agency should keep these concerns in mind.
Among the additional factors shaping the TxDOT environment are the troubled
economy, changing expectations regarding public sector transparency and accountability,
heightened sensitivity of government spending, and evolving expectations for increased
local control over transportation project selection and development. While the State faces
increasing needs for transportation infrastructure to serve its citizens, TxDOT is challenged
to obtain funds needed to maintain the existing assets, to continue to build new capability,
and to articulate what is required to fund transportation needs for the foreseeable future.
3.1.4 Technological Advancements
By 2020 the average person will be connected to 4.3 devices (Strategy Analytics,
2014). TxDOT will need to consider how to collect data from newly sources as well as
communicate with its customers through PCs, tablets, wearables, smartphones, televisions,
radio, and vehicle infotainment systems. Using the latest technology, TxDOT can leverage
relevant data to provide customers with a personal and valuable experience.
By viewing the transportation experience through the eyes of the customer, TxDOT
can orchestrate the customer experience across all layers so that it is seamless, integrated,
and consistent. OmniChannel anticipates that customers may start in one channel and move
to another as they progress to a resolution (Stocker, 2014). Facilitating the transitions so

55
that they are fluid for the customer develops continuity within the communications
strategy. The following outlines several of the most valuable channels:
Website: Developing an online presence through a mobile-optimized agency
website is critical as the basis for a, permanent digital relationship with the
customer.
Search: The next digital layer emerged from the development of powerful
search engines such as Google. Focusing on the customer’s discovery process,
transportation agencies can align customers to their desired services and
information.
Social Media: Social networks generate another layer of communications and
present a new way to engage with customer service. TxDOT can take advantage
of the opportunities to advertise safety campaigns, promote commerce, and
provide service options.
Mobile: Combined with social media, mobile presents an unprecedented
opportunity to focus on utility. By providing stakeholders with valuable
information in real time, customers can receive traffic alerts or evacuation
information and make effective decisions in a timely manner.
Wearables: Augmented reality, wearable technology, and advanced filters
increase the bond between customers and their technology. As individuals
become more health conscious, transportation agencies can leverage the trend
to promote pedestrian and bicycling initiatives.
Open communication channels form the basis of improved transportation planning
and resource allocation efforts. In a technology-advanced world, TxDOT can integrate its
KPI system to collect new information as well as engage with its customers on a more
56
personal level. A customer-oriented KPI framework can ensure that the right projects and
services are delivered to the right customers.
3.1.5 Financial Limitations
TxDOT has traditionally focused on the construction and maintenance of highways
and bridges. A primary reason for this focus is due to its restrictive funding structure as
stipulated by the state legislature. Policymakers in turn respond to the attitudes of their
constituents, who often view TxDOT’s sole function as the provider of the physical
infrastructure. As a result, the public is only willing to pay for traditional highway and
bridge projects; however, they still demand high levels of service and hold TxDOT
responsible for its inability to mitigate congestion. While the metrics required by the
Legislative Budge Board are heavily construction-biased, the public ultimately values
mobility. This discrepancy highlights multiple educational gaps: 1) the transportation
system must operate holistically, 2) congestion is a complex problem that requires a
comprehensive solution, and 3) a quality system requires a sustainable source of
investment. A customer-oriented KPI framework should strive to correct these
misperceptions and encourage voters to support comprehensive transportation investment.
Proposition 7 is the most recent example of Texas voters perpetuating the
traditional investment model. In February 2015, the Governor named transportation
funding one of five emergency items for the 84th Texas Legislature. To address this issue
and take steps toward closing the state’s transportation funding gap, the Texas Legislature
passed Senate Joint Resolution (SJR) 5 in May, placing Proposition 7 on the ballot on
November 3, 2015. Texans voted on the constitutional amendment to dedicate portions of
revenue from the state’s general sales and use tax as well as from the motor vehicle sales

57
and rental tax to the State Highway Fund for non-tolled projects. The amendment passed
and will allocate funds in the following ways:
Beginning in September 2017 (FY 2018), if state sales tax revenue exceeds $28
billion in a fiscal year, the next $2.5 billion of revenue will be directed to the
State Highway Fund.
Beginning in September 2019 (FY 2020), if state motor vehicle sales and rental
tax revenue exceeds $5 billion in a fiscal year, 35 percent of the amount in
excess of $5 billion will be directed to the State Highway Fund.
It is important to note that the funds may only be used to purchase right of way for,
build, maintain, and rehabilitate non-tolled public roads and to pay down certain
transportation-related debt. These restrictions were included in part due to the mistrust of
toll-road projects by the Texas public as well as hesitations towards non-traditional
infrastructure projects. A customer-oriented KPI framework could be used as an
educational tool to rebuild public trust, demonstrate thoughtful evaluation of diverse
options, and showcase TxDOT’s ability to deliver innovative solutions that improve overall
mobility.
Proposition 7 complements Proposition 1, which was passed in November 2014,
by tapping additional revenue sources to further enhance transportation funding.
Proposition 1 authorized a portion of the severance taxes on oil and natural gas to be
redirected to the State Highway Fund each year. For 2015, the first year in effect,
Proposition 1 resulted in an additional $1.7 billion going towards state highway funding.
Although these two amendments are an important step towards addressing highway
challenges, neither provision allows for investment in multimodal solutions. If TxDOT
envisions itself as a multimodal agency, then TxDOT should consider modifying its KPI
structure to support multimodal investment.

58
3.2 CUSTOMER-ORIENTED KPI FRAMEWORK PROPOSAL FOR TXDOT
Now that the stage is set, it is time to delve into the customer mindset. Three
example stakeholder profiles and a sample KPI report (see Appendix B) are designed to
equip the Texas Transportation Commission and TxDOT Executive Administration with
the right information in order to influence the respective stakeholder to take positive
actions. Each stakeholder profile begins with an “Ask” that aligns with TxDOT’s goals in
order to clearly identify the desired outcome. Next, a “Customer Experience Snapshot”
shifts the perspective from a traditional DOT-centric mentality to that of the stakeholder.
Then, a “Customized Value Proposition” is constructed to enable the TxDOT leadership to
deliver a data-woven narrative that effectively communicates the performance of the
agency. This format is considered more effective than overwhelming the stakeholder with
metrics that are overly complex or irrelevant, ensuring that the power of the KPIs is neither
diluted nor lost. Finally, a select few KPIs are proposed to support the Value Proposition,
allowing for it to be quickly adapted for its appropriate context and audience. Together
these four components constitute a Stakeholder Profile that prepare TxDOT leadership to
effectively communicate with a range of stakeholders, improving the position of the
agency, instilling trust, and encouraging investment.
The Stakeholder Profiles are specifically designed to use customer-oriented KPIs
to demonstrate how TxDOT is actively working to reduce congestion from multiple angles.
Congestion was selected as the focus since it is an everyday customer touch point, media
coverage is highly visible, and the Governor has explicitly directed TxDOT to address its
worsening conditions. Also, the KPIs are selected to broaden customer awareness
regarding non-construction, non-infrastructure solutions. The rationale behind these
decisions is to ultimately encourage stakeholders to perceive transportation as a holistic
system that deserves a corresponding holistic funding structure.

59
3.2.1 Stakeholder Profile: General Public
3.2.1.1 Ask
TxDOT should ask the Texas public to trust the agency to deliver quality solutions
to everyday congestion problems. TxDOT should earn the trust of the public by increasing
travel time reliability and evaluating all congestion mitigation measures in a transparent
manner.
3.2.1.2 Urban Customer Experience
Austin is the capital of Texas and the fourth largest city in the state with an
estimated population of 836,800 people. The average Austin resident spends 52 hours per
year in traffic congestion, typically commuting to and from work during peak hours in a
single-occupant vehicle. Austin traffic is concentrated along I-35 and Mopac, two of the
most congested and unreliable corridors in the state. Issues impacting public trust in the
transportation system include Mopac’s extensive construction delays, SH-130’s slow
traffic growth, and the incorrect TxTag billings. Austin residents – particularly the
Millennial generation – are receptive to bike, pedestrian, and certain public transit
initiatives. In November of 2014, however, Austin voters defeated Proposition 1, which
would have approved a $1 billion bond for city transportation with $600 million going
towards a 9.5-mile light-rail line and $400 million paying for various road improvements.
The urban rail initiative was considered an unwise investment in limited transportation
funds and voters doubted the design’s ability to meet ridership estimates needed to be
profitable. In transportation and land use, Austin residents are supporting walkable
downtown and neighborhood environments, and mixed-use development has increased to
meet growing demands. Special traffic events that resonate with the Austin public include
SXSW, ACL, and University of Texas at Austin athletic events.
60
3.2.1.3 Value Proposition
Today, the average commuter is dedicating more than 40 hours and $1,000 every
year towards sitting in traffic – time that could be better spent with family, money that
could be better spent on groceries or education. Furthermore due to the unreliability of the
roadways, Texans are leaving 20-30 minutes early to just to avoid being late for a doctor’s
appointment or facing hefty childcare penalties for picking the kids up late. With 157 new
people moving to the city every day, TxDOT understands that Austin residents cannot
afford the wasted time and money and has developed a suite of mobility initiatives to
address Austin’s everyday congestion problems.
TxDOT is dedicated to increasing travel time reliability and providing Texans the
choice and convenience of quality travel options. Using technology in order to generate
reliable travel time information, TxDOT enables people to plan their day without budgeting
an extra half-hour. Furthermore, the HERO program facilitates incident clearance when
unexpected accidents occur in order to keep Texans moving. Through a combination of
new lanes, enhanced operations, and traffic management solutions, TxDOT is committed
to reducing the hours Texans spend in traffic. TxDOT is also helping people save time and
money by exploring more cost-effective options to driving alone. Whether people are going
down the street or across the state, TxDOT wants everyone to arrive safely and on-time.
Through traditional and innovative solutions, TxDOT is dedicated to creating a positive
transportation experience every day for its customers.
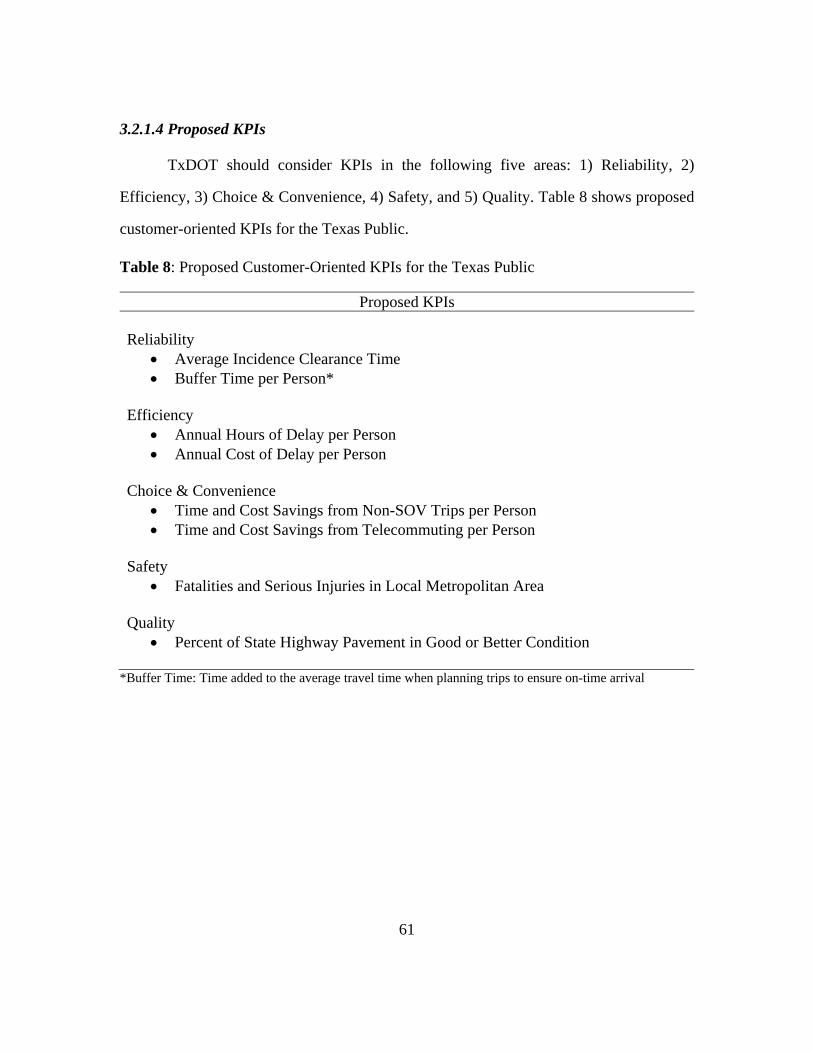
61
3.2.1.4 Proposed KPIs
TxDOT should consider KPIs in the following five areas: 1) Reliability, 2)
Efficiency, 3) Choice & Convenience, 4) Safety, and 5) Quality. Table 8 shows proposed
customer-oriented KPIs for the Texas Public.
Table 8: Proposed Customer-Oriented KPIs for the Texas Public
Proposed KPIs
Reliability Average Incidence Clearance Time Buffer Time per Person*
Efficiency
Annual Hours of Delay per Person Annual Cost of Delay per Person
Choice & Convenience Time and Cost Savings from Non-SOV Trips per Person Time and Cost Savings from Telecommuting per Person
Safety Fatalities and Serious Injuries in Local Metropolitan Area
Quality Percent of State Highway Pavement in Good or Better Condition
*Buffer Time: Time added to the average travel time when planning trips to ensure on-time arrival
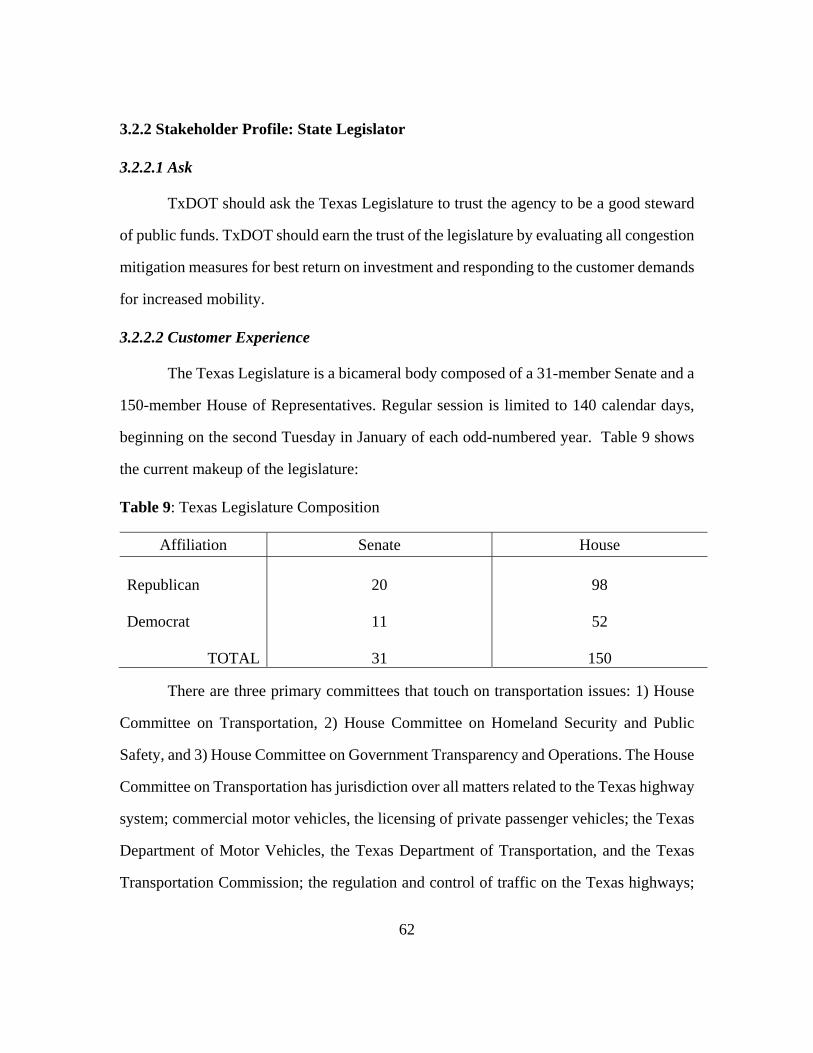
62
3.2.2 Stakeholder Profile: State Legislator
3.2.2.1 Ask
TxDOT should ask the Texas Legislature to trust the agency to be a good steward
of public funds. TxDOT should earn the trust of the legislature by evaluating all congestion
mitigation measures for best return on investment and responding to the customer demands
for increased mobility.
3.2.2.2 Customer Experience
The Texas Legislature is a bicameral body composed of a 31-member Senate and a
150-member House of Representatives. Regular session is limited to 140 calendar days,
beginning on the second Tuesday in January of each odd-numbered year. Table 9 shows
the current makeup of the legislature:
Table 9: Texas Legislature Composition
Affiliation Senate House Republican
20
98
Democrat
11 52
TOTAL 31 150
There are three primary committees that touch on transportation issues: 1) House
Committee on Transportation, 2) House Committee on Homeland Security and Public
Safety, and 3) House Committee on Government Transparency and Operations. The House
Committee on Transportation has jurisdiction over all matters related to the Texas highway
system; commercial motor vehicles, the licensing of private passenger vehicles; the Texas
Department of Motor Vehicles, the Texas Department of Transportation, and the Texas
Transportation Commission; the regulation and control of traffic on the Texas highways;

63
rail, water, and air transportation; the regulation of metropolitan transit; and a permanent
sub-committee that focuses on the transportation needs and funding mechanisms of the
state during the next ten years. In the 84th Session, the House Committee on Transportation
heard and considered 300 bills. Therefore, it is critical for TxDOT to organize its efforts
around its highest priorities; customer-oriented KPIs can focus the Legislature on the most
significant policymaking areas.
Based upon the customer experience of their constituents, legislators will
correspondingly exhibit a difference in priorities between urban and rural districts. Urban
communities face one set of unique challenges: growing populations, traffic congestion,
parking difficulties, limited public transit, bicycle and pedestrian connectivity, land
development, and freight distribution. On the other hand, rural communities face a different
set of challenges: declining populations, aging infrastructure, eminent domain threats,
limited access to services, environmental issues, agricultural changes, and unreliable
access to market. Generally, urban districts are focusing on reducing congestion while rural
districts are emphasizing roadway maintenance.
When developing their campaigns and careers, legislators typically build a platform
around a focal point. It is important to distinguish between the legislators who are closely
involved with transportation policymaking and those who are outside of the field. When
communicating with the latter group, it becomes especially important to link transportation
to their focal point so that it is relevant to their interest in either education, health care, or
the economy for example. By using customer-oriented KPIs to build a case for
transportation policy in the legislator’s mental space, TxDOT successfully translates
abstract concepts into a familiar language to become a trusted resource for information.

64
The following sample value proposition is designed for Republican State
Representative of House District 52, which includes the cities of Round Rock, Hutto,
Taylor, and part of Georgetown – suburbs of the greater Austin metropolitan area. The
Representative was selected for his innovative nature, communications background, and
engagement in transportation funding. The KPIs proposed in Section 3.2.2.4 are reflective
of HD52’s congestion priorities and the Representative’s focus on fiscal stewardship.
The Representative of HD52 is dedicated to developing solutions to transportation
challenges by finding new ways to fund critical infrastructure while seeking innovative
ways to make the most efficient use of the infrastructure already in place (Gonzales, 2015).
In the 84th Legislative Session, he authored HB 3690 relating to the operation of
autonomous motor vehicles by TxDOT to perform construction and maintenance work.
The bill has been referred to the House Transportation Committee. In addition to his public
service, he is owner of a communications and graphic design company that offers a wide
range of services including creative design and mediation. Combined with his education in
Government, Master’s in Public Administration, and almost 20 years of experience as a
Capitol staffer, he is aware of the power visualization tools have to communicate complex
issues to his constituents. Furthermore, he serves on the Appropriations committee and
chairs the Appropriations Subcommittee on Articles VI, VII, and VIII, which addresses
transportation funding. Appointed to serve for the first time on the 84th Legislature joint
House-Senate panel, he played a key role in negotiating the state budget. Conscious of the
need to achieve balance, he sought to “meet the needs of the state and the people of this
state while also being very mindful and a good steward of taxpayer dollars” (Collier, 2015).
Using customer-oriented KPIs, TxDOT can demonstrate its ability to be a good steward of
public funds in order to earn the trust and respect of key legislators such as the
Representative of HD52.
65
3.2.2.3 Value Proposition
Today, voters of Round Rock are dedicating more than 40 hours and $1,000 every
year towards sitting in traffic – time that could be better spent with family, money that
could be better spent on childcare or housing. Furthermore due to the unreliability of the
roadways, folks in Round Rock are leaving 30-40 minutes early just to avoid being late for
dinner with friends or risking the embarrassment of missing the start of a business meeting.
Thanks to the leadership in the Legislature and voter approval of Proposition 7, TxDOT is
actively working with the Governor to reduce congestion for HD52. Although the funds
will not be available until 2018, TxDOT is preparing now by evaluating several congestion
mitigation measures for best return on investment to ensure that the agency is meeting the
state’s future mobility demands in a transparent and responsible manner.
TxDOT is dedicated to being a good steward of public funds by investing in the
right projects. Through a thoughtful and transparent evaluation of the costs and benefits,
the Texas Transportation Commission selects congestion mitigation projects that will best
serve the residents and businesses of the state. Furthermore, TxDOT can be trusted to
deliver solutions on-time and on-budget, demonstrating accountability in the use of tax
dollars. Through a combination of new lanes, enhanced operations, and traffic management
solutions, TxDOT is committed to reducing the hours people spend in traffic and
maximizing the value of goods moved in the state. In partnership with the City and other
transportation agencies, TxDOT is also encouraging voters to save time and money by
exploring more cost-effective options to driving alone. Whether people are going down the
street or across the state, TxDOT wants everyone to arrive safely and on-time. Through
traditional and innovative solutions, TxDOT is dedicated to creating a positive
transportation experience every day for its customers in Round Rock.

66
3.2.2.4 Proposed KPIs
TxDOT should consider KPIs in the following five areas: 1) Fiscal Stewardship, 2)
Mobility, 3) Accessibility, 4) Economic Competitiveness, and 5) Safety. Table 9 shows
proposed customer-oriented KPIs for the Texas State Legislature.
Table 10: Proposed Customer-Oriented KPIs for the Texas State Legislature
Proposed KPIs
Fiscal Stewardship Projects Completed On-Time and On-Budget Return on Transportation Investment
Mobility
Annual Hours of Delay per Legislative District Annual Cost of Delay per Legislative District
Accessibility Residents within a half-mile of public transit Businesses within a half-mile of public transit
Economic Vitality Value and Quantity of Goods Shipped Over Texas Roadways
Safety Fatalities and Serious Injuries in Legislative District

67
3.2.3 Stakeholder Profile: Small Business
3.2.3.1 Ask
TxDOT should ask small businesses to trust the agency to provide reliable access
to product and labor markets. TxDOT should earn the trust of small businesses by
increasing travel time reliability and improving employee mobility.
3.2.3.2 Customer Experience
The State of Texas defines small business as an independent business with fewer
than 100 employees. Small businesses create seven out of every ten new jobs and employ
over half of the country’s private sector workforce (SBA Office of Advocacy, 2015). More
than 2.2 million small businesses constitute over 98.6% of all businesses in Texas, and
include over 725,000 women and minority owned small businesses. In 2014, Texas was
ranked number one in Economy and Infrastructure and second in Technology and
Innovation by CNBC, supporting the “Texas, Wide Open for Business” campaign. While
small business growth is continuing to rise, the environment is very competitive. The
Bureau of Labor Statistics shows that 49% of establishments survive five years or more;
34% survive 10 years or more, and 26% survive 15 years or more. Seven Texas counties
reported average weekly wages above the national average of $922 per week and Texas’s
six largest cities all have cost of living indexes under the national average of 100. Small
businesses seeking to develop or expand their operations must consider a large number of
factors, including reliable and efficient access to markets, access to an educated workforce,
costs of living, regulatory processes, and investment opportunities. It is important to
demonstrate how the transportation network and services can support the profitability and
success of the small business. Customer-oriented KPIs can be used to inform the decision-
making process and foster economic growth.

68
3.2.2.3 Value Proposition
With less than 50% of establishments surviving five years or more, small businesses
are competing for access to markets, low cost of living, and an educated workforce. Success
and survival depend heavily on the reliability of the transportation network in order to
guarantee on-time and on-budget operations. Furthermore, passionate employees, who are
the backbone of the organization, are demanding higher levels of mobility and access to
urban amenities. In order to meet client expectations, TxDOT understands that small
businesses cannot afford the wasted time and money and has developed a suite of initiatives
to facilitate small business supply chain management.
TxDOT is dedicated to enabling small businesses by increasing travel time
reliability and improving employee mobility. Using technology in order to generate reliable
travel time information, TxDOT enables small businesses to plan their operations to
achieve on-time and on-budget goals. Furthermore, TxDOT works closely with local
municipalities and other transportation agencies to offer multimodal interconnectivity that
supports first- and last-mile solutions. In order to maximize the value of goods moved
through the state, TxDOT is addressing congestion by building new lanes, enhancing
operations, and implementing traffic management systems. To provide access to a quality
workforce and improve worker productivity, TxDOT is encouraging small businesses to
save time and money by exploring flextime policies. Whether a small business is deciding
where to open or when to expand operations, TxDOT wants small businesses to succeed in
supply chain management and be proud to call Texas home. Through traditional and
innovative solutions, TxDOT is dedicated to creating a positive transportation experience
every day for its small business customers.

69
3.2.3.4 Proposed KPIs
TxDOT should consider KPIs in the following three areas: 1) Supply Chain
Management, 2) Local Economic Vitality, and 3) Access to Labor.
Table 11: Proposed Customer-Oriented KPIs for Texas Small Businesses
Proposed KPIs
Supply Chain Management Annual On-Time Delivery Percentage Buffer Index per Delivery Route per Mode Annual Cost of Delay per Delivery Route per Mode
Local Economic Vitality
Cost of Living Index Accessibility of business to multimodal transportation facilities
Access to Educated Workforce Annual Hours of Delay for Employees Annual Cost of Delay for Employees Time and Cost Savings from Implementing Flextime Policies

70
3.3 ANALYSIS
In an effort to validate the usefulness of the proposed stakeholder profiles, feedback
from each of the following stakeholder groups was gathered through a series of key person
interviews.
3.3.1 TxDOT Leadership
TxDOT leadership was asked to provide their reactions to the stakeholder profiles,
commenting on their usefulness in engaging the various stakeholder groups, offering
suggestions for improving their content, and comparing their format with the existing
reporting techniques. A Commissioner and Chief Strategy and Innovation Officer shared
their thoughts on the development of key performance indicators. The Commissioner
appreciated the focus of the KPIs over a multitude of metrics and saw the value in engaging
directly with the stakeholder. He also recognized the need to respond to the political context
and recommended to do “political reality checks” so the KPIs would resonate with the
legislature in the way that they were intended. The Chief Strategy and Innovation Officer
also appreciated the concise format that summarized the customer experience. He
recommended that additional customer segments should be studied: urban and rural
residents, technology-oriented and non-technology-oriented legislators, and major
corporations and small businesses.
3.3.2 Public
The Chief Communications and Marketing Officer and Director from the TxDOT
Communications Division offered their insights in communicating the agency’s message
to the public. From their experience, using narratives have been fundamental in painting a
picture that citizens can relate to and find meaningful. Distinguishing between urban and

71
rural needs was also identified as an important factor. Regarding technology, it is important
to relate it to the everyday context and eliminate all technical jargon.
3.3.3 State Legislature
The Director and Assistant Director from the State Legislative Affairs Section of
the TxDOT Government Affairs Office provided feedback on effective techniques for
communicating with the state legislature. The Director noted that there are a limited
number of legislators who are familiar with or receptive to technology, often making it
difficult to propose more innovative solutions. The Director also raised the point that the
traditional “highways and bridges” DOT model is still considered the paradigm for the
agency by many. In order to overcome these obstacles, it was suggested that technology
constitute part of a more comprehensive solution to complement and enhance conventional
infrastructure projects.
3.3.4 Businesses
The Director of Research and Technology Implementation who formerly worked
in supply chain management discussed the importance to focus on the business perspective
of profitability. By concentrating on how transportation impacts the margins, TxDOT can
become a trusted business partner. Furthermore, it was pointed out that many businesses
desire to locate within five miles of the interstate for access to markets. The impact of
traffic congestion on worker productivity was also raised and the opportunity to use KPIs
to support telecommuting policies was considered viable.

72
Chapter 4: Recommendations
Based upon the key person interviews described previously, the following
synthesizes their feedback and summarizes five best practices for State DOTs seeking to
develop a customer-oriented KPI framework.
4.1 LESS IS MORE
It is more effective to focus on the vital few. While State DOTs may measure an
array of things, it is important to recognize which metrics are driving strategic intent and
are relevant to the stakeholders of interest. If there are too many KPIs, State DOT
executives run the risk of overwhelming the stakeholder, diluting the message, or losing
stakeholder interest altogether. Confusion or apathy may arise instead of having the desired
effect of garnering stakeholder support.
4.2 DESIGN FROM THE OUTSIDE IN
Understanding the customer experience is key to developing a customer-oriented
KPI framework. Considering transportation from the stakeholder’s perspective ensures that
the agency’s performance message resonates with the audience. Furthermore, KPIs can be
used to manage or exceed customer expectations. Rather than relying upon the traditional
myopic KPIs, State DOTs can use customer-oriented KPIs to connect and engage with
stakeholders. By nurturing stakeholder relationships, State DOTs can progressively build
credibility, improve their public image, and secure critical investments.
73
4.3 POWER OF PERSONALIZATION
Stakeholder segmentation and mapping are critical tools for differentiating
stakeholder priorities and clarifying their individual relationships to the State DOT. Each
stakeholder group may be viewed as an audience. Developing customized communications
strategies tailored to specific interests ensures that each stakeholder’s contribution is
valued. Although this requires additional time, benefits of personalized messages include
constructive feedback, emotional connections, effective education, diverse perspectives,
proactive problem solving, improved decision making, and engaged stakeholder
development.
4.4 EMPOWER STAKEHOLDERS
Through the use of KPIs, State DOTs can translate data into information and
actionable items. Armed with the right information, a good KPI can enable a stakeholder
to make a well-informed decision in a timely manner. When coupled with incentives,
influential KPIs can be used to reinforce positive changes in behavior or perception. If
progress is demonstrated, trust is established and a stakeholder may become an advocate
for the agency’s activities. By leveraging brand advocates, State DOTs can accrue more
influence, reach, and stakeholder engagement.
4.5 EVOLVE OR RISK BEING LEFT BEHIND
In an environment of constant change, State DOTs need to be prepared to respond
to multiple forces of change. By institutionalizing the development process rather than the
product, State DOTs can establish a consistent methodology for updating their KPI
frameworks. By taking a proactive stance, State DOTs can anticipate the needs of
stakeholders and may even avoid additional oversight by including inherent transparency
and accountability mechanisms.

74
Chapter 5: Conclusion
With the erosion of public trust, increasing shortfalls in funding, and continuous
forces of disruption, State DOTs need to evolve their performance management
frameworks to better align the agency’s mission with stakeholder priorities. Using
stakeholder segmentation and mapping techniques, customized stakeholder profiles were
developed and KPIs were proposed to support the Texas Department of Transportation
leadership engage with the public, state legislators, and businesses. Feedback from the
stakeholder groups recognized the value of the proposal for its clarity, accessibility, and
relevance. Although a customer-oriented KPI framework requires more forethought than a
traditional DOT-centric approach, the rewards are advantageous. The customer-oriented
KPI development approach offers a successful process that is transferable to other State
DOTs. By understanding the context that surrounds performance management, State DOTs
can craft customized stakeholder profiles to build trust, garner support, and encourage
investment in their own states.
Areas of future research include refinement and expansion of the stakeholder
profiles to include more detailed customer segmentation, such as urban and rural
customers, Democrat and Republican legislators, small and large businesses. Additional
feedback could be gathered through stakeholder focus groups in order to improve
messaging. Other state DOTs could also be solicited for input regarding the transferability
of the customer-oriented approach. It is important to explore data integration and
interagency collaboration policies to identify areas in which TxDOT or the state could
serve as the central authority on information. Overall, this thesis serves as a good starting
point for state DOTs seeking to implement a customer-oriented KPI framework to improve
stakeholder engagement.
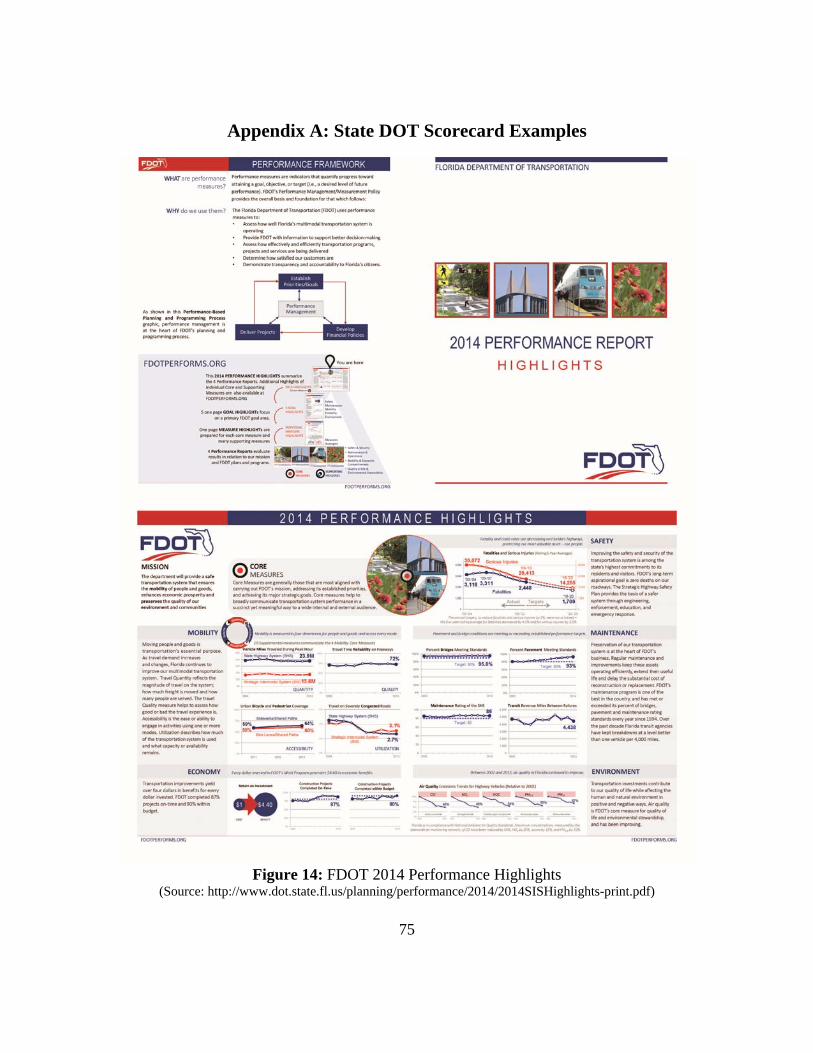
75
Appendix A: State DOT Scorecard Examples
Figure 14: FDOT 2014 Performance Highlights
(Source: http://www.dot.state.fl.us/planning/performance/2014/2014SISHighlights-print.pdf)

76
Figure 15A: CalTrans 2015 Q2 Mile Markers
(Source: http://www.dot.ca.gov/MileMarker/2015-2/index.html)

77
Figure 15B: CalTrans 2015 Q2 Mile Markers
(Source: http://www.dot.ca.gov/MileMarker/2015-2/index.html)

78
Figure 16A: MDOT 2015 MiScorecard Performance Summary
(Source: https://www.michigan.gov/documents/mdot/MDOT_Scorecard11-14-11_01-19-12_374118_7.pdf)

79
Figure 16B: MDOT 2015 MiScorecard Performance Summary
(Source: https://www.michigan.gov/documents/mdot/MDOT_Scorecard11-14-11_01-19-12_374118_7.pdf)

80
Figure 17A: MnDOT 2014 Transportation Results Scorecard
(Source: http://www.dot.state.mn.us/measures/pdf/2014PerformanceReport.pdf)

81
Figure 17B: MnDOT 2014 Transportation Results Scorecard
(Source: http://www.dot.state.mn.us/measures/pdf/2014PerformanceReport.pdf)

82
Figure 18A: ODOT 2015 Key Performance Measures
(Source: http://www.oregon.gov/ODOT/CS/PERFORMANCE/OnePagers/KPM%20Rollup.pdf)
Data as of Aug 25, 2014
Policy goal/Key Performance Measure
PreviousReporting period
CurrentReporting period
Goal
Goal met (w/in 10%)
Progress Made
Comments
Safety – Engineering, educating, and enforcing a safe transportation system
Number of traffic fatalities per 100 million vehicle miles traveled (VMT) in Oregon 1.02 .93 .90
Since 1999, Oregon's fatality rates have been consistently below the national average (Currently 1.14)
Number of traffic injuries per 100 million vehicle miles traveled (VMT) in Oregon
108.78 98.38 70 ‐‐‐
A system change in 2011 resulted inan increase of over 15% for injury and property damage data making it into the crash data file.
Percent of traffic fatalities that involved alcohol
37% 41% 35% ‐‐‐
According to 2013 NHTSA statistics, Oregon is #7 in the nation for lowest alcohol‐related fatalities.
Percentage of all vehicle occupants using safety belts 98% 98% 97%
In 214, Oregon’s observed safety belt use rate was reportedly 97.75%. The national average is 87%.
Number of large truck (commercial motor vehicle) at fault crashes per million vehicle miles traveled (VMT) in Oregon
.42 .44 .37 ‐‐‐
In 2013, Oregon ranked #1 in thenation, as inspectors placed 13.2 percent of drivers out of service for critical safety violations. The national rate is 5.5 percent. Most truck‐at‐fault crashes are caused by speeding, tailgating, or changing lanes unsafely.
Number of highway‐railroad at grade incidents 9 14 11 ‐‐‐
Oregon has been in or near the top 20 states for least number of motor vehicle incidents at public crossings.
Number of train derailments caused by human error, track, or equipment
20 23 25
Some increase may be attributed toincreased train volumes as the industry recovers from the recession.
Percent of public satisfied with transportation safety
83% 81% 74%
For the last three consecutive years,public opinion survey shows that over 80% of Oregon travelers feel safe on our roads.
Employee disabling (time loss ) claims rate per 100 ODOT employees
2.1 2.1 1.7 ‐‐‐
A comprehensive review of operations where workers are near moving equipment is underway. Changes in procedure and training will be implemented in 2015.
Mobility and Economic Vitality – Keeping people and the economy movingHours of travel delay per capita per year in urban areas 24 24 22
This statistic reflects Portland, Salem& Eugene metropolitan areas.
Average number of transit rides per each elderly and disabled Oregonian annually 19 20 24 ‐‐‐
Increases in the population of olderadults continue increase demands.
Number of rail service passengers 215,096 210,901 208,590
Since 2004, passenger rail ridership has increased by more than 92,000.
Percent of Oregon communities of 2.5K+ with intercity bus or rail passenger service 94% 95% 95%
Intercity bus connections remain steady.
Percent of Oregonians who do not commute alone to work during peak hours** 33% 30% 35% ‐‐‐
Education and awareness of alternatives to commuting alone can affect change.
Percent of lane blocking crashes cleared within 90 minutes
80% 81% 100% ‐‐‐
Clearing lanes is occasionally delayed due to accident investigations. Traffic incidents account for about 25% of the congestion on the highway system.
Oregon Department of Transportation Key Performance Measures Continuously updated as performance is reported
N
N
Y
Y
Y
N
N
N
Y
N
N

83
Figure 18B: ODOT 2015 Key Performance Measures
(Source: http://www.oregon.gov/ODOT/CS/PERFORMANCE/OnePagers/KPM%20Rollup.pdf)
Preservation – Preserving and maintaining the transportation infrastructure Percent of pavement mi les rated “fair or better” out of total miles on ODOT highway system
87% 87% 87%
ODOT’s pavement programs resurface less than one‐half the need and higher co st projects can’t be completed with available funds.
Percent of State highway bridges that are not distressed
78% 78% 78%
After 2017, bridge conditions willdecline exponentially. To maintain current bridge conditions through 2030, funding to state bridges would need to be tripled.
Sustainability – Sustaining the environment and communities Number of priority culverts that need work to improve fish passage 190 190 189
In the next 4 years, approximately1/2 its annual budget will fund storm water runoff retrofit projects.
Percent of urban state highways with bike lanes and sidewalks 43% 38% 48% ‐‐‐
ODOT is making strategic investments where communities have identified the greatest need.
Percent of ODOT sustainability performance measures maintaining steady or trending positive
93% 93% 90%
As with most new measures, additional data will be needed over time to better understand facility‐level practices and trends.
Stewardship – Maximizing value from transportation investments Number of jobs sustained as a result of annual construction expenditures
11,700 10,138 10,600
The 2013 model update calculatedthe 2013 fiscal year jobs impact factor at 10.5 jobs per $1M. The fiscal year 2015 jobs impact factor decreased to 10.1 jobs per $1M, due to inflation.
Percent of projects going to construction phase within 90 days of target date 96% 99% 90%
In 2014 ODOT continued to exceedthe 90% goal with 99% being on time.
Percent of projects with construction phase completed within 90 days of original date 76% 88% 80%
2014 results (88%) surpassed thegoal of 80% the first time since measurements started.
Percent of original construction authorization spent
106% 100% 99%
On average, overall project construction expenses are within 100% of their original authorization over the last 13 years.
Percent of ODOT contract dollars awarded to Disadvantaged Business Enterprise (DBE) businesses
9.0% 8.7% 16.95% ‐‐‐
The ODOT DBE Program is in the tophalf of the state reviews (45 to date).
Percent of ODOT customers who are satisfied with services
90% 89.5% 90%
Variations in results between 2006and 2012 are not statistically significant and have been near the target of 90%.
DMV Field office wait times (minutes) 15 mins 18 mins 11 mins ‐‐‐
ODOT is implementing a new measure to better reflecting the average customer experience.
DMV Phone queue wait times (seconds)
41 sec 45 sec 45 sec
ODOT continues to focus on providing consistent telephone answer time and cost‐effective service from three contact centers.
Vehicle Title transaction turnaround time (days)
24 days 24 days 21 days ‐‐‐
Agency is developing business processes to reduce the title wait time as transaction volumes increase.
Y
N
Y
Y
N
N
Y N Regression since last report Progress since last report Progress remains unchanged since last report
N
N

84
Figure 19A: VDOT 2015 Q4 Quarterly Report
(Source: http://www.virginiadot.org/VDOT/Info/asset_upload_file723_65707.pdf)

85
Figure 19B: VDOT 2015 Q4 Quarterly Report
(Source: http://www.virginiadot.org/VDOT/Info/asset_upload_file723_65707.pdf)
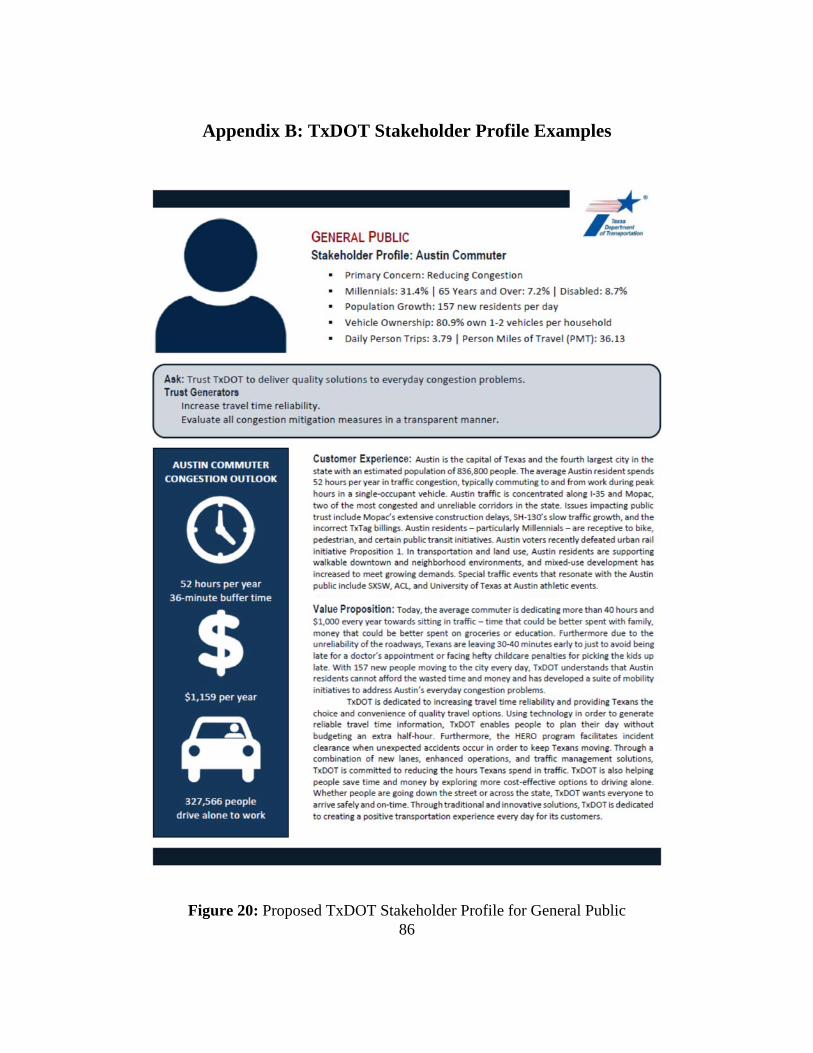
86
Appendix B: TxDOT Stakeholder Profile Examples
Figure 20: Proposed TxDOT Stakeholder Profile for General Public

87
Figure 21: Proposed TxDOT Stakeholder Profile for State Legislature

88
Figure 22: Proposed TxDOT Stakeholder Profile for Small Business
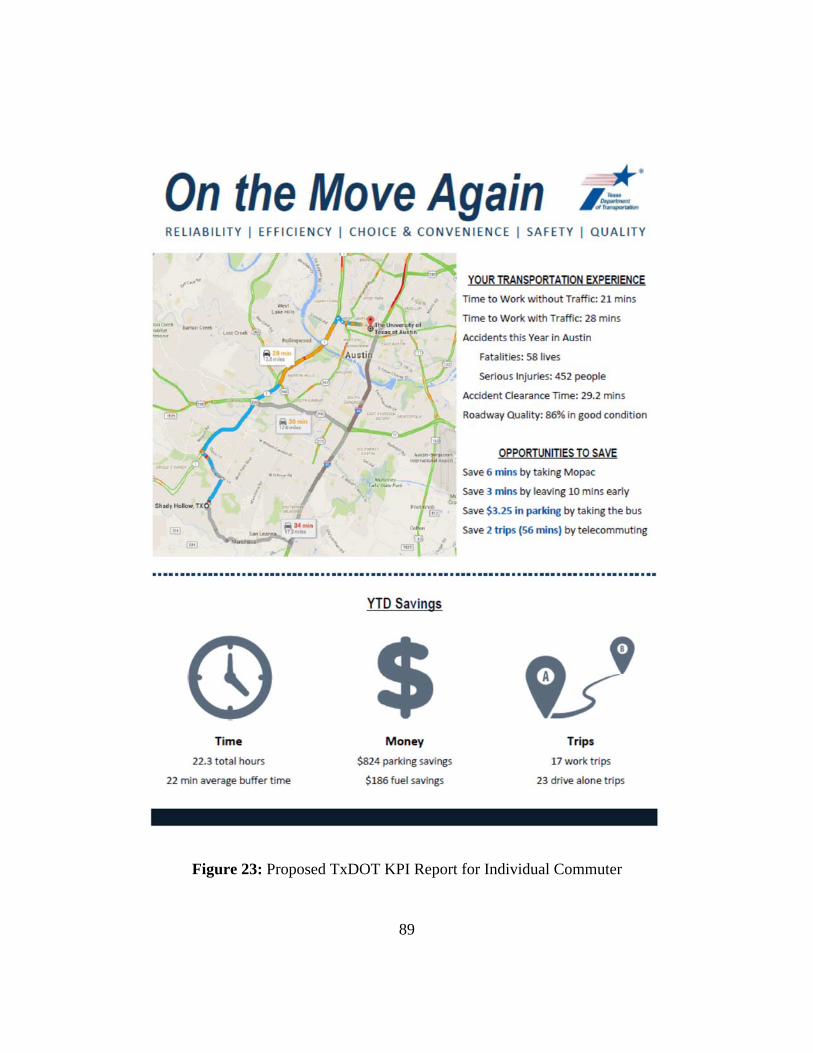
89
Figure 23: Proposed TxDOT KPI Report for Individual Commuter
90
Bibliography
Transportation for America. State Transportation Funding. 2015. Accessed: http://t4america.org/maps-tools/state-transportation-funding/#top
Turnbull. Katherine F. Aligning Data Systems to Communicate with Decision Makers: A Peer Exchange. Transportation Research Board of the National Academies. Washington, DC. 2014.
Cambridge Systematics. A Guidebook for Performance-Based Transportation Planning. NCHRP Report 446. Transportation Research Board of the National Academies. Washington, DC. 2000.
Molenaar, Keith R., Navarro, Desiderio. Key Performance Indicators in Highway Design and Construction. Transportation Research Record: Journal of the Transportation Research Board, No. 2228. Transportation Research Board of the National Academies. Washington, DC. 2011, pp. 51-58.
Federal Highway Administration (FHWA). Performance-Based Planning: Minnesota Department of Transportation. 2011. Accessed: http://www.fhwa.dot.gov/planning/performance_based_planning/case_studies/minnesota/
National Association of State Chief Information Officers (NASCIO). NASCIO Nomination Category: Data, Information, and Knowledge Management; Project Title: NC Department of Transportation Pre-Construction Project Status Dashboard. 2007. Accessed: http://www.nascio.org/portals/0/awards/nominations2007/2007/2007NC3-DOT.NASCIO%20application.pdf
Chisholm-Smith, Gwen. State DOT Public Transportation Performance Measures: State of the Practice and Future Needs. National Cooperative Highway Research Program. Transportation Research Board of the National Academies. Washington, DC. September 2011.
Virginia Department of Rail and Public Transportation (DRPT). Virginia Transit Performance Report (FY 2002 – FY 2006). 2007. Accessed: http://www.drpt.virginia.gov/media/1218/fy2002-2006-transit-performance-report-final.pdf
Minnesota Department of Transportation (MnDOT). 2014 Annual Minnesota Transportation Performance Report. 2014. Accessed: http://www.dot.state.mn.us/measures/
Oregon. Key Performance Measure Summaries. 2014. Accessed: http://www.oregon.gov/ODOT/CS/PERFORMANCE/Pages/PerformanceMeasureSummaries.aspx#Overview

91
Maryland Department of Budget and Management. Managing for Results in Maryland State Government. 1996. Accessed: http://www.dbm.maryland.gov/Pages/ManagingResultsMaryland.aspx
Maryland Department of Information Technology. Open Data Portal. 2015. Accessed: https://data.maryland.gov/
Google Now. What Is It. 2015. Accessed: https://www.google.com/landing/now/
Metropia. About. 2015. Accessed: http://www.metropia.com/about-metropia
Metropia. Metropia and the Central Texas Regional Mobility Authority Kick Off App-Based Traffic Solution. Austin, TX. May 6, 2015. Accessed: http://www.metropia.com/blog/metropia-and-central-texas-regional-mobility-authority-kick-app-based-traffic-solution
Ad Council. Buzzed Driving Case Study: Making a Difference, Drunk Driving Prevention. 2011. Accessed: http://www.adcouncil.org/Impact/Case-Studies/Buzzed-Driving-Prevention-2011
Padgette, Robert. Effective Organization of Performance Measurement. NCHRP 8-36, Task 47. Requested by American Association of State Highway and Transportation Officials (AASHTO). 2006. Accessed: http://statewideplanning.org/wp-content/uploads/19_PM-Organization.pdf
Missouri Department of Transportation (MoDOT). MoDOT’s Approach to Program Management. 2007. Accessed: http://www.modot.org/business/documents/Programmanagementsupportdocument.pdf
Rall, Jaime; Wheet, Alice; Farber, Nicholas J.; Reed, James B. Transportation Governance and Finance: A 50-State Review of State Legislatures and Departments of Transportation. National Conference of State Legislatures and AASHTO Center for Excellence in Project Finance. 2011. Accessed: http://www.mbta.com/uploadedfiles/About_the_T/Panel/TransportationGovernanceandFinance-50StateReview.pdf
Bremmer, Daniela; Cotton, Keith C.; Hamilton, Brooke. Emerging Performance Measurement Responses to Changing Political Pressures at State DOTs: A Practitioner’s Perspective. November 2004.
Federal Highway Administration (FHWA). MAP-21: Moving Ahead for Progress in the 21st Century. 2013. Accessed: https://www.fhwa.dot.gov/map21/factsheets/pm.cfm
Amekudzi, Adjo A.; Meyer, Michael. Best Practices in Selecting Performance Measures and Standards for Effective Asset Management. June 2011.
RideScout. About. 2015. Accessed: http://www.ridescoutapp.com/about-us/

92
Stein, Kathleen E. and Sloane, Robert K. Managing Change in State Departments of Transportation. Scan 4 of 8: Innovations in DOT Communications, Image, and Positioning. NCHRP Web Document 39, Transportation Research Board, National Research Council. May 2001. Accessed: http://onlinepubs.trb.org/onlinepubs/nchrp/nchrp_w39-4.pdf
Washington State Department of Transportation (WSDOT). Gray Notebook. Edition 58. June 30, 2015. Accessed: http://wsdot.wa.gov/publications/fulltext/graynotebook/Jun15.pdf
Van Wart, Montgomery. Public-Sector Leadership Theory: An Assessment. Public Administration Review. Vol. 63, No. 2. March/April 2003. Accessed: http://classes.maxwell.syr.edu/ppa753/PDF%20Files/Van%20Wart%202003.pdf
Kase, Philip “PK.” Interview. 2015.
Litman, Todd. Evaluating Transportation Economic Development Impacts: Understanding How Transport Policy and Planning Decisions Affect Employment, Incomes, Productivity, Competitiveness, Property Values, and Tax Revenues. 2010. Accessed: http://www.vtpi.org/econ_dev.pdf
Chisholm-Smith, Gwen. State Department of Transportation Role in the Implementation of Transportation Demand Management Programs. Research Results Digest 348. National Cooperative Highway Research Program. Transportation Research Board of the National Academies. Washington, DC. July 2010.
National Household Travel Survey. 2009. Accessed: http://nhts.ornl.gov/2009/pub/stt.pdf
FHWA. Virginia’s Dashboard: Driving VDOT Success. 2014. Accessed: https://www.fhwa.dot.gov/tpm/noteworthy/hif13014.pdf
TransTech Management. Strategic Performance Measures for State Departments of Transportation. 2003.
PricewaterhouseCoopers LLP. Guide to Key Performance Indicators: Communicating the Measures that Matter. 2007.
Rozner, Steve. Developing Key Performance Indicators: A Toolkit for Health Sector Managers. December 2013. Accessed: https://www.hfgproject.org/wp-content/uploads/2014/10/03-Developing-Key-Performance-Indicators.pdf
Michigan. Open Michigan: MI Dashboard. 2015. Accessed: https://midashboard.michigan.gov/
Office of the Auditor General of British Columbia. Guide for Developing Relevant Key Performance Indicators for Public Sector Reporting. 2010. Accessed: http://www.bcauditor.com/sites/default/files/publications/2010/report_10/report/OAGBC_KPI_2010_updated.pdf

93
TxDOT. Project Tracker. 2015. Accessed: http://www.txdot.gov/inside-txdot/projects/project-tracker.html
Cisco. Utah Department of Transportation Creates CommuterLink to Help Utah Residents “Know Before You Go.” 2004. Accessed: https://www.cisco.com/web/strategy/docs/trans/utah_dept_transportation.pdf
Govloop. The Govloop Guide: Big Data, Examining the Big Data Frontier, Innovations that Matter. Accessed: http://img.en25.com/Web/GovDeliveryInc/%7B2d226ca5-be34-4b05-9134-65f7925fd9fb%7D_GovLoop_Innovations_That_Matter_ Big_Data_Spring2014.pdf
American Association of State Highway and Transportation Officials (AASHTO). Communications Brief: State Departments of Transportation Lead the Way Using New Media. February 2010. Accessed: http://communications.transportation.org/ Documents/New_Media_Research_Brief%202010.pdf
Florida Transportation Commission. Performance and Production Review of the Florida Department of Transportation: FY 2013/2014. 2014. Accessed: http://www.ftc.state.fl.us/documents/reports/PPR/FY13-14FinalCombinedReport.pdf
Florida Department of Transportation (FDOT). 2014 Performance Highlights. 2014. Accessed: http://www.dot.state.fl.us/planning/performance/2014/2014PerformanceHighlights-print.pdf
Virginia Department of Transportation (VDOT). Quarterly Report: Fourth Quarter FY 2015. September 2015. Accessed: http://www.virginiadot.org/VDOT/Info/asset_upload_file723_65707.pdf
Utah Department of Transportation (UDOT). 2015 Strategic Direction. 2015. Accessed: http://www.udot.utah.gov/main/uconowner.gf?n=19974707633468335
Nevada Department of Transportation (NDOT). 2014 Performance Management Report. 2014. Accessed: https://www.nevadadot.com/uploadedFiles/NDOT/About_NDOT/NDOT_Divisions/Planning/Performance_Analysis/2014_Performance_Management_Report.pdf
Missouri Department of Transportation (MoDOT). Tracker. October 2015. Accessed: http://www.modot.org/about/documents/Oct2015Tracker.pdf
Caltrans. Strategic Management Plan: 2015-2020. 2015. Accessed: http://www.dot.ca.gov/perf/library/pdf/Caltrans_Strategic_Mgmt_Plan_033015.pdf
Sunset Advisory Commission. Summary of Sunset Legislation – 82nd Legislature. July 2011. Accessed:

94
https://www.sunset.texas.gov/public/uploads/files/reports/Department%20of%20Transportation%20SOL%202011%2082%20Leg.pdf
Texas Department of Transportation (TxDOT). 84th Legislature 2015: Mapping for the Future, Summary of Enacted Legislation. 2015. Accessed: https://ftp.dot.state.tx.us/pub/txdot-info/sla/84th-legislative-summary.pdf
Texas Government Insider. Barton Leaving TxDOT after Nearly Three-Decade Career with Agency: SB 20 Provision Could Lead to Exodus of Veterans throughout State Government. Volume 13, Issue 30. August 7, 2015. Accessed: http://www.spartnerships.com/newsletter/2015/tgi-8-7-15/texas-government-insider-8-7-15.html
Potter, Lloyd B.; Hoque, Nazrul. Office of the State Demographer. Texas Population Projections, 2010-2050. November 2014. Accessed: http://osd.texas.gov/Resources/Publications/2014/2014-11_ProjectionBrief.pdf
Batheja, Aman. Some Worry Traffic Issues Will Stem Texas’s Growth. The Texas Tribune. July 9, 2014. Accessed: http://www.texastribune.org/2014/07/09/traffic-forecasts-worsen-fears-miracle-slowing/
International Transportation Forum. What the Rise of the Sharing Economy Means for Transport. April 2015. Accessed: http://www.fiaregion1.com/en/fia_region_1/news/what-the-rise-of-the-sharing-economy-means-for-transport.htm
Batheja, Aman. TxDOT Refunding $1.7 Million for Botched Toll Bills. The Texas Tribune. March 17, 2015. Accessed: http://www.texastribune.org/2015/03/17/txdot-refunding-17-million-erroneous-toll-bills/
Strategy Analytics. 33 Billion Internet Devices by 2020: Four Connected Devices for Every Person in World. 2014. Accessed: https://www4.strategyanalytics.com/default.aspx?mod=pressreleaseviewer&a0=5609
Gonzales, Larry. On the Issues. 2015. Accessed: http://www.larrygonzales.com/meet-larry/
Collier, Kiah. Two Williamson County Republicans Will Help Negotiate State Budget. April 25, 2015. Accessed: http://www.larrygonzales.com/2015/04/two-williamson-county-republicans-will-help-negotiate-state-budget/
Stocker, Mike. The Definition of Omni-Channel Marketing – Plus 7 Tips. April 1, 2014. Accessed: http://blog.marketo.com/2014/04/the-definition-of-omni-channel-marketing-plus-7-tips.html