copyright by kathryn hoyt 2007
TRANSCRIPT

Copyright
by
Kathryn Hoyt
2007

Effect of Confinement and Gauging on the Performance of MMFX High
Strength Reinforcing Bar Tension Lap Splices
by
Kathryn Diane Hoyt, B.S.C.E
Thesis
Presented to the Faculty of the Graduate School of
The University of Texas at Austin
in Partial Fulfillment
of the Requirements
for the Degree of
Master of Science in Engineering
The University of Texas at Austin
May 2007

Effect of Confinement and Gauging on the Performance of MMFX High
Strength Reinforcing Bar Tension Lap Splices
Approved by Supervising Committee:

Dedication
To my parents, my sister Angie, and to Jacob Myers who have offered their unconditional
love and support throughout my educational journey.

v
Acknowledgements
I would like to express my sincere appreciation to my advisor Dr. Jim Jirsa for his
guidance and advice. I feel fortunate to have learned from someone who is a world-
renowned expert in the field and whose humble and personable nature has made a
significant difference in my graduate school experience.
Financial support from the South Texas Graduate Fellowship and the Phil M.
Ferguson Endowed Presidential Graduate Scholarship in Civil Engineering has allowed
me to focus on my research for which I am grateful. I would also like to thank MMFX
for their support of this project including their donation of the reinforcing bars.
The staff at the Ferguson Structural Engineering Laboratory made the completion
of this research possible. Their knowledge and assistance has been greatly appreciated.
Also, I would like to extend my thanks to Greg Glass, a fellow graduate student, for his
collaboration.
Finally, I offer my deepest gratitude to my family. Their unlimited belief in me
makes all things seem possible.
May 2007

vi
Abstract
Effect of Confinement and Gauging on the Performance of MMFX High
Strength Reinforcing Bar Tension Lap Splices
Kathryn Diane Hoyt, M.S.E.
The University of Texas at Austin, 2007
Supervisor: James O. Jirsa
Six beam specimens were tested with MMFX bars spliced in a constant moment
region. Test variables included the use of transverse reinforcement and its spacing, and
the number of spliced bars in the beam specimens. In all specimens, the bar size,
concrete strength, splice length and the bar cover was held constant. Splice confinement
was varied using transverse reinforcement
The splice lengths were instrumented with strain gauges to monitor bar stress
distribution along the splice length. Four of the beam specimens included two spliced
bars, with two of those specimens part of a collaborative test program mandating strain
gauges on splice ends only. The remaining two specimens had three spliced bars to
compare the behavior of the interior splice to that of the exterior splice. The interior

vii
splice was thought to be confined less than the exterior splice; however no difference in
behavior was noted.
Test results were compared with computed values using current development
length equations. Stress variation along bars was linear. More splice confinement
provided increased splice capacity. At high working stress levels (80-100 ksi) crack
widths exceeded code serviceability requirements for Grade 60 reinforcement. No
difference was noted in splice behavior when the splice length was gauged compared to
the splice ends gauged only.

viii
Table of Contents
Chapter 1: Background and Introduction.................................................................1 1.1 Background...............................................................................................1 1.2 Comparison of Equations for Development Length .................................2
1.2.1 ACI 408.........................................................................................2 1.2.2 ACI 318.........................................................................................5 1.2.3 Differences in Equations for Development Length ......................5
1.3 Introduction...............................................................................................6
Chapter 2: Test Program ..........................................................................................7 2.1 Description of Specimens .........................................................................7 2.2 Specimen Details and Variables ...............................................................7 2.3 Materials .................................................................................................12
2.3.1 Concrete ......................................................................................12 2.3.2 Steel.............................................................................................12
2.4 Fabrication of Specimens........................................................................13 2.5 Specimen Loading System......................................................................20
2.5.1 Constant Moment Loading System.............................................20 2.5.2 Dead Loadings on the Specimen.................................................22
2.6 Test Procedure ........................................................................................23
Chapter 3: Test Results and Observations .............................................................25 3.1 Failure Modes .........................................................................................25 3.2 Crack Widths ..........................................................................................27 3.3 Bar Stress ................................................................................................29
3.3.1 Two Splice Tests.........................................................................33 3.3.2 Effect of Strain Gauges Along Splice Length ............................37 3.3.3 Three Splice Tests.......................................................................40
Chapter 4: Evaluation of Test Results ...................................................................44 4.1 Failure Modes .........................................................................................44

ix
4.2 Crack Widths ..........................................................................................44 4.3 Comparison of Equations to Experimental Results .......................47
Chapter 5: Summary and Conclusions...................................................................50 5.1 Summary .................................................................................................50 5.2 Conclusions.............................................................................................50
References..............................................................................................................52
Vita .......................................................................................................................53

x
List of Tables
Table 2.1: Specimen Descriptions .........................................................................11
Table 4.1: Comparison of Experimental Results to Code Equations.....................49

xi
List of Figures
Figure 1.1: Potential Planes of Splitting for Two Splice and Three Splice Specimens and the Corresponding Atr and n values.........................................................4
Figure 2.1: Explanation of Test Terminology .........................................................9
Figure 2.2: Typical Cross Sections ........................................................................10
Figure 2.3: Stress-Strain Relationship for MMFX No. 8 Bars ..............................13
Figure 2.4: Finished Strain Gauge Site ..................................................................14
Figure 2.5: Gauge Placement on Splices ...............................................................15
Figure 2.6: Photos of Splice Regions Showing Gauge Placement ........................15
Figure 2.7: Fabricated Rebar Cages.......................................................................16
Figure 2.8: Rebar Cages Set in Formwork.............................................................17
Figure 2.9: Concrete Placement.............................................................................18
Figure 2.10: Consolidation and Finishing..............................................................18
Figure 2.11: Finished Specimens...........................................................................19
Figure 2.12: Photo of Test Set-up..........................................................................21
Figure 2.13: Schematic of Test Set-up...................................................................22
Figure 2.14: Example of Data Acquisition Monitoring, 8-8-OC0.........................24
Figure 3.1: Appearance of Specimen after Failure ................................................26
Figure 3.2: Crack Widths of Four Specimens with Fully Gauged Splice Lengths: 8-8-2-OC0, 8-8-2-OC1, 8-8-3-OC1, 8-8-3-OC2.................................................28
Figure 3.3: Specimen 8-8-2-OC0 (No Confinement), Typical Raw Test Data .....30
Figure 3.4: Specimen 8-8-2-OC0 (No Confinement), Strain Data Converted to Stress, Addition of Load Ratio .................................................................................31
Figure 3.5: Specimen 8-8-2-OC0 (No Confinement), Stress Along Splice at Various P/P140 Ratios, Average of Four Bars .............................................................32

xii
Figure 3.6: Specimen 8-8-2-OC0 Bar Stress Along Splice (No Confinement).....34
Figure 3.7: Specimen 8-8-2-OC1 Bar Stress Along Splice (Light Confinement) .35
Figure 3.8: Comparison of Two Splice Specimens 8-8-2-OC0 (No Confinement) to 8-8-2-OC1 (Light Confinement) Bar Stress Along Splice...............................36
Figure 3.9: Comparison of Two Splice Specimens with No Confinement 8-8-OC0 (Ends of Splice Gauged Only) to 8-8-2-OC0 (Splice Fully Gauged) Bar Stress at End of Splice.................................................................................................38
Figure 3.10: Comparison of Two Splice Specimens with Light Confinement 8-8-OC1 (Ends of Splice Gauged Only) to 8-8-2-OC1 (Splice Fully Gauged) Bar Stress at End of Splice.................................................................................................39
Figure 3.11: Specimen 8-8-3-OC1 Bar Stress Along Exterior Splice and Interior Splice (Light Confinement) ..........................................................................41
Figure 3.12: Specimen 8-8-3-OC2 Bar Stress Along Exterior Splice and Interior Splice (Heavy Confinement).........................................................................42
Figure 3.13: Comparison of Three Splice Specimens 8-8-3-OC1 (Light Confinement) to 8-8-3-OC2 (Heavy Confinement) Bar Stress Along Splice......................43
Figure 4.1: Crack Width Data of all Specimens with No. 8 bars (Including Collaborative Test Program).........................................................................46

1
Chapter 1: Background and Introduction
1.1 BACKGROUND
Microcomposite, multistructural, formable steel (MMFX) was designed as a
corrosion resistant steel and has the added benefit of high strength. The reinforcing bar is
not coated but is structured differently than conventional rebar at the atomic level to
prevent corrosion. MMFX steel costs more than conventional rebar because of its new
technology. However it may be economical if its high strength could be utilized at
stresses higher than the ACI Building Code(1) limit of 80 ksi. One issue with high
strength steel is bond and anchorage. The purpose of this study is to test MMFX
reinforcing bars splices to study bar development at high stresses.
Currently there is very little information about bond of high strength steel. The
ACI 408(2) database has a lot of bond and development test data, but almost all is for
Grade 60 steel. A series of pullout tests were conducted at Michigan Tech University to
determine whether the required development length for MMFX steel was equal to that
required of A615 Grade 60 steel(3). At North Carolina State University, beam-end pullout
tests were also conducted(4). Both studies concluded that bond behavior of MMFX steel
is similar to that of Grade 60 steel. At the University of North Florida, beams with
continuous MMFX tension steel were tested to determine if MMFX steel behaved in a
ductile manner in flexure, comparable to Grade 60 steel(5). The MMFX steel was found
to be ductile, comparable to Grade 60. The test program at NC State also included beam-
splice specimens. Bond capacity of the splices computed using code provisions and other
published equations were less than test values for MMFX bars up to the code limit of 80
ksi. Thompson et al.(6) tested wide sections with multiple lap splices of conventional

2
Grade 60 steel and found that exterior splices or splices not confined by corners of the
transverse reinforcement were weaker than interior splices.
1.2 COMPARISON OF EQUATIONS FOR DEVELOPMENT LENGTH
Current equations used to calculate splice development length are given in ACI
408R-03 and ACI 318-05.
1.2.1 ACI 408
ACI 408R-03 Equation (4-11a) was used to determine splice lengths. A
description of the equation follows.
Where,
dl = development or splice length
bd = diameter of bar being developed or spliced
yf = yield strength of steel being developed or spliced '
cf = concrete compressive strength based on 6 x 12 in. cylinders
φ = capacity-reduction factor, with a value of 1.0 for mean results and a value of
0.82 for lower fractile results
ω = 2519010 ...max
min ≤+cc
cmin = minimum of cb or cs
cmax = maximum of cb or cs
cb = bottom clear cover
cs = minimum of cso or csi
⎟⎟⎠
⎞⎜⎜⎝
⎛ +⋅
⋅⋅⋅⎟⎟⎠
⎞⎜⎜⎝
⎛⋅−
⋅=
b
tr
c
y
b
d
dKc
ff
dl
ω
λβαωφ
3.76
24004/1'
(Eq. 1-1)

3
cso = side clear cover
csi = one-half the bar clear spacing + 0.25 in.
α = reinforcement location factor
β = coating factor
λ = lightweight concrete factor
c = cmin + 0.5 bd
trK = '52.0c
trdr fns
Att⋅
⋅⋅⋅⋅
rt = 9.6Rr + 0.28 ≤ 1.72
Rr = relative rib area
dt = 0.78db + 0.22
Atr = area of each stirrup or tie crossing the potential plane of splitting adjacent to
the reinforcement being developed, spliced, or anchored
s = spacing of transverse reinforcement
n = number of bars being developed or spliced
And 0.4≤+⋅
b
tr
dKc ω
to prevent a pullout failure.
The splitting plane can propagate through the edge cover causing the clear cover
to spall off, called side splitting, as shown in Figure 1.1(a) for a two splice specimen and
(c) for a three splice specimen. Another splitting plane can propagate through the clear
cover, called face splitting, as shown in (b) for a two splice specimen and (d) for a three
splice specimen. A combination of side splitting and face splitting typically occurs,
called face-and-side-splitting. Splitting plane terminology is consistent with that used in
Orangun, Jirsa, Breen(7). For the possible splitting plane shown in Figure 1.1(a), the
splitting plane crosses the transverse reinforcement twice therefore trA = tieA⋅2 , and the
splitting plane crosses two splices therefore n = 2.

4
Figure 1.1: Potential Planes of Splitting for Two Splice and Three Splice Specimens and the Corresponding Atr and n values

5
1.2.2 ACI 318
The development length equation typically used by designers is equation (12-1) of
ACI 318-05, which is based on the expression developed by Orangun, Jirsa, and Breen(7)
and previously endorsed by Committee 408.
Where,
tψ = reinforcement location factor
eψ = reinforcement coating factor
sψ = reinforcement bar size factor
λ = lightweight concrete factor
bc = smaller of (a) distance from center of bar or wire to nearest concrete surface,
and (b) ½ the center-to-center spacing of bars or wires being developed
nsfA
K yttrtr ⋅⋅
⋅=
1500
ytf = yield strength of transverse reinforcement
And 5.2≤+
b
trb
dKc
to prevent a pullout failure.
1.2.3 Differences in Equations for Development Length
Several differences arise when comparing the two equations. A discussion of the
most significant differences follows. To account for the effect of concrete compressive
strength on bond strength, the ACI 408 equation (Eq. 1-1) specifies f’c1/4 while the ACI
318 equation (Eq. 1-2) uses f’c1/2. The calculation of the Ktr term in the ACI 408 equation
is a function of f’c, but in the ACI 318 equation Ktr does not consider f’c, resulting in the
b
b
trb
set
c
yd d
dKcf
fl ⋅
+⋅⋅⋅
⋅⋅= ))('40
3( λψψψ(Eq. 1-2)

6
ACI 318 equation producing a higher Ktr value, and therefore a lower ld, at lower values
of f’c. The limit to prevent a pullout failure is much higher in the ACI 408 equation. The
method of calculating the limit is slightly different in each equation: the ACI 408
equation uses the smaller of bottom cover and side cover times a ratio taking into account
the difference between the two covers, and the ACI 318 equation simply employs the
minimum cover or spacing. More importantly, the limit placed on the ACI 408 equation
is 4.0 while the limit placed on the ACI 318 equation is 2.5. It should be pointed out that
ACI 318 is thought of as a lower fractile equation, and is not a mean value equation
directly comparable with Φ=1.0 in the ACI 408 expression.
1.3 INTRODUCTION
To provide data on bond of high strength reinforcement, a collaborative test
program was developed and a series of tests were conducted at The University of Texas
at Austin, NC State University, and The University of Kansas. Guidelines were set for
the test procedure. Beams with two spliced MMFX reinforcing bars (No. 5, 8, or 11)
were tested. Concrete strengths of 5 ksi and 8 ksi were specified. Bar cover ranged from
¾ in to 3 in. Splice lengths and splice confinement varied. To measure strains, strain
gauges were attached at the splice ends. No gauges were attached along the splice to
ensure that bond behavior along the splice was not compromised.
The objective of the test program summarized in this report was to extend the
range of the collaborative test program by further varying the splice confinement and the
number of spliced bars. Four specimens were constructed. Two of the specimens were
duplicates of the specimens that were part of the collaborative test program but the entire
splice length was gauged for comparison with the companion tests. The other two
specimens contained three spliced bars and the confinement provided by transverse
reinforcement around the lap splice was varied.

7
Chapter 2: Test Program
2.1 DESCRIPTION OF SPECIMENS
All test specimens were beams with two or three lap spliced tension MMFX
reinforcing bars at midspan. Other properties were held constant in all specimens. No. 8
bars were used, a 1.5 in. cover was maintained around each tension bar, the splice length
was 40 in., concrete compressive strength was approximately 8 ksi, Grade 60
compression steel was used, and No. 4 Grade 60 closed ties were used outside of the
splice region as shear reinforcement. Four of the six specimens also had these ties in the
splice region.
To avoid lower bond strengths associated with top bar effects, the beams were
cast with the MMFX tension bars at the bottom of the section and rotated before testing
so that the MMFX tension bars were at the top of the beam.
During testing, the splice was under uniform stress in a constant moment region.
This was achieved with a two-point loading system.
2.2 SPECIMEN DETAILS AND VARIABLES
Beam dimensions were calculated based on given cover and bar spacings
determined in the collaborative test program. All beams were designed such that the
concrete should reach crushing strains when the MMFX steel reached a stress of 150 ksi.
The stress-strain relationship of the MMFX steel used in the designs was determined
from tension tests. Concrete stress-strain relationships were idealized using the Whitney
stress block and an ultimate strain of 0.003.
Compression steel was included to reduce the amount of concrete needed to
develop the compression zone and therefore the required height of the beams. The

8
amount of compression reinforcement was chosen to produce reasonably sized cross-
sections. All compression steel is Grade 60.
Transverse reinforcement was included outside of the test region in all specimens
to prevent shear failure. Number 4 Grade 60 ties were used as indicated in Table 2.1.
(Eq. 1-1) with Φ=1.0 was used to determine splice lengths. In the calculations, a
nominal value of relative rib area (Rr) was used. Although the relative rib area of MMFX
bars is reported to be greater than that of conventional reinforcing bars, which is 0.0727,
actual MMFX values were not known at the time of specimen design. The relative
relative rib area was assumed to be 0.075 for design, resulting in tr = 1.0. Small changes
in the value of Rr had practically no effect on calculated capacities. The Ktr term was
first assumed to be zero, which means no transverse reinforcement in the splice region,
for calculating the splice length. Then the Ktr term was varied for different confinement
levels of the splice in order to reach a predetermined stress value in the MMFX bar. For
higher levels of bar stress, Number 4 Grade 60 ties were used in the test region of all
specimens with Ktr > 0. The designs include values of Ktr selected so that stress levels of
80 ksi, 90 ksi, and 100 ksi were reached (OC0, OC1, and OC2 specimens respectively).
The splice lengths and confinement levels required to achieve the desired stresses
in the MMFX reinforcement are specified in Table 2.1. A confinement level of zero, C0,
means no confinement of the splice. A confinement level of one, C1, means light
confinement of the splice. Finally, a confinement level of two, C2, means heavy
confinement of the splice. The light and heavy confinement terms are relative to each
other for a certain specimen size.
The terminology used for the test names is consistent with that of the
collaborative test program and is described in Figure 2.1. The cross sections of the two

9
splice and three splice specimens are shown in Figure 2.2. Details of all tests are
described in Table 2.1.
Figure 2.1: Explanation of Test Terminology
Note: Only underlined parameters used in this test program

10
Figure 2.2: Typical Cross Sections
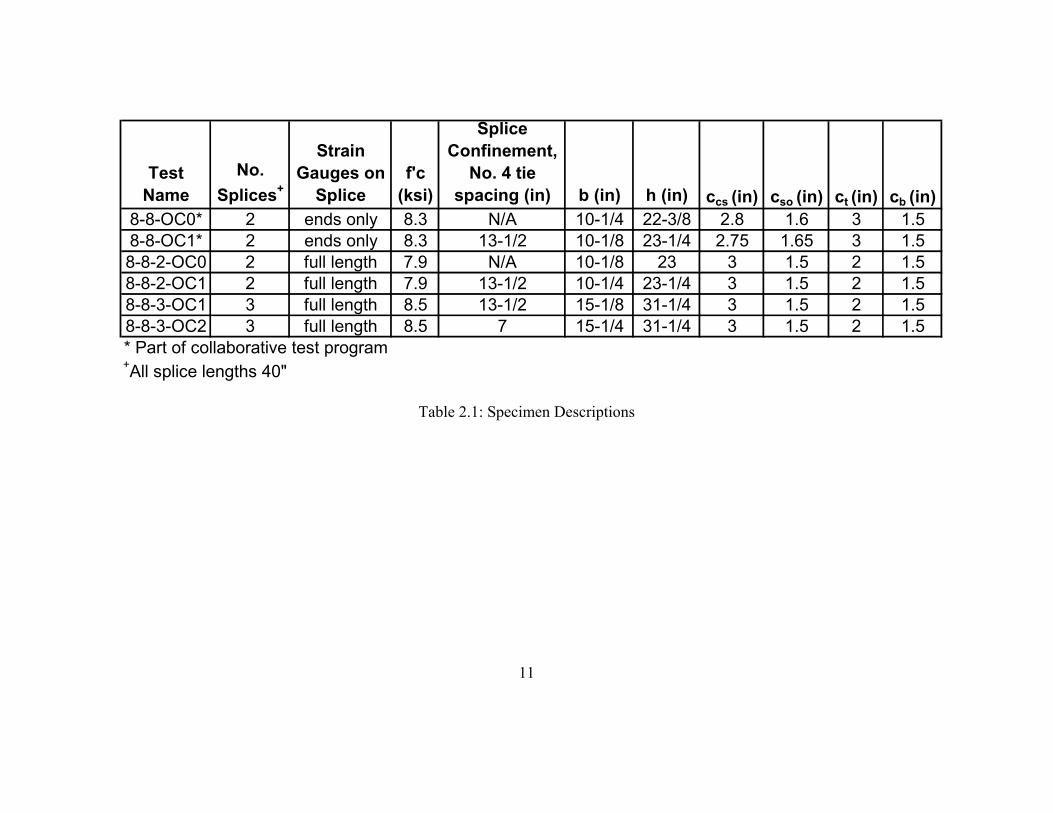
11
Test Name
No. Splices+
Strain Gauges on
Splicef'c
(ksi)
Splice Confinement,
No. 4 tie spacing (in) b (in) h (in) ccs (in) cso (in) ct (in) cb (in)
8-8-OC0* 2 ends only 8.3 N/A 10-1/4 22-3/8 2.8 1.6 3 1.58-8-OC1* 2 ends only 8.3 13-1/2 10-1/8 23-1/4 2.75 1.65 3 1.58-8-2-OC0 2 full length 7.9 N/A 10-1/8 23 3 1.5 2 1.58-8-2-OC1 2 full length 7.9 13-1/2 10-1/4 23-1/4 3 1.5 2 1.58-8-3-OC1 3 full length 8.5 13-1/2 15-1/8 31-1/4 3 1.5 2 1.58-8-3-OC2 3 full length 8.5 7 15-1/4 31-1/4 3 1.5 2 1.5
+All splice lengths 40"* Part of collaborative test program
Table 2.1: Specimen Descriptions

12
2.3 MATERIALS
2.3.1 Concrete
Ready-mix concrete from a local supplier was used to cast all specimens. Type 1
cement, sand and 1 in. gravel was used. The water-to-cement ratio was reported as 0.44.
The slump was measured from the truck to be between 6 and 8 in. for all specimens. The
design minimum compressive strength was 7000 psi. The actual compressive strengths
for each test are shown in Table 2.1 and ranged from 7900 to 8500 psi.
2.3.2 Steel
2.3.2.1 MMFX Reinforcement
Tension tests were conducted on No. 8 MMFX bars provided by the MMFX
Corporation. The bars were tested in a 600 kip capacity testing machine, and elongation
was measured using an 8 in. gauge length extensometer. Only two tests were conducted
on the No. 8 bars because they displayed consistent behavior from the first bar test to the
second bar test.
The exponential curve fit was developed using the data of the No. 8 bars. The
exponential relationship is:
)1(156 220 ε⋅−−⋅= efMMFX
The test data and best curve fit are plotted in Figure 2.3.

13
MMFX #8 Stress-Strain
0
20
40
60
80
100
120
140
160
180
0 0.005 0.01 0.015 0.02 0.025 0.03 0.035 0.04 0.045
Strain (in/in)
Stre
ss (k
si)
Bar 1
Bar 2
Exponential Best Curve Fit
Figure 2.3: Stress-Strain Relationship for MMFX No. 8 Bars
2.3.2.2 Grade 60
All compression and transverse reinforcement was Grade 60. There were no tests
run in the lab.
2.4 FABRICATION OF SPECIMENS
The MMFX tension reinforcement was cut to length. The 40 in. splice length was
measured and marked on each bar. Before the cages were constructed, the bars were
instrumented with four strain gauges placed along each splice at 10 in. spacings. A small
section of the rebar rib or lug was ground off to create a smooth, flat surface for the strain
gauge. The bar was then cleaned and the strain gauge was glued on, followed by an
application of sealant. A thin rubber pad was placed on top of the dried sealant to protect

14
the gauge, and foil tape was tightly wrapped around the entire bar. Electrical tape was
then tightly wrapped around the foil tape edges to seal the strain gauge site. The foil and
tape were pressed firmly around the rebar lugs. The finished strain gauge site was
approximately a 2 in. section covered by tape around the bar. There was concern that for
tests in the collaborative test program, gauging would destroy too much surface area and
affect bond behavior so no gauges were applied along the splice. A photograph of the
strain gauged site on a completed rebar cage is shown in Figure 2.4.
Figure 2.4: Finished Strain Gauge Site
A schematic showing gauge placement on spliced bars can be seen in Figure 2.5.
In the two splice specimen, both splices were instrumented. In the three splice specimen,
one exterior splice and the interior splice were instrumented. For the two splice
specimens that were part of the collaborative test program, only gauge 4 at the splice end
was applied to all bars. Photographs of the gauged splice region of both the two splice
specimens and the three splice specimens are shown in Figure 2.6.

15
Figure 2.5: Gauge Placement on Splices
Figure 2.6: Photos of Splice Regions Showing Gauge Placement
After gauge application, spliced bars were held in place with tie wires to create a
40 in. splice. Transverse reinforcement was carefully placed and tied, first in the test
region if necessary, and then in the shear region. For all tests, transverse reinforcement
was provided in the 5 ft shear span between the load and end support to prevent shear
failure before flexural or splice failure occurred.
Next the compression reinforcement was inserted through the stirrups and tied.
All compression reinforcement was No. 8 bars (Grade 60) cut to length. Compression
reinforcement was used so less concrete was needed to develop the compression force in
the section. Also, the compression reinforcement helped hold the transverse
reinforcement in place when the cages were later rotated and set into the formwork.
(a) Two Splice Specimens (b) Three Splice Specimens

16
Four lifting inserts were secured to the rebar cages, two on top and two on bottom
to facilitate lifting and rotating of the cured specimens with an overhead crane. Chairs
were attached to the bottom and sides of the cages to ensure the specified concrete cover.
Fabricated rebar cages before placement in forms are shown in Figure 2.7.
Figure 2.7: Fabricated Rebar Cages
At this stage of construction, gauges were on the bottom of the bars to prevent
damage from mechanical vibrators during concrete placement. Formwork sides and
bottom were constructed of plywood sheets and 2 x 4 boards. The forms were heavily
braced along the sides to maintain specimen dimensions when subjected to the pressures
of fluid concrete. The cages were lifted by crane, rotated 180º, and set into wooden
formwork. Photos of the rebar cages placed in the formwork for the two splice and three
splice specimens can be seen in Figure 2.8.

17
Figure 2.8: Rebar Cages Set in Formwork
Specimens were cast using ready-mix concrete. The slump was checked and
water was added if necessary before the concrete was placed. Concrete was placed in
three lifts using a bucket on a crane. See Figure 2.9. After each lift, the concrete was
vibrated with a mechanical vibrator. To ensure quality control, 6 in. x 12 in. cylinders
were also cast and used to measure the concrete strength throughout the curing process.
The concrete surface was screeded and then troweled, as shown in Figure 2.10, to
produce a smooth finish. See Figure 2.11.
(a) Two Splice Specimens (b) Three Splice Specimens

18
Figure 2.9: Concrete Placement
Figure 2.10: Consolidation and Finishing
(a) Slump Test (b) Use of Bucket
(a) Vibrating Concrete (b) Screeding Concrete Surface

19
Figure 2.11: Finished Specimens
After the concrete was placed, the specimens and cylinders were covered with a
polyethylene sheet for a minimum of twenty four hours to prevent shrinkage cracking.
The cylinders were cured next to the specimens in the laboratory.
When the concrete had reached sufficient strength, an overhead crane was used to
remove the specimens from the formwork, and they were placed on the lab floor to reach
their specified concrete compressive strength. When the desired concrete strength was
achieved, the specimens were lifted by overhead crane and rotated 180◦ so the spliced
bars would be on the top face (the tension face) of the beam during testing. The locations
(a) Two Splice Specimens (b) Three Splice Specimens

20
of the splice ends were marked on the beams so location of cracks relative to splice
position could be easily observed during testing. The two desired locations for ram
loading were marked on the beam to ensure the splice would remain in a constant
moment region. The specimens were then lifted by crane and placed into the test set-up
and centered above the rams that were in place on the lab floor. Strain gauge wires were
checked and connected to the data acquisition system. Final beam dimensions were
measured and recorded.
2.5 SPECIMEN LOADING SYSTEM
2.5.1 Constant Moment Loading System
All beams were simply supported on the ends with two identical point loads
applied by two hydraulic rams acting in an upward direction in the center region of the
span. This configuration was chosen to facilitate crack measurements and observation.
A photo of the test set-up can be seen in Figure 2.12 and a schematic is shown in Figure
2.13. The span is 16 ft and the spacing of the loading rams is 6 ft. Spans were chosen in
4 ft increments to align with tie down points in the laboratory strong floor. Ram spacings
were chosen to provide a constant moment region longer than the splice length, and beam
lengths were selected such that the failure loads would be compatible with the laboratory
equipment and test floor capacities.
Two large concrete blocks were used in the set-up to support the beam prior to
testing. The blocks also served as a safety system should beam failure cause the beam to
fall.
A roller with a plate was placed under each reaction beam to create a simply
supported boundary condition. The load was transferred from the rams, through the
beams, through the rollers to the reaction beams. From the reaction beams, the load was

21
transferred through tie down rods to the lab strong floor. The tie down rods were very
flexible and did not provide any longitudinal restraint to the specimens.
Two rams were connected to the same manifold to maintain constant pressure at
the rams. A load cell was placed under each ram to monitor the applied load, and a
pressure transducer was placed in the hydraulic line.
Figure 2.12: Photo of Test Set-up

22
Figure 2.13: Schematic of Test Set-up
2.5.2 Dead Loadings on the Specimen
Prior to testing, the concrete beam was resting on two large concrete blocks in the
test set-up. To initiate testing, the rams were slowly lifted causing the rollers, which were
placed on the test specimen, to make contact with the reaction frame. Once the initial

23
contact was made between the beam and the reaction frame, the ram load readings were
zeroed out in the data acquisition system to exclude the weight of the beam in the applied
ram load readings.
2.6 TEST PROCEDURE
A data acquisition system was used to monitor the different instruments. A load
cell under each ram measured the force applied to the beam. A pressure transducer in the
hydraulic line measured the pressure to the rams. Strain gauges in the splice region
measured variations in the MMFX bar strains. A deflection transducer measured the
beam deflection at midspan. The computer monitor displayed force applied to the beam
as load cell readings and strain gauge readings, which were used to monitor the rate at
which load was applied and to control load increments. Load was applied in increments
of 5 to 10 Kips or smaller as the beam approached failure. The instruments continuously
scanned during loading. The data acquisition system was not running at the end of each
load step, when cracks were measured and photographs were taken. Crack width
measurements were estimated using a crack comparator. Measurements were taken at
each load step at the two splice ends and at the center of the splice. Cracks were marked
and photos were taken to mark crack progression. An example of data acquisition output
of a two splice test conducted as part of the collaborative test program is shown in Figure
2.14, which clearly shows the increments where the loading was stopped for
measurements and observations.

24
0
0.0005
0.001
0.0015
0.002
0.0025
0.003
0 5 10 15 20 25 30 35 40
Load / Ram (kip)
Bar
Str
ain
at S
plic
e En
ds
splice failure
Load increment
Figure 2.14: Example of Data Acquisition Monitoring, 8-8-OC0

25
Chapter 3: Test Results and Observations
3.1 FAILURE MODES
The failure modes in all tests were similar in that splitting of the concrete cover
caused splice failure, which is shown in Figure 3.1. Initial splitting occurred in the cover
of the edge bar, perpendicular to the splice, called side splitting. As load increased and
bar stress increased, more load was transferred along the splice length and therefore
cracks progressed in regular increments down the splice length, perpendicular to the
splice. At high loads, cracks developed on top of the splice length, called face splitting.
In tests without splice confinement, much more concrete spalled off compared to tests
with splice confinement. The two splice specimens failed in a combination of face and
side splitting. The three splice specimens failed in side splitting.

26
Figure 3.1: Appearance of Specimen after Failure
(a) 8-8-2-OC0: Face and Side Split Failure (b) 8-8-2-OC1: Face and Side Split Failure
(c) 8-8-3-OC1: Side Split Failure (d) 8-8-3-OC2: Side Split Failure

27
3.2 CRACK WIDTHS
The bar stress was highest at the splice ends, and therefore flexural cracks at
splice ends formed first and were the widest cracks throughout the test. Crack widths at
splice ends were measured using a crack comparator at each load step.
Crack width data is graphed in Figure 3.2 for the four specimens with the splice
fully gauged: 8-8-2-OC0 (two splice specimen with no confinement), 8-8-2-OC1 (two
splice specimen with light confinement), 8-8-3-OC1 (three splice specimen with light
confinement), and 8-8-3-OC2 (three splice specimen with heavy confinement). Cracks at
both ends of the splice are shown. Crack widths at midsplice were monitored but
remained very small and did not progress as stress increased and are not included in the
graph. ACI 318 historical crack width limits at service loads (approximately 0.6.fy) are
included for reference.
Crack widths at splice ends did not increase linearly with bar stress but increased
exponentially until failure occured.

28
0
0.01
0.02
0.03
0.04
0.05
0.06
0 20 40 60 80 100 120
Bar Stress (ksi)
Cra
ck W
idth
(in)
2 splice fully gauged
3 splice fully gauged
Exterior Limit (0.013 in)
Interior Limit (0.016 in)
Figure 3.2: Crack Widths of Four Specimens with Fully Gauged Splice Lengths: 8-8-2-OC0, 8-8-2-OC1, 8-8-3-OC1, 8-8-3-OC2

29
3.3 BAR STRESS
The data from the data acquisition system was in terms of strain and force as
shown in Figure 3.3. Irregularities in the plot that were obviously due to the interruptions
of loading when the desired load increment was reached were smoothed out. Strain
gauge readings were converted to stress using the stress-strain relationship for MMFX
bars.
The ram load needed to produce a bar stress of 140 ksi was used to normalize the
load for each specimen. For example, using (Eq. 1-1) for specimen 8-8-2-OC0 shown in
the following figures, a calculated ram load of 70.97 kips would produce a bar stress of
140 ksi. A P/P140 ratio of 0.5 would indicate a ram load of 35.49 kips, which resulted in a
bar stress of 73 ksi during testing of the specimen. See Figure 3.4.
Bar stress was then plotted along the splice length for various load ratios. This
allowed the comparison of different tests in terms of load ratios. Stress readings for four
bars were averaged into a single curve as seen in Figure 3.5. Similar procedures were
used for all tests.

30
0
5
10
15
20
25
30
35
40
45
0 0.0005 0.001 0.0015 0.002 0.0025 0.003 0.0035 0.004
Bar Strain
Load
/ R
am (k
ip)
Strain 1,1 Strain 1,2 Strain 1,3 Strain 1,4 Strain 3,1 Strain 3,2 Strain 3,3 Strain 3,4Strain 2,1 Strain 2,2 Strain 2,3 Strain 2,4 Strain 4,1 Strain 4,2 Strain 4,3 Strain 4,4
Figure 3.3: Specimen 8-8-2-OC0 (No Confinement), Typical Raw Test Data

31
0
5
10
15
20
25
30
35
40
0 10 20 30 40 50 60 70 80 90
Bar Stress (ksi)
Load
/ R
am (k
ip)
0.00
0.07
0.14
0.21
0.28
0.35
0.42
0.49
0.56
P/P 1
40
Stress Bar 1, Gauge 1 Stress 1,3 Stress 1,4 Stress 3,1 Stress 3,2Stress 3,3 Stress 3,4 Stress 2,1 Stress 2,2 Stress 2,3Stress 2,4 Stress 4,2 Stress 4,3 Stress 4,4
Figure 3.4: Specimen 8-8-2-OC0 (No Confinement), Strain Data Converted to Stress, Addition of Load Ratio

32
0
10
20
30
40
50
60
70
80
90
0 1 2 3 4
Location Along Splice Length
Bar
Str
ess
(ksi
) Mea
sure
d fr
om S
trai
ns Typ. Average 4 Bars
0.18
0.32
0.53
Figure 3.5: Specimen 8-8-2-OC0 (No Confinement), Stress Along Splice at Various P/P140 Ratios, Average of Four Bars

33
3.3.1 Two Splice Tests
The stress variation along the splice of the two splice specimen with no splice
confinement is shown in Figure 3.6. The stress variation along the splice of the two
splice specimen with light splice confinement (No. 4 stirrups spaced at 13.5 in) is shown
in Figure 3.7.
Both specimens initially show higher stresses at the splice end, but the curve
gradually becomes linear near failure. At low stress levels, the splice end is carrying
much higher stress than at the splice midspan. This is probably due to the cracking
patterns discussed earlier. A comparison of the two splice specimen bar stress along the
splice with no confinement to bar stress along the splice with light confinement is shown
in Figure 3.8. At comparable stress levels there is very little difference between the
specimen without confinement and the specimen with light confinement. There is a
greater difference between the two specimens at low stress levels. As the specimen
reaches failure, this level of confinement does not appear to affect bar stress in the splice.

34
0
10
20
30
40
50
60
70
80
90
0 1 2 3 4
Location Along Splice Length
Stre
ss (k
si)
Mea
sure
d fr
om S
trai
ns
0
10
20
30
40
50
60
70
80
90
0.18
0.32
0.54(failure)
Figure 3.6: Specimen 8-8-2-OC0 Bar Stress Along Splice (No Confinement)

35
0
20
40
60
80
100
120
0 1 2 3 4
Location Along Splice Length
Stre
ss (k
si)
Mea
sure
d fr
om S
trai
ns
0
20
40
60
80
100
120
0.2
0.5
0.78(failure)
Figure 3.7: Specimen 8-8-2-OC1 Bar Stress Along Splice (Light Confinement)

36
0
10
20
30
40
50
60
70
80
0 1 2 3 4Location Along Splice Length
Stre
ss (k
si)
Mea
sure
d fr
om S
trai
ns
Typ. 8-8-2-OC0Typ. 8-8-2-OC1
0.2
0.35
0.5
Figure 3.8: Comparison of Two Splice Specimens 8-8-2-OC0 (No Confinement) to 8-8-2-OC1 (Light Confinement) Bar Stress Along Splice

37
3.3.2 Effect of Strain Gauges Along Splice Length
A comparison of bar stress versus ram load for the two splice specimens with
strain gauges at splice ends only (tested by Glass(8)) to the stresses with the splice length
fully gauged provides an indication of any loss of strength due to the disruption of bond
at the three additional strain gauge locations along the splice length. A comparison of the
two splice specimens with no splice confinement is shown in Figure 3.9, and a
comparison of specimens with light confinement is shown in Figure 3.10.
The additional gauges appear to have little or no effect on the bond behavior.
This may be due to the fact that only one bar lug was ground off to attach the strain
gauge. Since the force required to split the concrete cover is the same regardless of the
number of lugs acting against the cover along the 40 in. splice, the loss of a small
protrusion of the contact area between the bar and the concrete did not alter bond
behavior. The loss of contact may be more pronounced in cases where pullout failure
occurs.

38
0
10
20
30
40
50
60
70
80
0 5 10 15 20 25 30 35 40
Avg Load/Ram (K)
Avg
Bar
Str
ess
(ksi
) Mea
sure
d fr
om S
trai
ns
only splice ends gauged
splice length gauged
Figure 3.9: Comparison of Two Splice Specimens with No Confinement 8-8-OC0 (Ends of Splice Gauged Only) to 8-8-2-OC0 (Splice Fully Gauged) Bar Stress at End of Splice

39
0
20
40
60
80
100
120
0 10 20 30 40 50 60 70
Avg Load/Ram (K)
Avg
Bar
Str
ess
(ksi
) Mea
sure
d fr
om S
trai
ns
only splice ends gauged
splice length gauged
Figure 3.10: Comparison of Two Splice Specimens with Light Confinement 8-8-OC1 (Ends of Splice Gauged Only) to 8-8-2-OC1 (Splice Fully Gauged) Bar Stress at End of Splice

40
3.3.3 Three Splice Tests
The bar stress readings of the two bars creating the exterior splice were averaged
into a single “exterior bar” curve, and the same was done with the interior splice stress
readings to create an “interior bar” curve. The bar stress variation along the exterior
splice and along the interior splice for the three splice specimen with light confinement
(No. 4 stirrups at 13.5 in) is shown in Figure 3.11. The bar stress variation for the
specimen with heavy confinement (No. 4 stirrups at 7 in) is shown in Figure 3.12. The
three splice specimens show similar trends as the two splice specimens. At low stress
levels, the stress along the splice is nonlinear, and gradually becomes linear as the
specimen approaches failure. There does not appear to be a significant difference
between interior and exterior splices.
A comparison of bar stresses along the exterior splice and along the interior splice
of the three splice specimen with light confinement to bar stress along the splices with
heavy confinement is shown in Figure 3.13. For comparable load ratios, there is virtually
no difference between the low and high levels of confinement. The highly confined
splice has a higher capacity than the lightly confined splice. At higher load ratios as the
stresses increase, more splitting occurs and the steel carries more stress so there is a
greater difference between the light and high confined specimens.

41
0
10
20
30
40
50
60
70
80
90
100
110
120
0 1 2 3 4
Location Along Splice Length
Stre
ss (k
si)
Mea
sure
d fr
om S
trai
ns
0
10
20
30
40
50
60
70
80
90
100
110
Typ. Exterior SpliceTyp. Interior Splice
0.24
0.50
0.78, failure
Figure 3.11: Specimen 8-8-3-OC1 Bar Stress Along Exterior Splice and Interior Splice (Light Confinement)

42
0
10
20
30
40
50
60
70
80
90
100
110
120
130
140
0 1 2 3 4
Location Along Splice Length
Stre
ss (k
si)
Mea
sure
d fr
om S
trai
ns
0
10
20
30
40
50
60
70
80
90
100
110
120
130
Typ. Exterior SpliceTyp. Interior Splice
0.30
0.50
0.92, failure
Figure 3.12: Specimen 8-8-3-OC2 Bar Stress Along Exterior Splice and Interior Splice (Heavy Confinement)

43
0
10
20
30
40
50
60
70
80
90
100
110
0 1 2 3 4
Location Along Splice Length
Stre
ss (k
si) M
easu
red
from
Str
ains
0
10
20
30
40
50
60
70
80
90
100
1108-8-3-OC1 Exterior Splice8-8-3-OC1 Interior Splice8-8-3-OC2 Exterior Splice8-8-3-OC2 Interior Splice
0.30
0.50
0.70
Figure 3.13: Comparison of Three Splice Specimens 8-8-3-OC1 (Light Confinement) to 8-8-3-OC2 (Heavy Confinement) Bar Stress Along Splice
44
Chapter 4: Evaluation of Test Results
4.1 FAILURE MODES
As indicated in Figure 4.1, the two splice and three splice specimens resulted in
different splitting planes. Different Ktr values would be computed for the two and three
splice cases. For a two splice specimen, Figure 1.1(a) and (b) show the two different
splitting planes have the same Atr/n value in the Ktr term meaning that both splitting
planes may occur. Test results shown in Figure 3.1(a) and (b) indicate that the failure
mode was a combination of Figure 1.1(a) and (b), face and side splitting.
For the three splice specimen, the different Ktr value is based on splitting planes
as shown in Figure 1.1(c) and (d). The side splitting mode shown in Figure 1.1(c) results
in a lower Ktr value than (d) and therefore side splitting is the controlling mode of failure,
which is supported by the test results shown in Figure 3.1(c) and (d).
When transverse reinforcement provides large confinement, bar pullout is the
mode of failure. To reflect mode of failure, the code sets a limit to the confinement term
that includes bar cover and amount of transverse reinforcement. The ACI 408 (Eq. 1-1)
limit is 4.0, and the ACI 318 (Eq. 1-2) limit is 2.5. No tests discussed herein resulted in
pullout failure although the ACI 318 limit was exceeded in several specimens and a
pullout failure did not occur.
4.2 CRACK WIDTHS
In the ACI 318 code, cracking serviceability checks are based on the Gergely-
Lutz equation(9):
Where:
3076.0 Adfw csβ= (Eq. 4-1)

45
w = expected maximum crack width in 0.001 in. units
β = ratio of distances to the neutral axis from the extreme tension fiber and from
the centroid of As.
fs = steel stress in ksi
dc = cover of outermost bar of As, measured to the center of the bar
A = tension area per bar measured as the area centered around the c.g. of the
tension bars divided by the number of tension bars.
For simplicity, β is often taken as 1.2; however, a β value of 1.1 is more accurate
for the beam designs used in these tests. In Figure 4.1, all of the end-of-splice crack
width data for the No. 8 specimens in the collaborative test program is plotted and
compared with (Eq. 4-1). Again, the nonlinear increase in crack widths with increasing
bar stress is clear. At low stress levels, the data points fall within a narrow band, below
the line predicted by (Eq. 4-1), and begin to spread as bar stresses exceed about 60 ksi. It
is also indicated in Figure 4.1 that crack widths exceed the generally accepted limiting
values of 0.013 in. for exterior exposure and 0.016 in. for interior exposure at around 60
ksi. At working stress levels in the serviceability range of 0.6.fy, conventional Grade 60
steel with a bar stress of 36 ksi is well below the implied code crack width limits.
However, at serviceability range for MMFX steel, say fy = 120 ksi, working stress levels
reach 72 ksi; crack widths are well above implied code limits and some data falls above
the calculated crack width curve. Reinforcement stressed to high levels (>60 ksi) results
in wider cracks. Current codes do not explicitly address cracking at high stresses;
however; the bar stress limit of 80 ksi is implemented due to crack width concerns at high
stress levels.

46
0
0.01
0.02
0.03
0.04
0.05
0.06
0.07
0 20 40 60 80 100 120
Bar Stress (ksi)
Cra
ck W
idth
(in)
Two Splice (Collaborative Test Program)
Two Splice Fully Gauged
Three Splice Fully Gauged
Gergely-Lutz
Gergely-Lutz + 50%
Gergely-Lutz - 50%
Interior Limit (0.016 in)
Exterior Limit (0.013 in)
Figure 4.1: Crack Width Data of all Specimens with No. 8 bars (Including Collaborative Test Program)

47
4.3 Comparison of Equations to Experimental Results
The experimental results are compared with values from (Eq. 1-1) and (Eq. 1-2)
with Φ=1.0 in Table 4.1. As the splice confinement was increased, the ratio of measured
stress to calculated stress (ftest/fcalc) increased indicating that both equations do not
adequately account for splice confinement.
Failure stress computed using ACI 408 (Eq. 1-1) for both two splice specimens
without splice confinement was higher than measured, and lower than measured for
specimens with confinement.
Failure stress computed using ACI 318 (Eq. 1-2) was higher than measured for
every specimen except the three splice specimen with heavy confinement. This suggests
that the equation may not be adequate for the high stress levels that can be achieved by
MMFX steel. In specimens that reached the pullout failure code limit (2.5) marked with + in Table 4.1, the ftest/fcalc ratio is higher than in the specimen where the limit is not
reached. For example, for specimen 8-8-2-OC1 with cb = 2.0 in., Ktr = 0.60, and db = 1.0
the confinement term is:
However, with the limited number of tests it is not possible to determine if this is a
significant trend.
The average ftest/fcalc ratio for ACI 408 (Eq. 1-1) is greater than 1.0 and is less than
1.0 for ACI 318 (Eq. 1-2). At high stresses, ACI 408 provides a good estimate of mean
failure stresses. It should be noted that ACI 318 (Eq. 1-2) was developed primarily from
test data with failure at 60 ksi or less, and has a limit fy=80 ksi, and was developed for
use in design with Grade 60 reinforcement.
5.26.21
6.02>=
+=
+
b
trb
dKc governsSo 5.2

48
The interior splice was expected to carry lower stresses than the exterior splice;
however test results did not support this hypothesis. To explain the differences between
the interior splice and the exterior splice, the two splice specimen is compared to the
three splice specimen. Comparing Ktr values for a three splice specimen to that of a two
splice specimen in Table 4.1, the differences are not large enough to evaluate the limit on
Ktr. If more tests were to be conducted, three splice specimens should be constructed
with the spacing between the interior and exterior splices increased to create a greater
difference between the Ktr parameters, which is a function of bar cover in both (Eq. 1-1)
and (Eq. 1-2).

49
Test Name
f'c (ksi)
c(ACI 408), cb(ACI 318)
(in)
(c*ω+Ktr)/db
< 4.0 (ACI408) Ktr (ACI 408)
(cb+Ktr)/db
< 2.5 (ACI318) Ktr (ACI 318)
fexperimental
(ksi)
(Eq. 1-1) fACI 408
(ksi)
(Eq. 1-2) fACI 318
(ksi)fexperimental/
fACI408
fexperimental/ fACI318
8-8-OC0* 8.3 2 -- 0 -- 0 79 81 97 0.98 0.818-8-OC1* 8.3 2 2.71 0.71 2.5+ 0.60 114 102 121 1.12 0.948-8-2-OC0 7.9 2 -- 0 -- 0 78 80 95 0.98 0.828-8-2-OC1 7.9 2 2.69 0.69 2.5+ 0.60 107 100 119 1.07 0.908-8-3-OC1 8.5 2 2.48 0.48 2.40 0.40 105 96 118 1.09 0.898-8-3-OC2 8.5 2 2.96 0.96 2.5+ 0.80 129 110 123 1.17 1.05
AVG: 1.07 0.90* Part of collaborative test program+Code LimitNote: All splice lengths, ld = 40 in, all bar diameters, db = 1 in, all factors = 1
Table 4.1: Comparison of Experimental Results to Code Equations

50
Chapter 5: Summary and Conclusions
5.1 SUMMARY
The test program consisted of six beam specimens with MMFX rebar splices in a
constant moment region. Test variables included the use of transverse reinforcement and
its spacing, and the number of spliced bars in the beam specimens. In all specimens, the
rebar was No. 8, the concrete was 8 ksi, the splice length was 40 in. and the cover was 1.5
in. on all sides of the bar. Specimens with transverse reinforcement involved No. 4
Grade 60 ties.
The splice lengths were instrumented with strain gauges to monitor bar stress
distribution along the splice length. Four of the beam specimens included two spliced
rebars, with two of those specimens part of a collaborative test program mandating strain
gauges on splice ends only. The remaining two specimens consisted of three spliced
rebars.
5.2 CONCLUSIONS
Based on test observations, the following conclusions are made:
1. The development length equation in ACI 318-05 was not adequate at the high
stresses at which the confined splices with MMFX steel failed. The ACI 408
equation provided a good estimate of mean failure stresses at high stresses. Both
equations predicted lower strengths than measured in specimens with
confinement.
2. The bar stress distribution along the splice length was nonlinear at low stress
levels, but as the splice nears failure, the bar stress distribution was linear along

51
the splice length. The linear nature of the current development length code
equation is acceptable.
3. In the three splice specimens, the behavior of the interior splice was nearly
identical to that of the exterior splice. Two specimens were tested with three
splices with different levels of confinement, and one resulted in the exterior splice
carrying more stress than the interior splice at failure and the second test resulted
in the opposite conclusion.
4. High steel stresses resulted in greater crack widths than currently acceptable for
service load stresses using Grade 60 steel. The equation used to determine
serviceability limits only appears to be effective for stress levels of 60 ksi or less.
5. There did not appear to be a difference in bond behavior between the specimens
with fully gauged splices and those with gauges on splice ends only. Since
splitting controlled failure, the tightly wrapped tape that was used to seal the
strain gauge did not reduce the restraint of the cover concrete and the remaining
lugs were sufficient to produce splitting.
52
References
1. ACI Committee 318, Building Code Requirements for Structural Concrete (ACI 318-05), American Concrete Institute, Farmington Hills, Mich., 2005.
2. ACI Committee 408, Bond and Development of Straight Reinforcing Bars in Tension (ACI 408R-03), American Concrete Institute, Farmington Hills, Mich., 2003.
3. Ahlborn, T., and DenHartigh, T., “A Comparative Bond Study of MMFX Reinforcing Steel in Concrete,” Michigan Tech University, Center for Structural Durability, Houghton, MI, 2002.
4. El-Hacha, R.; El-Agroudy, H.; Rizkalla, S., “Bond Characteristics of High-Strength Steel Reinforcement,” ACI Structural Journal, V. 103, No. 6, Nov.-Dec. 2006, pp. 771-782.
5. Malhas, F., “Preliminary Experimental Investigation of the Flexural Behavior of Reinforced Concrete Beams Using MMFX Steel,” University of North Florida, Jacksonville, FL, 2002.
6. Thompson, M.A.; Jirsa, J.O.; Breen, J.E.; Meinheit, D.F., “Behavior of Multiple Lap Splices in Wide Sections,” ACI Journal, Feb. 1979, pp. 227-248.
7. Orangun, C.O.; Jirsa, J.O.; Breen, J.E., “A Reevaluation of Test Data on Development Length and Splices,” ACI Journal, March 1977, pp. 114-122.
8. Glass, G.M., “Performance of Tension Lap Splices with MMFX High Strength Reinforcing Bars,” Unpublished Thesis, The University of Texas at Austin, to be published 2007.
9. Gergely, P. and Lutz, L. A., “Maximum Crack Width in Reinforced Concrete Flexural Members,” Special Publication SP-20, American Concrete Institute, 1968, pp.87-117.

53
Vita
Kathryn Diane Hoyt was born in San Antonio, TX on December 30, 1982 to John
and Mari Hoyt. She has one older sister, Angie. After graduating from John Marshall
High School, she attended The University of Texas at San Antonio. She received her
Bachelor of Science in Civil Engineering in December 2004. She then worked as an
engineer in training at Baker Engineering and Risk Consultants. In August 2005 she
began her graduate studies at The University of Texas at Austin working as a research
assistant at the Phil M. Ferguson Structural Engineering Laboratory. She will receive her
Master of Science in May 2007 under the direction of Dr. James O. Jirsa.
Permanent address: 7035 Forest Mont
San Antonio, Texas 78240
This dissertation was typed by the author.