copyright by brian james petruzzi 2010
TRANSCRIPT

Copyright
By
Brian James Petruzzi
2010

The thesis committee for Brian James Petruzzi
certifies that this is the approved version of the following thesis:
Stabilizing Techniques for Curved Steel I-Girders During Construction
APPROVED BY
SUPERVISING COMMITTEE:
Todd A. Helwig, Supervisor
Michael D. Engelhardt

Stabilizing Techniques for Curved Steel I-Girders During Construction
by
Brian James Petruzzi, B.S.C.E
Thesis
Presented to the Faculty of the Graduate School of
The University of Texas at Austin
in Partial Fulfillment
of the Requirements
for the Degree of
Master of Science in Engineering
The University of Texas at Austin
May 2010

Dedication
To my parents, whose love and support have made this possible and to my sister, who has
always inspired me to be the best person I can be.

v
Acknowledgements
I would like to thank the Texas Department of Transportation for funding an
abundance of projects at Fergusson Structural Engineering Laboratory and allowing
students such as myself the opportunity to conduct research. I have enjoyed my time at
The University of Texas a great deal and attribute a large amount of that enjoyment to my
experiences and friendships developed at FSEL.
I also feel very fortunate to have been placed on an incredible research team. All
four of the professors who have been involved in the curved girder research project, Todd
Helwig, Eric Williamson, Karl Frank, and Michael Engelhardt, have provided me endless
guidance and support which was invaluable to the success and completion of this thesis.
The advice given to me by Dr. Helwig and Dr. Engelhardt throughout the writing process
was greatly appreciated and this thesis is better because of it. I would particularly like to
thank the PhD student on the project, Jason Stith, for being an incredible mentor. Jason’s
hard work, thoroughness, and curiosity in his own research was inspirational to me I
immensely enjoyed all of the time spent with him over the past two years. I attribute
much of my research success at UT to him and wish him the best in the future.
Lastly I would like to thank my parents, Jim and Carol, and my sister, Heather,
who have always supported me in the decisions I have made in all aspects of my life.
Although they may not agree with everything I do, it is because of their continued
support and love that I have the confidence, ability, and most of all the opportunity to
come to Texas to complete my Master’s Degree. They are greatly appreciated and I owe
them everything.
Brian J. Petruzzi
May 7, 2010

vi
Stabilizing Techniques for Curved Steel I-Girders During Construction
Brian James Petruzzi, M.S.E.
The University of Texas at Austin, 2010
SUPERVISOR: Todd Helwig
There are many issues and challenges to deal with when designing a curved I-
girder bridge. These challenges primarily deal with the many performance stages that
curved I-girder bridges have such as the erection, construction, and in-service stages.
When design engineers assess the stability of a bridge system, they typically evaluate the
system in its final configuration with all cross frames attached and the hardened concrete
deck placed. The evaluation of girder stability during erection and early stages of
construction stages is difficult because of the limited presence of bracing in the system.
Due to a lack of readily available analytical tools, many contractors do not conduct
detailed analytical evaluations of the bridge behavior during early stages of the
construction when stability is often critical. Instead, many contractors use rules of thumb
and experience to ensure stability during erection. Erection and construction practices
typically vary among contractors and consistent erection methods are a rarity. Although
some rules of thumb may be quite conservative, others are much less so. Therefore,
coming up with design guidelines based on parametric studies rather than rules of thumb
are desirable to help allow the contractor and the designer to work together to prevent
issues that may occur due to the lack of communication between the two professions.
Lastly, many challenges arise due to the complex geometry of curved I-girders.
To prevent excessive rotation in erected girders, three points of vertical support are often
vii
provided. Two of these points usually consist of permanent supports in the form of
bridge piers or abutments. The third point of support may consist of a temporary support
in the form of a shore tower or holding crane. Cases where a holding crane may be
satisfactory over a shore tower are also not well understood.
To improve the understanding of lifting practices and temporary support
requirements, parametric studies were conducted using the finite element program
ANSYS. Field data consisting of displacement, stress, and girder rotations gathered from
two tests were used to validate both the linear and geometric non-linear three-
dimensional FEA models. Upon validation, the finite element model was used to conduct
linear and geometric non-linear analyses to determine critical factors in curved I-girder
bridges during construction. Specifically, serviceability limit states were studied for the
lifting of curved girders. For partially constructed states, parametric studies were
conducted to determine optimal locations to place temporary supports as well as to
investigate stability differences between using a shore tower and a holding crane.
Recommendations are presented to provide guidance for the lifting of curved I-girders as
well as to maximize stability of partially constructed bridges.

viii
Table of Contents CHAPTER 1 Introduction................................................................................................... 1
1.1 Overview ............................................................................................................ 1
1.2 Scope of Study .................................................................................................... 4
1.3 Thesis Overview ................................................................................................. 5
CHAPTER 2 Background and Literature Review .............................................................. 6
2.1 Introduction ........................................................................................................ 6
2.2 Recent Work by Others ...................................................................................... 6
2.2.1 Effects of Web Plumbness on Girder Rotation ........................................ 6
2.2.2 Girder Lateral Torsional Buckling ........................................................... 7
2.2.3 Flange Local Buckling ............................................................................. 9
2.3 Work Previously Completed on TxDOT Project 0-5574 ................................. 10
2.3.1 Girder Lifting Field Tests ...................................................................... 10
2.3.2 Finite Element Analysis of Lifting of Curved Girders .......................... 11
2.3.3 Nationwide Survey of Erectors .............................................................. 12
2.3.4 Development of Analysis Tools............................................................. 12
2.4 Summary .......................................................................................................... 13
CHAPTER 3 Non-Linear Analysis of Lifting of Curved Steel I-Girders ........................ 14
3.1 Introduction ...................................................................................................... 14
3.2 Modeling Approaches ...................................................................................... 15
3.3 Research Objectives ......................................................................................... 17
3.4 Previous Work on Lifting of Curved Girders for Project 0-5574 .................... 17
3.4.1 Rigid Body Girder Rotations ................................................................. 19
3.4.2 Buckling Expressions for Girder Stability ............................................. 20
3.5 Study Description ............................................................................................. 29
3.5.1 Finite Element Modeling Technique ..................................................... 29
3.5.2 Parameter Descriptions .......................................................................... 30
3.5.3 Parameter Ranges ................................................................................... 31
3.6 Results of Parametric Studies ........................................................................... 33

ix
3.6.1 Overview ................................................................................................ 33
3.6.2 Using Eigenvalues to Predict Instability of Curved Girders .................. 33
3.6.3 Additional Failure Criteria for Lifting of Horizontally Curved I-Girders
35
3.6.4 Controlling Girder Rotation during Lifting ........................................... 40
3.6.5 Preferred Lifting Locations .................................................................... 50
3.7 Conclusions ...................................................................................................... 57
3.7.1 Eigenvalues ............................................................................................ 57
3.7.2 Rotation Limits ...................................................................................... 57
3.7.3 Lifting Location Limits .......................................................................... 58
3.7.4 Preferred Lifting Locations .................................................................... 58
CHAPTER 4 Parametric Studies on the Behavior of Partially Constructed Bridges with
Curved Steel I-Girders ...................................................................................................... 60
4.1 Introduction ...................................................................................................... 60
4.2 Background on Shore Towers and Holding Cranes ......................................... 61
4.3 Study Objectives and Description .................................................................... 64
4.3.1 Parameter Descriptions .......................................................................... 64
4.3.2 Parameter Ranges ................................................................................... 65
4.4 Results of Parametric Studies ........................................................................... 67
4.4.1 Shore Tower Location ............................................................................ 67
4.4.2 Holding Crane Location ......................................................................... 71
4.4.3 Holding Crane Lifting Load ................................................................... 73
4.5 Load Height Effects .......................................................................................... 77
4.5.1 Shore Towers ......................................................................................... 77
4.5.2 Holding Cranes ...................................................................................... 79
4.6 Critical Stages During Construction ................................................................. 82
4.7 Conclusions ...................................................................................................... 85
CHAPTER 5 Conclusions and Recommendations ........................................................... 87
5.1 Introduction ...................................................................................................... 87

x
5.2 Non-Linear Analysis of Lifting of Curved Steel I-Girders .............................. 88
5.3 Partially Constructed Bridges ........................................................................... 89
APPENDIX A Parametric Study Summary for the Lifting of Curved Steel I-Girders .... 91
A.1 Parametric Study Summary .............................................................................. 91
A.1.1 Study One............................................................................................... 92
A.1.2 Study Two .............................................................................................. 98
A.1.3 Study Three .......................................................................................... 105
A.1.4 Study Four ............................................................................................ 109
A.1.5 Study Five ............................................................................................ 112
A.1.6 Study Six .............................................................................................. 116
APPENDIX B Parametric Study Summary for Partially Constructed Bridges during
Erection ........................................................................................................................... 120
B.1 Parametric Study Summary ............................................................................ 120
B.1.1 Study One............................................................................................. 121
B.1.2 Study Two ............................................................................................ 127
B.1.3 Study Three .......................................................................................... 133
References ....................................................................................................................... 145
Vita .................................................................................................................................. 147
xi
List of Tables
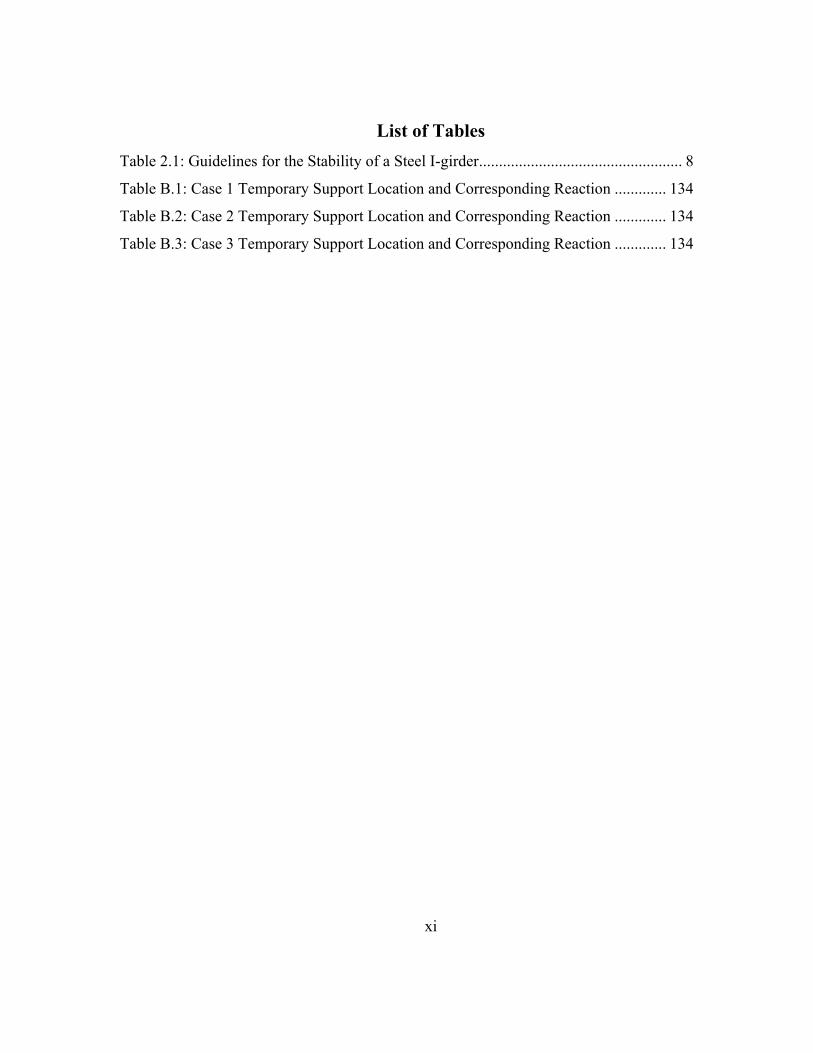
Table 2.1: Guidelines for the Stability of a Steel I-girder ................................................... 8
Table B.1: Case 1 Temporary Support Location and Corresponding Reaction ............. 134
Table B.2: Case 2 Temporary Support Location and Corresponding Reaction ............. 134
Table B.3: Case 3 Temporary Support Location and Corresponding Reaction ............. 134
xii
List of Figures
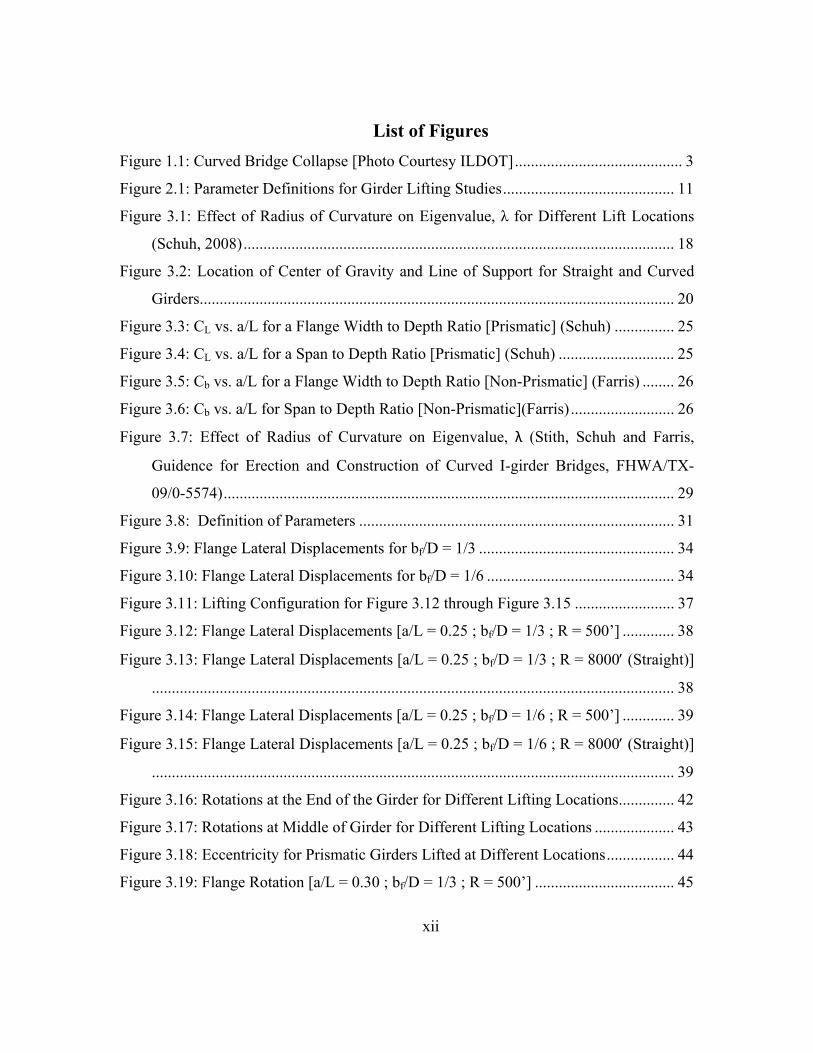
Figure 1.1: Curved Bridge Collapse [Photo Courtesy ILDOT] .......................................... 3
Figure 2.1: Parameter Definitions for Girder Lifting Studies ........................................... 11
Figure 3.1: Effect of Radius of Curvature on Eigenvalue, λ for Different Lift Locations
(Schuh, 2008) ............................................................................................................ 18
Figure 3.2: Location of Center of Gravity and Line of Support for Straight and Curved
Girders....................................................................................................................... 20
Figure 3.3: CL vs. a/L for a Flange Width to Depth Ratio [Prismatic] (Schuh) ............... 25
Figure 3.4: CL vs. a/L for a Span to Depth Ratio [Prismatic] (Schuh) ............................. 25
Figure 3.5: Cb vs. a/L for a Flange Width to Depth Ratio [Non-Prismatic] (Farris) ........ 26
Figure 3.6: Cb vs. a/L for Span to Depth Ratio [Non-Prismatic](Farris) .......................... 26
Figure 3.7: Effect of Radius of Curvature on Eigenvalue, λ (Stith, Schuh and Farris,
Guidence for Erection and Construction of Curved I-girder Bridges, FHWA/TX-
09/0-5574) ................................................................................................................. 29
Figure 3.8: Definition of Parameters ............................................................................... 31
Figure 3.9: Flange Lateral Displacements for bf/D = 1/3 ................................................. 34
Figure 3.10: Flange Lateral Displacements for bf/D = 1/6 ............................................... 34
Figure 3.11: Lifting Configuration for Figure 3.12 through Figure 3.15 ......................... 37
Figure 3.12: Flange Lateral Displacements [a/L = 0.25 ; bf/D = 1/3 ; R = 500’] ............. 38
Figure 3.13: Flange Lateral Displacements [a/L = 0.25 ; bf/D = 1/3 ; R = 8000′ (Straight)]
................................................................................................................................... 38
Figure 3.14: Flange Lateral Displacements [a/L = 0.25 ; bf/D = 1/6 ; R = 500’] ............. 39
Figure 3.15: Flange Lateral Displacements [a/L = 0.25 ; bf/D = 1/6 ; R = 8000′ (Straight)]
................................................................................................................................... 39
Figure 3.16: Rotations at the End of the Girder for Different Lifting Locations .............. 42
Figure 3.17: Rotations at Middle of Girder for Different Lifting Locations .................... 43
Figure 3.18: Eccentricity for Prismatic Girders Lifted at Different Locations ................. 44
Figure 3.19: Flange Rotation [a/L = 0.30 ; bf/D = 1/3 ; R = 500’] ................................... 45
xiii
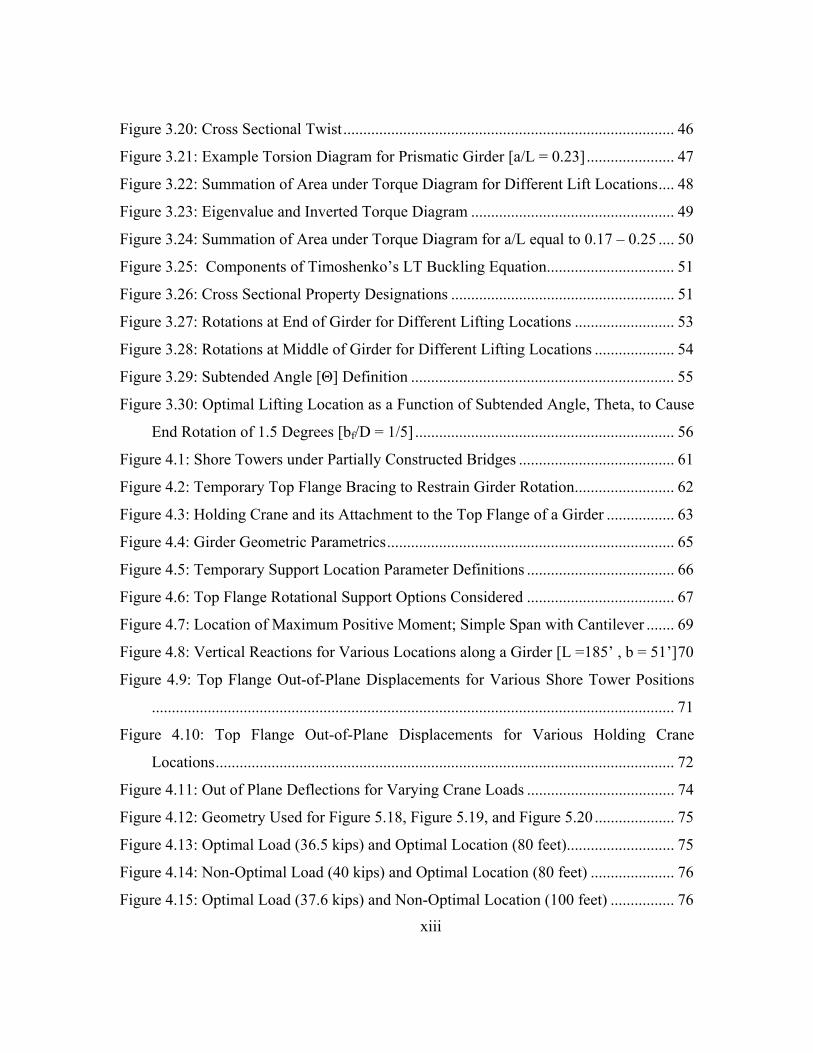
Figure 3.20: Cross Sectional Twist ................................................................................... 46
Figure 3.21: Example Torsion Diagram for Prismatic Girder [a/L = 0.23] ...................... 47
Figure 3.22: Summation of Area under Torque Diagram for Different Lift Locations .... 48
Figure 3.23: Eigenvalue and Inverted Torque Diagram ................................................... 49
Figure 3.24: Summation of Area under Torque Diagram for a/L equal to 0.17 – 0.25 .... 50
Figure 3.25: Components of Timoshenko’s LT Buckling Equation................................ 51
Figure 3.26: Cross Sectional Property Designations ........................................................ 51
Figure 3.27: Rotations at End of Girder for Different Lifting Locations ......................... 53
Figure 3.28: Rotations at Middle of Girder for Different Lifting Locations .................... 54
Figure 3.29: Subtended Angle [Θ] Definition .................................................................. 55
Figure 3.30: Optimal Lifting Location as a Function of Subtended Angle, Theta, to Cause
End Rotation of 1.5 Degrees [bf/D = 1/5] ................................................................. 56
Figure 4.1: Shore Towers under Partially Constructed Bridges ....................................... 61
Figure 4.2: Temporary Top Flange Bracing to Restrain Girder Rotation ......................... 62
Figure 4.3: Holding Crane and its Attachment to the Top Flange of a Girder ................. 63
Figure 4.4: Girder Geometric Parametrics ........................................................................ 65
Figure 4.5: Temporary Support Location Parameter Definitions ..................................... 66
Figure 4.6: Top Flange Rotational Support Options Considered ..................................... 67
Figure 4.7: Location of Maximum Positive Moment; Simple Span with Cantilever ....... 69
Figure 4.8: Vertical Reactions for Various Locations along a Girder [L =185’ , b = 51’] 70
Figure 4.9: Top Flange Out-of-Plane Displacements for Various Shore Tower Positions
................................................................................................................................... 71
Figure 4.10: Top Flange Out-of-Plane Displacements for Various Holding Crane
Locations ................................................................................................................... 72
Figure 4.11: Out of Plane Deflections for Varying Crane Loads ..................................... 74
Figure 4.12: Geometry Used for Figure 5.18, Figure 5.19, and Figure 5.20 .................... 75
Figure 4.13: Optimal Load (36.5 kips) and Optimal Location (80 feet)........................... 75
Figure 4.14: Non-Optimal Load (40 kips) and Optimal Location (80 feet) ..................... 76
Figure 4.15: Optimal Load (37.6 kips) and Non-Optimal Location (100 feet) ................ 76

xiv
Figure 4.16: Disturbing Force Caused by a Lack of Bracing on the Top Flange ............. 77
Figure 4.17: Linear and Non-Linear Displacements along a Girder for a Girder with a
Disturbing Force ....................................................................................................... 78
Figure 4.18: Restoring Force Caused by Lack of Bracing ................................................ 79
Figure 4.19: Displacements along a Girder Supported by a Holding Crane based on
Linear versus Nonlinear Geometry Analysis ............................................................ 80
Figure 4.20: Displacements along a Girder Supported by a Shore Tower based on Linear
versus Nonlinear Geometry Analysis - Amplified Displacement Scale ................... 81
Figure 4.21: Displacements along a Girder Supported by a Holding Crane based on
Linear versus Nonlinear Geometry Analysis - Amplified Displacement Scale ....... 82
Figure 4.22: Single Girder Segment Lifted for a Particular Cross Section ...................... 83
Figure 4.23: One, Two, Three, and Four Girder Erected Systems – Temporary Support at
80’ ............................................................................................................................. 84
Figure A.1: Parameter Definitions .................................................................................... 92
Figure A.2: bf/D = 1/3 : a/L = 0.15: .................................................................................. 94
Figure A.3: bf/D = 1/3 : a/L = 0.21: .................................................................................. 94
Figure A.4: bf/D = 1/3 : a/L = 0.34: .................................................................................. 95
Figure A.5: bf/D = 1/4 : a/L = 0.15: .................................................................................. 95
Figure A.6: bf/D = 1/4 : a/L = 0.21: .................................................................................. 96
Figure A.7: bf/D = 1/4 : a/L = 0.34: .................................................................................. 96
Figure A.8: bf/D = 1/6.667 : a/L = 0.15: ........................................................................... 97
Figure A.9: bf/D = 1/6.667 : a/L = 0.21: ........................................................................... 97
Figure A.10: bf/D = 1/6.667 : a/L = 0.34: ......................................................................... 98
Figure A.11: bf/D = 1/3 : a/L = 0.20: .............................................................................. 100
Figure A.12: bf/D = 1/3 : a/L = 0.25: .............................................................................. 100
Figure A.13: bf/D = 1/3 : a/L = 0.30: .............................................................................. 101
Figure A.14: bf/D = 1/4 : a/L = 0.20: .............................................................................. 101
Figure A.15: bf/D = 1/4 : a/L = 0.25: .............................................................................. 102
Figure A.16: bf/D = 1/4 : a/L = 0.30: .............................................................................. 102

xv
Figure A.17: bf/D = 1/6.7 : a/L = 0.20: ........................................................................... 103
Figure A.18: bf/D = 1/6.7 : a/L = 0.25: ........................................................................... 103
Figure A.19: bf/D = 1/6.7 : a/L = 0.30: ........................................................................... 104
Figure A.20: Rotations : L = 125’ : R = 500’ ................................................................. 106
Figure A.21: Rotations : L = 125’ : R = 1000’ ............................................................... 106
Figure A.22: Rotations : L = 125’ : R = 8000’ (~Str) ..................................................... 107
Figure A.23: Rotations : L = 80’ : R = 500’ ................................................................... 107
Figure A.24: Rotations : L = 80’ : R = 1000’ ................................................................. 108
Figure A.25: Rotations : L = 80’ : R = 8000’ (~Str) ....................................................... 108
Figure A.26: End Rotations : R = 500’ : D = 96” ........................................................... 110
Figure A.27: Middle Rotations : R = 500’ : D = 96” ...................................................... 110
Figure A.28: End Rotations : R = 500’ : D = 60” ........................................................... 111
Figure A.29: Middle Rotations : R = 500’ : D = 60” ...................................................... 111
Figure A.30: Load to Reach Serviceability Limit vs. Interior Angle, Θ (bf/D = 1/4) .... 113
Figure A.31: Load to Reach Serviceability Limit vs. Interior Angle, Θ (bf/D = 1/4) .... 113
Figure A.32: Load to Reach Serviceability Limit vs. Interior Angle, Θ (bf/D = 1/5) .... 114
Figure A.33: Load to Reach Serviceability Limit vs. Interior Angle, Θ (bf/D = 1/5) .... 114
Figure A.34: Load to Reach Serviceability Limit vs. Interior Angle, Θ (bf/D = 1/6) .... 115
Figure A.35: Load to Reach Serviceability Limit vs. Interior Angle, Θ (bf/D = 1/6) .... 115
Figure A.36: Serviceability Limits – bf/D = 1/4 : D = 60” : b = 15” : R = 1800’ ........... 117
Figure A.37: Serviceability Limits – bf/D = 1/6 : D = 60” : b = 9” : R = 1800’ ............. 117
Figure A.38: Serviceability Limits – bf/D = 1/4 : D = 60” : b = 15” : R = 500’ ............. 118
Figure A.39: Serviceability Limits – bf/D = 1/6 : D = 60” : b = 10” : R = 500’ ............. 118
Figure A.40: Serviceability Limits – bf/D = 1/6 : D = 90” : b = 15” : R = 500’ ............. 119
Figure B.1: Parameter Definitions .................................................................................. 121
Figure B.2: Shore Tower at 40 ft .................................................................................... 122
Figure B.3: Shore Tower at 60 ft .................................................................................... 122
Figure B.4: Shore Tower at 80 ft .................................................................................... 123
Figure B.5: Shore Tower at 100 ft .................................................................................. 123

xvi
Figure B.6: Shore Tower at 120 ft .................................................................................. 124
Figure B.7: Shore Tower at 140 ft .................................................................................. 124
Figure B.8: Shore Tower at 160 ft .................................................................................. 125
Figure B.9: Shore Tower at 205 ft .................................................................................. 125
Figure B.10: Shore Tower at 225 ft ................................................................................ 126
Figure B.11: Shore Tower at 245 ft ................................................................................ 126
Figure B.12: Holding Crane with 20 kip Vertical Force ................................................ 128
Figure B.13: Holding Crane with 25 kip Vertical Force ................................................ 128
Figure B.14: Holding Crane with 30 kip Vertical Force ................................................ 129
Figure B.15: Holding Crane with 35 kip Vertical Force ................................................ 129
Figure B.16: Holding Crane with 40 kip Vertical Force ................................................ 130
Figure B.17: Holding Crane with 45 kip Vertical Force ................................................ 130
Figure B.18: Holding Crane with 47.8 kip Vertical Force ............................................. 131
Figure B.19: Holding Crane with 50 kip Vertical Force ................................................ 131
Figure B.20: Holding Crane with 55 kip Vertical Force ................................................ 132
Figure B.21: Holding Crane with 60 kip Vertical Force ................................................ 132
Figure B.22: Shore Tower Reaction vs. Location [% Ltotal] ........................................... 135
Figure B.23: Case 1: x = 70 ft : F = 49.5 kips : 0.15 Cantilever ..................................... 136
Figure B.24: Case 1: x = 80 ft : F = 46.0 kips : 0.15 Cantilever ..................................... 136
Figure B.25: Case 1: x = 90 ft : F = 44.7 kips : 0.15 Cantilever ..................................... 137
Figure B.26: Case 1: x = 100 ft : F = 45.7 kips : 0.15 Cantilever ................................... 137
Figure B.27: Case 1: x = 110 ft : F = 48.8 kips : 0.15 Cantilever ................................... 138
Figure B.28: Case 2: x = 66 ft : F = 44.3 kips : 0.22 Cantilever ..................................... 139
Figure B.29: Case 2: x = 76 ft : F = 40.7 kips : 0.22 Cantilever ..................................... 139
Figure B.30: Case 2: x = 86 ft : F = 39.1 kips : 0.22 Cantilever ..................................... 140
Figure B.31: Case 2: x = 96 ft : F = 39.6 kips : 0.22 Cantilever ..................................... 140
Figure B.32: Case 2: x = 106 ft : F = 42.1 kips : 0.22 Cantilever ................................... 141
Figure B.33: Case 3: x = 56 ft : F = 32.5 kips : 0.30 Cantilever ..................................... 142
Figure B.34: Case 3: x = 66 ft : F = 28.4 kips : 0.30 Cantilever ..................................... 142

xvii
Figure B.35: Case 3: x = 76 ft : F = 26.3 kips : 0.30 Cantilever ..................................... 143
Figure B.36: Case 3: x = 86 ft : F = 25.9 kips : 0.30 Cantilever ..................................... 143
Figure B.37: Case 3: x = 96 ft : F = 27.3 kips : 0.30 Cantilever ..................................... 144
1
CHAPTER 1 Introduction
1.1 OVERVIEW
The research reported in this thesis addresses questions and problems that arise in
the construction of curved steel I-girder bridges. This work is a part of Texas Department
of Transportation (TxDOT) Research Project 0-5574 on Curved Plate Girder Design for
Safe and Economical Construction. There are many issues and challenges to deal with
when designing a curved I-girder bridge for safety and serviceability during various
stages of construction up through the final in-service condition. This research project
examines issues related to safety and serviceability of curved I-girders during lifting
operations as well as the safety and serviceability of partially constructed bridges curved
I-girder bridges.
When design engineers assess the stability of a bridge system, they typically
evaluate the system in its final in-service configuration with all cross frames attached and
the hardened concrete deck in-place. However, the most critical stage for stability of the
bridge often occurs during erection and the early stages of construction before all cross-
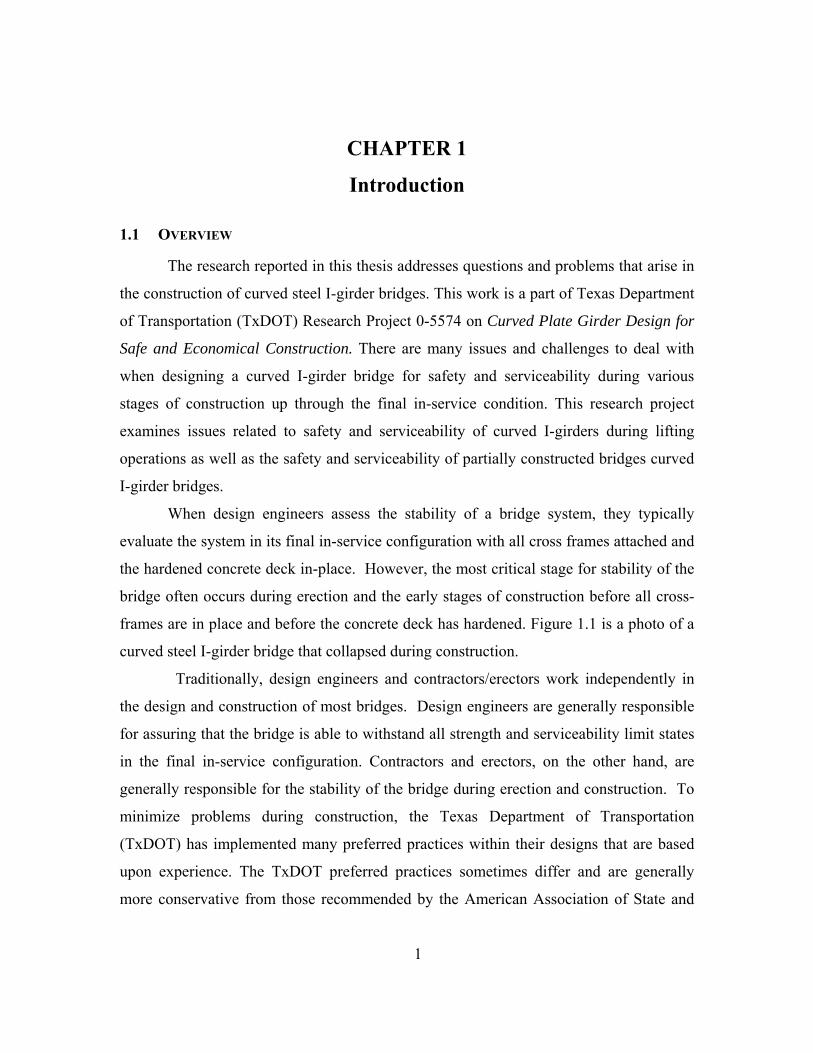
frames are in place and before the concrete deck has hardened. Figure 1.1 is a photo of a
curved steel I-girder bridge that collapsed during construction.
Traditionally, design engineers and contractors/erectors work independently in
the design and construction of most bridges. Design engineers are generally responsible
for assuring that the bridge is able to withstand all strength and serviceability limit states
in the final in-service configuration. Contractors and erectors, on the other hand, are
generally responsible for the stability of the bridge during erection and construction. To
minimize problems during construction, the Texas Department of Transportation
(TxDOT) has implemented many preferred practices within their designs that are based
upon experience. The TxDOT preferred practices sometimes differ and are generally
more conservative from those recommended by the American Association of State and

2
Highway Transportation Officials (AASHTO). One key area of difference is in the
recommended value for the ratio of flange width to girder depth, bf/d. TxDOT preferred
practices recommend designing curved I-girders with a target value for bf/d of 1/3.
AASHTO, on the other hand, permits bf/d values as low as 1/6. Higher values of bf/d,
such as that recommended by TxDOT, produce girders with a higher torsional stiffness
making them less likely to distort or fail from lateral torsional buckling. The
recommendation to use bf/d of 1/3 is therefore intended to mitigate girder stability
problems during lifting or in early stages of construction before all the bracing is present.
On the other hand, designing for bf/d equal to 1/3 can increase the cost of the girder.
Reducing the bf/d value to the AASHTO limit of 1/6 can result in more economical
girders, but can also result in more stability related problems during construction. The
girders in the bridge collapse shown in Figure 1.1 had a very low value of bf/d, as can be
seen from the girder contained within the highlighted box. Consequently, the bf/d value is
a crtical factor that affects both girder economy and girder stability. Accordingly, one of
the questions being examined in this research project is whether the bf/d value of 1/3
currently recommended by TxDOT can be reduced to provide more economical girders,
while still minimizing stability problems during lifting and construction.
3
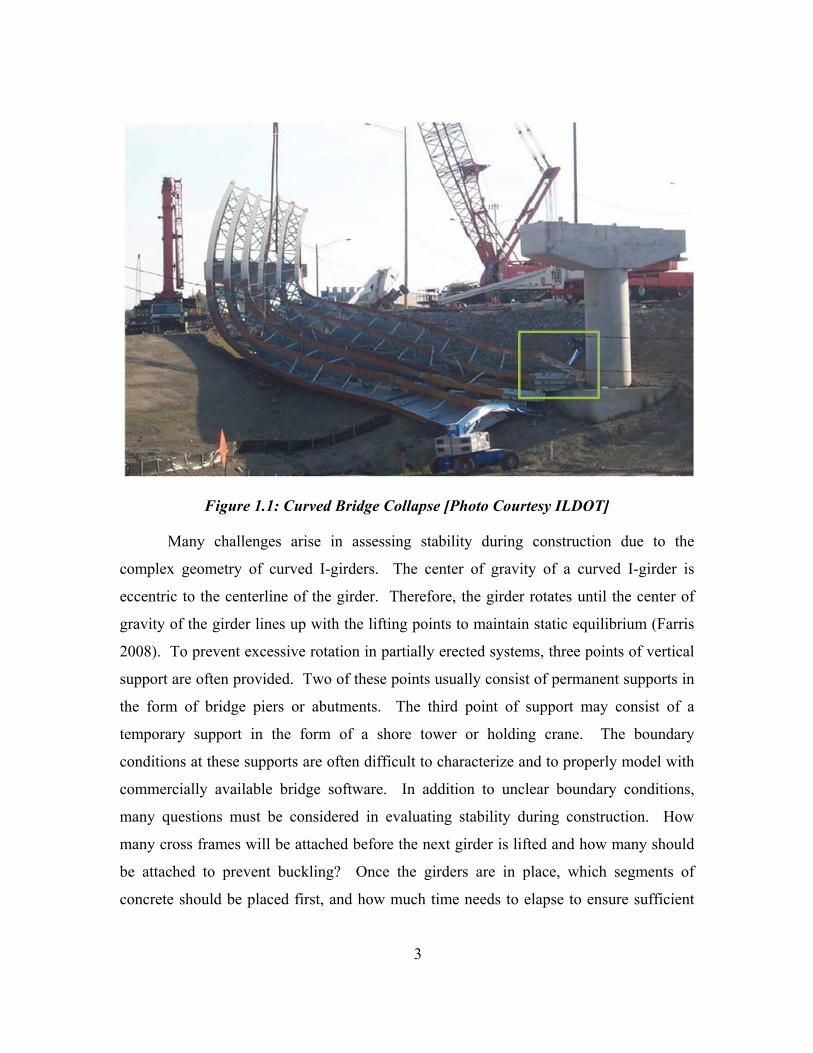
Figure 1.1: Curved Bridge Collapse [Photo Courtesy ILDOT]
Many challenges arise in assessing stability during construction due to the
complex geometry of curved I-girders. The center of gravity of a curved I-girder is
eccentric to the centerline of the girder. Therefore, the girder rotates until the center of
gravity of the girder lines up with the lifting points to maintain static equilibrium (Farris
2008). To prevent excessive rotation in partially erected systems, three points of vertical
support are often provided. Two of these points usually consist of permanent supports in
the form of bridge piers or abutments. The third point of support may consist of a
temporary support in the form of a shore tower or holding crane. The boundary
conditions at these supports are often difficult to characterize and to properly model with
commercially available bridge software. In addition to unclear boundary conditions,
many questions must be considered in evaluating stability during construction. How
many cross frames will be attached before the next girder is lifted and how many should
be attached to prevent buckling? Once the girders are in place, which segments of
concrete should be placed first, and how much time needs to elapse to ensure sufficient

4
composite action before placing the next section? Developing tools to address these
questions is an additional goal of TxDOT Research Project 0-5574.
1.2 SCOPE OF STUDY
As described earlier, this thesis is a part of a TxDOT Research Project 0-5574 on
Curved Plate Girder Design for Safe and Economical Construction. The focus of the
research study is to study the behavior and safety of curved steel I-girder bridges during
construction. Included within the overall scope of this project is the development of
recommendations and tools for evaluating safety and serviceability of curved I-girders
through all stages of the erection process as well as during casting of the concrete deck.
Research activities included field instrumentation of steel I-girders during lifting
operations and curved steel I-girder bridges at various stages of construction. The field
data was used to develop an improved understanding of behavior during construction and
to validate finite element models. To better understand the behavior of the curved girders
throughout all of the performance stages, extensive parametric studies were conducted
using the finite element program ANSYS. Finally, two PC based tools, UT Lift and UT
Bridge were created to help analyze both the lifting and partially constructed stages of
construction. UT Lift, a macro-enabled spread sheet analyzes the behavior of curved I-
girders during lifting. UT Bridge is a full three-dimensional finite element program for
analyzing bridge systems during the erection sequence and deck placement. Research
conducted in earlier phases of Project 0-5574 is reported by Schuh (2008), Farris (2008)
and Stith (2010). Further background on this work is provided in Chapter 2 of this thesis.
The purpose of research conducted for this thesis was to extend and supplement
other work on Project 0-5774 by Schuh (2008), Farris (2008) and Stith (2010). More
specifically, the research reported in this thesis has two primary objectives. The first
objective is to extend previous work on lifting of curved I-girders by Schuh (2008) and
Farris (2008). The previous work evaluated the stability of curved I-girders during lifting
through the use of eigenvalue buckling analysis. However, it is unclear if eigenvalue
analysis provides an accurate prediction of instability for curved girders. Consequently,
in this thesis, the behavior of curved I-girders during lifting is evaluated using nonlinear
5
geometry analyses. The purpose of this nonlinear analysis was to evaluate the suitability
of eigenvalue analyses for curved girders and to provide additional insights into problems
that can arise during lifting operations. The second objective of the research reported
herein was to examine how the use and placement of temporary shore towers and holding
cranes affect the structural performance of partially constructed curved steel I-girder
bridges.
1.3 THESIS OVERVIEW
Background information on previous research conducted on the behavior and
analyses of curved steel I-girder bridges during construction is provided in Chapter 2.
This includes research conducted under TxDOT Project 0-5574 as well as work by
others.
The results of a parametric finite element study on the lifting of curved I-girders
based on geometric nonlinear analyses are provided in Chapter 3. The behavior of girders
during lifting predicted by nonlinear analyses is compared with eigenvalue buckling
analyses. The results of the nonlinear analyses are also used to evaluate serviceability
criteria for lifting and to develop recommendations on preferred lifting locations.
The results from parametric finite element studies on partially constructed bridges
are highlighted in Chapter 4. This parametric study focuses on identifying when a
temporary support is required to stabilize a girder. In addition, advantages and
disadvantages are discussed for both shore towers and holding cranes. A summary of all
of the work presented in this thesis is provided in the final chapter.

6
CHAPTER 2 Background and Literature Review
2.1 INTRODUCTION
As described in Chapter 1, the research summarized in this thesis was conducted
as part of TxDOT Research Project 0-5574 on Curved Plate Girder Design for Safe and
Economical Construction. A significant amount of research has already been completed
under this project, and has been documented in the M.S. theses by Schuh (2008) and
Farris (2008) and in the PhD dissertation by Stith (2010). Prior to TxDOT Project 0-
5574, there has been considerable previous research on the behavior of curved steel I-
girders that support the objectives of this research project. Extensive reviews of previous
research have been documented by Schuh (2008), Farris (2008) and Stith (2010), and will
not be repeated here. Material presented in this chapter will therefore only summarize on
recent research efforts conducted by others since 2007. In addition, the previous work
completed on TxDOT Project 0-5574 will also be summarized.
2.2 RECENT WORK BY OTHERS
This section provides a review of recent research pertinent to curved girders that
has been published since the original literature review was completed by Schuh (2008),
Farris (2008), and Stith (2010). Most of the studies that were reviewed investigated the
behavior of erected steel I-girders and concrete deck placement. No recent research was
found on the behavior of steel I-girders during the lifting process when the only source of
support comes from the crane.
2.2.1 Effects of Web Plumbness on Girder Rotation
Recent work by Howell and Earls (2007) examined the effects that web out of
plumbness on the constructability of a bridge. The authors note that the self weight of a
girder alone will typically cause a curved girder to roll off of two supports. The reason
for the instability is because the girder’s center of gravity is not in line with the web. In

7
order to prevent the girder from rolling over, erectors attempt to brace the girder at a third
point by either introducing a temporary support into the system, placing cables and wood
blocks at permanent supports to prevent rotation, or erecting two girders at one time
when possible. Currently, there is no guidance in AASHTO on the allowable magnitude
of web rotation. The goal of the work by Howell and Earls was to quantify the effects
that web out-of-plumbness have on the girder behavior and to determine a suitable limit.
To quantify the effects, they computed girder flange stresses, vertical deflections, girder
distortion, and cross-frame forces with only steel dead load. Using finite element
analysis, the researchers modeled a six girder, three span continuous bridge with no skew
angles, and a radius of curvature of just over 500 feet. They changed the web out-of-
plumbness from zero degrees to five degrees in one degree increments. The results of the
study showed that the lateral deflections increased up to 250% for five degrees out of
plumbness and up to 100% for just two degrees of out of plumbness. The cross frame
forces were affected the most in the vicinity of the support locations. From the analyses
conducted, it was concluded that controlling the web plumbness is crucial in the
construction of bridges and that a more robust level of analysis may be needed for the
construction of complex curved steel I-girder bridges.
2.2.2 Girder Lateral Torsional Buckling
Recent work on lateral torsional buckling of steel I-girders during bridge erection
is reported by Zhao et al (2009). Zhao et al discuss the validity of commonly used
guidelines for girder stability related to the ratio L/b. The unbraced length of the girder is
represented by L and b is the flange width. The Handbook for Construction Engineers
provides L/b ranges for both cantilevers and simply supported sections that state whether
a system is stable, may be stable, or temporary supports are required as listed in Table
2.1 (American Bridge Division).
8
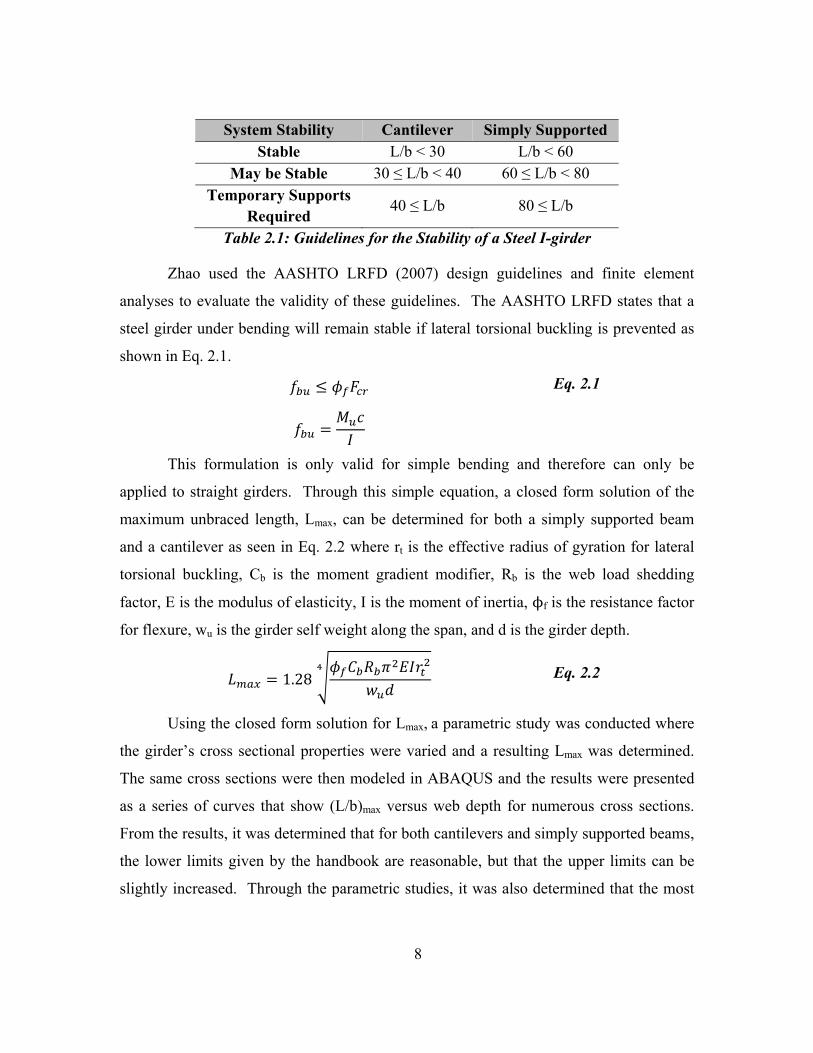
System Stability Cantilever Simply Supported Stable L/b < 30 L/b < 60
May be Stable 30 ≤ L/b < 40 60 ≤ L/b < 80 Temporary Supports
Required 40 ≤ L/b 80 ≤ L/b
Table 2.1: Guidelines for the Stability of a Steel I-girder
Zhao used the AASHTO LRFD (2007) design guidelines and finite element
analyses to evaluate the validity of these guidelines. The AASHTO LRFD states that a
steel girder under bending will remain stable if lateral torsional buckling is prevented as
shown in Eq. 2.1.
Eq. 2.1
This formulation is only valid for simple bending and therefore can only be
applied to straight girders. Through this simple equation, a closed form solution of the
maximum unbraced length, Lmax, can be determined for both a simply supported beam
and a cantilever as seen in Eq. 2.2 where rt is the effective radius of gyration for lateral
torsional buckling, Cb is the moment gradient modifier, Rb is the web load shedding
factor, E is the modulus of elasticity, I is the moment of inertia, f is the resistance factor
for flexure, wu is the girder self weight along the span, and d is the girder depth.
1.28 Eq. 2.2
Using the closed form solution for Lmax, a parametric study was conducted where
the girder’s cross sectional properties were varied and a resulting Lmax was determined.
The same cross sections were then modeled in ABAQUS and the results were presented
as a series of curves that show (L/b)max versus web depth for numerous cross sections.
From the results, it was determined that for both cantilevers and simply supported beams,
the lower limits given by the handbook are reasonable, but that the upper limits can be
slightly increased. Through the parametric studies, it was also determined that the most

9
important factors to control girder stability are the compression flange width and the web
depth.
In addition to looking at commonly used rules of thumb for girder stability, Zhao
et al (2009) also discussed optimal places to brace a cantilevered steel I-girder during
erection to minimize both vertical and lateral deflections and prevent lateral-torsional
buckling (Q. Zhao, B. Yu and E. G. Burdette). Using ABAQUS, Zhao et al modeled a
cantilever and factored the self weight in accordance to the AASHTO code (1.5 x dead
load). With no bracing, the section buckled under its own factored self weight. Bracing
was then placed at the top flange, bottom flange, and both flanges and the location and
magnitude of the maximum lateral displacements along the girder were computed. It was
determined that although it was best to brace both the top and bottom flange, that the
response of the girder was almost the same by just bracing the top, tension flange.
Bracing just the bottom (compression) flange resulted in lower deflections than no
bracing, but didn’t prevent the girder from buckling. As a result, it was concluded that
bracing the top, tension flange is an efficient and effective way to prevent lateral torsional
buckling in erection situations where a girder is cantilevered past a support.
2.2.3 Flange Local Buckling
Madhavan and Davidson (2009) conducted a study on flange local buckling in
curved I-girders. This research examined the effect that the curvature and warping
stresses had on the local buckling behavior of the compression flange. Traditionally,
only bending stresses are considered in local flange buckling. Yet, due to the curved
geometry, skewed supports, eccentricity of the deck weight on overhand brackets, deck
forms, screed rails, utilities, and wind loads, additional torsional and lateral bending
stresses can be introduced into the girder. The current 2007 AASHTO LRFD
Specification implements a unified approach for the flexural design of both tangential and
horizontally curved I-girder bridges with lateral bending loads to prevent local buckling.
The code states that for all girder slenderness ratios, a “one-third” rule is applied that
accounts for lateral bending in the flange. The “one-third” rule takes the maximum stress
that a cross section can handle before local buckling will occur, and reduces it by a factor

10
of fl/3 where fl is the factored lateral flange bending stress at the section being considered.
Using theoretical equations to evaluate definitions for slenderness limits, Madhavan and
Davidson were able to conclude that the “one-third” rule adopted by AASHTO in 2007 is
accurate for compact sections, but is increasingly conservative for both non-compact and
slender sections.
2.3 WORK PREVIOUSLY COMPLETED ON TXDOT PROJECT 0-5574
There are many aspects of TxDOT Project 0-5574 that were completed before and
in conjunction with the work described in this thesis. In order for the parametric studies
in this thesis to be completed on girder lifting and partially constructed bridges, a
validated three dimensional finite element model in ANSYS was needed. To validate the
ANSYS model, two independent field tests were completed to compare with ANSYS
predictions. Numerous eigenvalue and linear-elastic analyses were also previously
completed using the validated ANSYS model to investigate the stability of curved steel I-
girders during lifting. A nationwide survey of bridge erectors was also conducted to
establish typical industry lifting procedures and limits. Lastly, two analysis tools, UT Lift
and UT Bridge, were developed to assist designers and contractors to analyze curved I-
girders during lifting and to analyze partially constructed bridges. A brief discussion of
this previous work is described below.
2.3.1 Girder Lifting Field Tests
The literature review showed that very little research work has previously been
done on the lifting of horizontally curved I-girders. As a result, two tests were conducted
as part of TxDOT Project 0-5574 to better understand the behavior of curved steel I-
girders during lifting and to provide data to validate an ANSYS model for girder lifting.
In the first set of tests, a bridge located near Austin Bergstrom International Airport on
SH 130 at US 71 was instrumented and monitored during lifting. The data collected in
this test was difficult to interpret because the girder support conditions on the ground
prior to lifting were not were not well defined (Schuh). Therefore, a second set of tests
were conducted in San Angelo, Texas at a Hirschfeld Steel Company bridge girder

11
storage site. Using a crane at the storage site, a curved steel I-girder was instrumented
and displacements, rotations, and stresses were monitored during lifting. In this test,
well-defined girder support conditions were provided. As a result, high quality data was
obtained in this test. Further details of these tests are provided by Schuh (2008).
To the author’s knowledge, there is no other experimental data available that
records both rotations and stresses of curved steel I-girders during lifting.
2.3.2 Finite Element Analysis of Lifting of Curved Girders
The first finite element parametric study to be conducted on TxDOT Project 0-
5574 was by Schuh and identified the effects of changing various parameters during the
lifting of curved girders. Schuh conducted eigenvalue buckling analyses to quantify the
effects of changing variables such as the radius of curvature (R), flange width to girder
depth ratio (bf/d), span to depth ratio (L/d), and lift point location (a/L). These parameters
are illustrated in Figure 2.1.
Figure 2.1: Parameter Definitions for Girder Lifting Studies
The results from the parametric studies showed that the radius of curvature had
little effect on the eigenvalue of the system. For a given a/L, R, and bf/d, as the span to
depth ratio (L/d), increases, the eigenvalue buckling capacity decreases rapidly. The
variable that had the largest effect on the eigenvalue was the lift point location, a/L.
D
bf
L
R
tf
z
L
a a
Lifting Point
Lifting Point

12
When a girder is lifted at extreme locations (a/L = 0.1 or a/L = 0.4), the eigenvalue is the
lowest and eigenvalues are highest at a/L = 0.25 (Schuh).
Using eigenvalue buckling analyses, Schuh (2008) developed recommendations
for computing the buckling capacity of prismatic curved I-girders during lifting using
conventional formulas for lateral torsional buckling. Farris (2008) extended the work by
Schuh, and used eigenvalue buckling analyses to study the stability of non-prismatic
curved I-girders during lifting.
2.3.3 Nationwide Survey of Erectors
Farris also conducted a nationwide survey of steel bridge erection contractors,
inspectors and engineers. The primary purpose of the survey was to determine common
methodologies used in the lifting of curved, steel I-girders such as typical spreader beam
length, lift point locations, use of shore towers, and the length of girders lifted. The
industry survey was conducted to provide the researchers with a better understanding of
typical industry practices. The range of parameters used in practice, were used to assist
in planning the parameters that were studied on the research project so that solutions
could be developed for commonly encountered problems. Complete details of the survey
and survey responses are documented by Farris (2008).
2.3.4 Development of Analysis Tools
As a part of TxDOT Project 0-5574, two PC-based tools were developed to assist
with analysis of curved steel I-girder bridges during critical stages of the construction
process. One of these tools, called “UT Bridge," is a three dimensional finite element
program that contains a graphical user interface (GUI) that allows bridge engineers to
input a curved, I-girder bridge and quickly evaluate the stability of the system during
girder erection and concrete deck placement based upon information commonly found in
bridge plans. In addition to UT Bridge that evaluates girder stability during partially
constructed configurations, the tool “UT Lift” was also developed for analysis of curved
steel I-girders during lifting. UT Lift is a macro-enabled Microsoft Excel based
spreadsheet that allows the user to input the properties of a girder being lifted and quickly

13
evaluate both strength and serviceability limit states. Both UT Bridge and UT Lift are
described in Stith (2010).
2.4 SUMMARY
This chapter provided a brief review of recently completed research pertinent to
curved I-girders completed at other universities as well as previous work completed on
TxDOT Project 0-5574. The material presented in the chapter supplements the
background information provided by Stith (2010) Schuh (2008), and Farris (2008).
The research reported in this thesis extends previous work conducted on TxDOT
Project 0-5574 in two areas. As described above, Schuh (2008) and Farris (2008)
examined the stability of curved I-girders during lifting through the use of eigenvalue
buckling analyses. To extend this work, additional parametric studies of girder lifting
were conducted using nonlinear geometrical analyses for comparison with predictions on
curved girder behavior provided by the eigenvalue buckling analyses. The purpose of the
nonlinear analysis, which is described in Chapter 3, was to evaluate the ability of
eigenvalue buckling analysis to predict instability of curved I-girders and to also evaluate
proposed limits on girder rotation during lifting. The second area addressed by this thesis,
described in Chapter 4, was the analysis of partially constructed bridges with a focus on
the role of temporary shore towers and holding cranes.

14
CHAPTER 3 Non-Linear Analysis of Lifting of Curved Steel I-Girders
3.1 INTRODUCTION
Lifting of curved steel I-girders is an issue of significant concern in the
construction of steel bridges. Improper lifting practices can lead to safety concerns and
serviceability problems that can adversely impact construction operations. Despite the
importance of lifting operations, there is little work available from past research that can
provide engineers and erectors with guidance on criteria for lifting. In as such, there is a
lack of analysis tools and design criteria for lifting. Rather, bridge erectors have largely
relied on experience and rules of thumb to guide lifting operations (Beckmann and Mertz
2005). To address the lack of analysis tools and guidance on lifting of curved steel I-
girders, research on this topic was conducted as part of Texas Department of
Transportation (TxDOT) Research Project 0-5574, “Curved Plate Girder Design for Safe
and Economical Construction.” As part of TxDOT Project 0-5574, considerable research
has already been completed on lifting of curved steel I-girders, and is reported in Schuh
(2008) and Farris (2008). The work described in this chapter is a continuation of this
research for TxDOT Project 0-5574, and builds on the work of Schuh and Farris.
Two critical issues of concern in lifting of curved steel I-girders are safety and
serviceability. From a safety perspective, lateral torsional buckling of the girder is the
primary limit state of concern. Buckling of a girder during lifting can result in injuries or
fatalities. Thus, assuring the stability of a curved steel I-girder is critical in planning a
lifting operation. However, even if stability and safety are assured, serviceability
problems can occur due to excessive deformations of a girder during lifting. For example,
excessive rotation or deflection of a lifted girder can make connecting the girder to other
portions of the bridge that have already been erected very difficult. Such serviceability
problems, while not affecting safety, can cause costly delays in construction.
Serviceability is of particular concern with curved girders, as the curved geometry can

15
lead to large rotations of a lifted girder due to rigid body movements of the girder
combined with cross sectional torsional rotations.
3.2 MODELING APPROACHES
There are several possible approaches for conducting a structural analysis of
curved steel I-girders during lifting for the purposes of assessing safety and
serviceability. One approach is to conduct a first order structural analysis to compute the
moment diagram for the lifted girder as well as deflections and rotations. To check
stability of the girder, the moment in the girder can be compared to a critical buckling
moment. The critical buckling moment can be computed using formulas provided in
AASHTO or other codes, which are generally based on classical formulas for elastic
lateral torsional buckling of a straight beam. Buckling solutions are discussed in greater
detail later in this thesis. However, this approach leads to difficulties in that formulas for
the buckling moment for a beam since the engineer must identify the unbraced length of
the beam, which is unclear since there is no clear bracing present. Assessing the buckling
strength also may necessitate using a Cb factor to account for moment gradient. Again,
since the Cb factor is generally dependent on the unbraced length, there is significant
uncertainty on the proper Cb factor during lifting. The applicability of conventional beam
buckling formulas to curved girders is not well understood. Finally, many bridge girders
are nonprismatic, and the correct treatment of nonprismatic girders in formulas for
critical buckling moment is also unclear.
The deflections and rotations computed from a first order analysis can be used to
assess serviceability criteria. However, it is unclear if a first order analysis provides an
accurate prediction of the actual deflections and rotations of a curved girder during
lifting. That is, it is unclear if second-order geometric effects may significantly affect
girder deformations during lifting.
As an alternative to using buckling formulas, a first order structural analysis can
be combined with an eigenvalue analysis to estimate the buckling moment. An
eigenvalue analysis does not require the engineer to define the unbraced length or to
compute a Cb factor. However, it is unclear if an eigenvalue analysis can accurately

16
predict instability of a curved girder since the girder tends to laterally deflect and twist
from the applied load.
The most accurate approach for predicting the behavior of a curved steel I-girder
during lifting is to conduct an analysis that explicitly models nonlinear geometry. A
nonlinear analysis evaluates equilibrium in the deformed configuration of the girder, and
provides the most realistic prediction of deflections and rotations, and of internal forces
and stresses. A geometric nonlinear analysis is also sometimes referred to as a second-
order analysis, in that it includes second-order geometric effects.
An additional consideration in the analysis of curved steel I-girders is the
representation of the girder in the analysis model. At the simplest level, beam elements
can be used to model the girder. At a more advanced level, continuum finite elements,
such as shell elements can be used to model the girder. Shell finite element models
increase the complexity of modeling, but can provide more accurate results. Further, shell
finite element models can predict local buckling of the flanges and web as well as local
effects at lift points and at changes in the cross-section for nonprismatic girders. Such
local effects generally cannot be captured using beam elements. Note that either beam
elements or shell finite elements can be used to conduct a first order analysis, an
eigenvalue analysis, or a nonlinear geometry analysis.
A final issue in girder modeling is consideration of material inelasticity.
Significant yielding in the girder will affect the distribution of the internal forces and
stresses, deflections, rotations, and stability of the girder. In general, a key design
criterion for girder lifting is to prevent yielding of the girder during the lifting operation
to prevent permanent deformations. Consequently, an elastic analysis is generally
satisfactory for girder lifting. It is, of course, important to check the internal forces and
stresses predicted by the analysis to ensure that the girder does, in fact, remain elastic. All
of the analyses described in this chapter utilized elastic materials.
17
3.3 RESEARCH OBJECTIVES
The previous studies by Schuh (2008) and Farris (2008) used eigenvalue analysis
to develop recommendations for evaluating girder stability using simplified buckling
formulas. However, the validity of eigenvalue analyses for curved girders is unclear.
Consequently, the primary objective of the research described in this chapter is to assess
the validity of eigenvalue analyses for predicting instability of curved girders during
lifting and to extend the work previously conducted by Schuh and Farris. To accomplish
this objective, a geometric nonlinear analysis of curved girders during lifting using a
three-dimensional finite element model was conducted and compared to the results of
first-order and eigenvalue analysis. In addition to assessing the usefulness of eigenvalue
analyses, this research also examined additional issues involved in lifting of curved steel
girders.
Prior to describing the nonlinear analysis of curved steel I-girders during lifting,
the results of previous research on girder lifting conducted as part of TxDOT Project 0-
5574 will be reviewed.
3.4 PREVIOUS WORK ON LIFTING OF CURVED GIRDERS FOR PROJECT 0-5574
As part of TxDOT Project 0-5574, an extensive series of analyses were conducted
on lifting of curved steel I-girders (Schuh (2008), Farris (2008), Stith et al. (2009), and
Stith (2010)). In this previous work, the stability of curved steel I-girders during lifting
was evaluated by the use of eigenvalue analyses on a three-dimensional finite element
model of the girder using the ANSYS finite element computer program. Shell elements
were used to represent the flanges and web of the girder. The model used for this
analysis, as well as validation of the model by field testing of lifted curved girders is
described by Schuh (2008) and Stith (2010). The results of the eigenvalue analyses were
then used by Schuh and Farris to develop recommendations for the calculation of
buckling moments.
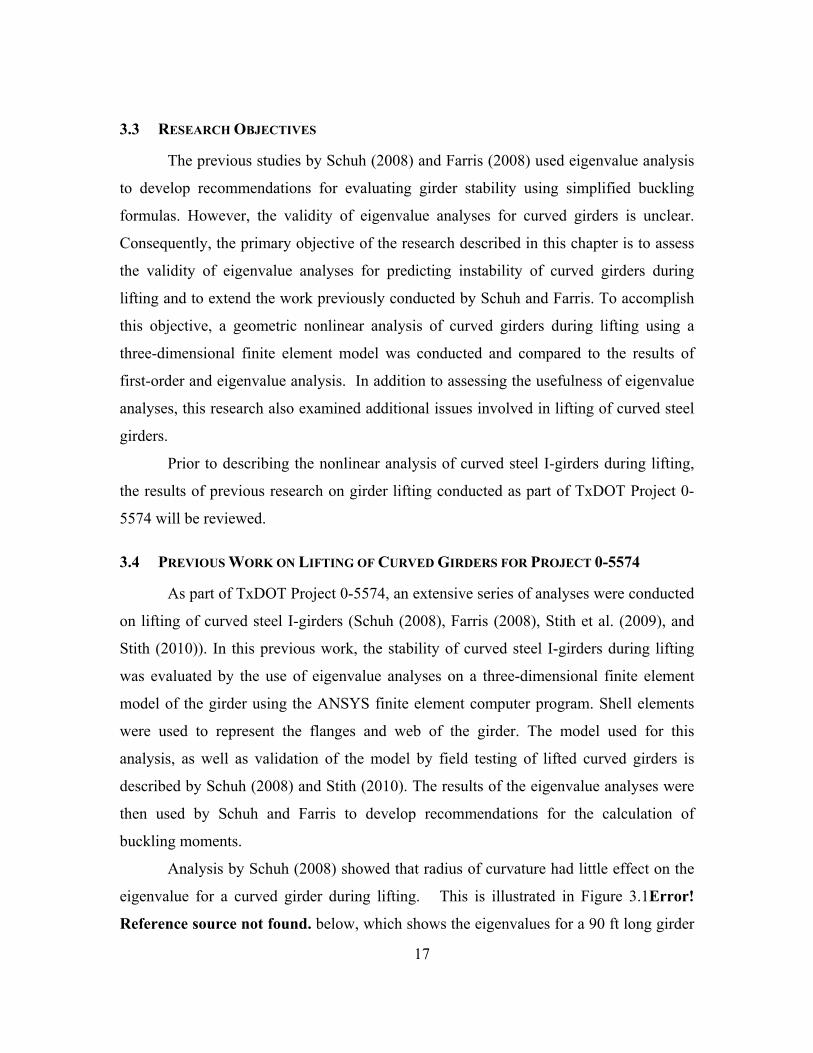
Analysis by Schuh (2008) showed that radius of curvature had little effect on the
eigenvalue for a curved girder during lifting. This is illustrated in Figure 3.1Error!
Reference source not found. below, which shows the eigenvalues for a 90 ft long girder

18
computed from the ANSYS model. Loading on the girder consisted of the girder self
weight. The girder had a top flange width (bf) of 18 in and a web depth (d) of 72 in (bf /d
ratio = 1/4). Four different radiuses of curvature were modeled (R = 250 ft, 500 ft, 1000
ft, and 8000 ft). The 8000 ft radius of curvature was included to approximate a straight
girder. For each radius of curvature, the eigenvalue was obtained for seven different lift
point locations (a/L) where a represents the distance from the end of the girder to the lift
point location and L is the total length of the girder being lifted. The eigenvalue, λ,
shown in Figure 3.1 represents a multiplier on the self-weight of the girder needed to
cause buckling.
Figure 3.1: Effect of Radius of Curvature on Eigenvalue, λ for Different Lift Locations
(Schuh, 2008)
From the results in Figure 3.1, it can be seen that regardless of the lift point
location, the eigenvalues are nearly the same for the four different radiuses of curvature.
The eigenvalue was therefore assumed to not be a function of the radius of curvature in
the parametric studies subsequently conducted by Schuh (2008) and Farris (2008). The
0
20
40
60
80
100
120
140
0.05 0.1 0.15 0.2 0.25 0.3 0.35 0.4 0.45
λ
Lift Point Location (a/L)
R = 250 ftR = 500 ftR = 1000 ftStraight Girder

19
graphs show that the resulting eigenvalues are very sensitive to the lifting location and
ranged from approximately 10 to 125 for the various a/L ratios.
3.4.1 Rigid Body Girder Rotations
Because of the geometry of horizontally curved I-girders, a potential for
significant rotations during lifting is present. Large rotations can contribute to instability
of the girder during lifting and can also cause problems during fit up when attempting to
connect two girders in the air or when attempting to connect cross frames. There are two
sources of rotation when lifting a curved girder. One source is a rigid body rotation that
occurs when the center of gravity of the curved girder is not located on the line of support
defined by the lift points. The second source of rotation is deformation due to girder
flexibility and includes both torsional deformations and weak axis bending of the girder.
The rigid body rotation depends on the girder geometry and lift locations, and
does not depend on the stiffness of the girder. Straight girders do not develop rigid body
rotations because their center of gravity lies between the line of support created by the
lifting locations for any two points on a straight girder. However, for curved girders,
rigid body rotation will occur if the girder’s center of gravity is eccentric to the line of
support between the lifting locations, as illustrated in Figure 3.2.
20
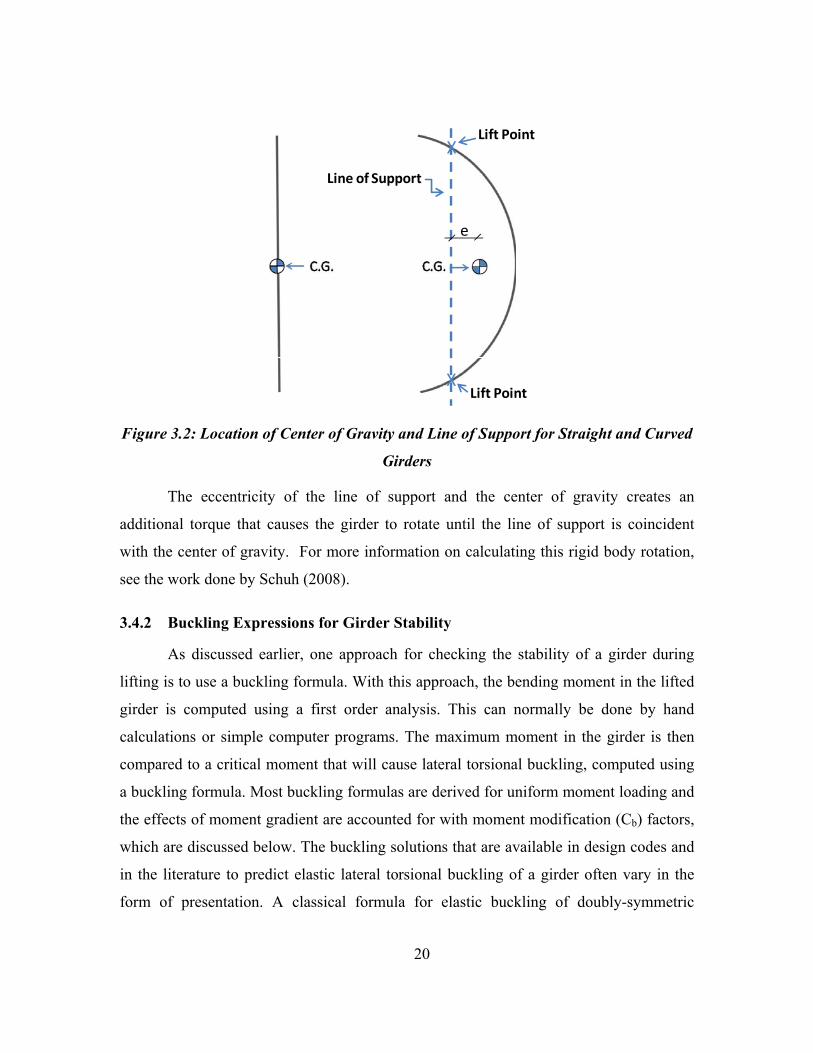
Figure 3.2: Location of Center of Gravity and Line of Support for Straight and Curved
Girders
The eccentricity of the line of support and the center of gravity creates an
additional torque that causes the girder to rotate until the line of support is coincident
with the center of gravity. For more information on calculating this rigid body rotation,
see the work done by Schuh (2008).
3.4.2 Buckling Expressions for Girder Stability
As discussed earlier, one approach for checking the stability of a girder during
lifting is to use a buckling formula. With this approach, the bending moment in the lifted
girder is computed using a first order analysis. This can normally be done by hand
calculations or simple computer programs. The maximum moment in the girder is then
compared to a critical moment that will cause lateral torsional buckling, computed using
a buckling formula. Most buckling formulas are derived for uniform moment loading and
the effects of moment gradient are accounted for with moment modification (Cb) factors,
which are discussed below. The buckling solutions that are available in design codes and
in the literature to predict elastic lateral torsional buckling of a girder often vary in the
form of presentation. A classical formula for elastic buckling of doubly-symmetric
X
X
e
Line of Support
Lift Point
Lift Point

21
girders is the formula presented in Timoshenko and Gere (1961), which is shown as Eq.
3.1 below. This formula, referred to herein as the “Timoshenko Equation,” is the basis for
most doubly-symmetric beam buckling formulas found in design codes, including
AASHTO. This formula assumes the girder is straight, prismatic and is subject to a
uniform moment along its length. At the girder ends, this formula assumes warping is
permitted but that twist is fully restrained. Although Timoshenko originally stated that
lateral movement was restrained at the ends, the assumption is not actually required to
obtain the resulting expression. As a result, effective bracing need only control twist of
the cross section; however bracing can also be provided to prevent lateral movement of
the compression flange. The value of Mo computed from Eq. 3.1 is the critical moment
that will cause elastic buckling of the girder for these conditions.
When the moment diagram along the unbraced length of the girder is not uniform,
as is the case with a girder during lifting, a moment gradient factor, Cb, is typically
applied to the uniform buckling moment from Eq. 3.1. Thus, the final formula for
predicting elastic lateral torsional buckling of a girder is given by Eq. 3.2. To check
girder stability, the buckling moment, Mcr computed by Eq. 3.2 is compared to the
maximum moment computed in the girder, with application of an appropriate factor of
safety.
As noted above, Eq. 3.2 is the basis for beam buckling formulas found in many
design standards for steel structures, including AASHTO (2008) and AISC (2005).
However, the use of Eq. 3.2 for checking stability of girders during lifting raises a
number of questions and concerns, as follows:
• What unbraced length, Lb should be used in Eq. 3.2?
The unbraced length, Lb is defined as: “Length between points that are either
braced against lateral displacement of the compression flange or braced
against twist of the cross-section.” (AISC, 2005). For a girder during lifting,
there are no points along the girder that are braced against lateral displacement
or braced against twist of the cross-section. The primary source of stability in
girders during lifting comes from the fact that the point of application of the

22
self weight lies below the vertical lifting locations. Consequently, it is very
unclear how Lb should be determined for a girder during lifting.
• How should Cb be determined?
Various expressions for computing Cb are available in design codes and in the
literature. All of these expressions require information on the shape of the
moment diagram over the unbraced length. Since the unbraced length in not
clearly defined for a girder during lifting, the calculation of Cb is also not
clear. Further, in addition to Cb accounting for moment gradient over the
unbraced length, this factor also accounts for load height effects. Most Cb
factors are applicable for mid-height loading. When the loads are applied
above or below mid-height, load height effects increase or decrease the
buckling capacity. For gravity loading, loads applied above mid-height results
in a reduction of the capacity relative to mid-height loading, while loads
applied below mid-height result in an increase in the buckling capacity. In the
case of a girder during lifting, where the girder is generally hanging from
lifting hooks, conventional formulas for Cb do not properly account for this
support conditions.
• Is Eq. 3.2 applicable to curved girders?
The Timoshenko Equation was derived for a straight girder. Its applicability to
a curved girder is unclear.
• How can Eq. 3.2 be applied to a nonprismatic girder?
The Timoshenko Equation was derived for a prismatic girder. However, many
bridge girders are nonprismatic. The correct application of Eq. 3.2 to
nonprismatic girders is unclear.

23
Eq. 3.1
Eq. 3.2
Schuh and Farris developed recommendations on how Eq. 3.2 can be used to
compute the buckling moment for a girder during lifting. The basic approach used in this
work was to consider a wide range of parameters for lifted girders, including variations in
length, cross-section properties, location of lift points, etc. For each case considered, an
eigenvalue buckling analysis was conducted on a three-dimensional finite element model
of the lifted girder using ANSYS. Moment gradient factors can be found analytically by
conducting two analyses: one with moment gradient and one with uniform moment. The
moment gradient factor is then found using the following expression in Eq. 3.3.
Eq. 3.3
Where Mcr is the maximum moment at buckling within a specific unbraced
length, Lb from the analysis with moment gradient; and Mo is the buckling moment from
the corresponding analysis with uniform moment loading. Instead of conducting a
second analysis with uniform moment loading, Eq. 3.1 can also be used for Mo. An
important factor in defining Cb from the analysis is the selection of the unbraced length
24
that is used to define Mo and Mcr. The definition of Lb, is a major factor that differed in
the work from Schuh and Farris.
Schuh (2008) considered prismatic girders while Farris (2008) considered
nonprismatic girders. Schuh defined the unbraced length Lb to be taken as the larger of
LLift and a, where LLift is the distance between lift point, and a is the overhang distance
from the lift point to the end of the girder (Figure 3.3). In computing the Cb factor for
nonprismatic girders (Figure 3.5, Figure 3.6), Farris (2008) defined the unbraced length
Lb as the total length L of the girder. Further, Farris developed recommendations for an
approach for using Eq. 3.2 for checking nonprismatic girders. Figure 3.3 through Figure
3.6 illustrate some of the results from these studies. For these figures, the moment
gradient factor is represented by the symbol CL for prismatic girders and Cb for non-
prismatic girders. While there is not a significant difference in the desired effect of using
CL or Cb, the primary difference is the unbraced length that was used to define the values.
Therefore, the magnitude of the range of CL and Cb vary in the graphs. The Cb factors
from the work of Farris are generally larger than the CL values from Schuh, however
Farris would use the full length of the segment in Eq. 3.1 while Schuh would use the
larger of a or LLift.

25
Figure 3.3: CL vs. a/L for a Flange Width to Depth Ratio [Prismatic] (Schuh)
Figure 3.4: CL vs. a/L for a Span to Depth Ratio [Prismatic] (Schuh)
0.0
0.5
1.0
1.5
2.0
2.5
3.0
3.5
0.05 0.1 0.15 0.2 0.25 0.3 0.35 0.4 0.45
C L
Lift Point Location (a/L)
b/d = 1/6
b/d = 1/4
b/d = 1/3
0.0
0.5
1.0
1.5
2.0
2.5
3.0
3.5
4.0
0.05 0.1 0.15 0.2 0.25 0.3 0.35 0.4 0.45
C L
Lift Point Location (a/L)
L/d = 25
L/d = 20
L/d = 15

26
Figure 3.5: Cb vs. a/L for a Flange Width to Depth Ratio [Non-Prismatic] (Farris)
Figure 3.6: Cb vs. a/L for Span to Depth Ratio [Non-Prismatic](Farris)
0
2
4
6
8
10
12
0.00 0.05 0.10 0.15 0.20 0.25 0.30 0.35 0.40 0.45
C b
a/L
b/d = 1/3
b/d = 1/4
b/d = 1/5
b/d = 1/6
0
2
4
6
8
10
12
0.00 0.05 0.10 0.15 0.20 0.25 0.30 0.35 0.40 0.45
C b
a/L
L/d = 15
L/d = 20
L/d = 25

27
For additional information on the development of the moment gradient factor, CL,
for prismatic girders, see Schuh (2008). For additional information on the development
of the moment gradient factor, Cb, for non-prismatic girders, see Farris (2008). One of the
consistent conclusions from these studies, as illustrated in Figure 3.3 to Figure 3.6, is that
the best place to lift a girder from a stability stand point is at the quarter points where a/L
= 0.25. This location will typically give the highest CL or Cb factor resulting in the
highest critical moment. Lifting at these locations, however, may not always be possible
based on spreader beam availability, or based on the need to minimize rigid body
rotations. Lifting at the quarter points may not align the girder’s center of gravity with the
line of support (Figure 3.2), which may in turn require moving the lift points away from
the quarter points.
The CL and Cb factors developed by Schuh and Farris can be used with Eq. 3.2 to
check stability of curved girders during lifting. As noted above, however, it is important
to use a definition for the unbraced length Lb that is consistent with the calibration
process. It is also important to use these calibrated factors only within the range of
parameters for which the calibrations were conducted.
3.4.2.1 Concerns with using Eigenvalue Solutions to Evaluate Curved Girder Stability
The recommendations by Schuh and Farris for calculating buckling moments for
lifted girders are based on calibrations to eigenvalue buckling analyses. Implicit in this
process were two assumptions. The first was that the eigenvalue buckling capacity was
largely independent of radius of curvature. The second assumption was that eigenvalue
analysis provides a reasonable prediction for instability of a curved girder.
There is reason to question these assumptions. With regard to the first assumption,
additional analyses by Stith et al. (2009) showed some dependence of the eigenvalue on
radius of curvature. A result of this analysis is shown in Figure 3.7. Note that while this
analysis shows some dependence of the eigenvalue on the radius of curvature, the effect
was still rather small. For the analysis shown in Figure 3.7, the difference in eigenvalue
between a straight girder and a highly curved girder is less than 5-percent.
28
The second assumption is one of potentially greater concern. That is, it is unclear
if instability of a curved girder is accurately predicted by an eigenvalue analysis. Work
by Earls (2007) suggests that eigenvalue buckling analysis from finite element programs
may provide misleading results for cases other than simple bifurcation buckling. In the
case of horizontally curved girders, the initial curved geometry can be viewed as a large
initial geometric imperfection. This suggests that instability of curved girders may not be
well characterized as a bifurcation buckling problem, and consequently, may not be
accurately predicted by an eigenvalue buckling analysis.
To address concerns on the applicability of eigenvalue buckling analysis for
predicting instability of curved girder during lifting, a series of geometric nonlinear
analysis were conducted. These analyses can provide a more accurate prediction of the
behavior of curved girders during lifting. As described earlier, the objective of these
nonlinear analyses is to evaluate the applicability of eigenvalue buckling analysis, extend
the previous work by Schuh and Farris, and provide additional insights into the behavior
of curved steel I-girders during lifting.
Results from the graphs above show that the best place to lift a girder from a
stability stand point is at the quarter points where a/L = 0.25. This location will typically
give the highest Cb factor resulting in the highest critical moment. As discussed
previously, these results assume that the radius of curvature does not affect the solution to
the problem. A more refined analysis was conducted and demonstrated that the radius of
curvature actually did affect the eigenvalue buckling capacity of the system. The results
are presented in Figure 3.7.
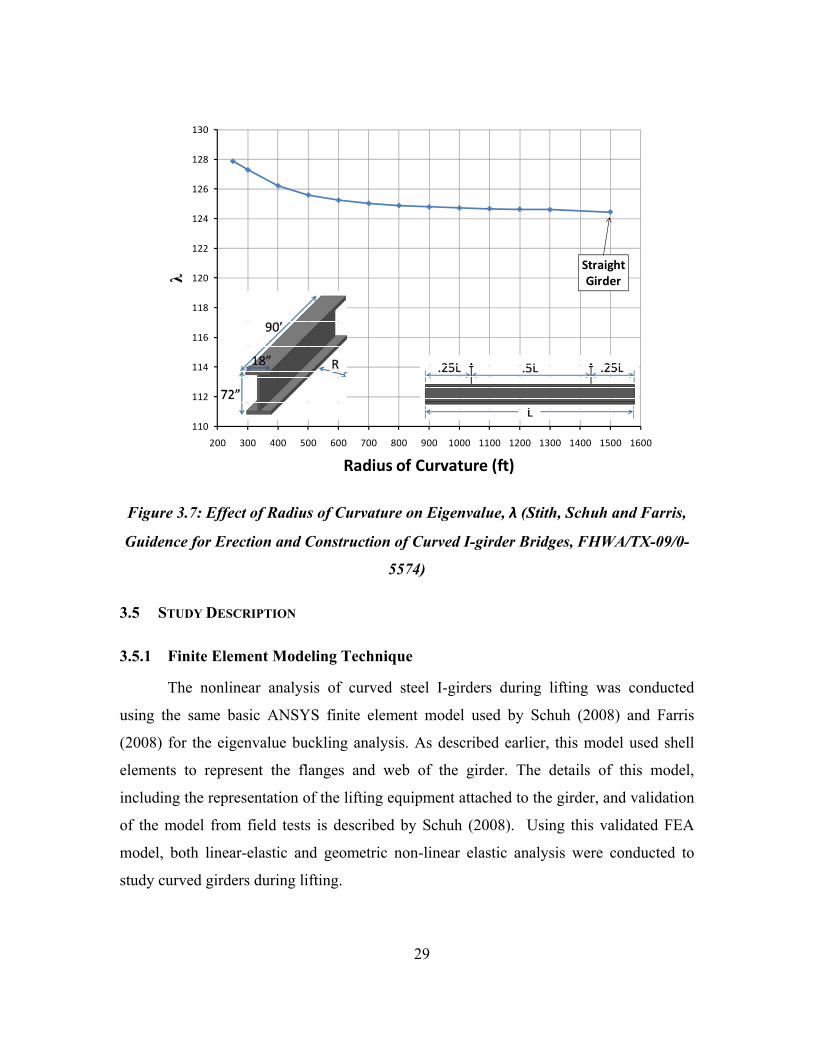
29
Figure 3.7: Effect of Radius of Curvature on Eigenvalue, λ (Stith, Schuh and Farris,
Guidence for Erection and Construction of Curved I-girder Bridges, FHWA/TX-09/0-
5574)
3.5 STUDY DESCRIPTION
3.5.1 Finite Element Modeling Technique
The nonlinear analysis of curved steel I-girders during lifting was conducted
using the same basic ANSYS finite element model used by Schuh (2008) and Farris
(2008) for the eigenvalue buckling analysis. As described earlier, this model used shell
elements to represent the flanges and web of the girder. The details of this model,
including the representation of the lifting equipment attached to the girder, and validation
of the model from field tests is described by Schuh (2008). Using this validated FEA
model, both linear-elastic and geometric non-linear elastic analysis were conducted to
study curved girders during lifting.
110
112
114
116
118
120
122
124
126
128
130
200 300 400 500 600 700 800 900 1000 1100 1200 1300 1400 1500 1600
λ
Radius of Curvature (ft)
Straight Girder

30
Linear elastic materials were used in all analyses conducted. Within the context
of an elastic analysis, a linear geometric analysis formulates equations of equilibrium
using the initial undeformed geometry of the structure and loading. Such an analysis is
accurate if deformations remain sufficiently small so as not to significantly alter the
equations of equilibrium, and therefore not to significantly affect the predicted stresses
and deformations.
In the case of a geometric nonlinear analysis, equations of equilibrium are formed
in the deformed configuration of the structure. This provides a more accurate
representation of actual behavior, since an actual structure must always be in equilibrium
in any deformed state. For structures that undergo significant displacements, a nonlinear
analysis will provide a more accurate prediction of stresses and deformations. For a
geometric nonlinear FE analysis, various solution strategies are possible, but these
generally involve applying load in increments and then iterating to find a solution within
a specified tolerance.
3.5.2 Parameter Descriptions
Using the geometric nonlinear analysis capability of ANSYS, a parametric study
was conducted on curved steel I-girders during lifting. These parametric studies were
conducted on doubly symmetric, prismatic girders. The parameters that were investigated
were the slenderness ratio (bf/D) where bf is the flange width and D is the web depth, the
lifting location (a/L) where a is the distance from the lift point to the end of the girder and
L is the girder length, the radius of curvature (R), and the girder cross sectional
properties. The girder cross sectional properties that were varied include the web depth,
D, the flange width, bf, and the flange thickness, tf. The parameters are illustrated defined
in Figure 3.8.

31
Figure 3.8: Definition of Parameters
3.5.3 Parameter Ranges
3.5.3.1 Flange Width to Depth Ratio (bf/D)
The flange width to depth ratio (bf/D) that the Texas Department of
Transportation (TxDOT) recommends in their TxDOT Preferred Practices for Steel
Bridge Design, Fabrication, and Erection is 1/3 (Texas Steel Quality Council, 2007).
AASHTO on the other hand allows a bridge design engineer to use a flange width to
depth ratio as little as 1/6 as seen in Equation 6.10.2.2-2 of the AASHTO LRFD Bridge
Specification (AASHTO, 2008). In this study, the range of bf/D ratios that were used was
0.15 to 0.33 (roughly 1/6 to 1/3) to study the behavior of the girders at these two limits.
After a number of studies with varying values of bf/D were conducted, bf/D = 1/3 was
used in subsequent studies. When changing the bf/D ratio, the depth stayed constant and
only the flange width varied. Additionally, when the flange widths were varied, the
flange thicknesses also changed to maintain the same flange slenderness (bf/2tf). For
example, if the flange width doubled in size from 9 in to 18 in, the flange thicknesses also
doubled in size from 0.5 in to 1.0 in. For all parametric studies completed, the top and
bottom flange dimensions were identical.
D
bf
L
R
tf
z
L
a a
Lifting Point
Lifting Point

32
3.5.3.2 Lift Location (a/L)
The lift location ratio (a/L) is used to create a non-dimensional variable able to be
compared between all parametric studies regardless of the length of the girder. The
variable a is the distance from the end of the girder being lifted to the lift point. The
variable L is the total length of the girder being lifted. For this study, all of the lifting
locations were symmetric about the center of the girder. At first, the values of the a/L
ratio considered ranged from 0.15 to 0.34. After a number of studies were concluded, the
range was reduced to 0.20 to 0.25. This was done because a/L values outside of this
range were not practical since they resulted either in excessive initial rigid body
rotation or in excessive cross sectional twist for most girders studied. This is discussed in
greater detail in the results section.
3.5.3.3 Radius of Curvature
The radius of curvature (R) is the distance from the center of curvature to the
centerline of the girder cross section. The radius of curvatures that were considered in
this study ranged from 500 ft. to 8,000 ft. The 8000 ft. radius of curvature was intended
to approximate a straight girder. Most bridges in Texas have a radius of curvature greater
than 800 ft.
3.5.3.4 Girder Cross Section
The girder depth (D) refers to the depth of the web of the girder. The girder
depths considered in this study were 60 in, 72 in, or 96 in with the majority of the girders
having a depth of 60 in.The flange width (bf) investigated in this study ranged from 9 in
to 24 in. The flange thickness ranged from 0.5 in to 1.125 in.
The girder length (L) refers to the total length of the lifted girder lengths, which
ranged from 80 ft to 225 ft. A majority of the girders studied had a length of either 80 ft
or 125 ft.

33
3.6 RESULTS OF PARAMETRIC STUDIES
3.6.1 Overview
This section presents key results from the parametric studies on geometric
nonlinear analysis of curved steel I-girders during lifting. Rather than presenting the
results for each variable individually, results are presented in the context of important
issues related to girder analysis and lifting.
3.6.2 Using Eigenvalues to Predict Instability of Curved Girders
One of the key objectives in this parametric study was to investigate how well
eigenvalue analysis characterizes potential instability of curved girders during lifting.
Some representative results from this evaluation are illustrated in Figure 3.9 and Figure
3.10. In Figure 3.9, three 125 ft long girders with a bf/D ratio of 1/3 were analyzed and
their top flange and bottom flange out of plane displacements are plotted against
multiples of the girders self weight. The depth of the web is 60 in and the width of the
flanges is 20 in. The girder is lifted at a/L equal to 0.21. The three girders lifted have a
radius of curvature of 500 ft, 1000 ft, and 8000 ft (straight). The out of plane
displacements graphed in the remainder of this chapter are the result of the geometric
nonlinear analysis. The dotted line represents the top flange out of plane displacement
and the solid line represents the bottom flange out of plane displacement. The eigenvalue
for the three girders is 25.4 and is also plotted. Although the magnitudes of the loads that
are graphed are not generally practical, the purpose of this comparison is to determine if
the eigenvalue provides a reasonable estimate of a limit for curved girders. In as such,
the load level that is graphed is the eigenvalue for the problem. Recall that the radius of
curvature does not have a significant effect on the eigenvalue. Consequently, the
eigenvalue of 25.4 was computed for all three values of radius of curvature considered in
this analysis. In Figure 3.10, three similar girders to the ones plotted in Figure 3.9 are
shown, with the exception that the bf/D ratio is 1/6. The depth of the girders is still 60 in
but the width of the flanges is now 9 in. Note that the horizontal scales are different for
Figure 3.9 and Figure 3.10.

34
Figure 3.9: Flange Lateral Displacements for bf/D = 1/3
Figure 3.10: Flange Lateral Displacements for bf/D = 1/6
‐30
‐20
‐10
0
10
20
30
0 5 10 15 20 25 30
Out of Plane
Displacem
ents [in]
Multiple of Self Weight
R = 500 ftR = 1000 ft
R = Straight
Eigenvalue= 25.4
R = 500 ftR = 1000 ft
R = Straight
Eigenvalue= 25.4Top Flange Bottom Flange
‐30
‐20
‐10
0
10
20
30
0 0.5 1 1.5 2 2.5 3 3.5
Out of Plane
Displacem
ents [in]
Multiple of Self Weight
R = 500 ftR = 1000 ft
R = Straight
Eigenvalue= 3.3Top Flange Bottom Flange

35
Several observations can be made from Figure 3.9 and Figure 3.10. Looking at the
displacements plotted on both figures, the straight girders exhibits a reasonably well
defined bifurcation type behavior. That is, the lateral displacements initially remain very
small as the load (represented by a multiple of self weight) increases, and then there is a
load at which the lateral displacements increase rapidly. Further, the eigenvalue captures
this phenomenon reasonably well. That is, the eigenvalue provides a good estimate of the
load at which lateral displacements become large. Thus, the eigenvalue is a good
predictor of elastic lateral torsional buckling for straight girders.
The lateral displacement plots for the curved girders, on the other hand, show a
somewhat different type of behavior. These plots do not show a bifurcation type
behavior. Rather, these plots show a continuous growth of lateral displacement from the
start of loading, with no well defined bifurcation or critical load. Such a behavior is
expected for a system with large initial geometric imperfections. As noted earlier, the
curved geometry can be viewed as a large initial geometric imperfection from a stability
perspective. When the load corresponding to the eigenvalue is reached for the curved
girders, the out of plane displacements are significantly larger than for the straight girder.
For example, for the straight girder with bf/D =1/3 (Figure 3.9), the out of plane
displacement at the eigenvalue is about 7 inches. For the curved girder with a radius of
500 feet, the out of plane displacement at the same eigenvalue is about 22 inches. This
large out of plane displacement would cause major problems with the girder erection.
Thus, the eigenvalue can provide a general indication of the load to cause lateral
torsional buckling of straight girders, but is not practical for most curved steel I-girder
during lifting. Therefore, additional checks are likely needed to assure that out of plane
displacements are within reasonable serviceability limits and do not result in yielding of
the girder.
3.6.3 Additional Failure Criteria for Lifting of Horizontally Curved I-Girders
As described above, the eigenvalueis not a good indicator of the potential for
strength or serviceability problems during lifting of curved I-girders. Depending on the
degree of curvature, large and potentially problematic out of plane displacements can

36
occur at loads well below the eigenvalue. Consequently, additional failure criteria need to
be considered in the analysis of curved girders during lifting. In this section, two
additional failure criteria are considered. These failure criteria are related to yielding of
the girder and excessive rotation of the girder ends, and are described below.
From both a strength and serviceability point of view, yielding of the girder
during lifting will be considered as a failure criterion. Yielding, in addition to causing
permanent deformation of the girder, can also cause a loss of stiffness that may result in
instability. Thus, using geometric nonlinear analyses, the stresses in the girder is
examined to determine when yielding is expected. For the current analysis, failure is
taken as the load at which peak girder stresses reach Fy/2, where Fy is taken as 50 ksi. The
stress limit is taken as one-half of the yield stress to account for the presence of residual
stresses in the girder. The stress limit of Fy/2 is somewhat arbitrary, but is considered
reasonable for this analysis.
In addition to limiting stress in the girder, an additional limit is needed to avoid
deformation related serviceability problems. However, it is more difficult to quantify a
serviceability limit state for the lifting of curved girders. Setting this limit requires
answering questions such as: how much deformation can be allowed at the end of a
girder and still be able to complete the air splice. To help answer these questions, a
nationwide survey was sent out to contractors and engineers to collect data on
serviceability and other lifting issues (Farris, 2008). From the results of the survey, a
serviceability criterion was established that rotations at the girder ends in excess of 1.5
degrees can result in fit-up problems. While this limit is subject to considerable
judgment, this limit will be used in the analysis described below and a reasonable basis
for minimizing serviceability problems.
To evaluate limit states related to yielding and girder end rotation, out of plane
displacements are calculated with the only load on the girder being the self weight.
Although wind may be present in the field, typically erectors and Departments of
Transportations have strict guidelines on wind conditions that preclude girder erection. If
it is too windy, then the lift will be postponed to a later time. Therefore, wind is not
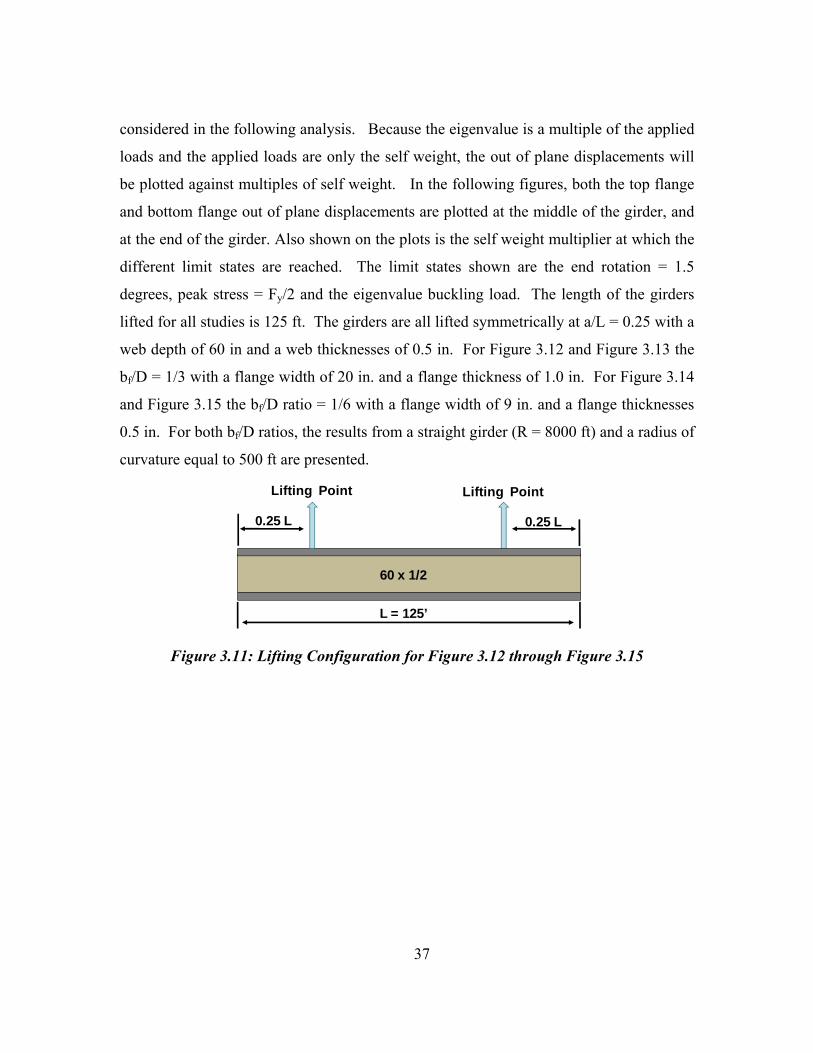
37
considered in the following analysis. Because the eigenvalue is a multiple of the applied
loads and the applied loads are only the self weight, the out of plane displacements will
be plotted against multiples of self weight. In the following figures, both the top flange
and bottom flange out of plane displacements are plotted at the middle of the girder, and
at the end of the girder. Also shown on the plots is the self weight multiplier at which the
different limit states are reached. The limit states shown are the end rotation = 1.5
degrees, peak stress = Fy/2 and the eigenvalue buckling load. The length of the girders
lifted for all studies is 125 ft. The girders are all lifted symmetrically at a/L = 0.25 with a
web depth of 60 in and a web thicknesses of 0.5 in. For Figure 3.12 and Figure 3.13 the
bf/D = 1/3 with a flange width of 20 in. and a flange thickness of 1.0 in. For Figure 3.14
and Figure 3.15 the bf/D ratio = 1/6 with a flange width of 9 in. and a flange thicknesses
0.5 in. For both bf/D ratios, the results from a straight girder (R = 8000 ft) and a radius of
curvature equal to 500 ft are presented.
Figure 3.11: Lifting Configuration for Figure 3.12 through Figure 3.15
60 x 1/2
0.25 L0.25 L
Lifting Point Lifting Point
L = 125’
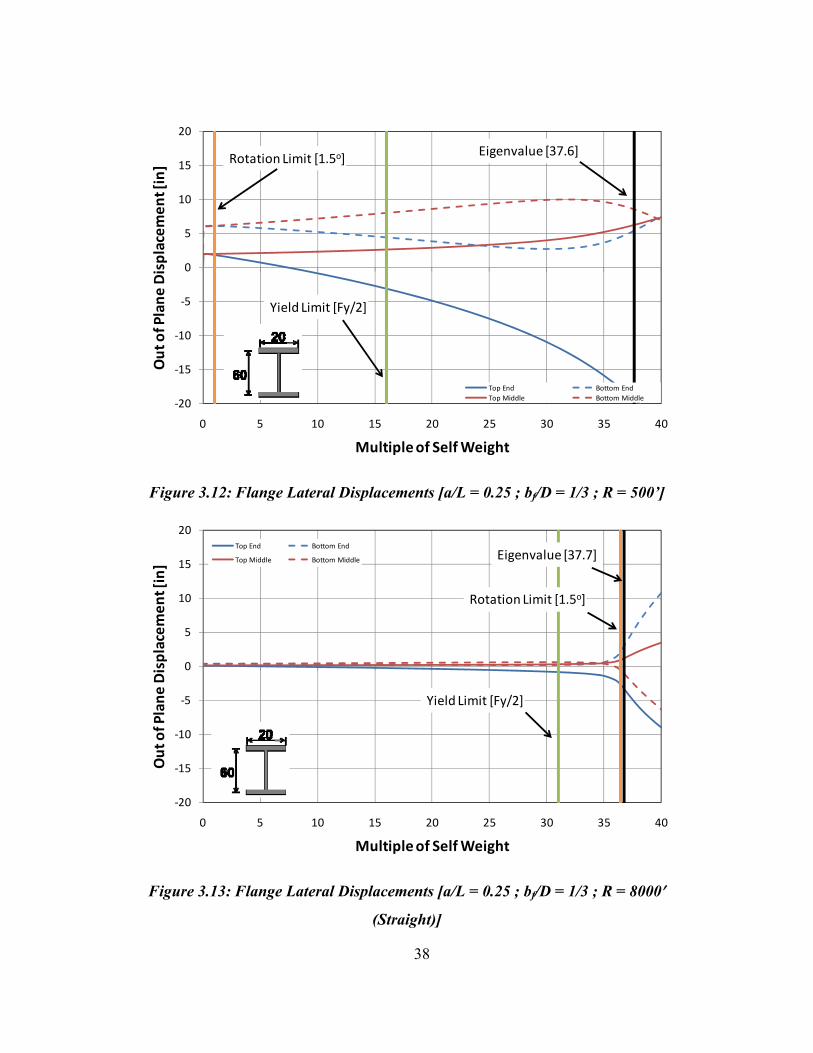
38
Figure 3.12: Flange Lateral Displacements [a/L = 0.25 ; bf/D = 1/3 ; R = 500’]
Figure 3.13: Flange Lateral Displacements [a/L = 0.25 ; bf/D = 1/3 ; R = 8000′
(Straight)]
‐20
‐15
‐10
‐5
0
5
10
15
20
0 5 10 15 20 25 30 35 40
Out of Plane
Displacem
ent [in]
Multiple of Self Weight
Top End Bottom EndTop Middle Bottom Middle
Yield Limit [Fy/2]
Rotation Limit [1.5o] Eigenvalue [37.6]
‐20
‐15
‐10
‐5
0
5
10
15
20
0 5 10 15 20 25 30 35 40
Out of Plane
Displacem
ent [in]
Multiple of Self Weight
Top End Bottom End
Top Middle Bottom Middle
Yield Limit [Fy/2]
Rotation Limit [1.5o]
Eigenvalue [37.7]

39
Figure 3.14: Flange Lateral Displacements [a/L = 0.25 ; bf/D = 1/6 ; R = 500’]
Figure 3.15: Flange Lateral Displacements [a/L = 0.25 ; bf/D = 1/6 ; R = 8000′
(Straight)]
‐40
‐30
‐20
‐10
0
10
20
30
40
0 1 2 3 4 5 6 7 8
Out of Plane
Displacem
ent [in]
Multiple of Self Weight
Top End Bottom End
Top Middle Bottom Middle
Yield Limit [Fy/2]
Rotation Limit [1.5o]
Eigenvalue [7.1]
‐40
‐30
‐20
‐10
0
10
20
30
40
0 1 2 3 4 5 6 7 8
Out of Plane
Displacem
ent [in]
Multiple of Self Weight
Top End Bottom End
Top Middle Bottom Middle
Yield Limit [Fy/2]
Rotation Limit [1.5o]
Eigenvalue [7.0]

40
As seen in Figure 3.13 and Figure 3.15 for the straight girder, the eigenvalue
once again provides a reasonable indication of the load at which large out of plane
displacements begin to occur, and provides a reasonable correlation with the load at
which the yielding and end rotation limit states are exceeded. However, for the curved
girder with a 500 ft. radius of curvature (Figure 3.12 and Figure 3.14) the girders
deflected a large amount by the time it reaches the load corresponding to the eigenvalue.
As a result, the load corresponding to the eigenvalue is significantly larger than the load
at the yield or end rotation limit states. Thus, as noted in the previous section, the
eigenvalue, by itself, may not be a reliable indicator of the potential for strength or
serviceability problems during lifting of curved I-girders.
An important observation from the plots shown above is that the rotation limit
controls in most situations. In three of the four plots above, the rotation limit is reached
first, then the yield limit, and finally the eigenvalue. In additional studies shown in
Appendix A, the only time it was found that the rotation limit state did not control was
with straight girders. In these cases, the yield limit can be reached first. The rotation
limit generally controlled for girders with a reasonable amount of curvature
(approximately R < 2000 ft). It should also be noted that in Figure 3.14, there is a large
initial rotation and therefore the 1.5 degree rotation limit is reached at less than the girder
self weight. These analyses show the importance of controlling girder rotations when
lifting curved girders.
3.6.4 Controlling Girder Rotation during Lifting
3.6.4.1 Overview
In order to control girder rotation, it is important to understand what contributes to
the rotation of a girder. As discussed earlier, girder rotation has two different
components: rigid body rotation and cross sectional twist. The rigid body rotation is
independent of girder stiffness and is completely a function of the geometry of the girder
and the lift locations. The cross sectional twist on the other hand is a function of the
girder’s St. Venant and warping torsional stiffness. Therefore, to control the rotations of
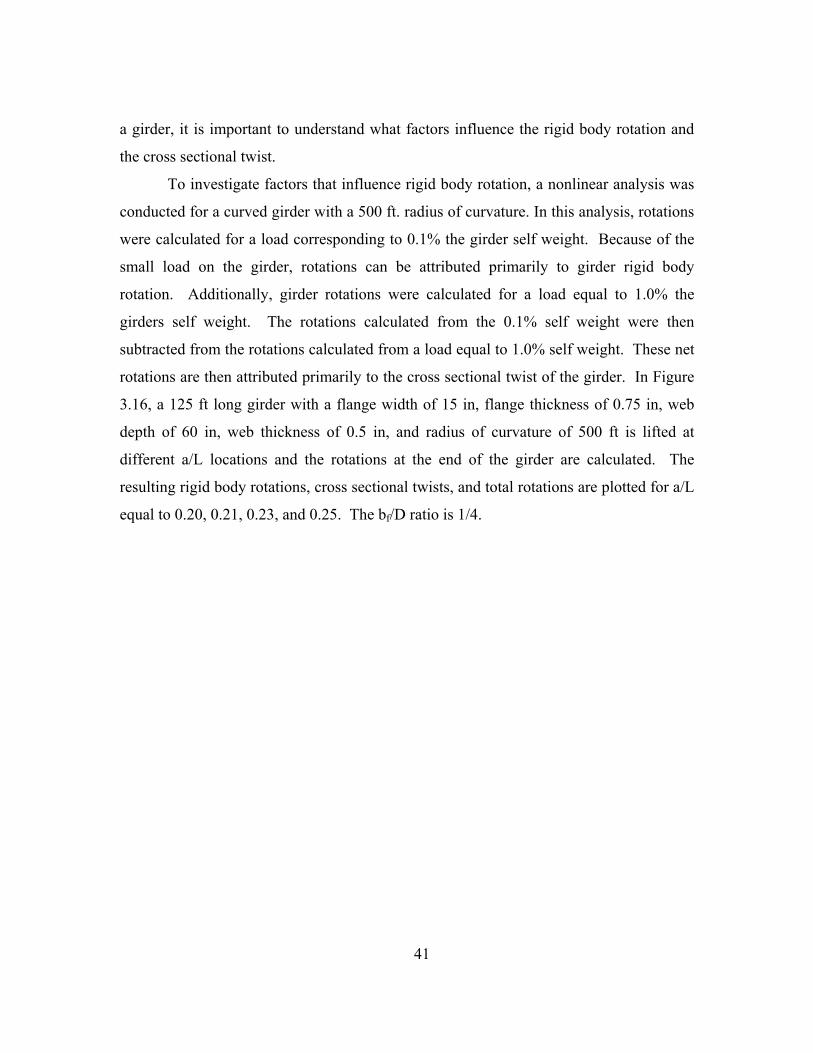
41
a girder, it is important to understand what factors influence the rigid body rotation and
the cross sectional twist.
To investigate factors that influence rigid body rotation, a nonlinear analysis was
conducted for a curved girder with a 500 ft. radius of curvature. In this analysis, rotations
were calculated for a load corresponding to 0.1% the girder self weight. Because of the
small load on the girder, rotations can be attributed primarily to girder rigid body
rotation. Additionally, girder rotations were calculated for a load equal to 1.0% the
girders self weight. The rotations calculated from the 0.1% self weight were then
subtracted from the rotations calculated from a load equal to 1.0% self weight. These net
rotations are then attributed primarily to the cross sectional twist of the girder. In Figure
3.16, a 125 ft long girder with a flange width of 15 in, flange thickness of 0.75 in, web
depth of 60 in, web thickness of 0.5 in, and radius of curvature of 500 ft is lifted at
different a/L locations and the rotations at the end of the girder are calculated. The
resulting rigid body rotations, cross sectional twists, and total rotations are plotted for a/L
equal to 0.20, 0.21, 0.23, and 0.25. The bf/D ratio is 1/4.

42
Figure 3.16: Rotations at the End of the Girder for Different Lifting Locations
[R = 500 ft ; bf/D = 1/4]
The results from Figure 3.16 show that the rigid body rotation is lowest at a/L of
approximately 0.21. The cross sectional twist, on the other hand, is lowest at a/L of
approximately 0.23. Therefore one might think the optimal place to lift a girder would be
somewhere between 0.21 and 0.23 depending on the cross sectional properties and the
stiffness of the given girder. Yet, in Figure 3.16, the lowest total rotation is found at a/L
= 0.20. This is because the rigid body rotation and the cross section twist occur in
different directions and tend to cancel each other at a/L = 0.20 Although the lowest
total rotation is at a/L = 0.20, the highest cross sectional twist occurs for this lifting
location. Therefore, there may be a concern that large rotations may be occurring at other
points along the girder. The end rotations are important when connecting a splice, but
being able to connect the cross frames elsewhere on the girder is also of concern. If the
girder is rotated too much along the middle section of the girder, then cross frame fit up
‐2
‐1
0
1
2
3
4
5
0.20 0.21 0.22 0.23 0.24 0.25
Rotation
[Degrees]
Lifting Location [a/L]
Rigid Body Rotation (RBR)
Cross Sectional Twist (CST)
Total Rotations (TR)
Rigid Body Roation (RBR) + Cross Sectional Twist (CST) = Total Rotations (TR)
RBR = Min CST = Min

43
may be a problem. Figure 3.17 plots rotations at the middle of the same girder that was
analyzed for Figure 3.16.
Figure 3.17: Rotations at Middle of Girder for Different Lifting Locations
[R = 500 ft ; bf/D = 1/4]
It can be seen in Figure 3.17 that the total rotation at the middle of the girder is
the greatest at the two extremes: a/L = 0.20 and a/L = 0.25. The least total rotation at the
middle of the girder occurs at a/L ≈ 0.22. As was the case with the end of the girder, this
is also where the rigid body rotation and cross sectional twist tend to cancel each other.
However, the lift location that minimizes total rotation at the girder end (a/L = 0.20) is
different than the lift location that minimized total rotation at the middle of the girder
(a/L = 0.22). Therefore, it may be better for many lifting scenarios to lift the girder
somewhere between a/L = 0.20 and 0.22 where the total rotations both at the end of the
girder and at the middle of the girder are relatively low. Alternatively, an erector can
choose to lift a girder at a location that will minimize total rotation at a specific point
‐5.0
‐4.0
‐3.0
‐2.0
‐1.0
0.0
1.0
2.0
3.0
4.0
5.0
6.0
7.0
0.20 0.21 0.22 0.23 0.24 0.25
Rotation
[degrees]
Lifting Location [a/L]
Rigid Body Rotation (RBR)
Cross Sectional Twist (CST)
Total Rotations (TR)
Rigid Body Roation (RBR) + Cross Sectional Twist (CST) = Total Rotations (TR)
TR = Min

44
along the girder where a critical fit up tolerance is needed. Further discussion of this issue
is provided later.
3.6.4.2 Minimizing Rigid Body Rotation
This section examines the value of a/L that minimizes the rigid body rotation for a
prismatic girder. As discussed earlier, the rigid body rotation is due to the line of support
between the two lift points being eccentric to the center of gravity of the curved girder
(Figure 3.2). Larger eccentricities lead to larger rigid body rotations. In Figure 3.18, the
eccentricities for a prismatic girder are normalized to the maximum eccentricity for
different lift locations ranging from a/L = 0 to 0.5. The values presented are the absolute
values for the eccentricity.
Figure 3.18: Eccentricity for Prismatic Girders Lifted at Different Locations
It can be seen from the results in Figure 3.18 that the smallest eccentricity occurs
at a/L = 0.211. At this location, the line of support essentially passes through the center
of gravity and therefore causes no rigid body rotation. These findings are valid for radius
0
0.1
0.2
0.3
0.4
0.5
0.6
0.7
0.8
0.9
1
0 0.05 0.1 0.15 0.2 0.25 0.3 0.35 0.4 0.45 0.5
Normalized
Absolute Va
lue of Eccen
tricity, e
Lift Location [a/L]
Minimum at a/L = 0.211

45
of curvature values of approximately100 ft or greater and are consistent with earlier
results reported in Figure 3.16 and Figure 3.17 which showed that the smallest rigid body
rotations occurred at a location of a/L = 0.21. Note that for nonprismatic girders, the
value of a/L that results in no rigid body rotation will be different, but can be determined
by computing the location of the center of gravity of the girder.
3.6.4.2.1 Rigid Body Rotation Limits
In the previous analysis shown in Figure 3.14, the rigid body rotation on the
girder was large enough that the 1.5 degree rotation limit was exceeded at less than the
full girder self weight. Clearly, if the lift locations are chosen so that rigid body rotation
is large, it may be impossible to satisfy the 1.5 degree rotation limit regardless of girder
stiffness. This is demonstrated in the analysis plotted in Figure 3.19. A stiff girder is
lifted at a location a/L = 0.30. The cross sectional properties of the girder are similar to
that of the girders lifted above with a bf/D ratio = 1/3, length = 125 ft, flange width = 20
in, web depth = 60 in, and a radius of curvature = 500 ft.
Figure 3.19: Flange Rotation [a/L = 0.30 ; bf/D = 1/3 ; R = 500’]
0
5
10
15
20
25
30
35
40
45
50
0 2 4 6 8 10 12 14 16 18 20
Absolute Va
lue of Rotations [d
egrees]
Multiple of Self Weight
Yield Limit [Fy/2]
Rotation Limit [1.5o]
Eigenvalue [19.5]
Endof Girder
Middle of Girder

46
For this girder, the rigid body rotation exceeds 1.5 degrees. Consequently, the 1.5
degree rotation limit can only be achieved if the direction of cross section twist is
opposite to the rigid body rotation and reduces the total rotation to the 1.5 degree limit.
However, as described above, even if rigid body rotations and cross section twist cancel
each other at the girder ends, they may be additive near the middle of the girder, resulting
in large rotations in the middle portions of the girder. Consequently, choosing a lifting
location that results in a large rigid body rotation is likely to lead to serviceability
problems at some point along the girder. As a result, it is important to understand how
the lifted location can have a large effect on the rigid body rotation. Because of this, it is
not recommended to lift a prismatic girder at a location greater then a/L = 0.25.
3.6.4.3 Minimizing Cross Sectional Twist
This section examines how the lift location a/L affects the cross section twist for a
prismatic curved girder. Cross section twist refers to rotation of the girder due to an
applied torsional moment, as shown in Figure 3.20. As used herein, the term cross section
twist refers to the rotation resulting only from torsional flexibility of the girder, and does
not include rigid body rotation.
Figure 3.20: Cross Sectional Twist
For a curved girder during lifting, the torsional moment that produces cross
section twist is generated by the girder’s self weight. The distribution of torsional
moment along the length of a lifted curved girder was evaluated by Stith (2010). An
example of the analysis by Stith is shown in Figure 3.21. The torsional moment along the

47
length of the girder is graphed in the figure. The torsional moment is normalized by its
maximum value. Note that this torsional moment is based on the undeformed geometry of
the girder.
Figure 3.21: Example Torsion Diagram for Prismatic Girder [a/L = 0.23]
It should be noted that the radius of curvature will only change the magnitude of
the torsion diagram, but not the shape. Therefore, for all configurations of a prismatic
girder lifting at a/L = 0.23, the plot shown in Figure 3.21 represents the shape of the
normalized torsion diagram. Note that the largest torsional moments occur at the lift
locations.
The amount of cross section twist at the girder ends depends on the girder
torsional stiffness as well as the magnitude and distribution of torque along the girder.
However, for given cross section torsional properties, the amount of cross section twist at
the girder ends is related to the absolute value of the area under the torsion diagram
(Stith, 2010). More cross section twist will occur in the girder the larger the area is under
the torsion diagram. In Figure 3.22, the summation using the absolute value of the area
‐1
‐0.8
‐0.6
‐0.4
‐0.2
0
0.2
0.4
0.6
0.8
1
0 0.1 0.2 0.3 0.4 0.5 0.6 0.7 0.8 0.9 1
Normalized
Torque
Location along Girder [x/L]

48
under the torsion diagrams constructed for lift locations ranging from a/L = 0 to a/L = 0.5
is presented.
Figure 3.22: Summation of Area under Torque Diagram for Different Lift Locations
From Figure 3.22, it can be seen that the smallest total area occurs at a/L = 0.238.
This indicates that the least amount of cross sectional twist in a prismatic girder segment
occurs at a lift location a/L equal to 0.238. The results of Figure 3.22 are consistent with
the results shown in Figure 3.16 and Figure 3.17 that show that the lift location a/L =
0.23 has the least amount of cross sectional twist.
As discussed earlier, another way to evaluate the stability of a system is to
calculate the eigenvalue. Although the eigenvalue, by itself, may not be an accurate
indicator of potential strength and serviceability problems for curved girders, it still
provides a general indication of girder instability. In Figure 3.23, the diagram shown in
Figure 3.22 is inverted and eigenvalues for prismatic girders are normalized to the
maximum eigenvalue and plotted for different a/L locations.
0
0.1
0.2
0.3
0.4
0.5
0.6
0.7
0.8
0.9
1
0 0.05 0.1 0.15 0.2 0.25 0.3 0.35 0.4 0.45 0.5
Summation of Area Und
er To
rque
Diagram
[φ
/φMax]
Lift Location [a/L]
Minimum at a/L = 0.238
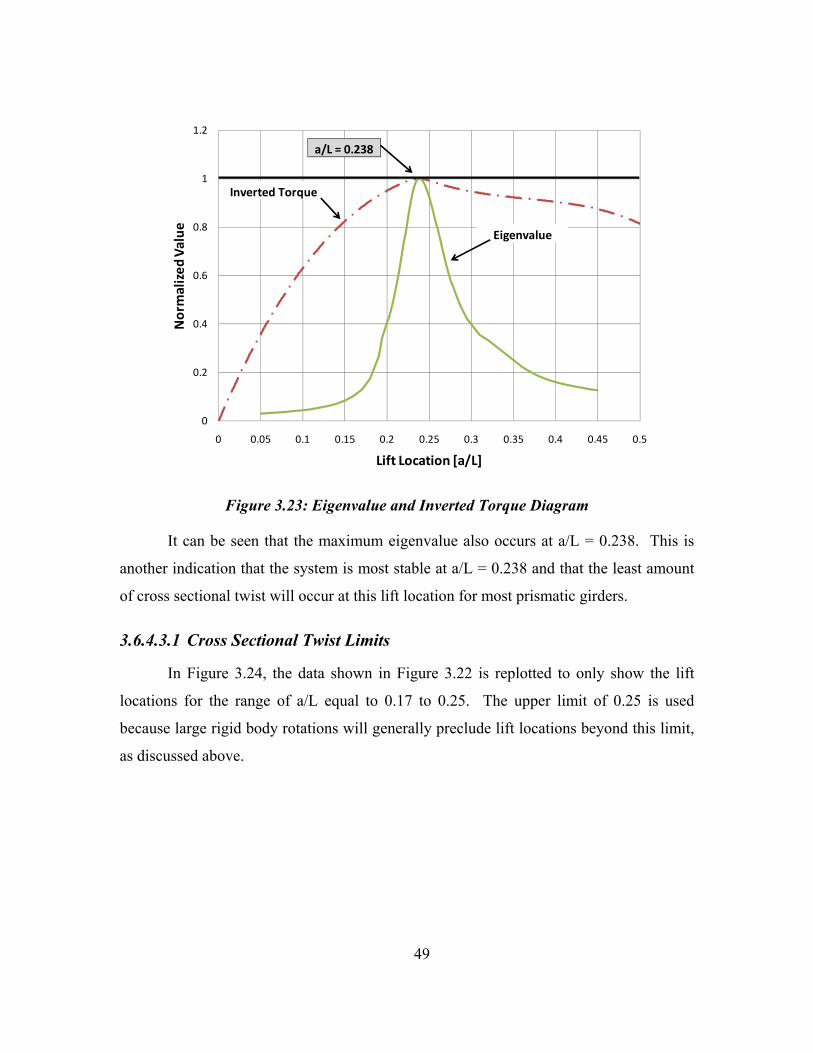
49
Figure 3.23: Eigenvalue and Inverted Torque Diagram
It can be seen that the maximum eigenvalue also occurs at a/L = 0.238. This is
another indication that the system is most stable at a/L = 0.238 and that the least amount
of cross sectional twist will occur at this lift location for most prismatic girders.
3.6.4.3.1 Cross Sectional Twist Limits
In Figure 3.24, the data shown in Figure 3.22 is replotted to only show the lift
locations for the range of a/L equal to 0.17 to 0.25. The upper limit of 0.25 is used
because large rigid body rotations will generally preclude lift locations beyond this limit,
as discussed above.
0
0.2
0.4
0.6
0.8
1
1.2
0 0.05 0.1 0.15 0.2 0.25 0.3 0.35 0.4 0.45 0.5
Normalized
Value
Lift Location [a/L]
a/L = 0.238
Inverted Torque
Eigenvalue

50
Figure 3.24: Summation of Area under Torque Diagram for a/L equal to 0.17 – 0.25
It can be seen in Figure 3.24 that the summed area under the normalized torque
diagram at a/L = 0.238 is 0.017. At a/L = 0.20, the value more than triples to a value of
0.066. By the time the lift location is moved out to a/L = 0.17 the value is 0.132; almost
eight times the value at a/L = 0.238. Between a/L = 0.17 and 0.20 the cross sectional
twist generally dominates the behavior and leads to large rotations in horizontally curved
I-girders. Therefore, it is recommended to lift a girder at a location between a/L = 0.20
and a/L = 0.25 to avoid excessive torsional deformations on the girder that lead to large
twists of the cross section.
3.6.5 Preferred Lifting Locations
3.6.5.1 Slenderness Ratio [bf/D]
A parameter that is sometimes used as an indicator of potential stability problems
during girder lifting and erection is the ratio of girder flange width to depth bf/D. To
evaluate the significance of this parameter, it is instructive to consider the effect of cross-
0
0.02
0.04
0.06
0.08
0.1
0.12
0.14
0.17 0.18 0.19 0.2 0.21 0.22 0.23 0.24 0.25
Summation of Area Und
er To
rque
Diagram
[φ
/φMax]
Lift Location [a/L]
0.017 0.0250.017 0.025
0.066
0.132Cross Sectional Twist
Lower Limit Rigid Body Rotation
Upper Limit
Proposed Lifting Locations

51
section dimensions on the critical elastic lateral torsional buckling moment computed by
Timoshenko’s equation. This equation, shown in Figure 3.25, has two terms that
contribute to the buckling resistance. As shown in the figure, these two terms are the St.
Venant’s torsional stiffness and the warping torsion stiffness.
Figure 3.25: Components of Timoshenko’s LT Buckling Equation
The flange width is important in determining many of the cross section properties
that are found in both the St. Venant’s stiffness and the warping stiffness terms. The
moment of inertia (Eq. 3.4), Iy, the torsional constant (Eq. 3.5), J, and the warping
torsional constant (Eq. 3.6), Cw, are all variables that are dependent on the flange width,
bf.
Figure 3.26: Cross Sectional Property Designations
6 Eq. 3.4
⎟⎟⎠
⎞⎜⎜⎝
⎛+= 2
22
bwyy
bo L
CIEGJEIL
M ππ
Part 1: St. Venant’s StiffnessPart 2: Warping Stiffness
Part 1 Part 2
bf
d
tf
tw XX
Y
Y

52
23 Eq. 3.5
4 24 Eq. 3.6
Because the thickness of the flange, t, and the width of the web, w, are small, the
torsional constant, J, is generally small relative to the moment of inertia, Iy, and the
torsional warping constant, Cw. Yet, both the moment of inertia and the torsional
warping constant are dependent on the flange width cubed. Therefore, for a constant
depth, doubling the slenderness ratio (bf/D) from 1/6 to 1/3 can make each one of these
terms eight times larger. Therefore, increasing the flange width will significantly increase
the torsional stiffness and significantly increase the buckling moment.
As described earlier, current TxDOT preferred practices suggest limiting the
value of bf/D to 1/3. On the other hand, AASHTO permits a value of bf/D as small as 1/6.
Girders with a slenderness ratio closer to bf/D = 1/3 have a significantly higher torsional
stiffness and the rotation is more likely to be affected by rigid body rotation than by cross
section twist. Therefore, it may be beneficial to lift these girders closer to a/L = 0.211 to
minimize the rigid body rotation. For more slender girders closer to bf/D = 1/6, cross
sectional twist will play a much larger role in girder rotation. Therefore, it may be
beneficial to lift these girders closer to a/L = 0.238 to minimize the cross sectional twist.
Highly curved girders with a slenderness ratio close to bf/D = 1/6 may be
problematic during lifting. Lifting these girders close to a/L = 0.238 to prevent excessive
cross sectional twist will still lead to relatively large rigid body rotations. Yet, if the lift
locations are chosen to minimize rigid body rotations, then large cross sectional twist will
occur. This effect can be seen in Figure 3.27 where a girder with a flange width of 9 in,
flange thickness of 0.5 in, web depth of 60 in, web thickness of 0.5 in, a length of 125 ft,
and a radius of curvature of 500 ft is lifted.

53
Figure 3.27: Rotations at End of Girder for Different Lifting Locations
[R = 500 ft; bf/D = 1/6]
It can be seen by looking at the total rotations in Figure 3.27 that no matter where
the girder is lifted, the total rotations are above the 1.5 degree limit. In this case, lifting
the girder at a/L = 0.25 creates the least amount of cross sectional distortion, yet, the rigid
body rotation is almost 4 degrees. If the girder is lifted at a/L = 0.21, then the rigid body
rotation is minimized, but the cross sectional twist is almost 2 degrees. Lifting the girder
at a/L = 0.2 where the total rotation is the least creates the largest cross sectional twist as
expected. Therefore, other locations on the girder should be checked to confirm that
excessive deformations are not occurring. In Figure 3.28 the same girder is lifted and the
rotations at the middle of the girder are plotted for different lift locations.
‐1
0
1
2
3
4
5
0.20 0.21 0.22 0.23 0.24 0.25
Rotation
[Degrees]
Lifting Location [a/L]
Rigid Body RotationCross Sectional Twist
Total Rotations
Rigid Body Roation + Cross Sectional Twist = Total Rotations
1.5 Degree Rotational Limit

54
Figure 3.28: Rotations at Middle of Girder for Different Lifting Locations
[R = 500 ft ; bf/D = 1/6]
It can be seen in Figure 3.28 that at a/L = 0.20, the total rotation at the middle is
almost 7 degrees. A majority of this is due to cross sectional twist as expected. It can
therefore be concluded that the best place to lift the girder would be somewhere between
a/L = 0.21 to 0.23. Yet, as noted above, no location gives total rotations under the 1.5
degree limit. Therefore, due to serviceability issues during lifting, designing very slender
members with a small top flange and a small radius of curvature is not recommended.
With girders approaching bf/D = 1/6, the best control over deformations will likely be to
use two cranes with spreader bars so that the girder is supported at 4 lift points. Although
parametric studies with 4 support points were not considered, isolated cases showed that
the resistance to both rigid body deformations and torsional deformations were
significantly improved.
‐5.0
‐4.0
‐3.0
‐2.0
‐1.0
0.0
1.0
2.0
3.0
4.0
5.0
6.0
7.0
0.20 0.21 0.22 0.23 0.24 0.25
Rotation
[degrees]
Lifting Location [a/L]
Rigid Body Rotation
Cross Sectional Twist
Total Rotations
Rigid Body Roation + Cross Sectional Twist = Total Rotations
Large Total Rotaions

55
3.6.5.2 Subtended Angle
A useful parameter when determining where to lift horizontally curved I-girders is
the girder’s subtended angle. The subtended angle, θ, is determined by the angle created
by the arc formed by the girder as shown in Figure 3.29. If the radius of curvature of a
girder is large, the subtended angle is generally small. When expressed in radian, the
subtended angle is the arc length of the segment divided by the radius of curvature [L/R].
Figure 3.29: Subtended Angle [Θ] Definition
In Figure 3.30, a girder with a flange width of 12 in, flange thickness of 0.625 in,
web depth of 60 in, web thickness of 0.5 in, and a length of 125 ft is lifted at four
different lift locations: a/L = 0.20, 0.21, 0.23, and 0.25. For each of the lift locations, the
girder was lifted with five different radii of curvature: R = 1000 ft, 1500 ft, 1800 ft, 2000
ft, and 2500 ft. Five different values for subtended angle are plotted for each lift location.
The subtended angles are plotted versus the load in multiples of self weight that causes
the girder to reach an end rotation of 1.5 degrees.
Θ
R
L

56
Figure 3.30: Optimal Lifting Location as a Function of Subtended Angle, Theta, to
Cause End Rotation of 1.5 Degrees [bf/D = 1/5]
From the results in Figure 3.30, it can be seen that there are different lift locations
that provide the most stable system for different subtended angles. For a given length
girder, larger subtended angles result from the smaller radius of curvature values. These
girders are more vulnerable to rigid body rotations and therefore it is important to lift
them so that the rigid body rotations are small. For a given length girder, smaller
subtended angles result from larger values of the radius of curvature. In the limit of an
infinite radius of curvature, i.e. a straight girder, the subtended angle is zero. Since rigid
body rotations are less of a concern for straight girders, it is optimal to lift the girder
where the least amount of cross sectional twist can occur. Based on these conclusions, the
following recommendations have been made for prismatic, horizontally curved I girders:
relatively straight girders (small subtended angles) should be lifted closer to a/L = 0.238
and highly curved girders (large subtended angles) should be lifted closer to a/L = 0.211.
0.0
0.5
1.0
1.5
2.0
2.5
3.0
3.5
4.0
4.5
5.0
2.5 3.0 3.5 4.0 4.5 5.0 5.5 6.0 6.5 7.0 7.5
Multiple of Girde
r Self W
eight
Theta [degrees]
a/L = 0.20
a/L = 0.21
a/L = 0.23
a/L = 0.25

57
It should be noted that when lifting closer to a/L = 0.211, the girder experiences
more cross sectional twist. Therefore, deflections should be checked along the length of
the girder to prevent fit up problems at locations other than at the end of the girder.
3.7 CONCLUSIONS
3.7.1 Eigenvalues
Eigenvalue buckling analyses provide an accurate prediction of instability for a
straight girder during lifting. For curved girders, on the other hand, results from an
eigenvalue buckling analysis are less useful. The eigenvalue provides a general indication
of the load to cause instability of a curved girder. However, by the time the load
corresponding to the eigenvalue is reached for a curved girder, very large lateral
deflections and rotations may have already occurred. These large lateral deflections and
rotations, in turn, can result in significant serviceability problems by making it difficult or
impossible to connect the lifted girder to previously erected portions of the bridge. These
large deformations can also lead to yielding of the girder. Thus, the eigenvalue, by itself,
may not be a reliable indicator of the potential for strength or serviceability problems
during lifting of curved I-girders. In general, the value of eigenvalue buckling analysis is
diminished as the girder becomes more curved, i.e., as the radius of curvature is reduced.
3.7.2 Rotation Limits
As an alternative to an eigenvalue buckling analysis, computing the rotations of a
curved girder during lifting can provide an improved approach for assuring safety and
serviceability. Based on a nationwide survey of erectors and engineers, a rotation limit of
1.5 degrees at the end of the girder is recommended. The analyses conducted herein
suggest that this rotation limit will generally be reached well before the eigenvalue is
reached. There are two components that contribute to the total rotation of a girder: the
rigid body rotation and the cross sectional twist. The rigid body rotation is only a
function of geometry of the girder and the lift locations and is independent of girder
stiffness. The cross sectional twist is a function of the girder stiffness. Both are a

58
function of the girder lift location. Consequently, it is recommended that in planning a lift
for a curved steel I-girder that will not result in safety or serviceability problems,
engineers should limit girder rotations to about 1.5 degrees and also check the
eigenvalue. For girders with any significant curvature, the rotation limit is likely to be
the controlling factor. However, for girders with only very slight curvature, the
eigenvalue is likely to provide a useful prediction of instability. UT Lift, a macro enabled
spreadsheet, was developed as a tool to calculate the rigid body rotation and predict the
cross sectional twist using a first order analysis.
3.7.3 Lifting Location Limits
Because both the amount of rigid body rotation and the amount of cross sectional
twist a girder is a function of the lift location, it is important to understand the upper and
lower limits of the lift location to try to keep each one of these effects under the 1.5
degree rotational limit. It is recommended to lift a girder:
• At a location greater than a/L = 0.20: this will prevent excessive girder
distortion due to cross sectional twist.
• At a location less than a/L = 0.25: this will prevent excessive rigid body
rotations.
Adhering to the above guidelines will not ensure that when lifting a prismatic
girder, that the rotations will stay under 1.5 degrees. Yet, the above guidelines are a good
starting point to ensure the most stable lifting conditions for most prismatic girders.
3.7.4 Preferred Lifting Locations
The flange width significantly affects the stiffness of a girder. Therefore, for
girders with bf/D ratios close to 1/3, the girders have a relatively high stiffness and the
cross sectional distortions are less significant. For these girders, it is recommended to lift
them closer to a/L = 0.21 to minimize the rigid body rotations on the system. For girders
with a bf/D ratio closer to 1/6, it is recommended to lift them closer to a/L = 0.24 to help
prevent excessive cross sectional distortion. Lifting very slender girders (where bf/D is
close to 1/6) that have a small radius of curvature can be very problematic due to

59
excessive rigid body rotations and cross sectional distortions. Keeping their total
rotations less than 1.5 degrees may not be possible in some cases and as a result should
be avoided if possible due to serviceability issues during lifting. In girders with bf/D
approaching 1/6, the erector should consider using two cranes with spreader bars to
distribute the support along the length.

60
CHAPTER 4 Parametric Studies on the Behavior of Partially Constructed
Bridges with Curved Steel I-Girders
4.1 INTRODUCTION
The design of curved steel I-girder bridges necessitates considerations for safety
and serviceability of the structure and structural elements at several stages. Important
stages and elements that need to be considered include lifting of individual girder
segments, the partially erected steel superstructure, the concrete deck placement, and
finally the in-service stage. When bridge engineers assess the structural performance of
a bridge system, they typically evaluate the system in its final in-service configuration.
Yet, critical structural safety and serviceability issues often arise during the construction
stages. A bridge structure can be particularly vulnerable to severe problems during
construction because less bracing and continuity is present as compared to the final
constructed bridge. Most often, contractors are responsible for the safety of the bridge
during construction. However, structural design criteria and analysis tools for bridges
during construction are not as well developed compared to that of the final fully
constructed in-service bridge structure. Consequently, contractors often rely heavily on
experience and on rules of thumb (Beckmann and Mertz 2005) to guide their assessment
of structural safety during construction. Curved steel I-girder bridges can be particularly
challenging during construction. The significant influence of torsion on the structural
response of curved girders often makes their analysis more complex than for straight
girders. Various issues related to the safety and serviceability of curved steel I-girder
bridges during construction were investigated as part of TxDOT Research Project 0-5574
(2006), “Curved Plate Girder Design for Safe and Economical Construction.” One of the
issues considered in this project was safety and serviceability of curved steel I-girders
during lifting. These studies were described in the last chapter. An additional issue
considered in TxDOT Project 0-5574 is the safety and serviceability of the steel

61
superstructure in a partially-constructed condition. A number of studies on partially
constructed curved steel I-girder bridges for this project were conducted by Stith (2010).
To support and supplement the work by Stith, a number of parametric finite element
studies were conducted on partially constructed bridges, and are reported in this chapter.
More specifically, the primary objective of the studies reported herein was to examine
how the use and placement of temporary shore towers and holding cranes affect the
structural performance of partially constructed bridges.
4.2 BACKGROUND ON SHORE TOWERS AND HOLDING CRANES
Shore towers or holding cranes are sometimes used to provide temporary support
for one or more girders during construction of a curved steel I-girder bridge. These
temporary supports are left in-place until the partially constructed bridge can safely stand
without these supports. The temporary supports are often needed until a sufficient
number of cross-frames have been connected to the girders and/or until girder splice
connections have been completed. A shore tower is a temporary structure that is placed
at a specific location along the girder to provide support to the girder at the bottom flange
location. A shore tower acts essentially as a temporary bridge pier and can restrain both
vertical and horizontal movement of the girder. Pictures of shore towers are shown in
Figure 4.1.
Figure 4.1: Shore Towers under Partially Constructed Bridges

62
In addition to providing restraint to vertical and horizontal movement of a girder,
the attachment of the girder to the shore tower can be designed to also restrain rotation of
the girder. This can be accomplished by connecting the top flange of the girder to the
shore tower with cables, timbers or other bracing. An example is shown in Figure 4.2.
This figure shows photos of temporary bracing to restrain girder rotation at a permanent
bridge pier. However, the same type of bracing can be used at a shore tower. In the photo
on the left, an iron worker is positioning a timber brace to restrain the girder from
rotating. In the photo on the right, both a timber brace, which can only resist
compression, and a slender steel rod with a turnbuckle brace, which primarily resists
tension, are used to prevent the girder from rotating in either direction.
Figure 4.2: Temporary Top Flange Bracing to Restrain Girder Rotation
Although shore towers are temporary structures, they are significant engineered
structures in their own right. They must be designed to carry large loads at significant
heights. Further, they must be designed to be quickly assembled on site to accommodate
a variety of configurations and heights, and then to be quickly disassembled and moved
to the next location. Shore towers can therefore be costly structures. Further, the time,
labor, and equipment needed to assemble and disassemble a shore tower can impact the
cost and schedule for constructing the bridge. Also, since a significant amount of time
may be needed to assemble and disassemble a shore tower, their use may not be possible

63
if they are located on an existing in-service roadway where there is a lack of space and
extended traffic closures are not permitted. Further, if the bridge crosses a waterway or
other obstacles, the use of a shore tower may be impractical or impossible.
The use of a holding crane is another option for providing temporary support of
girders during construction. Whereas a single shore tower can support several girders at
one time (Figure 4.2), a holding crane typically supports only a single girder. Further,
whereas the bottom flange of a girder normally rests on top of a shore tower, the top
flange of a girder normally hangs from a holding crane. Photos of a holding crane
clamping onto the top flange of a steel I-girder are shown in Figure 4.3. In the photo on
the left, the large crane with the lattice boom and with the spreader bar was used to lift
the girder into place. The holding crane is the smaller crane in the photo on the left. The
holding crane uses a single lifting clamp to apply a specified upward force to support the
girder so that the lifting crane can be released to pick up the adjacent girder. The photo
on the right side of Figure 4.3 is a close up showing the holding crane attached to the top
flange. Holding cranes provide little restraint to the girder from translating in directions
orthogonal to the cable. Therefore, structural analysis should be performed to make sure
that the girder does not translate a significant amount when the lifting crane is released.
Figure 4.3: Holding Crane and its Attachment to the Top Flange of a Girder

64
Unlike shore towers, holding cranes do not typically require as large of a space
around the bridge for extended periods of time. Therefore, they can be useful in
situations where girders cross existing roadways, bodies of water, or other obstacles.
Holding cranes also require less preparation before use and can be used for shorter
periods of time. In addition, because of their mobility, the placement of holding cranes
can be adjusted to meet last minute changes at the jobsite. Holding cranes, of course, also
add cost to a project, both for the cost of the equipment and for the operator. The cost of
a holding crane can escalate quickly if adversities arise and the holding crane is required
for longer than initially estimated.
4.3 STUDY OBJECTIVES AND DESCRIPTION
As part of this research study, several issues related to the use and placement of
shore towers and holding cranes were investigated using finite element analyses. The
analysis methods and results are described below.
An objective of this analysis was to study the effect of shore tower and holding
crane location on the safety and serviceability of the supported girder. An additional
objective was to study the effect of varying the lifting load used for the holding crane. A
final objective was to compare girder behavior and stability when the bottom flange is
supported by a shore tower versus when the top flange is hung from a holding crane.
The analysis conducted in this study used the same ANSYS finite element model
that was described in Chapter 3 for girder lifting simulations. Girders were modeled in
three dimensions using shell elements for the flanges and web. All analyses were elastic,
and considered both linear (first-order) and nonlinear (second-order) geometry. Further
details of the model, along with information of validation of the model from field testing
are described in Stith (2010).
4.3.1 Parameter Descriptions
The parameters investigated in the analyses dealing with shore towers and holding
cranes were the flange width to girder depth ratio (bf/D), the girder span length to girder
depth ratio (L/D), radius of curvature of the girder (R), and the location of the shore

65
tower/holding crane along the length of the girder. Boundary conditions were also varied
when considering the use of a shore tower. Both a small and large stiffness of the bracing
connecting the top flange of the girder to the shore tower was considered. Lastly, the
parameter considered when using a holding crane includes varying the upward load
applied by the holding crane. Cross sectional variables used for this study are depicted in
Figure 4.4.
Figure 4.4: Girder Geometric Parametrics
4.3.2 Parameter Ranges
The flange width to depth ratio recommended in the TxDOT Preferred Practices
for Steel Bridge Design, Fabrication, and Erection is 1/3 (TxDOT 2007). AASHTO on
the other hand allows a bridge design engineer to use a flange width to depth ratio as little
as 1/6 as seen in Equation 6.10.2.2-2 of the AASHTO LRFD Bridge Specification
(AASHTO 2008). In this study, the range of bf/D ratios that were used was 1/3 to 1/6 to
determine the behavior of the girders at the two recommended limits. For all parametric
studies completed, the top and bottom flanges had the same dimensions.
The girder span to depth ratio was changed throughout the study to see if it had an
effect on the optimal location of a shore tower. Additionally, the span to depth ratio was
changed to determine if there was a significant effect on the stresses on the cross section
for either the geometric linear or non-linear analysis. In trying to model realistic
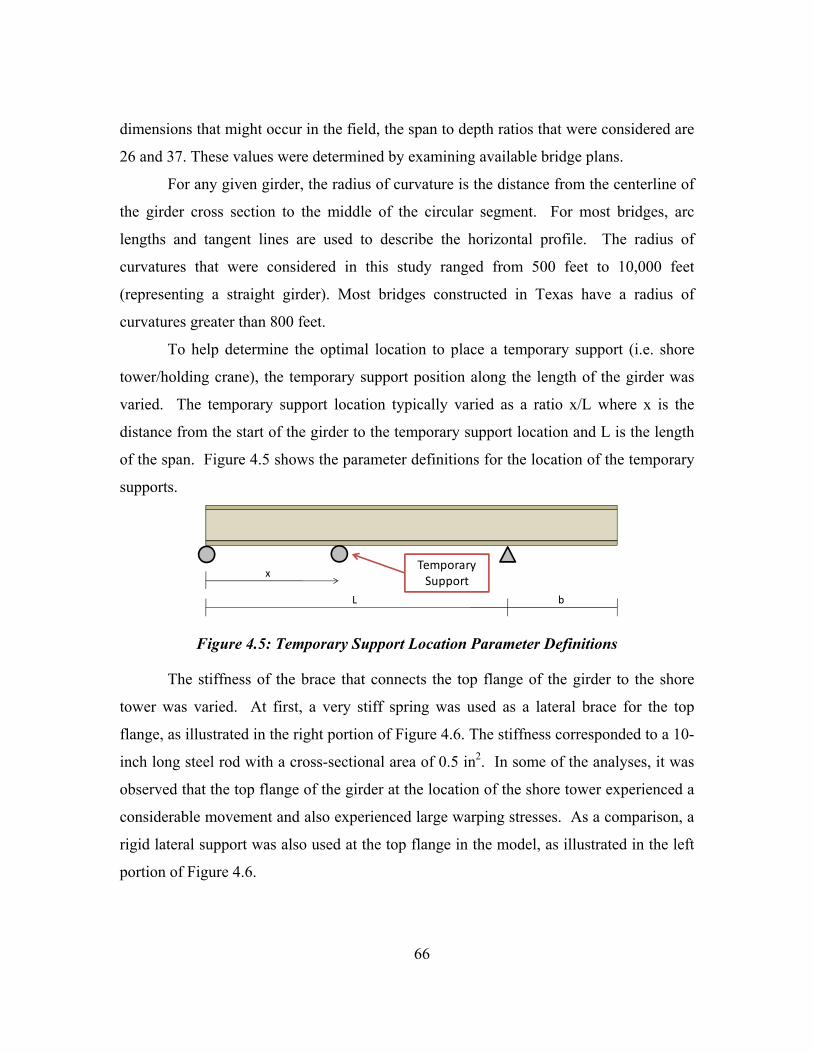
66
dimensions that might occur in the field, the span to depth ratios that were considered are
26 and 37. These values were determined by examining available bridge plans.
For any given girder, the radius of curvature is the distance from the centerline of
the girder cross section to the middle of the circular segment. For most bridges, arc
lengths and tangent lines are used to describe the horizontal profile. The radius of
curvatures that were considered in this study ranged from 500 feet to 10,000 feet
(representing a straight girder). Most bridges constructed in Texas have a radius of
curvatures greater than 800 feet.
To help determine the optimal location to place a temporary support (i.e. shore
tower/holding crane), the temporary support position along the length of the girder was
varied. The temporary support location typically varied as a ratio x/L where x is the
distance from the start of the girder to the temporary support location and L is the length
of the span. Figure 4.5 shows the parameter definitions for the location of the temporary
supports.
Figure 4.5: Temporary Support Location Parameter Definitions
The stiffness of the brace that connects the top flange of the girder to the shore
tower was varied. At first, a very stiff spring was used as a lateral brace for the top
flange, as illustrated in the right portion of Figure 4.6. The stiffness corresponded to a 10-
inch long steel rod with a cross-sectional area of 0.5 in2. In some of the analyses, it was
observed that the top flange of the girder at the location of the shore tower experienced a
considerable movement and also experienced large warping stresses. As a comparison, a
rigid lateral support was also used at the top flange in the model, as illustrated in the left
portion of Figure 4.6.
L b
Temporary Support
x
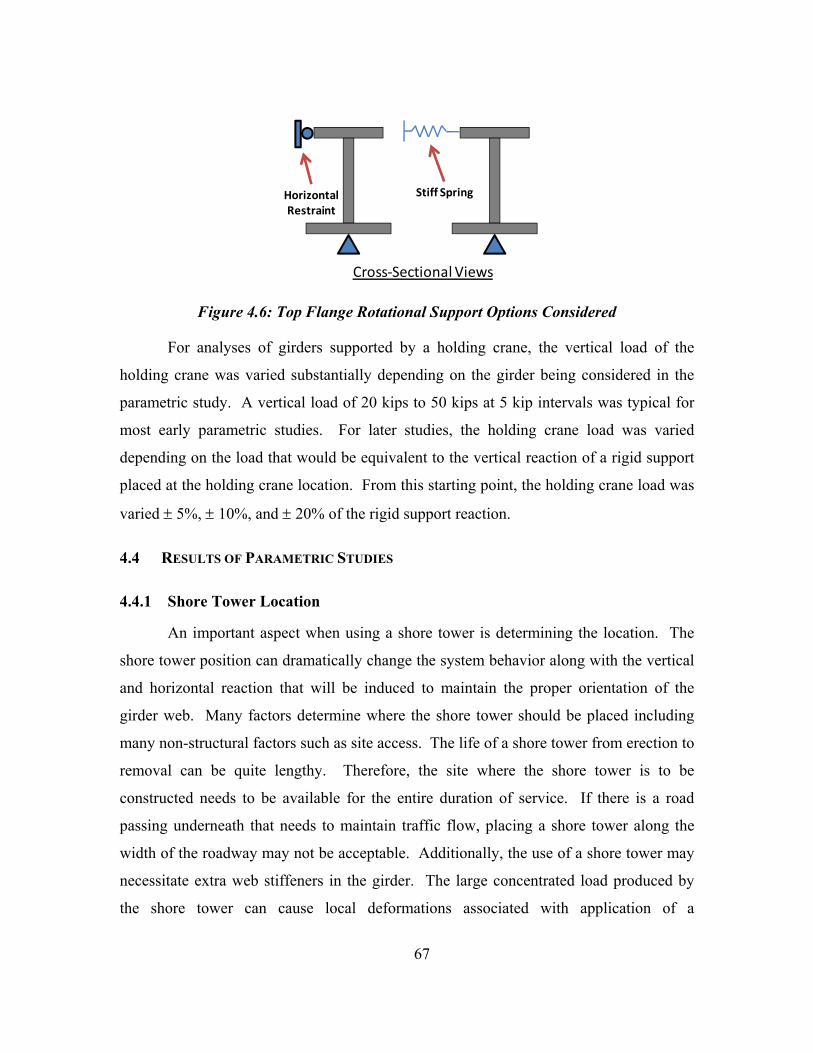
67
Figure 4.6: Top Flange Rotational Support Options Considered
For analyses of girders supported by a holding crane, the vertical load of the
holding crane was varied substantially depending on the girder being considered in the
parametric study. A vertical load of 20 kips to 50 kips at 5 kip intervals was typical for
most early parametric studies. For later studies, the holding crane load was varied
depending on the load that would be equivalent to the vertical reaction of a rigid support
placed at the holding crane location. From this starting point, the holding crane load was
varied ± 5%, ± 10%, and ± 20% of the rigid support reaction.
4.4 RESULTS OF PARAMETRIC STUDIES
4.4.1 Shore Tower Location
An important aspect when using a shore tower is determining the location. The
shore tower position can dramatically change the system behavior along with the vertical
and horizontal reaction that will be induced to maintain the proper orientation of the
girder web. Many factors determine where the shore tower should be placed including
many non-structural factors such as site access. The life of a shore tower from erection to
removal can be quite lengthy. Therefore, the site where the shore tower is to be
constructed needs to be available for the entire duration of service. If there is a road
passing underneath that needs to maintain traffic flow, placing a shore tower along the
width of the roadway may not be acceptable. Additionally, the use of a shore tower may
necessitate extra web stiffeners in the girder. The large concentrated load produced by
the shore tower can cause local deformations associated with application of a
Cross‐Sectional Views
Stiff SpringHorizontal Restraint

68
concentrated force to a girder, including flange local bending, web local yielding or
crippling, and web sideway buckling. Consequently, it is often preferable to place the
shore tower at a location on the girder where a stiffener is already located. Regardless if
a shore tower is placed at a stiffener location or not, it is still necessary to conduct an
analysis to assure local failure modes associated with concentrated forces do not occur.
A series of analyses were conducted to examine the response of different girders to
different shore tower locations. In these analyses, the shore tower was assumed to
permit no vertical deflection of the girder at the location of the shore tower. Based on
analysis results, it is recommended that the shore tower be placed close to the location
of maximum positive moment for any given span between two permanent supports.
This location will approximately minimize the total deflections that are observed for a
given span and will be close to the location that requires the shore tower to hold the
minimum amount of load. In bridge erection, it is common for a contractor to lift a
section of girder that creates a simply supported beam with a cantilever off on one of
the sides as illustrated in Figure 4.7. For this case, the location of the maximum
positive moment can be obtained from
Eq. 4.1 where L is the length of the simple span, b is the length of the cantilever,
and XM,Max is the distance from the beginning of the simple span to the location of
maximum positive moment. It should be noted that this equation, which can be derived
from simple structural analysis, is only valid for uniform loading and was derived for a
straight girder. The results from the equation are considered reasonable for curved
girders with a radius of curvature larger than 300 feet.
2 1
Eq. 4.1

69
Figure 4.7: Location of Maximum Positive Moment; Simple Span with Cantilever
In Figure 4.8, a sample girder is shown with a span of 185 ft. and a cantilever on
one side of 51 ft. The temporary support was varied ±10 ft. and ±20 ft. on either side of
the location of maximum positive moment. The figure shows a plot of the girder reaction
at the shore tower versus the normalized shore tower location (x/L). It can be seen that
for this case, the lowest required vertical reaction for the shore tower coincides with the
location of the maximum positive moment. Additionally, it can be seen that the shore
tower reaction gradually increases as the shore tower position varies from the location of
maximum positive moment.
L b
Temporary Support
MMAX
x

70
Figure 4.8: Vertical Reactions for Various Locations along a Girder [L =185’ , b = 51’]
In Figure 4.9, the out of plane displacements along the length of the sample girder
shown in Figure 4.8 above are plotted for different shore tower positions. These
displacements are based on first-order analyses. Although placing the shore tower at the
maximum positive moment location in the simple span portion of the girder (xM,Max = 86
ft.) will generally minimize the girder’s displacements and necessary shore tower
reaction, it may not always be the optimal position. Placing the shore tower at the
maximum positive moment location in the simple span is a good starting point, but
further analysis can determine whether or not there is a better place to put the shore tower
depending on the individual girder stiffness and geometric properties. By placing the
shore tower at 76 feet in the sample girder, the out-of-plane displacements along the
simple span are actually lower at certain points along the girder than placing the shore
tower at 86 feet. Yet, the displacements at the end of the girder are greater for the 76 foot
location. In general, keeping the shore tower location within about ± 5% of the
38
39
40
41
42
43
44
45
0.30 0.35 0.40 0.45 0.50 0.55 0.60
Reaction
(kips)
Support Location [x/L]
⎟⎟⎠
⎞⎜⎜⎝
⎛−= 2
2
12 L
bLxMAXM
x=66'
x=76'
x=86'
x=96'
x=106'

71
maximum positive moment location in the simple span will result in low displacements, a
low vertical shore tower reaction, and reduce the second order effects.
Figure 4.9: Top Flange Out-of-Plane Displacements for Various Shore Tower
Positions
4.4.2 Holding Crane Location
The location of the holding crane affects the upward force that the crane must
resist. Like shore towers, many non-structural criteria such as site access, construction
methodology, and girder properties can affect the erector’s ability to be able to place a
holding crane in the optimal location. Yet, just like a shore tower, it is desirable to place a
holding crane at the point of maximum positive moment between the two permanent
supports. This location results in approximately the smallest value for the required crane
load and will minimize both displacements and stresses on the girder cross section.
Figure 4.10 shows first-order displacements for the same girder that was considered for
the shore tower analysis shown in Figure 4.9 except that a holding crane was placed at
‐2.5
‐2.0
‐1.5
‐1.0
‐0.5
0.0
0.5
1.0
1.5
2.0
2.5
0 50 100 150 200 250
Out of Plane
Displacem
ents (in)
Distance along Girder (ft)
x=66'x=76' xM,Max=86'
x=96' x=106'

72
different locations instead of a shore tower. The holding crane force was set equal to the
vertical reactions obtained from the shore tower analysis. It can be seen that by placing a
holding crane at the location of maximum positive moment (86 ft.) the out-of-plane
displacements are minimized along the length of the girder. Unlike shore towers, placing
a holding crane at the location of maximum positive moment tends to give the lowest
displacements and warping stresses of any location along the girder. Therefore, if
possible it is recommended that holding cranes be placed at this location.
Figure 4.10: Top Flange Out-of-Plane Displacements for Various Holding Crane
Locations
It should be noted that deviations in holding crane location on the order of ± 10%
may be acceptable assuming that the holding crane lifts with the optimal load. This
concept is discussed more in the following section.
‐2.5
‐2.0
‐1.5
‐1.0
‐0.5
0.0
0.5
1.0
1.5
2.0
2.5
0 50 100 150 200 250
Out of Plane
Displacem
ents (in)
Distance along Girder (ft)
xM,Max=86'
x=66'
x=76'
x=96'
x=106'
73
4.4.3 Holding Crane Lifting Load
Most modern cranes have the ability of measuring the magnitude of the lifting
force in the crane. The load that the holding crane applies significantly affects the
behavior of the girder being supported. It is recommended that the holding crane lift with
a load that is equivalent to the reaction of a rigid support placed at the same location.
This load allows the web of the girder to remain vertical and minimizes deformations
helping with fit-up. Using a load in the holding crane that differs from this optimal load
will not keep the girder’s web vertical.
A geometrically linear analysis can be used to determine the reaction that would
occur at a rigid support for a given location along the length of the girder. The difference
in reactions for a first order analysis and second order analysis is small assuming the top
flange of the girder is properly braced to prevent excessive rotations. It is important to
model the horizontal curvature of the bridge when determining the reaction. Studies were
conducted where the reaction at a given support was up to 10% higher if the curvature of
the bridge was considered when compared to that of a straight bridge with the same
properties. Accurately computing the reaction for a rigid support is crucial because small
deviations from the optimal lifting load can result in large differences in out of plane
deflections. Figure 4.11 shows three out of plane displacement plots of the same girder
with different holding crane forces and a bf/D ratio of about 1/3.5. By changing the
holding crane force by only ± 5%, the maximum vertical displacements can increase by
over an inch. For this particular case, the optimal load is 47.8 kips. In the field, the
erector will often use the crane to lift up or lower the girder segment to assist in making
the connection; however the optimum load provides a good starting point to expedite the
erection.

74
Figure 4.11: Out of Plane Deflections for Varying Crane Loads
As long as the optimal load is determined correctly and is used as the holding
crane force, then the location of the holding crane becomes less important, although it is
still desirable to place the holding crane close to the location of maximum positive
moment. For the girder shown in Figure 4.12, the optimal place to put a holding crane is
at 86 feet. As stated above, it is desirable to place the holding crane close to this location.
If the holding crane were placed at 80 feet, the optimal lifting load is 36.5 kips. The bf/D
ratio for the girder in Figure 4.12 is 1/6. This ratio was used to evaluate the girder
slenderness at the AASHTO limit. Figure 4.13 shows the lateral displacements for the
girder if it were held at 80 feet which is very close to the optimal holding crane location
and with a force of 36.5 kips which is exactly what the optimal holding crane load is for
the 80 foot location. This is the ideal case and shows the minimal girder deflections when
using a holding crane for this specific case. Figure 4.14 shows the out of plane
displacements down the length of the girder when close to the optimal lifting location but
not using the optimal lifting load for the 80 foot location. It can be seen that even though
‐1.5
‐1.0
‐0.5
0.0
0.5
1.0
1.5
0 50 100 150 200 250
Out of Plane
Displacem
ents (in)
Distance along Girder (ft)
F = 45 kips
F = 47.8 kips
F = 50 kips

75
the holding crane is close to the optimal lifting location, with a lifting load just 3.5 kips
higher than the desired load, the displacements are much larger than in Figure 4.13.
Figure 4.15 shows the displacements along the girder when using the optimal lifting load
but for a lifting location of 100 feet which is relatively far away from the optimal lifting
location. Even though the lifting location is relatively far away from the optimal lifting
location, the displacements along the length of the girder are not as severe as seen in
Figure 4.14. Therefore, it can be concluded that the holding crane location can be varied
more from the optimal value than the holding crane load. Maintaining the correct holding
crane load is more critical for minimizing girder deformations.
Figure 4.12: Geometry Used for Figure 5.18, Figure 5.19, and Figure 5.20
Figure 4.13: Optimal Load (36.5 kips) and Optimal Location (80 feet)
L = 185’ b = 51’
x = varies F = varies bf = 14”
D = 84”
‐2.0
‐1.5
‐1.0
‐0.5
0.0
0.5
1.0
1.5
2.0
0 50 100 150 200 250
Out of Plane
Displacem
ent (in)
Distance along Girder (ft)
Bottom Flange
Top Flange

76
Figure 4.14: Non-Optimal Load (40 kips) and Optimal Location (80 feet)
Figure 4.15: Optimal Load (37.6 kips) and Non-Optimal Location (100 feet)
‐2.0
‐1.5
‐1.0
‐0.5
0.0
0.5
1.0
1.5
2.0
0 50 100 150 200 250
Out of Plane
Displacem
ent (in)
Distance along Girder (ft)
Bottom Flange
Top Flange
‐2.0
‐1.5
‐1.0
‐0.5
0.0
0.5
1.0
1.5
2.0
0 50 100 150 200 250
Out of Plane
Displacem
ent (in)
Distance along Girder (ft)
Bottom Flange
Top Flange

77
4.5 LOAD HEIGHT EFFECTS
4.5.1 Shore Towers
Shore towers support a girder on the bottom flange. This is below the girder's
center of gravity. Therefore, if the girder is not vertical and is not braced against rotation,
the self weight will cause a disturbing moment that will tend to destabilize the girder.
Figure 4.16 shows the disturbing moment that is created by the girder self weight when
the girder is supported from below. Note that the effect of the self weight shown in
Figure 4.16 depends on how the bottom flange is supported. If the bottom flange is
supported at a single point in the middle of the flange (directly below the web), or is
supported by a bearing with high rotational flexibility, then the girder will rotate about
the middle of the flange as demonstrated by the left diagram in Figure 4.16. For this case,
the self weight will generate a destabilizing moment for any initial rotation of the girder.
However, if the bottom flange of the girder is supported over its full width by a stiff
support as demonstrated by the center and right diagrams in Figure 4.16, then the girder
will rotate about the edge of the bearing pad. For this case, the self weight will generate a
restoring moment as seen in the center diagram until the girder has a sufficient rotation so
that the center of gravity is located outside of the bearing pad as shown by the right
diagram in Figure 4.16. For the analyses conducted herein, it was assumed that the girder
will tip about mid-width of the flange, as this represent the worst case for stability.
Figure 4.16: Disturbing Force Caused by a Lack of Bracing on the Top Flange
Pin Support(No Tipping Restraint)
Bearing Pad(Tipping Restraint)
Bearing Pad(Tipping Restraint)
Disturbing Moment Disturbing MomentRestoring Moment

78
Because the disturbing force is only present after the girder has rotated due to its
own self weight, it can only be detected by a second-order analysis that includes
geometric, non-linear effects. A number of analyses were conducted using both first-
order and second order analysis. When comparing results, the bending stresses were
generally very similar for first- and second-order analyses. However, the warping stresses
and out-of-plane displacements were typically significantly different. This effect can be
seen in Figure 4.17 where the lateral displacements are graphed down the length of the
girder for both the first-order and second-order analyses.
Figure 4.17: Linear and Non-Linear Displacements along a Girder for a Girder
with a Disturbing Force
The large lateral deflections predicted by the nonlinear analysis emphasize the
destabilizing effect of the girder self weight when the girder is supported at the bottom
flange. As noted above, this analysis assumed the most severe condition in which the
girder is supported at the middle of the flange by a pin support that offers no tipping
restraint. Tipping restraint, if present, reduces the second-order lateral displacements.
‐4.0
‐2.0
0.0
2.0
4.0
6.0
8.0
0 50 100 150 200 250
Out of Plane
Displacem
ents (in)
Distance along Girder (ft)
Top Flange, Non‐Linear
Top Flange, Linear
Bottom Flange, Non‐Linear
Bottom Flange, Linear
L = 185’ b = 51’
x = 80’ F = 35 kips

79
These lateral displacements can also be minimized, of course, by bracing the girder
against rotation at the location of the shore tower. Taking advantage of tipping restraint
requires a detailed second-order analysis that accurately models the bottom flange
support conditions. Providing bracing for the girder at the shore tower precludes the need
for such an analysis and therefore may be the more straightforward and certain approach
for assuring girder stability.
4.5.2 Holding Cranes
Holding cranes generally support a girder on the top flange and the girder
essentially hangs from the support. The support is therefore above the girder’s center of
gravity. Unlike shore towers, holding cranes do not have the ability to brace the system
in the translational directions orthogonal to the lifting load or in any of the rotational
directions. As the girder begins to rotate, the holding crane force creates a restoring
moment that opposes the rotation, as illustrated in Figure 4.18.
Figure 4.18: Restoring Force Caused by Lack of Bracing
Because the restoring force is only present after the girder has rotated, a second-
order analysis is needed to account for this effect. As was the case with the shore tower,
comparing first- and second-order analyses of girders supported by a holding crane
showed little difference in the predicted bending stresses. However, there were large
differences in the warping stresses and out-of-plane displacements predicted by the first-
order versus second-order analyses. This effect is demonstrated in Figure 4.19 where the
Properly Braced No Lateral Bracing
Restoring Moment
Lifting Crane Force

80
out-of-plane displacements are plotted along the length of a girder for both a linear (first-
order) and non-linear (second-order) analysis. Note that the out-of-plane displacements
for the second-order analysis are smaller than for the first-order analysis. This
demonstrates the stabilizing effect of supporting the girder from above.
Figure 4.19: Displacements along a Girder Supported by a Holding Crane based on
Linear versus Nonlinear Geometry Analysis
As noted above, the restoring and disturbing effects that are generated as a result
of the girder support conditions can only be calculated using a second-order, geometric
non-linear analysis. Therefore the linear analysis done on both the top flange and bottom
flange loadings should be the same for both the shore tower and holding crane because
both were loaded with a 35 kip load. In Figure 4.20 and Figure 4.21, the out-of-plane
displacement results shown for the shore tower and holding crane analyses are amplified.
It is clear from these plots that the first-order displacements are identical for the two
cases. It is also again clear that the second-order displacements are smaller than the first-
order displacements for the holding crane, in sharp contrast to the shore tower.
‐4.0
‐2.0
0.0
2.0
4.0
6.0
8.0
0 50 100 150 200 250
Out of Plane
Displacem
ents (in)
Distance Along Girder (ft)
Bottom Flange, Non‐LinearTop Flange, Linear
Bottom Flange, LinearTop Flange, Non‐Linear
L = 185’ b = 51’
x = 80’F = 35 kips

81
Supporting a girder by a holding crane therefore provides an intrinsic advantage over a
shore tower in regard to girder stability.
Figure 4.20: Displacements along a Girder Supported by a Shore Tower based on
Linear versus Nonlinear Geometry Analysis - Amplified Displacement Scale
‐0.8
‐0.6
‐0.4
‐0.2
0.0
0.2
0.4
0.6
0.8
1.0
1.2
0 50 100 150 200 250
Out of Plane
Displacem
ents (in)
Distance along Girder (ft)
Top Flange, Linear
Bottom Flange, Linear
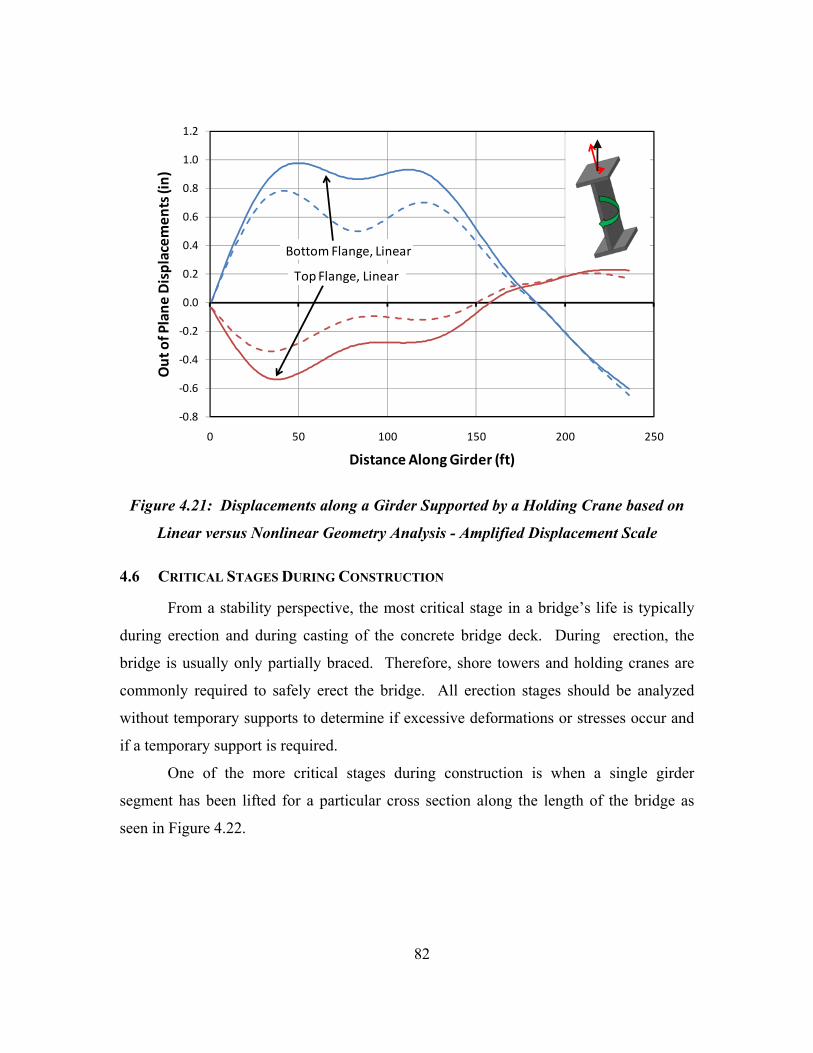
82
Figure 4.21: Displacements along a Girder Supported by a Holding Crane based on
Linear versus Nonlinear Geometry Analysis - Amplified Displacement Scale
4.6 CRITICAL STAGES DURING CONSTRUCTION
From a stability perspective, the most critical stage in a bridge’s life is typically
during erection and during casting of the concrete bridge deck. During erection, the
bridge is usually only partially braced. Therefore, shore towers and holding cranes are
commonly required to safely erect the bridge. All erection stages should be analyzed
without temporary supports to determine if excessive deformations or stresses occur and
if a temporary support is required.
One of the more critical stages during construction is when a single girder
segment has been lifted for a particular cross section along the length of the bridge as
seen in Figure 4.22.
‐0.8
‐0.6
‐0.4
‐0.2
0.0
0.2
0.4
0.6
0.8
1.0
1.2
0 50 100 150 200 250
Out of Plane
Displacem
ents (in)
Distance Along Girder (ft)
Top Flange, Linear
Bottom Flange, Linear
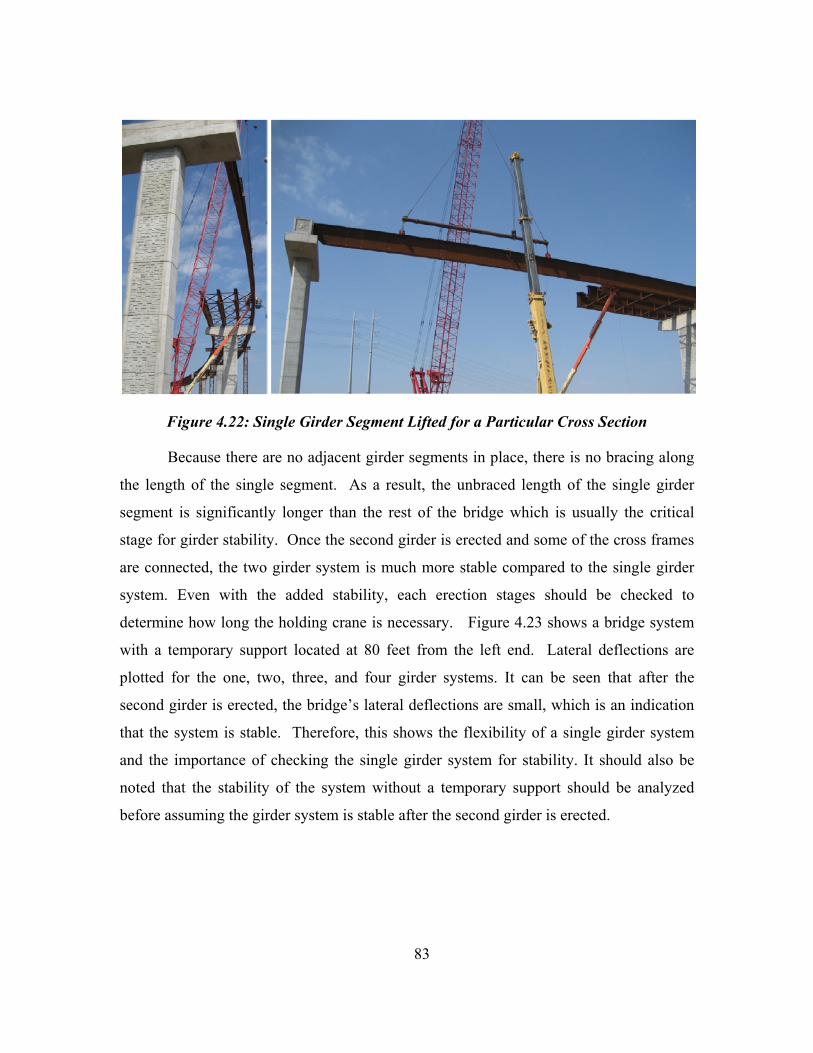
83
Figure 4.22: Single Girder Segment Lifted for a Particular Cross Section
Because there are no adjacent girder segments in place, there is no bracing along
the length of the single segment. As a result, the unbraced length of the single girder
segment is significantly longer than the rest of the bridge which is usually the critical
stage for girder stability. Once the second girder is erected and some of the cross frames
are connected, the two girder system is much more stable compared to the single girder
system. Even with the added stability, each erection stages should be checked to
determine how long the holding crane is necessary. Figure 4.23 shows a bridge system
with a temporary support located at 80 feet from the left end. Lateral deflections are
plotted for the one, two, three, and four girder systems. It can be seen that after the
second girder is erected, the bridge’s lateral deflections are small, which is an indication
that the system is stable. Therefore, this shows the flexibility of a single girder system
and the importance of checking the single girder system for stability. It should also be
noted that the stability of the system without a temporary support should be analyzed
before assuming the girder system is stable after the second girder is erected.

84
Figure 4.23: One, Two, Three, and Four Girder Erected Systems – Temporary Support
at 80’
Another critical stage during construction occurs during the first concrete
placement stage on a span. When the concrete is initially poured on a span, the concrete
is essentially a fluid that acts as a large dead load on the system and provides no restraint.
Once the concrete begins to cure, the top flange of the girder gains significant lateral and
torsional bracing. In some irregular systems, the concrete pour can be subdivided and
spaced out over multiple days so that the bracing effect of the concrete can be used to
assist in stabilizing the girder system. However, care should be taken in these cases to
consider the impact of the partially composite stiffness on the girder deflections to ensure
‐0.10
‐0.05
0.00
0.05
0.10
0.15
0.20
0 50 100 150 200 250
Out of Plane
Displacem
ents (in)
Length along Bridge (ft)
L = 185’ B = 50’
x = 80’
1 Girder
3 Girders
4 Girders
2 Girders

85
good ride quality in the finished bridge. The program UT Bridge has the ability to model
the contributions of early age concrete.
4.7 CONCLUSIONS
The stability of partially erected bridges can be difficult to assess because of the
limited presence of bracing and uncertainty in support conditions. Because of the lack of
appropriate analytical tools, erection engineers often rely heavily on experience and on
rules-of-thumb when developing an erection plan for a bridge. Guidelines and tools based
on research are needed to help both contractors and design engineers better understand
the behavior of curved I-girder bridges in the partially constructed state.
Common practices that are used for additional support and bracing during the
partially constructed state include temporary shore towers and holding cranes. Although
shore towers are desirable because they prevent translation of the girder in two directions,
it is important to make sure that the top flange of the girder is properly braced to prevent
undesirable twist of the cross sections. Additionally, shore towers can be difficult to use
because they require their own engineering to ensure that they can withstand the load of
the bridge and require adequate space below the bridge to be placed on. In areas of heavy
traffic, care must be taken to protect the shore tower from potential vehicle impact that
could jeopardize the safety of the partially erected bridge. In many cases, holding cranes
can sometimes be more desirable due to their ability to be used only when needed and the
ability to minimize time over obstacles such as busy roads or water.
This chapter described a series of parametric finite element studies on issues
related to the use of shore towers and holding cranes. Many geometric parameters were
varied as well as the stiffness of the top flange bracing used for the shore towers and the
load parameters used for the holding cranes. Based on analyses of both the shore towers
and the holding cranes, it suggested that they are placed close to the position of maximum
positive moment. When using a 3-D finite element analysis software package, this
position can often occur at the location of the highest stresses. Placing a shore tower at
the position of highest moment allows the shore tower to be designed for close to the
minimum amount of load and will minimize the girder bending/warping stresses as well

86
as the girder displacements. When using a holding crane, it is recommended to lift with a
value equal to the reaction of a rigid vertical support at the same position. This will keep
the web of the cross section vertical and will minimize the second order effects that occur
due to twisting of the cross section. It is important to keep the load in a holding crane
very close to the reaction of a rigid support placed at the same position because a small
deviation from this load can significantly increase both the warping/bending stresses as
well as increase the deflections of the girder. As long as the proper lifting load is used
for a given location of the holding crane, the location of the holding crane can vary
somewhat from the location of maximum moment without causing large changes in the
bending/warping stresses and the displacements.
Due to load height effects associated with shore towers and holding cranes, it is
important to consider second-order effects when conducting an analysis. Because shore
towers are supported on the bottom flange, as the girder cross section rotates, the girder
self weight can cause a disturbing moment that will tend to destabilize the girder at the
support location. This can be prevented if the top flange of the girder is properly braced
against rotation at the location of the shore tower. Holding cranes, on the contrary,
typically support the girder from above at the top flange. As a result, as the girder cross
section rotates, the girder self weight causes a restoring moment that tends to stabilize the
girder at the location of the holding crane support. With a holding crane, the predicted
displacements will typically be smaller than for the case with a second-order analysis.
Some of the most critical stages of construction occur when a single girder section
is lifted or during the first concrete placement on a given span. Both of these stages are
critical due to the minimal amount of bracing. Therefore, it is typically desirable to use a
shore tower or holding crane on partially erected girders to temporarily brace the system
until additional bracing can be provided to the system. In general though, it is good
practice to check stability of a system anytime support conditions or bracing is changed
or large additional loads are applied to the system.

87
CHAPTER 5 Conclusions and Recommendations
5.1 INTRODUCTION
The research reported in this thesis was conducted as part of TxDOT Research
Project 0-5574 on Curved Plate Girder Design for Safe and Economical Construction.
This project focused on a number of issues involved in assessing the safety and
serviceability of curved steel I-girder bridges during construction. More specifically, this
project considered structural safety and serviceability during three critical stages of
construction: girder lifting, erection sequencing, and concrete deck placement.
The overall scope of research in TxDOT Project 0-5574 included:
• Two field monitoring studies.
• Parametric studies focused on developing a simple methodology to
predict the buckling capacity of prismatic and non prismatic girders
during lifting. These studies included eigenvalue buckling analyses as
well as nonlinear geometric analyses.
• Parametric studies focused on developing lifting location guidelines for
prismatic girders to prevent excessive displacements and rotations during
lifting.
• A nationwide survey of erectors and contractors to establish industry
standards and preferred practices.
• Parametric studies focused on determining when temporary supports are
necessary during erection sequencing.
• Development of two analysis tools: UT Lift and UT Bridge.
This thesis focused on the parametric study on girder lifting using nonlinear
geometric analyses as well as the parametric study looking at the stability of partially
constructed bridges and the necessity and behavior of temporary support systems. In
addition to the parametric studies, this thesis also provided the reader with a literature

88
review of work done in recent years as well as a comprehensive summary of work
previously done on this curved girder project. The following sections provide a summary
of the key conclusions from both of the parametric studies
5.2 NON-LINEAR ANALYSIS OF LIFTING OF CURVED STEEL I-GIRDERS
• Eigenvalue buckling analyses can provide an accurate prediction of
instability for a straight girder during lifting. For curved girders, on the
other hand, eigenvalue buckling analysis is less useful. The eigenvalue
provides a general indication of the load to cause instability of a curved
girder. However, by the time the load corresponding to the eigenvalue is
reached for a curved girder, very large lateral deflections and rotations
may have already occurred. The eigenvalue, by itself, may not be a
reliable indicator of the potential for strength or serviceability problems
during lifting of curved I-girders.
• As an alternative to eigenvalue buckling analyses, computing the rotations
of a curved girder during lifting can provide an improved approach for
assuring safety and serviceability. Based on a nationwide survey of bridge
erectors, a rotation limit of 1.5 degrees at the end of the girder is suggested
to avoid problems with connecting the lifted girder to previously erected
portions of the bridge. The analyses conducted herein suggest that this
limit will generally be reached before the eigenvalue is reached for curved
girders.
• It is recommended that in planning a lift of a curved girder that will not
result in safety or serviceability problems, engineers should limit girder
rotations to approximately 1.5 degrees and also check the eigenvalue. For
girders with any significant curvature, the rotation limit is likely to
control. However, for girders with only slight curvature, the eigenvalue is
likely to provide a useful prediction of instability.
• For curved girders with a flange width to depth ratio (bf/d) close to the
current AASHTO limit of 1/6, it may not be possible to lift these girders in
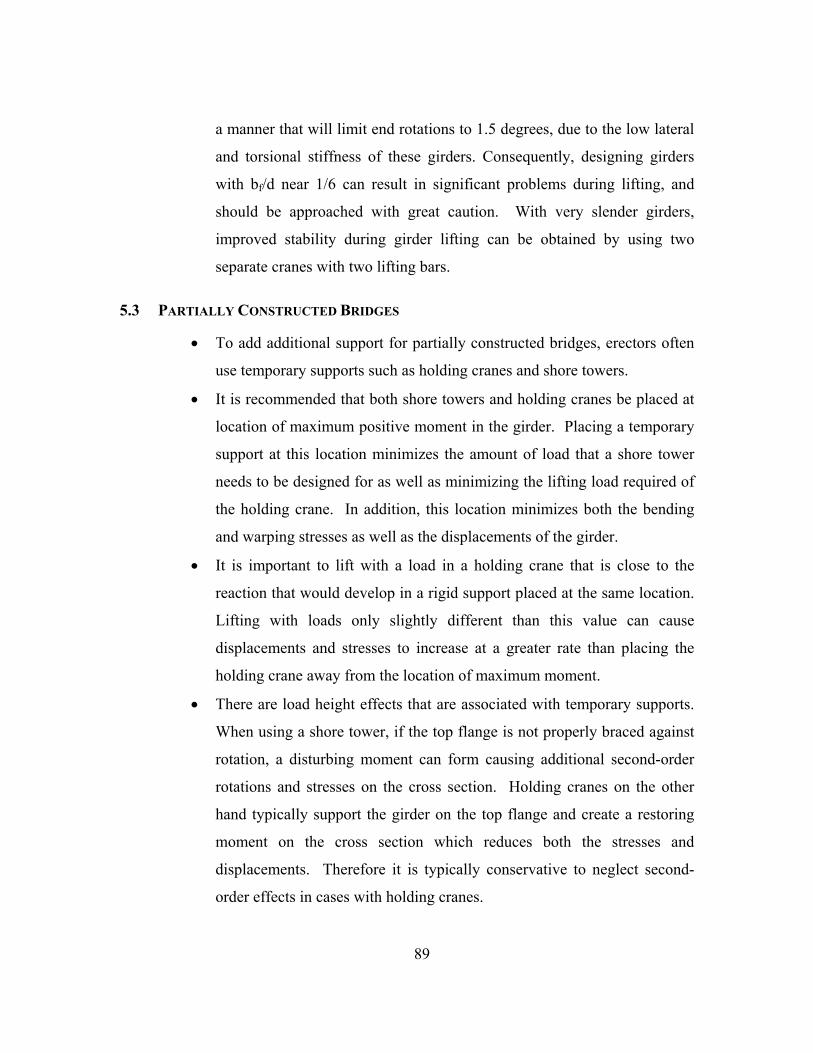
89
a manner that will limit end rotations to 1.5 degrees, due to the low lateral
and torsional stiffness of these girders. Consequently, designing girders
with bf/d near 1/6 can result in significant problems during lifting, and
should be approached with great caution. With very slender girders,
improved stability during girder lifting can be obtained by using two
separate cranes with two lifting bars.
5.3 PARTIALLY CONSTRUCTED BRIDGES
• To add additional support for partially constructed bridges, erectors often
use temporary supports such as holding cranes and shore towers.
• It is recommended that both shore towers and holding cranes be placed at
location of maximum positive moment in the girder. Placing a temporary
support at this location minimizes the amount of load that a shore tower
needs to be designed for as well as minimizing the lifting load required of
the holding crane. In addition, this location minimizes both the bending
and warping stresses as well as the displacements of the girder.
• It is important to lift with a load in a holding crane that is close to the
reaction that would develop in a rigid support placed at the same location.
Lifting with loads only slightly different than this value can cause
displacements and stresses to increase at a greater rate than placing the
holding crane away from the location of maximum moment.
• There are load height effects that are associated with temporary supports.
When using a shore tower, if the top flange is not properly braced against
rotation, a disturbing moment can form causing additional second-order
rotations and stresses on the cross section. Holding cranes on the other
hand typically support the girder on the top flange and create a restoring
moment on the cross section which reduces both the stresses and
displacements. Therefore it is typically conservative to neglect second-
order effects in cases with holding cranes.

90
• Without considering a second-order analysis, the computed displacements
and stresses will be similar for both shore towers and holding cranes.

91
APPENDIX A Parametric Study Summary for the Lifting of Curved Steel
I-Girders
As described in Chapter 3, an extensive parametric study was conducted to study
the non-linear behavior of horizontally curved steel I-girders during lifting. In this study,
two support points were utilized to represent a girder being lifted with two cranes or with
one crane and a spreader bar. In order to complete the study, many finite element models
were created in ANSYS 11.0 (2007) and a non-linear geometric analysis was conducted
to determine displacements, stresses, and rotations. This appendix supplements Chapter
3 and provides a summary of the various analysis results to support the observations and
conclusions in Chapter 3. The parameters in bold under the Parameters and Range
section in each study signify that the range has been changed in comparison to the
previous study.
A.1 PARAMETRIC STUDY SUMMARY
The following summary and results are organized in order in which they were
completed. It should be noted that each study has some similar characteristics, which are
described in the study summaries below. The parameters that were varied and kept
constant are also noted.

92
Figure A.1: Parameter Definitions
A.1.1 Study One
• Prismatic Girder: bf/D = 0.15 – 0.33 : a/L = 0.15 – 0.34 : R = 500’ – 8000’
A.1.1.1 Summary
For the first study, the slenderness ratio (bf/D), lifting location (a/L), and the
radius of curvature (R) are varied. The out of plane displacements for the top of the
girder are monitored at the end of the girder and at mid-span. The eigenvalues are also
recorded.
A.1.1.2 Parameters and Range
• Varied:
o bf/D = 0.15 (~1/6) : 1/4 : 1/3
tf = 0.5” : 0.75” : 1”
o a/L = 0.15 : 0.21 : 0.34
o R = 500’ : 1000’ : 8000’ (~straight)
• Constant:
o L = 125’
D
bf
L
R
tf
z
L
a a
Lifting Point
Lifting Point
tw

93
o D = 60”
o tw = 0.5

94
A.1.1.3 Results
Figure A.2: bf/D = 1/3 : a/L = 0.15:
R = Varies
Figure A.3: bf/D = 1/3 : a/L = 0.21:
R = Varies
‐40
‐30
‐20
‐10
0
10
20
30
40
0 2 4 6 8 10
Out of P
lane
Displacem
ent (in)
Load (Multiples of Self Weight)
bf/D = 1/3 : a/L = 0.15 : R = Str.
End of Girder
Mid Span
Eigenvalue
‐40
‐30
‐20
‐10
0
10
20
30
40
0 2 4 6 8 10
Out of P
lane
Displacem
ent (in)
Load (Multiples of Self Weight)
bf/D = 1/3 : a/L = 0.15 : R = 1000'
‐40
‐30
‐20
‐10
0
10
20
30
40
0 2 4 6 8 10
Out of P
lane
Displacem
ent (in)
Load (Multiples of Self Weight)
bf/D = 1/3 : a/L = 0.15 : R = 500'
‐40
‐30
‐20
‐10
0
10
20
30
40
0 5 10 15 20 25 30 35
Out of P
lane
Displacem
ent (in)
Load (Multiples of Self Weight)
bf/D = 1/3 : a/L = 0.21 : R = Str.
End of Girder
Mid Span
Eigenvalue
‐40
‐30
‐20
‐10
0
10
20
30
40
0 5 10 15 20 25 30 35
Out of P
lane
Displacem
ent (in)
Load (Multiples of Self Weight)
bf/D = 1/3 : a/L = 0.21 : R = 1000'
‐40
‐30
‐20
‐10
0
10
20
30
40
0 5 10 15 20 25 30 35
Out of P
lane
Displacem
ent (in)
Load (Multiples of Self Weight)
bf/D = 1/3 : a/L = 0.21 : R = 500'

95
Figure A.4: bf/D = 1/3 : a/L = 0.34:
R = Varies
Figure A.5: bf/D = 1/4 : a/L = 0.15:
R = Varies
‐40
‐30
‐20
‐10
0
10
20
30
40
0 3 6 9 12 15
Out of P
lane
Displacem
ent (in)
Load (Multiples of Self Weight)
bf/D = 1/3 : a/L = 0.34 : R = Str.
End of Girder
Mid Span
Eigenvalue
‐40
‐30
‐20
‐10
0
10
20
30
40
0 3 6 9 12 15
Out of P
lane
Displacem
ent (in)
Load (Multiples of Self Weight)
bf/D = 1/3 : a/L = 0.34 : R = 1000'
‐40
‐30
‐20
‐10
0
10
20
30
40
0 3 6 9 12 15
Out of P
lane
Displacem
ent (in)
Load (Multiples of Self Weight)
bf/D = 1/3 : a/L = 0.34 : R = 500'
‐25
‐20
‐15
‐10
‐5
0
5
10
15
20
25
0 0.5 1 1.5 2 2.5 3
Out of P
lane
Displacem
ent (in)
Load (Multiples of Self Weight)
bf/D = 1/4 : a/L = 0.15 : R = Str.
End of Girder
Mid Span
Eigenvalue
‐25
‐20
‐15
‐10
‐5
0
5
10
15
20
25
0 0.5 1 1.5 2 2.5 3
Out of P
lane
Displacem
ent (in)
Load (Multiples of Self Weight)
bf/D = 1/4 : a/L = 0.15 : R = 1000'
‐25
‐20
‐15
‐10
‐5
0
5
10
15
20
25
0 0.5 1 1.5 2 2.5 3
Out of P
lane
Displacem
ent (in)
Load (Multiples of Self Weight)
bf/D = 1/4 : a/L = 0.15 : R = 500'

96
Figure A.6: bf/D = 1/4 : a/L = 0.21:
R = Varies
Figure A.7: bf/D = 1/4 : a/L = 0.34:
R = Varies
‐25
‐20
‐15
‐10
‐5
0
5
10
15
20
25
0 2 4 6 8 10 12 14
Out of P
lane
Displacem
ent (in)
Load (Multiples of Self Weight)
bf/D = 1/4 : a/L = 0.21 : R = Str.
End of Girder
Mid Span
Eigenvalue
‐25
‐20
‐15
‐10
‐5
0
5
10
15
20
25
0 2 4 6 8 10 12 14
Out of P
lane
Displacem
ent (in)
Load (Multiples of Self Weight)
bf/D = 1/4 : a/L = 0.21 : R = 1000'
‐25
‐20
‐15
‐10
‐5
0
5
10
15
20
25
0 2 4 6 8 10 12 14
Out of P
lane
Displacem
ent (in)
Load (Multiples of Self Weight)
bf/D = 1/4 : a/L = 0.21 : R = 500'
‐25
‐20
‐15
‐10
‐5
0
5
10
15
20
25
0 1 2 3 4 5 6 7
Out of P
lane
Displacem
ent (in)
Load (Multiples of Self Weight)
bf/D = 1/4 : a/L = 0.34 : R = Str.
End of Girder
Mid Span
Eigenvalue
‐25
‐20
‐15
‐10
‐5
0
5
10
15
20
25
0 1 2 3 4 5 6 7
Out of P
lane
Displacem
ent (in)
Load (Multiples of Self Weight)
bf/D = 1/4 : a/L = 0.34 : R = 1000'
‐25
‐20
‐15
‐10
‐5
0
5
10
15
20
25
0 1 2 3 4 5 6 7
Out of P
lane
Displacem
ent (in)
Load (Multiples of Self Weight)
bf/D = 1/4 : a/L = 0.34 : R = 500'

97
Figure A.8: bf/D = 1/6.667 : a/L = 0.15:
R = Varies
Figure A.9: bf/D = 1/6.667 : a/L = 0.21:
R = Varies
‐40
‐30
‐20
‐10
0
10
20
30
40
0 0.2 0.4 0.6 0.8 1 1.2 1.4
Out of P
lane
Displacem
ent (in)
Load (Multiples of Self Weight)
bf/D = 1/6.667 : a/L = 0.15 : R = Str.
End of Girder
Mid Span
Eigenvalue
‐40
‐30
‐20
‐10
0
10
20
30
40
0 0.2 0.4 0.6 0.8 1 1.2 1.4
Out of P
lane
Displacem
ent (in)
Load (Multiples of Self Weight)
bf/D = 1/6.667 : a/L = 0.15 : R = 1000'
‐40
‐30
‐20
‐10
0
10
20
30
40
0 0.2 0.4 0.6 0.8 1 1.2 1.4
Out of P
lane
Displacem
ent (in)
Load (Multiples of Self Weight)
bf/D = 1/6.667 : a/L = 0.15 : R = 500'
‐40
‐30
‐20
‐10
0
10
20
30
40
0 0.5 1 1.5 2 2.5 3 3.5 4
Out of P
lane
Displacem
ent (in)
Load (Multiples of Self Weight)
bf/D = 1/6.667 : a/L = 0.21 : R = Str.
End of Girder
Mid Span
Eigenvalue
‐40
‐30
‐20
‐10
0
10
20
30
40
0 0.5 1 1.5 2 2.5 3 3.5 4
Out of P
lane
Displacem
ent (in)
Load (Multiples of Self Weight)
bf/D = 1/6.667 : a/L = 0.21 : R = 1000'
‐40
‐30
‐20
‐10
0
10
20
30
40
0 0.5 1 1.5 2 2.5 3 3.5 4
Out of P
lane
Displacem
ent (in)
Load (Multiples of Self Weight)
bf/D = 1/6.667 : a/L = 0.21 : R = 500'

98
Figure A.10: bf/D = 1/6.667 : a/L = 0.34:
R = Varies
A.1.2 Study Two
• Prismatic Girder: bf/D = 0.15 – 0.33 : a/L = 0.2 – 0.3 : R = 500’ – 8000’
‐40
‐30
‐20
‐10
0
10
20
30
40
0.0 0.2 0.4 0.6 0.8 1.0 1.2 1.4
Out of P
lane
Displacem
ent (in)
Load (Multiples of Self Weight)
bf/D = 1/6.667 : a/L = 0.34 : R = Str.
End of Girder
Mid Span
Eigenvalue
‐40
‐30
‐20
‐10
0
10
20
30
40
0 0.2 0.4 0.6 0.8 1 1.2 1.4
Out of P
lane
Displacem
ent (in)
Load (Multiples of Self Weight)
bf/D = 1/6.667 : a/L = 0.34 : R = 1000'
‐40
‐30
‐20
‐10
0
10
20
30
40
0 0.2 0.4 0.6 0.8 1 1.2 1.4
Out of P
lane
Displacem
ent (in)
Load (Multiples of Self Weight)
bf/D = 1/6.667 : a/L = 0.34 : R = 500'

99
A.1.2.1 Summary
In the second study, the a/L range is decreased compared to that of the first study.
The top and bottom flange is monitored at the midspan and at the end of the girder for out
of plane displacements and rotations instead of just at the top flange. The eigenvalue is
also recorded as well as the yield limit (load resulting in an in-plane stress of 50 ksi).
Timoshenko’s lateral torsional buckling load limit is determined (using Lb = L and Cb =
1) as well as the rotational load limit (load resulting in a rotation of 4 degrees or 0.6981
rad, set arbitrarily).
A.1.2.2 Parameters and Range
• Varied:
o bf/D = 0.15 (~1/6) : 1/4 : 1/3
tf = 0.5” : 0.75” : 1”
o a/L = 0.20 : 0.25 : 0.30
o R = 500’ : 1000’ : 8000’ (~straight)
• Constant:
o L = 125’
o D = 60”
o tw = 0.5
100
A.1.2.3 Results
Figure A.11: bf/D = 1/3 : a/L = 0.20:
R = Varies
Figure A.12: bf/D = 1/3 : a/L = 0.25:
R = Varies
‐40
‐30
‐20
‐10
0
10
20
30
40
0 5 10 15 20
Out of P
lane
Displacem
ents (in)
Load (Multiple of Self Weight)
a/L = 0.20 : b/d = 1/3 : R = StraightTop End Displacement Bottom End DisplacementTop Middle Displacement Bottom Middle DisplacementRotational Limit Yield LimitEigen Value
‐40
‐30
‐20
‐10
0
10
20
30
40
0 5 10 15 20
Out of P
lane
Displacem
ents (in)
Load (Multiple of Self Weight)
a/L = 0.20 : b/d = 1/3 : R = 1000'
‐40
‐30
‐20
‐10
0
10
20
30
40
0 5 10 15 20
Out of P
lane
Displacem
ents (in)
Load (Multiple of Self Weight)
a/L = 0.20 : b/d = 1/3 : R = 500'
‐40
‐30
‐20
‐10
0
10
20
30
40
0 5 10 15 20 25 30 35 40
Out of P
lane
Displacem
ents (in)
Load (Multiple of Self Weight)
a/L = 0.25 : b/d = 1/3 : R = Straight
Top End Displacement Bottom End DisplacementTop Middle Displacement Bottom Middle DisplacementRotation Limit Eigen ValueYield Limit
‐40
‐30
‐20
‐10
0
10
20
30
40
0 5 10 15 20 25 30 35 40
Out of P
lane
Displacem
ents (in)
Load (Multiple of Self Weight)
a/L = 0.25 : b/d = 1/3 : R = 1000'
‐40
‐30
‐20
‐10
0
10
20
30
40
0 5 10 15 20 25 30 35 40
Out of P
lane
Displacem
ents (in)
Load (Multiple of Self Weight)
a/L = 0.25 : b/d = 1/3 : R = 500'

101
Figure A.13: bf/D = 1/3 : a/L = 0.30:
R = Varies
Figure A.14: bf/D = 1/4 : a/L = 0.20:
R = Varies
‐40
‐30
‐20
‐10
0
10
20
30
40
0 5 10 15 20
Out of P
lane
Displacem
ents (in)
Load (Multiple of Self Weight)
a/L = 0.30 : b/d = 1/3 : R = Straight
Top End Displacement Bottom End DisplacementTop Middle Displacement Bottom Middle DisplacementRotation Limit Yield LimitEigen Value
‐40
‐30
‐20
‐10
0
10
20
30
40
0 5 10 15 20
Out of P
lane
Displacem
ents (in)
Load (Multiple of Self Weight)
a/L = 0.30 : b/d = 1/3 : R = 1000'
‐40
‐30
‐20
‐10
0
10
20
30
40
0 5 10 15 20
Out of P
lane
Displacem
ents (in)
Load (Multiple of Self Weight)
a/L = 0.30 : b/d = 1/3 : R = 500'
‐40
‐30
‐20
‐10
0
10
20
30
40
0 2 4 6 8 10
Out of P
lane
Displacem
ents (in)
Load (Multiple of Self Weight)
a/L = 0.2 : bf/d = 1/4 : R = Str.
Top End Bottom EndTop Mid Bottom MidYield Limit Rotation LimitEigenvalue
‐40
‐30
‐20
‐10
0
10
20
30
40
0 2 4 6 8 10
Out of P
lane
Displacem
ents (in)
Load (Multiple of Self Weight)
a/L = 0.2 : bf/d = 1/4 : R = 1000'
‐40
‐30
‐20
‐10
0
10
20
30
40
0 2 4 6 8 10
Out of P
lane
Displacem
ents (in)
Load (Multiple of Self Weight)
a/L = 0.2 : bf/d = 1/4 : R 500'

102
Figure A.15: bf/D = 1/4 : a/L = 0.25:
R = Varies
Figure A.16: bf/D = 1/4 : a/L = 0.30:
R = Varies
‐40
‐30
‐20
‐10
0
10
20
30
40
0 5 10 15 20 25 30
Out of P
lane
Displacem
ents (in)
Load (Multiple of Self Weight)
a/L = 0.25 : bf/d = 1/4 : R = Str.
Top End Bottom End
Top Mid Bottom Mid
Yield Limit Rotation Limit
Eigenvalue
‐40
‐30
‐20
‐10
0
10
20
30
40
0 5 10 15 20 25 30
Out of P
lane
Displacem
ents (in)
Load (Multiple of Self Weight)
a/L = 0.25 : bf/d 1/4 : R = 1000'
‐40
‐30
‐20
‐10
0
10
20
30
40
0 5 10 15 20 25 30
Out of P
lane
Displacem
ents (in)
Load (Multiple of Self Weight)
a/L = 0.25 : bf/d = 1/4 : R = 500'
‐40
‐30
‐20
‐10
0
10
20
30
40
0 2 4 6 8 10
Out of P
lane
Displacem
ents (in)
Load (Multiple of Self Weight)
a/L = 0.3 : bf/d = 1/4 : R = Str.
Top End Bottom End
Top Mid Bottom Mid
Yield Limit Rotation Limit
Eigenvalue
‐40
‐30
‐20
‐10
0
10
20
30
40
0 2 4 6 8 10
Out of P
lane
Displacem
ents (in)
Load (Multiple of Self Weight)
a/L = 0.3 : bf/d = 1/4 : R = 1000'
‐40
‐30
‐20
‐10
0
10
20
30
40
0 2 4 6 8 10
Out of P
lane
Displacem
ents (in)
Load (Multiple of Self Weight)
a/L = 0.3 : bf/d = 1/4 : R = 500'

103
Figure A.17: bf/D = 1/6.7 : a/L = 0.20:
R = Varies
Figure A.18: bf/D = 1/6.7 : a/L = 0.25:
R = Varies
‐40
‐30
‐20
‐10
0
10
20
30
40
0 0.5 1 1.5 2 2.5 3
Out of P
lane
Displacem
ents (in)
Load (Multiple of Self Weight)
a/L = 0.20 : bf/d = 1/6.7 : R = Str. : 0.070
Top End Top MidBottom End Bottom MidYield Limit Rotation LimitEigenvalue
‐40
‐30
‐20
‐10
0
10
20
30
40
0 0.5 1 1.5 2 2.5 3
Out of P
lane
Displacem
ents (in)
Load (Multiple of Self Weight)
a/L = 0.20 : bf/d = 1/6.7 : R = 1000' : 0.590
‐40
‐30
‐20
‐10
0
10
20
30
40
0 0.5 1 1.5 2 2.5 3
Out of P
lane
Displacem
ents (in)
Load (Multiple of Self Weight)
a/L = 0.2 : bf/d = 1/6.7 : R = 500' : 1.220
‐40
‐30
‐20
‐10
0
10
20
30
40
0 1 2 3 4 5 6 7 8
Out of P
lane
Displacem
ents (in)
Load (Multiple of Self Weight)
a/L = 0.25 : bf/d = 1/6.7 : R = Str. : 0.230
Top End Top Mid
Bottom End Bottom Mid
Yield Limit Rotation Limit
Eigenvalue
‐40
‐30
‐20
‐10
0
10
20
30
40
0 1 2 3 4 5 6 7 8
Out of P
lane
Displacem
ents (in)
Load (Multiple of Self Weight)
a/L = 0.25 : bf/d = 1/6.7 : R = 1000' : 1.840
‐40
‐30
‐20
‐10
0
10
20
30
40
0 1 2 3 4 5 6 7 8
Out of P
lane
Displacem
ents (in)
Load (Multiple of Self Weight)
a/L = 0.25 : bf/d = 1/6.7 : R = 500 : 3.660
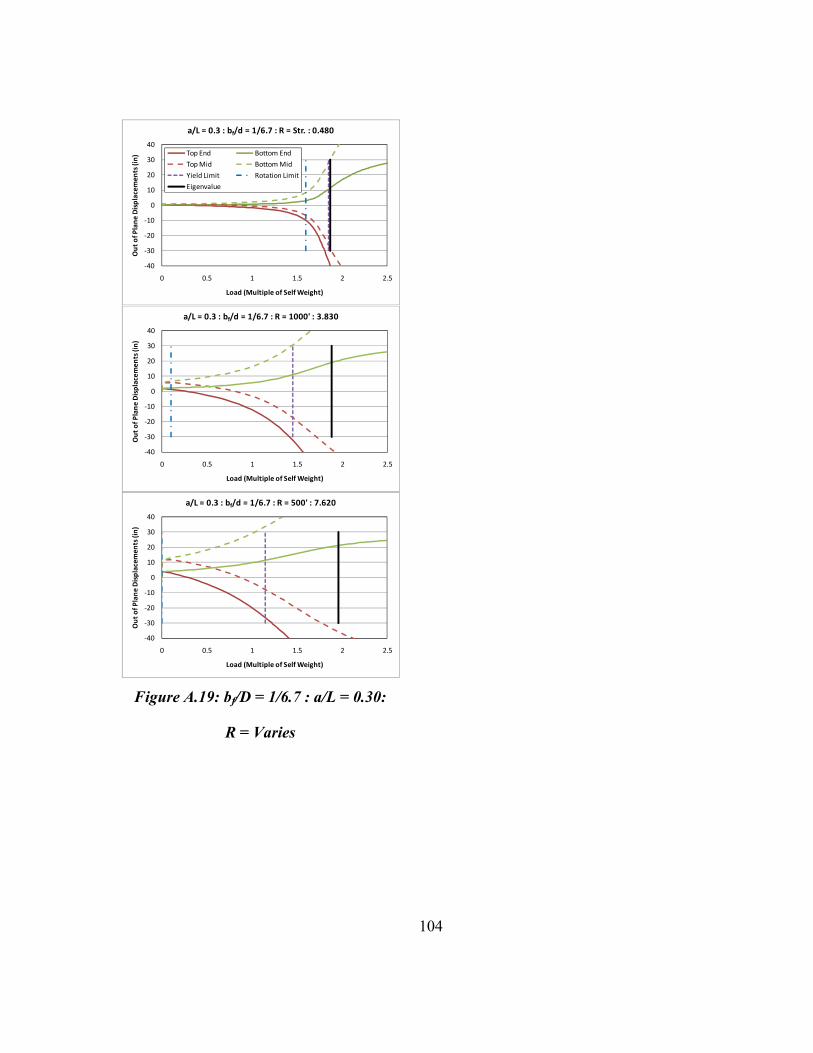
104
Figure A.19: bf/D = 1/6.7 : a/L = 0.30:
R = Varies
‐40
‐30
‐20
‐10
0
10
20
30
40
0 0.5 1 1.5 2 2.5
Out of P
lane
Displacem
ents (in)
Load (Multiple of Self Weight)
a/L = 0.3 : bf/d = 1/6.7 : R = Str. : 0.480
Top End Bottom End
Top Mid Bottom Mid
Yield Limit Rotation Limit
Eigenvalue
‐40
‐30
‐20
‐10
0
10
20
30
40
0 0.5 1 1.5 2 2.5
Out of P
lane
Displacem
ents (in)
Load (Multiple of Self Weight)
a/L = 0.3 : bf/d = 1/6.7 : R = 1000' : 3.830
‐40
‐30
‐20
‐10
0
10
20
30
40
0 0.5 1 1.5 2 2.5
Out of P
lane
Displacem
ents (in)
Load (Multiple of Self Weight)
a/L = 0.3 : bf/d = 1/6.7 : R = 500' : 7.620
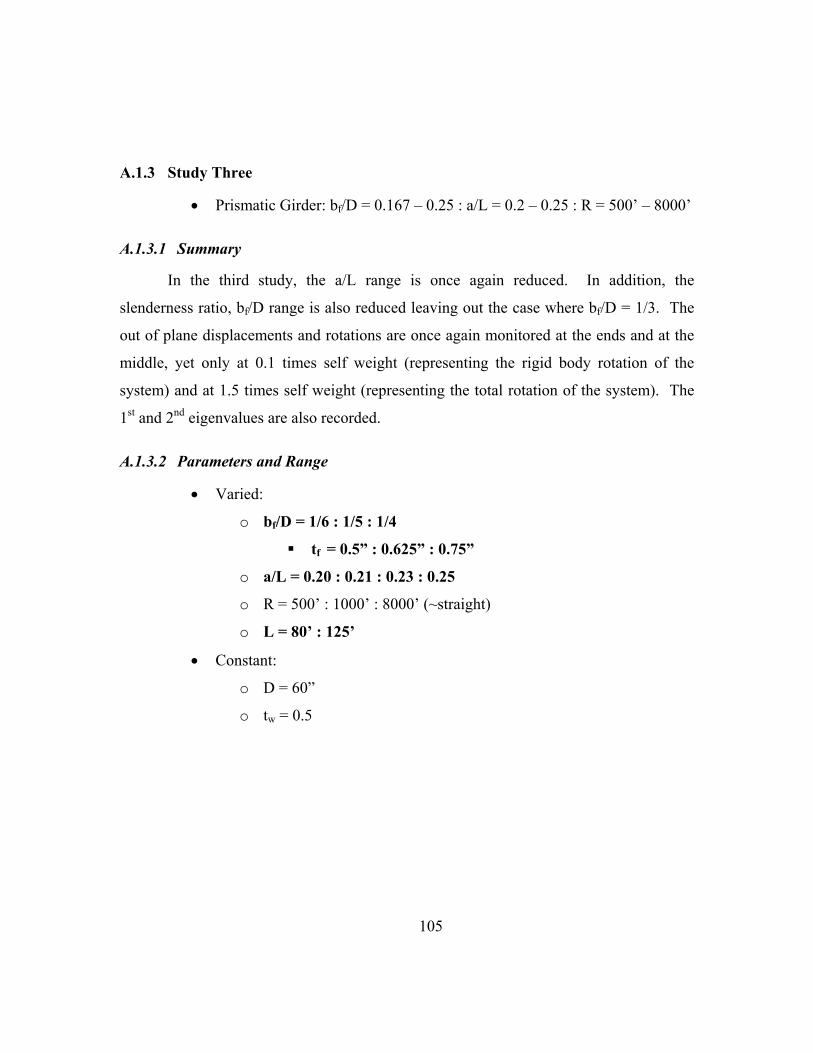
105
A.1.3 Study Three
• Prismatic Girder: bf/D = 0.167 – 0.25 : a/L = 0.2 – 0.25 : R = 500’ – 8000’
A.1.3.1 Summary
In the third study, the a/L range is once again reduced. In addition, the
slenderness ratio, bf/D range is also reduced leaving out the case where bf/D = 1/3. The
out of plane displacements and rotations are once again monitored at the ends and at the
middle, yet only at 0.1 times self weight (representing the rigid body rotation of the
system) and at 1.5 times self weight (representing the total rotation of the system). The
1st and 2nd eigenvalues are also recorded.
A.1.3.2 Parameters and Range
• Varied:
o bf/D = 1/6 : 1/5 : 1/4
tf = 0.5” : 0.625” : 0.75”
o a/L = 0.20 : 0.21 : 0.23 : 0.25
o R = 500’ : 1000’ : 8000’ (~straight)
o L = 80’ : 125’
• Constant:
o D = 60”
o tw = 0.5
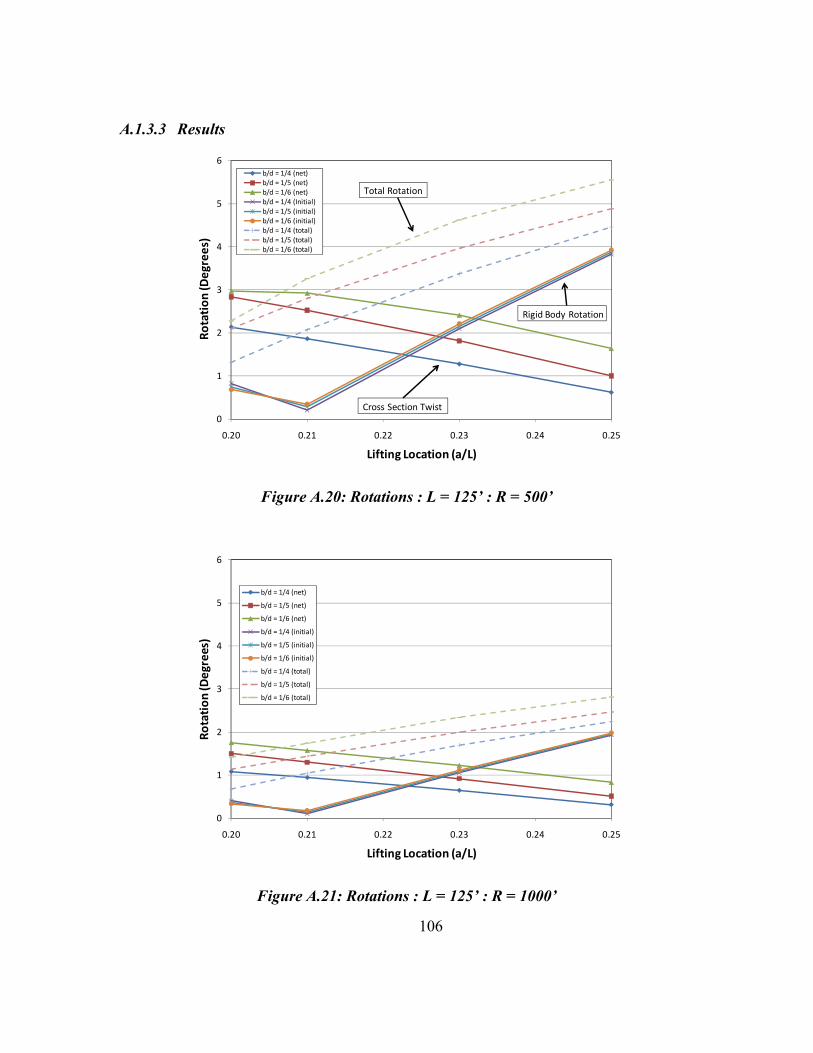
106
A.1.3.3 Results
Figure A.20: Rotations : L = 125’ : R = 500’
Figure A.21: Rotations : L = 125’ : R = 1000’
0
1
2
3
4
5
6
0.20 0.21 0.22 0.23 0.24 0.25
Rotation
(Degrees)
Lifting Location (a/L)
b/d = 1/4 (net)b/d = 1/5 (net)b/d = 1/6 (net)b/d = 1/4 (Initial)b/d = 1/5 (initial)b/d = 1/6 (initial)b/d = 1/4 (total)b/d = 1/5 (total)b/d = 1/6 (total)
Total Rotation
Rigid Body Rotation
Cross Section Twist
0
1
2
3
4
5
6
0.20 0.21 0.22 0.23 0.24 0.25
Rotation
(Degrees)
Lifting Location (a/L)
b/d = 1/4 (net)
b/d = 1/5 (net)
b/d = 1/6 (net)
b/d = 1/4 (initial)
b/d = 1/5 (initial)
b/d = 1/6 (initial)
b/d = 1/4 (total)
b/d = 1/5 (total)
b/d = 1/6 (total)

107
Figure A.22: Rotations : L = 125’ : R = 8000’ (~Str)
Figure A.23: Rotations : L = 80’ : R = 500’
0
1
2
3
4
5
6
0.20 0.21 0.22 0.23 0.24 0.25
Rotation
(Degrees)
Lift Location (a/L)
b/d = 1/4 (net)
b/d = 1/5 (net)
b/d = 1/6 (net)
b/d = 1/4 (initial)
b/d = 1/5 (initial)
b/d = 1/6 (initial)
b/d = 1/4 (total)
b/d = 1/5 (total)
b/d = 1/6 (total)
0
0.2
0.4
0.6
0.8
1
1.2
1.4
1.6
1.8
2
0.20 0.21 0.22 0.23 0.24 0.25
Rotation
(degrees)
Lift Location (a/L)
b/d = 1/4 (net)
b/d = 1/5 (net)
b/d = 1/6 (net)
b/d = 1/4 (initial)
b/d = 1/5 (initial)
b/d = 1/6 (initial)
b/d = 1/4 (total)
b/d = 1/5 (total)
b/d = 1/6 (total)
Total Rotation
Rigid Body Rotation
Cross Section Twist
108
Figure A.24: Rotations : L = 80’ : R = 1000’
Figure A.25: Rotations : L = 80’ : R = 8000’ (~Str)
0
0.2
0.4
0.6
0.8
1
1.2
1.4
1.6
1.8
2
0.20 0.21 0.22 0.23 0.24 0.25
Rotation
(degrees)
Lift Location (a/L)
b/d = 1/4 (net)
b/d = 1/5 (net)
b/d = 1/6 (net)
b/d = 1/4 (initial)
b/d = 1/5 (initial)
b/d = 1/6 (initial)
b/d = 1/4 (total)
b/d = 1/5 (total)
b/d = 1/6 (total)
0
0.2
0.4
0.6
0.8
1
1.2
1.4
1.6
1.8
2
0.20 0.21 0.22 0.23 0.24 0.25
Rotation
(degrees)
Lift Location (a/L)
b/d = 1/4 (net)
b/d = 1/5 (net)
b/d = 1/6 (net)
b/d = 1/4 (initial)
b/d = 1/5 (initial)
b/d = 1/6 (initial)
b/d = 1/4 (total)
b/d = 1/5 (total)
b/d = 1/6 (total)
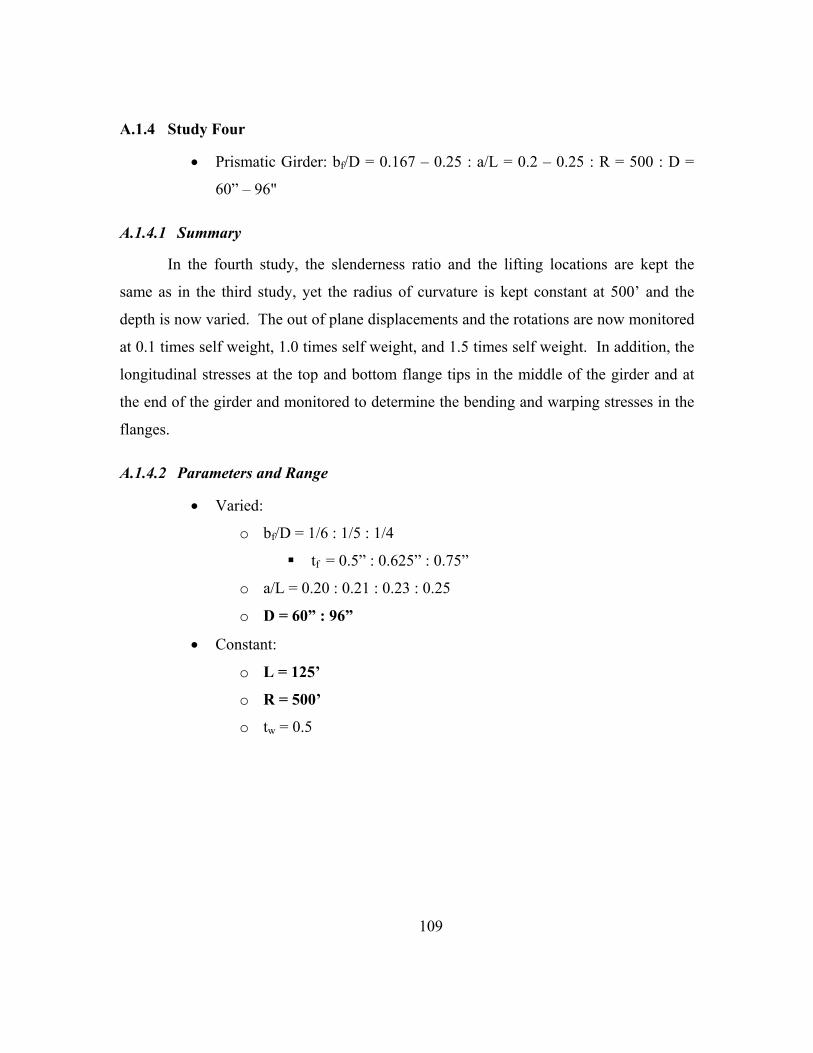
109
A.1.4 Study Four
• Prismatic Girder: bf/D = 0.167 – 0.25 : a/L = 0.2 – 0.25 : R = 500 : D =
60” – 96"
A.1.4.1 Summary
In the fourth study, the slenderness ratio and the lifting locations are kept the
same as in the third study, yet the radius of curvature is kept constant at 500’ and the
depth is now varied. The out of plane displacements and the rotations are now monitored
at 0.1 times self weight, 1.0 times self weight, and 1.5 times self weight. In addition, the
longitudinal stresses at the top and bottom flange tips in the middle of the girder and at
the end of the girder and monitored to determine the bending and warping stresses in the
flanges.
A.1.4.2 Parameters and Range
• Varied:
o bf/D = 1/6 : 1/5 : 1/4
tf = 0.5” : 0.625” : 0.75”
o a/L = 0.20 : 0.21 : 0.23 : 0.25
o D = 60” : 96”
• Constant:
o L = 125’
o R = 500’
o tw = 0.5

110
A.1.4.3 Results
Figure A.26: End Rotations : R = 500’ : D = 96”
Figure A.27: Middle Rotations : R = 500’ : D = 96”
‐5
‐4
‐3
‐2
‐1
0
1
2
3
4
5
6
7
0.20 0.21 0.22 0.23 0.24 0.25
Rotation
(degrees)
Lift Location (a/L)
Net Rotation at End (b/d = 1/4)
Net Rotation at End (b/d = 1/5)
Net Rotation at End (b/d = 1/6)
Initial Rotation
Total Rotation at End (b/d = 1/4)
Total Rotation at End (b/d = 1/5)
Total Rotation at End (b/d = 1/6)
Total Rotation
Cross Section Twist
‐5
‐4
‐3
‐2
‐1
0
1
2
3
4
5
6
7
0.20 0.21 0.22 0.23 0.24 0.25
Rotation
(degrees)
Lift Location (a/L)
Net Rotation at Middle (b/d = 1/4)
Net Rotation at Middle (b/d = 1/5)
Net Rotation at Middle (b/d = 1/6)
Initital Rotation
Total Rotation at Middle (b/d = 1/4)
Total Rotation at Middle (b/d = 1/5)
Total Rotation at Middle (b/d = 1/6)
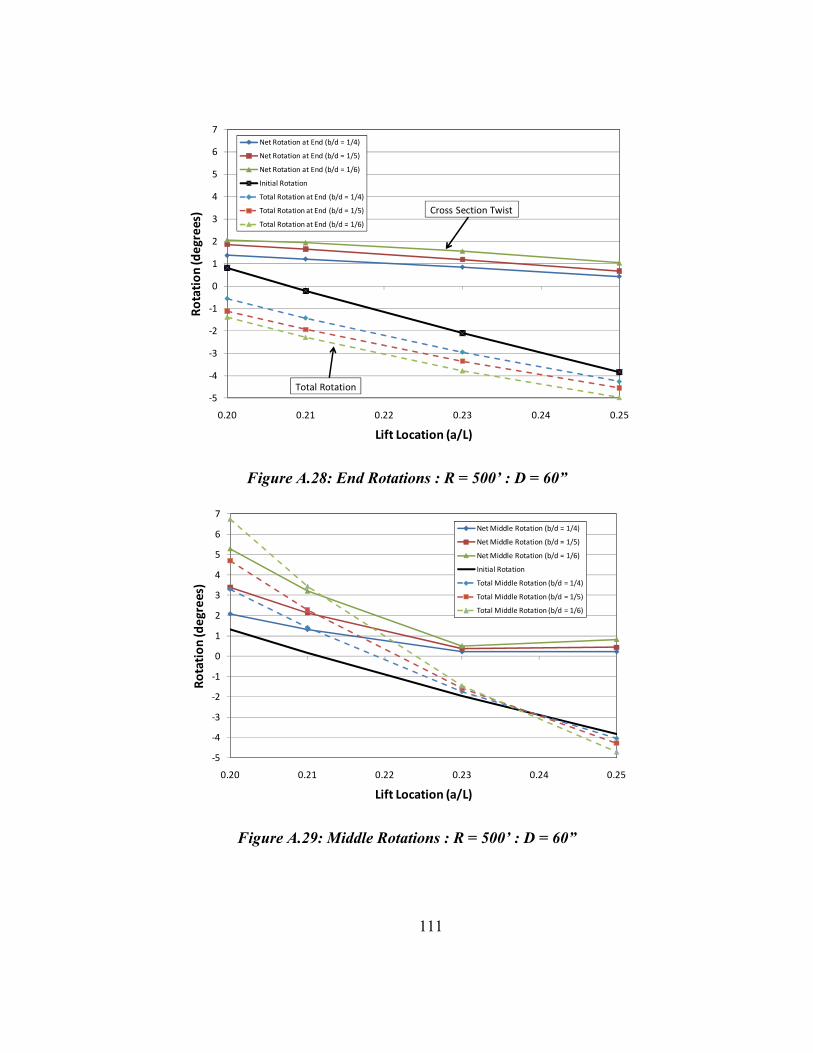
111
Figure A.28: End Rotations : R = 500’ : D = 60”
Figure A.29: Middle Rotations : R = 500’ : D = 60”
‐5
‐4
‐3
‐2
‐1
0
1
2
3
4
5
6
7
0.20 0.21 0.22 0.23 0.24 0.25
Rotation
(degrees)
Lift Location (a/L)
Net Rotation at End (b/d = 1/4)
Net Rotation at End (b/d = 1/5)
Net Rotation at End (b/d = 1/6)
Initial Rotation
Total Rotation at End (b/d = 1/4)
Total Rotation at End (b/d = 1/5)
Total Rotation at End (b/d = 1/6)
Total Rotation
Cross Section Twist
‐5
‐4
‐3
‐2
‐1
0
1
2
3
4
5
6
7
0.20 0.21 0.22 0.23 0.24 0.25
Rotation
(degrees)
Lift Location (a/L)
Net Middle Rotation (b/d = 1/4)
Net Middle Rotation (b/d = 1/5)
Net Middle Rotation (b/d = 1/6)
Initial Rotation
Total Middle Rotation (b/d = 1/4)
Total Middle Rotation (b/d = 1/5)
Total Middle Rotation (b/d = 1/6)

112
A.1.5 Study Five
• Prismatic Girder: bf/D = 0.167 – 0.25 : a/L = 0.2 – 0.25 : R = 500 – 2500’
A.1.5.1 Summary
In the fifth study, the accuracy of the eigenvalue to predict a serviceability limit
state was determined. In order to do this, the rotations at the end of the girder are
monitored as the load on the girder increases in multiples of the girder’s self weight. The
load in terms of girder self weight is recorded when the end of the girder rotates 1.5
degrees. This is done for the same slenderness ratio and lifting location range as the
previous study. The radius of curvature is varied for a given length and the depth is kept
constant.
A.1.5.2 Parameters and Range
• Varied:
o bf/D = 1/6 : 1/5 : 1/4
tf = 0.5” : 0.625” : 0.75”
o a/L = 0.20 : 0.21 : 0.23 : 0.25
o R = 1000’ : 1500’ : 1800’ : 2000’ : 2500’
• Constant:
o L = 125’
o D = 60’
o tw = 0.5
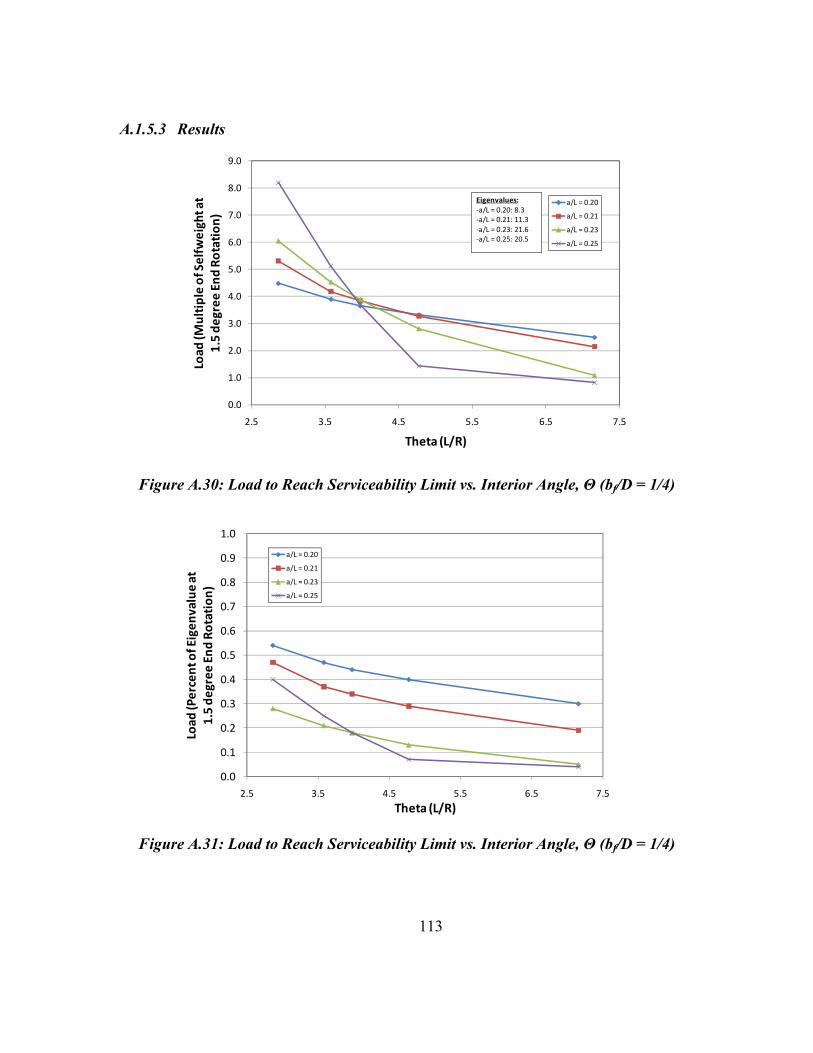
113
A.1.5.3 Results
Figure A.30: Load to Reach Serviceability Limit vs. Interior Angle, Θ (bf/D = 1/4)
Figure A.31: Load to Reach Serviceability Limit vs. Interior Angle, Θ (bf/D = 1/4)
0.0
1.0
2.0
3.0
4.0
5.0
6.0
7.0
8.0
9.0
2.5 3.5 4.5 5.5 6.5 7.5
Load
(Multiple of Selfw
eight at
1.5 de
gree
End
Rotation)
Theta (L/R)
a/L = 0.20
a/L = 0.21
a/L = 0.23
a/L = 0.25
Eigenvalues:‐a/L = 0.20: 8.3‐a/L = 0.21: 11.3‐a/L = 0.23: 21.6‐a/L = 0.25: 20.5
0.0
0.1
0.2
0.3
0.4
0.5
0.6
0.7
0.8
0.9
1.0
2.5 3.5 4.5 5.5 6.5 7.5
Load
(Percent of Eigen
value at
1.5 de
gree
End
Rotation)
Theta (L/R)
a/L = 0.20
a/L = 0.21
a/L = 0.23
a/L = 0.25
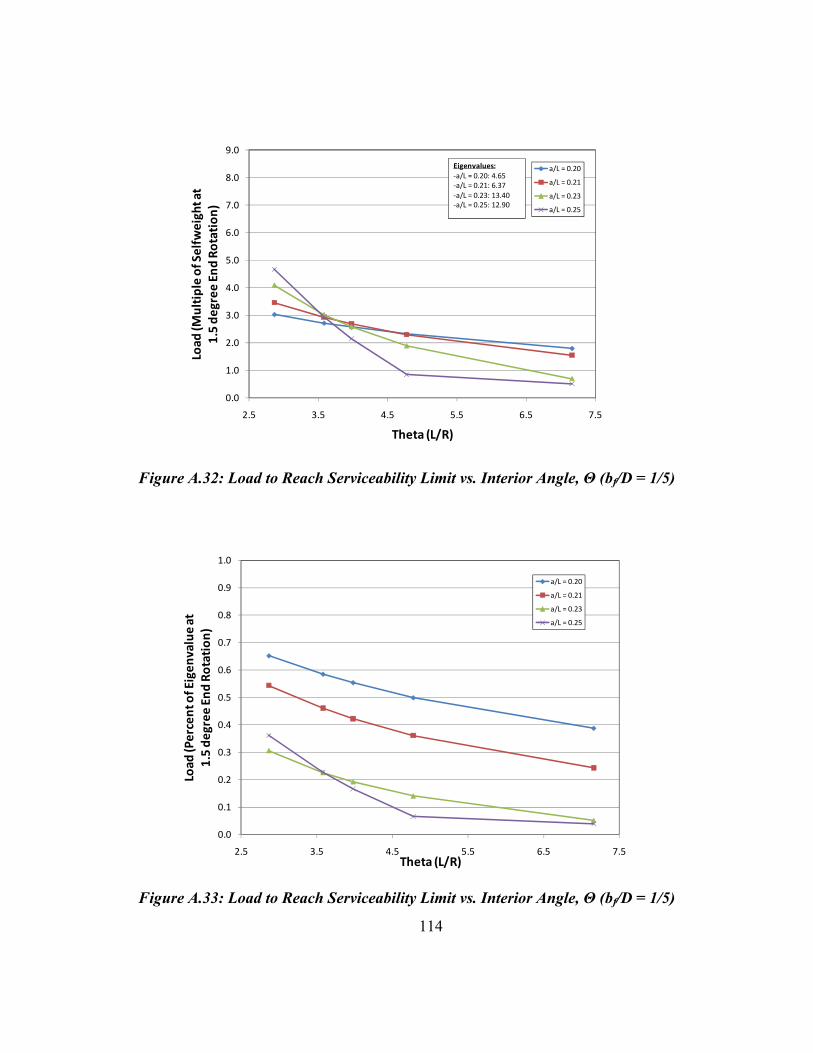
114
Figure A.32: Load to Reach Serviceability Limit vs. Interior Angle, Θ (bf/D = 1/5)
Figure A.33: Load to Reach Serviceability Limit vs. Interior Angle, Θ (bf/D = 1/5)
0.0
1.0
2.0
3.0
4.0
5.0
6.0
7.0
8.0
9.0
2.5 3.5 4.5 5.5 6.5 7.5
Load
(Multiple of Selfw
eight at
1.5 de
gree
End
Rotation)
Theta (L/R)
a/L = 0.20
a/L = 0.21
a/L = 0.23
a/L = 0.25
Eigenvalues:‐a/L = 0.20: 4.65‐a/L = 0.21: 6.37‐a/L = 0.23: 13.40‐a/L = 0.25: 12.90
0.0
0.1
0.2
0.3
0.4
0.5
0.6
0.7
0.8
0.9
1.0
2.5 3.5 4.5 5.5 6.5 7.5
Load
(Percent of Eigen
value at
1.5 de
gree
End
Rotation)
Theta (L/R)
a/L = 0.20
a/L = 0.21
a/L = 0.23
a/L = 0.25

115
Figure A.34: Load to Reach Serviceability Limit vs. Interior Angle, Θ (bf/D = 1/6)
Figure A.35: Load to Reach Serviceability Limit vs. Interior Angle, Θ (bf/D = 1/6)
0.0
1.0
2.0
3.0
4.0
5.0
6.0
7.0
8.0
9.0
2.5 3.0 3.5 4.0 4.5 5.0 5.5 6.0 6.5 7.0 7.5
Load
(Multiple of Selfw
eight a
t 1.5 de
gree
End
Rotation)
Theta (L/R)
a/L = 0.20
a/L = 0.21
a/L = 0.23
a/L = 0.25
Eigenvalues:‐a/L = 0.20: 2.76‐a/L = 0.21: 3.81‐a/L = 0.23: 8.40‐a/L = 0.25: 8.33
0.0
0.1
0.2
0.3
0.4
0.5
0.6
0.7
0.8
0.9
1.0
2.5 3.0 3.5 4.0 4.5 5.0 5.5 6.0 6.5 7.0 7.5
Load
(Percent of E
igen
value at
1.5 de
gree
End
Rotation)
Theta (L/R)
a/L = 0.20
a/L = 0.21
a/L = 0.23
a/L = 0.25

116
A.1.6 Study Six
• Prismatic Girder: bf/D = 0.167 – 0.25 : a/L = 0.2 – 0.25 : R = 1800’ : L =
90’ – 225’
A.1.6.1 Summary
In the sixth study, the accuracy of the eigenvalue to predict a serviceability limit
is once again investigated. The rotations at the end of the girder are monitored as the
load on the girder increases in multiples of the girder’s self weight. The load in terms of
girder self weight is recorded when the end of the girder rotates 1.5 degrees. This is done
for the same slenderness ratio and lifting location range as the previous study. The radius
of curvature is kept constant this time and the lengths are varied for a constant depth.
A.1.6.2 Parameters and Range
• Varied:
o bf/D = 1/6 : 1/4
tf = 0.5” : 0.625” : 0.75”
o a/L = 0.20 : 0.21 : 0.23 : 0.25
o L = 90’ : 112.5’ : 125’ : 150’ : 225’
• Constant:
o D = 60’
o R = 1800’
o tw = 0.5

117
A.1.6.3 Results
Figure A.36: Serviceability Limits – bf/D = 1/4 : D = 60” : b = 15” : R = 1800’
Figure A.37: Serviceability Limits – bf/D = 1/6 : D = 60” : b = 9” : R = 1800’
0
5
10
15
20
25
30
0 50 100 150 200 250 300
Load
(Multiple of Selfw
eight at
1.5 Degrees End
Rotation)
L/bf Ratio
a/L = 0.20
a/L = 0.21
a/L = 0.23
a/L = 0.25
0
5
10
15
20
25
30
0 50 100 150 200 250 300
Load
(Multiple of Selfw
eight at
1.5 Degrees End
Rotation)
L/bf Ratio
a/L = 0.20
a/L = 0.21
a/L = 0.23
a/L = 0.25

118
Figure A.38: Serviceability Limits – bf/D = 1/4 : D = 60” : b = 15” : R = 500’
Figure A.39: Serviceability Limits – bf/D = 1/6 : D = 60” : b = 10” : R = 500’
0
1
2
3
4
5
6
60 70 80 90 100 110 120 130
Load
(Multiple of Selfw
eight at
1.5 Degrees End
Rotation)
L/bf Ratio
a/L = 0.20
a/L = 0.21
a/L = 0.23
a/L = 0.25
0
1
2
3
4
5
6
7
8
0 50 100 150 200
Load
(Multiple of Selfw
eight at
1.5 Degrees End
Rotation)
L/bf Ratio
a/L = 0.20
a/L = 0.21
a/L = 0.23
a/L = 0.25

119
Figure A.40: Serviceability Limits – bf/D = 1/6 : D = 90” : b = 15” : R = 500’
0
1
2
3
4
5
6
7
8
60 70 80 90 100 110 120 130
Load
(Multiple of Selfw
eight at
1.5 Degrees End
Rotation)
L/bf Ratio
a/L = 0.20
a/L = 0.21
a/L = 0.23
a/L = 0.25

120
APPENDIX B Parametric Study Summary for Partially Constructed
Bridges during Erection As described in Chapter 4, an extensive parametric study was conducted to study
the behavior of partially constructed horizontally curved steel I-girder bridges during
erection sequencing and concrete placement. In this study, it was important to determine
optimal locations to place shore towers and temporary holding cranes as well as the
lifting force that should be used in a temporary lifting crane. In order to complete the
study, many finite element models were created in ANSYS 11.0 (2007) and both linear
and non-linear analyses was conducted monitoring displacements, stresses, and rotations.
This appendix supplements the information in Chapter 4 and provides a summary of the
various partially constructed scenarios studied. The parameters in bold under the
Parameters and Range section in each study signify that the range has been changed in
comparison to the previous study.
B.1 PARAMETRIC STUDY SUMMARY
The following summary and results are organized in the order in which they were
completed. It should be noted that each study has some similar characteristics, which are
described in the study summaries below. The parameters that were varied and kept
constant are noted.

121
Figure B.1: Parameter Definitions
B.1.1 Study One
• Shore tower location varied
B.1.1.1 Summary
For the first study, an actual bridge design was used to determine the optimal
place to place a temporary shore tower. Shore towers were placed along the girder to
determine where stresses and displacements were lowest. The supports are simulated as
resting on elastomeric bearing pads with 11 kips/in shear stiffness. A stiff lateral spring is
placed at the top flange of the girder at supports to prevent rotation. Both linear and non-
linear stresses and displacements are recorded.
B.1.1.2 Parameters and Range
• bf/D ~ 1/3.5 : R = 1200’ : L = 236’ : D = 84” : bf = 24”
• Permanent supports located at 0 ft and 185 ft with the shore tower varied at distances of ~20 ft.
D
bf
L
R
tf
z
L
a a
Lifting Point
Lifting Point
tw
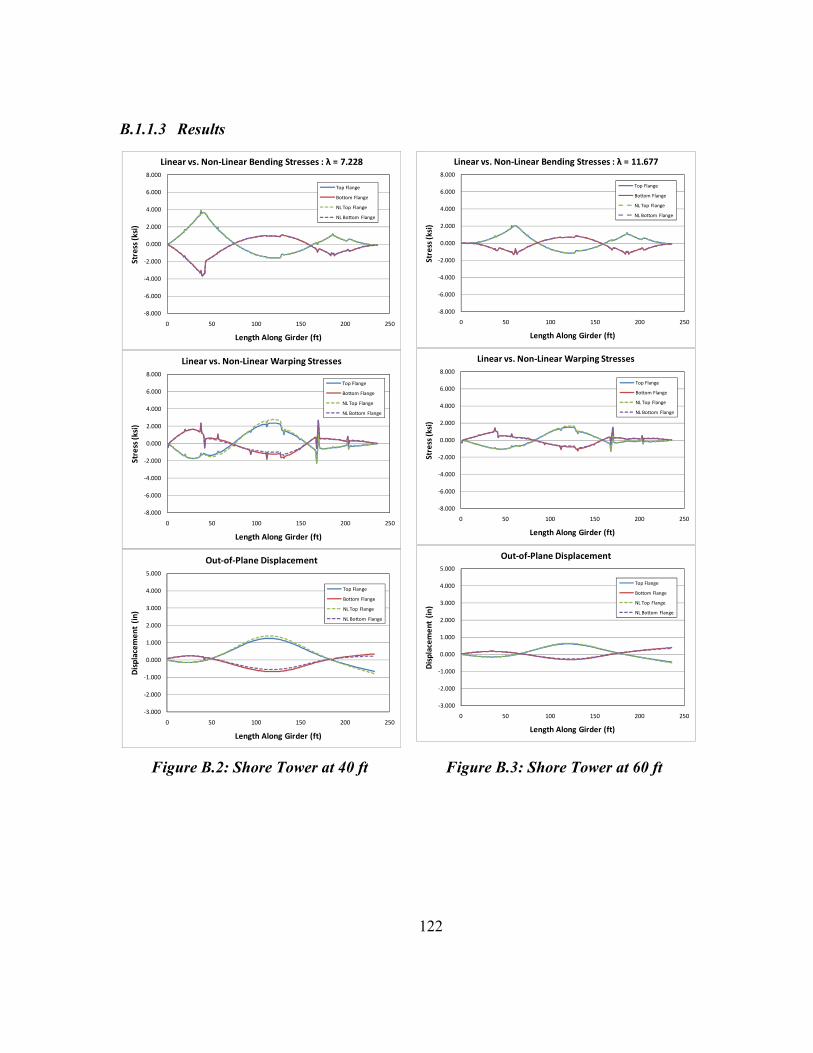
122
B.1.1.3 Results
Figure B.2: Shore Tower at 40 ft Figure B.3: Shore Tower at 60 ft
‐8.000
‐6.000
‐4.000
‐2.000
0.000
2.000
4.000
6.000
8.000
0 50 100 150 200 250
Stress (ksi)
Length Along Girder (ft)
Linear vs. Non‐Linear Bending Stresses : λ = 7.228
Top Flange
Bottom Flange
NL Top Flange
NL Bottom Flange
‐8.000
‐6.000
‐4.000
‐2.000
0.000
2.000
4.000
6.000
8.000
0 50 100 150 200 250
Stress (ksi)
Length Along Girder (ft)
Linear vs. Non‐Linear Warping Stresses
Top Flange
Bottom Flange
NL Top Flange
NL Bottom Flange
‐3.000
‐2.000
‐1.000
0.000
1.000
2.000
3.000
4.000
5.000
0 50 100 150 200 250
Displacem
ent (in)
Length Along Girder (ft)
Out‐of‐Plane Displacement
Top Flange
Bottom Flange
NL Top Flange
NL Bottom Flange
‐8.000
‐6.000
‐4.000
‐2.000
0.000
2.000
4.000
6.000
8.000
0 50 100 150 200 250
Stress (ksi)
Length Along Girder (ft)
Linear vs. Non‐Linear Bending Stresses : λ = 11.677
Top Flange
Bottom Flange
NL Top Flange
NL Bottom Flange
‐8.000
‐6.000
‐4.000
‐2.000
0.000
2.000
4.000
6.000
8.000
0 50 100 150 200 250
Stress (ksi)
Length Along Girder (ft)
Linear vs. Non‐Linear Warping Stresses
Top Flange
Bottom Flange
NL Top Flange
NL Bottom Flange
‐3.000
‐2.000
‐1.000
0.000
1.000
2.000
3.000
4.000
5.000
0 50 100 150 200 250
Displacem
ent (in
)
Length Along Girder (ft)
Out‐of‐Plane Displacement
Top Flange
Bottom Flange
NL Top Flange
NL Bottom Flange

123
Figure B.4: Shore Tower at 80 ft Figure B.5: Shore Tower at 100 ft
‐8.000
‐6.000
‐4.000
‐2.000
0.000
2.000
4.000
6.000
8.000
0 50 100 150 200 250
Stress (ksi)
Length Along Girder (ft)
Linear vs. Non‐Linear Bending Stresses : λ = 12.049
Top Flange
Bottom Flange
NL Top Flange
NL Bottom Flange
‐8.000
‐6.000
‐4.000
‐2.000
0.000
2.000
4.000
6.000
8.000
0 50 100 150 200 250
Stress (ksi)
Length Along Girder (ft)
Linear vs. Non‐Linear Warping Stresses
Top Flange
Bottom Flange
NL Top Flange
NL Bottom Flange
‐3.000
‐2.000
‐1.000
0.000
1.000
2.000
3.000
4.000
5.000
0 50 100 150 200 250
Displacem
ent (in)
Length Along Girder (ft)
Out‐of‐Plane Displacement
Top Flange
Bottom Flange
NL Top Flange
NL Bottom Flange
‐8.000
‐6.000
‐4.000
‐2.000
0.000
2.000
4.000
6.000
8.000
0 50 100 150 200 250
Stress (ksi)
Length Along Girder (ft)
Linear vs. Non‐Linear Bending Stresses : λ = 11.819
Top Flange
Bottom Flange
NL Top Flange
NL Bottom Flange
‐8.000
‐6.000
‐4.000
‐2.000
0.000
2.000
4.000
6.000
8.000
0 50 100 150 200 250
Stress (ksi)
Length Along Girder (ft)
Linear vs. Non‐Linear Warping Stresses
Top Flange
Bottom Flange
NL Top Flange
NL Bottom Flange
‐3.000
‐2.000
‐1.000
0.000
1.000
2.000
3.000
4.000
5.000
0 50 100 150 200 250
Displacem
ent (in)
Length Along Girder (ft)
Out‐of‐Plane Displacement
Top Flange
Bottom Flange
NL Top Flange
NL Bottom Flange

124
Figure B.6: Shore Tower at 120 ft Figure B.7: Shore Tower at 140 ft
‐8.000
‐6.000
‐4.000
‐2.000
0.000
2.000
4.000
6.000
8.000
0 50 100 150 200 250
Stress (ksi)
Length Along Girder (ft)
Linear vs. Non‐Linear Bending Stresses : λ = 9.599
Top Flange
Bottom Flange
NL Top Flange
NL Bottom Flange
‐8.000
‐6.000
‐4.000
‐2.000
0.000
2.000
4.000
6.000
8.000
0 50 100 150 200 250
Stress (ksi)
Length Along Girder (ft)
Linear vs. Non‐Linear Warping Stresses
Top Flange
Bottom Flange
NL Top Flange
NL Bottom Flange
‐3.000
‐2.000
‐1.000
0.000
1.000
2.000
3.000
4.000
5.000
0 50 100 150 200 250
Displacem
ent (in)
Length Along Girder (ft)
Out‐of‐Plane Displacement
Top Flange
Bottom Flange
NL Top Flange
NL Bottom Flange
‐8.00
‐6.00
‐4.00
‐2.00
0.00
2.00
4.00
6.00
8.00
0.00 50.00 100.00 150.00 200.00 250.00
Stress (ksi)
Length Along Girder (ft)
Linear vs. Non‐Linear Bending Stresses : λ = 7.493
Top Flange
Bottom Flange
NL Top Flange
NL Bottom Flange
‐8.00
‐6.00
‐4.00
‐2.00
0.00
2.00
4.00
6.00
8.00
0.00 50.00 100.00 150.00 200.00 250.00
Stress (ksi)
Length Along Girder (ft)
Linear vs. Non‐Linear Warping Stresses
Top Flange
Bottom Flange
NL Top Flange
NL Bottom Flange
‐3.00
‐2.00
‐1.00
0.00
1.00
2.00
3.00
4.00
5.00
0 50 100 150 200 250
Displacem
ent (in
)
Length Along Girder (ft)
Out‐of‐Plane Displacement
Top Flange
Bottom Flange
NL Top Flange
NL Bottom Flange
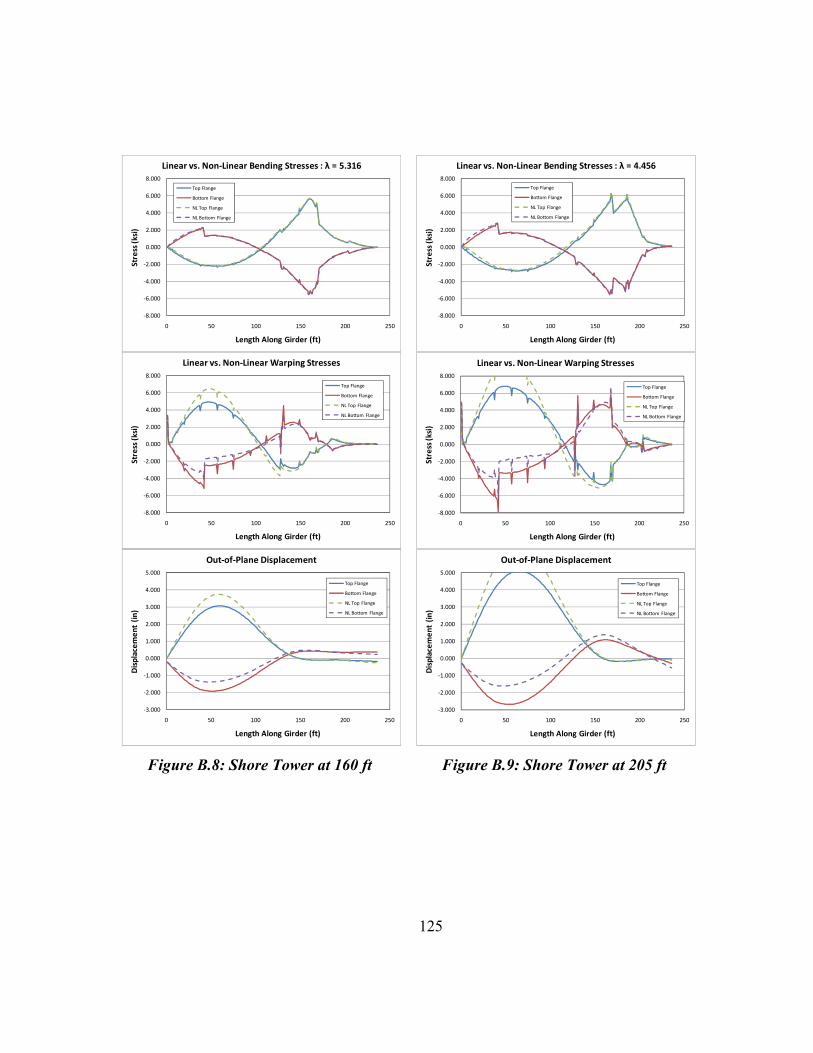
125
Figure B.8: Shore Tower at 160 ft Figure B.9: Shore Tower at 205 ft
‐8.000
‐6.000
‐4.000
‐2.000
0.000
2.000
4.000
6.000
8.000
0 50 100 150 200 250
Stress (ksi)
Length Along Girder (ft)
Linear vs. Non‐Linear Bending Stresses : λ = 5.316
Top Flange
Bottom Flange
NL Top Flange
NL Bottom Flange
‐8.000
‐6.000
‐4.000
‐2.000
0.000
2.000
4.000
6.000
8.000
0 50 100 150 200 250
Stress (ksi)
Length Along Girder (ft)
Linear vs. Non‐Linear Warping Stresses
Top Flange
Bottom Flange
NL Top Flange
NL Bottom Flange
‐3.000
‐2.000
‐1.000
0.000
1.000
2.000
3.000
4.000
5.000
0 50 100 150 200 250
Displacem
ent (in
)
Length Along Girder (ft)
Out‐of‐Plane Displacement
Top Flange
Bottom Flange
NL Top Flange
NL Bottom Flange
‐8.000
‐6.000
‐4.000
‐2.000
0.000
2.000
4.000
6.000
8.000
0 50 100 150 200 250
Stress (ksi)
Length Along Girder (ft)
Linear vs. Non‐Linear Bending Stresses : λ = 4.456
Top Flange
Bottom Flange
NL Top Flange
NL Bottom Flange
‐8.000
‐6.000
‐4.000
‐2.000
0.000
2.000
4.000
6.000
8.000
0 50 100 150 200 250
Stress (ksi)
Length Along Girder (ft)
Linear vs. Non‐Linear Warping Stresses
Top Flange
Bottom Flange
NL Top Flange
NL Bottom Flange
‐3.000
‐2.000
‐1.000
0.000
1.000
2.000
3.000
4.000
5.000
0 50 100 150 200 250
Displacem
ent (in
)
Length Along Girder (ft)
Out‐of‐Plane Displacement
Top Flange
Bottom Flange
NL Top Flange
NL Bottom Flange

126
Figure B.10: Shore Tower at 225 ft Figure B.11: Shore Tower at 245 ft
‐8.000
‐6.000
‐4.000
‐2.000
0.000
2.000
4.000
6.000
8.000
0 50 100 150 200 250
Stress (ksi)
Length Along Girder (ft)
Linear vs. Non‐Linear Bending Stresses : λ = 4.330
Top Flange
Bottom Flange
NL Top Flange
NL Bottom Flange
‐8.000
‐6.000
‐4.000
‐2.000
0.000
2.000
4.000
6.000
8.000
0 50 100 150 200 250
Stress (ksi)
Length Along Girder (ft)
Linear vs. Non‐Linear Warping Stresses
Top Flange
Bottom Flange
NL Top Flange
NL Bottom Flange
‐3.000
‐2.000
‐1.000
0.000
1.000
2.000
3.000
4.000
5.000
0 50 100 150 200 250
Displacem
ent (in
)
Length Along Girder (ft)
Out‐of‐Plane Displacement
Top Flange
Bottom Flange
NL Top Flange
NL Bottom Flange
‐8.000
‐6.000
‐4.000
‐2.000
0.000
2.000
4.000
6.000
8.000
0 50 100 150 200 250
Stress (ksi)
Length Along Girder (ft)
Linear vs. Non‐Linear Bending Stresses : λ = 4.236
Top Flange
Bottom Flange
NL Top Flange
NL Bottom Flange
‐8.000
‐6.000
‐4.000
‐2.000
0.000
2.000
4.000
6.000
8.000
0 50 100 150 200 250
Stress (ksi)
Length Along Girder (ft)
Linear vs. Non‐Linear Warping Stresses
Top Flange
Bottom Flange
NL Top Flange
NL Bottom Flange
‐3.000
‐2.000
‐1.000
0.000
1.000
2.000
3.000
4.000
5.000
0 50 100 150 200 250
Displacem
ent (in
)
Length Along Girder (ft)
Out‐of‐Plane Displacement
Top Flange
Bottom Flange
NL Top Flange
NL Bottom Flange

127
B.1.2 Study Two
• Holding crane location fixed : holding crane load varied
B.1.2.1 Summary
For the second study, the same bridge as used in Study 1 was used again to
determine the optimal load to place in a temporary holding crane. The holding crane
location was fixed at 80 ft which corresponded to the optimal shore tower location per
study 1. Holding crane forces were changed to determine when stresses and
displacements were lowest. The holding crane is modeling by placing a vertical force in
the middle of the top flange. Both linear and non-linear stresses and displacements are
recorded.
B.1.2.2 Parameters and Range
• bf/D ~ 1/3.5 : R = 1200’ : L = 236’ : D = 84” : bf = 24”
• Permanent supports located at 0 ft and 185 ft
• Holding crane location fixed at x = 80 ft
• Holding crane force varied from 20 kips to 60 kips at 5 kip intervals
with an additional load of 47.8 kips used (vertical reaction in the shore
tower placed at 80 ft per study 1).
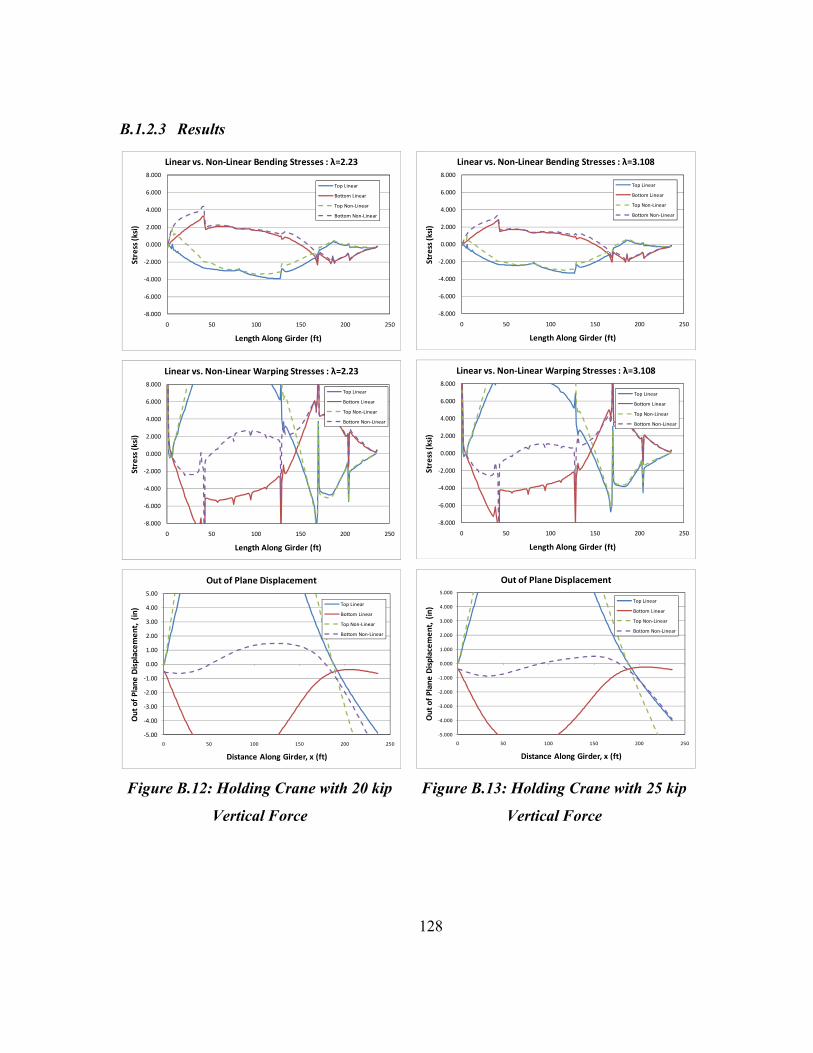
128
B.1.2.3 Results
Figure B.12: Holding Crane with 20 kip
Vertical Force
Figure B.13: Holding Crane with 25 kip
Vertical Force
‐8.000
‐6.000
‐4.000
‐2.000
0.000
2.000
4.000
6.000
8.000
0 50 100 150 200 250
Stress (ksi)
Length Along Girder (ft)
Linear vs. Non‐Linear Bending Stresses : λ=2.23
Top Linear
Bottom Linear
Top Non‐Linear
Bottom Non‐Linear
‐8.000
‐6.000
‐4.000
‐2.000
0.000
2.000
4.000
6.000
8.000
0 50 100 150 200 250
Stress (ksi)
Length Along Girder (ft)
Linear vs. Non‐Linear Warping Stresses : λ=2.23
Top Linear
Bottom Linear
Top Non‐Linear
Bottom Non‐Linear
‐5.00
‐4.00
‐3.00
‐2.00
‐1.00
0.00
1.00
2.00
3.00
4.00
5.00
0 50 100 150 200 250
Out of Plane Displacem
ent, (in)
Distance Along Girder, x (ft)
Out of Plane Displacement
Top Linear
Bottom Linear
Top Non‐Linear
Bottom Non‐Linear
‐8.000
‐6.000
‐4.000
‐2.000
0.000
2.000
4.000
6.000
8.000
0 50 100 150 200 250
Stress (ksi)
Length Along Girder (ft)
Linear vs. Non‐Linear Bending Stresses : λ=3.108
Top Linear
Bottom Linear
Top Non‐Linear
Bottom Non‐Linear
‐8.000
‐6.000
‐4.000
‐2.000
0.000
2.000
4.000
6.000
8.000
0 50 100 150 200 250
Stress (ksi)
Length Along Girder (ft)
Linear vs. Non‐Linear Warping Stresses : λ=3.108
Top Linear
Bottom Linear
Top Non‐Linear
Bottom Non‐Linear
‐5.000
‐4.000
‐3.000
‐2.000
‐1.000
0.000
1.000
2.000
3.000
4.000
5.000
0 50 100 150 200 250
Out of P
lane
Displacem
ent, (in
)
Distance Along Girder, x (ft)
Out of Plane Displacement
Top Linear
Bottom Linear
Top Non‐Linear
Bottom Non‐Linear

129
Figure B.14: Holding Crane with 30 kip
Vertical Force
Figure B.15: Holding Crane with 35 kip
Vertical Force
‐8.000
‐6.000
‐4.000
‐2.000
0.000
2.000
4.000
6.000
8.000
0 50 100 150 200 250
Stress (ksi)
Length Along Girder (ft)
Linear vs. Non‐Linear Bending Stresses : λ=4.725
Top Linear
Bottom Linear
Top Non‐Linear
Bottom Non‐Linear
‐8.000
‐6.000
‐4.000
‐2.000
0.000
2.000
4.000
6.000
8.000
0 50 100 150 200 250
Stress (ksi)
Length Along Girder (ft)
Linear vs. Non‐Linear Warping Stresses : λ=4.725
Top Linear
Bottom Linear
Top Non‐Linear
Bottom Non‐Linear
‐5.000
‐4.000
‐3.000
‐2.000
‐1.000
0.000
1.000
2.000
3.000
4.000
5.000
0 50 100 150 200 250
Out of Plane Displacem
ent, (in)
Distance Along Girder, x (ft)
Out of Plane Displacement
Top Linear
Bottom Linear
Top Non‐Linear
Bottom Non‐Linear
‐8.000
‐6.000
‐4.000
‐2.000
0.000
2.000
4.000
6.000
8.000
0 50 100 150 200 250
Stress (ksi)
Length Along Girder (ft)
Linear vs. Non‐Linear Bending Stresses : λ=7.745
Top Linear
Bottom Linear
Top Non‐Linear
Bottom Non‐Linear
‐8.000
‐6.000
‐4.000
‐2.000
0.000
2.000
4.000
6.000
8.000
0 50 100 150 200 250
Stress (ksi)
Length Along Girder (ft)
Linear vs. Non‐Linear Warping Stresses : λ=7.745
Top Linear
Bottom Linear
Top Non‐Linear
Bottom Non‐Linear
‐5.000
‐4.000
‐3.000
‐2.000
‐1.000
0.000
1.000
2.000
3.000
4.000
5.000
0 50 100 150 200 250
Out of P
lane
Displacem
ent, (in)
Distance Along Girder, x (ft)
Out of Plane Displacement
Top Linear
Bottom Linear
Top Non‐Linear
Bottom Non‐Linear
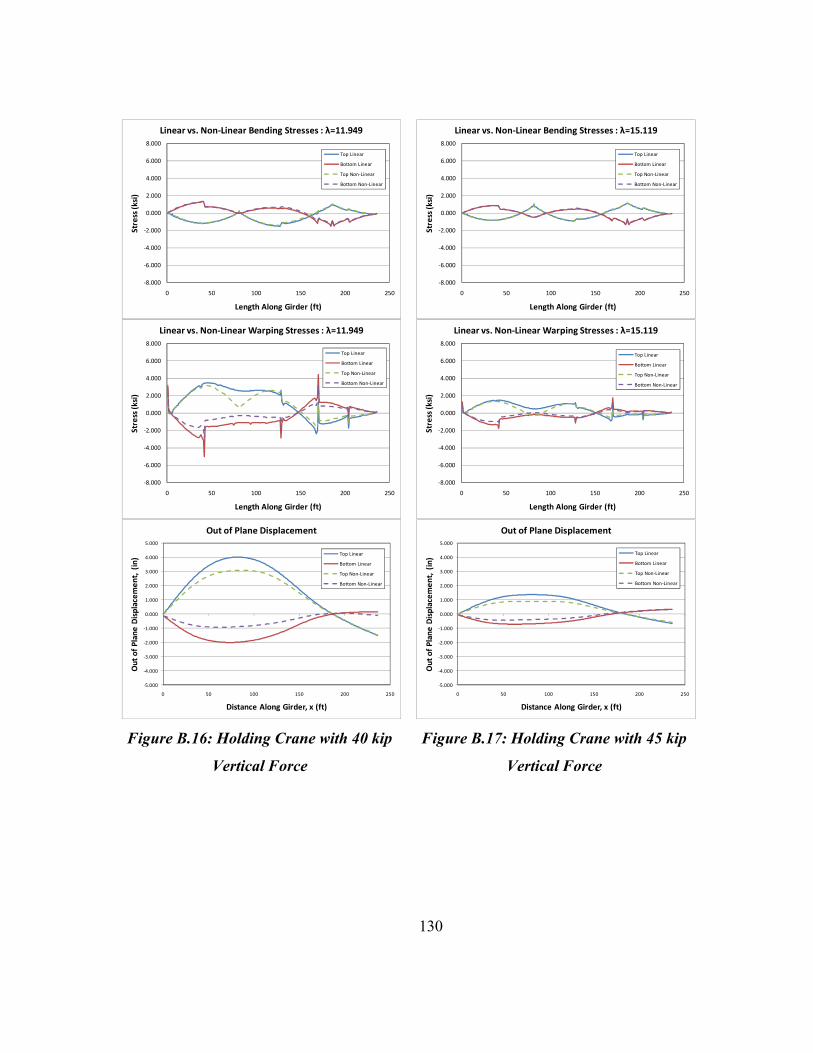
130
Figure B.16: Holding Crane with 40 kip
Vertical Force
Figure B.17: Holding Crane with 45 kip
Vertical Force
‐8.000
‐6.000
‐4.000
‐2.000
0.000
2.000
4.000
6.000
8.000
0 50 100 150 200 250
Stress (ksi)
Length Along Girder (ft)
Linear vs. Non‐Linear Bending Stresses : λ=11.949
Top Linear
Bottom Linear
Top Non‐Linear
Bottom Non‐Linear
‐8.000
‐6.000
‐4.000
‐2.000
0.000
2.000
4.000
6.000
8.000
0 50 100 150 200 250
Stress (ksi)
Length Along Girder (ft)
Linear vs. Non‐Linear Warping Stresses : λ=11.949
Top Linear
Bottom Linear
Top Non‐Linear
Bottom Non‐Linear
‐5.000
‐4.000
‐3.000
‐2.000
‐1.000
0.000
1.000
2.000
3.000
4.000
5.000
0 50 100 150 200 250
Out of P
lane
Displacem
ent, (in)
Distance Along Girder, x (ft)
Out of Plane Displacement
Top Linear
Bottom Linear
Top Non‐Linear
Bottom Non‐Linear
‐8.000
‐6.000
‐4.000
‐2.000
0.000
2.000
4.000
6.000
8.000
0 50 100 150 200 250
Stress (ksi)
Length Along Girder (ft)
Linear vs. Non‐Linear Bending Stresses : λ=15.119
Top Linear
Bottom Linear
Top Non‐Linear
Bottom Non‐Linear
‐8.000
‐6.000
‐4.000
‐2.000
0.000
2.000
4.000
6.000
8.000
0 50 100 150 200 250
Stress (ksi)
Length Along Girder (ft)
Linear vs. Non‐Linear Warping Stresses : λ=15.119
Top Linear
Bottom Linear
Top Non‐Linear
Bottom Non‐Linear
‐5.000
‐4.000
‐3.000
‐2.000
‐1.000
0.000
1.000
2.000
3.000
4.000
5.000
0 50 100 150 200 250
Out of P
lane
Displacem
ent, (in)
Distance Along Girder, x (ft)
Out of Plane Displacement
Top Linear
Bottom Linear
Top Non‐Linear
Bottom Non‐Linear

131
Figure B.18: Holding Crane with 47.8 kip
Vertical Force
Figure B.19: Holding Crane with 50 kip
Vertical Force
‐8.000
‐6.000
‐4.000
‐2.000
0.000
2.000
4.000
6.000
8.000
0 50 100 150 200 250
Stress (ksi)
Length Along Girder (ft)
Linear vs. Non‐Linear Bending Stresses : λ=16.044
Top Linear
Bottom Linear
Top Non‐Linear
Bottom Non‐Linear
‐8.000
‐6.000
‐4.000
‐2.000
0.000
2.000
4.000
6.000
8.000
0 50 100 150 200 250
Stress (ksi)
Length Along Girder (ft)
Linear vs. Non‐Linear Warping Stresses : λ=16.044
Top Linear
Bottom Linear
Top Non‐Linear
Bottom Non‐Linear
‐5.000
‐4.000
‐3.000
‐2.000
‐1.000
0.000
1.000
2.000
3.000
4.000
5.000
0 50 100 150 200 250
Out of P
lane
Displacem
ent, (in
)
Distance Along Girder, x (ft)
Out of Plane Displacement
Top Linear
Bottom Linear
Top Non‐Linear
Bottom Non‐Linear
‐8.000
‐6.000
‐4.000
‐2.000
0.000
2.000
4.000
6.000
8.000
0 50 100 150 200 250
Stress (ksi)
Length Along Girder (ft)
Linear vs. Non‐Linear Bending Stresses : λ=16.667
Top Linear
Bottom Linear
Top Non‐Linear
Bottom Non‐Linear
‐8.000
‐6.000
‐4.000
‐2.000
0.000
2.000
4.000
6.000
8.000
0 50 100 150 200 250
Stress (ksi)
Length Along Girder (ft)
Linear vs. Non‐Linear Warping Stresses : λ=16.667
Top Linear
Bottom Linear
Top Non‐Linear
Bottom Non‐Linear
‐5.000
‐4.000
‐3.000
‐2.000
‐1.000
0.000
1.000
2.000
3.000
4.000
5.000
0 50 100 150 200 250
Out of Plane Displacem
ent, (in)
Distance Along Girder, x (ft)
Out of Plane Displacement
Top Linear
Bottom Linear
Top Non‐Linear
Bottom Non‐Linear

132
Figure B.20: Holding Crane with 55 kip
Vertical Force
Figure B.21: Holding Crane with 60 kip
Vertical Force
‐8.000
‐6.000
‐4.000
‐2.000
0.000
2.000
4.000
6.000
8.000
0 50 100 150 200 250
Stress (ksi)
Length Along Girder (ft)
Linear vs. Non‐Linear Bending Stresses : λ=17.853
Top Linear
Bottom Linear
Top Non‐Linear
Bottom Non‐Linear
‐8.000
‐6.000
‐4.000
‐2.000
0.000
2.000
4.000
6.000
8.000
0 50 100 150 200 250
Stress (ksi)
Length Along Girder (ft)
Linear vs. Non‐Linear Warping Stresses : λ=17.853
Top Linear
Bottom Linear
Top Non‐Linear
Bottom Non‐Linear
‐5.000
‐4.000
‐3.000
‐2.000
‐1.000
0.000
1.000
2.000
3.000
4.000
5.000
0 50 100 150 200 250
Out of P
lane
Displacem
ent, (in
)
Distance Along Girder, x (ft)
Out of Plane Displacement d
Top LInear
Bottom Linear
Top Non‐Linear
Bottom Non‐Linear
‐8.000
‐6.000
‐4.000
‐2.000
0.000
2.000
4.000
6.000
8.000
0 50 100 150 200 250
Stress (ksi)
Length Along Girder (ft)
Linear vs. Non‐Linear Bending Stresses : λ=12.582
Top Linear
Bottom Linear
Top Non‐Linear
Bottom Non‐Linear
‐8.000
‐6.000
‐4.000
‐2.000
0.000
2.000
4.000
6.000
8.000
0 50 100 150 200 250
Stress (ksi)
Length Along Girder (ft)
Linear vs. Non‐Linear Warping Stresses : λ=12.582
Top Linear
Bottom Linear
Top Non‐Linear
Bottom Non‐Linear
‐5.000
‐4.000
‐3.000
‐2.000
‐1.000
0.000
1.000
2.000
3.000
4.000
5.000
0 50 100 150 200 250
Out of P
lane
Displacem
ent, (in)
Distance Along Girder, x (ft)
Out of Plane Displacement
Top Linear
Bottom Linear
Top Non‐Linear
Bottom Non‐Linear

133
B.1.3 Study Three
B.1.3.1 Summary
For the third study, different cantilever ratios and beam lengths were used to see if
it affected the results from the previous studies. The three cases that were looked at are
as follows where b is the cantilever length, L is the simple span length, and Ltotal is the
total propped cantilever length.
• Case 1: Ltotal = 217 ft ; b/Ltotal = 0.15
• Case 2: Ltotal = 236 ft ; b/Ltotal = 0.22
• Case 3: Ltotal = 264 ft ; b/Ltotal = 0.30
For each case, the holding crane was placed at the optimal lift location which
corresponds to the location of maximum positive moment. For a propped cantilever
beam with a uniformly distributed load such as that of a prismatic girder with only self
weight applied, this location can be determined from Eq. 4.1. Analyses were also
completed for holding crane locations equal to +/- 10% and +/- 20% of the optimal lift
location. The ideal lifting force was used for each holding crane location. The ideal
lifting load is equal to the vertical reaction that a shore tower is required to resist if
modeled by a rigid support placed at the same location as the holding crane.
B.1.3.2 Parameters and Range
• bf/D = 1/6 : R = 1200’ : L = varies : D = 84” : bf = 14”
• Permanent supports located at 0 ft and 185 ft
• Holding crane location: varies
• Holding crane force equal to vertical reaction in a shore tower
modeled as a rigid support at the same location
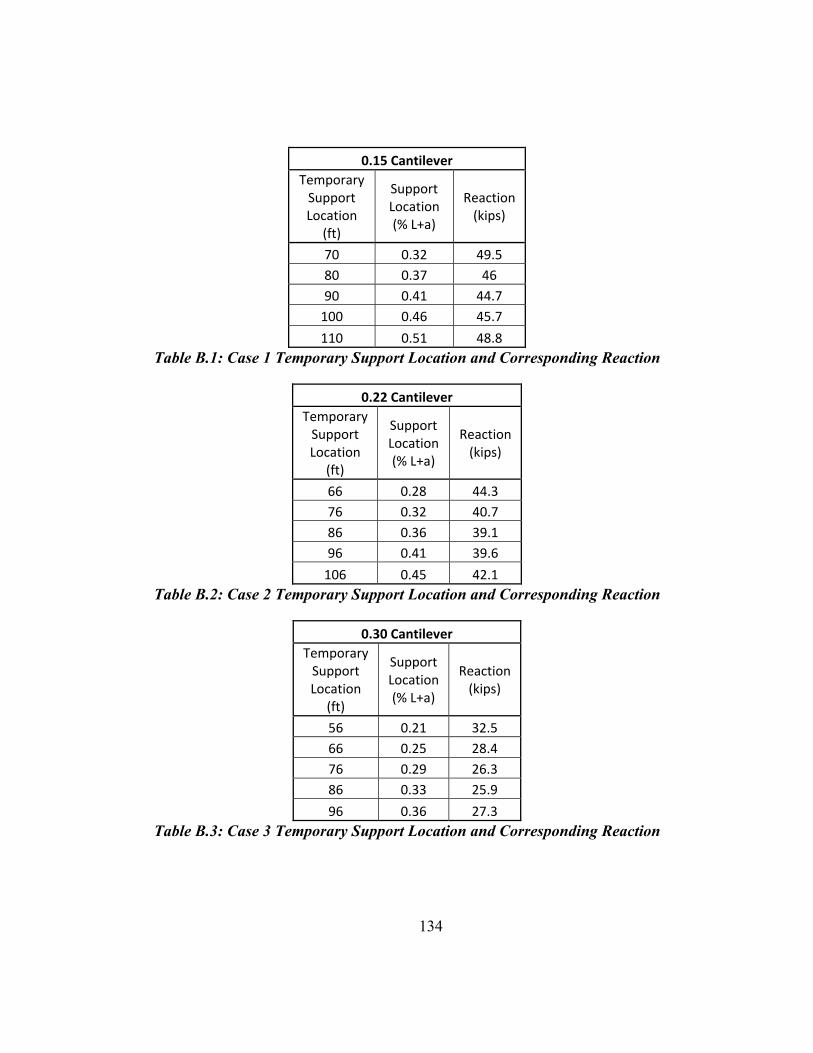
134
0.15 Cantilever Temporary Support Location
(ft)
Support Location (% L+a)
Reaction (kips)
70 0.32 49.5 80 0.37 46 90 0.41 44.7 100 0.46 45.7
110 0.51 48.8 Table B.1: Case 1 Temporary Support Location and Corresponding Reaction
0.22 Cantilever Temporary Support Location
(ft)
Support Location (% L+a)
Reaction (kips)
66 0.28 44.3 76 0.32 40.7 86 0.36 39.1 96 0.41 39.6
106 0.45 42.1 Table B.2: Case 2 Temporary Support Location and Corresponding Reaction
0.30 Cantilever Temporary Support Location
(ft)
Support Location (% L+a)
Reaction (kips)
56 0.21 32.5 66 0.25 28.4 76 0.29 26.3 86 0.33 25.9
96 0.36 27.3 Table B.3: Case 3 Temporary Support Location and Corresponding Reaction

135
Figure B.22: Shore Tower Reaction vs. Location [% Ltotal]
20
25
30
35
40
45
50
55
0.20 0.25 0.30 0.35 0.40 0.45 0.50 0.55 0.60 0.65
Reaction
, Kips
Support Location [Location/(Ltotal)]
0.15*L Cantilever
0.22*L Cantilever
0.3*L Cantilever

136
B.1.3.3 Results
B.1.3.3.1 Case 1
Figure B.23: Case 1: x = 70 ft : F = 49.5
kips : 0.15 Cantilever
Figure B.24: Case 1: x = 80 ft : F = 46.0
kips : 0.15 Cantilever
‐6.00
‐4.00
‐2.00
0.00
2.00
4.00
6.00
0 50 100 150 200 250
Ben
ding
Stresses [ksi]
Distance Along Girder [ft]
Bending Stresses Along Girder
Top Linear
Bottom Linear
Top Non‐Linear
Bottom Non‐Linear
‐6.00
‐4.00
‐2.00
0.00
2.00
4.00
6.00
0 50 100 150 200 250
Warping
Stresses [ksi]
Distance Along Girder [ft]
Warping Stresses Along Girder
Top Linear
Bottom Linear
Top Non‐Linear
Bottom Non‐Linear
‐4.000
‐3.000
‐2.000
‐1.000
0.000
1.000
2.000
3.000
4.000
0 50 100 150 200 250
Displacem
ents [in]
Distance Along Girder [ft]
Displacements Along Girder
Top Linear
Bottom Linear
Top Non‐Linear
Bottom Non‐Linear
‐6.00
‐4.00
‐2.00
0.00
2.00
4.00
6.00
0 50 100 150 200 250
Ben
ding
Stresses [ksi]
Distance Along Girder [ft]
Bending Stresses Along Girder
Top Linear
Bottom Linear
Top Non‐Linear
Bottom Non‐Linear
‐6.00
‐4.00
‐2.00
0.00
2.00
4.00
6.00
0 50 100 150 200 250
Warping
Stresses [ksi]
Distance Along Girder [ft]
Warping Stresses Along Girder
Top Linear
Bottom Linear
Top Non‐Linear
Bottom Non‐Linear
‐4.000
‐3.000
‐2.000
‐1.000
0.000
1.000
2.000
3.000
4.000
0 50 100 150 200 250
Displacem
ents [in]
Distance Along Girder [ft]
Displacements Along Girder
Top Linear
Bottom Linear
Top Non‐Linear
Bottom Non‐Linear
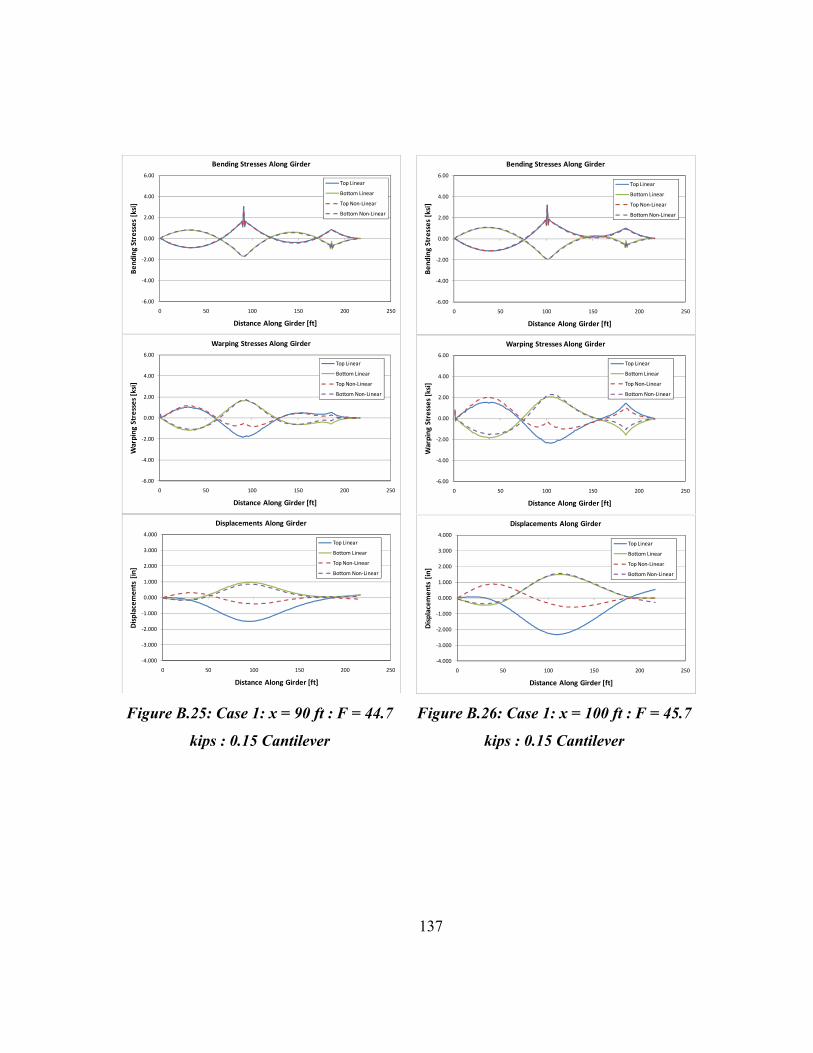
137
Figure B.25: Case 1: x = 90 ft : F = 44.7
kips : 0.15 Cantilever
Figure B.26: Case 1: x = 100 ft : F = 45.7
kips : 0.15 Cantilever
‐6.00
‐4.00
‐2.00
0.00
2.00
4.00
6.00
0 50 100 150 200 250
Bend
ing Stresses [ksi]
Distance Along Girder [ft]
Bending Stresses Along Girder
Top Linear
Bottom Linear
Top Non‐Linear
Bottom Non‐Linear
‐6.00
‐4.00
‐2.00
0.00
2.00
4.00
6.00
0 50 100 150 200 250
Warping
Stresses [ksi]
Distance Along Girder [ft]
Warping Stresses Along Girder
Top Linear
Bottom Linear
Top Non‐Linear
Bottom Non‐Linear
‐4.000
‐3.000
‐2.000
‐1.000
0.000
1.000
2.000
3.000
4.000
0 50 100 150 200 250
Displacem
ents [in]
Distance Along Girder [ft]
Displacements Along Girder
Top Linear
Bottom Linear
Top Non‐Linear
Bottom Non‐Linear
‐6.00
‐4.00
‐2.00
0.00
2.00
4.00
6.00
0 50 100 150 200 250
Bend
ing Stresses [ksi]
Distance Along Girder [ft]
Bending Stresses Along Girder
Top Linear
Bottom Linear
Top Non‐Linear
Bottom Non‐Linear
‐6.00
‐4.00
‐2.00
0.00
2.00
4.00
6.00
0 50 100 150 200 250
Warping
Stresses [ksi]
Distance Along Girder [ft]
Warping Stresses Along Girder
Top Linear
Bottom Linear
Top Non‐Linear
Bottom Non‐Linear
‐4.000
‐3.000
‐2.000
‐1.000
0.000
1.000
2.000
3.000
4.000
0 50 100 150 200 250
Displacem
ents [in]
Distance Along Girder [ft]
Displacements Along Girder
Top Linear
Bottom Linear
Top Non‐Linear
Bottom Non‐Linear

138
Figure B.27: Case 1: x = 110 ft : F = 48.8
kips : 0.15 Cantilever
‐6.00
‐4.00
‐2.00
0.00
2.00
4.00
6.00
0 50 100 150 200 250
Bend
ing Stresses [ksi]
Distance Along Girder [ft]
Bending Stresses Along Girder
Top Linear
Bottom Linear
Top Non‐Linear
Bottom Non‐Linear
‐6.00
‐4.00
‐2.00
0.00
2.00
4.00
6.00
0 50 100 150 200 250
Warping
Stresses [ksi]
Distance Along Girder [ft]
Warping Stresses Along Girder
Top Linear
Bottom Linear
Top Non‐Linear
Bottom Non‐Linear
‐4.000
‐3.000
‐2.000
‐1.000
0.000
1.000
2.000
3.000
4.000
0 50 100 150 200 250
Displacem
ents [in]
Distance Along Girder [ft]
Displacements Along Girder
Top Linear
Bottom Linear
Top Non‐Linear
Bottom Non‐Linear
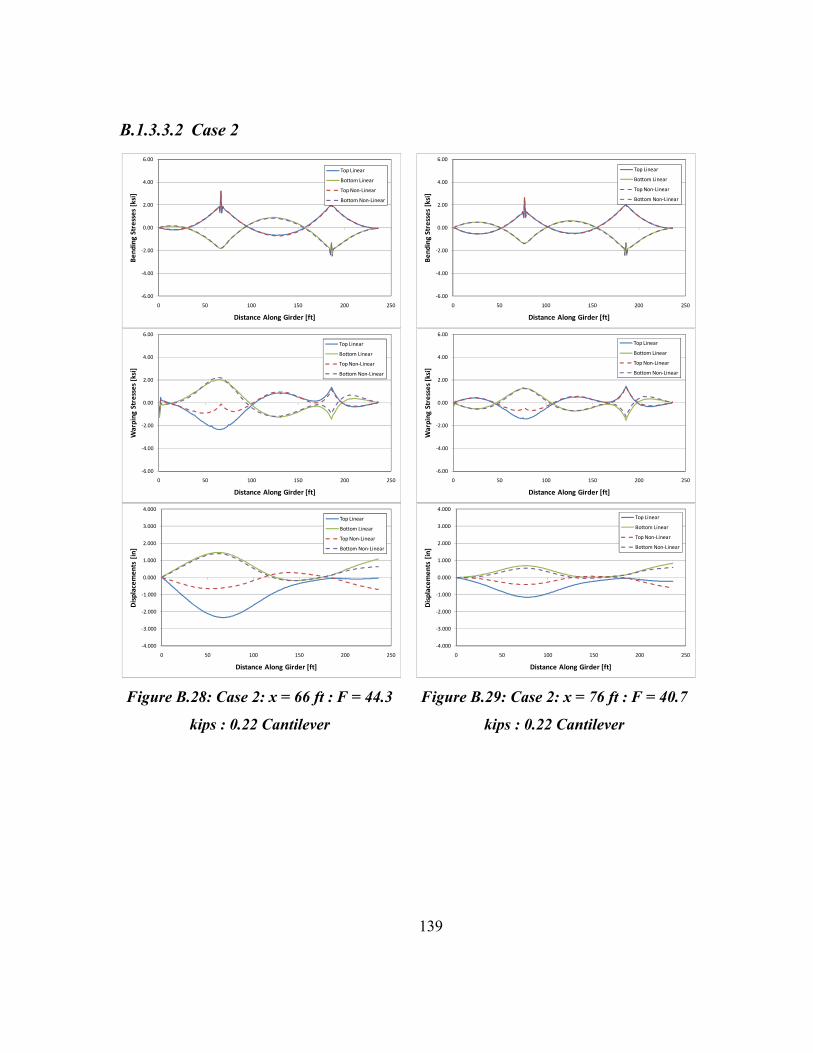
139
B.1.3.3.2 Case 2
Figure B.28: Case 2: x = 66 ft : F = 44.3
kips : 0.22 Cantilever
Figure B.29: Case 2: x = 76 ft : F = 40.7
kips : 0.22 Cantilever
‐6.00
‐4.00
‐2.00
0.00
2.00
4.00
6.00
0 50 100 150 200 250
Bend
ing Stresses [ksi]
Distance Along Girder [ft]
Top Linear
Bottom Linear
Top Non‐Linear
Bottom Non‐Linear
‐6.00
‐4.00
‐2.00
0.00
2.00
4.00
6.00
0 50 100 150 200 250
Warping
Stresses [ksi]
Distance Along Girder [ft]
Top Linear
Bottom Linear
Top Non‐Linear
Bottom Non‐Linear
‐4.000
‐3.000
‐2.000
‐1.000
0.000
1.000
2.000
3.000
4.000
0 50 100 150 200 250
Displacem
ents [in]
Distance Along Girder [ft]
Top Linear
Bottom Linear
Top Non‐Linear
Bottom Non‐Linear
‐6.00
‐4.00
‐2.00
0.00
2.00
4.00
6.00
0 50 100 150 200 250
Bend
ing Stresses [ksi]
Distance Along Girder [ft]
Top Linear
Bottom Linear
Top Non‐Linear
Bottom Non‐Linear
‐6.00
‐4.00
‐2.00
0.00
2.00
4.00
6.00
0 50 100 150 200 250
Warping
Stresses [ksi]
Distance Along Girder [ft]
Top Linear
Bottom Linear
Top Non‐Linear
Bottom Non‐Linear
‐4.000
‐3.000
‐2.000
‐1.000
0.000
1.000
2.000
3.000
4.000
0 50 100 150 200 250
Displacem
ents [in]
Distance Along Girder [ft]
Top Linear
Bottom Linear
Top Non‐Linear
Bottom Non‐Linear

140
Figure B.30: Case 2: x = 86 ft : F = 39.1
kips : 0.22 Cantilever
Figure B.31: Case 2: x = 96 ft : F = 39.6
kips : 0.22 Cantilever
‐6.00
‐4.00
‐2.00
0.00
2.00
4.00
6.00
0 50 100 150 200 250
Bend
ing Stresses [ksi]
Distance Along Girder [ft]
Top Linear
Bottom Linear
Top Non‐Linear
Bottom Non‐Linear
‐6.00
‐4.00
‐2.00
0.00
2.00
4.00
6.00
0 50 100 150 200 250
Warping
Stresses [ksi]
Distance Along Girder [ft]
Top Linear
Bottom Linear
Top Non‐Linear
Bottom Non‐Linear
‐4.000
‐3.000
‐2.000
‐1.000
0.000
1.000
2.000
3.000
4.000
0 50 100 150 200 250
Displacem
ents [in]
Distance Along Girder [ft]
Top Linear
Bottom Linear
Top Non‐Linear
Bottom Non‐Linear
‐6.00
‐4.00
‐2.00
0.00
2.00
4.00
6.00
0 50 100 150 200 250
Ben
ding
Stresses [ksi]
Distance Along Girder [ft]
Top Linear
Bottom Linear
Top Non‐Linear
Bottom Non‐Linear
‐6.00
‐4.00
‐2.00
0.00
2.00
4.00
6.00
0 50 100 150 200 250
Warping
Stresses [ksi]
Distance Along Girder [ft]
Top Linear
Bottom Linear
Top Non‐Linear
Bottom Non‐Linear
‐4.000
‐3.000
‐2.000
‐1.000
0.000
1.000
2.000
3.000
4.000
0 50 100 150 200 250
Displacem
ents [in]
Distance Along Girder [ft]
Top LInear
Bottom Linear
Top Non‐Linear
Bottom Non‐Linear

141
Figure B.32: Case 2: x = 106 ft : F = 42.1
kips : 0.22 Cantilever
‐6.00
‐4.00
‐2.00
0.00
2.00
4.00
6.00
0 50 100 150 200 250
Ben
ding
Stresses [ksi]
Distance Along Girder [ft]
Top Linear
Bottom Linear
Top Non‐Linear
Bottom Non‐Linear
‐6.00
‐4.00
‐2.00
0.00
2.00
4.00
6.00
0 50 100 150 200 250
Warping
Stresses [ksi]
Distance Along Girder [ft]
Top Linear
Bottom Linear
Top Non‐Linear
Bottom Non‐Linear
‐4.000
‐3.000
‐2.000
‐1.000
0.000
1.000
2.000
3.000
4.000
0 50 100 150 200 250
Displacem
ents [in]
Distance Along Girder [ft]
Top Linear
Bottom Linear
Top Non‐Linear
Bottom Non‐Linear

142
B.1.3.3.3 Case 3
Figure B.33: Case 3: x = 56 ft : F = 32.5
kips : 0.30 Cantilever
Figure B.34: Case 3: x = 66 ft : F = 28.4
kips : 0.30 Cantilever
‐6.000
‐4.000
‐2.000
0.000
2.000
4.000
6.000
0 50 100 150 200 250 300
Ben
ding
Stresses [ksi]
Distance Along Girder [ft]
Top Linear
Bottom Linear
Top Non‐Linear
Bottom Non‐Linear
‐6.000
‐4.000
‐2.000
0.000
2.000
4.000
6.000
0 50 100 150 200 250 300
Warping
Stresses [ksi]
Distance Along Girder [ft]
Top Linear
Bottom Linear
Top Non‐Linear
Bottom Non‐Linear
‐4.000
‐3.000
‐2.000
‐1.000
0.000
1.000
2.000
3.000
4.000
0 50 100 150 200 250 300
Displacem
ents [in]
Distance Along Girder [ft]
Top Linear
Bottom Linear
Top Non‐Linear
Bottom Non‐Linear
‐6.000
‐4.000
‐2.000
0.000
2.000
4.000
6.000
0 50 100 150 200 250 300
Ben
ding
Stresses [ksi]
Distance Along Girder [ft]
Top Linear
Bottom Linear
Top Non‐Linear
Bottom Non‐Linear
‐6.000
‐4.000
‐2.000
0.000
2.000
4.000
6.000
0 50 100 150 200 250 300
Warping
Stresses [ksi]
Distance Along Girder [ft]
Top Linear
Bottom Linear
Top Non‐Linear
Bottom Non‐Linear
‐4.000
‐3.000
‐2.000
‐1.000
0.000
1.000
2.000
3.000
4.000
0 50 100 150 200 250 300
Displacem
ents [in]
Distance Along Girder [ft]
Top Linear
Bottom Linear
Top Non‐Linear
Bottom Non‐Linear

143
Figure B.35: Case 3: x = 76 ft : F = 26.3
kips : 0.30 Cantilever
Figure B.36: Case 3: x = 86 ft : F = 25.9
kips : 0.30 Cantilever
‐6.000
‐4.000
‐2.000
0.000
2.000
4.000
6.000
0 50 100 150 200 250 300
Bend
ing Stresses [ksi]
Distance Along Girder [ft]
Top Linear
Bottom Linear
Top Non‐Linear
Bottom Non‐Linear
‐6.000
‐4.000
‐2.000
0.000
2.000
4.000
6.000
0 50 100 150 200 250 300
Warping
Stresses [ksi]
Distance Along Girder [ft]
Top Linear
Bottom Linear
Top Non‐Linear
Bottom Non‐Linear
‐4.000
‐3.000
‐2.000
‐1.000
0.000
1.000
2.000
3.000
4.000
0 50 100 150 200 250 300
Displacem
ents [in]
Distance Along Girder [ft]
Top Linear
Bottom Linear
Top Non‐Linear
Bottom Non‐Linear
‐6.000
‐4.000
‐2.000
0.000
2.000
4.000
6.000
0 50 100 150 200 250 300
Bend
ing Stresses [ksi]
Distance Along Girder [ft]
Top Linear
Bottom Linear
Top Non‐Linear
Bottom Non‐Linear
‐6.000
‐4.000
‐2.000
0.000
2.000
4.000
6.000
0 50 100 150 200 250 300
Warping
Stresses [ksi]
Distance Along Girder [ft]
Top Linear
Bottom Linear
Top Non‐Linear
Bottom Non‐Linear
‐4.000
‐3.000
‐2.000
‐1.000
0.000
1.000
2.000
3.000
4.000
0 50 100 150 200 250 300
Displacem
ents [in]
Distance Along Girder [ft]
Top Linear
Bottom Linear
Top Non‐Linear
Bottom Non‐Linear

144
Figure B.37: Case 3: x = 96 ft : F = 27.3
kips : 0.30 Cantilever
‐6.000
‐4.000
‐2.000
0.000
2.000
4.000
6.000
0 50 100 150 200 250 300
Bend
ing Stresses [ksi]
Distance Along Girder [ft]
Top Linear
Bottom Linear
Top Non‐Linear
Bottom Non‐Linear
‐6.000
‐4.000
‐2.000
0.000
2.000
4.000
6.000
0 50 100 150 200 250 300
Warping
Stresses [ksi]
Distance Along Girder [ft]
Top Linear
Bottom Linear
Top Non‐Linear
Bottom Non‐Linear
‐4.000
‐3.000
‐2.000
‐1.000
0.000
1.000
2.000
3.000
4.000
0 50 100 150 200 250 300
Displacem
ents [in]
Distance Along Girder [ft]
Top Linear
Bottom Linear
Top Non‐Linear
Bottom Non‐Linear

145
References 1. American Association of State Highway and Transportation Officials (AASHTO).
Guide Specifications for Horizontally Curved Bridges. Washington, D.C., 2003.
2. American Associations of State Highway and Transportation Officials (AASHTO).
AASHTO LRFD Bridge Design Specifications. Washington, D.C., 2007.
3. American Bridge Division. Handbook for Construction Engineers. Pittsburgh: United
States Steel Corporation, 1983.
4. American Institute of Steel Construction, Inc. (AISC). Steel Construction Manual,
13th Edition. Chicago: American Institute of Steel Construction, Inc., 2005.
5. Brennan, P.J. "Horizontally Curved Bridges First Annual Report: Analysis of
Horizontally Curved Bridges Through Three-Dimensional Mathematical Model and
Small Scale Structural Testing." First Annual Report: Research Project HPR-2(111)
(1970).
6. Canadian Institute of Steel Construction (CISC). Torsional Section Properties of Steel
Sections. Markham: Canadian Institute of Steel Construction (CISC), 2002.
7. Earls, C J. "Observations on Eigenvalue Buckling Analysis Within a Finite Element
Context." Proceedings - 2007 Annual Stability Conference (2007).
8. Farris, Jamie F. Behvaior of Horizontally Curved Steel I-girders, Masters Thesis.
Austin: University of Texas at Austin, 2008.
9. Howell, T D and C J Earls. "Curved Steel I-Girder Bridge Response during
Construction Loading: Effects of Web Plumbness." Journal of Bridge Engineering
(2007).
10. Mertz, Dennis R and Fred R Beckmann. "Steel Bridge Erection Practices." NCHRP
Synthesis 345 (2005).
11. NCHRP Synthesis 345. Steel Bridge Erection Practices, A Synthesis of Highway
Practice. Washington D.C.: Transportation Research Board of the National
Acadamies, 2005.

146
12. Schuh, Andrew C. Behavior of Horizontally Curved Steel I-girders During Lifting,
Masters Thesis. 2008: University of Texas at Austin, 2008.
13. Stith, Jason and Brian Petruzzi. "UT Bridge Beta 1.0 User Manual." Austin:
University of Texas at Austin, 2009.
14. Stith, Jason C. The Behavior of Curved I-girder Bridges During Construction, PhD
Dissertation. Austin: University of Texas at Austin, 2010.
15. Stith, Jason, et al. Guidence for Erection and Construction of Curved I-girder Bridges,
FHWA/TX-09/0-5574. Austin: Center for Transportation Research, 2009.
16. Stith, Jason. "The Behavior of Horitontally Curved Plate Girders During Lifting."
World Steel Bridge Symposium. San Antonio: American Institute of Steel
Construction, 2009.
17. Texas Steel Quality Council. Preferred Practices for Steel Bridge Design Fabrication
and Erection. Austin: Texas Department of Transportation (TxDOT), 2007.
18. Timoshenko, S P and J M Gere. Theory of Elastic Stability. 2nd Edition. New York:
McGraw-Hill Book Company, Inc., 1961.
19. Topkaya, Cem. Behavior of Curved Steel Trapazoidal Box Girders During
Construction, PhD Dissertation. Austin: University of Texas at Austin, 2002.
20. White, D W, et al. Development of Unified Equations for Design of Curved and
Straight Steel Bridge I Girders. Prepared for American Iron and Steel Institute
Transportation and Infrastructure Committee. Georgia Institute of Technology.
Atlanta: Professional Service Industries, Inc. and Federal Highway Administration,
2001.
21. Zhao, Q, et al. "Monitoring Steel Girder Stability for Safer Bridge Erection." Journal
of Performace of Constructed Facilities (2009).
22. Zhao, Qiuhong, et al. "Monitoring Steel Girder Stability for Safer Bridge Erection."
World Steel Bridge Symposium. San Antonio, 2009.

147
Vita
Brian James Petruzzi, son of James and Carol Petruzzi and brother of Heather
Petruzzi, was born in North Brunswick, New Jersey on February 23, 1986. At the age of
five, his family moved from New Jersey to Dublin, Ohio where he spent the rest of his
childhood. In May of 2008, Brian graduated from Dublin Coffman High School and in
August of the same year enrolled at Virginia Polytechnic Institute and State University
(Virginia Tech) in Blacksburg, Virginia. He graduated summa cum laude from Virginia
Tech with a Bachelor of Science in Civil Engineering in May of 2008. In August of
2008, he enrolled in graduate school at The University of Texas at Austin, where he
worked as a research assistant at the Phil M. Ferguson Structural Engineering Laboratory.
Upon graduation from The University of Texas, he will be moving to Washington, DC to
work for Weidlinger Associates, Inc.
Permanent Address:
135 Goldfinch Terrace
Hackettstown, NJ 07840
This document was typed by the author.