copyright © 2018 pearson education, inc. or its affiliates ... · pearson clinical assessments...
TRANSCRIPT

Copyright © 2018 Pearson Education, Inc. or its affiliates. All rights reserved.1
Attemointerpretation using case studies
Peter Entwistle, PhD, HSPPSenior Educational Consultant
Chris Huzinec,Senior Educational Consultant
Pearson Clinical Assessments
April 17th, 2018
1
Agenda
2
• What is the current state of the art in assessing attention?
• What tools from Pearson are available to assess attention?
• How is Attemo different from other tools?
• Recently normed?
• Can we expect research studies to be conducted with this program?
• What will the new technical manual tell us?
• How can I learn to interpret test results?
• What case studies do we have to help me understand this new test?
Attention Problems and Academic PerformanceWhich Students have attention problems in school?
• ADHD• TBI• LD• EBD• Underachievers?• FAS-FAE?
How does attentional issues affect academic performance?
• Reading, Comprehension?• Writing?• Arithmetic?• Listening?• Behavior?
Copyright © 2018 Pearson Education, Inc. or its affiliates. All rights reserved.2
Attention Assessment
How do you currently assess attention?
Performance Tests: Do you give the WISC-V Digit Span test?Do you administer anything else?
Rating Scales: Do you use the Conner’s scales?Is that all you need?
Posner & Petersen (1990 & 2012)Framework for understanding human attention:
1. Alerting system. ie. readiness to respond, or arousal. Questions to explore: is the subject engaged? Sleep deprived? Affected by alcohol or drugs?
2. Orienting system: priorities, or selective attention? Can you find what you are looking for? Does it change?
3. Executive system: is attention controlled or directed towards a goal? One sets up the task, the other maintains focus. Can you switch when you need to? Can you divide your attention between stimuli? Is there a spotlight focusing on the target?
Attention: What Should we Assess?• Do you look at engagement? Motivation? Alertness or arousal?
• Do you measure sustained attention?
• Divided attention?
• Switching attention?
• Do you look at consistency? Or variability over time?
• Impulsivity? Disinhibition?
• Distractibility?
• Accuracy?
• Do you measure movement?

Copyright © 2018 Pearson Education, Inc. or its affiliates. All rights reserved.3
Types of attention• Sustained attention refers to the
ability to keep your mind on a task for an extended period of time, or to remain vigilant;
• Divided attention means that youcan keep track of two or more things simultaneously say driving a car and having a conversation;
• Switching means you can be flexible in problems solving, and go back and forth between tasks like an alphabetic and numeric series…A1, B2, C3 D4 etc
• Can you maintain focus for a period of time and react consistently?
• Or does you mind wander? Do you focus on the wrong things…?
JOURNAL OF NEUROTHERAPYFIGURE 1. Types of attention represented on two hemispheres.
Upper image:Left hemisphere. Lower image: Right hemisphere.
Selective attention Sustained attention Alternating attention
Brief Review of Part I
Assessment of Sustained Attention?
“Promising laboratory measures of sustained attention may soon make it possible to evaluate ADHD symptoms more objectively in clinical settings….” Barkley, 1981
He was referring to CPTs. He said the hit rate is close to 80% and that is the best tool to identify children with attention problems. i.e. 80 percent of the time a CPT will correctly identify ADHD, but it will still miss 20% of children with an actual diagnosis of ADHD.
He provided further details in this 1997 article.

Copyright © 2018 Pearson Education, Inc. or its affiliates. All rights reserved.4
What is Attēmo?
The Attēmo™ Attention & Motion Test is a 15-minute visual attention continuous performance task (CPT) administered on an iPad® along with simultaneous measurement of the examinee’s head movement.
It is designed to objectively measure the three core symptoms of attention and behavior issues:
Attēmo OverviewAge Range Child Version: 6–12:11
Adolescent Version: 13–19:11Adult Version: 20 years and older
Qualification Level B
Completion Time Setup: 5 minutes,Administration: 15 minutes
Administration Downloadable iPad app
Scoring & Reporting Attēmo Clinician Portal (web-based)
Report Options Score Report, Progress Report
Publication Date 2017
Administration of Attēmo
12
15 Minute Attention and Motion Test –Child Test: 6 to 12:11Adolescent Test: 13 to 19:11Adult Test: 20 years and older

Copyright © 2018 Pearson Education, Inc. or its affiliates. All rights reserved.5
1. Examinee wears the headband and begins the visual attention test.
2. Various types of stars appear every few seconds at randomlocations around the screen.
3. Examinee should press the spacebar when a target star appears and not press any key when a non-target appears.
4. Attēmo’s advanced motion-tracking software records the movement of a small LED marker attached in front of the headband.
How Does it Work?
Why is Attēmo different?
• Attēmo directly observes key behaviors rather and provides
objective, quantifiable data to inform decision making. It can
be used along with standard rating scales to get a more
comprehensive diagnostic evaluation.
• Attēmo surpasses traditional CPTs by looking at
neurobehavioral issues beyond average attention, such as
the ability to control motion as well as dynamically fluctuating
attention states over the course of the test.
Attēmo Workflow – Review InstructionsThe test descriptions display. Review the instructions and press the space bar to confirm the bell tone/Bluetooth keyboard connection.

Copyright © 2018 Pearson Education, Inc. or its affiliates. All rights reserved.6
The test completes after 15 minutes and a confirmation message displays
Attemo ResultsAttēmo assesses control of attention and motor activity. What is the supporting research linking neurocognitive systems to sustained attention and motor regulation processes including attentional engagement, impulse control, postural/positional stability and kinetic processes ?If you already know this it will facilitate a detailed interpretation of Attēmo.
Attēmo is not constructed to diagnose a specific condition such as ADHD. Attēmo is designed to measure specific elements of attention and motor control affected in a variety of neurodevelopmental, neuropsychiatric, and neurological conditions.
The diagnosis of clinical disorders is facilitated by the use of cognitive measures; however, an individual examinee may present with a number of background, developmental, physical, or other conditions that impact performance on cognitive tests such as the Attēmo.
Attemo: does it only measure attention?An attention test is not simply a measure of attention ability, but is also a visual perceptual and visual scanning test when the information is presented visually. Does visual perception play a role? Yes, it is not completely eliminated. For individuals with any type of visual perceptual issue, the ability to rapidly distinguish among stars having very similar shapes could affect performance.
Similarly, individuals suffering injuries (e.g. TBI) may have neck, back, or physical injury or pain affecting postural and motion control that is not specifically related to neurocognitive functioning.
Language difficulties are unlikely to affect performance; however, significant comprehension problems could affect understanding the test instructions. Likewise, individuals with significant general cognitive impairments may not fully comprehend task instructions.

Copyright © 2018 Pearson Education, Inc. or its affiliates. All rights reserved.7
Do the results show problems in daily life?Analysis of performance on the Attēmo can verify problems evidenced in the examinee’s daily functioning. The profile of scores among the composite and scores within subdomains may suggest a global deficit or narrow band of attention and/or motor control difficulties.
Cognitive impairments may affect functions broadly, such as in dementia or intellectual deficiency, or they may be narrow such as a specific impairment in attentional engagement.
They may be specific (i.e., poor performance on one or two measures) or generalized (i.e., evidence of impairment across many domains). In many cases, the examinees overall general cognitive functioning will help determine if the observed deficits are distinct cognitive impairment or part of a generalized pattern of cognitive limitations
Results: what do the patterns of scores look like? • How are they graphed?• What is the speed of responses?• What do the inaccuracies look like?• Is there a regularity to the pattern of scores?• Is there a change over time? E.g. starting off well and then
getting worse?• How do the results compare to same age peers? • Is it easy to see very low scores? Answer: yes look for a red t
(t) next to the number…that is below the 16th percentile.
Attemo Reports OverviewThe Attēmo Report consists of four sections:
1. Motion Analysis: Graph and quantified analysis 2. Attention Response: Graph and quantified analysis 3. Attention State: Graph and quantified analysis 4. Composite Scores: Motion, Attention, and Global composite
scores
• The Attēmo report presents data in each section with graphs and tables, utilizing percentile ranks to compare specific scores to the normative range.
• The table reports the raw score for each test parameter—motion and attention.
• Raw scores are converted to percentile ranks for comparison to the community sample-referenced percentile ranges (scores between the 16th and 84th percentiles).
Copyright © 2018 Pearson Education, Inc. or its affiliates. All rights reserved.8
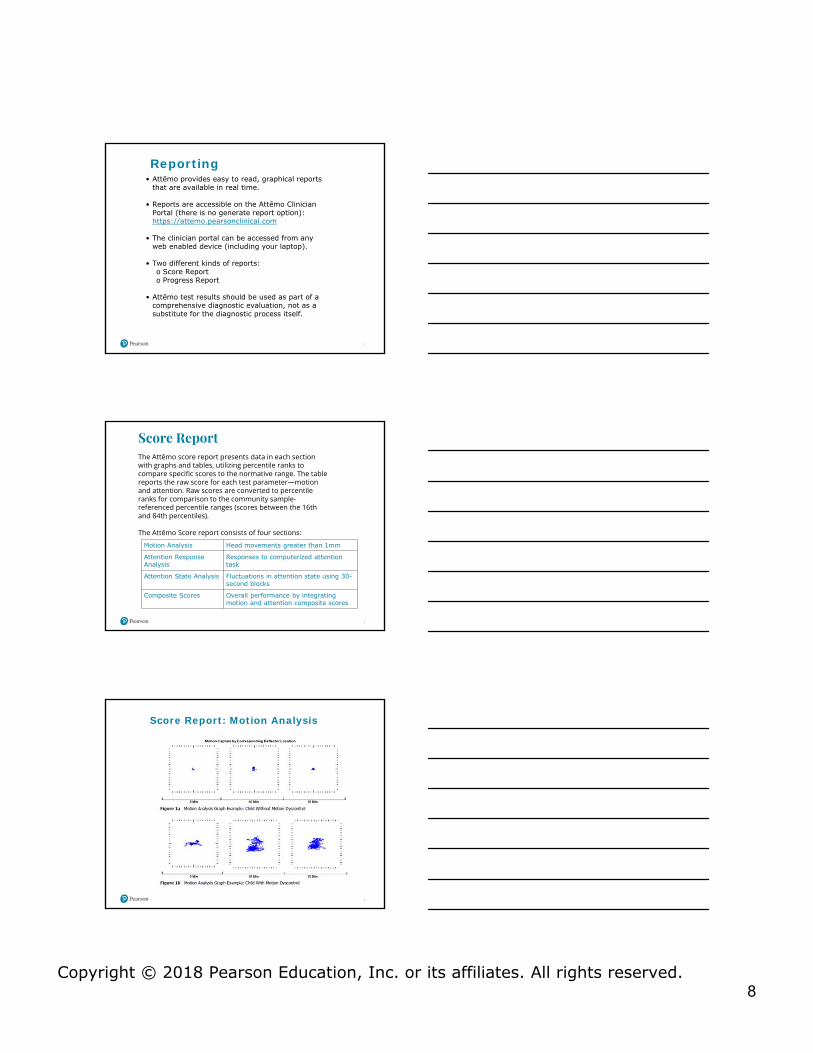
Reporting• Attēmo provides easy to read, graphical reports
that are available in real time.
• Reports are accessible on the Attēmo ClinicianPortal (there is no generate report option): https://attemo.pearsonclinical.com
• The clinician portal can be accessed from any web enabled device (including your laptop).
• Two different kinds of reports: o Score Reporto Progress Report
• Attēmo test results should be used as part of a comprehensive diagnostic evaluation, not as a substitute for the diagnostic process itself.
Score ReportThe Attēmo score report presents data in each section with graphs and tables, utilizing percentile ranks to compare specific scores to the normative range. The table reports the raw score for each test parameter—motion and attention. Raw scores are converted to percentile ranks for comparison to the community sample-referenced percentile ranges (scores between the 16th and 84th percentiles).
The Attēmo Score report consists of four sections:
Motion Analysis Head movements greater than 1mm
Attention Response Analysis
Responses to computerized attention task
Attention State Analysis Fluctuations in attention state using 30-second blocks
Composite Scores Overall performance by integrating motion and attention composite scores
Score Report: Motion Analysis
Copyright © 2018 Pearson Education, Inc. or its affiliates. All rights reserved.9
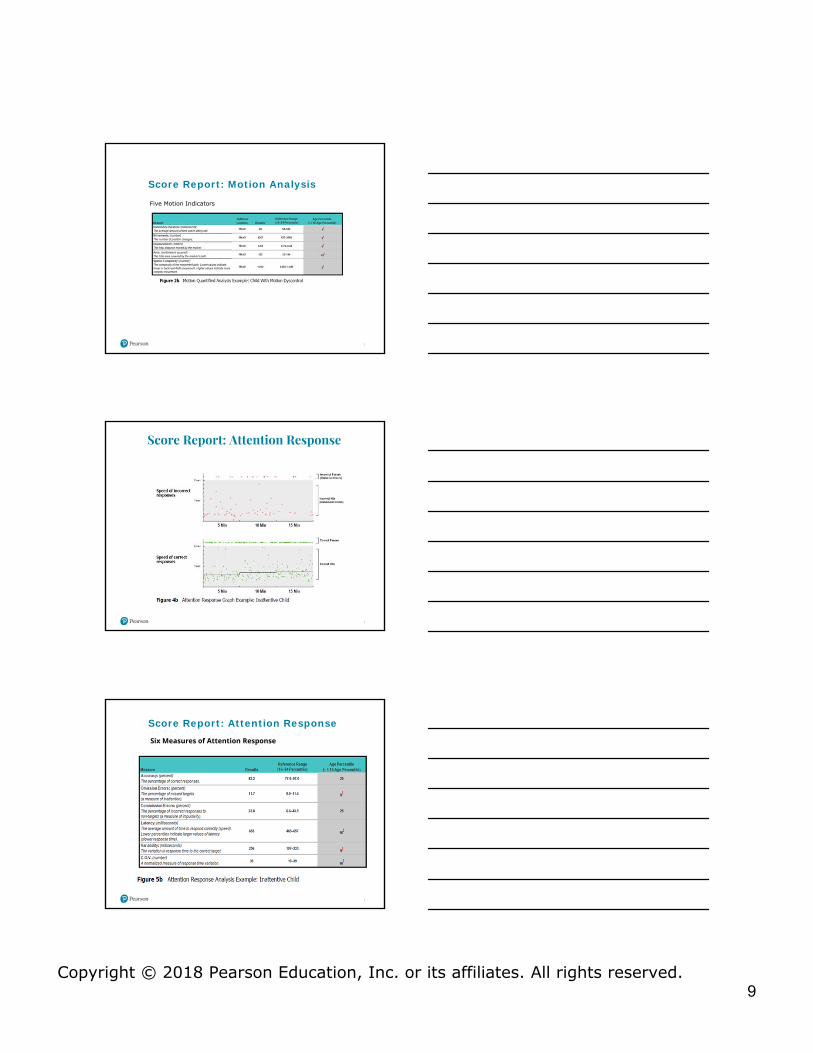
Five Motion Indicators
Score Report: Motion Analysis
Score Report: Attention Response
Six Measures of Attention Response
Score Report: Attention Response

Copyright © 2018 Pearson Education, Inc. or its affiliates. All rights reserved.10
Score Report: Attention State
Four Measures of Attention States
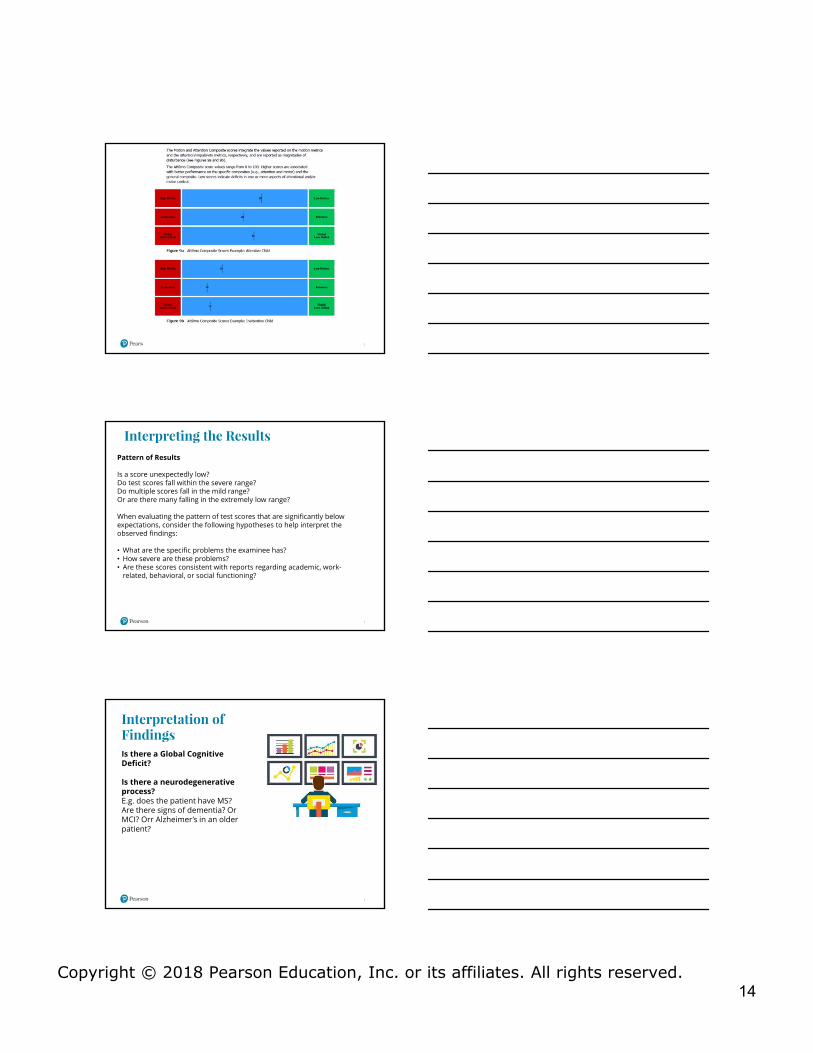
Score Report: Composite Scores
The Composite Scores section of the report provides an integrated view of the individual’s overall performance compared to his or her reference group.
Progress ReportCompares scores from each section across multiple administrations

Copyright © 2018 Pearson Education, Inc. or its affiliates. All rights reserved.11
Attēmo Report: Motion Analysis
Attēmo Report: Motion Analysis
Five Motion Indicators:• Immobility Duration: The average amount of time spent sitting still• Movements: The number of position changes greater than 1 millimeter• Displacement: The total distance moved by the marker• Area: The total area covered by the marker’s path• Spatial Complexity: The complexity of the movement path, with values typically from 1 to
2; higher values indicate more complex movement

Copyright © 2018 Pearson Education, Inc. or its affiliates. All rights reserved.12
Attēmo Report: Attention Response: Attentive
Attēmo Report: Attention Response: Inattentive

Copyright © 2018 Pearson Education, Inc. or its affiliates. All rights reserved.13
Attēmo Report: Attention StateFour Measures of Attention States:• Attentive: Good level of accuracy (greater than 85%) with limited omission or
commission errors• Impulsive: Good level of accuracy (greater than 85%) with significant commission
errors• Distracted: Fair level of accuracy with significant omission errors• Disengaged: Accuracy no better than chance (less than 50%) with individual
responding in a disengaged manner as reflected by these behaviors:• Random—no better than random chance• Minimal—few responses, less than random chance• Contrary—significantly worse than random chance
Copyright © 2018 Pearson Education, Inc. or its affiliates. All rights reserved.14
Interpreting the ResultsPattern of Results
Is a score unexpectedly low?Do test scores fall within the severe range?Do multiple scores fall in the mild range?Or are there many falling in the extremely low range?
When evaluating the pattern of test scores that are significantly below expectations, consider the following hypotheses to help interpret the observed findings:
• What are the specific problems the examinee has?• How severe are these problems?• Are these scores consistent with reports regarding academic, work-
related, behavioral, or social functioning?
Interpretation of FindingsIs there a Global Cognitive Deficit?
Is there a neurodegenerative process? E.g. does the patient have MS?Are there signs of dementia? Or MCI? Orr Alzheimer’s in an older patient?

Copyright © 2018 Pearson Education, Inc. or its affiliates. All rights reserved.15
What causative factors need to be considered?• Poor (uncorrected) visual acuity• Severely impaired upper-body gross- or fine-motor skills• General intellectual disability• Severely impaired language comprehension functioning• Poor effort• Lack of cooperation• Fatigue • Medication side effects (e.g. drowsiness)• Pain affecting ability to remain seated or affecting
concentration
Is there a primary attention activation deficit?• Is there a high level of Omissions? Commissions? Is
that due to a processing deficit?• Have you taken into account the patients’
background?• Co-morbid disorder?• Medications?• History?• Family stressors?• Is there a language problem? • Is there an executive deficit too? Or Working memory
problem?
Validity
• How do I know if the test is valid?• What features in the test results will
tell me that?• Is there consistency among
measures?• Is there only one low score?• Is there any external data to support
the one finding on the test?• Do we have external data to support
test observations and findings? For instance do teachers or parents report similar observations in other settings?

Copyright © 2018 Pearson Education, Inc. or its affiliates. All rights reserved.16
Case Studies
46
Case examples #1: Tim
BackgroundShowed high scores on the Brown ADD scalesSignificant inattention based on parent rated scaleNo medication treatment reported
Age: 17 Years OldGender: Male
Looking at the Attemo raw scores• What can we gather from the results• What do the scores indicate in relation to peers• Are there areas of functioning that might require
additional assessment?
Results

Copyright © 2018 Pearson Education, Inc. or its affiliates. All rights reserved.17
Attemo Test Results InterpretationComposite Scores
• Attention score shows in the lower range indicating moderate attention problems
• Motion score in the low average range showing likelihood of some mild motion control problems.
• Low Global composite score indicates behavior problems
Attention Analysis
• Mild attention problems
• Disengagement during last 5 minutes of test (Fatigue?)
Implications?
In the case of the security guard, this is the person that starts out doing a very good job but becomes tired over the course of the evening resulting in not seeing problems that are occurring.
Likewise, a driver of a car may start out energetic and attentive but after driving for an extended period they lose concentration and start to make errors (e.g., miss a turn or notice a red light too late) and become a risk.
Case example #2: Tom
BackgroundSignificant inattention, hyperactivity and overall symptomology as shown based on parent rated scaleNo medication treatment reported
Age: 8 Years OldGender: Male
Let us look at the results for this example.
Attemo Test Results

Copyright © 2018 Pearson Education, Inc. or its affiliates. All rights reserved.18
Attemo Test Results Interpretation
Motion Analysis Graph• Significant motion dyscontrol shown in graph and scores
• Red “t” indicates the client falls below the 16th percentile
• Indication of possible hyperactivity
• Appears to disengage at times-he is also impulsive
Attention Analysis
• Report shows mild problems with sustained attention with inability to stop rapid behavior
Attemo Test Results Con’t
Implications?
• Did he understand what he had to do? Did he try to comply with instructions?
• He is more disengaged than usual• He seems to have understood the task but did zone out at times• He was highly impulsive and at times inattentive• He failed to notice when something was not a real target• The random responses suggest he was “keeping an eye on it”
but was also distracted…like someone with an Iphone seeming to be paying attention, but not really!

Copyright © 2018 Pearson Education, Inc. or its affiliates. All rights reserved.19
Case example #3: Terry
Self report ADHD scale endorsed a significant number of ADHD symptoms
Age: 21 Years OldGender: Male
Composite Scores• Attention score shows in the lower
range indicating mild attention problems
• Motion score in the average range showing that there may be some mild motion control problems but not observable to others
• Low Global composite score indicates low average behavior control
Attemo Test Results
Attemo Test Results Con’t
Attention Analysis• Client made few errors but omission rates increased over course
of test and commission rates decreased• Attention state analysis attentiveness was best during initial part
of session and toward the end of the session.
• No evidence of problems with attention control with 3 out 3 scores were in the green to blue range
• Attention appears to fade in and out during middle

Copyright © 2018 Pearson Education, Inc. or its affiliates. All rights reserved.20
Terry, the 21 year old male: Implications?His objective performance was notable for mild problems with attention engagement and activation. His attention faded in and out over the course of testing. His performance was notable for slowed and variable reaction time consistent with a cognitive activation issues. Motion analysis was generally within expected limits for his age; however, he does show mild postural stability issues and may be prone to shifting in his seat during a boring task. However, the degree and frequency of shifting would not be significantly distracting to others around him.
In the security guard analogy, he would have problems due to inconsistent vigilance. Problems could arise due to a failure to notice suspicious activity or due to slowness to respond to information. In the driving example, this person would tend to miss information like signs to change lanes or miss turns because of being distracted and appearing to daydream.
Case examples #4: Female: SarahBackground: Presenting with significant symptoms of inattention and hyperactivity as rated by her parent.
Age: 11 Years OldGender: Female
Attemo Test Results

Copyright © 2018 Pearson Education, Inc. or its affiliates. All rights reserved.21
Case Study #4 Female: Sarah: Summary
Her performance was characterized by adequate attention skills with a tendency toward stop signal or distracted response errors that decayed rapidly a little over halfway through the test. The performance decrement was observed as a significant deactivation of attentional engagement (e.g. “fatigued” or “checked out”). She showed very high levels of hyperactivity throughout the test, so overactivity (e.g. “fidgety”) did not interfere with attention and may be a coping mechanism to help her get mentally activated.
Her profile suggests that she does have good attention skills for at least a moderate amount of time. However, it may take considerable mental energy for her to maintain attention and once she is fatigued she “mentally checks out”. In the case of the security guard, this is the person that starts out doing a very good job but becomes tired over the course of the evening resulting in not seeing problems that are occurring. Likewise, a driver of a car may start out energetic and attentive but after driving for an extended period they lose concentration and start to make errors (e.g., miss a turn or notice a red light too late) and become a risk. She does have a very high level of activity which could be a distraction to others around her.
Summary & Conclusions
• Interpretation is complex• It is rarely easy or straightforward• You will need to consider other factors, such visual acuity, ability
to understand directions, co-morbidity, severity, and compliance• You will need to ask what is the pattern of scores?• Was the client trying? Did they remain consistent throughout?• Is there supporting evidence from the family, or history?• Do we have other data to consider? E.g. test findings?