©copyright 2016 ryan m. ziels
TRANSCRIPT

©Copyright 2016
Ryan M. Ziels
Recovering biomethane from fats, oils, and greases: Examining the impacts of microbial ecology on anaerobic codigester stability and bioconversion
kinetics
Ryan M. Ziels
A dissertation
submitted in partial fulfillment of the
requirements for the degree of
Doctor of Philosophy
University of Washington
2016
Reading Committee:
H. David Stensel, Chair
David Stahl
David Beck
Program Authorized to Offer Degree:
Civil and Environmental Engineering

University of Washington
Abstract
Recovering biomethane from fats, oils, and greases: Examining the impacts of microbial ecology on anaerobic codigester stability and bioconversion kinetics
Ryan M. Ziels
Chair of the Supervisory Committee: Professor H. David Stensel
Civil and Environmental Engineering
Recovering biomethane with anaerobic digestion is of global interest to reduce carbon footprints
and improve process economics for the treatment of organic wastes. Fats, oils, and greases
(FOG) are desirable co-substrates for biomethane recovery because they have a substantially
higher energy density than wastewater treatment solids or livestock manure. Yet, biomethane
recovery from FOG codigestion at wastewater treatment plants or agricultural digesters can be
limited due to process inhibition caused by long-chain fatty acids (LCFA) accumulation.
Currently, there is a lack of understanding regarding the role of anaerobic digester microbial
communities in maintaining efficient conversion of LCFA into biomethane. The ultimate goal of
this research was to improve the reliability of biomethane recovery during FOG codigestion by
elucidating relationships between microbial community composition and LCFA bioconversion
kinetics.
The ability to accurately monitor LCFA-degrading populations in anaerobic digesters was
obtained by developing and validating quantitative PCR (qPCR) assays for the syntrophic LCFA

β-oxidizing genera of Syntrophomonas and Syntrophus. These qPCR assays were then utilized to
measure population changes in a codigester treating FOG and municipal wastewater treatment
solids at increasing FOG loadings for over 150 days. A relationship was developed that
correlated higher effluent LCFA concentrations with higher influent FOG loading rates
normalized to digester Syntrophomonas 16S rRNA gene concentrations. Subsequently, the
impacts of LCFA feeding strategy on LCFA bioconversion kinetics were investigated using
bench-scale codigesters that were either pulse-fed every two days or continuously-fed daily with
oleate. The results showed that Bacteria and Archaea community compositions in the
codigesters diverged based on LCFA feeding frequency and LCFA loading. Predictive models
for LCFA bioconversion kinetics were developed as a function of absolute concentrations of
selected Syntrophomonas taxa. DNA-stable isotope probing (SIP) based metagenomics
confirmed that different LCFA-degrading syntrophic bacteria were selected with different
codigester LCFA feeding frequencies. Taken together, the results of this study demonstrate that
higher codigester FOG loadings can be achieved by developing a higher biomass concentration
of LCFA-degrading syntrophic consortia, and that the codigester feeding strategy can be adjusted
to biologically select for LCFA-degrading populations with higher LCFA bioconversion kinetics
at high FOG loadings.

i
TABLE OF CONTENTS
List of Figures ................................................................................................................................ vi
List of Tables ................................................................................................................................ xii
Chapter 1. Overview ..................................................................................................................... 15
Chapter 2. Literature Background ................................................................................................. 20
2.1 Resource recovery potential of fats, oils, and grease by anaerobic treatment ................. 20
2.2 Characteristics of Long-chain Fatty Acids ...................................................................... 21
2.3 Bioconversion of Long-chain Fatty Acids Into Methane ................................................ 24
2.4 Inhibition of Long-chain Fatty Acid Degradation During Anaerobic Digestion ............. 30
2.5 Microbial Ecology of Long-chain Fatty Acid Degradation ............................................. 33
2.6 Effect of Microbial Community Diversity and Ecological Stability on Anaerobic
Digester Performance ............................................................................................................... 38
Chapter 3. Monitoring the dynamics of syntrophic beta-oxidizing bacteria during anaerobic
degradation of oleic acid by quantitative PCR ............................................................................. 41
3.1 Abstract ............................................................................................................................ 41
3.2 Introduction ...................................................................................................................... 42
3.3 Materials And Methods ................................................................................................... 45
3.3.1 Batch-fed Methanogenic Bioreactors Degrading Oleic Acid ................................... 45
3.3.2 Extraction and Quantification of Genomic DNA ..................................................... 47
3.3.3 Design and Validation of qPCR Primer and Probe Sets ........................................... 47
3.3.4 Quantitative PCR (qPCR) ......................................................................................... 50

ii
3.3.5 High-Throughput Amplicon Sequencing of Bacterial 16S rRNA Genes ................. 52
3.3.6 Analytical Methods ................................................................................................... 54
3.3.7 Statistical Analysis .................................................................................................... 55
3.4 Results .............................................................................................................................. 56
3.4.1 Validation of Syntrophomonas and Syntrophus Genus-Level qPCR Assays ........... 56
3.4.2 Specific Mineralization Rates of Oleic Acid in Methanogenic Bioreactors ............. 58
3.4.3 Quantitative Dynamics of Syntrophic β-Oxidizing Bacteria by qPCR .................... 59
3.4.4 Quantitative Dynamics of Methanogenic Archaea by qPCR ................................... 62
3.4.5 Dynamics of Bacterial Community by High-throughput Amplicon Sequencing of
16S rRNA Genes ................................................................................................................... 64
3.5 Discussion ........................................................................................................................ 66
3.6 Supplemental Information Available ............................................................................... 71
Chapter 4. Microbial community adaptation influences long-chain fatty acid conversion during
anaerobic codigestion of fats, oils, and grease with municipal sludge ......................................... 72
4.1 Abstract ............................................................................................................................ 72
4.2 Introduction ...................................................................................................................... 73
4.3 Materials and Methods ..................................................................................................... 76
4.3.1 Digester Operation .................................................................................................... 76
4.3.2 Batch Methanogenic Activity Assays ....................................................................... 78
4.3.3 Analysis of Microbial Community Structure ............................................................ 80
4.4 Results .............................................................................................................................. 83
4.4.1 FOG codigestion led to enhanced methane production and higher LCFA conversion
kinetics .................................................................................................................................. 83

iii
4.4.2 FOG codigestion selected for syntrophic β-oxidizing bacteria and specific
methanogenic archaea partners ............................................................................................. 86
4.4.3 Microbial community structure was related to reactor performance during FOG
codigestion ............................................................................................................................ 92
4.5 Discussion ........................................................................................................................ 95
4.6 Conclusions ...................................................................................................................... 99
4.7 Supplemental Information Available ............................................................................. 100
Chapter 5. Syntrophic community structure and biokinetics driven by long-chain fatty acid
feeding strategy in anaerobic codigestion ................................................................................... 101
5.1 Abstract .......................................................................................................................... 101
5.2 Introduction .................................................................................................................... 102
5.3 Materials and Methods ................................................................................................... 106
5.3.1 Anaerobic Digester Description and Operation: ..................................................... 106
5.3.2 Oleate Bioconversion Kinetics ............................................................................... 110
5.3.3 Oleate Inhibition of Aceticlastic Methanogenic Activity ....................................... 110
5.3.4 Analytical Methods ................................................................................................. 111
5.3.5 DNA Extraction and Quantification ....................................................................... 112
5.3.6 Quantitative PCR .................................................................................................... 112
5.3.7 16S rRNA Gene Amplicon Sequencing ................................................................. 112
5.3.8 Bioinformatics ......................................................................................................... 113
5.3.9 Regression Analysis ................................................................................................ 114
5.4 Results ............................................................................................................................ 114
5.4.1 Effect of LCFA OLR and feeding frequency on codigester performance .............. 114

iv
5.4.2 Impacts of LCFA OLR and feeding frequency on LCFA and acetate bioconversion
kinetics ................................................................................................................................ 116
5.4.3 Microbial community structure and diversity was altered by the codigester feeding
pattern 119
5.4.4 Oleate and acetate bioconversion kinetics were correlated to syntrophic and
methanogenic community abundance ................................................................................. 125
5.5 Discussion ...................................................................................................................... 127
5.5.1 Codigester stability and bioconversion kinetics were impacted by LCFA feeding
pattern 127
5.5.2 Codigester feeding pattern drove biological selection of syntrophic bacteria and
methanogen population structures ...................................................................................... 128
5.5.3 Relating bioconversion kinetics to microbial community structure ....................... 130
5.6 Conclusions .................................................................................................................... 131
5.7 Supplemental Information Available ............................................................................. 132
Chapter 6. DNA-stable isotope probing based metagenomics identifies key long-chain fatty acid
degrading populations in parallel anaerobic codigesters with different oleate feeding strategies
..................................................................................................................................................... 133
6.1 Abstract .......................................................................................................................... 133
6.2 Introduction .................................................................................................................... 134
6.3 Materials and Methods ................................................................................................... 137
6.3.1 Anaerobic Bioreactor Operation ............................................................................. 137
6.3.2 Stable Isotope Probing Incubations with Anaerobic Digester Sludge .................... 138
6.3.3 DNA Extraction and Density Gradient Centrifugation ........................................... 139

v
6.3.4 Quantitative PCR .................................................................................................... 140
6.3.5 16S rRNA Amplicon Sequencing ........................................................................... 141
6.3.6 Metagenomic Sequencing, Assembly, and Annotation .......................................... 142
6.3.7 Metagenomic Binning ............................................................................................. 142
6.3.8 Statistical Analysis .................................................................................................. 143
6.4 Results ............................................................................................................................ 144
6.4.1 Conversion of Oleate into Methane and Enrichment of 13C DNA ......................... 144
6.4.2 16S rRNA Amplicon Sequencing of DNA-SIP Samples ....................................... 147
6.4.3 DNA-SIP Metagenomic Sequencing ...................................................................... 149
6.5 Discussion ...................................................................................................................... 154
6.6 Supplemental Information Available ............................................................................. 160
Chapter 7. Conclusions and Future Outlook ............................................................................... 161
7.1 Major Findings and Engineering Significance .............................................................. 162
7.2 Future Outlooks ............................................................................................................. 164
Bibliography ............................................................................................................................... 168
Appendix A .................................................................................................................................. A1
Appendix B ................................................................................................................................... B1
Appendix C ................................................................................................................................... C1
Appendix D .................................................................................................................................. D1

vi
LIST OF FIGURES
Figure 2-1 Chemical structures of various LCFA commonly found in wastewater sources
(adapted from Sousa et al. 2009) .............................................................................. 23
Figure 2-2 Potential trophic interactions during conversion of LCFA into methane in anaerobic
digesters. ................................................................................................................... 25
Figure 2-3 LCFA metabolism and its regulation through the fad regulon (adapted from Fujita et
al., 2007). .................................................................................................................. 27
Figure 3-1 Changes in 16S rRNA gene concentrations of (A) Syntrophomonas and (B)
Syntrophus in methanogenic bioreactors; Ratio of 16S rRNA gene concentrations of (C)
Syntrophomonas and (D) Syntrophus to that of total Bacteria in bioreactors. Error bars
indicate one standard deviation based on biological (n=3) and technical replicates (n=2).
................................................................................................................................... 60
Figure 3-2 Correlation between the initial specific methane production rate during the oleic acid
batch degradation periods and the average relative abundance of (A) Syntrophomonas 16S
rRNA genes in bacterial community, and (B) methanogenic archaea 16S rRNA genes in
prokaryotic community. The total methanogenic archaea gene concentration was
determined as the sum of all methanogen target groups, and the prokaryotic gene
concentration was determined as the sum of methanogenic archaea and total Bacteria gene
counts. Error bars for the specific methane production rate indicate one standard deviation
based on biological replicates (n=3), and error bars for relative abundance values indicate
one standard deviation based on biological (n=3) and technical replicates (n=2). ... 61
Figure 3-3 (A) Change in the 16S rRNA gene concentration of the sum of all methanogenic
archaea targets in bioreactors degrading oleic acid; (B) Relative abundance of the 16S
rRNA gene concentration of each methanogenic target group relative to the sum of
methanogenic archaea targets; (n) = Methanomicrobiales; (�) = Methanosaetaceae;
(w)=Methanobacteriales; (⌃)=Methanosarcinaceae. Methanobacteriales and
Methanosarcinaceae remained below 1% relative abundance, while Methanococcales was

vii
not detected by qPCR of the bioreactor samples. Error bars indicate one standard deviation
based on biological (n=3) and technical replicates (n=2). ........................................ 63
Figure 3-4 Change in the relative abundance of each OTU that accounted for 1% or more of the
bacterial community during the bioreactor operation relative to initial conditions, as
determined by high-throughput amplicon sequencing of 16S rRNA genes. The left axis
shows a phylogenetic clustering of the OTU's based on sequence alignment with MUSCLE
(http://www.ebi.ac.uk). The right axis shows the genus level classification of each
representative OTU sequence. The scale on the color key is relative to the entire community
(e.g., an increase in relative abundance from 1% to 5% would be shown as +4%). The
relative abundance change of each OTU is shown for all reactor replicates (e.g. 1, 2, 3) at
days 7, 14, 21, 28, and 35. ........................................................................................ 65
Figure 3-5 Relative abundance of bacterial groups based on high-throughput amplicon
sequencing of 16S rRNA genes from bioreactor samples taken on days 0, 7, 14, 21, 28, and
35 showing (A) the 12 most abundant bacterial orders, and (B) the 20 most abundant
genera. The groups were ranked based on their maximum observed relative abundances, and
all other groups were combined and are shown as “Other”. The abundances of groups
shown at each time point represent an average of the triplicate bioreactors. ............ 66
Figure 4-1 Comparison of the FOG codigester and the control digester performance over
experimental period, based on (A) daily volatile solids loading rate, (B) daily methane
production, (C) digester pH, and (D) effluent LCFA concentrations. The LCFA
concentrations shown in (D) were calculated as the sum of palmitate, stearate, and oleate in
the digester effluent solids (error bars represent one standard deviation with n=4). 85
Figure 4-2 Maximum methane production rate in batch assays fed with (A) oleate and (B)
acetate, as determined by fitting the Gompertz growth model to observed methane
production in triplicate biological replicates. Error bars represent the standard error based on
the non-linear regression model fitting (n=3). .......................................................... 86
Figure 4-3 Relative fraction of 16S rRNA genes of the β-oxidizing bacterial genera, (A)
Syntrophomonas and (B) Syntrophus, within the total Bacteria 16S rRNA gene
concentration in the FOG codigester and control digester over the experimental period, as

viii
determined by qPCR. Error bars represent a standard deviation based on DNA extraction
replicates (n=3) and qPCR technical replicates (n=2) for each time point. .............. 88
Figure 4-4 Relative sequence fraction of the 13 most abundant genera within the FOG codigester
and control digester libraries produced from Illumina MiSeq sequencing of Bacteria 16S
rRNA gene amplicons. The triplicate bars shown for each sample day represent replicate
DNA extractions. The relative sequence fraction of all other genera were summed, and are
shown here as “Other”. ............................................................................................. 89
Figure 4-5 Change in the relative fraction of methanogenic Archaea 16S rRNA genes in
prokaryotic community of the control digester and FOG codigester. The total methanogenic
Archaea 16S rRNA gene concentration was determined as the sum of all methanogen
groups targeted in qPCR, and the prokaryotic gene concentration was determined as the sum
of methanogenic Archaea and total Bacteria 16S rRNA gene concentrations. ........ 91
Figure 4-6 Relative sequence fraction of the 13 most abundant genera within the FOG codigester
and control digester libraries produced from Illumina MiSeq sequencing of Archaea 16S
rRNA gene amplicons. The triplicate bars shown at each sample day represent replicate
DNA extractions. The relative sequence fraction of all other genera were summed, and are
shown here as “Other”. ............................................................................................. 91
Figure 4-7 Canonical correspondence analysis (CCA) plots based on (A) Bacteria and (B)
Archaea scaled OTU sequence counts in the codigester and control digester samples,
constrained by the four highest-scoring environmental gradients: daily methane production,
maximum methane production from oleate (qmax,oleate), maximum methane production from
acetate (qmax,acetate), and time (experimental days). The color of the outer circles represents
the sample digester source and the color of the inner circles represents the sample collection
day. The triplicate samples shown for each sample day are from replicate DNA extractions.
The length and direction of each arrow represents the scaling used for that environmental
gradient in the CCA model. ...................................................................................... 93
Figure 4-8 Specific effluent LCFA concentration of the FOG codigester versus the FOG to
syntroph feed ratio (F:MSynt). The exponential trend line was fitted with a non-linear
regression method in R v. 3.0.2. Error bars represent one standard deviation. ........ 94

ix
Figure 5-1 Comparison of (A) daily methane production and organic loading rate (OLR) for
Phase I experimental digesters; (B) daily methane production and OLR for Phase II
experimental digesters; (C) digester effluent acetate concentrations during Phase I; and (D)
digester effluent acetate concentrations during Phase II. Error bars represent one standard
deviation with n=4. ................................................................................................. 118
Figure 5-2 Relative read fractions of the (A) 12 most abundant Bacteria genera, and (B) 10 most
abundant Archaea genera in the 16S rRNA amplicon sequence libraries for the digesters
during Phase I. Genus abundance profiles from triplicate DNA extractions are shown for
each time point. ....................................................................................................... 120
Figure 5-3 Concentration of 16S rRNA genes in the Phase I digesters for (A) Bacteria, (B)
Archaea, and (C) Syntrophomonas, and in the Phase II digesters for (D) Bacteria, (E)
Archaea, and (F) Syntrophomonas. Error bars represent one standard deviation based on
triplicate DNA extractions and duplicate qPCR technical replicates. .................... 121
Figure 5-4 Correspondence analysis (CA) plots based on (A) Bacteria and
(B) Archaea normalized OTU sequence counts in the codigester and control digester
samples collected throughout Phases I and II. The color of each marker represents the
sample collection day and the shape of each marker represents the digester sludge source.
The triplicate samples shown for each sample day are from replicate DNA extractions. The
percentage shown along each axis represents the fraction of variance explained by that CA
axis. ......................................................................................................................... 122
Figure 5-5 Relative read fractions of the (A) 12 most abundant Bacteria genera, and (B) 10 most
abundant Archaea genera in the 16S rRNA amplicon sequence libraries for the digesters
during Phase II. Genus abundance profiles from triplicate DNA extractions are shown for
each time point. ....................................................................................................... 122
Figure 5-6 Relative read fractions of the 13 most abundant OTUs classified within the
Syntrophomonas genus of the digesters during Phases I and II based on 16S rRNA amplicon
sequencing. OTU abundance profiles from triplicate DNA extractions are shown at each
time point. ............................................................................................................... 124
Figure 5-7 Linear regression of observed qmax,oleate values versus (A) the total Syntrophomonas
16S rRNA gene concentration; and (B) predicted qmax,oleate values from a multiple-linear

x
regression model based on inferred 16S rRNA gene concentrations of 6 selected
Syntrophomonas OTUs. Inferred absolute abundances were calculated by multiplying the
relative fraction of each OTU within total Syntrophomonas read counts by the total
Syntrophomonas 16S rRNA gene concentration. Error bars represent one standard
deviation. ................................................................................................................. 126
Figure 6-1 Cumulative methane production (minus blank controls) for the microcosms fed with 12C-and 13C-labeled oleate over three repeated batch feeding periods. The number above
each plot indicates the batch oleate feed round. The black dashed line shows the theoretical
methane potential of the added oleate (25.5 mL CH4; based on 2.9 g COD/g oleate, 8 mM
concentration, and 35 °C temperature). The black solid line represents the predicted
methane production based on non-linear model fitting with a modified Gompertz equation
(see Supplemental Table D1). ................................................................................. 145
Figure 6-2 Total copies of Syntrophomonas 16S rRNA genes measured by qPCR for each
density gradient fraction recovered from isopycnic separation of DNA from 13C-incubated
microcosms and 12C-controls for both anaerobic codigesters. The filled circles indicate
gradient fractions that were pooled for subsequent 16S rRNA amplicon sequencing and
metagenomic sequencing. Both biological replicates are shown, and each point represents
an average of duplicate technical replicates. ........................................................... 146
Figure 6-3 Principle coordinate analysis (PCA) plot of OTU read counts from 16S rRNA
amplicon sequencing after regularized log transformation with DESeq2 (Love et al., 2014).
The different shapes indicate the codigestion reactor biomass source, and the colors
represent the isotope of oleate (13C or 12C) fed to the microcosms. Biological duplicate
samples are shown. ................................................................................................. 147
Figure 6-4 Cumulative read counts of the 11 most abundant genera in the heavy gradient
fractions of 13C-incubated samples and 12C-controls for both codigester sample sets, based
on 16S rRNA amplicon sequencing. Normalized read counts for all OTUs were calculated
with DESeq2 (Love et al., 2014) to correct for differences in sequencing depths between
samples, and were then aggregated at the genus level. ........................................... 149
Figure 6-5 Phylogenetic overview of differentially abundant genome bins identified in both
anaerobic codigester DNA-SIP metagenomes. The tree was constructed based on a

xi
concatenated alignment of conserved marker genes within the metagenomic contigs of each
bin using PhyloPhlAn (Segata et al., 2013). The color of each genome bin node represents
the codigester biomass source, and the height of the outer bars represent the genome bin
coverage in the heavy gradient fractions of the 13C-incubated samples and 12C-controls. The
tree was illustrated using GraPhLan (Asnicar et al., 2015). ................................... 152
Figure 6-6 Cumulative coverage values of KEGG ECs potentially involved in LCFA degradation
(KEGG map 00071), based on the coverage of all differentially abundant genome bins in
the 13C-incubated DNA-SIP metagenomes. Values from duplicate biological replicates are
shown for both codigesters, and the size of each marker is proportional to the log10 of the
EC read coverage. ................................................................................................... 154

xii
LIST OF TABLES
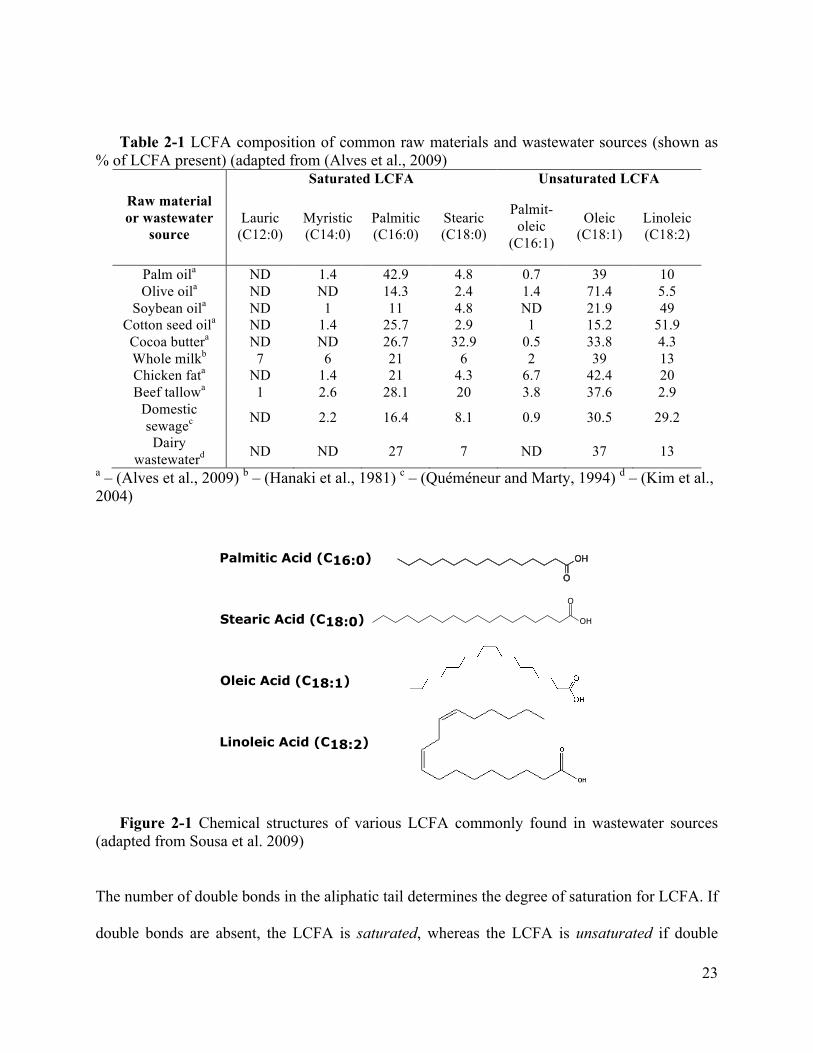
Table 2-1 LCFA composition of common raw materials and wastewater sources (shown as % of
LCFA present) (adapted from (Alves et al., 2009) ................................................... 23
Table 2-2 Stoichiometry and free energy for the conversion of palmitate and oleate into methane
(adapted from (Schink, 1997; Sousa et al., 2007a; Thauer et al., 1977) ................... 28
Table 2-3 Substrate utilization of isolated syntrophic bacteria capable of degrading C4-C18 fatty
acids (adapted from Sousa et al., 2009) .................................................................... 37
Table 3-1 Operating conditions and performance characteristics of methanogenic bioreactors
degrading oleic acid. (n=3) ....................................................................................... 46
Table 3-2 Characteristics of qPCR primers and hydrolysis probes developed to target
Syntrophomonas and Syntrophus genera .................................................................. 49
Table 4-1 Total influent volatile solids loading rate (VSLR), FOG VSLR, and the percent of
FOG VS in the feed versus time for the FOG codigester. Values in parentheses indicate one
standard deviation. .................................................................................................... 77
Table 5-1 Summary of oleate feed and total feed characteristics to the codigesters during Phase I
and II. Values in parentheses represent one standard deviation. ............................ 109
Table 5-2: Maximum conversion rates for oleate (qmax,oleate) and acetate (qmax,acetate) observed in
the batch kinetic assays with digester sludges collected throughout Phases I and II.119
Table 6-1 Taxonomic classification and characteristics for genome bins that were significantly
enriched (p < 0.01) in 13C metagenomes relative to 12C-controls for both codigester sample
sets. Only genome bins that were above 40% completion are included. ................ 150

xiii
ACKNOWLEDGEMENTS
This dissertation represents a period in my life filled with independent exploration, discovery,
and learning, which was supported by the help of many amazing people. Firstly, I give deep
thanks to my advisor, Dr. David Stensel, for his incredible mentorship, encouragement, and
guidance throughout my academic and personal pursuits. He taught me to think critically and
analytically, as well as how to enjoy a nice glass of wine when the day’s work is over. I am also
grateful for the opportunity to collaborate and work with my other committee members, Dr.
David Stahl and Dr. David Beck, who provided me with extremely helpful guidance throughout
this work. I also would like to thank my ‘host’ advisors from the international NSF GROW
programs, Dr. Bo Svensson and Dr. Diana Sousa—as they took on extra responsibilities to
mentor me, and I am deeply appreciative of their hospitality and guidance.
I was also very fortunate to receive amazing help from Masters research assistants throughout
this research. Songlin Wang was truly our ‘lab Mother’, and I thank her for her determination
and generosity—it was a blessing to have her help. I also appreciate the hard work of Xumo
Chen toward this research.
I would also like to thank all of my colleagues from Civil and Environmental Engineering (and
beyond) for many great scientific discussions and fun times, including (in no particular order):
Mariko Lust, Bryce Figdore, Dr. Mari Winkler, Wei Qin, Stephany Wei, Kathryn Cogert,
xiv
Nicolette Zhou, Peiran Zhou, Tess Young, Sudarshan Shetty, Jueeli Vaidya, Dr. Nejc Stopnisek,
Dr. Frederick von Netzer, Dr. Stuart Strand, and any others I may have forgotten.
I also would like to thank the continued support and involvement of the King County
Department of Natural Resources and Parks, Wastewater Treatment Division including John
Smyth, Bob Bucher, and Pardi Sukapanpotharam.
This research was supported by numerous funding sources including: the U.S. National Science
Foundation Graduate Research Fellowship, the U.S. National Science Foundation Graduate
Research Opportunities Worldwide Fellowship, the University of Washington Valle Fellowship,
the Water Environment Federation Canham Scholarship, the Department of Energy Joint
Genome Institute Community Science Program, and the U.S. EPA Grant STAR_N3R14A.
I am also grateful for the constant encouragement from my family and friends, who have all put
up with my lengthy talks about microbes and bioenergy during this time. And last but most
importantly, I would like to thank the unconditional support and love from my wife, Meika. She
has been my pillar of strength, and if it were not for her great patience (and awesome cooking
skills), this dissertation work would not have been possible.
15
Chapter 1. OVERVIEW
Energy recovery through the conversion of organic waste into biomethane with anaerobic
digestion is of great interest due to improved economics as well as smaller carbon footprints in
comparison to aeration and oxidation based treatment processes. The interest in utilizing fats,
oils, and greases (FOG) as co-substrates for anaerobic digestion is growing due to their higher
potential methane yield in comparison to waste primary sludge and waste activated sludge
typically fed to municipal wastewater sludge digesters, or dairy manure fed to agricultural
digesters. Thus, codigesting waste FOG with wastewater treatment sludge or livestock manure
has the potential to significantly increase biomethane recovery from existing anaerobic digester
operations. However, the long-chain fatty acids (LCFA) released during FOG hydrolysis are a
major concern for codigester stability due to their ability to inhibit methanogenic activity.
Microbial inhibition by LCFA could limit the maximum methane production obtainable during
FOG codigestion, or even result in digester failure. Therefore, understanding the factors
influencing LCFA conversion during FOG codigestion is important for determining maximum
allowable FOG loading rates that permit stable digester operation with enhanced biomethane
recovery. Currently, there is a lack of understanding regarding the role of anaerobic digester
microbial communities in maintaining efficient LCFA conversion into biomethane. The ultimate
goal of this research project was to improve the reliability of biomethane recovery during FOG
codigestion by elucidating relationships between microbial ecology and LCFA bioconversion
kinetics and digester stability.

16
When this research project began, there was a lack of molecular tools available to accurately
monitor the abundance of LCFA-degrading bacteria in anaerobic digesters, since they can be
present in digester sludge at concentrations below the detection limits of FISH and membrane
hybridization probes (Stams et al., 2012). Based on this knowledge gap, the initial research
objective was to develop sensitive molecular tools to quantify and monitor the growth dynamics
of syntrophic β-oxidizing bacteria during LCFA degradation. Quantitative PCR (qPCR) assays
were developed and validated to target the syntrophic LCFA-degrading bacterial genera
Syntrophomonas and Syntrophus. The assays were applied to measure the growth of syntrophic
β-oxidizing bacteria in oleate-fed microcosms inoculated with anaerobic digester sludge. This is
the topic of the research paper in Chapter 3: “Monitoring the dynamics of syntrophic β-
oxidizing bacteria during anaerobic degradation of oleic acid by quantitative PCR.”
Once the ability to monitor absolute abundances of syntrophic LCFA-degrading bacteria was
established, the objective of the next research phase was to examine potential relationships
between LCFA removal efficiency and the concentration of syntrophic β-oxidizing bacteria
during FOG codigestion with municipal wastewater sludge. Such relationships are investigated
in Chapter 4: “Microbial community adaptation influences long-chain fatty acid conversion
during anaerobic codigestion of fats, oils, and grease with municipal sludge.“ Microbial
community structure was monitored in a codigester treating waste restaurant oil and municipal
wastewater treatment sludge in parallel with a control digester for over 150 days. A relationship
was established between effluent LCFA concentrations and the FOG loading rate normalized to
Syntrophomonas 16S rRNA genes within the codigester.

17
The finding that effluent LCFA concentrations were positively correlated to the ratio of the FOG
loading rate to Syntrophomonas 16S rRNA gene concentrations during codigestion indicated that
the overall LCFA bioconversion rate of syntrophic bacteria and methanogenic archaea together
could establish the permissible FOG loading rate that prevents inhibitory LCFA accumulation.
However, it remained unknown whether different communities of syntrophic bacteria and
methanogenic archaea with different LCFA bioconversion kinetics could be biologically selected
in codigesters at high FOG loadings, and whether the codigester LCFA feeding frequency could
impact the LCFA-degrading community. Thus, the objective of the next phase of research was to
investigate the effects of the codigester LCFA feeding frequency on LCFA bioconversion
kinetics, codigester stability, and the composition of syntrophic LCFA-degrading consortia. A
secondary research objective was to develop predictive models for LCFA-conversion kinetics
based on syntrophic LCFA-degrading bacteria community structure and abundance. LCFA
bioconversion kinetics and microbial community structure were compared in two parallel
anaerobic codigesters receiving oleate (C18:1 LCFA) in either a pulse-fed or a continuous-fed
regime. These objectives are addressed in Chapter 5: “Syntrophic community structure and
bioconversion kinetics are driven by long chain fatty acid feeding strategy in anaerobic
codigestion.”
The results in Chapter 5 showing that the codigester LCFA feeding frequency impacted the fine-
scale composition of β-oxidizing Syntrophomonas communities were based on time-series 16S
rRNA gene amplicon sequencing analysis. However, a comparison of the active LCFA-
degrading populations between the codigesters was lacking, and was necessary to address the
mechanism in which digester feeding strategies impacted LCFA-degradation biokinetics. The

18
objective of the next phase of research was thus to apply DNA-SIP combined with metagenomic
sequencing to conduct a genomic-based comparison of the active oleate degrading populations in
the two parallel codigesters fed with LCFA at different frequencies. This research objective is
addressed in Chapter 6: “DNA-stable isotope probing based metagenomics identifies key long-
chain fatty acid degrading populations in parallel anaerobic codigesters with different oleate
feeding strategies.” A comparison of active syntrophic population genome bins between the
codigesters was conducted using differential coverage binning on DNA-SIP 13C and 12C
metagenomes, and the results were also validated with 16S rRNA gene amplicon sequencing.
The results showed that Syntrophomonas were predominantly enriched in the metagenomes and
16S rRNA sequence libraries of the 13C-incubated samples, and phylogenetically distinct
Syntrophomonas were observed within each codigester.
Chapter 2 provides an overview of relevant literature for this research project, including an
introduction to the importance of energy recovery through anaerobic wastewater treatment, the
current state of understanding on LCFA inhibition and microbial LCFA conversion, and
implications of microbial ecology and stability for anaerobic digester performance. The methods,
results, and conclusions of this study are presented in Chapters 3-4 as published papers, and in
Chapters 5-6 as manuscripts prepared for submission. Future research needs to develop
biokinetic models for FOG codigestion based on ecological principles and thermodynamics are
discussed in Chapter 7. Supplemental data for the research presented in Chapters 3-6 is presented
in Appendices A-D.

19
The publication associated with the research in Chapter 3 is:
Ziels, R. M., Beck, D. A., Martí, M., Gough, H. L., Stensel, H. D., & Svensson, B. H.
(2015). Monitoring the dynamics of syntrophic β-oxidizing bacteria during anaerobic
degradation of oleic acid by quantitative PCR. FEMS microbiology ecology, 91(4), doi:
http://dx.doi.org/10.1093/femsec/fiv028
The publication associated with the research in Chapter 4 is:
Ziels, R.M., Karlsson, A., Beck, D.A., Ejlertsson, J., Yekta, S.S., Bjorn, A., Stensel, H.D.
& Svensson, B.H., (2016). Microbial community adaptation influences long-chain fatty
acid conversion during anaerobic codigestion of fats, oils, and grease with municipal
sludge. Water Research, 103, doi:http://dx.doi.org/10.1016/j.watres.2016.07.043
The planned publication associated with the research in Chapter 5 is:
Ziels, R.M., Beck, D.A., Stensel, H.D. (2016). Syntrophic community structure and
biokinetics driven by long-chain fatty acid feeding strategy in anaerobic codigestion.
Prepared for submission to Water Research.
The planned publication associated with the research in Chapter 6 is:
Ziels, R.M., Beck, D.A., Stensel, H.D. (2016). DNA-stable isotope probing based
metagenomics identifies key long-chain fatty acid degrading populations in parallel
anaerobic codigesters with different oleate feeding strategies. Prepared for submission to
Environmental Microbiology.

20
Chapter 2. LITERATURE BACKGROUND
2.1 RESOURCE RECOVERY POTENTIAL OF FATS, OILS, AND GREASE BY ANAEROBIC
TREATMENT
Anaerobic digestion is commonly used at municipal wastewater treatment plants (WWTPs) as
well as agricultural dairy operations to process waste solids and generate renewable energy as
biomethane. A growing worldwide interest in anaerobic digestion has led to the implementation
of approximately 9,000 full-scale facilities in Europe and over 3,000 facilities in the U.S. by
2012 (Guo et al., 2015). Approximately 9.1 billion kW-h of electricity was generated from
biogas in the U.S. in 2012, with approximately 47 to 95 billion kW-h of electricity generated
worldwide (Guo et al., 2015).
The combination of multiple organic waste streams and feedstocks in the influent to an anaerobic
digester is termed codigestion. More recently, codigesting exogenous organic wastes with
municipal sludge or dairy manure is gaining interest for increased biomethane recovery and
improved process economics (Bishop and Shumway, 2009). Lipid-rich waste streams, such as
fats, oils, and greases (FOG) originating from municipal sewer grease traps or industrial
processes, are desirable substrates for anaerobic codigestion due to their high energy content
(Labatut et al., 2011). The impact of FOG codigestion on renewable energy recovery and carbon
footprints of municipalities is thus worth consideration. A city of 500,000 persons is expected to
produce approximately 90 million pounds of waste FOG annually (Wiltsee, 1998). Assuming a
specific biological methane yield of 0.4 L-CH4/g for FOG (Labatut et al., 2011), the above
production of FOG would correspond to a potential of 10.3 MW if only 50% of the waste FOG
were sent to anaerobic digesters, which is roughly enough to power 10,000 homes per year (U.S.

21
DOE, 2010) or ~6% of the population with 3 persons per home. Importantly, this renewable
methane recovery also would reduce CO2 emissions by 16,000 tons/year by replacing fossil fuel-
derived natural gas (U.S. DOE, 2010). Since waste FOG has 30-50 times the energy density (per
volume) as traditional anaerobic digester feed sludge sources (Labatut et al., 2011), the increased
reactor volume capacity required for codigestion is negligible. Previous work has demonstrated
the potential for substantial increases in digester methane production of 2.6- to 7.3-times with
FOG addition from 30 to 60% (v/v) of the feed volatile solids (Kabouris et al., 2009; Luostarinen
et al., 2009; Wan et al., 2011; Wang et al., 2013). Therefore, waste FOG represents a valuable
energy-rich resource that could be effectively recovered as renewable biomethane with little
impact on the solids processing capacity of existing anaerobic digesters.
In addition to increasing renewable methane production, disposing of FOG through codigestion
would also alleviate wastewater treatment systems of a major nuisance product. FOG is known
to accumulate and congeal on pipe walls, contributing to the obstruction of sewer collection lines
(He et al., 2011). Approximately 50-75% of reported sewer overflows were caused by FOG
accumulation within the collection system (Keener et al., 2008). FOG from municipal grease
traps is typically disposed via landfilling (Davidsson et al., 2008). Codigesting trapped FOG with
municipal sludge or dairy manure at existing digestion facilities could help to recover resources
(energy) from a problematic waste stream that currently hinders sewer collection infrastructure.
2.2 CHARACTERISTICS OF LONG-CHAIN FATTY ACIDS
Lipids are comprised of long-chain fatty acids (LCFA) that are linked to glycerol, alcohols, or
other groups (i.e. sugars and sterols) with an ether or ester bond. Fats and oils are a subgroup of
22
lipids that have their alcohol group (glycerol) esterified with LCFA, and take the form of
triglycerides (a glycerol backbone esterified with 3 LCFA) (Alves et al., 2009). Fats are
triglycerides that are solid at room temperature, while oils are triglycerides that are liquid at
room temperature. The size and structure of the LCFA in the triglyceride dictate whether it takes
the form of a fat or an oil.
LCFA are organic molecules that include a carboxylic head and an aliphatic tail. LCFA are
typically defined as carboxylic acids with more than 12 carbon atoms (Sousa et al., 2009). LCFA
comprise a major component of fats, accounting for up to 90% of the total organic carbon
(Hanaki et al., 1981), and are also major ingredients in soaps due to their surfactant properties
(Johansson and Svensson, 2001). The LCFA-composition of typical lipid containing wastewaters
and raw materials is summarized in Table 2-1. Palmitic, stearic, oleic, and linoleic acids are the
most abundant saturated and unsaturated LCFA in wastewaters and food sources (Table 2-1).
Oleic acid is the most common LCFA found in domestic wastewater (Table 2-1). These LCFA
commonly found in wastewater sources are depicted in Figure 2-1.
23
Table 2-1 LCFA composition of common raw materials and wastewater sources (shown as % of LCFA present) (adapted from (Alves et al., 2009)
Raw material or wastewater
source
Saturated LCFA Unsaturated LCFA
Lauric (C12:0)
Myristic (C14:0)
Palmitic (C16:0)
Stearic (C18:0)
Palmit-oleic
(C16:1)
Oleic (C18:1)
Linoleic (C18:2)
Palm oila ND 1.4 42.9 4.8 0.7 39 10 Olive oila ND ND 14.3 2.4 1.4 71.4 5.5
Soybean oila ND 1 11 4.8 ND 21.9 49 Cotton seed oila ND 1.4 25.7 2.9 1 15.2 51.9 Cocoa buttera ND ND 26.7 32.9 0.5 33.8 4.3 Whole milkb 7 6 21 6 2 39 13 Chicken fata ND 1.4 21 4.3 6.7 42.4 20 Beef tallowa 1 2.6 28.1 20 3.8 37.6 2.9
Domestic sewagec ND 2.2 16.4 8.1 0.9 30.5 29.2
Dairy wastewaterd ND ND 27 7 ND 37 13
a – (Alves et al., 2009) b – (Hanaki et al., 1981) c – (Quéméneur and Marty, 1994) d – (Kim et al., 2004)
Figure 2-1 Chemical structures of various LCFA commonly found in wastewater sources (adapted from Sousa et al. 2009)
The number of double bonds in the aliphatic tail determines the degree of saturation for LCFA. If
double bonds are absent, the LCFA is saturated, whereas the LCFA is unsaturated if double
OH
O
Palmitic Acid (C16:0)
Stearic Acid (C18:0)
Oleic Acid (C18:1)
Linoleic Acid (C18:2)
24
bonds are present. Commonly, the double bonds in LCFA found in nature are in the cis
configuration (Sousa et al., 2009). The addition of a double bond to the alkyl chain limits the
flexibility of the LCFA relative to its saturated counterpart (Kanicky and Shah, 2002). For
instance, stearic acid, a C18 saturated fatty acid, has a limiting area of 21 Å2, while oleic acid, a
C18 unsaturated fatty acid, has a limiting area of 32 Å2 (Kanicky and Shah, 2002). The pKa of
LCFA is also affected by the degree of saturation as well as chain length. As the alkyl chain
length increases, the van der Waals interactions between adjacent LCFA molecules increases,
thus bringing their carboxylic heads closer in proximity and shielding hydrogen atoms from
protonating the acids (Kanicky and Shah, 2002). pKa values measured by titration range from
8.6 in palmitic acid (C16:0) to 9.0 for stearic acid (C18:0), thus demonstrating the effect of chain
length on pKa (Christodoulou and Rosano, 1968; Kanicky et al., 2000). It was also shown that
the larger limiting areas of LCFA with double bonds causes the pKa to decrease, as oleic acid
(C18:1) and lineoleic acid (C18:2) had lower pKa than stearic acid (C18:0) (Kanicky and Shah,
2002). The aqueous solubilities of LCFA are low and are also impacted by the alkyl chain length,
with longer chain lengths leading to lower solubility. Double bonds present in LCFA also
increase the solubility. The aqueous solubility of the saturated LCFA palmitic (C16:0) and stearic
(C18:0) acids are 7.2 and 2.9 mg/L at 20 °C, respectively (Ralston and Hoerr, 1942), while the
unsaturated linoleic acid (C18:2) has a solubility of 160 mg/L (Mabrouk and Jr, 1961).
2.3 BIOCONVERSION OF LONG-CHAIN FATTY ACIDS INTO METHANE
Syntrophy is a thermodynamically-based mutualistic partnership between two different species in
which the pool of intermediate metabolites must be kept at a very low concentration in order for
growth of the two partners to occur. LCFA are converted into methane through a syntrophic
partnership between acetogenic β-oxidizing bacteria and methanogenic archaea (Schink, 1997;

25
Sousa et al., 2009). Interspecies hydrogen/formate transfer between syntrophic bacteria and
methanogenic archaea plays an important role in the degradation of LCFA in methanogenic
environments (Schink, 1997). Beta-oxidation involves the cleavage of acetate, hydrogen and/or
formate from the fatty acid, producing ATP through substrate-level phosphorylation (Schink,
1997). An overall scheme showing the steps involved in converting LCFA into methane is
shown in Figure 2-2.
Figure 2-2 Potential trophic interactions during conversion of LCFA into methane in anaerobic digesters.
The regulation of bacterial LCFA fatty acid metabolism has been mainly studied using the model
organism Escherichia coli (Fujita et al., 2007). E. coli is capable of utilizing fatty acids with
various chain lengths as the sole carbon and energy sources, yet it requires a terminal respiratory
electron acceptor such as oxygen or nitrate for growth (Campbell et al., 2003; Fujita et al., 2007).
After uptake, E. coli either degrades LCFA via β-oxidation or utilizes the fatty acids as
precursors for membrane phospholipid biosynthesis (Fujita et al., 2007). The fad regulon
encodes for enzymes utilized in the LCFA degradation pathway, including the transport and
activation of fatty acids, as well as their activation and cleavage via β-oxidation into acetyl-CoAs
(Figure 2-3). Briefly, LCFA are transported across the cell via an outer membrane protein, FadL,
and an acyl-CoA synthetase, FadD (Campbell et al., 2003). E. coli contains a single acyl-CoA
synthetase (FadD) that has a broad substrate specificity, whereas eukaryotic systems possess
UnsaturatedFatty Acid
SaturatedFatty Acid
Formate
Acetate
H2
Oleate (C18:1) Stearate (C18)Palmitate (C16)
Hydrogenation Beta-oxidation
Methane
Methanogenesis

26
multiple acyl-CoA synthetases with different fatty acid chain length specificities (Campbell et
al., 2003; Fujita et al., 2007). In the initial step of LCFA degradation, acyl-CoA is converted to
enoyl-CoA via the acyl-CoA dehydrogenase, FadE (Campbell et al., 2003). The remaining steps
of LCFA degradation involves hydration, oxidation and thiolytic cleavage by the tetrameric
complex consisting of two copies each of FadB and FadA (Pramanik et al., 1979). The β-
oxidation pathway acts in a cyclic manner, with each cycle shortening the input acyl-CoA by two
carbon atoms to give acetyl-CoA (Figure 2-3).
The metabolic pathway for the degradation of unsaturated fatty acids by β-oxidation differs
slightly from saturated fatty acids. After a given number of cycles through the β-oxidation
pathway, the double bond present in unsaturated fatty acids must be removed before subsequent
hydration, oxidation and thiolytic cleavage in the β-oxidation cycle. Two pathways have been
proposed for the degradation of double bonds during LCFA β-oxidation: (1) the isomerase-
dependent pathway involves one auxiliary enzyme, Δ3,Δ2-enoyl-CoA isomerase (enoyl-CoA
isomerase); (2) the reductase-dependent pathway requires three auxiliary enzymes, enoyl-CoA
isomerase, 2,4-dienoyl-CoA reductase, and Δ3,5,Δ2,4-dienoyl-CoA isomerase (dienoyl-CoA
isomerase) (Ren et al., 2004). In E. coli, the isomerase-dependent pathway is thought to be
dominant pathway for double bond removal during oleate degradation (Ren et al., 2004). In
addition to double bond removal coupled to the classical LCFA β-oxidation pathway, another
possible mechanism for the saturation of LCFA (length Cn) was shown to be coupled to the
production of a Cn-2 saturated fatty acid (Cavaleiro et al., 2016). This alternative pathway was
found to be independent of hydrogen partial pressure and methanogenesis, suggesting that non-

27
syntrophic organisms could execute double bond saturation prior to syntrophic conversion of the
excreted Cn-2 saturated fatty acid (Cavaleiro et al., 2016).
Figure 2-3 LCFA metabolism and its regulation through the fad regulon (adapted from Fujita et al., 2007).
As mentioned, the formation of methane from LCFA involves a syntrophic partnership of
proton-reducing acetogenic bacteria, which utilize the β-oxidation pathway to convert LCFA into
acetate and formate/hydrogen (Weng and Jeris, 1976), along with aceticlastic and
hydrogenotrophic methanogenic archaea (Schink, 1997; Sousa et al., 2009). The consumption of
hydrogen and/or formate is essential to maintain favorable thermodynamics of LCFA conversion
(Schink, 1997), as well as prevent hydrogenase inhibition from hydrogen accumulation (Garcia
et al., 2000). The Gibbs free energies of LCFA conversion into methane are shown below in
Table 2-2, and demonstrate the importance of low hydrogen concentrations for maintaining
energy-yielding conditions.

28
Table 2-2 Stoichiometry and free energy for the conversion of palmitate and oleate into methane (adapted from (Schink, 1997; Sousa et al., 2007a; Thauer et al., 1977)
LCFA Equation ΔG°’ (kJ/mole)a
ΔG’ (kJ/mole)b
Palmitate C16H31O2
- + 14H2O → 8C2H3O2- + 14H2 +
8H+
+419 -81
Oleate C18H33O2- + 16H2O → 9C2H3O2
- + 14H2 + 9H+ +391 -131
Methanogenic Substrate Equation ΔG°’
(kJ/mole)a ΔG’
(kJ/mole)b Acetate C2H3O2
- + H2O → HCO3- + CH4 -31 -19
Hydrogen and CO2
4H2 + HCO3- + H+ → CH4 + 3H2O -136 -20
a - Gibbs free energies (at 25°C) under standard conditions (solute concentrations of 1 M and gas partial pressure of 1 atm). b - Gibbs free energies (at 25°C) for environmental conditions with 1 mM LCFA, 10 mM acetate, and gas partial pressure of 1 Pa).
The biochemical mechanisms involved in LCFA degradation have not been well studied for
microorganisms growing in methanogenic environments (Sousa et al., 2009). However, the
mechanisms involved in the syntrophic β-oxidation of butyrate (C4:0) have been better
characterized, and may be analogous to β-oxidation pathways of LCFA degradation. Similar to
LCFA, the production of hydrogen or formate with electrons derived from butyrate oxidation is
energetically unfavorable under standard conditions. If the methanogenic partner organisms keep
the hydrogen concentration below 10−4 atm, the midpoint potential of the proton/hydrogen
couple is raised to −300 to −250 mV (Schink, 1997; Sieber et al., 2012). This potential can then
be matched by electrons delivered from NADH (E0′ = −320 mV) (Thauer et al., 1977). It was
shown that NAD+ is the electron acceptor involved in the second oxidation step of the butyrate
pathway, from 3-hydroxybutyryl-CoA to acetoacetyl-CoA (Gustafson et al., 1986). However, at
1 Pa hydrogen partial pressure, two electrons are released at a much higher redox potential in the
first oxidation step of the butyrate pathway (E0′ = −10 mV), from butyryl-CoA to crotonyl-CoA

29
(Sieber et al., 2012). To release these electrons as hydrogen or formate (E0′ = −260 mV), it is
assumed that the syntrophic bacteria invests energy through a process called reverse electron
transport (Sieber et al., 2012).
Several recent studies utilized transcriptomics and proteomics to analyze the metabolic pathways
involved in butyrate β-oxidation by Syntrophomonas wolfei (Schmidt et al., 2013; Sieber et al.,
2015, 2014). The genome sequence of S. wolfei has been thoroughly analyzed and annotated to
understand how butyrate oxidation is coupled to the formation of hydrogen/formate (Sieber et
al., 2010). The S. wolfei genome contains a cluster of five formate dehydrogenases (FDH-1 -
FDH-5), and three hydrogenases (HYD-1 – HYD-3) (Sieber et al., 2010). To identify enzymes
involved in syntrophic butyrate degradation, proteins were extracted and compared from S.
wolfei grown on butyrate in co-culture with Methanospirillum hungatei (syntrophic) and in pure-
culture on crotonate (non-syntrophic) (Schmidt et al., 2013; Sieber et al., 2015). Formate
dehydrogenases were predominant proteins expressed by S. wolfei during butyrate degradation in
co-culture with M. hungatei, but were not expressed in pure-culture growth on crotonate
(Schmidt et al., 2013). Hydrogenase activity was not detected in the proteome of S. wolfei during
butyrate degradation with M. hungatei (Schmidt et al., 2013). In contrast to these findings,
another study revealed that butyrate metabolism was limited by hydrogenase inhibitors (cyanide
and carbon monoxide), but not by a formate dehydrogenase inhibitor (hypophosphite) in washed
cell suspensions of S. wolfei and M. hungatei (Sieber et al., 2014). Reverse-transcription
quantitative PCR confirmed that the expression of hydrogenases hydA1 and hydA2 was 50-fold
greater than formate dehydrogenases fdhA1- fdhA5 in S. wolfei during syntrophic butyrate
degradation with M. hungatei (Sieber et al., 2014).

30
Interestingly, the different findings from these proteomic- and transcriptomic- based studies of
butyrate degradation by S. wolfei and M. hungatei were attributed to different cultivation
conditions, such as: the presence of yeast extract in the growth medium, iron concentration of the
growth medium, incubation temperature, and the size of the incubation bottles (Sieber et al.,
2014). It was reported that membranes of S. wolfei cells retrieved from a larger incubation vessel
(250-L) with butyrate had high levels of formate-dehydrogenase activity but low levels of
hydrogenase activity (Sieber et al., 2014). Thus, the metabolic pathways involved in syntrophic
β-oxidation by S. wolfei appear to be flexible and dependent upon environmental conditions.
2.4 INHIBITION OF LONG-CHAIN FATTY ACID DEGRADATION DURING
ANAEROBIC DIGESTION
Despite the high methane yield potential of FOG, the LCFA released during lipid hydrolysis are
a major concern for the stability of anaerobic digestion, due to the inhibitory effects of LCFA on
anaerobic microorganisms (Koster & Cramer 1987; Rinzema et al. 1994; Lalman & Bagley
2000). Microbial inhibition by LCFA could limit the maximum methane production obtainable
during FOG codigestion, or even result in digester failure. Problematic digester performance
issues associated with LCFA accumulation involve: (1) sludge foaming due to the surfactant
properties of LCFA (Long et al., 2012); (2) sludge floatation and washout due to LCFA
adsorption onto biomass (Hwu et al., 1998), and (3) the inhibition of methanogenic activity
(Davidsson et al., 2008; Hwu and Lettinga, 1997; Lalman and Bagley, 2001, 2000; Luostarinen
et al., 2009; Wang et al., 2013). The accumulation of LCFA may interfere with microbial activity
by disrupting the cell plasma membrane (Koster and Cramer, 1987). It has also been suggested

31
that substrate transport is limited when LCFA adsorbs onto the biomass surface (Pereira et al.,
2005), as adsorbed LCFA can interfere with cell membrane transport activities (Soliva et al.,
2004). LCFA can also disrupt cellular energy production mechanisms by disrupting the electron
transport chain and uncoupling oxidative phosphorylation (Desbois and Smith, 2010).
LCFA inhibition of methanogenic communities was shown to be a reversible phenomenon, with
methane production resuming after a lag phase (Pereira et al., 2005). This suggested that
perceived LCFA inhibition of methanogenic communities might be attributed to temporary
transport limitations from adsorption, rather than true substrate toxicity. However, at very high
concentrations, LCFA can solubilize large segments of the plasma membrane (Desbois and
Smith, 2010), which may lead to direct cell toxicity and lysis (Hanaki et al., 1981; Rinzema et
al., 1994). Therefore, it appears that LCFA toxicity can depend on concentration and adaptation
time.
LCFA could slow biological conversion by toxic inhibition of methanogenic archaea, syntrophic
bacteria, and hydrolytic bacteria. Both aceticlastic and hydrogenotrophic methanogens can be
affected by LCFA. The concentration of oleate that led to 50% inhibition of activity (i.e. IC50)
for aceticlastic methanogens ranged from 0.5 – 2.3 mM at 40°C for anaerobic sludge collected
from a mesophilic digester (Hwu and Lettinga, 1997). The IC50 of oleate for pure-cultures of the
hydrogen-utilizing methanogens Methanospirillum hungatei and Methanobacterium formicicum
was reported to be 0.3 mM and 1.0 mM, respectively (Sousa et al., 2013). While the IC50 for
oleate towards the aceticlastic methanogens Methanosaeta concilii and Methanosarcina mazei
was about 0.5 mM, the IC50 for palmitate was ~3 mM for M. concilii and ~1.5 mM for M. mazei

32
(Silva et al., 2016). These findings suggest that different methanogenic archaeal species can be
affected by LCFA to varying degrees, which has been attributed to differences in cell wall
structure and membrane lipid composition (Sousa et al., 2013). Although aceticlastic
methanogens have been purported to be more susceptible to LCFA toxicity than
hydrogenotrophic methanogens (Hwu and Lettinga, 1997; Lalman and Bagley, 2001), the above
findings also indicate that LCFA inhibition of hydrogenotrophic and aceticlastic methanogens
can occur within a similar concentration range (Hwu and Lettinga, 1997; Silva et al., 2016;
Sousa et al., 2013). With regards to LCFA impacting other microbial populations, the addition of
LCFA up to ~0.5 mM had little effect on the fermentation of glucose by an anaerobic digester
sludge (Lalman and Bagley, 2002). In contrast, butyrate degradation by the anaerobic sludge was
inhibited by 75% with the addition of ~0.5 mM LCFA (Lalman and Bagley, 2002). Thus, it
appears that the accumulation of LCFA within a digester would not limit the rate of
hydrolysis/fermentation, but rather the kinetics of syntrophic acetogenesis and methanogenesis.
Reported threshold values for FOG loading that led to process inhibition in municipal sludge
codigestion have ranged from 30% to 71% of the total feed VS (w/w) (Davidsson et al., 2008;
Luostarinen et al., 2009; Silvestre et al., 2011; Wan et al., 2011; Wang et al., 2013; Yalcinkaya
and Malina, 2015). Higher threshold values for FOG loading have been proposed for digester
biomass previously exposed to lipids (Silvestre et al., 2011; Wang et al., 2013). Silvestre et al.
(2011) suggested that step-wise increases in the FOG loading allowed for a gradual increase in
acetogenic activity in the anaerobic sludge. Methanogenic processes were also observed to
develop increased tolerances toward LCFA over time, with increased substrate-conversion
activity after pulse (Nielsen & Ahring, 2006; Cavaleiro et al., 2008; Palatsi et al., 2009) and

33
continuous feeding (Pereira et al., 2005; Cavaleiro et al., 2009; Baserba et al., 2012). However,
the relationship between microbial community structure and the maximum loading rate of FOG
during codigestion has not been characterized. Additionally, it is unknown whether ‘indicator’
populations can be used to assess the level of LCFA adaptation in an anaerobic digester
community. Therefore, understanding the relationships between LCFA accumulation and
changes in the microbial population during FOG codigestion may be important for determining
maximum allowable FOG loading rates with stable digester operation for enhanced methane
production.
2.5 MICROBIAL ECOLOGY OF LONG-CHAIN FATTY ACID DEGRADATION
As previously mentioned, LCFA are converted into methane by a syntrophic partnership between
obligate hydrogen producing acetogens and methanogens (Schink, 1997). To date, 15 bacteria
have been isolated that are capable of anaerobically degrading C4 – C18 fatty acids in pure culture
or co-culture with hydrogen-utilizing microorganisms (Table 2-3). All of these isolates belong to
the two families of syntrophic bacteria, Syntrophomonadaceae (Hatamoto et al., 2007a;
McInerney, 1992; Sousa et al., 2007b; Wu et al., 2007; F. Zhang et al., 2012) and Syntrophaceae
(Jackson et al., 1999). Bacteria capable of utilizing LCFA (i.e. greater or equal to 12 carbons in
length) include Syntrophomonas sapovorans, Syntrophomonas saponavida, Syntrophomonas
curvata, Syntrophomonas zehnderi, Thermosyntrophica lipolytica, Thermosysntropha
tengcongensis, and Syntrophus aciditrophicus (Table 2-3).
Syntrophic β-oxidizing bacteria are thought to be slow growing, with maximum growth rates
near 0.06 d-1 reported for butyrate-degrading co-cultures (Beaty and McInerney, 1987;

34
McInerney et al., 1979). However, the growth of syntrophic LCFA degrading bacteria in
environmental systems, such as anaerobic digesters, has not been well characterized. Membrane
hybridization probes and fluorescent in-situ hybridization (FISH) probes have been developed to
target members of the β-oxidizing Syntrophomonadaceae family (H. Ariesyady et al., 2007;
Hansen et al., 1999; Menes and Travers, 2006), and were used to detect Syntrophomonadaceae
bacteria within full-scale anaerobic digesters and laboratory-scale digesters at relative
abundances up to 1.75% of the bacteria community (Hansen et al., 1999; McMahon, 2001;
McMahon et al., 2004). The abundance of the genus Syntrophomonas was quantified at 1.5% of
the bacterial population using FISH in a full-scale mesophilic anaerobic digester treating
domestic wastewater sludge (H. Ariesyady et al., 2007). Members of Syntrophomonadaceae
were detected with FISH up to 3% of the bacterial population of a full-scale mesophilic digester
treating edible tallow refinery wastewater (Menes and Travers, 2006). Yet, butyrate-degrading
syntrophic bacteria were not detected in sludges of 4 full-scale anaerobic digesters using RNA-
cleavage probes (Narihiro et al., 2012). These findings suggest that characterized syntrophic β-
oxidizing bacteria are present at relatively low abundances in anaerobic digester communities,
often below the detection limits of membrane hybridization and FISH probes (Stams et al.,
2012). More accurate and sensitive quantification techniques, such as quantitative PCR, may
therefore be needed to monitor their growth dynamics during LCFA degradation.
The use of culture-independent molecular fingerprinting techniques to monitor changes in
microbial community structure has led to somewhat contradictory results about the key
populations involved in LCFA degradation (Baserba et al., 2012; Hatamoto et al., 2007c; Palatsi
et al., 2010; Sousa et al., 2007a). Sousa et al. (2007a) used PCR-denaturing gradient gel

35
electrophoresis (DGGE) to study the microbial communities of an anaerobic bioreactor fed
oleate (C18:1) and palmitate (C16:0) followed by batch degradation. The bacterial communities
shifted toward more Syntrophomonadaceae-affiliated organisms that were not detectable in the
initial inoculum. Hatamoto et al. (2007c) used RNA-based stable isotope probing (SIP) to
identify palmitate (C16:0)–degrading bacteria in methanogenic sludges from commercial upflow
anaerobic sludge blanket (UASB) reactors. Syntrophomonadaceae-affiliated sequences were
only detected in half of the 13C-RNA clone libraries (2 of the 4 reactor libraries), whereas
sequences from Syntrophus were highly abundant in the clone libraries (Hatamoto et al., 2007c).
The observed differences in bacterial community structure shifts during LCFA degradation were
hypothesized to be influenced by the degree of saturation of the LCFA used for growth; a clade
of Deltaproteobacteria (i.e. Syntrophus) were associated more with saturated LCFA DNA
sequence libraries, while a clade of Syntrophomonadaceae were more associated with
unsaturated LCFA incubations (Sousa et al., 2009). Conversely, Palatsi et al. (2010) found no
significant changes in the bacterial community structure using PCR-DGGE on sludge from an
anaerobic bioreactor subjected to repeated pulses of LCFA, even though increases in
hydrogenotrophic and β-oxidation activities were observed. Recently, a metagenomic assessment
of microbial biodiversity based on differential coverage binning in parallel anaerobic digesters
led to the recovery of 48 Syntrophomonas draft population genomes (Campanaro et al., 2016;
Treu et al., 2016b). Yet, metatranscriptomic mapping of mRNA reads to the draft population
genomes revealed that only two Syntrophomonas bins showed significant response to LCFA
addition (Treu et al., 2016a). Thus, it remains uncertain whether the increased tolerance of
anaerobic communities to LCFA is a result of the growth of specialized degrading populations
(Sousa et al., 2007b; Hatamoto et al., 2007b; Baserba et al., 2012), or rather to changes in the

36
physiology of existing populations (Palatsi et al., 2010). Therefore, additional ecological
understanding of the microorganisms responsible for degrading LCFA in methanogenic
communities is needed.

37
Table 2-3 Substrate utilization of characterized syntrophic bacteria capable of degrading C4-C18 fatty acids (adapted from Sousa et al., 2009)
Organism Fatty acid utilized in co-culture with H2-utilizing partner
Reference Butyrate (C4:0)
Caproate (C6:0)
Caprylate (C8:0)
Caprate (C10:0)
Laurate (C12:0)
Myristate (C15:0)
Palmitate (C16:0)
Stearate (C18:0)
Oleate (C18:1)
Linoleate (C18:2)
Syntrophomonas bryantii + + + + - - - - ND ND (Wu et al.,
2007) Syntrophomonas
cellicola + + + - - - ND ND ND ND (Wu et al., 2007)
Syntrophomonas curvata + + + + + + + + + - (Zhang et al.,
2004) Syntrophomonas
erecta erecta + + + - - - - - - - (Zhang et al., 2005)
Syntrophomonas erecta sporosyntropha + + + - - - - - - - (Wu et al.,
2006) Syntrophomonas
palmitatica + + + + + + + + - - (Hatamoto et al., 2007a)
Syntrophomonas saponavida + + + + + + + + - - (Lorowitz et
al., 1989) Syntrophomonas
sapovorans + + + + + + + + + + (Zhang et al., 2005)
Syntrophomonas wolfei methylbutyratica + + + - - - - - ND ND (Wu et al.,
2007) Syntrophomonas wolfei
wolfei + + + - - - - - - - (McInerney, 1992)
Syntrophomonas zehnderi + + + + + + + + + + (Sousa et al.,
2007b) Syntrophus
aciditrophicus + + + ND ND ND + + ND ND (Jackson et al., 1999)
Syntrophothermus lipocalidus + + + + - - - - - - (Sekiguchi et
al., 2000) Thermosysntropha
lipolytica + + + + + + + + + + (Svetlitshnyi et al., 1996)
Thermosysntropha tengcongensis + + + + + + + + + + (F. Zhang et
al., 2012) +, utilized; -, not utilized; ND, not determined or reported

38
2.6 EFFECT OF MICROBIAL COMMUNITY DIVERSITY AND ECOLOGICAL
STABILITY ON ANAEROBIC DIGESTER PERFORMANCE
Advances in molecular microbiology techniques over the past two decades have permitted a
closer examination of the microbial communities present in wastewater treatment process
biomass (Rittmann et al., 2006). Such investigations have contributed evidence suggesting that
microbial communities in biological treatment processes can have high levels of ecological
biodiversity (T. Zhang et al., 2012) and display dynamic patterns of community composition
over time (Ju and Zhang, 2015; Wittebolle et al., 2008). The vast microbial biodiversity of
wastewater treatment biomass is in conflict with traditional biokinetic models used for predicting
treatment process performance, such as the IWA Anaerobic Digester Model 1 (ADM1), which
assume uniform biomass compositions (Rittmann et al., 2006). Improving our understanding of
the relationships between microbial community composition and function within biological
wastewater treatment processes thus has potential to revise existing engineering design
approaches by incorporating ecological theory to achieve better treatment performance
(McMahon et al., 2007).
The functional stability of the anaerobic digestion process is often characterized by efficient
methane production without VFA or LCFA accumulation (Briones and Raskin, 2003), and has
been related to the resilience, resistance, and redundancy of the microbial populations within the
various trophic levels (i.e. functional guilds) of the digester microbial food web (Carballa et al.,
2015; Werner et al., 2011). Resistance refers to the degree in which a community composition
remains unchanged during a disturbance; resilience indicates to the rate at which the microbial
community returns to its original composition following a disturbance; and functional

39
redundancy refers to the potential for various microbial taxa to process the same substrate
(Allison and Martiny, 2008). Community stability has been related to levels of biodiversity, as
indicated by the species richness (number of different species) (Elsas et al., 2012; Johnson et al.,
2014) and/or the community evenness (equality of species abundance) (Wittebolle et al., 2009);
although general diversity-stability relationships remain unclear (Shade, 2016). Determining
which metrics of diversity and/or ecological stability are important drivers of digester
performance is thus a major challenge for the development of predictive treatment models that
incorporate ecological principles (McMahon et al., 2007).
In anaerobic digesters, hydrolytic bacteria are thought to have a high degree of functional
redundancy (Carballa et al., 2015; Vanwonterghem et al., 2014), whereas syntrophic bacteria and
methanogens are thought to be more metabolically specialized (Briones and Raskin, 2003;
McInerney et al., 2009) and less likely to undergo competition (Werner et al., 2011). Thus,
anaerobic digester biomass may be inherently uneven based on a comparison of functional clades
(Briones and Raskin, 2003). Yet, the metabolically-specialized microbes that convert fatty acids,
hydrogen, acetate, and carbon dioxide into methane are considered keystone species (Briones
and Raskin, 2003), and maintaining their metabolic roles has implications for the efficiency of
methane recovery from organic waste. For instance, the discovery of syntrophic acetate oxidation
(Lee and Zinder, 1988; Schnürer et al., 1996) demonstrated a new pathway for methanogenesis
from acetate, which could afford a digester with greater functional flexibility to convert acetate
under stressful conditions (Werner et al., 2014). The reported flexible metabolism of
Methanosarcina species to use both hydrogen and acetate for growth (Phelps et al., 1985) could
also allow for multiple pathways of methanogenesis within an anaerobic digester population. The

40
ability to enrich for Methanosarcina species over Methanosaeta species by changing the digester
feeding pattern (Conklin et al., 2006) indicated that it may be possible to impact the functional
redundancy of keystone functional groups by adjusting digester operating conditions. Similarly,
it was observed that four distinct clades of syntrophic propionate oxidizing bacteria (POB) were
enriched in an anaerobic digester operated in fill-and-draw mode, and the coexistence of multiple
syntrophic POB groups was attributed to the different biokinetic characteristics of the POB
clades and the periodic changes in propionate concentration with batch feeding (H. D. Ariesyady
et al., 2007). Distinct syntrophic POB populations with different biokinetic parameters were also
detected in the first and second phases of a thermophilic phased-digester based on differences in
organic loading (Zamanzadeh et al., 2013). However, Werner et al. (2011) observed that the
same syntrophic populations rebounded after periods of starvation in full-scale digesters treating
distillery waste, and thus concluded that syntrophic populations were resilient rather than
functionally redundant. If different syntrophic and methanogenic consortia could have different
rates of fatty acid conversion (e.g. functional redundancy), then biological selective pressures
could potentially be incorporated into FOG codigester operating strategies to favorably steer the
LCFA-degrading community toward a composition with higher bioconversion kinetics. Thus, the
effects of codigester operating conditions on the resistance, resilience, and functional redundancy
of syntrophic and methanogenic consortia warrant further investigation to facilitate appropriate
strategies to maximize biomethane recovery.

41
Chapter 3. MONITORING THE DYNAMICS OF SYNTROPHIC
BETA-OXIDIZING BACTERIA DURING ANAEROBIC
DEGRADATION OF OLEIC ACID BY QUANTITATIVE PCR
This work is published as:
Ziels, R. M., Beck, D. A., Martí, M., Gough, H. L., Stensel, H. D., & Svensson, B. H. (2015). Monitoring the dynamics of syntrophic β-oxidizing bacteria during anaerobic degradation of
oleic acid by quantitative PCR. FEMS microbiology ecology, 91(4), doi: http://dx.doi.org/10.1093/femsec/fiv028
3.1 ABSTRACT
The ecophysiology of long-chain fatty acid (LCFA)-degrading syntrophic β-oxidizing bacteria
has been poorly understood due to a lack of quantitative abundance data. Here, TaqMan
quantitative PCR (qPCR) assays targeting the 16S rRNA gene of the known mesophilic
syntrophic β-oxidizing bacterial genera Syntrophomonas and Syntrophus were developed and
validated. Microbial community dynamics were followed using qPCR and Illumina-based high
throughput amplicon sequencing in triplicate methanogenic bioreactors subjected to five
consecutive batch feedings of oleic acid. With repeated oleic acid feeding, the initial specific
methane production rate significantly increased along with the relative abundances of
Syntrophomonas and methanogenic archaea in the bioreactor communities. The novel qPCR
assays showed that Syntrophomonas increased from 7% to 31% of the bacterial community 16S
rRNA gene concentration, whereas that of Syntrophus decreased from 0.02% to less than
0.005%. High throughput amplicon sequencing also revealed that Syntrophomonas became the
dominant genus within the bioreactor microbiomes. These results suggest that increased specific
mineralization rates of oleic acid were attributed to quantitative shifts within the microbial

42
communities toward higher abundances of syntrophic β-oxidizing bacteria and methanogenic
archaea. The novel qPCR assays targeting syntrophic β-oxidizing bacteria may thus serve as
monitoring tools to indicate the fatty acid β-oxidization potential of anaerobic digester
communities.
3.2 INTRODUCTION
Anaerobic digestion (AD) is an attractive biotechnology used to treat organic wastes and produce
renewable energy as methane. Co-digesting energy-rich wastes with municipal sludge or manure
has gained increased interest due to observed improvements in bioreactor methane production
(Davidsson et al., 2008; Luostarinen et al., 2009; Wang et al., 2013). Lipid-rich wastes are
desirable co-substrates for AD due to their relatively high specific methane yield (Cavaleiro et
al., 2008; Palatsi et al., 2010). However, the long-chain fatty acids (LCFA) produced during lipid
hydrolysis have been shown to inhibit anaerobic microorganisms (Angelidaki and Ahring, 1992;
Hanaki et al., 1981; Koster and Cramer, 1987; Lalman and Bagley, 2000; Rinzema et al., 1994).
Achieving efficient degradation of LCFA by anaerobic microorganisms is therefore critical to
obtain stable and elevated methane production during the AD of lipid-rich wastes.
Under anaerobic conditions, LCFA are primarily degraded through β-oxidation to yield hydrogen
and acetate (Weng and Jeris, 1976). Methane formation from LCFA occurs through a syntrophic
partnership between LCFA β-oxidizing acetogenic bacteria and methanogenic archaea, which are
responsible for maintaining low concentrations of acetate and hydrogen (Schink, 1997; Sousa et
al., 2009). Currently, all of the bacterial species that have been characterized to grow on LCFA
in syntrophic partnership with methanogens belong to the families of Syntrophomonadaceae

43
within the class of Clostridia (Hatamoto et al., 2007a; McInerney, 1992; Sousa et al., 2009,
2007b; Wu et al., 2007; Zhao et al., 1993), or Syntrophaceae within the subclass of
Deltaproteobacteria (Jackson et al., 1999).
The effect of LCFA exposure on methanogenic activity has been observed to vary with contact
time, and has been attributed to either microbial acclimation to LCFA or adaptation through
changes in the microbial community composition. Despite early reports of bactericidal (Rinzema
et al., 1994) and permanent toxic effects of LCFA (Angelidaki and Ahring, 1992), LCFA
inhibition was shown to be reversible with anaerobic microorganisms capable of mineralizing
biomass-sorbed LCFA after a lag period (Pereira et al., 2005, 2004, 2003). Methanogenic
communities were also observed to develop an increased tolerance toward LCFA after pulse
(Cavaleiro et al., 2008; Nielsen and Ahring, 2006; Palatsi et al., 2009) and continuous feeding
(Baserba et al., 2012; Cavaleiro et al., 2009; Pereira et al., 2005). However, the use of culture-
independent molecular fingerprinting techniques (Baserba et al., 2012; Hatamoto et al., 2007c;
Palatsi et al., 2010; Sousa et al., 2007a) led to contradictory results regarding the changes in
microbial community structure during LCFA degradation. Sousa et al. (2007a) used PCR-
denaturing gradient gel electrophoresis (DGGE) to study the microbial communities of an
anaerobic bioreactor fed oleate (C18:1) and palmitate (C16:0) followed by batch degradation.
The bacterial communities shifted toward more Syntrophomonadaceae-affiliated organisms that
were not detectable in the initial inoculum. Conversely, Palatsi et al. (2010) found no significant
changes in the bacterial community structure using PCR-DGGE on sludge from an anaerobic
bioreactor subjected to repeated pulses of LCFA, even though improvements in
hydrogenotrophic and β-oxidation activities were observed. Thus, it remains uncertain whether

44
the increased tolerance of anaerobic communities to LCFA is a result of the proliferation of
specialized degrading populations (Baserba et al., 2012; Hatamoto et al., 2007c; Sousa et al.,
2007a), or rather to changes in the physiology of existing populations (Palatsi et al., 2010).
Additional ecological understanding of the microorganisms responsible for degrading LCFA in
methanogenic communities is thus needed.
The ability to quantify syntrophic β-oxidizing bacteria could offer new insight into their
ecophysiology during the degradation of LCFA. Membrane hybridization (Hansen et al., 1999)
and cleavage (Narihiro et al., 2012) probes have been previously developed targeting the
mesophilic syntrophic β-oxidizing genera Syntrophomonas and Syntrophus. Yet, poor detection
has been reported when employing these methods due to the potentially low concentrations of β-
oxidizing bacteria in anaerobic bioreactors (Menes and Travers, 2006; Narihiro et al., 2012), thus
calling for a more sensitive quantification technique. Quantitative PCR (qPCR) is a widely
employed method that uses DNA primer sets to obtain rapid and highly-sensitive detection of
specific microorganisms (Bustin et al., 2009), and has proven to be a powerful tool for
monitoring microbial populations in the complex communities of anaerobic bioreactors (Hori et
al., 2006; Lee et al., 2009; Westerholm et al., 2011; Yu et al., 2005). The use of a dual-labeled
fluorogenic hydrolysis probe in the qPCR assay (TaqMan qPCR) may offer a higher level of
specificity in comparison to SYBR Green assays (Wittwer et al., 1997). Currently, there have
been no qPCR primer and TaqMan hydrolysis probe sets designed to quantify mesophilic
syntrophic LCFA β-oxidizing bacteria.

45
The objective of this study was to develop and validate TaqMan qPCR assays targeting the
known mesophilic syntrophic LCFA β-oxidizing genera Syntrophomonas and Syntrophus, and to
apply the newly developed qPCR assays to monitor changes in the abundance of the syntrophic
β-oxidizing groups in methanogenic bioreactors that were batch-fed with oleic acid. High-
throughput amplicon sequencing of the bacterial 16S rRNA gene was also conducted on time-
series samples from the bioreactors to further examine microbial community dynamics.
3.3 MATERIALS AND METHODS
3.3.1 Batch-fed Methanogenic Bioreactors Degrading Oleic Acid
Triplicate bioreactors (330 mL Pyrex glass serum bottles) were initially purged with N2/CO2
(80:20, 1atm) and sealed with butyl rubber septa. The bioreactors were seeded with sludge (21 g
VS L-1) from a mesophilic laboratory-scale complete-mix AD bioreactor co-digesting grease
waste with primary and waste activated sludge. The seed sludge was diluted 50:50 with
anaerobic basal medium prepared according to Karlsson et al. (1999). The bioreactors were
initially incubated at 37°C for seven days until methane production ceased from the background
substrate in the seed sludge. After this period, sludge samples for DNA extraction (10 mL), total
solids and volatile solids (TS/VS) (8 mL), volatile fatty acids (VFA) (1 mL), and LCFA (3 mL)
analyses were withdrawn to characterize the initial conditions.
The bioreactors were incubated without shaking in a 37°C environmental chamber during five
consecutive batch-feedings of oleic acid. The bioreactors were fed with oleic acid (80% purity,
VWR) every 7th day using a needle and syringe to obtain the target initial concentrations given
in Table 3-1. The liquid volume that was removed for liquid sampling throughout the batch

46
degradation period (42 mL) was replaced with anaerobic basal medium during each subsequent
batch feeding to maintain an initial working volume of 120 mL. This operation resulted in the
replacement of approximately two reactor liquid volumes throughout the experimental period,
and thus promoted the washout of the initial inoculum over time. Liquid samples were
withdrawn with a needle and syringe for analysis of VFA (1 mL) and LCFA (3 mL) six times
during each batch degradation period. Sludge samples for DNA extraction (10 mL) and TS/VS
and pH (8 mL) were withdrawn at the end of each batch period before the subsequent feeding.
The bioreactor headspace was purged with N2/CO2 (80:20, 1 atm) prior to the addition of new
substrate at the start of each batch-feeding period. The bioreactor conditions during each batch
degradation period are summarized in Table 3-1.
Table 3-1 Operating conditions and performance characteristics of methanogenic bioreactors
degrading oleic acid. (n=3)
Parameter Batch Cycle 1 2 3 4 5
VS (g L-1)a 7.8 ± 0.3 4.9 ± 0.2 3.5 ± 0.1 2.1 ± 0.2 1.2 ± 0.1 pH 7.3 ± 0.03 7.3 ± 0.01 7.2 ± 0.03 7.2 ± 0.01 7.1 ± 0.01
Oleic Acid Added (mM) 2.9 4.0 5.0 5.0 6.6 Initial Oleic Acid to
Solids Ratio (mg g VS-1)b
100 ± 4 230 ± 10 410 ± 7 670 ± 65 1570 ± 130
Initial Specific Methane Production Rate
(mL CH4 g VS-1
d-1) 57 ± 3 85 ± 2 130 ± 1 170 ± 7 260 ± 24
a Average of the levels at the beginning and end of each batch degradation period b Based on the amount of oleic acid added and the VS concentration in each vial, since the LCFA did not accumulate above 0.15 mM at the end of each batch period (see Table A2)
Biogas volume and composition were measured daily throughout the bioreactor operation. The
initial specific methane production rates in each batch period were determined by dividing the

47
initial slope of the methane production curve (in mL CH4 L-1 d-1) by the average volatile solids
(in g VS L-1) of each vial, and were expressed as mL CH4 g VS-1 d-1.
3.3.2 Extraction and Quantification of Genomic DNA
Bioreactor samples for DNA extraction were immediately centrifuged at 10,000 x g at 4°C for 10
min, decanted, and stored at -20°C. Genomic DNA was isolated from approximately 0.2 g of wet
solids using the PowerSoil® RNA/DNA Isolation Kit (MO BIO, Inc, Carlsbad, California)
according to the manufacturer instructions. This DNA extraction protocol was chosen due to its
use of phenol-chloroform, which can help to ensure efficient recovery of high-quality archaeal
and bacterial DNA (Urakawa et al., 2010). The concentration of extracted DNA was immediately
measured with the Quant-IT dsDNA High Sensitivity Assay Kit with a Qubit 2.0 flourometer,
according to the manufacturer’s instructions (Invitrogen, Carlsbad, California). Extracted DNA
was stored in nuclease-free water at -20°C.
3.3.3 Design and Validation of qPCR Primer and Probe Sets
16S rRNA gene sequences of strains belonging to the genera Syntrophomonas and Syntrophus
were obtained from the National Center for Biotechnology Information (NCBI) GenBank
database (https://www.ncbi.nlm.nih.gov/genbank/, retrieved July, 2013) and separately aligned
using the Clustal package in Jalview software (v. 2.8) (Waterhouse et al., 2009). Sequence
regions of high similarity within the multiple gene alignments were identified, and were used to
design potential hybridization sites for primers and probes. Primer sequences were designed to
meet the following criteria: minimal dimer formation, a guanine + cytosine (GC) content of 40%
to 70%, minimal repeats of guanine and cytosine, an amplicon fragment length less than 150 bp,
and the fewest degenerate nucleotides possible. Hydrolysis (TaqMan) probes were designed
48
based on: a 5’ location as close to the forward primer as possible, less than 30 nucleotides in
length, minimal self- and cross- annealing, no terminal guanine base at the 5’ end, a melting
temperature 5°C to 10°C above the associated primer pair, and minimal degenerate nucleotides.
All hydrolysis probes were labeled with 6-FAM at the 5’end and BHQ-1 at the 3’ end.
The optimal qPCR primer and probe sets were chosen based on their adherence to the above
criteria, as well as their target group specificity and coverage. The specificity and group coverage
of each primer and probe set was tested in silico by conducting searches with: BLAST of the
GenBank Database (http://blast.ncbi.nlm.nih.gov/); the Ribosomal Database Project ProbeMatch
software (Cole et al., 2009); and the SILVA TestPrime 1.0 and TestProbe 3.0 programs
(Klindworth et al., 2013). Potential false-positive targets were identified by increasing the
number of allowed sequence mismatches in the in silico database searches. Organisms with three
or more mismatches within each of the three oligonucleotide sequences (≥9 mismatches total)
were excluded from the analysis due to their low probability of amplification (Yu et al., 2005).
The optimal primer/probe sets targeting Syntrophomonas and Syntrophus 16S rRNA genes are
given in Table 3-2 along with their respective target group coverage.

49
Table 3-2 Characteristics of qPCR primers and hydrolysis probes developed to target Syntrophomonas and Syntrophus genera
Oligo. Namea Target Group Positionb Oligo. Sequence (5’ to 3’) Expected Length
(bp)
Tm (°C)c
Target Group
Coverage (%)d
Synm-678 (F) Syntrophomonas
678-691 CCWGGTGTAGCGGT 75
60.3 97 Synm-696 (P) 696-722 TGCGTAGAAATCAGGAGGAAYACCAGT 70.0 90 Synm-738 (R) 738-752 TCAGGGYCAGTCCAG 61.5 97 Syntr-441 (F)
Syntrophus 441-459 GGTGGGAAGAAATGTATKGA
137 61.6 88
Syntr-462 (P) 462-487 TTAAYAGCCTTTGTACTTGACGGTAC 66.8 88 Syntr-559 (R) 559-576 CTCTTTACGCCCAATGAT 60.1 88
a F = forward primer; P = hydrolysis probe; R = reverse primer b According to Escherichia coli J01695 numbering c Calculated using nearest-neighbor method with the OligoAnalyzer 3.1 program (http://www.idtdna.com), using the model inputs: 200nM probe, 500nM primer, 200mM monobasic salt d Calculated as the ratio of matches with sequences from isolated organisms within the target group over the total number of sequences from isolated organisms in that group. The ratios were calculated based on available sequences in the Ribosomal Database Project using the Probe Match program (http://rdp.cme.msu.edu/probematch) with inputs: Quality=”Good”, Size ≥ 1200bp, Source=”Isolates”, Mismatches=0.
In addition to the in silico analysis, the specificities of the qPCR assays were tested empirically
using genomic DNA from pure cultures. Positive controls included genomic DNA from:
Syntrophomonas wolfei subsp. saponavida (DSM 4212), Syntrophomonas palmitatica (DSM
18709), Syntrophomonas zehnderi OL-4, Syntrophus aciditrophicus (DSM 26646), and
Syntrophus gentianae (DSM 8423). Negative controls to test for non-specific amplification
included DNA from: Syntrophobacter wolinii, Syntrophobacter pfennigii, Pelotomaculum
propionicicum, Desulfotomaculum kuznetsovii (DSM 6115), Desulfomonile tiedjei (DSM 6799),
Desulfovibrio desulfuricans (DSM 642), Clostridium ultunense, Clostridium acidurici (DSM
604), Enterococcus faecalis, Streptococcus pyogenes, Escherichia coli, Pseudomonas
aeruginosa, Methanosaeta concilii (DSM 3671), Methanospirillum hungatei (DSM 864),
Methanococcus voltae (DSM 1537), Methanosarcina barkeri (DSM 800), and
Methanobacterium formicicum (DSM 1535). Most genomic DNA samples of pure-culture
50
isolates were purchased from the Deutsche Sammlung von Mikroorganismen und Zellkulturen
GmbH (DSMZ) (Braunschweig, Germany). Additional genomic DNA samples from isolated
strains were obtained from collections at Wageningen University (Wageningen, Netherlands),
Linköping University (Linköping, Sweden) and the Swedish University of Agricultural Sciences
(Uppsala, Sweden). Approximately 0.5-2 ng DNA of each pure-culture DNA sample was loaded
in the qPCR reaction for specificity testing.
3.3.4 Quantitative PCR (qPCR)
qPCR targeting partial 16S rRNA gene sequences was performed using a LightCycler 480
system (Roche Diagnostics GmbH, Mannheim, Germany). Each 20 µL reaction mix contained 5
µL DNA template, 2 µL PCR-grade water (Roche Diagnostics GmbH), 500 nM of each forward
and reverse primers, 200 nM of hydrolysis probe, and 10 µL LightCycler 480 Probes Master mix
(2X, Roche Diagnostics GmbH). All samples were analyzed in duplicate. No-template controls
(NTCs) were included with each qPCR run to ensure that no contamination occurred.
In addition to the Syntrophomonas and Syntrophus genus-level qPCR assays developed in this
study (Table 3-2), qPCR analysis was also conducted targeting 16S rRNA genes of the domain
Bacteria, the methanogenic archaeal orders of Methanomicrobiales, Methanobacteriales,
Methanococcales, and the methanogenic archaeal families of Methanosarcinaceae and
Methanosaetaceae using previously developed primer/probe sets (Yu et al., 2005). The details of
all primer/probe sets used for qPCR in this study are provided in Table A1 (Supplemental
Information). The amplification procedure for all qPCR assays consisted of an initial
denaturation at 95°C for 10 min, followed by 42 cycles of 95°C for 10 s, and annealing and
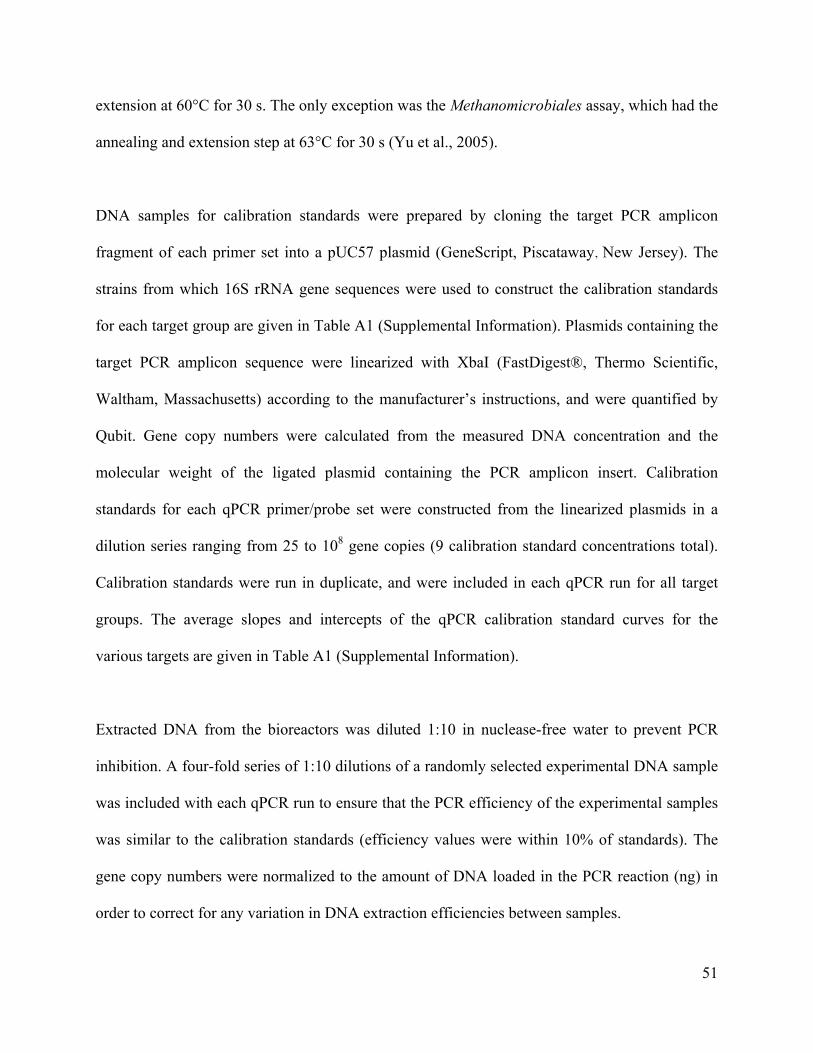
51
extension at 60°C for 30 s. The only exception was the Methanomicrobiales assay, which had the
annealing and extension step at 63°C for 30 s (Yu et al., 2005).
DNA samples for calibration standards were prepared by cloning the target PCR amplicon
fragment of each primer set into a pUC57 plasmid (GeneScript, Piscataway, New Jersey). The
strains from which 16S rRNA gene sequences were used to construct the calibration standards
for each target group are given in Table A1 (Supplemental Information). Plasmids containing the
target PCR amplicon sequence were linearized with XbaI (FastDigest®, Thermo Scientific,
Waltham, Massachusetts) according to the manufacturer’s instructions, and were quantified by
Qubit. Gene copy numbers were calculated from the measured DNA concentration and the
molecular weight of the ligated plasmid containing the PCR amplicon insert. Calibration
standards for each qPCR primer/probe set were constructed from the linearized plasmids in a
dilution series ranging from 25 to 108 gene copies (9 calibration standard concentrations total).
Calibration standards were run in duplicate, and were included in each qPCR run for all target
groups. The average slopes and intercepts of the qPCR calibration standard curves for the
various targets are given in Table A1 (Supplemental Information).
Extracted DNA from the bioreactors was diluted 1:10 in nuclease-free water to prevent PCR
inhibition. A four-fold series of 1:10 dilutions of a randomly selected experimental DNA sample
was included with each qPCR run to ensure that the PCR efficiency of the experimental samples
was similar to the calibration standards (efficiency values were within 10% of standards). The
gene copy numbers were normalized to the amount of DNA loaded in the PCR reaction (ng) in
order to correct for any variation in DNA extraction efficiencies between samples.

52
3.3.5 High-Throughput Amplicon Sequencing of Bacterial 16S rRNA Genes
All DNA extracts were processed for high-throughput amplicon sequencing on the Illumina
MiSeq platform. Two-step nested PCR was conducted prior to sequencing to improve PCR
sensitivity. The primers used in the initial PCR were a modified 341F
(CCTAYGGGRBGCASCAG) and a modified 806R (GGACTACNNGGGTATCTAAT)
(Sundberg et al., 2013), which targeted a 465 bp DNA fragment flanking the V3 and V4 regions
of the 16S rRNA gene of Bacteria and Archaea. The initial PCR was performed in a total
volume of 20 µL containing: 5 µL of sample DNA extract (diluted 1:10), 500 nM of each of the
primers 341F and 806R, 0.2 mM dNTPs mixture, 0.4 U of Phusion High Fidelity DNA
Polymerase (Finnzymes, Finland), 1X Phusion High-Fidelity Buffer (Finnzymes), and PCR
grade water. The PCR amplification was performed with an initial incubation at 98°C for 30 s,
followed by 35 cycles of 98°C for 5 s, annealing at 60°C for 20 s, extension at 72°C for 20 s, and
a final extension step at 72°C for 5 min. PCR was run in duplicate for each DNA sample and
then subsequently pooled. PCR products were purified using the High-Pure PCR Cleanup Kit
(Roche Diagnostics GmbH, Mannheim, Germany) according to the manufacturer’s instructions.
DNA concentrations of the purified PCR product were subsequently quantified using the Quant-
IT dsDNA High Sensitivity Assay Kit and a Qubit fluorometer, and amplicon size was verified
by gel electrophoresis. Addition of adapters and indices to DNA fragments was done in a second
PCR using the modified primers 515F (GTGCCAGCMGCCGCGGTAA) and 806R. The second
PCR was performed in a total volume of 20 µL containing: 2 µL AccuPrime™ PCR Buffer
(10X, Invitrogen), 0.24 U AccuPrime™ Taq DNA Polymerase High-Fidelity (Invitrogen), 500
nM each of the fusion primers 515F and 806R with indexes, 2 µL of 1:10 diluted PCR product
from the first PCR, and PCR grade water. The second PCR was run with the following

53
conditions: 94°C for 2 min, followed by 15 cycles of 94° C for 20 s, 56°C for 30 s and 68°C for
40 s, and a final extension at 68°C for 5 min. PCR amplicons were purified using Agencourt
AMPure XP (Agencourt Bioscience Corporation, MA, USA) and the concentration was
measured using PicoGreen staining (Invitrogen), according to the manufacturer protocols. The
sample amplicons were pooled at equimolar concentrations, and subjected to high-throughput
sequencing on the Illumina MiSeq platform at the University of Copenhagen Molecular
Microbial Ecology Lab according to MiSeq Reagent Kit Preparation Guide (Illumina, Inc., San
Diego, CA, USA). Sequences were submitted to the NCBI Sequence Read Archive as BioProject
PRJNA262832.
Sequences were processed and analyzed using QIIME version 1.8.0 (Caporaso et al., 2010b).
Paired-end sequences were joined using the fastq-join method (Aronesty, 2013) within the
QIIME script join_paired_ends.py with a minimum overlap of 100 bp and a zero percent
difference allowed in the overlap region. Sequences shorter than 220 bp and with quality scores
less than 20 were filtered using the split_libraries_fastq.py script in QIIME. Sequence chimeras
were identified and filtered with USEARCH61 (Edgar, 2010; Edgar et al., 2011). Filtered
sequences were clustered into operational taxonomic units (OTU's) based on 3% sequence
divergence using USEARCH61 (Edgar, 2010). Representative sequences of each OTU were
identified based on the cluster seed, and were classified using a naïve Bayesian algorithm with
the Ribosomal Database Project (RDP) Classifier program version 2.2 (Wang et al., 2007).
Archaeal sequences were removed from the sequence libraries prior to further analysis of the
bacterial community. The representative sequences were aligned to the Greengenes core
reference alignment (DeSantis et al., 2006) using PyNAST (Caporaso et al., 2010a). Weighted

54
UniFrac distances (Lozupone and Knight, 2005) were calculated with QIIME to determine
changes in phylogenetic community structure over time. Community richness was determined by
rarefying each sample based on the lowest number of sequences observed in a single sample, and
the community evenness was estimated with the Gini coefficient (Wittebolle et al., 2009).
3.3.6 Analytical Methods
The total gas production was measured based on the pressure increase in the bioreactors using a
handheld pressure transducer (Testo 3123, Testo, Sparta, New Jersey). The change in headspace
volume over time within the batch vials due to liquid sampling was accounted for when
determining the total gas production. The methane content of the headspace was measured in
triplicate by GC-FID (Hewlett Packard, 5880 A) at each gas pressure sampling point. All
measured gas volumes are reported at standard temperature and pressure (1 atm pressure and
0°C). The pH of bioreactor samples was measured using an Inolab pH 7310 meter (WTW,
Weilheim, Germany). TS and VS were determined according to Standard Methods (Eaton &
Franson, 2005). VFA (acetate, propionate, butyrate, iso-butyrate, valerate, iso-valerate, capronate
and iso-capronate) were analyzed by GC-FID (HP 6890, Hewlett Packard), and were separated
with a BP21 (FFAP) column (30m x 0.32mm x 0.25µm, SGE Analytical Science) as described
previously (Jonsson and Borén, 2002).
The protocol for LCFA extraction and analysis was adapted from Lalman and Bagley (2000).
Bioreactor sludge samples were stored at -20°C and thawed at 4°C prior to LCFA extraction. 1
mL of sample was transferred to a 10 mL glass vial, and the following were added: 100 µL of 10
g L-1 pentadecanoic acid (>99% purity, Sigma Aldrich, St. Gallen, Switzerland) in methanol as in
internal standard (IS), 200 µL of 250 g L-1 sodium chloride in MilliQ water, two drops of 50%

55
sulfuric acid, and 2 mL of 1:1 hexane:methyl-tert-butylether (MTBE). Samples were then sealed
with Teflon-lined caps, vortexed to mix, placed on an orbital shaker at 250 rpm for 20 minutes
before centrifuging at 4,500 x g for 10 minutes. The organic supernatant was decanted for
analysis by GC-FID (Clarus 580, Perken-Elmer) with a split/splitless injector. LCFA were
separated with a BP21 (FFAP) column (30m x 0.32mm x 0.25µm, SGE Analytical Science),
with He as the carrier-gas at a flow of 2 mL min-1 and a split-ratio of 1:10. The injector
temperature was 250°C and the injection volume was 1 µL. The detector temperature was 280°C
and the detector flow was comprised of 45 mL min-1 H2 and 450 mL min-1 air. The oven
temperature was initially 160°C with a 20°C min-1 ramp to 225°C, isothermal for 15 minutes,
then a final 5°C min-1 ramp to 240°C. Calibration standards included 10, 25, 50, 100, 250, 500,
and 1000 mg L-1 of palmitic, stearic, and oleic acids (>99% purity, Sigma Aldrich), each
containing 500 mg L-1 of pentadecanoic acid (IS) dissolved in 1:1 hexane:MTBE. The average
recovery of palmitic acid, stearic acid, and oleic acid was 88%, 87%, and 102%, respectively.
3.3.7 Statistical Analysis
Changes in abundance based on qPCR data were determined using two-tailed t-tests with
biological (n=3) and technical replicates (n=2). Changes in abundance and microbial community
structure parameters (i.e. Unifrac distances, evenness, richness) based on high throughput
amplicon sequencing data were determined using two-tailed t-tests with biological replicates
(n=3).

56
3.4 RESULTS
3.4.1 Validation of Syntrophomonas and Syntrophus Genus-Level qPCR Assays
The qPCR primer and probe sets developed for Syntrophomonas and Syntrophus successfully
detected all species belonging to the respective target groups during the specificity testing with
pure-culture DNA (Figures A1 and A2, Supplemental Information). Moreover, the in silico
analysis of the Syntrophus and Syntrophomonas qPCR assays showed that between 88% and
97% of target 16S rRNA gene sequences in the RDP database matched the corresponding
primers and probe sets (Table 3-2), indicating that false-negative results were minimized due to
the high target group coverage of the assays. Slopes of the calibration dilution series were
calculated by performing linear regressions on plots of Ct values versus the log10 of the template
concentrations. The reproducibility of the qPCR assays was tested by generating 8 standard
calibration curves over approximately 4 months, yielding average slopes of -3.30 and -3.32 for
the Syntrophomonas and Syntrophus sets, respectively. These average qPCR calibration slopes
for the Syntrophomonas and Syntrophus assays corresponded to average PCR efficiencies of
101% and 100%, respectively. The relative standard deviations of the slopes and intercepts of
standard calibration curves were less than 3%. The linear dynamic range of both primer/probe
sets was between 25 to 108 gene copies (Figures A3 and A4, Supplemental Information).
The in silico testing of the Syntrophomonas qPCR assay identified potential false-positive 16S
rRNA gene sequences from non-target organisms. Potentially interfering sequences with 4 to 5
total mismatches within the primer and probe oligonucleotide sequences aligned to the genera:
Desulfotomaculum, Desulfitibacter, Syntrophothermus, Thermosyntropha, Thermoanaerobacter,
Halomonas, and Chromohalobacter. Sequences from the genus Pelospora were also identified as

57
potential false-positives with less than 4 total mismatches in the primer and probe sequences of
the Syntrophomonas qPCR assay. Yet, Syntrophothermus, Thermosyntropha, and
Thermoanaerobacter are thermophilic (Sekiguchi et al., 2000; Svetlitshnyi et al., 1996; F. Zhang
et al., 2012), while Halomonas and Chromohalobacter species thrive in hypersaline
environments (Arahal and Ventosa, 2006; Mata et al., 2002), and are thus not expected to be
present in the study bioreactors. Moreover, no sequences aligning to Desulfotomaculum,
Halomonas, Chromohalobacter, and Thermoanaerobacter were detected by high-throughput
amplicon sequencing of the bioreactor samples, while sequences aligning to Desulfitibacter and
Syntrophothermus were detected below 0.1% relative abundance and Thermosyntropha and
Pelospora sequences remained below 0.5% relative abundance. It is therefore unlikely that DNA
from the above groups interfered with the specificity of the Syntrophomonas qPCR assay applied
to the mesophilic bioreactors. Moreover, the specificity of the Syntrophomonas qPCR assay was
verified with no observed amplification of Desulfitibacter alkalitolerans DNA (5 total
mismatches), and minimal amplification of Desulfotomaculum kuznetsovii DNA (4 total
mismatches) (Figure A1, Supplemental Information). The potential for interference with the
Syntrophomonas qPCR assay due to the presence of Desulfotomaculum DNA was further
negated by demonstrating that the addition of D. kuznetsovii DNA (0.6 ng) to each standard in
the calibration curve had no significant impact on the slope of the standard curve between 100 to
108 gene copies (Figure A5, Supplemental Information). The Syntrophomonas 16S rRNA gene
concentration in the bioreactor DNA samples also showed no significant change when spiked
with 106 to 107 16S gene copies of D. kuznetsovii (Figure A6, Supplemental Information) (p >
0.10), and testing of all other pure-culture isolates with the Syntrophomonas qPCR assay showed
no amplification of non-target DNA (Figure A1, Supplemental Information). The

58
Syntrophomonas qPCR assay was therefore highly specific for Syntrophomonas 16S rRNA
genes.
No potential non-target 16S rRNA gene sequences were found with less than 2 mismatches in
each of the three oligonucleotides in the Syntrophus primer/probe set (up to 6 mismatches total)
during the in-silico database searches. Furthermore, the specificity testing showed that the
Syntrophus primer/probe set did not amplify DNA from Desulfomonile tiedjei (Figure A2,
Supplemental Information), a species that also belongs to the family Syntrophaceae, nor was
amplification observed with other non-target DNA samples (Figure A2, Supplemental
Information). The effect of non-target DNA on the efficiency of the Syntrophus primer/probe set
was assessed by spiking each standard in the calibration curve with D. tiedjei DNA (0.5 ng
DNA), which had no significant impact on the PCR slope or linear dynamic range between 25 to
108 gene copies (Figure A7, Supplemental Information). Thus, false-positive results were
minimized by the high target specificity of the Syntrophus qPCR assay.
3.4.2 Specific Mineralization Rates of Oleic Acid in Methanogenic Bioreactors
The amount of oleic acid added to the bioreactors during batch feeding was more than doubled
by the fifth batch degradation cycle (Table 3-1), and for all degradation cycles most of the oleic
acid was metabolized (Table A2, Supplemental Information). The detection of stearic, palmitic,
and acetic acids as intermediates from oleic acid (Table A2, Supplemental Information) indicated
that β-oxidation was the primary degradation pathway for oleic acid metabolism (Lalman and
Bagley, 2001; Pereira et al., 2002; Weng and Jeris, 1976). While the VS concentration decreased
in each consecutive batch cycle due to the replacement of a fraction of the liquid volume with
anaerobic basal medium during feeding, the initial specific methane production rate (normalized

59
to VS) increased after each batch feeding (Table 3-1). This observation suggested an increase in
the fraction of LCFA β-oxidizing consortia, as discussed below.
3.4.3 Quantitative Dynamics of Syntrophic β-Oxidizing Bacteria by qPCR
The newly developed qPCR assays targeting the β-oxidizing genera of Syntrophomonas and
Syntrophus were applied to the triplicate bioreactors degrading oleic acid. Changes in the 16S
rRNA gene concentration of the syntrophic bacterial groups are shown in Figure 3-1A and
Figure 3-1B. The Syntrophomonas 16S rRNA gene concentration significantly increased from
4.2×10⁴ to 22×104 copies ng-1 DNA during the bioreactor operation (p=1E-11; Figure 3-1A),
while the Syntrophus 16S rRNA gene concentration significantly decreased from 90 to 9 copies
ng-1 DNA (p=2E-10; Figure 3-1B). The 16S rRNA gene concentration of the Bacteria domain
slightly increased throughout the bioreactor operation from 5.9×10⁵ to 7.1×10⁵ copies ng-1 DNA
(p=0.002). The gene copy levels of the two syntrophic β-oxidizing groups were normalized to
that of the Bacteria domain to assess the relative abundances of the groups over time (Figure
3-1C and Figure 3-1D). Figure 3-1C illustrates the significant increase in Syntrophomonas
abundance from 7% of the bacterial 16S rRNA gene concentration initially to approximately
31% after the last batch feeding of oleic acid. The average relative abundance of
Syntrophomonas in each batch degradation period correlated strongly with the initial specific
methane production rate from oleic acid (Pearson’s coefficient = 0.99; Figure 3-2A). In contrast,
the Syntrophus 16S rRNA gene was quantified at an initial relative abundance of 0.015% and
decreased to 0.001% of the bacterial 16S rRNA gene concentration by the end of bioreactor
operation (Figure 3-1D). These results indicated that Syntrophomonas species, but not
Syntrophus species, were actively growing from the degradation of oleic acid in the bioreactors.
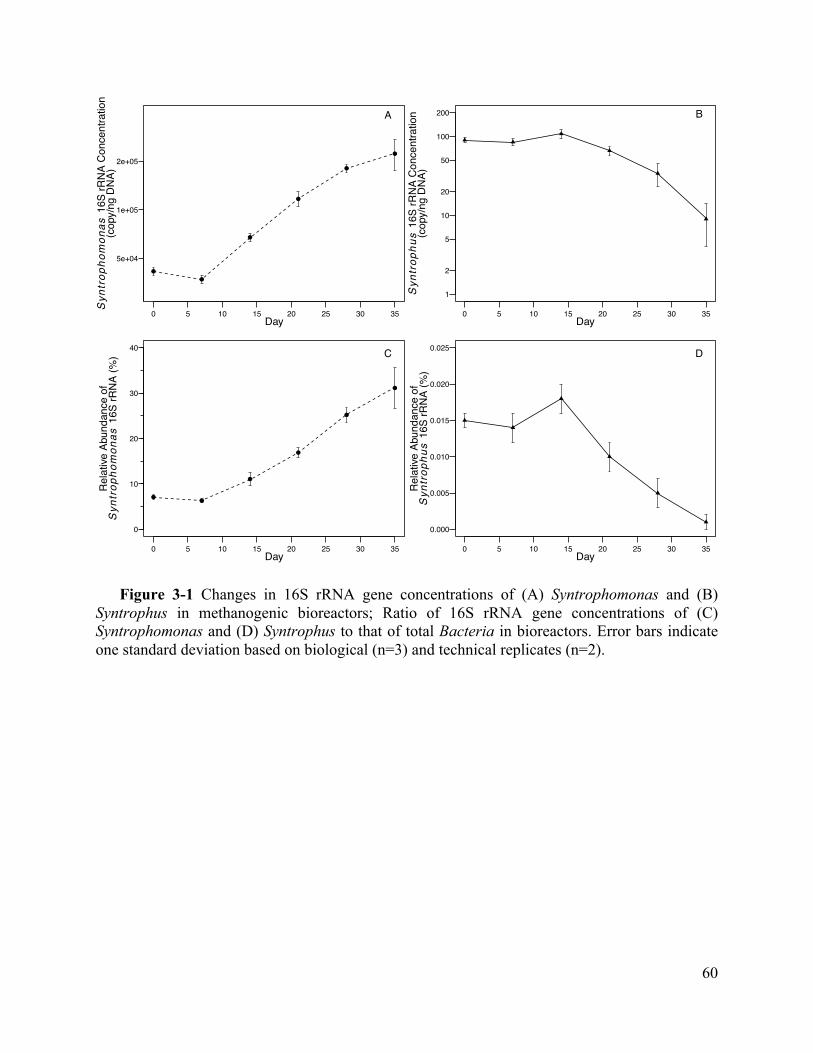
60
Figure 3-1 Changes in 16S rRNA gene concentrations of (A) Syntrophomonas and (B) Syntrophus in methanogenic bioreactors; Ratio of 16S rRNA gene concentrations of (C) Syntrophomonas and (D) Syntrophus to that of total Bacteria in bioreactors. Error bars indicate one standard deviation based on biological (n=3) and technical replicates (n=2).
●
●
●
●
●
●
0 5 10 15 20 25 30 35
5e+04
1e+05
2e+05
Day
Syntrop
homon
as 1
6S rR
NA
Con
cent
ratio
n(c
opy/
ng D
NA)
A
0 5 10 15 20 25 30 35
1
2
5
10
20
50
100
200
Day
Syntrop
hus
16S
rRN
A C
once
ntra
tion
(cop
y/ng
DN
A)
B
●●
●
●
●
●
0 5 10 15 20 25 30 35
0
10
20
30
40 C
Day
Rel
ative
Abu
ndan
ce o
fSyntrop
homon
as 1
6S rR
NA
(%)
0 5 10 15 20 25 30 35
0.000
0.005
0.010
0.015
0.020
0.025 D
Day
Rel
ative
Abu
ndan
ce o
fSyntrop
hus
16S
rRN
A (%
)

61
Figure 3-2 Correlation between the initial specific methane production rate during the oleic
acid batch degradation periods and the average relative abundance of (A) Syntrophomonas 16S rRNA genes in bacterial community, and (B) methanogenic archaea 16S rRNA genes in prokaryotic community. The total methanogenic archaea gene concentration was determined as the sum of all methanogen target groups, and the prokaryotic gene concentration was determined as the sum of methanogenic archaea and total Bacteria gene counts. Error bars for the specific methane production rate indicate one standard deviation based on biological replicates (n=3), and error bars for relative abundance values indicate one standard deviation based on biological (n=3) and technical replicates (n=2).
●
●
●
●
●
5 10 15 20 25 30 35
0
50
100
150
200
250
300
Syntrophomonas Relative Abundance (%)
Spec
ific
Met
hane
Pro
duct
ion
Rat
e(m
L C
H4/g
VS/
d)
A
R2=0.97
●
●
●
●
●
15 20 25 30 35
0
50
100
150
200
250
300
Methanogenic Archaea Relative Abundance (%)
Spec
ific
Met
hane
Pro
duct
ion
Rat
e(m
L C
H4/g
VS/
d)
B
R2=0.95

62
3.4.4 Quantitative Dynamics of Methanogenic Archaea by qPCR
The sum of the 16S rRNA gene concentrations of all methanogenic archaeal target groups
increased 2.8-fold throughout the bioreactor operation, from 1.4×10⁵ to 3.9×10⁵ copies ng-1 DNA
(p=0.001; Figure 3-3A). Correspondingly, the ratio of the total methanogenic archaea 16S rRNA
gene concentration to that plus the Bacteria domain (representing the total prokaryotic
community) significantly increased from 19% to 35% throughout bioreactor operation
(p=0.0004). The relative abundance of the total methanogenic archaea 16S rRNA gene
concentration in the prokaryotic community correlated strongly with the initial specific methane
production rate from oleic acid (Pearson’s coefficient = 0.97; Figure 3-2B). The change in 16S
rRNA gene concentration of each targeted methanogenic group is shown in Figure A8
(Supplemental Information). The 16S rRNA gene concentration of each methanogenic archaea
group was normalized to the sum of all methanogenic archaea targets to infer their relative
abundances over time, as shown in Figure 3-3B. The methanogenic archaeal community
composition stayed relatively stable over time, with the hydrogenotrophic order of
Methanomicrobiales accounting for 70% of the methanogenic archaeal 16S rRNA gene
concentration and the aceticlastic family of Methanosaetacea accounting for 30% (Figure 3-3B).
The order of Methanobacteriales and family of Methanosarcinaceae comprised less than 1% of
the methanogenic archaeal 16S rRNA gene concentration throughout bioreactor operation, while
the order of Methanococcales was not detected by the qPCR assay (Figure 3-3B).
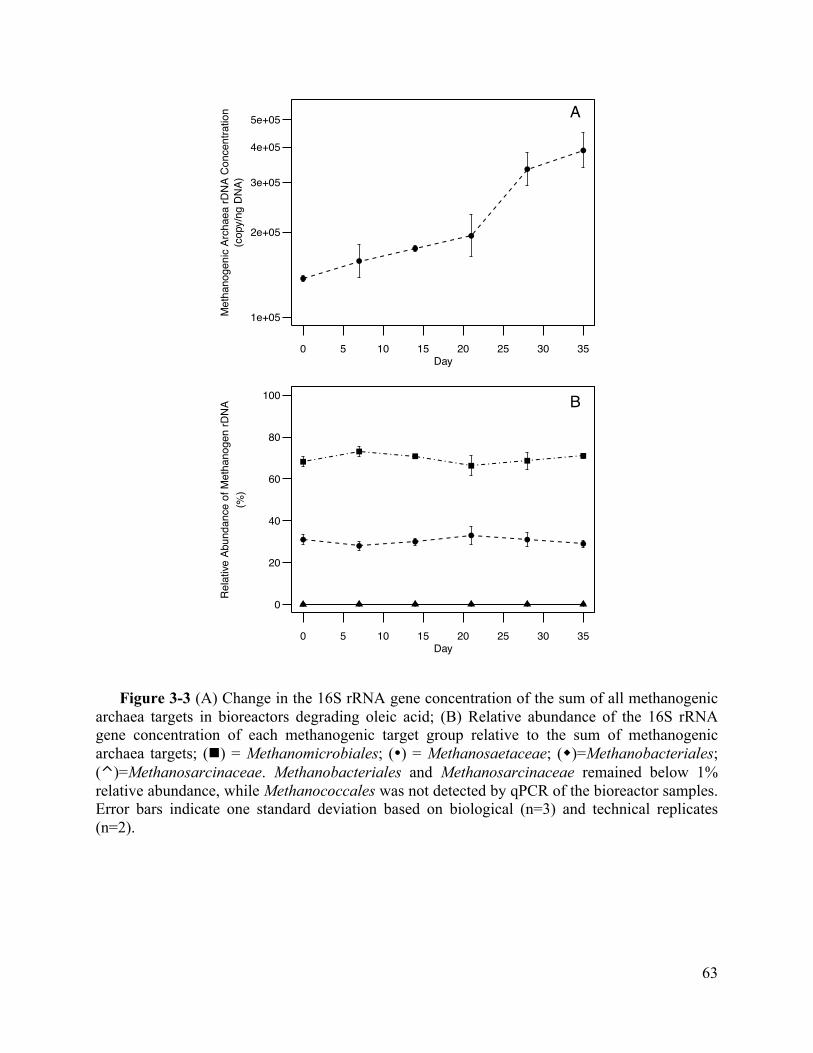
63
Figure 3-3 (A) Change in the 16S rRNA gene concentration of the sum of all methanogenic archaea targets in bioreactors degrading oleic acid; (B) Relative abundance of the 16S rRNA gene concentration of each methanogenic target group relative to the sum of methanogenic archaea targets; (n) = Methanomicrobiales; (�) = Methanosaetaceae; (w)=Methanobacteriales; (⌃)=Methanosarcinaceae. Methanobacteriales and Methanosarcinaceae remained below 1% relative abundance, while Methanococcales was not detected by qPCR of the bioreactor samples. Error bars indicate one standard deviation based on biological (n=3) and technical replicates (n=2).
●
●
●
●
●
●
0 5 10 15 20 25 30 35
1e+05
2e+05
3e+05
4e+05
5e+05 A
Day
Met
hano
geni
c Ar
chae
a rD
NA
Con
cent
ratio
n(c
opy/
ng D
NA)
●●
●●
●●
0 5 10 15 20 25 30 35
0
20
40
60
80
100 B
Day
Rel
ative
Abu
ndan
ce o
f Met
hano
gen
rDN
A(%
)

64
3.4.5 Dynamics of Bacterial Community by High-throughput Amplicon Sequencing of 16S
rRNA Genes
Bacterial community dynamics in the triplicate bioreactors were monitored using Illumina-based
high-throughput amplicon sequencing of 16S rRNA genes for 18 biomass samples, which
produced a total of 1,180,000 non-chimeric bacterial sequence reads and an average of 68,000
sequences per sample. The bacterial community structure of the bioreactors significantly
changed over time, while similar community structures were maintained between the triplicate
bioreactors. This result was apparent by the significant increase in phylogenetic structure
differences within the bioreactor microbiomes (determined by weighted UniFrac distances)
relative to the initial conditions (p=0.0002; Figure A9, Supplemental Information), and by the
similar dynamics within the OTU sets of the triplicate bioreactors (Figure 3-4). The richness of
the bacterial community significantly decreased throughout the bioreactor operation (p=0.005),
as did the community evenness (p=0.007; Figure A9, Supplemental Information). These
observed changes in the diversity and phylogenetic structure within the bacterial communities
indicated that a specialized population of bacteria developed during the degradation of oleic acid
and its byproducts, during which non-growing bacterial groups were washed out of the
bioreactors.
65
Figure 3-4 Change in the relative abundance of each OTU that accounted for 1% or more of the bacterial community during the bioreactor operation relative to initial conditions, as determined by high-throughput amplicon sequencing of 16S rRNA genes. The left axis shows a phylogenetic clustering of the OTU's based on sequence alignment with MUSCLE (http://www.ebi.ac.uk). The right axis shows the genus level classification of each representative OTU sequence. The scale on the color key is relative to the entire community (e.g., an increase in relative abundance from 1% to 5% would be shown as +4%). The relative abundance change of each OTU is shown for all reactor replicates (e.g. 1, 2, 3) at days 7, 14, 21, 28, and 35.
The growth dynamics of all OTU’s representing more than 1% relative abundance are shown in
Figure 3-4. The bacterial communities were dominated primarily by the orders Clostridiales and
Anaerolineales, which together accounted for over 55% of the population by the end of
bioreactor operation (Figure 3-5A) and were comprised mainly of the genera Syntrophomonas
and Levilinea, respectively (Figure 3-5B). Syntrophomonas became the most abundant genus
within the bacterial communities by the end of the experiment, increasing in relative abundance
from 6% to 19% of sequence reads (Figure 3-5B). Syntrophomonas-affiliated OTU’s that were
detected above 1% relative sequence abundance (7 OTU’s total) all showed general patterns of
BogoriellaChelonobacterPropioniferaxTreponemaExilispiraCoenoniaPetrimonasPaludibacterOrnithobacteriumPaludibacterPaludibacterSyntrophomonasSyntrophomonasSyntrophomonasSyntrophomonasSyntrophomonasSyntrophomonasSyntrophomonasSedimentibacterAlkaliphilusAnaerovirgulaEubacteriumAminobacteriumPapillibacterSynergistesCloacibacillusBellilineaLeptolineaLevilineaLevilineaLevilineaLeptolineaEscherichia/ShigellaSmithellaCaldithrix
OTU 17OTU 4OTU 84OTU 2OTU 63OTU 27OTU 1OTU 55OTU 3OTU 15OTU 29OTU 16OTU 8OTU 44OTU 19OTU 28OTU 12OTU 31OTU 11OTU 26OTU 6OTU 46OTU 24OTU 21OTU 7OTU 37OTU 18OTU 13OTU 62OTU 14OTU 0OTU 43OTU 5OTU 22OTU 10
-5% 0 +5%Abundance
Day 7 Day 14 Day 21 Day 28 Day 35
1 2 3 1 2 3 1 2 3 1 2 3 1 2 3
Change

66
increased abundance within the bioreactor microbiomes over time (Figure 3-4). Other bacterial
orders that experienced growth in the bioreactor microbiomes included Synergistales and
Enterobacteriales, which were comprised mainly of the genera Synergistes and
Escherichia/Shigella, respectively (Figure 3-4 and Figure 3-5A). Notably, no Syntrophus
sequences were detected above 0.3% relative abundance throughout the bioreactor operation
(data not shown), which is consistent with the results of the qPCR assay.
Figure 3-5 Relative abundance of bacterial groups based on high-throughput amplicon sequencing of 16S rRNA genes from bioreactor samples taken on days 0, 7, 14, 21, 28, and 35 showing (A) the 12 most abundant bacterial orders, and (B) the 20 most abundant genera. The groups were ranked based on their maximum observed relative abundances, and all other groups were combined and are shown as “Other”. The abundances of groups shown at each time point represent an average of the triplicate bioreactors.
3.5 DISCUSSION
The dynamics and ecological role of syntrophic β-oxidizing bacteria in methanogenic bioreactors
has been poorly understood due to a relative lack of information regarding the concentration of
these groups within anaerobic communities (H. Ariesyady et al., 2007; Hansen et al., 1999;
McMahon, 2001; McMahon et al., 2004; Narihiro et al., 2012). The application of the newly
developed TaqMan qPCR assays in combination with high-throughput amplicon sequencing of
Day0 7 14 21 28 35
RelativeSequenceAbundance(%
)
B
0
20
40
60
80
100OtherExilispiraBogoriellaCloacibacillusEubacteriumSmithellaLongilineaSedimentibacterCaldithrixSynergistesPaludibacterBellilineaAnaerovirgulaLeptolineaOrnithobacteriumEscherichia/ShigellaTreponemaChelonobacterPetrimonasLevilineaSyntrophomonas
0
20
40
60
80
100O therTherm oanaerobacte ra lesS yntrophobacte ra lesD eferr ibacte ra lesA ctinom yceta lesE nterobacteria lesS ynerg is ta lesF lavobacte ria lesS p irochaeta lesPasteure lla lesB actero ida lesA naero linea lesC lostr id ia les
Day0 7 14 21 28 35
RelativeSequenceAbundance(%
)
A
Day0 7 14 21 28 35
RelativeSequenceAbundance(%
)
B
0
20
40
60
80
100OtherExilispiraBogoriellaCloacibacillusEubacteriumSmithellaLongilineaSedimentibacterCaldithrixSynergistesPaludibacterBellilineaAnaerovirgulaLeptolineaOrnithobacteriumEscherichia/ShigellaTreponemaChelonobacterPetrimonasLevilineaSyntrophomonas
0
20
40
60
80
100
Day0 7 14 21 28 35
RelativeSequenceAbundance(%
)
A

67
bacterial 16S rRNA genes proved to be a valuable approach to monitor the quantitative dynamics
of syntrophic β-oxidizing communities in bioreactors mineralizing oleic acid. Thus, the
combination of these assays may provide a platform for analyzing and surveying microorganisms
in anaerobic digesters degrading lipid rich wastes.
The increase in the initial specific methane production rate by 4.6-times throughout the
experimental period showed that the bioreactor communities developed a greater capacity to
convert oleic acid into methane, which was likely caused by the growth of LCFA-degrading
consortia within the community. The increase in the relative abundance of Syntrophomonas
species in the bioreactors to over 30% of the bacterial community determined by qPCR (Figure
3-1C) showed that this group was actively growing through oleic acid β-oxidation. The strong
correlation between the relative abundance of Syntrophomonas species and the initial specific
methane production rate from oleic acid (Figure 3-2A) further suggested that Syntrophomonas
species contributed to the increase in mineralization rates of the LCFA observed in the
bioreactors at higher oleic acid loadings. High-throughput amplicon sequencing corroborated the
observed growth of Syntrophomonas species by predicting that Syntrophomonas-affiliated
sequences increased to approximately 20% of the bioreactor communities (Figure 3-5B). The
various extent of growth observed within the Syntrophomonas-affiliated OTU’s (Figure 3-4)
suggested that different Syntrophomonas ecotypes may express different physiological capacities
to degrade oleic acid. A phylogenetic comparison of 16S rRNA gene sequences of characterized
Syntrophomonas species with that of the most abundant Syntrophomonas-affiliated OTU’s
indicated that the enriched OTU's were distributed throughout the genus (Figure A10,
Supplemental Information). The importance of Syntrophomonadaceae species in anaerobic

68
communities degrading LCFA has been implicated in prior studies based on molecular
fingerprinting techniques (Baserba et al., 2012; Sousa et al., 2007a). Yet, the quantitative results
provided by the newly developed qPCR assays, in combination with high throughput amplicon
sequencing, further showed that increased oleic acid degradation rates could be obtained with
higher relative abundances of β-oxidizing Syntrophomonas species. Thus, the abundance of
syntrophic β-oxidizing bacteria, as measured by the novel qPCR assays, may be used to indicate
the capacity of anaerobic digester communities to β-oxidize fatty acids, in part involving LCFA.
In contrast to Syntrophomonas, the relative abundance of the Syntrophus genus was much lower
in the initial seed and decreased throughout the bioreactor operation as measured by qPCR. The
high-throughput amplicon sequencing results also indicated that Syntrophus-affiliated sequences
decreased in relative abundance. These results suggest that Syntrophus species were not growing
through oleic acid β-oxidation either due to out-competition by other populations or to LCFA
inhibition. The ability of Syntrophus species to degrade oleate remains to be determined (Sousa
et al., 2009), and their inability to do so could have also contributed to their observed washout.
The disappearance of Proteobacteria-related species has been previously reported based on
PCR-DGGE profiles of anaerobic communities degrading oleic acid in batch (Sousa et al.,
2007a) and continuous (Baserba et al., 2012) modes. It has also been suggested that
Deltaproteobacteria were more strongly associated with the degradation of saturated versus
unsaturated LCFA (Hatamoto et al., 2007c; Sousa et al., 2009). The high-throughput amplicon
sequencing indicated that Smithella, a genus also within the Syntrophaceae family that is
phylogenetically closely related to Syntrophus (Gray et al., 2011), maintained a stable abundance
in the bacterial microbiomes over time (Figures 3-4 and 3-5B). Smithella species have been

69
associated with syntrophic degradation of long-chain alkanes (Embree et al., 2014; Gray et al.,
2011), yet it is unclear if members of Smithella take part in β-oxidizing LCFA. However, a
partial genome of an uncultured Smithella species obtained from an enriched methanogenic
hexadecane-degrading community showed that the bacterium contained genes involved in LCFA
β-oxidization (Embree et al., 2014). The saturated LCFA produced during oleic acid degradation
(Table A2, Supplemental Information) therefore may have supported the population of Smithella
in the bioreactors. Thus, despite the high target group coverage of the Syntrophus qPCR assay
developed in this study (Table 3-2), it is possible that other members of the Syntrophaceae
family not targeted by the qPCR assay, such as Smithella, were involved in LCFA degradation
within the bioreactors.
While previous studies have hypothesized a toxicity of LCFA towards methanogenic archaea
(Angelidaki and Ahring, 1992; Hanaki et al., 1981; Koster and Cramer, 1987), the observed
increase in the abundance of hydrogenotrophic and aceticlastic methanogens (Figure 3-3)
suggests that oleic acid and its intermediate degradation products did not exhibit a permanent
toxic effect on the targeted methanogenic groups. The strong correlation between the initial
specific methane production rate and the abundance of methanogenic archaea (Figure 3-2B)
further showed that higher concentrations of syntrophic β-oxidizing consortia resulted in more
efficient LCFA mineralization in the anaerobic bioreactors. The stable abundance of
Methanosaetaceae in the bioreactors revealed that this aceticlastic group was growing on the
acetate produced through oleic acid β-oxidation (Table A2, Supplemental Information), even
though oleic acid has been shown to inhibit aceticlastic methanogens (Hanaki et al., 1981; Hwu
and Lettinga, 1997; Koster and Cramer, 1987; Sousa et al., 2013). Salvador et al. (2013) showed

70
with PCR-DGGE that Methanosaeta was the dominant aceticlastic genus in continuously fed
bioreactors treating oleate-based waste with LCFA loadings greater than 10 g COD L-1 day-1.
Yet, it was recently shown that oleate was more toxic than palmitate to the aceticlastic
methanogens Methanosaeta concilii and Methanosarcina mazei (Sousa et al., 2013). The results
of this study provide quantitative evidence suggesting that both hydrogenotrophic and
aceticlastic methanogenic groups remained active during oleic acid degradation.
To the best of our knowledge, this is the first application of a high-throughput amplicon
sequencing approach to characterize anaerobic LCFA-degrading bacterial communities. The
changes in relative abundance of Syntrophomonas and Syntrophus sequences correlated with the
levels predicted by the respective qPCR assays (Pearson’s coefficients of 0.99, 0.93,
respectively; Figure A11, Supplemental Information), implying that this technique can be used to
compliment novel qPCR assays applied to complex environmental samples. The significant
difference in phylogenetic structure (weighted UniFrac distances) in the bacterial microbiomes
over time (Figure A9, Supplemental Information) showed that growth on oleic acid selected for
specialized bacterial populations, which in this case were dominated by Syntrophomonas species
(Figures 3-1, 3-4, 3-5). The high-throughput sequencing also detected the growth of bacterial
groups not previously characterized to participate in syntrophic LCFA β-oxidization (Figure 3-
4). For instance, Escherichia coli is known to β-oxidize LCFA anaerobically with nitrate as a
terminal electron acceptor (Campbell et al., 2003); yet the cause of the increase in relative
abundance of Escherichia/Shigella-affiliated sequences to 5% in these methanogenic bioreactors
(Figure 3-5B) is not known. Moreover, increases in the relative abundance of sequences aligning
with Synergistes and Levilinea (Figures 3-4 and 3-5), members of which have been respectively
71
associated with syntrophic short chain fatty acid (Ito et al., 2011) and protein degradation
(Yamada and Sekiguchi, 2009), suggested that the microbial oleic acid-degrading food web was
potentially complex. The increased abundance of these groups might be attributable to growth on
endogenous decay products and/or on byproducts of LCFA β-oxidization. However, the
ecological role of these groups in oleic acid-degrading communities warrants further
investigation.
Collectively, the results of this study contributed new evidence to show that increased
mineralization rates of LCFA were a result of quantitative shifts within the microbiome towards
a higher abundance of LCFA-degrading Syntrophomonas bacteria and methanogenic archaea.
The newly developed qPCR assays may thus serve as a novel method to determine the fatty acid
β-oxidization potential of AD reactors based on the concentration of syntrophic β-oxidizing
bacteria within the community. Such an approach may lead to better anaerobic digester feeding
strategies that result in stable elevated methane production from waste fats, oils, and grease.
3.6 SUPPLEMENTAL INFORMATION AVAILABLE
The Supplemental Information for this Chapter is available online at
(http://dx.doi.org/10.1093/femsec/fiv028), and is included in this document as Appendix A.

72
Chapter 4. MICROBIAL COMMUNITY ADAPTATION
INFLUENCES LONG-CHAIN FATTY ACID CONVERSION
DURING ANAEROBIC CODIGESTION OF FATS, OILS, AND
GREASE WITH MUNICIPAL SLUDGE
This work is published as:
Ziels, R.M., Karlsson, A., Beck, D.A., Ejlertsson, J., Yekta, S.S., Bjorn, A., Stensel, H.D. & Svensson, B.H., (2016). Microbial community adaptation influences long-chain fatty acid
conversion during anaerobic codigestion of fats, oils, and grease with municipal sludge. Water Research, 103, doi:http://dx.doi.org/10.1016/j.watres.2016.07.043
4.1 ABSTRACT
Codigesting fats, oils, and greases with municipal wastewater sludge can greatly improve
biomethane recovery at wastewater treatment facilities. Process loading rates of fats, oils, and
greases have been previously tested with little knowledge of the digester microbial community
structure, and high transient fat loadings have led to long chain fatty acid (LCFA) accumulation
and digester upsets. This study utilized recently-developed quantitative PCR assays for
syntrophic LCFA-degrading bacteria along with 16S amplicon sequencing to relate changes in
microbial community structure to LCFA accumulation during transient loading increases to an
anaerobic codigester receiving waste restaurant oil and municipal wastewater sludge. The 16S
rRNA gene concentration of the syntrophic β-oxidizing genus Syntrophomonas increased to
~15% of the Bacteria community in the codigester, but stayed below 3% in the control digester
that was fed only wastewater sludge. Methanosaeta and Methanospirillum were the dominant
methanogenic genera enriched in the codigester, and together comprised over 80% of the
Archaea community by the end of the experimental period. Constrained ordination showed that

73
changes in the codigester Bacteria and Archaea community structures were related to measures
of digester performance. Notably, the codigester LCFA concentration was positively correlated
to the specific loading rate of waste oil normalized to the Syntrophomonas 16S rRNA
concentration in the codigester. Specific loading rates of 0 to 1.5x10⁻¹² g VS oil/16S gene
copies-day resulted in LCFA concentrations below 30 mg/g TS, whereas LCFA accumulated up
to 104 mg/g TS at higher transient loading rates. Based on the community-dependent loading
limitations found, enhanced biomethane production from high loadings of fats, oils and greases
can be achieved by promoting a higher biomass of slow-growing syntrophic consortia, such as
with longer digester solids retention times. This work also demonstrates the potential for
controlling the loading rate of fats, oils, and greases based on the analysis of the codigester
community structure, such as with quantitative PCR measurements of syntrophic LCFA-
degrading bacteria abundance.
4.2 INTRODUCTION
Anaerobic digestion is commonly used at municipal wastewater treatment plants (WWTPs) to
process waste sludge and recover renewable energy as biomethane. Fats, oils, and greases (FOG)
are desirable substrates for enhancing biomethane recovery through codigestion because they
have a methane yield potential per g VS that is 250% to 350% greater than the wastewater sludge
typically fed to municipal digesters (Davidsson et al., 2008; Girault et al., 2012; Luostarinen et
al., 2009). Reported increases in digester methane production from 140% to 620% during FOG
codigestion with wastewater sludge (Wan et al., 2011; Wang et al., 2013) have demonstrated the
potential to significantly improve economics and reduce energy footprints of municipal WWTPs
with FOG codigestion.

74
When fats and oils are added to the anaerobic digestion process, they are rapidly hydrolyzed into
their major constituents of glycerol and long-chain fatty acids (LCFA) (Hanaki et al., 1981).
After lipid hydrolysis, most of the energy content resides in LCFA, which can comprise over
90% of the chemical oxygen demand of the original lipid molecule (Sousa et al., 2009). The
formation of methane from LCFA involves a syntrophic partnership of proton-reducing
acetogenic bacteria, which utilize the β-oxidation pathway to convert LCFA into acetate and
formate/hydrogen, along with aceticlastic and hydrogenotrophic methanogenic archaea (Schink,
1997; Sousa et al., 2009; Weng and Jeris, 1976). All of the isolated bacterial species known to β-
oxidize LCFA syntrophically belong to two families, Syntrophomonadaceae and Syntrophaceae
(Hatamoto et al., 2007a; Jackson et al., 1999; McInerney, 1992; Sousa et al., 2007b; Wu et al.,
2006). Generally, the conversion of LCFA into methane is considered the rate-limiting step for
lipid degradation in anaerobic digesters (Cirne et al., 2007).
Process failures observed at elevated FOG loading rates have impeded the ability to fully exploit
higher biomethane production during FOG codigestion with municipal wastewater sludge
(Davidsson et al., 2008; Girault et al., 2012; Luostarinen et al., 2009; Noutsopoulos et al., 2013;
Wan et al., 2011; Wang et al., 2013). Specifically, the LCFA released during lipid hydrolysis can
inhibit anaerobic microorganisms at high concentrations (Angelidaki and Ahring, 1992; Koster
and Cramer, 1987; Lalman and Bagley, 2000; Rinzema et al., 1994), thereby limiting their
bioconversion into methane. Causes of inhibition have been attributed to LCFA adsorption onto
cell surfaces, which can lead to direct toxicity (Hanaki et al., 1981; Rinzema et al., 1994) and/or
substrate transport limitations (Pereira et al., 2005). While aceticlastic methanogens are believed
to be the most sensitive group to LCFA toxicity (Koster and Cramer, 1987; Lalman and Bagley,
75
2001, 2000; Rinzema et al., 1994), the inhibition of hydrogenotrophic methanogens and
syntrophic bacteria by LCFA has also been suggested (Hanaki et al., 1981; Lalman and Bagley,
2002; Pereira et al., 2005; Roy et al., 1985). Reported threshold values for FOG loading that led
to decreased methane yields during codigestion with municipal wastewater sludge ranged from
~0.4 to 2.1 g VS/L-d (Girault et al., 2012; Luostarinen et al., 2009; Noutsopoulos et al., 2013;
Wan et al., 2011; Wang et al., 2013). However, these empirical FOG loading thresholds do not
account for digester microbial populations and their role in LCFA conversion, and are thus of
limited use for predicting the response of a digester following transient increases in FOG
loading. An improved understanding of the relationship between digester biomass composition
and LCFA accumulation is needed to develop operational strategies for stable codigester
operation with increased FOG loadings and enhanced methane recovery.
The importance of biomass adaptation for stable FOG digestion has been indicated by previous
studies. Silvestre et al. (2011) observed that stepwise increases in FOG loading led to the
development of biomass with higher LCFA β-oxidation and methanogenic activities during
codigestion with municipal sludge. Alves et al. (2001) found that both the tolerance to LCFA
toxicity as well as the LCFA-biodegradation activity increased with long-term exposure to lipids
in an anaerobic fixed-bed bioreactor. Similarly, long-term acclimation was identified as a key
factor influencing the resilience to LCFA toxicity in a series of digester sludges exposed to skim
milk and oleate based wastewaters (Silva et al., 2014). While these results collectively indicated
that biomass adaptation could affect the efficiency of FOG conversion, the microbial community
structures of these digester sludges were not assessed. The dynamics of LCFA-degrading
microbial communities have been previously studied using highly enriched systems with LCFA
76
as the primary carbon source (Salvador et al., 2013; Shigematsu et al., 2006; Sousa et al., 2007a;
Ziels et al., 2015). However, the relationship between the LCFA conversion efficiency and
microbial community structure during FOG codigestion with municipal wastewater sludge has
received little attention. The changes in LCFA-degrading community structure caused by
transient increases in FOG loading therefore need further study to enable better predictions of
acceptable FOG loadings during codigestion.
The main objective of this study was to elucidate the relationship between digester biomass
composition and LCFA conversion rates and removal efficiency during FOG codigestion with
municipal wastewater treatment sludge. Quantitative PCR targeting LCFA-degrading syntrophic
bacteria and methanogenic archaea was conducted along with Illumina 16S rRNA gene amplicon
sequencing of Bacteria and Archaea communities to monitor microbial population structure
changes in a FOG codigester and control digester treating municipal wastewater solids. The
specific goals were to: (1) determine the effects of FOG addition on the digester microbial
community structure, and (2) examine relationships between microbial community structure and
LCFA removal following transient variations in FOG loading.
4.3 MATERIALS AND METHODS
4.3.1 Digester Operation
Two semi-continuous complete-mix anaerobic digesters (4L working volume) were operated at
37°C with a 20-day hydraulic retention time (HRT) for 198 days. The digesters were mixed with
axial flow impellers at 275-325 rpm. They were started with anaerobic digester sludge collected
from Henriksdal WWTP in Stockholm, Sweden, and were fed with a mixture of waste primary

77
sludge (WPS) and waste activated sludge (WAS) collected from the same plant throughout the
experiment. The WAS+WPS was collected biweekly and stored at 4°C. The digesters were
manually fed once daily by withdrawing the volume of reactor liquid corresponding to the
volume of the feed prior to addition. The average feed WPS+WAS volatile solids (VS)
concentration was 28 ± 2 g VS/L and the feed sludge VS loading rate (VSLR) for both digesters
averaged 1.4 ± 0.1 g VS/L-day over the course of the experiment. After an initial startup period
of 53 days of only feeding WPS+WAS, waste cooking oil (hereby referred to as FOG) from a
nearby restaurant was added to one of the digesters for codigestion. The start of FOG codigestion
was defined as day 1 of the experimental period (Table 4-1). The FOG VS content was ~99%,
and its addition to the codigester was increased in a stepwise manner over time to 1.5 g VS/L-d
(52% of the total feed VS) by day 94 (Table 4-1).
Table 4-1 Total influent volatile solids loading rate (VSLR), FOG VSLR, and the percent of
FOG VS in the feed versus time for the FOG codigester. Values in parentheses indicate one standard deviation.
Days Total VSLR (g VS/L-day)
FOG VSLR (g VS/L-day)
% FOG in Feed
(VS-basis) -53 - 0 1.4 (0.2) 0 0 1 - 9 1.9 (0.1) 0.25 13
10 - 37 1.8 (0.1) 0.5 27 38 - 72 2.1 (0.1) 0.75 36 73 - 79 2.4 (0.0) 1.0 41 80 - 93 2.6 (0.1) 1.25 47 94 - 145 2.9 (0.1) 1.5 52
Digester performance was monitored with daily biogas production, methane content, pH, effluent
volatile fatty acid (VFA), effluent LCFA, total solids (TS), and VS. Biogas production was
measured with tipping bucket displacement gas meters (MilliGascounters, Ritter, Germany). The
biogas composition was analyzed weekly for methane, carbon dioxide, oxygen, and hydrogen
78
sulfide using a portable gas analyzer (Biogas Check, Geotech, UK). All measured gas volumes
are reported at standard temperature and pressure (1 atm pressure and 0°C). The TS and VS
contents of the sludge were determined according to Swedish Standard Method SS028311. The
pH of the digesters was measured using an Inolab pH 7310 meter (InoLab, Wissenschaftlich-
Technische Werkstätten, Germany) immediately after withdrawing sludge from the reactors.
VFA (acetate, propionate, butyrate, iso-butyrate, valerate, iso-valerate, capronate and iso-
capronate) were analyzed by GC-FID (HP 6890, Hewlett Packard), and were separated with a
BP21 (FFAP) column (30 m × 0.32 mm × 0.25 µm, SGE Analytical Science) as described
previously (Jonsson and Borén, 2002). LCFA were measured according Ziels et al. (2015) with
minor modifications. Briefly, 10 mL of digester sludge was centrifuged at 10,000 x g for 10 min,
and immediately decanted. Approximately 0.2 g of pelleted sludge was transferred to a pre-
weighed glass extraction vial, which was then dried at 80°C for 15 hr, allowed to cool, and
reweighed. 1 mL of water was then added to the sample, and the subsequent LCFA extraction
and quantification was conducted as described by Ziels et al. (2015). The average recovery of
palmitate (C16:0), stearate (C18:0), and oleate (C18:1) spiked to digester sludge samples was 100%,
92%, and 83%, respectively.
4.3.2 Batch Methanogenic Activity Assays
Batch methanogenic activity tests were conducted with biomass from both digesters in order to
determine the maximum conversion kinetics of acetate and oleate on days 0, 65, and 135,
according to the protocol by Karlsson et al. (2012). Briefly, 15 mL digester sludge aliquots
(0.17-0.19 g VS) were directly transferred into 160 mL glass serum bottles containing 130 mL of
anaerobic basal medium prepared according to Karlsson et al. (2012), and were then sealed with
butyl rubber septa. The bottles were flushed with a mixture of O2-free 80:20 N2:CO2 to ensure

79
anaerobic conditions. Substrate (either sodium acetate or oleic acid) was then added to an initial
concentration of 5 mM. Control vials without any added substrate were also included in each
batch test. All treatments were run in triplicate, and were maintained at 37°C for approximately
260 h without mixing. The gas production was measured based on the pressure increase in the
bottles using a handheld pressure transducer (Testo 3123, Testo, Sparta, New Jersey). The
methane content of the headspace was measured in triplicate by GC-FID (Hewlett Packard, 5880
A) at each gas pressure sampling point. The methane production in the control vials was
subtracted from the substrate-amended vials to determine the methane production attributed to
substrate conversion.
A modified Gompertz equation was used to describe the inoculum-corrected methane production
curves in the batch kinetic assays, as proposed by Palatsi et al. (2012) and Silva et al. (2014):
where M is the accumulated methane (mL CH4/L) at time = t (days), P is the maximum
cumulative methane production (mL CH4/L), qmax is the maximum methane production rate (mL
CH4/L-day), e is 2.7182818, and λ is the lag-phase time (days). All methane generation terms are
in reference to standard temperature and pressure. The model fitting and parameter standard error
estimation was conducted with nonlinear regression in R version 3.0.2.
80
4.3.3 Analysis of Microbial Community Structure
4.3.3.1 DNA Extraction and Quantification
Digester biomass samples were collected for DNA analysis on days 0, 37, 51, 64, 114 and 138
from the FOG codigester and on days 0, 64, 86 and 138 from the control. The samples were
prepared by transferring 10 mL of digester sludge aliquots directly into sterile 15 mL tubes,
immediately centrifuging at 10,000 x g for 10 min at 4°C, carefully decanting the supernatant,
and storing the remaining pellet at -20°C. DNA was isolated from approximately 0.2 g of wet
solids using the PowerSoil® RNA/DNA Isolation Kit (MO BIO, Inc, Carlsbad, California)
according to the manufacturer’s instructions. The concentration of extracted DNA was
immediately measured with the Quant-IT dsDNA High Sensitivity Assay Kit with a Qubit 2.0
flourometer (Invitrogen, Carlsbad, California). Triplicate DNA extractions were analyzed at each
sampling date to estimate variance in population abundances and ensure that observed changes in
community structure were not due to technical error. Extracted DNA was stored in nuclease-free
water at -20°C.
4.3.3.2 Quantitative PCR (qPCR)
Reaction contents and thermocycling conditions for qPCR analysis were as described by Ziels et
al. (2015). qPCR analysis on syntrophic LCFA β-oxidizing bacteria was conducted targeting 16S
rRNA genes of the genera Syntrophomonas and Syntrophus using the primers and probes
developed by Ziels et al. (2015), as these primers/probes were the only established TaqMan
qPCR assays targeting these syntrophic β-oxidizing bacterial groups at this time. Additionally,
qPCR analysis was conducted targeting the domain Bacteria, the methanogenic archaeal orders
of Methanomicrobiales, Methanobacteriales, Methanococcales, and the methanogenic archaeal
families of Methanosarcinaceae and Methanosaetaceae using previously developed

81
primer/probe sets (Yu et al., 2005). Further details on the qPCR primer/probe sets used in this
study are provided in Supplemental Table B1. All samples were analyzed in duplicate. No-
template controls (NTCs) were included with each qPCR run. Extracted DNA from the digester
biomass samples was diluted 1:10 in nuclease-free water to prevent PCR inhibition. Calibration
standards for the qPCR assays were prepared as described by Ziels et al. (2015), and were
included in duplicate in each qPCR run for all target groups. The strains from which 16S rRNA
gene sequences were used to construct the calibration standards are given in Supplemental Table
B1, along with the average slopes and intercepts of the qPCR calibration curves.
4.3.3.3 High-Throughput Amplicon Sequencing of 16S rRNA Genes and Statistics
Selected DNA extracts were processed for high-throughput amplicon sequencing on the Illumina
MiSeq platform, using the protocol described by Ziels et al. (2015). Briefly, two-step nested PCR
was conducted prior to sequencing to enhance sensitivity. Bacteria and Archaea sequence
libraries were generated separately for each sample by using different primer sets in the initial
PCR. The primers used in the initial PCR for the Bacteria sequence library generation were a
modified 341F (5’-CCTAYGGGRBGCASCAG-3’) and a modified 806R (5’-
GGACTACNNGGGTATCTAAT-3’) (Sundberg et al., 2013), and for the Archaea sequence
library the primers Arch-349F (5’-GYGCASCAGKCGMGAAW-3’) and Arch-915R (5’-
GTGCTCCCCCGCCAATTCCT-3’) were used. PCR amplification, purification, and library
construction were conducted in accordance to Ziels et al. (2015). Libraries were sequenced with
an Illumina MiSeq at the University of Copenhagen Molecular Microbial Ecology Lab.
Sequences were submitted to the NCBI Sequence Read Archive as BioProject PRJNA301747.
82
Paired-end sequences were joined using the fastq-join method (Aronesty, 2013) with a minimum
overlap of 100 bp and a zero percent difference allowed in the overlap region. The UPARSE
method was used to trim sequences to 298 bp and filter sequences based on a maximum
estimated error of 0.05 using USEARCH61 (Edgar, 2010; Edgar et al., 2011). Sequence
chimeras were identified against the RDP Gold reference database (v.9) included in the
UCHIME distribution (Edgar et al., 2011) within the QIIME pipeline v.1.8.0 (Caporaso et al.,
2010b). Filtered sequences were clustered into operational taxonomic units (OTUs) based on 3%
sequence divergence using USEARCH61 (Edgar, 2010). Representative sequences of each OTU
were identified based on the cluster seed, and were classified using a naïve Bayesian algorithm
with the Ribosomal Database Project (RDP) Classifier program version 2.2 (Wang et al., 2007).
For the Bacteria sequence libraries, Archaea sequences were removed prior to further analysis,
and similarly Bacteria sequences were filtered and removed from Archaea sequence libraries. A
total of 1,442,363 quality-filtered reads were obtained from the Illumina sequencing of Bacteria
16S rRNA gene amplicons (n=21 samples), and 1,312,584 quality-filtered reads were obtained
from sequencing of Archaea 16S rRNA gene amplicons (n=21 samples).
Multivariate statistical analysis and diversity metrics were calculated using the vegan library
version 2.0.10 (Oksanen et al., 2007) in R version 3.0.2. Canonical correspondence analysis
(CCA) was performed using sequence counts (scaled to equal reads per sample) for OTUs that
were present above 1% of the population in at least one sample. The environmental parameters
that maximized the model significance were identified using forward-backward selection based
on P-values. Bray-Curtis distance matrices were calculated after rarefying samples to an equal
number of reads. Diversity calculations were performed on entire sample sequence libraries

83
(rarefied to equal reads) excluding singleton OTUs. Richness was calculated as the number of
OTUs after rarefying to the smallest number of reads per sample. Hill numbers were used to
measure diversity based on effective species numbers (qD) at varying orders (q=0,1,2) (Hill,
1973; Jost, 2006). Diversity of order 0 (i.e. 0D) is equal to species richness, while 1D is equal to
exp(Shannon entropy), and 2D is equivalent to 1/(Simpson concentration) (Hill, 1973; Jost,
2006). Diversity of order 1D weights species frequencies equally, while diversity of order 2D
disproportionally emphasizes dominant species (Jost, 2006; Vuono et al., 2015).
4.4 RESULTS
4.4.1 FOG codigestion led to enhanced methane production and higher LCFA conversion
kinetics
Two parallel anaerobic digesters were operated to compare differences in performance between
FOG codigestion with WPS+WAS and the digestion of only WPS+WAS for 145 days (Table
4-1). By day 94 after FOG codigestion was commenced, the FOG VSLR reached 1.5 g VS/L-d
(52% of the total VSLR w/w), corresponding to an increase in the total VSLR to the codigester
of 2.1-times relative to the control (2.9 versus 1.4 g/L-d) (Figure 4-1A). Accordingly, the daily
methane production significantly increased by 2.7-times in the FOG codigester (5200 mL CH4/d
± 560) relative to the control (1900 mL CH4/d ± 200) at the highest VSLR (p < 1e-3, unpaired t-
test; Figure 4-1B). Due to the high VS concentration of the added FOG, the HRT of the
codigester was only decreased by 3% to 19.4 days at the highest VSLR. Thus, codigesting FOG
at a VSLR of 1.5 g FOG VS/L-d resulted in about 2.7-times the daily methane production with
no significant process penalty in the digester HRT.

84
The specific methane yield on a VS-basis also increased by 31% in the FOG codigester (420 mL
CH4/g VSfed ± 40) relative to the control (320 mL CH4/g VSfed ± 70) at the highest VSLR (p <
1e-3), indicating that the added FOG was more biodegradable than the WPS+WAS. The higher
degree of biodegradability of the added FOG was further supported by the significantly higher
VS reduction in the FOG codigester over the control throughout the experimental period,
achieving 63% ± 4 versus 51% ± 5 (p < 1e-3, unpaired t-test). Assuming that the VS reduction of
the feed WPS+WAS in the FOG codigester was similar to the control digester (i.e. 51%), the VS
reduction of the feed FOG in the codigester was estimated to be 74% during the highest FOG
VSLR. Consequently, the specific LCFA concentration in the codigester effluent increased to a
maximum of 104 ± 11 mg LCFA/g TS on day 114 of FOG addition, in comparison to 4 ± 0.5 mg
LCFA/g TS in the control (Figure 4-1D). Thus, the 74% reduction in FOG VS at the highest
loading rate resulted in LCFA accumulation within the codigester.

85
Figure 4-1 Comparison of the FOG codigester and the control digester performance over experimental period, based on (A) daily volatile solids loading rate, (B) daily methane production, (C) digester pH, and (D) effluent LCFA concentrations. The LCFA concentrations shown in (D) were calculated as the sum of palmitate, stearate, and oleate in the digester effluent solids (error bars represent one standard deviation with n=4).
The pH was slightly reduced (Figure 4-1C) after day 50 of FOG codigestion when the LCFA
concentration increased (Figure 4-1D). The VFA concentration never exceeded 100 mg/L in both
digesters (data not shown), indicating that the codigester had sufficient VFA consumption
capacity at the prevailing LCFA conversion rates. LCFA were therefore the major intermediate
metabolites that accumulated during FOG degradation (Figure 4-1D). The LCFA in the
codigester effluent were comprised of 38% palmitic, 16% stearic, and 46% oleic acids on
average (Supplemental Figure B1).
The maximum methane production rates (qmax) of both digester sludges were determined in batch
assays (on days 0, 65, and 135) fed with either acetate or oleate to compare the kinetic capacities
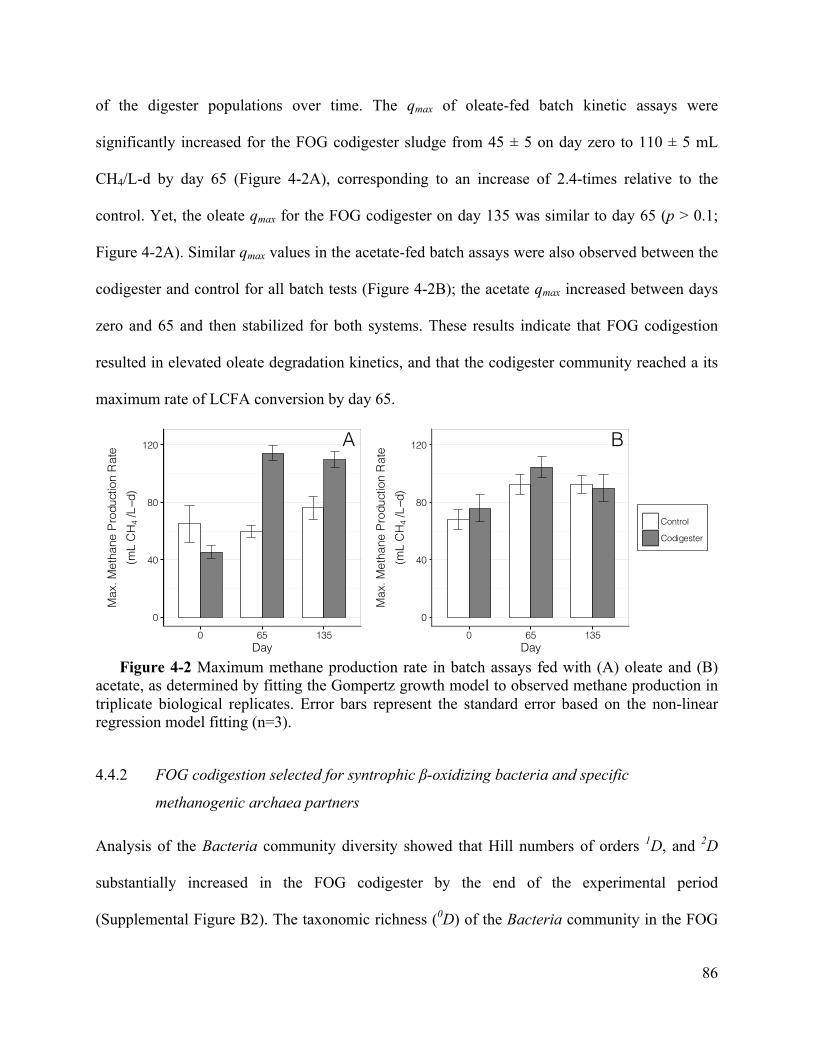
86
of the digester populations over time. The qmax of oleate-fed batch kinetic assays were
significantly increased for the FOG codigester sludge from 45 ± 5 on day zero to 110 ± 5 mL
CH4/L-d by day 65 (Figure 4-2A), corresponding to an increase of 2.4-times relative to the
control. Yet, the oleate qmax for the FOG codigester on day 135 was similar to day 65 (p > 0.1;
Figure 4-2A). Similar qmax values in the acetate-fed batch assays were also observed between the
codigester and control for all batch tests (Figure 4-2B); the acetate qmax increased between days
zero and 65 and then stabilized for both systems. These results indicate that FOG codigestion
resulted in elevated oleate degradation kinetics, and that the codigester community reached a its
maximum rate of LCFA conversion by day 65.
Figure 4-2 Maximum methane production rate in batch assays fed with (A) oleate and (B)
acetate, as determined by fitting the Gompertz growth model to observed methane production in triplicate biological replicates. Error bars represent the standard error based on the non-linear regression model fitting (n=3).
4.4.2 FOG codigestion selected for syntrophic β-oxidizing bacteria and specific
methanogenic archaea partners
Analysis of the Bacteria community diversity showed that Hill numbers of orders 1D, and 2D
substantially increased in the FOG codigester by the end of the experimental period
(Supplemental Figure B2). The taxonomic richness (0D) of the Bacteria community in the FOG
A
0
40
80
120
0 65 135Day
Max
. Met
hane
Pro
duct
ion
Rat
e(m
L C
H4
/L−d
)
Control
Codigester
B
0
40
80
120
0 65 135Day
Max
. Met
hane
Pro
duct
ion
Rat
e(m
L C
H4
/L−d
)
Control
Codigester

87
codigester did not change by day 138 (p > 0.1, unpaired t-test), while diversities of order 1D and
2D in the FOG codigester increased by 3.0-times and 4.6-times relative to the control,
respectively (p < 0.001, unpaired t-test; Supplemental Figure B2). While it is apparent that the
diversity of Bacteria was substantially elevated at the orders 1D and 2D in the FOG codigester
versus the control, the larger relative increase in diversity of order 2D indicates that the addition
of FOG had a larger influence on the diversity of dominant bacterial species.
The increase in the diversity of Bacteria in the FOG codigester occurred concomitantly with the
significant growth of β-oxidizing Syntrophomonas within the Bacteria community.
Syntrophomonas relative abundance in the Bacteria community increased to 14% ± 0.7 in the
FOG codigester over the experimental period but remained below 3% relative abundance in the
control digester, as measured by qPCR (Figure 4-3A). In contrast, the other known LCFA β-
oxidizing genus, Syntrophus, was measured by qPCR at less than 0.03% of the Bacteria
community in both digesters (Figure 4-3B). The Syntrophus abundance significantly decreased
from day zero to 86 in both digesters (p < 1e-3), but returned to its initial level in the FOG
codigester by day 138. The enrichment of Syntrophomonas within the Bacteria community was
corroborated by 16S rRNA gene amplicon sequencing, which showed that Syntrophomonas
became the dominant genus in the Bacteria sequence library by day 138 (Figure 4-4).
Syntrophomonas significantly increased in the FOG codigester Bacteria sequence library from
1.2% ± 0.3 initially to 9.0% ± 1.0 by day 138 (p = 0.009, paired t-test), but stayed below 2% in
the control (Figure 4-4). Gelria was another genus that also increased in the FOG codigester
Bacteria sequence library relative to the control (Figure 4-4). On the other hand, Petrimonas was
initially the dominant bacterial genus in both digesters with a relative sequence abundance of

88
~20%, but had a significantly lower relative sequence abundance in the FOG codigester at 4.0%
± 2.2 by day 138 (p = 0.03, paired t-test; Figure 4-4). Smithella also significantly decreased from
6.2% ± 0.9 to 1.7% ± 0.3 relative sequence abundance in the FOG codigester Bacteria
community (p = 0.01, paired t-test), but increased from 6.7% ± 0.1 to 12% ± 4.5 in the control
(Figure 4-4). Bray-Curtis dissimilarity values relative to the initial Bacteria community structure
(day zero) significantly increased between days 37 (0.44 ± 0.04) to 138 (0.61 ± 0.03) in the FOG
codigester (p < 1e-3, paired t-test), whereas no significant changes in Bray-Curtis dissimilarity
values occurred in the control Bacteria community over time (p > 0.1; Supplemental Figure B3).
These results demonstrate that FOG codigestion resulted in changes in the Bacteria community
structure, primarily attributed to the growth of the initially rare members of Syntrophomonas and
Gelria and the washout of initially dominant bacterial members such as Petrimonas and
Smithella (Figure 4-4).
Figure 4-3 Relative fraction of 16S rRNA genes of the β-oxidizing bacterial genera, (A) Syntrophomonas and (B) Syntrophus, within the total Bacteria 16S rRNA gene concentration in the FOG codigester and control digester over the experimental period, as determined by qPCR. Error bars represent a standard deviation based on DNA extraction replicates (n=3) and qPCR technical replicates (n=2) for each time point.

89
Figure 4-4 Relative sequence fraction of the 13 most abundant genera within the FOG codigester and control digester libraries produced from Illumina MiSeq sequencing of Bacteria 16S rRNA gene amplicons. The triplicate bars shown for each sample day represent replicate DNA extractions. The relative sequence fraction of all other genera were summed, and are shown here as “Other”.
In contrast to changes in Bacteria diversity, Hill diversity of orders 1D, and 2D for the Archaea
showed a decreasing trend in the FOG codigester over the experimental period (Supplemental
Figure B4). Notably, the diversity of orders 1D, and 2D for Archaea in the FOG codigester on
day 138 were 6% and 8% of that for Bacteria, respectively. Archaea species richness (0D) for the
FOG codigester and control were 34% and 51% of that for Bacteria on day 138, respectively.
These results indicate that the diversity of Archaea was less than that of the Bacteria
communities in both digesters.
Significant changes in the Archaea community structure and abundance were observed with
FOG codigestion. The fraction of methanogenic archaea 16S rRNA gene concentration in the
prokaryotic community (calculated as the sum of all methanogen groups targeted by qPCR
Rel
ativ
e S
equ
ence
Ab
un
dan
ce (
%)
Control
Sample Day
0
15
30
45
60
75Other
Smithella
PaludibacterLeptolinea
Bellilinea
Gelria
Levilinea
Sedimentibacter
Ornithobacterium
Petrimonas
MahellaSphaerochaeta
Candidatus CloacamonasSyntrophomonas
FOG Codigester
0 37 64 138 0 64 138

90
divided by total methanogens + Bacteria) increased 8-times by day 138 in the FOG codigester
relative to the control (p < 1e-3, unpaired t-test; Figure 4-5). The methanogenic archaea 16S
rRNA gene concentration comprised over 20% of the prokaryotic community by the end of the
experimental period, while that of the control digester was 2.5% (Figure 4-5). Bray-Curtis
dissimilarity values relative to the initial Archaea community structure significantly increased in
the FOG codigester between days 37 (0.29 ± 0.08) and 138 (0.62 ± 0.10) (p < 1e-3, paired t-test)
(Supplemental Figure B5). The increase in Bray-Curtis dissimilarity of the codigester Archaea
community relative to its initial population reveals that the addition of FOG resulted in changes
in the Archaea community structure. A significant increase in the hydrogenotrophic
Methanospirillum relative sequence abundance from 1.3% ± 0.4 to 34% ± 3.0 occurred between
day zero and 138 in the FOG codigester (p = 0.002, paired t-test; Figure 4-6). In contrast,
Methanospirillum stayed below 3% relative sequence abundance in the control digester (Figure
4-6). Methanosaeta was the dominant aceticlastic genus within the FOG codigester, increasing
from a relative concentration of 23% ± 9 on day zero to 46% ± 5 by day 138 (p=0.01; Figure
4-6). Pearson correlation coefficients between the average relative sequence abundances of
Methanospirillum and Methanosaeta with Syntrophomonas in the FOG codigester were 0.90 and
0.96, respectively. Methanospirillum and Methanosaeta species were therefore key
methanogenic groups growing along with Syntrophomonas in the codigester microbiome during
the degradation of FOG.
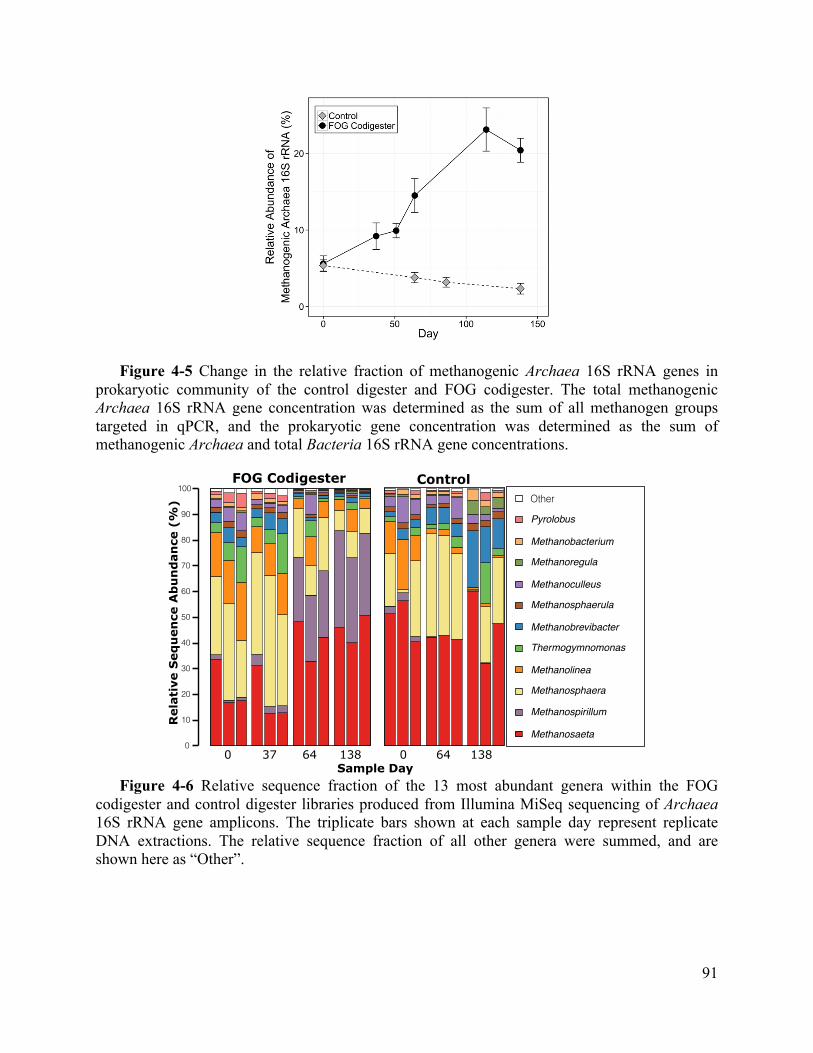
91
Figure 4-5 Change in the relative fraction of methanogenic Archaea 16S rRNA genes in prokaryotic community of the control digester and FOG codigester. The total methanogenic Archaea 16S rRNA gene concentration was determined as the sum of all methanogen groups targeted in qPCR, and the prokaryotic gene concentration was determined as the sum of methanogenic Archaea and total Bacteria 16S rRNA gene concentrations.
Figure 4-6 Relative sequence fraction of the 13 most abundant genera within the FOG
codigester and control digester libraries produced from Illumina MiSeq sequencing of Archaea 16S rRNA gene amplicons. The triplicate bars shown at each sample day represent replicate DNA extractions. The relative sequence fraction of all other genera were summed, and are shown here as “Other”.
Rel
ativ
e S
equ
ence
Ab
un
dan
ce (
%)
Control
Sample Day
Other
FOG Codigester
0 37 64 138 0 64 1380
10
20
30
40
50
60
70
80
90
100
Pyrolobus
Methanobacterium
Methanoregula
Methanoculleus
Methanosphaerula
Methanobrevibacter
Thermogymnomonas
Methanolinea
Methanosphaera
Methanospirillum
Methanosaeta
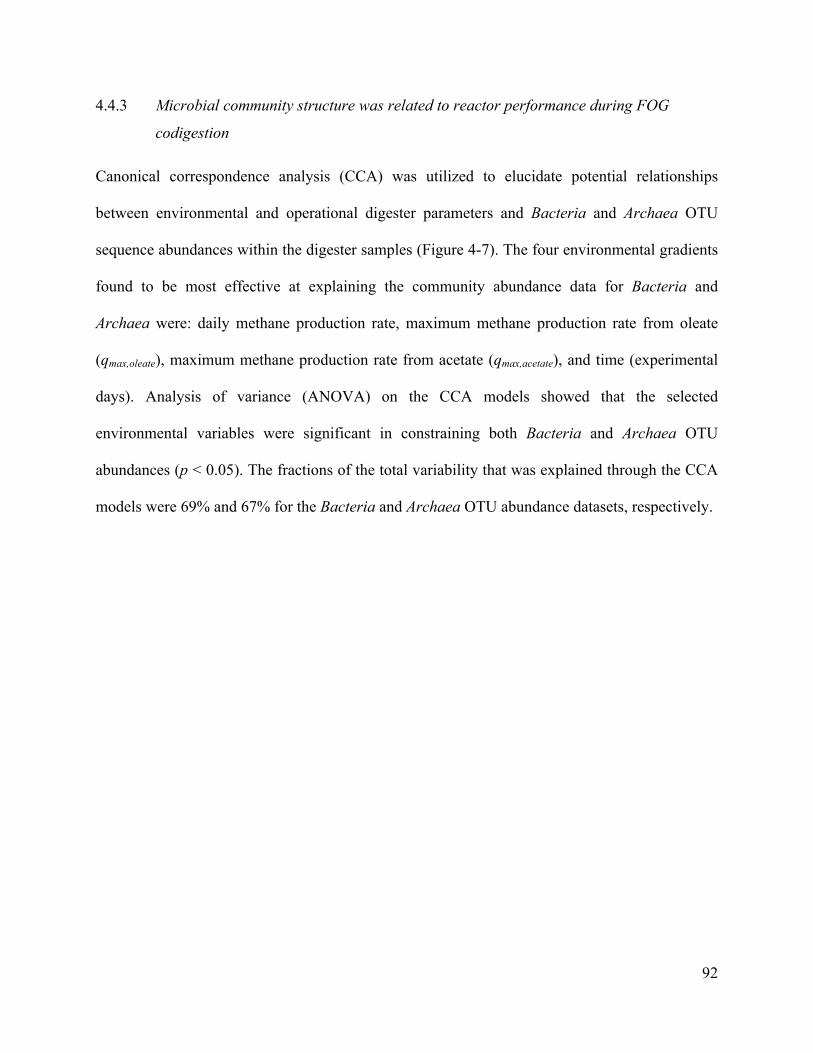
92
4.4.3 Microbial community structure was related to reactor performance during FOG
codigestion
Canonical correspondence analysis (CCA) was utilized to elucidate potential relationships
between environmental and operational digester parameters and Bacteria and Archaea OTU
sequence abundances within the digester samples (Figure 4-7). The four environmental gradients
found to be most effective at explaining the community abundance data for Bacteria and
Archaea were: daily methane production rate, maximum methane production rate from oleate
(qmax,oleate), maximum methane production rate from acetate (qmax,acetate), and time (experimental
days). Analysis of variance (ANOVA) on the CCA models showed that the selected
environmental variables were significant in constraining both Bacteria and Archaea OTU
abundances (p < 0.05). The fractions of the total variability that was explained through the CCA
models were 69% and 67% for the Bacteria and Archaea OTU abundance datasets, respectively.

93
Figure 4-7 Canonical correspondence analysis (CCA) plots based on (A) Bacteria and (B) Archaea scaled OTU sequence counts in the codigester and control digester samples, constrained by the four highest-scoring environmental gradients: daily methane production, maximum methane production from oleate (qmax,oleate), maximum methane production from acetate (qmax,acetate), and time (experimental days). The color of the outer circles represents the sample digester source and the color of the inner circles represents the sample collection day. The triplicate samples shown for each sample day are from replicate DNA extractions. The length and direction of each arrow represents the scaling used for that environmental gradient in the CCA model.
To further evaluate whether microbial community structure was related to system performance
during FOG degradation, a parameter was developed to relate the food-to-microorganism ratio
(F:M) for FOG loading to the LCFA-degrading microbial population within the codigester. Due
to the significant increase in Syntrophomonas abundance in the codigester relative to the control
(Figure 4-3A and Figure 4-4), we investigated whether Syntrophomonas abundance could serve
as a predictor for LCFA-degradation activity. A parameter termed the FOG-to-syntroph feed
ratio (F:MSynt) was thereby developed by normalizing the FOG loading to the concentration of
Syntrophomonas in the digester:
where: Q is the daily feed volume (L/d), VSFOG is the influent FOG VS concentration (g VS/L),
V is the reactor working volume (L), XVS is the reactor VS concentration (g VS/L), and fSynt is the
●●
●
●
●
●
●●
●
●
●●
●
●
●
●●
●
●
●
●
●
●
●
●●
●
●
●
●
●
●
●
●
●
●
Time (days)
Daily MethaneProduction
qmax: Acetate
−2
−1
0
1
−1 0 1 2CCA1
CC
A2
Reactor●a●
CodigesterControl
●
0
64
138
qmax: Oleate
Day●
●
A
●
●●
●
●
●
●
●
●
●●
●
●●●
●
●●
●
●●
●
●
●
●
●
●
●●
●
●●
●
●
●●
Time (days)
Daily MethaneProduction
qmax: Acetate
−1
0
1
2
−2 −1 0 1 2CCA1
CC
A2
Reactor●●
CodigesterControl
Day
●
0
64
138
qmax: Oleate
●
●
B
F :MSynt =Q ⋅VSFOGV ⋅XVS ⋅ fSynt
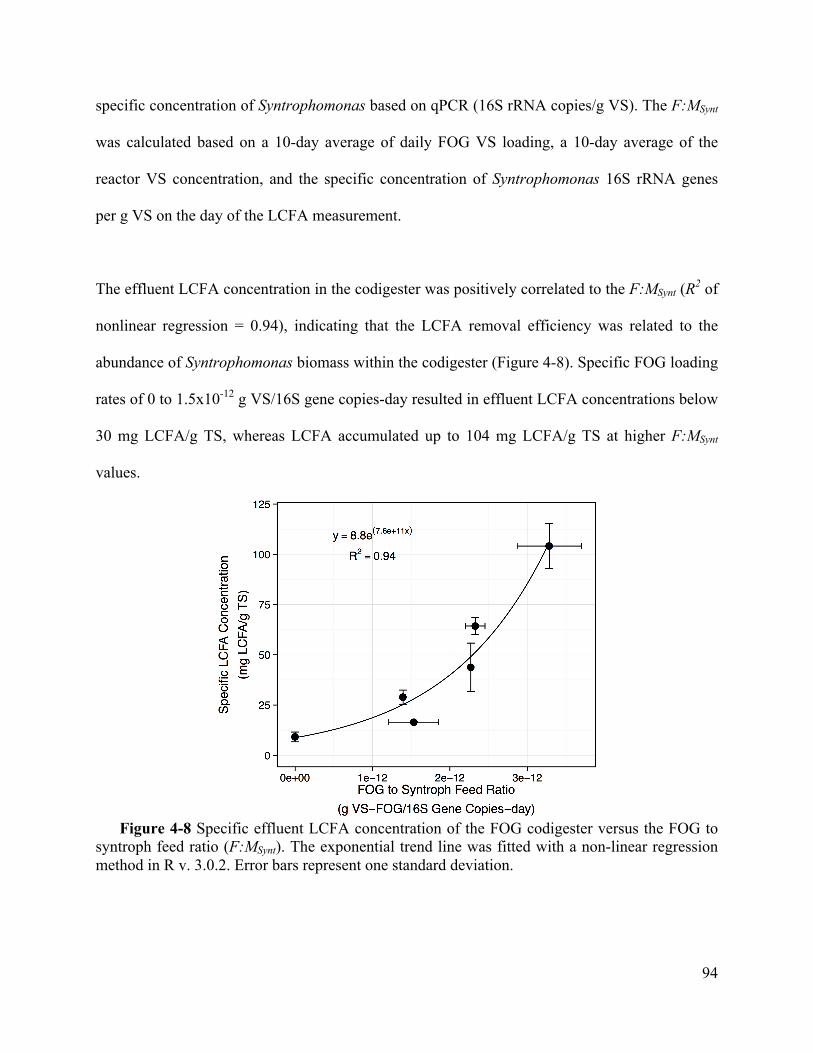
94
specific concentration of Syntrophomonas based on qPCR (16S rRNA copies/g VS). The F:MSynt
was calculated based on a 10-day average of daily FOG VS loading, a 10-day average of the
reactor VS concentration, and the specific concentration of Syntrophomonas 16S rRNA genes
per g VS on the day of the LCFA measurement.
The effluent LCFA concentration in the codigester was positively correlated to the F:MSynt (R2 of
nonlinear regression = 0.94), indicating that the LCFA removal efficiency was related to the
abundance of Syntrophomonas biomass within the codigester (Figure 4-8). Specific FOG loading
rates of 0 to 1.5x10⁻¹² g VS/16S gene copies-day resulted in effluent LCFA concentrations below
30 mg LCFA/g TS, whereas LCFA accumulated up to 104 mg LCFA/g TS at higher F:MSynt
values.
Figure 4-8 Specific effluent LCFA concentration of the FOG codigester versus the FOG to
syntroph feed ratio (F:MSynt). The exponential trend line was fitted with a non-linear regression method in R v. 3.0.2. Error bars represent one standard deviation.
95
4.5 DISCUSSION
High FOG loadings during codigestion with municipal sludge have led to process upsets
(Davidsson et al., 2008; Girault et al., 2012; Luostarinen et al., 2009; Noutsopoulos et al., 2013;
Wang et al., 2013) and even delayed process recovery (Wan et al., 2011). Threshold FOG
loading limits for codigestion have been recommended (Noutsopoulos et al., 2013; Wang et al.,
2013), but these loading limits have not considered the impacts of microbial community
adaptation. In our study, changes in microbial community structure were closely monitored
during transient increases in FOG loading, which showed that LCFA accumulation was related to
both the FOG loading rate and the abundance of syntrophic β-oxidizing consortia. LCFA
accumulated at higher specific loading rates of FOG relative to the abundance of
Syntrophomonas 16S rRNA genes in the codigester. Thus, previous reports of unstable digester
performance at high FOG loadings (Davidsson et al., 2008; Girault et al., 2012; Luostarinen et
al., 2009; Noutsopoulos et al., 2013; Wang et al., 2013) could possibly have been attributed to an
insufficient abundance of LCFA-degrading syntrophic bacteria, so that LCFA accumulated to a
concentration high enough to inhibit methanogenic activity (Angelidaki and Ahring, 1992;
Hanaki et al., 1981; Rinzema et al., 1994). The significant growth of LCFA-degrading syntrophic
bacteria and methanogenic archaea in the FOG codigester in this study supports previous
observations that gradual stepwise increases in FOG loading stimulated higher rates of LCFA β-
oxidation and methanogenesis (Silvestre et al., 2011) and that biomass resilience to LCFA was
impacted by the exposure time to lipids (Alves et al., 2001; Silva et al., 2014). Our finding that
LCFA conversion efficiency depends upon the digester biomass composition may also help to
explain some of the variation in reported threshold limits of FOG loading during municipal
sludge codigestion, which ranged from ~0.4 to 2.1 g FOG VS/L-d (Girault et al., 2012;

96
Luostarinen et al., 2009; Noutsopoulos et al., 2013; Silvestre et al., 2011; Wan et al., 2011; Wang
et al., 2013). The highest FOG VSLR tested in this study was 1.5 g VS/L-d, which is close to the
FOG VSLR threshold of 1.6 g VS/L-d reported previously during FOG codigestion with
municipal sludge by Luostarinen et al. (2009). At our highest FOG VSLR, LCFA accumulated to
104 mg LCFA/g TS with no appreciable increase in VFA. This phenomenon was also observed
by Silvestre et al. (2014) and Girault et al. (2012) during FOG codigestion with municipal
sludge, suggesting that acetogenesis from LCFA can be rate-limiting in such processes. The
decrease in effluent LCFA in the codigester on day 138 in our study thus indicates that a higher
FOG VSLR may be possible after further time for microbial community adaptation. Overall,
these results implicate that the FOG loading threshold during codigestion may be considered a
‘moving target’ that relies upon the degree of microbial community adaptation and the activity
within the digester microbiome to degrade LCFA.
This is the first study to monitor changes in syntrophic β-oxidizing bacteria abundance during
FOG codigestion by qPCR, which highlighted a differential selection of Syntrophomonas over
Syntrophus. The family of Syntrophomonadaceae has been previously identified as key
syntrophic bacteria enriched in anaerobic digester biomass during unsaturated LCFA degradation
(Baserba et al., 2012; Sousa et al., 2009, 2007a; Ziels et al., 2015). In contrast, Syntrophaceae
have been detected at higher abundances in anaerobic communities degrading saturated LCFA
(Sousa et al., 2009) as well as long-chain alkanes (Gray et al., 2011; Zengler et al., 1999). While
the saturated fatty acids of palmitate (C16:0) and stearate (C18:0) together comprised 54% of the
LCFA in the codigester effluent on average (Supplemental Figure B1), it is not known whether
the LCFA composition of the influent FOG influenced the selection of Syntrophomonas over

97
Syntrophus. It may be also possible that the enrichment of Syntrophomonas in the codigester was
attributed to specific syntroph-methanogen pairings with Methanospirillum and Methanosaeta,
which were the dominant methanogenic archaeal groups enriched with FOG addition and were
strongly correlated with Syntrophomonas abundance (i.e. Pearson coefficients > 0.9).
The positive association of the FOG codigester Bacteria and Archaea community profiles with
the constrained gradients of daily methane production and qmax,oleate further confirm that changes
in microbial community structure were related to measures of codigester performance. Hill
diversity numbers also proved to be effective metrics to capture the alpha and beta components
of community structure changes within the digesters, as was similarly found with other
biological wastewater treatment processes (Vuono et al., 2015). Diversity numbers of orders 1D
and 2D for the Bacteria community increased along with measures of reactor performance in the
FOG codigester, but the same was not true with species richness (0D). This agrees with previous
findings indicating that higher order diversity (i.e. evenness) in digester Bacteria communities
correlated positively with COD removal and methane production, whereas species richness did
not (Werner et al., 2011). While the Bacteria species richness of the FOG codigester remained
stable in this study, the community experienced changes in dominant members (captured by 2D)
that contributed to higher ecosystem function. The higher methane production of the codigester
following shifts in dominant Bacteria community members (higher 2D) coincided with the
growth of the functionally specific Syntrophomonas. The increased biodiversity within the
codigester was therefore attributed to the growth of initially rare syntrophic bacteria, which were
also a driving force behind improvements in the codigester daily methane production and
increased values of qmax,oleate. This finding agrees with previous observations that the abundance

98
of syntrophic bacteria was linked to anaerobic digester resilience (Regueiro et al., 2015; Werner
et al., 2011).
Evaluating the activity of syntrophic fatty acid-oxidizing bacteria has previously been proposed
as an alternative approach to gauge the activity of methanogenic pathways, since the metabolism
of syntrophic fatty acid-oxidizing bacteria is directly coupled to the activity of methanogens
(Smith et al., 2015). Our proposed relationship between LCFA removal and the Syntrophomonas
16S rRNA gene concentration was based on the assumption that Syntrophomonas was a major
syntrophic bacterial group involved in LCFA β-oxidation, and that Syntrophomonas biomass
could serve as a surrogate measure for the activity of the LCFA-degrading community
(syntrophic bacteria + methanogens). This assumption was supported by the observation that
LCFA were the primary metabolite of FOG degradation rather than acetate, indicating that
LCFA β-oxidation was not likely limited by aceticlastic methanogenesis. Similar to our findings,
the concentration of syntrophic bacterial biomass was recently found to be the limiting factor for
butyrate conversion via β-oxidation in non-defined methanogenic enrichments (H. Junicke et al.,
2016). Ziels et al. (2015) also found that the relative fraction of Syntrophomonas in the Bacteria
community of oleate-fed anaerobic enrichments was positively correlated with the specific
methane production rate. Since the thermodynamics of LCFA-degradation hinges upon the
activity of methanogenic archaea and syntrophic β-oxidizing bacteria (Schink, 1997), we propose
that the FOG-loading capacity of a given digester can be better predicted by closely monitoring
the abundance and activity of those populations.

99
From a process engineering perspective, efficient turnover of LCFA is critical for maintaining
the maximum kinetic capacity of the digester community (Pereira et al., 2005). The positive
correlation observed between the effluent LCFA concentration and the codigester F:MSynt
suggested that a higher biomass of syntrophic LCFA-degrading consortia could increase the
threshold loading rate of FOG during codigestion. A higher biomass of slow growing
Syntrophomonas has been associated with longer anaerobic digester solids retention times (Hao
et al., 2016; Lee et al., 2011). Therefore, the methane production of FOG codigestion processes
should be greater with longer solids retention times by allowing a higher mass loading of FOG
while maintaining an F:MSynt that supports low effluent LCFA concentrations. This work also
demonstrates the potential to minimize LCFA accumulation by controlling transient FOG
loading rates based on the analysis of the codigester community structure, such as with qPCR
measurements of syntrophic LCFA-degrading bacteria abundance.
4.6 CONCLUSIONS
Microbial adaptation was important for the conversion of FOG into methane during codigestion
with municipal wastewater sludge. Syntrophomonas bacteria were the primary syntrophic β-
oxidizing group that was enriched in the codigester microbiome. Increases in digester LCFA
concentrations occurred when the FOG loading rate relative to Syntrophomonas abundance
exceeded a threshold value. Changes in the FOG codigester and control digester microbiomes
were best explained through constrained ordination by measures of digester function. These
results collectively indicate that more efficient LCFA conversion into methane can be achieved
by strategically managing transient FOG loadings to allow sufficient time for microbial
community adaptation through higher abundances of LCFA-degrading consortia.

100
4.7 SUPPLEMENTAL INFORMATION AVAILABLE
Supplemental Information for this Chapter is available online at
(http://dx.doi.org/10.1016/j.watres.2016.07.043), and is included in this document as Appendix
B.
101
Chapter 5. SYNTROPHIC COMMUNITY STRUCTURE AND
BIOKINETICS DRIVEN BY LONG-CHAIN FATTY ACID
FEEDING STRATEGY IN ANAEROBIC CODIGESTION
5.1 ABSTRACT
This study investigated the impacts of long-chain fatty acid (LCFA) feeding pattern on microbial
community structure, bioconversion kinetics, and process stability during anaerobic codigestion.
Parallel laboratory-scale anaerobic codigesters were fed with dairy cattle manure, and were
either pulse-fed every two days or continuously-fed daily with oleate (C18:1) up to a maximum
loading of 64% of the influent COD over 200 days. Maximum substrate conversion rates of
oleate (qmax,oleate) and acetate (qmax,acetate) were significantly higher in the pulse-fed codigester
compared to the continuous-fed codigester. The effluent acetate concentration in the continuous-
fed codigester exceeded 3,000 mg/L at the highest oleate loading rate, whereas acetate in the
pulse-fed codigester remained at low levels. 16S rRNA gene amplicon sequencing showed that
Bacteria and Archaea community profiles diverged based on the codigester LCFA feeding
pattern and loading rate. LCFA-degrading Syntrophomonas bacteria were significantly enriched
in both LCFA codigesters, but the pulse-fed codigester had almost double the fraction of
Syntrophomonas 16S rRNA genes by the end of the experiment with 43% of Bacteria sequences.
qmax,oleate and qmax,acetate values were both significantly correlated to absolute concentrations of
Syntrophomonas and Methanosaeta 16S rRNA genes, respectively. Improved quantitative
predictions of bioconversion kinetics were achieved with multiple-linear regression models
based on the absolute abundance of individual Syntrophomonas and Methanosaeta taxa. These

102
results suggest that pulse-feeding LCFA during anaerobic codigestion selected for higher
microbial bioconversion kinetics and functional stability, which were related to changes in the
physiological diversity and adaptive capacity of syntrophic and methanogenic communities.
5.2 INTRODUCTION
Anaerobic digestion of agricultural livestock manure is an attractive solution to minimize carbon
footprints by treating the organic waste through the recovery of biomethane. However, the low
biomethane potential of animal manures (Labatut et al., 2011) can limit the economic viability of
agricultural digesters (Bishop and Shumway, 2009). Codigesting high-strength organic wastes
with manure can significantly improve process economics by increasing biomethane recovery as
well as provide additional revenue from tipping fees (Bishop and Shumway, 2009). Fats, oils,
and greases (FOG) are appealing substrates for codigestion because of their 2.7-times greater
biological methane yield per unit mass than that for livestock manures (Labatut et al., 2011).
When added to the digestion process, fats and oils are rapidly hydrolyzed into glycerol and long-
chain fatty acids (LCFA) (Cirne et al., 2007; Hanaki et al., 1981), with over 90% of the original
methane potential of FOG maintained within LCFA (Sousa et al., 2009).
The conversion of LCFA into methane is considered rate-limiting for the ultimate degradation of
FOG in anaerobic digesters (Cirne et al., 2007; Hanaki et al., 1981). LCFA-degradation under
methanogenic conditions involves an obligatory syntrophic partnership between acetogenic β-
oxidizing bacteria and acetate- and hydrogen-utilizing methanogenic archaea (Schink, 1997;
Sousa et al., 2009). The bacterial species known to β-oxidize LCFA in syntrophy with a
hydrogen- or formate- consuming partner have so far been identified within only two families,

103
Syntrophomonadaceae and Syntrophaceae (Sousa et al., 2009). The slower biodegradation of
LCFA relative to lipid hydrolysis in anaerobic digesters can lead to LCFA accumulation and
process instability, as LCFA are known inhibitors of hydrogenotrophic and aceticlastic
methanogenic activity at high concentrations (Hanaki et al., 1981; Hwu and Lettinga, 1997;
Rinzema et al., 1994; Silva et al., 2016; Sousa et al., 2013). LCFA accumulation can also limit
the kinetics of syntrophic β-oxidizing bacteria (Hanaki et al., 1981). Understanding how to
increase the robustness and stability of anaerobic digesters at high FOG loading rates is thus key
for improving biomethane recovery from agricultural digesters through codigestion.
The relationship between the LCFA-degrading community structure and LCFA bioconversion
kinetics in anaerobic digesters has not been well characterized. Previous efforts have predicted
LCFA conversion kinetics in anaerobic digesters using theoretical models, such as ADM1
(Palatsi et al., 2010; Zonta et al., 2013). However, those biokinetic models were based on
predictions of biomass composition, instead of calibration with actual measurements of LCFA-
degrading bacteria abundance. Such models have also represented LCFA-degrading bacteria as a
single homogenous population, whereas it was previously shown that various LCFA-degrading
Syntrophomonas and Syntrophus taxa can coexist in anaerobic digester sludge (Sousa et al.,
2007a; Ziels et al., 2015). Different methanogenic archaea species can also have varying degrees
of tolerance to LCFA exposure (Silva et al., 2016; Sousa et al., 2013), suggesting that the
digester methanogen community structure could be affected by FOG addition. The recent finding
that effluent LCFA concentrations were inversely correlated to LCFA-degrading bacteria 16S
rRNA gene concentrations during FOG codigestion (Ziels et al., 2016) indicated that the overall
LCFA bioconversion rate of syntrophic bacteria and methanogenic archaea within a codigester

104
could establish the allowable FOG loading rate that prevents inhibitory LCFA accumulation.
However, no studies have examined whether different communities of syntrophic bacteria and
methanogenic archaea with different LCFA bioconversion kinetics could be biologically selected
during FOG codigestion. Additional research is therefore needed to develop predictive models
for LCFA conversion kinetics based on the LCFA-degrading community abundance and
composition. Such models could then be utilized to identify effective digester operating
strategies that promote stable performance at high FOG loading rates.
The stability of the anaerobic digestion process during disturbances has been attributed to the
resilience, resistance, and redundancy of the various microbial trophic guilds of the digester food
web (Carballa et al., 2015; Werner et al., 2011). Resistance refers to the degree in which a
community composition remains unchanged during a disturbance; resilience indicates to the rate
at which the microbial community returns to its original composition following a disturbance;
and functional redundancy refers to the potential for various microbial taxa to process the same
substrate (Allison and Martiny, 2008). In anaerobic digesters, hydrolytic bacteria are thought to
have a high degree of functional redundancy (Carballa et al., 2015; Vanwonterghem et al., 2014),
whereas syntrophic bacteria are thought to be more metabolically specialized (Briones and
Raskin, 2003; McInerney et al., 2009) and less likely to undergo competition (Werner et al.,
2011). However, if different syntrophic and methanogenic consortia could have different rates of
LCFA conversion, then biological selective pressures could potentially be incorporated into FOG
codigester operating strategies to favorably steer the LCFA-degrading community toward a
composition with higher bioconversion kinetics. It was observed that four distinct clades of
syntrophic propionate oxidizing bacteria (POB) were enriched in an anaerobic digester operated

105
in fill-and-draw mode, and the presence of multiple syntrophic POB groups was attributed to
periodic changes in propionate concentrations with batch feeding along with different biokinetic
characteristics of the POB clades (H. D. Ariesyady et al., 2007). Distinct syntrophic POB
populations with different biokinetic parameters were also detected in the first and second phases
of a thermophilic phased-digester based on differences in organic loading (Zamanzadeh et al.,
2013). The digester feeding strategy was also found to impact the methanogen community
structure (Conklin et al., 2006) and digester robustness during overloading events (Conklin et al.,
2006; De Vrieze et al., 2013; Mulat et al., 2016). With regards to LCFA degradation, pulse-
feeding LCFA during codigester startup was suggested to promote greater stability at higher
loading rates (Cavaleiro et al., 2009); however, the resulting LCFA-degrading community
structure and biokinetics were not compared to a continuous-fed codigester in parallel. Thus, the
impact of LCFA feeding frequency on the bioconversion kinetics and community composition of
LCFA-degrading syntrophic bacteria and methanogenic archaea during the codigestion of
LCFA-rich wastes remains unknown.
The objective of this research was to investigate the effects of LCFA feeding frequency during
codigestion on: (1) LCFA bioconversion kinetics, (2) codigester stability and performance, and
(3) the composition of syntrophic LCFA-degrading consortia. Additionally, a goal of this study
was to develop quantitative models to predict LCFA-conversion kinetics based on syntrophic
LCFA-degrading bacteria community structure and abundance. Anaerobic codigesters fed with
dairy manure and oleate were operated with either a pulse-fed or a semi-continuous-fed regime
to compare their respective substrate conversion kinetics and microbial community structures.
106
5.3 MATERIALS AND METHODS
5.3.1 Anaerobic Digester Description and Operation:
The three anaerobic digesters operated in this study consisted of 5.5 L glass semi-continuous
stirred tank reactors with 4.0 L working volumes. The digesters were configured as shown in
Supplemental Figure C1. The digesters were intermittently mixed for 2 minutes every 10 minutes
with an axial impeller mixer (5VB, Cleveland Mixer), and temperature was controlled at 35°C in
an environmental chamber.
The digesters were inoculated with effluent sludge from a mesophilic anaerobic digester treating
dairy manure at a nearby farm. Fresh cow dairy manure feedstock was collected from the
influent mixing tank of the same dairy farm digester that supplied the inoculum sludge. The
manure feedstock was blended for 1 minute before storing ~1L aliquots at -20°C. Single manure
aliquots were thawed at 4°C daily before use. Three batches of manure were collected
throughout the entire experimental period. The manure feed was manually added once daily after
withdrawing 200 mL of sludge. The total feed volume (manure + oleate) was maintained at 200
mL/day to maintain a 20-day hydraulic retention time (HRT), which was also equal to the solids
retention time (SRT). Daily biogas production was measured with wet tip gas meters (Wet Tip
Gas Meter Co., Nashville), and the methane composition of the biogas was measured at least
twice weekly at the end of the daily feeding cycle. Total COD (TCOD), total solids (TS), and
volatile solids (VS) of the manure feed and digester effluents were measured 3-times weekly.
Effluent volatile fatty acids (VFA) were measured 3-7 times weekly, and effluent long-chain
fatty acids (LCFA) were measured weekly.
107
Digester operation conditions were varied under three experimental phases: (1) start-up period
with manure-only feeding (days -50 to 0); (2) Phase I of oleate codigestion with manure (days 1
to 85); and (3) Phase II of oleate codigestion with manure (days 86 to 204). The manure feed VS
loading was maintained at 1.3 ± 0.2 g VS/L-d during all experimental phases.
During Phase I, two of the digesters received an aqueous solution of sodium oleate (>97%,
Tokyo Chemical Industry Co.) at 10% of the daily influent feed volume for codigestion, while
the third digester was fed only manure as the control. The oleate feed organic loading rate (OLR)
for the two codigesters was equal, and was increased over time by increasing the oleate
concentration. The oleate feeding frequency was different for the two codigesters. One
codigester received the oleate feed every 6-hrs daily, and is hereon referred to as the continuous-
fed codigester (CF codigester). The other codigester received the oleate feed once every 2-days,
and is hereon referred to as the pulse-fed codigester (PF codigester). The oleate OLR was almost
doubled about every 20-days (equal to SRT/HRT) during Phase I, accounting for up to 27% of
the influent feed total COD during the 85 day period (Table 5-1). On day 85, the PF codigester
operation was terminated due to accidental damage to the reactor vessel.
During Phase II, two oleate-fed codigesters were operated in parallel: (1) the control digester
from Phase I was used for the pulse-fed codigester operation, and is hereon termed pulse-fed
codigester #2 (PF2 codigester); and (2) the operation of the CF codigester from Phase I was
continued. The oleate OLR to the PF2 codigester in Phase II was increased about every 10 days
and the step increases to the CF codigester remained about every 20 days, such that the oleate
accounted for 64% of the total influent COD to both codigesters by day 150 (Table 5-1). Due to
108
acetate accumulation in the CF codigester at an oleate OLR of 3.8 g COD/L-d, the oleate OLR
was reduced to 3.2 g COD/L-d on day 184 (Table 5-1).

109
Table 5-1 Summary of oleate feed and total feed characteristics to the codigesters during Phase I and II. Values in parentheses represent one standard deviation.
Step # LCFA increase
Days Oleate Feed Total Feed (Manure + Oleate)
VS (g/L)
VSLR (g VS/L-d)
COD (g/L)
OLR (g COD/L-d)
VSLR (g VS/L-d)
OLR (g COD/L-d)
% VS as LCFA
% COD as LCFA
Phase I: Pulse-fed and Continuous-Fed Codigesters 0 -50 - 0 0 0 0 0 1.3 (0.1) 2.4 (0.7) 0% 0% 1 1 - 20 0.7 0.04 2.1 0.1 1.3 (0.1) 2.2 (0.3) 3% 5% 2 21-45 1.5 0.08 4.5 0.2 1.3 (0.1) 3.0 (0.4) 6% 7% 3 46-65 2.5 0.1 7.5 0.4 1.3 (0.1) 2.3 (0.4) 10% 16% 4 66-85 4.8 0.2 14 0.7 1.5 (0.2) 2.7 (0.2) 16% 27%
Phase II: Continuous-Fed Codigester 5 86 - 106 7.5 0.4 22 1.1 1.7 (0.2) 3.5 (0.2) 22% 32% 6 107 - 126 11.6 0.6 34 1.7 1.8 (0.2) 3.7 (0.3) 32% 47% 7 127 - 149 18.9 0.9 56 2.8 2.1 (0.2) 5.2 (0.3) 45% 54% 8 150 - 183 25.6 1.3 76 3.8 2.6 (0.2) 5.9 (0.3) 50% 64% 9 184 - 204 21.8 1.1 65 3.2 2.3 (0.1) 5.2 (0.4) 48% 62%
Phase II: Pulse-Fed Codigester 1 104-116 1.5 0.1 4.6 0.2 1.4 (0.2) 2.3 (0.1) 5% 10% 2 117-126 3.5 0.2 10 0.5 1.3 (0.2) 2.4 (0.4) 13% 22% 3 127-137 6 0.3 18 0.9 1.7 (0.3) 3.0 (0.3) 18% 30% 4 138-149 13.6 0.7 40 2.0 1.9 (0.2) 3.9 (0.3) 36% 52% 5 150-183 25.6 1.3 76 3.8 2.6 (0.2) 5.9 (0.4) 50% 64% 6 184-204 21.8 1.1 65 3.2 2.3 (0.1) 5.2 (0.4) 48% 62%
VSLR = volatile solids volumetric loading rate; OLR = COD volumetric loading rate

110
5.3.2 Oleate Bioconversion Kinetics
Oleate bioconversion kinetics were measured for each codigester sludge in a series of batch tests
conducted on days 0, 41, and 84 during Phase I, and on days 129, 148, 170, and 204 for Phase II.
The 30-mL glass serum batch test bottles were purged with N2:CO2 (80:20) before adding 15 mL
digester effluent (digestate), sealed with butyl rubber septa and purged again with N2:CO2
(80:20). A 100 g/L aqueous solution of sodium oleate was added to the batch test bottles via
syringe for initial oleate concentrations of 0 (control), 100, 175, 350, 750, 1800, and 4500 mg/L.
The pH was adjusted to 7.2 with 1 N HCl. Triplicate test bottles were maintained at 35°C on an
orbital shaker at 150 rpm. Gas production was measured using a digital manometer (Series 490,
Dwyer Instruments, Michigan City) approximately 7 times over 8 hrs. The headspace methane
concentration was sampled with each pressure measurement. The background methane
production from the control was subtracted from each substrate-amended treatment, and the
slope of methane production was determined via linear regression in R version 3.2.1. Methane
production rates were adjusted to standard temperature and pressure (STP), and were normalized
to the amount of VS added to the vials initially. Batch tests for the PF codigesters were
conducted at the end of the 48-hr pulse-feeding cycles to minimize background substrate
concentrations.
5.3.3 Oleate Inhibition of Aceticlastic Methanogenic Activity
To test inhibitory effects of oleate on methanogenic activity, aceticlastic maximum methane
production rates (qmax,acetate) were measured in batch tests with different initial oleate
concentrations. The aceticlastic maximum methane production rate was measured according to
the procedure described by Conklin et al. (2006). Batch test bottle preparation was conducted as
111
described above in Section 5.3.2. A series of triplicate bottles received 50 mM sodium acetate in
addition to sodium oleate at initial concentrations of 0, 1.5, 4, 8, 12, and 16 g/L. One set of
triplicate vials without any added substrate was incubated in parallel to measure background
digestate methane production. Methane production was monitored 8-times over a 6-hr period
based on headspace pressure and composition. The qmax,acetate was calculated based on linear
regression of methane production curves as described by Conklin et al. (2006). Aceticlastic
inhibition tests were conducted within 3-days of each oleate bioconversion kinetic tests.
5.3.4 Analytical Methods
TCOD was measured with High-Range COD digestion vials (Hach Co., Loveland, CO)
according to Hach Method 8000. TS and VS were measured according to Standard Methods
(Eaton and Franson, 2005). Prior to daily wasting and feeding of the digesters, pH was measured
(EcoSens pH100A, YSI, Yellow Springs, Ohio) immediately after withdrawing samples.
Effluent sludge samples for volatile fatty acid (VFA) analysis were initially centrifuged at 14,000
g for 10 minutes. The supernatant was serial filtered with 0.45 and 0.22 µm polyethersulfone
(PES) syringe filters, and 100 µL of 10% formic acid was then added to 1 mL of filtrate to
acidify the sample. VFA were measured with a GC-FID (Shimadzu GC-2010) equipped with a
BP-21 column (30 m×0.32 mm I.D., 0.25 µm film thickness, SGE). LCFA were extracted from
digester effluent according to the protocol described by Ziels et al. (2015), and were analyzed by
GC-FID with a BP-21 column (30 m×0.32 mm I.D., 0.25 µm film thickness; SGE). Biogas
samples (~0.5-1 mL) were collected with a syringe equipped with a Teflon Mininert valve, and
the methane composition was analyzed using a SRI 8610C GC-FID with a Supelco Alumina
Sulfate Plot column (50 m, 0.53 mm i.d.).
112
5.3.5 DNA Extraction and Quantification
DNA was extracted in triplicate from digester sludge samples collected on the same days as the
batch oleate bioconversion kinetic assays. Briefly, ~15 mL of digester sludge was collected via
catheter syringe and transferred to pre-purged, O2-free centrifuge tubes on ice. The digester
sludge was aliquoted into 2 mL microcentrifuge tubes on ice in an anaerobic glove chamber. The
2 mL samples were then centrifuged at 14,000 g for 10 min at 4°C, immediately decanted, and
stored at -80°C. DNA was extracted from the pellet using the PowerMicrobiomeTM kit (MO BIO
Laboratories Inc., Carlsbad, CA) with phenol:chloroform:isoamyl during bead-beating,
according to the manufacturer’s instructions. Extracted DNA was quantified with the Quant-iT
HS DNA kit using a Qubit 2.0 fluorometer (Invitrogen, Carlsbad, CA).
5.3.6 Quantitative PCR
Quantitative PCR (qPCR) was conducted in accordance to Ziels et al. (2015) targeting 16S
rRNA gene fragments of the syntrophic β-oxidizing bacterial genera of Syntrophomonas, as well
as the domains Bacteria and Archaea (Yu et al., 2005). More detailed descriptions of the reaction
conditions, primers and probes, and calibration standards are given in the Supplemental
Information. qPCR was conducted on triplicate DNA extractions from each sampling point, and
gene copy numbers were normalized per g VS of digester biomass.
5.3.7 16S rRNA Gene Amplicon Sequencing
Amplicon sequencing of 16S rRNA genes was conducted on triplicate DNA extractions from
each sampling point. Briefly, 16S rRNA gene fragments from all samples were amplified with
barcoded and indexed universal prokaryotic V4-V5 primers 515F-Y (5′-
GTGYCAGCMGCCGCGGTAA) and 926R (5′-CCGYCAATTYMTTTRAGTTT) (Parada et

113
al., 2015), and the products were pooled and sequenced on a 2x300bp Illumina MiSeq run by the
United States Department of Energy Joint Genome Institute. The raw sequence data is available
through the JGI Portal (http://jgi.doe.gov) under project ID number 1105525.
5.3.8 Bioinformatics
To obtain a high resolution of the community composition, amplicon reads were denoised into
their exact sequences using the DADA2 pipeline (Callahan et al., 2016). Reads were first quality
filtered by trimming the first 10 bp from all sequences, truncating forward reads at 265 bp,
truncating reverse reads at 180 bp, and filtering all reads based on a maximum expected error of
2 using DADA2. Parameters for the DADA2 error model were initially calculated on
dereplicated reads of a random subset of 20 samples, and the estimated error parameters were
subsequently used to denoise all dereplicated sample reads into exact sequences. Forward and
reverse sequences were then merged with DADA2 using a minimum overlap of 20 bp and zero
allowed mismatches. Merged denoised sequences were truncated to 390 bp and clustered into
99.5% OTUs following chimera removal with UPARSE (Edgar, 2013), resulting in 5014 non-
singleton OTUs. Representative sequences of the 99.5% OTUs were classified against the
SILVA SSU Ref NR dataset (v.123) using the RDP classifier (Wang et al., 2007).
Relative abundance values were calculated based on normalized sequence counts obtained with
DESeq2 (Love et al., 2014), which accounted for different sequencing depths among samples.
Diversity estimates were based on Hill diversity numbers (qD) of orders q = 0, 1, and 2 (Jost,
2006) using DESeq2 normalized sequence counts.

114
5.3.9 Regression Analysis
A stepwise regression approach was used to identify a subset of OTUs that significantly
explained maximum methane production rates from oleate and acetate (p < 0.05). Predictor
variables (before stepwise feature selection) for the qmax,oleate regression model included the
inferred absolute abundances of 13 dominant Syntrophomonas OTUs, and the predictor variables
for the qmax,acetate regression model consisted of inferred absolute abundances of 3 dominant
Methanosaeta OTUs. Inferred absolute abundances were calculated by multiplying each OTU
relative abundance value by the target group 16S rRNA gene copies per g VS obtained by qPCR.
The triplicate amplicon sequence profiles for each sampling point were included individually in
the model development and validation. Prior to model fitting, multicollinearity between OTU
abundances was examined using Pearson’s correlation, and OTUs with correlation coefficients
greater than 0.7 were removed from the dataset. Stepwise feature selection was conducted with
the remaining OTU abundance datasets, and model selection was cross-validated based on 10
sub-samplings repeated 10 times using the caret package in R (Kuhn, 2008).
5.4 RESULTS
5.4.1 Effect of LCFA OLR and feeding frequency on codigester performance
Impacts of LCFA (oleate) feeding frequency on codigester performance and bioconversion
kinetics were investigated by increasing the oleate loading in two operational phases over 204
days (Table 5-1). There was no significant effect of the LCFA OLR on codigester effluent VS
concentrations, indicating that LCFA addition with both feeding strategies did not impair the
manure VS destruction efficiency and that most of the LCFA fed was degraded (Supplemental

115
Tables C1 and C2). The pH of the codigesters was on average 7.2 and 7.5 by the end of Phase I
and II, respectively (Supplemental Tables C1 and C2), indicating sufficient buffering capacity in
the codigesters.
During Phase I, the average daily methane production rate was similar for the two codigesters,
and increased with each incremental increase in the feed LCFA concentration (Figure 5-1A). By
the end of Phase I, the methane production rate for the codigesters was on average 70% higher
than that for the manure-fed control (average of 1700 mL/d versus 1000 mL/d). Similar increases
in methane production during Phase II were observed with each incremental increase in LCFA
loading to the codigesters (Figure 5-1B). At the highest LCFA loading of 64% of the influent
COD during Phase II, the daily methane production of both codigesters was on average 440%
higher than that for the Phase I manure-fed control (average of 5500 mL/d versus 1000 mL/d).
The average specific methane yield was 8% higher for the PF2 codigester relative to the CF
codigester at the highest LCFA loading during Phase II, but the difference was not statistically
significant due to the large daily variation in gas production with the pulse-feeding regime
(Supplemental Table C2).
Acetate was the only VFA that accumulated above 40 mg/L during LCFA codigestion. In Phase
I, acetate was always below 40 mg/L (Figure 5-1C), but in Phase II the effluent acetate persisted
after the oleate OLR was increased to 64% of the total influent COD (3.8 g CODoleate/L-d) on day
150. After day 180, the effluent acetate concentration in the CF codigester steadily increased to
about 3,000 mg/L by the end of the experiment on day 204. During that time, the PF2 codigester
effluent acetate concentration was elevated to about 500-1000 mg/L at 24 hrs after LCFA
116
feeding, but the acetate was consumed to low levels before the next feeding every 48-hrs (Figure
5-1D).
5.4.2 Impacts of LCFA OLR and feeding frequency on LCFA and acetate bioconversion
kinetics
After the addition of oleate to the codigesters, their qmax,acetate and qmax,oleate values increased with
increasing oleate OLRs up to day 170. At the end of Phase I, the CF and PF codigesters had
similar qmax,acetate values, but the qmax,oleate value for the PF codigester was 16% higher (Table
5-2). During Phase II, the oleate OLR was increased for the CF codigester from 2.8 to 3.8 g
COD/L-d by day 170 (Table 5-1). The PF2 codigester had the same oleate OLR of 3.8 g COD/L-
d by day 170, but its OLR had been increased at a faster rate starting from day 104. On day 170,
the PF2 codigester had a higher qmax,oleate than the CF codigester by 17%, and a higher qmax,acetate
by 28% (Table 5-2). The qmax,acetate and qmax,oleate values for both codigesters decreased between
days 170 and 204 in Phase II, but the biokinetics of the PF2 codigester remained faster with 35%
and 33% higher qmax,acetate and qmax,oleate values than that of the CF codigester on day 204,
respectively (Table 5-2). These results were confirmed by substrate inhibition kinetic modeling
(Aiba et al., 1968) described in the Supplemental Information, which showed that the PF and
PF2 codigesters had 65% and 27% higher qmax,oleate values than the CF codigester at the end of
Phase I and II (Supplemental Table C7). Pulse-feeding oleate during codigestion therefore
selected for higher oleate and acetate utilization kinetics.
Tests were conducted to examine the effect of oleate concentration on the maximum acetate
utilization rate (qmax,acetate), and showed that qmax,acetate values were not inhibited by oleate
concentrations below 4 g/L until day 204 (Supplemental Table C3). On day 204, the qmax,acetate of

117
both Phase II codigesters was not inhibited by an oleate concentration of 0.8 g/L, but at 4 g/L
oleate it was inhibited by over 60% (Supplemental Table C3). Effluent oleate concentrations for
both Phase I and II were below 150 mg/L (Supplemental Tables C4 and C5), which were below
these inhibitory concentrations for aceticlastic methanogenesis. Yet, a decreased aceticlastic
tolerance to oleate on day 204 was indicated by lower total qmax,acetate values in both codigesters
(Table 5-2), as well as acetate accumulation within the CF codigester (Figure 5-1D).
Until day 84 in Phase I, the rate of oleate bioconversion in the batch tests with both codigester
sludges was inhibited above 350 mg/L oleate, as indicated by lower methane production rates at
higher oleate concentrations (Supplemental Table C6). On day 84 in Phase I, the rate of oleate
conversion in PF codigester batch tests was not inhibited up to 1,800 mg/L oleate, whereas the
conversion rate in the CF codigester batch tests was inhibited at 350 mg/L (Supplemental Table
C6). During Phase II, the inhibitory oleate concentration increased for both codigesters batch
tests toward ~1,800 mg/L until day 204 (Supplemental Table C6). On day 204, oleate
bioconversion rates in CF codigester batch tests were inhibited at an oleate concentration of 875
mg/L, whereas the rates in the PF2 codigester batch tests were not inhibited up to 1,800 mg/L.
Thus, pulse-feeding LCFA during codigestion led to a higher resistance to oleate inhibition
during its biodegradation in comparison to continuous-feeding.
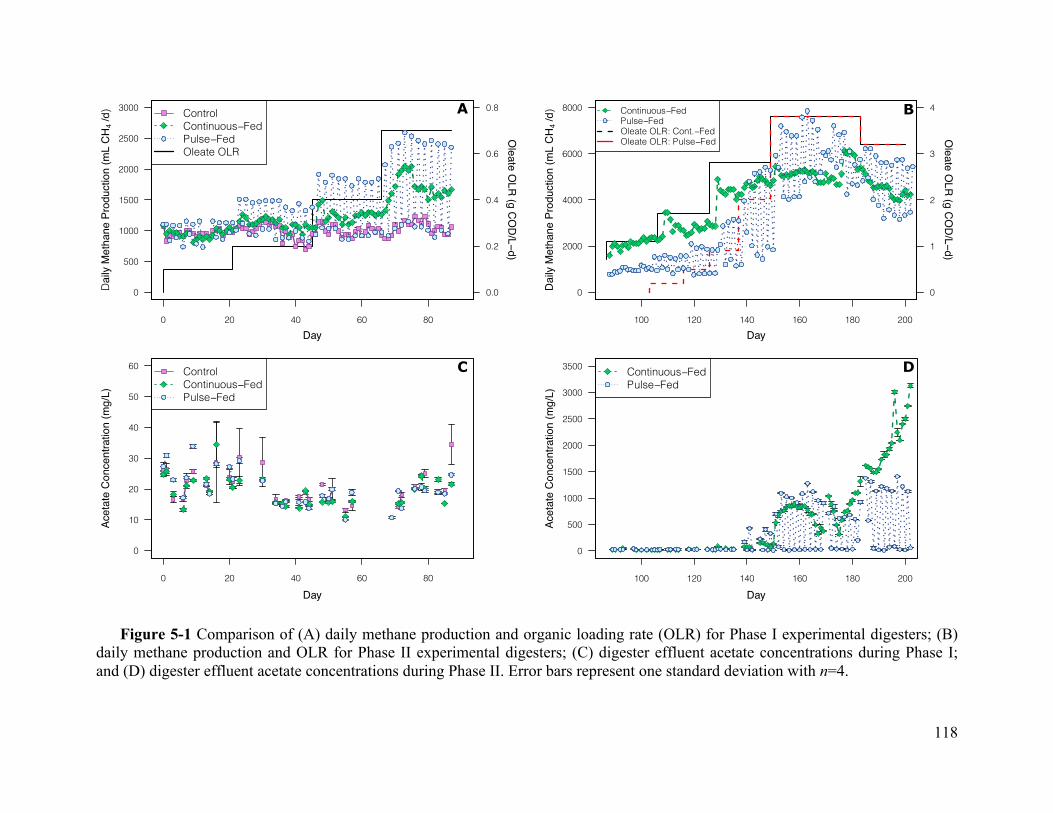
118
Figure 5-1 Comparison of (A) daily methane production and organic loading rate (OLR) for Phase I experimental digesters; (B) daily methane production and OLR for Phase II experimental digesters; (C) digester effluent acetate concentrations during Phase I; and (D) digester effluent acetate concentrations during Phase II. Error bars represent one standard deviation with n=4.
0
1
2
3
4
100 120 140 160 180 200
0
2000
4000
6000
8000
●●●●●●●●●●●●
●●●●●
●
●
●
●
●
●
●
●
●
●
●
●
●
●
●
●
●
●
●
●
●
●
●
●
●●
●
●
●
●
●
●
●
●
●
●
●
●
●
●
●
●
●
●
●
●
●
●
●
●
●
●
●
●
●
●
●
●
●
●
●
●
●
●
●●●
●
●
●
●
●
●
●
●
●
●
●
●
●
●
●
●
●
●
●
●
●
●
●
●
●
●
●
●
●
●
●
●
Dai
ly M
etha
ne P
rodu
ctio
n (m
L C
H4
/d)
Oleate O
LR (g C
OD
/L−d)Continuous−FedPulse−FedOleate OLR: Cont.−FedOleate OLR: Pulse−Fed
●
0.0
0.2
0.4
0.6
0.8
0 20 40 60 80
0
500
1000
1500
2000
2500
3000
●●
●
●
●
●
●
●
●
●
●
●
●
●
●
●
●
●
●
●●
●
●
●
●
●
●
●
●
●
●
●
●
●
●
●
●
●
●
●
●
●
●
●
●
●
●
●
●
●
●
●
●
●
●
●
●
●
●
●
●
●
●
●
●
●
●
●
●
●
●
●
●
●
●
●
●
●
●
●
●
●
●
●
●
●
Dai
ly M
etha
ne P
rodu
ctio
n (m
L C
H4
/d)
Oleate O
LR (g C
OD
/L−d)
Day
ControlContinuous−FedPulse−FedOleate OLR
●
A
0 20 40 60 80
0
10
20
30
40
50
60
●
●
●
●
●
●
●
●
● ●
●
●
●
●●● ●●
●
●●
●
●
●
●
●
●
●●● ●●
●
Acet
ate
Con
cent
ratio
n (m
g/L)
Day
ControlContinuous−FedPulse−Fed●
C
B
100 120 140 160 180 200
0
500
1000
1500
2000
2500
3000
3500
●●●● ●●●●●●●● ●●●● ●●● ●●●●●●●●
●
●
●
●
●
●
●
●
●
●
●
●
●
●
●
●
●
●
●
●
●
●
●
●
●
●
●
●
●
●
●
●
●
●
●
●
●
●
●
●
●
●
●
●
●
●
●
●
●
●
●
●
●
●
●
●
●
●
●
●Ac
etat
e C
once
ntra
tion
(mg/
L)
Day
Continuous−FedPulse−Fed●
D
Day

119
Table 5-2 Maximum conversion rates for oleate (qmax,oleate) and acetate (qmax,acetate) observed in the batch kinetic assays with digester sludges collected throughout Phases I and II.
Day
Oleate qmax (mL CH4/g VS-d)
Acetate qmax (mL CH4/g VS-d)
Control CF Codigester
PF Codigester Control CF
Codigester PF
Codigester Phase I Digesters
0 24 (2) 27 (2) 25 (4) 45 (4) 47 (5) 37 (3) 41 11 (0) 34 (1) 23 (1) 35 (4) 40 (3) 32 (2) 84 15 (1) 56 (4) 65 (2) 39 (1) 64 (6) 61 (8)
Phase II Digesters 129 - 167 (0) 49 (1) - 137 (11) 88 (8) 148 - - 124 (9) - - 104 (19) 170 - 144 (5) 168 (4) - 111 (13) 142 (9) 204 - 81 (2) 108 (1) - 52 (5) 70 (8)
5.4.3 Microbial community structure and diversity was altered by the codigester feeding
pattern
By the end of Phase I, the Bacteria and Archaea community profiles were similar between the
PF codigester and the CF codigester (Figure 5-2). Yet, sequences of the β-oxidizing
Syntrophomonas increased to 9% ± 0.2 and 4% ± 0.1 of bacterial reads in the PF and CF
codigesters by day 84, respectively, which were both significantly higher (p<1e-3) than the
control at 0.5% ± 0.04 (Figure 5-2A). While the fraction of Syntrophomonas in the PF codigester
was almost double that of the CF codigester by day 84 (p<0.001; Figure 5-2A), the CF
codigester had significantly higher absolute concentrations of total Bacteria 16S rRNA genes at
the end of Phase I (p<0.01, respectively; Figure 5-3A). Consequentially, the absolute
concentration of Syntrophomonas 16S rRNA genes measured by qPCR was similar in the PF and
CF codigesters on day 84 (Figure 5-3C). Likewise, the PF codigester had a higher community
fraction of aceticlastic Methanosaeta on day 84 in Phase I (Figure 5-2B), but the higher total

120
Archaea 16S rRNA concentration in the CF codigester (Figure 5-3B) resulted in similar absolute
concentrations of Methanosaeta in the two codigesters (Supplemental Figure C2).
Figure 5-2 Relative read fractions of the (A) 12 most abundant Bacteria genera, and (B) 10
most abundant Archaea genera in the 16S rRNA amplicon sequence libraries for the digesters during Phase I. Genus abundance profiles from triplicate DNA extractions are shown for each time point. Both the microbial community abundance and composition was altered by the LCFA feeding
strategy during Phase II. Correspondence analysis revealed that the Bacteria and Archaea OTU
read abundance profiles diverged between the PF2 codigester and CF codigester beginning on
day 129 onward (Figure 5-4). On day 170, the PF2 codigester Archaea population had
significantly higher fractions of Methanosaeta, Methanoculleus, and Methanospirillum
sequences compared to the CF codigester (p<0.001; Figure 5-5B), whereas the CF codigester had
a significantly higher fraction of Methanobacterium (p<0.001). By day 204, the total Archaea
16S rRNA gene concentration was similar in both codigesters (Figure 5-3E), indicating that the
absolute abundance of Methanosaeta, Methanoculleus, and Methanospirillum was higher in the
PF2 codigester (Supplemental Figure C2). The Bacteria community of the PF2 codigester had a
R
ela
tive
Fra
ctio
n o
f Ba
cter
ia R
ea
ds
Day:
Reactor:
Bacteria
0 41 84 0 41 84 0 41 84
ControlCont.-Fed
Codigester
Pulse-Fed
Codigester
A
Candidatus Anammoximicrobium
Erysipelotrichaceae UCG−004
Sedimentibacter
Sphaerochaeta
Saccharofermentans
Rikenellaceae RC9 gut group
Christensenellaceae R−7 group
Ruminofilibacter
Smithella
Candidatus Cloacamonas
Syntrophomonas
vadin BC27 WW sludge group
0
10
20
30
40
50
0
10
20
30
40
Methanoregula
Methanobrevibacter
Methanomassiliicoccus
Candidatus_Methanoplasma
Methanomethylovorans
Methanimicrococcus
Methanospirillum
Methanoculleus
Methanobacterium
Methanosaeta
R
ela
tive
Fra
ctio
n o
f Ar
chae
a R
ea
ds
Archaea
0 41 84 0 41 84 0 41 84
ControlCont.-Fed
Codigester
Pulse-Fed
Codigester
Day:
Reactor:
B

121
significantly higher fraction of β-oxidizing Syntrophomonas compared to the CF codigester by
day 170 (p<0.001; Figure 5-5A). On day 204, the fraction of Syntrophomonas sequences in the
PF2 Bacteria sequence library increased to 43% ± 2, which was almost double that of the CF
codigester at 22% ± 0.4 (Figure 5-5A). The total Bacteria 16S rRNA gene concentration reached
similar levels in both codigesters by day 204 (Figure 5-3D), indicating that the absolute
abundance of Syntrophomonas was higher in the PF2 codigester due to its higher community
fraction (Figure 5-5A). This result was confirmed with qPCR on total Syntrophomonas 16S
rRNA genes, which showed a higher concentration in the PF2 codigester relative to the CF
codigester on day 204 (p<0.001; Figure 5-3F).
Figure 5-3 Concentration of 16S rRNA genes in the Phase I digesters for (A) Bacteria, (B)
Archaea, and (C) Syntrophomonas, and in the Phase II digesters for (D) Bacteria, (E) Archaea, and (F) Syntrophomonas. Error bars represent one standard deviation based on triplicate DNA extractions and duplicate qPCR technical replicates.
● ●●
16S
rRN
A G
ene
Con
c. (c
opie
s/g
VS)
●
●
●
●
●
●●
1e+10
1e+11
0 25 50 75 140 160 180 200Day
● ●●
●● ● ●
1e+11
5e+11
0 25 50 75 140 160 180 200
Phase I: Bacteria Phase II: Bacteria
●
●
● ●
5e+10
1e+11
0 25 50 75 140 160 180 200
Reactor
●
Control
Continuous-Fed
Pulse-Fed
Phase I: Archaea Phase II: Archaea
Phase I: Syntrophomonas Phase II: Syntrophomonas
A
B
C
D
E
F

122
Figure 5-4 Correspondence analysis (CA) plots based on (A) Bacteria and (B) Archaea normalized OTU sequence counts in the codigester and control digester samples collected throughout Phases I and II. The color of each marker represents the sample collection day and the shape of each marker represents the digester sludge source. The triplicate samples shown for each sample day are from replicate DNA extractions. The percentage shown along each axis represents the fraction of variance explained by that CA axis.
Figure 5-5 Relative read fractions of the (A) 12 most abundant Bacteria genera, and (B) 10 most abundant Archaea genera in the 16S rRNA amplicon sequence libraries for the digesters during Phase II. Genus abundance profiles from triplicate DNA extractions are shown for each time point.
ReactorControl
Continuous−Fed
Pulse
Pulse.v.2
Day04184129148170204
A B
●●●
●●●
●●●
−1
0
1
2
0 1 2 3CA 1 (36%)
CA 2
(21%
)
●●●●●●
●●●
−1
0
1
2
3
−1 0 1CA 1 (37%)
CA 2
(9%
)
0
20
40
60
80
100
Rel
ativ
e Fr
actio
n of
Bac
teria
Rea
ds
Day: 129 148 170 204
Reactor:
Archaea
Pulse-FedCodigester
Cont.-FedCodigester
B
MethanoregulaMethanobrevibacterMethanomassiliicoccusCandidatus MethanoplasmaMethanomethylovoransMethanimicrococcusMethanospirillumMethanoculleusMethanobacteriumMethanosaeta
129 148 170 2040
10
20
30
40
50
60
70
Rel
ativ
e Fr
actio
n of
Arc
haea
Rea
ds
A
129 148 170 204
Pulse-FedCodigester
Cont.-FedCodigester
129 148 170 204 Day:
Reactor:
Bacteria
Candidatus_AnammoximicrobiumErysipelotrichaceae_UCG−004SedimentibacterSphaerochaetaSaccharofermentansRikenellaceae_RC9_gut_groupChristensenellaceae_R−7_groupRuminofilibactervadinBC27_wastewater−sludge_groupSmithellaCandidatus_CloacamonasSyntrophomonas
123
In order to obtain a high resolution of digester microbial community compositions, amplicon
reads were denoised into their exact sequences with DADA2 (Callahan et al., 2016) prior to
clustering into OTUs at a 99.5% similarity. Such high-resolution analysis showed that at least
85% of Syntrophomonas-classified sequences were distributed among 13 OTUs (Figure 5-6).
Time-series abundance profiles of Syntrophomonas OTUs showed divergence based on
codigester LCFA feeding patterns by the end of Phases I and II (Figure 5-6). Correspondence
analysis of Syntrophomonas OTU sequence counts revealed that the genus composition differed
based on the codigester LCFA feeding strategy and loading (Supplemental Figure C3). These
results indicate that the fine-scale community structure of LCFA β-oxidizing bacteria in the
codigesters was impacted by the LCFA feeding frequency. In contrast, over 95% of the
sequences classified within the aceticlastic genus of Methanosaeta were comprised by only 3
OTUs, which had similar relative abundance profiles between the two codigesters (Supplemental
Figure C4). The hydrogen-utilizing genus Methanobacterium was represented at over 90% by a
single OTU. The biological selective pressure from LCFA feeding frequency therefore had larger
impacts on the composition of syntrophic bacteria than selection for different dominant taxa of
aceticlastic and hydrogenotrophic methanogens.

124
Figure 5-6 Relative read fractions of the 13 most abundant OTUs classified within the
Syntrophomonas genus of the digesters during Phases I and II based on 16S rRNA amplicon sequencing. OTU abundance profiles from triplicate DNA extractions are shown at each time point. The presence of LCFA as a co-substrate in the feed resulted in lower Bacteria diversity in both
codigesters, while pulse-feeding LCFA during codigestion resulted in higher Archaea
community diversity. Diversity of the Bacteria community at all orders of Hill diversity numbers
(qD) assessed (q = 0, 1, and 2) decreased over time for both codigesters during Phases I and II
(Supplemental Figure C5). In contrast, Bacteria Hill diversity numbers for the Phase I control
digester increased over time (Supplemental Figure C5). Despite their decreasing trend in both
codigesters during Phase II, Bacteria Hill diversity numbers of the orders of 1D and 2D were
higher in the PF codigester relative to the CF codigester until day 170, after which 1D and 2D
were lower in the PF2 codigester (Supplemental Figure C5). Similarly, diversity numbers of
orders 1D and 2D for the Archaea community were significantly higher (p<0.01) in the PF
codigester relative to the CF codigester at the end of Phase I, and stayed significantly higher
(p<0.01) in the PF2 codigester during Phase II (Supplemental Figure C6). Richness (i.e. 0D)
0
20
40
60
80
100
seq_12291seq_12110seq_1083seq_7266seq_154seq_6886seq_340seq_58seq_348seq_364seq_35seq_34
Rela
tive
Frac
tion
of S
yntro
phom
onas
Rea
ds
Day: 0 41 84 0 41 84 0 41 84 129 148 170 204 129 148 170 204
Reactor: Control Cont.-FedCodigester
Phase I Phase II
Pulse-FedCodigester
Pulse-FedCodigester
Cont.-FedCodigester

125
values of the Archaea communities were similar between all digesters in Phase I, but were
significantly higher (p<0.01) in the PF2 codigester relative to the CF codigester starting at day
170 in Phase II (Supplemental Figure C6).
5.4.4 Oleate and acetate bioconversion kinetics were correlated to syntrophic and
methanogenic community abundance
A linear regression model was established to examine the relationship between maximum oleate
conversion rates (qmax,oleate) measured during batch kinetic tests with all digester sludges (16 tests
total) and the 16S rRNA gene concentration of total Syntrophomonas in the sludges (Figure
5-7A). The total Syntrophomonas 16S rRNA gene concentration was a significant predictor of
qmax,oleate values (p<0.001). The specific slope of the linear regression was 8.6 x 10⁻¹⁰ mL
CH4/16S rRNA gene-day, and the overall model fit had an R2 of 0.73.
To examine the importance of syntrophic bacteria community structure, a multiple linear
regression model was developed to predict qmax,oleate values based on absolute concentrations of a
subset of Syntrophomonas OTUs (Figure 5-7B). Feature selection and cross-validation showed
that the linear model provided the greatest R2 by incorporating the absolute concentrations of six
Syntrophomonas OTUs. All of the six selected Syntrophomonas OTUs were significant
predictors of qmax,oleate (p<0.05; Supplemental Table C8). The individual OTU correlation
coefficients ranged from -7.0 x 10⁻⁸ to 2.8 x 10⁻⁸ mL CH4/16S rRNA gene-day (Supplemental
Table C8). The negative slope contribution found for one OTU suggests that it had an
antagonistic effect on oleate conversion. The resulting multiple linear regression model had an
improved R2 of 0.92 in comparison to the linear regression that was dependent only on the total

126
Syntrophomonas 16S rRNA gene concentration (Figure 5-7). A phylogenetic comparison of the
six selected Syntrophomonas OTUs showed that they were distributed throughout the genus
(Supplemental Figure C7).
Figure 5-7 Linear regression of observed qmax,oleate values versus (A) the total Syntrophomonas 16S rRNA gene concentration; and (B) predicted qmax,oleate values from a multiple-linear regression model based on inferred 16S rRNA gene concentrations of 6 selected Syntrophomonas OTUs. Inferred absolute abundances were calculated by multiplying the relative fraction of each OTU within total Syntrophomonas read counts by the total Syntrophomonas 16S rRNA gene concentration. Error bars represent one standard deviation.
A similar approach showed that the absolute concentration of total Methanosaeta 16S rRNA
genes was a significant predictor of the aceticlastic qmax,acetate values (p=0.001), although the R2 of
the correlation was only 0.51 (Supplemental Figure C8A). A multiple-regression model was
developed to predict qmax,acetate values based on the absolute 16S rRNA gene concentrations of
two Methanosaeta OTUs, which resulted in an R2 of 0.62 (Supplemental Figure C8B). Thus,
oleate and acetate conversion kinetics of the codigester biomasses were both predicted more
precisely by incorporating fine-scale syntrophic and methanogenic community structures.
Predicted qmax, oleate (mL CH4 /g VS−d)
Obs
erve
d q m
ax, o
leat
e(m
L C
H4
/g V
S−d
)
Syntrophomonas 16S rRNA Gene Conc. (Copies/g VS)
A B
●
●
●
●
●
●
●
R2 = 0.92
P = 2.6e−09
Slope = 1.02
0
50
100
150
200
0 50 100 150
Reactor
●
Control
Continuous-fed
Pulse-fed
●
●
●
●
●
●
●
R2 = 0.73P = 1.6e−05
Slope = 8.6e−10
0
50
100
150
0 5x10¹⁰ 1x10¹¹ 5x10¹¹
Obs
erve
d q m
ax, o
leat
e(m
L C
H4
/g V
S−d
)
127
5.5 DISCUSSION
5.5.1 Codigester stability and bioconversion kinetics were impacted by LCFA feeding pattern
The results of this study showed that pulse-feeding oleate during codigestion selected for higher
oleate and acetate bioconversion kinetics, as well as more stable digester performance at high
LCFA loadings. The improved tolerance to high LCFA loadings was apparent during Phase II,
when acetate accumulated to above 3,000 mg/L in the CF codigester but was completely
degraded between feedings in the PF2 codigester. Even though the maximum acetate conversion
rates (qmax,acetate) decreased in both codigesters at the high LCFA loadings in Phase II, the PF2
codigester had a higher aceticlastic tolerance by maintaining a higher qmax,acetate than the CF
codigester. The higher acetate conversion kinetics in the pulse-fed system may have prevented
acetate accumulation at the high LCFA OLRs. These findings agree with previous work showing
that daily acetate feeding improved acetate utilization kinetics and digester tolerance to organic
overloading in comparison to hourly acetate feeding (Conklin et al., 2006). Pulse-feeding also
provided a greater tolerance to organic overloading and ammonia toxicity in comparison to a
continuous-fed digester during anaerobic treatment of synthetic wastewater (De Vrieze et al.,
2013). Periodic pulse-feeding of LCFA has been suggested as a strategy to enable efficient
digester start-up by providing sufficient batch degradation time to consume inhibitory LCFA
(Cavaleiro et al., 2009). Yet, this is the first study to operate a continuous-fed codigester in
parallel with a pulse-fed codigester for a comparison of stability and LCFA bioconversion
kinetics during LCFA codigestion. The mechanism for biological selection imposed by LCFA
pulse feeding could have been attributed to transiently high acetate and LCFA concentrations,
which could select for more resistant syntrophic and archaeal populations as well as promote
higher maximum substrate utilization kinetics. Thus, pulse-feeding LCFA-rich substrates, such

128
as FOG, may allow for more stable codigester performance at high daily loading rates relative to
continuous-fed codigestion systems.
5.5.2 Codigester feeding pattern drove biological selection of syntrophic bacteria and
methanogen population structures
Our results showed that LCFA codigestion promoted the growth of Syntrophomonas bacteria as
the dominant LCFA β-oxidizing group, with different LCFA feeding patterns resulting in
divergent Syntrophomonas community composition and absolute abundance. Syntrophomonas
have been identified by previous studies to play an important role in LCFA β-oxidation in
anaerobic digestion systems (Shigematsu et al., 2006; Sousa et al., 2009, 2007a; Ziels et al.,
2016, 2015). The maximum relative fraction of Syntrophomonas observed in the PF2 codigester
of 43% was the largest Syntrophomonas community fraction reported for an anaerobic digestion
community thus far (Stams et al., 2012; Ziels et al., 2016, 2015). Previous work has suggested
that syntrophic bacteria populations are stable and resilient, and are unlikely to undergo
competition with different syntrophs that have similar metabolic functions (Werner et al., 2011).
The high-resolution 16S rRNA gene amplicon analysis conducted in this study revealed that
various Syntrophomonas taxa were capable of occupying the same ecological niche within the
codigesters, and the resulting Syntrophomonas community structure was affected by the digester
feeding pattern. Thus, the highly-specialized metabolic role of syntrophic fatty-acid oxidation
(McInerney et al., 2009) may have a level of physiological diversity in anaerobic digesters, with
multiple syntrophic species/strains capable of contributing to LCFA-degradation. The dynamic
LCFA concentrations from pulse-feeding could have possibly promoted competition among
syntrophic taxa with different affinities and/or maximum substrate conversion rates, as was

129
reported for syntrophic propionate oxidation in fill-and-draw anaerobic reactors (H. D.
Ariesyady et al., 2007).
The structure of syntrophic communities likely depends on the kinetics of both the syntrophic
bacteria and the methanogenic partners, since the metabolism of these communities exists
delicately near thermodynamic equilibrium (Stams and Plugge, 2009). The rate of fatty-acid
oxidation by syntrophic bacteria was shown to limit fatty-acid conversion when the
methanogenic partner maintained low concentrations of acetogenesis products (Junicke et al.,
2016), whereas methanogens have also been found to limit syntrophic conversion rates (Warikoo
et al., 1996). In our study, higher qmax,oleate values were observed in the PF codigesters, which
also had higher values of qmax,acetate. It is plausible that the higher acetate consumption kinetics
drove more rapid oleate conversion, since the thermodynamics of oleate conversion into methane
relies upon the intermediate acetate concentration (Schink, 1997). Differences in acetate
utilization kinetics with pulse- versus continuous-feeding patterns have been attributed to
divergent aceticlastic populations, since Methanosaeta species have higher affinities for acetate
but lower maximum utilization rates in comparison to Methanosarcina species (Conklin et al.,
2006). In this study, Methanosaeta was the dominant aceticlastic group in both codigesters,
despite acetate accumulation to over 3,000 mg/L in the CF codigester and periodic acetate
accumulation to 500-1,000 mg/L in the PF2 codigester. A higher tolerance to LCFA was
reported for pure cultures of Methanosaeta concilii in comparison to Methanosarcina mazei
(Silva et al., 2016), which could explain the dominance of Methanosaeta in our study
codigesters.

130
The PF2 codigester had almost twice the Syntrophomonas concentration as the CF codigester on
day 204 despite similar levels of influent LCFA removal in the two systems, indicating that the
LCFA feeding frequency may have altered growth yields or decay rates. Growth yields under
anaerobic conditions have been related to thermodynamics, with greater Gibbs free energies
supporting higher yields (Kleerebezem and Van Loosdrecht, 2010). High initial oleate
concentrations coupled with low digester acetate levels could have promoted more free energy
for growth of Syntrophomonas in the PF2 codigester (Schink, 1997). In addition to lower acetate,
a lower hydrogen concentration would also provide more free-energy for growth via LCFA β-
oxidation (Schink, 1997; Stams and Plugge, 2009). Lower hydrogen levels could have been
promoted in the PF2 codigester, which had higher concentrations of the hydrogen-utilizing
Methanoculleus that have higher affinities for hydrogen in comparison to Methanobacterium
(Chong et al., 2002; Lovley, 1985) that were more abundant in the CF codigester. A more
detailed thermodynamic analysis would be needed to elucidate how the LCFA feeding strategy
impacted the fluxes of intermediate metabolites during syntrophic conversion, but such work is
warranted to improve our understanding of codigester LCFA conversion kinetics and syntrophic
community structure.
5.5.3 Relating bioconversion kinetics to microbial community structure
This study demonstrated that codigester biokinetics were correlated to measurements of
community composition. While the qmax,oleate and qmax,acetate both correlated significantly with the
absolute concentrations of total Syntrophomonas and Methanosaeta 16S rRNA genes,
respectively, improved model accuracy was obtained by incorporating measurements of fine-
scale community composition and absolute abundance measurements. Bocher and colleagues
(2015) demonstrated the promising use of multiple-linear regression to predict specific
131
methanogenic activities from glucose and propionate based on methanogen community
descriptors. Yet, the models developed in the latter study utilized relative DGGE band intensities
as predictor variables, while the multiple-linear regression models developed in our study
utilized absolute concentrations of fine-scale OTUs as predictor variables. Absolute
quantification of taxa through the combination of high-throughput 16S amplicon sequencing and
quantitative enumeration methods was recently suggested to provide a more comprehensive view
of microbial compositional dynamics (Props et al., 2016). Since reactor bioconversion kinetics
are dependent on biomass concentrations, we suggest that our predictive modeling approach
based on absolute quantification of taxa can be used to identify certain OTUs that contribute to
higher bioconversion rates for substrates of interest, such as LCFA and acetate in anaerobic
digesters. From a practical perspective, identifying such key microbial taxa could enable more
focused monitoring efforts for predicting codigester performance and capacities under dynamic
FOG loading situations, leading to improved digester stability and methane recovery.
5.6 CONCLUSIONS
This study assessed the impacts of codigester LCFA feeding pattern on microbial community
structure and bioconversion kinetics. The following can be concluded from the results of this
study:
• Overall Bacteria and Archaea community composition diverged at high LCFA OLRs in
codigesters fed at different frequencies. Thus, LCFA feeding frequency and OLR were
biological selective pressures that drove the digester population structure.

132
• The codigester LCFA feeding strategy impacted the composition of the syntrophic and
methanogenic communities. Higher relative and absolute concentrations of
Syntrophomonas and Methanosaeta 16S rRNA genes were observed in the PF2
codigester than the CF codigester in Phase II at high LCFA loadings.
• Higher qmax,oleate values were promoted in the PF codigesters in Phase I and II operation.
The qmax,acetate values were also higher in the PF codigester by the end of Phase II
operation. These results indicate that the anaerobic codigester oleate feeding pattern
influenced microbial bioconversion kinetics for acetate and oleate.
• Both qmax,oleate and qmax,acetate correlated significantly with the concentrations of total
Syntrophomonas and Methanosaeta 16S rRNA genes, respectively.
• Improved predictive accuracy for qmax,oleate and qmax,acetate was obtained through multiple-
linear regression based on the absolute concentration of syntrophic and methanogenic
taxa. This method could be used to monitor key microbial OTUs that significantly
contribute to substrate conversion kinetics in anaerobic digesters.
5.7 SUPPLEMENTAL INFORMATION AVAILABLE
The Supplemental Information for Chapter 5 is included in this document as Appendix C.

133
Chapter 6. DNA-STABLE ISOTOPE PROBING BASED
METAGENOMICS IDENTIFIES KEY LONG-CHAIN FATTY
ACID DEGRADING POPULATIONS IN PARALLEL
ANAEROBIC CODIGESTERS WITH DIFFERENT OLEATE
FEEDING STRATEGIES
6.1 ABSTRACT
Recovering biomethane from fats, oils, and greases (FOG) with anaerobic codigestion has
considerable potential to reduce energy and carbon footprints of wastewater treatment.
Improving our understanding of long-chain fatty acid (LCFA)-degrading microbial communities
is key for developing anaerobic digester operating strategies that mitigate inhibitory LCFA
accumulation at high FOG loading rates. There is limited information on the impact of anaerobic
digester operating conditions on the diversity and genomic potential of LCFA-degrading
communities. In this research, DNA stable isotope probing (SIP) was coupled with metagenomic
sequencing for a genome-centric comparison of oleate (C18:1)-degrading populations in two
parallel anaerobic codigesters operated with either a pulse-feeding or continuous-feeding
strategy. The pulse-fed codigester SIP microcosms converted oleate into methane at a higher rate
than the continuous-fed codigester microcosms. Differential coverage binning was demonstrated
for the first time to recover population genome bins (GBs) from DNA-SIP metagenomes. About
70% of the 13C-enriched GBs were taxonomically classified to the Syntrophomonas genus.
Phylogenetic comparisons of 13C-enriched GBs showed that some closely-related
Syntrophomonas GBs were detected in both codigesters, while other phylogenetically distinct
134
Syntrophomonas GBs were unique to each codigester. 16S rRNA amplicon sequencing of heavy
density gradient fractions corroborated the results of metagenomic binning. Overall, these data
suggest that syntrophic populations degrading LCFA in anaerobic digesters can be functionally
redundant, and different populations may be biologically selected by adjusting the digester
feeding strategy to promote favorable biokinetics.
6.2 INTRODUCTION
Anaerobic digestion is an attractive biotechnology for recovering renewable energy as
biomethane (CH4) during organic waste treatment. Worldwide interest in anaerobic digestion has
led to the implementation of approximately 9,000 full-scale facilities in Europe and over 3,000
facilities in the U.S. by 2012 (Guo et al., 2015). The conversion of organic matter into
biomethane relies upon an intricate balance of multiple microbial trophic groups, including
hydrolyzing and fermenting bacteria, syntrophic acetogenic bacteria, and methanogenic archaea
(Briones and Raskin, 2003). Despite the relatively widespread adoption of anaerobic digestion,
its genomic potential still remains relatively underexplored (Vanwonterghem et al., 2016), owing
to the vast phylogenetic and metabolic diversity (Sundberg et al., 2013) and general non-
culturability of a majority of the microorganisms present in digesters (Vanwonterghem et al.,
2014). An improved understanding of the metabolic capabilities of microbial populations
occupying key ecological niches within anaerobic digesters could help to facilitate new process
designs and operational strategies that maximize biomethane recovery from organic waste.

135
Adding fats, oils, and greases (FOG) as a co-substrate in the anaerobic digestion of livestock
manure or wastewater treatment solids has gained popularity to increase biomethane recovery
due to its higher biological methane potential (Alves et al., 2009; Luostarinen et al., 2009; Wang
et al., 2013), which is 2.7 to 3.0-times higher than livestock manure or wastewater treatment
solids (Labatut et al., 2011). During anaerobic degradation, FOG is rapidly hydrolyzed into
glycerol and long-chain fatty acids (LCFA) (Hanaki et al., 1981). LCFA are biologically
converted into methane through a syntrophic partnership between acetogenic β-oxidizing
bacteria and methanogenic archaea (Schink, 1997; Sousa et al., 2009). So far, only seven isolated
bacterial species are capable of β-oxidizing LCFA (> 12 carbons in length) in syntrophy with a
methanogen, and all belong to the families of Syntrophomonadaceae and Syntrophaceae (Sousa
et al., 2009; Zhang et al., 2012). However, the generally slow growth rates of syntrophic bacteria
coupled with the toxicity of LCFA has limited the number of cultured representatives obtained
(Hatamoto et al., 2007b).
Biomethane recovery from FOG can be limited by the toxicity of LCFA towards microbial
activity at high concentrations (Angelidaki and Ahring, 1992; Davidsson et al., 2008; Hanaki et
al., 1981; Luostarinen et al., 2009; Rinzema et al., 1994; Wan et al., 2011; Wang et al., 2013).
However, recent work showed that the maximum FOG loading rate without LCFA inhibition
could be elevated depending on the LCFA-degrading population abundance and specific LCFA
bioconversion kinetics (Ziels et al., 2016, Chapter 4). In the work presented in Chapter 5, it was
investigated whether the codigester LCFA feeding strategy could select for different LCFA-
degrading populations and bioconversion kinetics. The experimental results showed that the
LCFA feeding frequency impacted the composition of β-oxidizing Syntrophomonas bacteria, and

136
that pulse-feeding LCFA resulted in higher LCFA bioconversion kinetics in comparison to semi-
continuous LCFA feeding (Chapter 5). However, differences in community structure between
the codigesters in Chapter 5 were based on time-series 16S rRNA gene amplicon sequencing of
total digester biomass, and thus differences in the active fraction of LCFA-degrading populations
between the systems remain unknown. A comparison of the active LCFA-degrading populations
selected with different codigester feeding frequencies could improve our understanding of the
level of physiological diversity within digester syntrophic populations.
Stable isotope probing (SIP) is a cultivation-independent method that can be used to elucidate
links between microbial activity (function) and identity within environmental samples (Dumont
and Murrell, 2005; Radajewski et al., 2000). DNA-SIP relies on the incorporation of ‘heavy’
isotopes (e.g. 13C) into microbial DNA during biogrowth on labeled-substrates, and can thus acts
as a ‘filter’ to enrich the DNA of active populations (Chen and Murrell, 2010). DNA-SIP has
been combined with shotgun metagenomic sequencing approaches to discover novel enzymes
and operons within microbial communities (Chemerys et al., 2014; Saidi-Mehrabad et al., 2013;
Verastegui et al., 2014), and to identify new functional traits of microbial taxa (Eyice et al.,
2015). Additionally, the recovery of population genomes from 13C-enriched metagenome
libraries with DNA-SIP has been demonstrated using homology-based binning methods (Grob et
al., 2015; Laban et al., 2015). Recently-developed differential coverage binning techniques for
recovering population genomes from shotgun metagenomes (Albertsen et al., 2013; Kang et al.,
2015; Karst et al., 2016) are amenable to DNA-SIP due to the expected sequence composition
divergence between heavy density fractions of 12C- and 13C-incubated DNA samples (Coyotzi et
137
al., 2016). However, there have been no reported studies coupling differential coverage binning
with DNA-SIP to recover population genome bins from metagenome sequence data.
The objective of this study was to apply DNA-SIP combined with shotgun metagenomic
sequencing for a genome-centric comparison of the active oleate (C18:1 LCFA) degrading
populations in two parallel anaerobic codigesters fed with equal manure loadings but with
different oleate feeding frequencies. Differential coverage binning was employed to retrieve
population genome bins from the DNA-SIP 13C and 12C metagenomes. 16S rRNA gene amplicon
sequencing was also conducted on 13C and 12C heavy DNA fractions to verify key populations
involved in converting oleate into biomethane within the anaerobic codigesters.
6.3 MATERIALS AND METHODS
6.3.1 Anaerobic Bioreactor Operation
The two parallel anaerobic codigesters treating manure and oleate were operated at 35°C for over
200-days, as described previously in Chapter 5. The digesters had a 4-L working volume and a
20-day hydraulic and solids retention time. They were inoculated with anaerobic digester sludge
from a mesophilic anaerobic digester treating dairy manure at a nearby farm, and were fed with
blended manure feedstock collected from the same dairy farm (Chapter 5). Manure was fed daily
at a VS loading rate of 1.3 ± 0.2 g VS/L-d, and an aqueous solution of sodium oleate (>97%,
Tokyo Chemical Industry Co.) was added to the influent feed at 10% of the daily feed volume
for codigestion. The daily average oleate organic loading rate (OLR) to both codigesters was
identical, but their oleate feeding frequency differed. One codigester received the oleate feed
semi-continuously every 6-hrs daily, and is termed the continuous-fed (CF) codigester. The other

138
codigester received the oleate feed in a pulse every 2 days, and is termed the pulse-fed (PF)
codigester. Oleate loading was increased to the codigesters over two experimental phases: in
Phase I (days 0-85) the oleate feed reached 27% of the total influent COD, and in Phase II (days
86-204) the oleate loading reached 64% of the influent COD (Chapter 5). After Phase II
operation on day 204, the oleate OLR to both codigesters was reduced from 3.2 to 1.8 g COD/L-
d for 24 days. During this time, the pH of both codigesters averaged 7.5. The codigesters were
not fed between days 228-230 to reduce the level of any background substrates before
commencing SIP incubations with 13C-labeled sodium oleate on day 230. At that time, effluent
VFA and LCFA levels were below 70 mg/L.
6.3.2 Stable Isotope Probing Incubations with Anaerobic Digester Sludge
Sludge was sampled directly from the PF and CF codigesters after 48-hr of starvation on day
230. Microcosms were established in 35 mL glass serum bottles pre-purged with N2:CO2
(80:20), amended with 10 mL of codigester sludge (0.17 g VS total), sealed and capped with
butyl rubber septa, and purged again with N2:CO2 (80:20). All microcosms were maintained at
35°C, and stirred at 150 rpm on an orbital shaker. Microcosms were grouped into duplicate vials
that were supplemented with either 12C-sodium oleate or 13C-labeled sodium oleate at an initial
concentration of 8 mM. The 13C-labeled sodium oleate was universally labeled at all 18 carbons
(>98% atom purity, Cambridge Isotope Laboratories, Tewksbury, MA). Triplicate un-
supplemented controls were incubated in parallel to measure background methane production.
Gas production was measured based on the headspace pressure increase using a digital
manometer (Series 490A, Dwyer Instruments), and the headspace methane content was
measured with a GC-FID (SRI 8610C) equipped with a Supelco Alumina Sulfate Plot column

139
(50 m, 0.53 mm i.d.). Headspace pressure and composition were sampled about every 5 hr using
sterile syringes.
After the first addition of oleate was converted at >90% into methane over 48 hr (Figure 6-1),
12C- and 13C-labeled sodium oleate were re-supplemented separately at 8 mM after purging the
headspace with N2:CO2 (80:20). Following another 48-hrs for oleate conversion into methane, a
third supplement of 8 mM 12C- and 13C-labeled sodium oleate was added to the microcosms after
purging the headspace with N2:CO2 (80:20). The third incubation lasted 48 hr, after which
biomass from all bottles was sacrificed for DNA extraction. In total, 240 µmol of either 12C- or
13C-labeled oleate was added to the microcosms over the course of 6-days (144 hr), and was
converted into methane at >90% (Figure 6-1).
6.3.3 DNA Extraction and Density Gradient Centrifugation
Anaerobic codigester sludge samples were collected for DNA extraction at the start of the SIP
incubation (time zero), as well as from each SIP microcosm bottle after 6 days of incubation.
Briefly, 10 mL sludge was transferred to pre-purged, O2-free 15 mL centrifuge tubes on ice. The
15 mL tubes were then centrifuged at 12,000 g for 10 min at 4°C, immediately decanted, and
stored at -80°C. DNA was extracted from the frozen pellet using the PowerMicrobiomeTM kit
(MO BIO Laboratories Inc., Carlsbad, CA) with phenol:chloroform:isoamyl during bead-
beating, according to the manufacturer’s instructions. Extracted DNA was suspended in
nuclease-free TE buffer, and was quantified with a Quant-iT HS DNA kit on a Qubit 2.0
fluorometer (Invitrogen, Carlsbad, CA).

140
DNA extracts (5 µg in 500 µL 1X TE buffer) from 12C-oleate and 13C-oleate fed microcosms
after 6 days of incubation were separately combined with 25 µL SYBR Safe DNA Gel Stain
(10,000X, ThermoFisher Scientific, Waltham, MA) and 4.4 mL TE/CsCl solution (10mM Tris,
10mM EDTA [pH 8.0], CsCl at a buoyant density of 1.82 g/mL) and loaded into 4.8 mL
OptiSeal polyallomer tubes (Beckman Coulter, Brea, CA) for a final buoyant density of 1.71
g/mL. Density gradient centrifugation was performed with a TLA-110 rotor at 55,000 rpm and
20°C for 72 hr in an OptimaMax ultracentrifuge (Beckman Coulter) with vacuum on, maximum
acceleration, and no brake on deceleration. Gradients were displaced with MilliQ water pumped
into the top of the OptiSeal tube at 425 µL/min using a Model 11 Plus syringe pump (Harvard
Apparatus, Holliston, MA), and 200 µL fractions were collected dropwise from a needle in the
bottom of the tube (24 fractions total). The refractive index (nd-TC) of each gradient fraction
was immediately measured using an AR200 digital refractometer (Reichart, Ithaca, NY), and the
buoyant density (BD) was calculated based on a standard curve of nd-TC versus BD for the
TE/CsCl solution (Supplemental Figure D1). DNA was precipitated from each fraction by
adding 1 µL of linear polyacrylamide (GenElute LPA, Sigma-Aldrich), 0.3 M sodium acetate,
and 70% ethanol and left overnight at 4°C before centrifuging at 16,000 g for 30 min. Pelleted
DNA was washed with 1 mL 70% ethanol, centrifuged again for 20 min, air dried and re-
suspended in sterile 1X TE buffer (pH 8.0). The concentration of DNA in each fraction was
measured with a Quant-iT HS DNA kit to identify shifts in BD in the 13C-oleate amended
microcosms (Supplemental Figure D2).
6.3.4 Quantitative PCR
To further detect differences in DNA BD values between the 12C- and 13C-incubated
microcosms, quantitative PCR (qPCR) was conducted on DNA from gradient fractions with BDs

141
ranging from 1.68 to 1.75 g/mL. The qPCR targeted 16S rRNA gene fragments of the syntrophic
LCFA β-oxidizing bacterial genus of Syntrophomonas using primers and probes developed by
Ziels et al. (2015). More detailed descriptions of the reaction conditions, primers and probes, and
calibration standards are given in the Supplemental Information.
6.3.5 16S rRNA Amplicon Sequencing
DNA from ‘heavy’ gradient fractions with BDs ranging from 1.70 to 1.73 (4 fractions) were
pooled at equal volumes and subjected to 16S rRNA gene amplicon sequencing for each
microcosm. Briefly, 16S rRNA gene fragments were amplified with barcoded and indexed
universal prokaryotic V4-V5 primers 515F-Y (5′-GTGYCAGCMGCCGCGGTAA) and 926R
(5′-CCGYCAATTYMTTTRAGTTT) (Parada et al., 2016), and the products were pooled and
sequenced on a 2x300bp Illumina MiSeq run by the United States Department of Energy (DOE)
Joint Genome Institute (JGI). Raw sequence data is available through the JGI
Portal (http://jgi.doe.gov) under project ID number 1105527.
Amplicon reads were denoised into their exact sequences using the DADA2 pipeline (Callahan
et al., 2016). Raw reads were filtered by trimming the first 10 bp, truncating forward reads at 265
bp, truncating reverse reads at 180 bp, and filtering all reads based on a maximum expected error
of 2 using DADA2. The filtered and trimmed reads were then dereplicated and denoised into
exact sequences using estimated error parameters with DADA2. Forward and reverse sequences
were then merged with DADA2 using a minimum overlap of 20 bp and zero allowed
mismatches. Merged and denoised sequences were then truncated to 390 bp and clustered into
OTUs with a 99.5% similarity cutoff following chimera removal with UPARSE (Edgar, 2013).
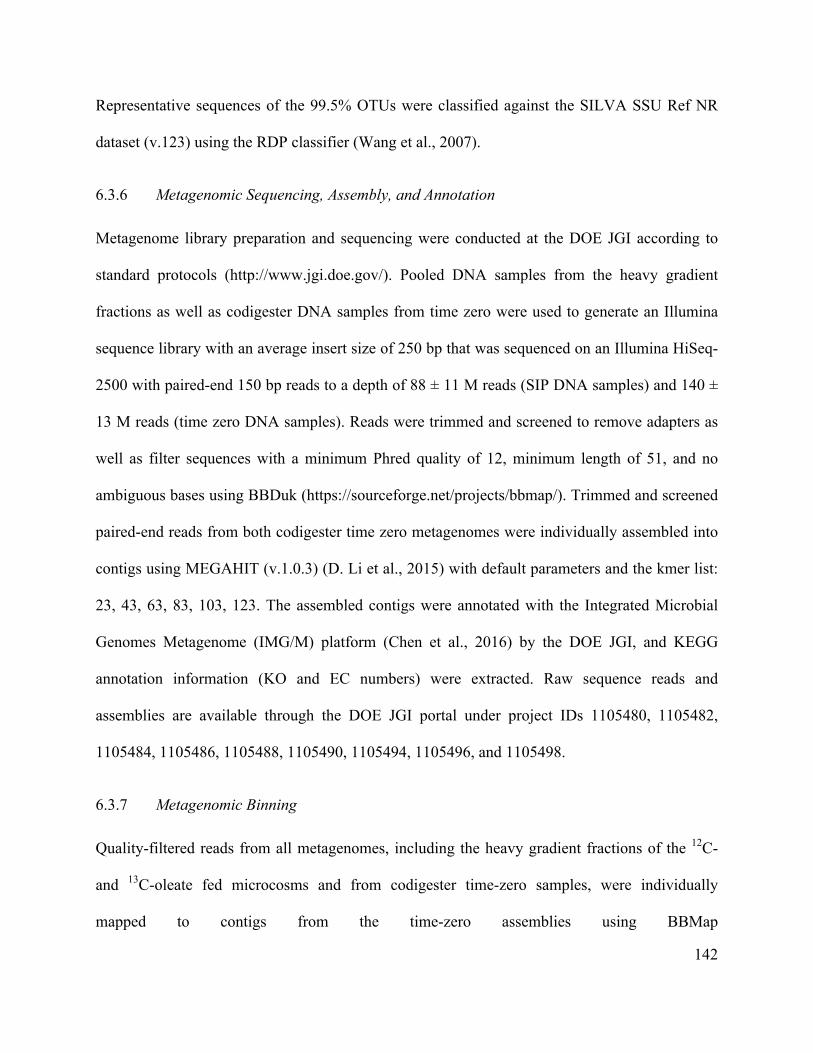
142
Representative sequences of the 99.5% OTUs were classified against the SILVA SSU Ref NR
dataset (v.123) using the RDP classifier (Wang et al., 2007).
6.3.6 Metagenomic Sequencing, Assembly, and Annotation
Metagenome library preparation and sequencing were conducted at the DOE JGI according to
standard protocols (http://www.jgi.doe.gov/). Pooled DNA samples from the heavy gradient
fractions as well as codigester DNA samples from time zero were used to generate an Illumina
sequence library with an average insert size of 250 bp that was sequenced on an Illumina HiSeq-
2500 with paired-end 150 bp reads to a depth of 88 ± 11 M reads (SIP DNA samples) and 140 ±
13 M reads (time zero DNA samples). Reads were trimmed and screened to remove adapters as
well as filter sequences with a minimum Phred quality of 12, minimum length of 51, and no
ambiguous bases using BBDuk (https://sourceforge.net/projects/bbmap/). Trimmed and screened
paired-end reads from both codigester time zero metagenomes were individually assembled into
contigs using MEGAHIT (v.1.0.3) (D. Li et al., 2015) with default parameters and the kmer list:
23, 43, 63, 83, 103, 123. The assembled contigs were annotated with the Integrated Microbial
Genomes Metagenome (IMG/M) platform (Chen et al., 2016) by the DOE JGI, and KEGG
annotation information (KO and EC numbers) were extracted. Raw sequence reads and
assemblies are available through the DOE JGI portal under project IDs 1105480, 1105482,
1105484, 1105486, 1105488, 1105490, 1105494, 1105496, and 1105498.
6.3.7 Metagenomic Binning
Quality-filtered reads from all metagenomes, including the heavy gradient fractions of the 12C-
and 13C-oleate fed microcosms and from codigester time-zero samples, were individually
mapped to contigs from the time-zero assemblies using BBMap

143
(https://sourceforge.net/projects/bbmap/) in paired-end mode with default
parameters. Metagenome reads were mapped to assemblies separately for both codigester sample
sets. SAMtools (Li et al., 2009) was used to sort and index the mapping files and extract contig
coverage information across samples. The mapping data and coverage information were used to
bin contigs into population genome bins (GBs) separately for each codigester sample set using
MetaBat (Kang et al., 2015) in ‘superspecific’ mode. CheckM was used to evaluate the level of
bin completeness and contamination based on domain-level single-copy marker genes (Parks et
al., 2015). Taxonomic classification of GBs was conducted by extracting a set of 107 conserved
marker genes within open reading frames using mmgenome (Karst et al., 2016), running
BLASTP on the extracted marker genes against the RefSeq v.52 protein database with a
maximum e-value cutoff of 1e-5, and finding the least common ancestor (LCA) of the top 5 blast
hits for each marker gene with MEGAN v.6.4 (Huson et al., 2007). The finest taxonomic ranking
was assigned for which at least 70% of the LCA results agreed. Phylogenetic trees were
generated for GBs that were over 40% complete using PhyloPhlAn based on 400 conserved
marker genes (Segata et al., 2013), as well as with UPGMA clustering of distance estimates from
in-silico DNA-DNA hybridization with the Genome-to-Genome Distance Calculator (Auch et
al., 2010).
6.3.8 Statistical Analysis
Statistically significant differences in raw sequence counts of OTUs (from 16S rRNA amplicon
libraries) and GBs (from shotgun metagenome libraries) within the 12C and 13C DNA-SIP
samples were detected with the negative binomial Wald test in DESeq2 separately for each
codigester dataset (Love et al., 2014). Raw sequence counts of GBs were obtained from parsing
the mapping files. An adjusted p value of 0.01 and a log2 fold change of 2.0 were used to identify

144
features (e.g. OTUs or GBs) that significantly increased between the 12C and 13C DNA-SIP
samples.
Normalized sequence counts for 16S RNA amplicon OTUs and GBs were obtained with DESeq2
to account for the different sequencing depths among samples. Coverage values for GBs were
calculated based on DESeq2 normalized sequence counts and the GB length. Regularized log-
transformed sequence counts of 16S RNA amplicon OTUs were determined with DESeq2 for
use in principal coordinate analysis, and permutational multivariate ANOVA (ADONIS) was
conducted on Euclidian distance values from transformed sequence counts using the vegan
package in R (Oksanen et al., 2007).
6.4 RESULTS
6.4.1 Conversion of Oleate into Methane and Enrichment of 13C DNA
13C-labeled oleate was fed to a series of microcosms inoculated with sludge from either the PF or
CF oleate anaerobic codigesters, respectively. 12C-oleate was added to a parallel set of
microcosms to serve as a control for DNA BD shifts. The 13C- and 12C- oleate was fed three
times at 8 mM with 48-hr batch incubations to ensure sufficient recovery of labeled biomass. The
initial oleate concentration of 8 mM in the microcosms was similar to in situ levels that occurred
within the experimental codigesters after feeding (Chapter 5). Metabolism of 12C- and 13C-
labeled oleate was confirmed with 97% and 95% COD recoveries as methane in the headspace
for the PF codigester and CF codigester microcosms, respectively (Figure 6-1). Biokinetic
modeling of methane production (described in Supplemental Information) showed that the

145
maximum methane production rate increased with each subsequent batch feeding of 12C- and
13C-labeled oleate (Supplemental Table D1). The maximum methane production rate in the PF
codigester microcosms was 26%, 21%, and 17% higher than the CF codigester microcosms for
the first, second, and third batch incubation rounds, respectively (Supplemental Table D1).
Figure 6-1 Cumulative methane production (minus blank controls) for the microcosms fed
with 12C-and 13C-labeled oleate over three repeated batch feeding periods. The number above each plot indicates the batch oleate feed round. The black dashed line shows the theoretical methane potential of the added oleate (25.5 mL CH4; based on 2.9 g COD/g oleate, 8 mM concentration, and 35 °C temperature). The black solid line represents the predicted methane production based on non-linear model fitting with a modified Gompertz equation (see Supplemental Table D1). Total DNA concentrations were measured in 24 density gradient fractions to detect BD shifts
after the consumption of 240 µmol 12C- or 13C-labeled oleate after 6 days. The heavy density
fractions with BDs from 1.70 to 1.725 g/mL contained 2.2-times and 2.0-times more DNA in the
Continuous−Fed
1
Continuous−Fed
2
Continuous−Fed
3
Pulse−Fed
1
Pulse−Fed
2
Pulse−Fed
3
0
10
20
30
0
10
20
30
0 10 20 30 40 50 0 10 20 30 40 50 0 10 20 30 40 50
0 10 20 30 40 50 0 10 20 30 40 50 0 10 20 30 40 50Time (hours)
Cum
ulat
ive M
etha
ne P
rodu
ctio
n (m
L C
H4
)
IsotopeC12C13
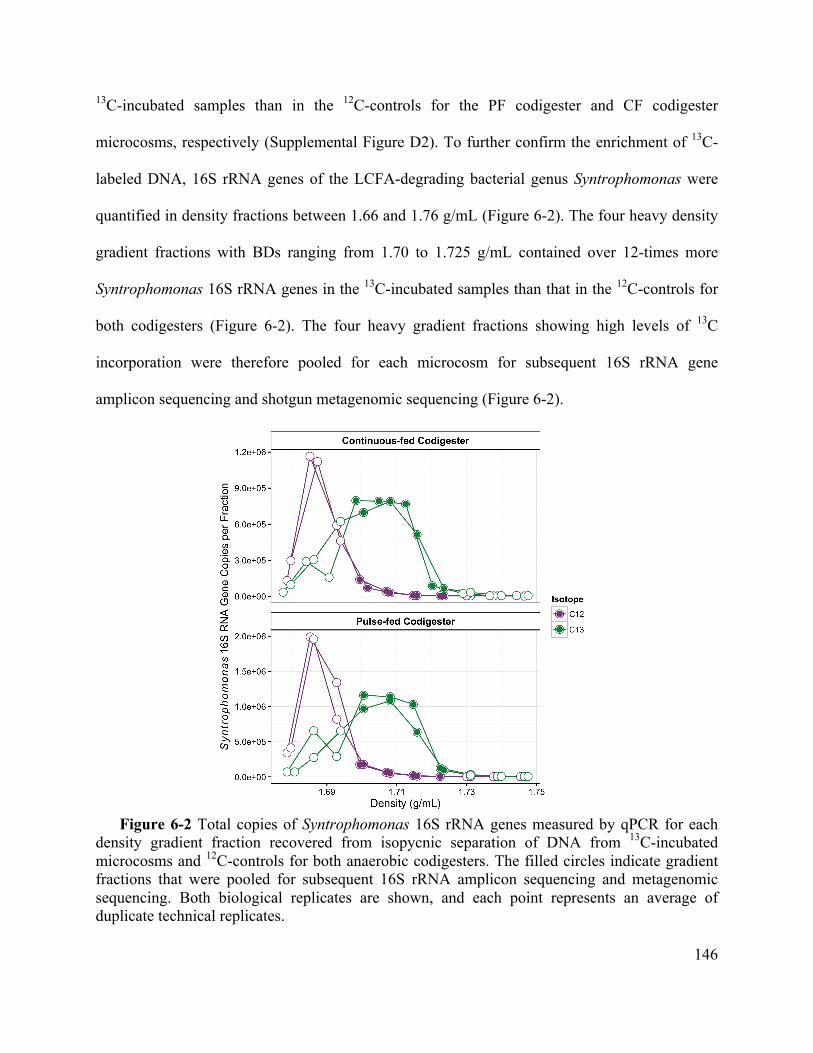
146
13C-incubated samples than in the 12C-controls for the PF codigester and CF codigester
microcosms, respectively (Supplemental Figure D2). To further confirm the enrichment of 13C-
labeled DNA, 16S rRNA genes of the LCFA-degrading bacterial genus Syntrophomonas were
quantified in density fractions between 1.66 and 1.76 g/mL (Figure 6-2). The four heavy density
gradient fractions with BDs ranging from 1.70 to 1.725 g/mL contained over 12-times more
Syntrophomonas 16S rRNA genes in the 13C-incubated samples than that in the 12C-controls for
both codigesters (Figure 6-2). The four heavy gradient fractions showing high levels of 13C
incorporation were therefore pooled for each microcosm for subsequent 16S rRNA gene
amplicon sequencing and shotgun metagenomic sequencing (Figure 6-2).
Figure 6-2 Total copies of Syntrophomonas 16S rRNA genes measured by qPCR for each
density gradient fraction recovered from isopycnic separation of DNA from 13C-incubated microcosms and 12C-controls for both anaerobic codigesters. The filled circles indicate gradient fractions that were pooled for subsequent 16S rRNA amplicon sequencing and metagenomic sequencing. Both biological replicates are shown, and each point represents an average of duplicate technical replicates.
147
6.4.2 16S rRNA Amplicon Sequencing of DNA-SIP Samples
The microbial community profiles of pooled heavy density gradient fractions (Figure 6-2) were
assessed through paired-end 16S rRNA gene amplicon sequencing. After qualify-filtering,
denoising, and merging paired-end amplicon reads, the number of sequences retained per sample
averaged 164,000 ± 39,000. Principle coordinate analysis (PCA) showed that community profiles
of the 12C- and 13C-incubated microcosms were distinctly clustered for both codigesters (Figure
6-3). The grouping of community profiles was significant within both codigester sample sets
according to the oleate isotope (ADONIS, p < 0.05). Additionally, samples within each isotope
group were significantly grouped according to the codigester sludge source (ADONIS, p < 0.05).
These results suggest that microbial community profiles within heavy density gradient fractions
were significantly altered by the incorporation of 13C-labeled oleate, and the community profiles
of the 13C-enriched DNA within both codigester microcosms were also distinct.
Figure 6-3 Principle coordinate analysis (PCA) plot of OTU read counts from 16S rRNA
amplicon sequencing after regularized log transformation with DESeq2 (Love et al., 2014). The different shapes indicate the codigestion reactor biomass source, and the colors represent the isotope of oleate (13C or 12C) fed to the microcosms. Biological duplicate samples are shown.
●
●
●
●
−20
−10
0
10
−10 0 10 20PC1: 32% variance
PC2:
25%
var
ianc
e
IsotopeC12C13
Reactor● Continuous−Fed
Pulse−Fed

148
Differential abundance analysis was conducted to detect 16S rRNA OTUs that significantly
increased in 13C-incubated heavy gradient fractions relative to 12C-controls. A total of 59
differentially abundant OTUs were identified in the PF codigester samples, 42 of which were
classified to the Syntrophomonas genus (Supplemental Figure D3). Within the CF codigester
samples, a total of 40 differentially abundant OTUs were identified, with 36 classified as
Syntrophomonas (Supplemental Figure D3). Of the total number of differentially abundant
Syntrophomonas OTUs identified, 19 were found in both codigesters while the remaining OTUs
were unique to either codigester (Supplemental Figure D4). Cumulative Syntrophomonas genus
read counts increased on average 5.0- and 5.5-times in the 13C-incubated samples relative to the
12C-controls for the PF codigester and CF codigester, respectively (Figure 6-4). Other bacterial
genera that contained differentially abundant OTUs included: Thermovirga, Aminivibrio,
Candidatus Cloacamonas, Anaerofustis, Syntrophothermus, and Ruminococcaceae
NK4A214 group, along with unclassified members of Planctomycetes, Spirochaetae,
Synergistes, Actinobacteria, and Bacteriodetes (Supplemental Figures D3 and D4). No
methanogenic archaeal OTUs were identified as differentially abundant in either codigester
sample set. Nonetheless, cumulative read counts of Methanosaeta increased by 68% and 170%
in the 13C-incubated samples relative to 12C-controls for the PF codigester and CF codigester,
respectively, and Methanobacterium read counts increased by 69% and 90%, respectively
(Figure 6-4). These results indicate that Bacteria incorporated 13C into DNA to a greater extent
than Archaea during the conversion of oleate over 6 days, but some methanogenic archaeal
groups showed slight increases in 13C heavy density gradient profiles (Figure 6-4).

149
Figure 6-4 Cumulative read counts of the 11 most abundant genera in the heavy gradient
fractions of 13C-incubated samples and 12C-controls for both codigester sample sets, based on 16S rRNA amplicon sequencing. Normalized read counts for all OTUs were calculated with DESeq2 (Love et al., 2014) to correct for differences in sequencing depths between samples, and were then aggregated at the genus level.
6.4.3 DNA-SIP Metagenomic Sequencing
Metagenomes from the PF and CF codigester sludges before SIP incubation (i.e. time zero) were
assembled to produce contigs for genome binning. The PF and CF codigester time-zero
metagenome assemblies amounted to 536,947,079 kb and 680,484,169 kb within contigs longer
than 1 kb, and had maximum contig lengths of 692,259 kb and 485,835 kb, respectively. Over
200 GBs were recovered through differential coverage binning for each codigester DNA-SIP
sample set. Differential abundance analysis of mapped GB read counts with DESeq2 showed that
16 and 18 GBs were significantly enriched in the 13C-incubated metagenomes of the PF and CF
codigesters, respectively (Supplemental Table D2). Due to the low completeness of some
enriched GBs (Supplemental Table D2), a threshold of 40% genome completeness was
Continuous−fed Codigester Pulse−fed Codigester
0
50000
100000
150000
200000N
orm
aliz
ed R
ead
Cou
nt
GenusAminivibrio
Candidatus_Cloacamonas
Christensenellaceae_R−7_group
Methanobacterium
Methanosaeta
Ruminococcaceae_NK4A214_group
Ruminofilibacter
Sphaerochaeta
Syntrophomonas
Thermovirga
Treponema_2
13CSamples
12CSamples
13CSamples
12CSamples

150
established for further phylogenetic analysis. Assigned taxonomies and genomic characteristics
of differentially abundant GBs with over 40% completeness are summarized in Table 6-1.
Table 6-1 Taxonomic classification and characteristics for genome bins that were
significantly enriched (p < 0.01, log2 increase > 2.0) in 13C metagenomes relative to 12C-controls for both codigester sample sets. Only genome bins that were above 40% completion are included.
Genome Bin I.D. Taxonomya Assigned Bin ‘Species’ Name Completenessb GC Size
(Mbp) Coding Densityb
Pulse-fed Codigester Genome Bins
bin.15 Syntrophomonas Syntrophomonas sp. PF15 47% 41.4% 1.21 86%
bin.75 Syntrophomonas Syntrophomonas sp. PF75 90% 41.2% 2.10 89%
bin.62 Syntrophomonas Syntrophomonas sp. PF62 97% 43.5% 2.66 87%
bin.103 Syntrophomonas Syntrophomonas sp. PF103 57% 44.6% 1.12 85%
bin.36 Firmicutes Firmicutes sp. PF103 85% 50.8% 1.60 90%
bin.111 Syntrophomonas Syntrophomonas sp. PF111 89% 45.7% 3.38 88%
bin.7 Syntrophomonas Syntrophomonas sp. PF07 74% 49.7% 1.27 89%
bin.128 Syntrophomonadaceae Syntrophomonadaceae sp. PF128 98% 46.4% 2.71 88%
Continuous-fed Codigester Genome Bins
bin.22 Syntrophomonas Syntrophomonas sp. CF22 74% 41.4% 2.00 86%
bin.196 Syntrophomonas Syntrophomonas sp. CF196 72% 42.9% 2.41 87%
bin.226 Syntrophomonas Syntrophomonas sp. CF226 98% 47.6% 3.18 88%
bin.14 Syntrophomonas Syntrophomonas sp. CF14 63% 49.7% 0.78 89%
bin.263 Firmicutes Firmicutes sp. CF263 83% 50.6% 4.81 92%
bin.250 Candidatus
Parcubacteria Candidatus Parcubacteria sp.
CF263 40% 30.8% 0.25 91%
bin.187 Syntrophomonas Syntrophomonas sp. CF187 86% 45.6% 2.12 89% a Based on LCA of BLAST output; b Based on CheckM output
Approximately 75% of the differentially abundant GBs (6 of 8) in the PF codigester samples
were taxonomically assigned to the Syntrophomonas, along with 71% (5 of 7) of the
differentially abundant GBs in the CF codigester (Table 6-1). Both codigesters contained one
differentially abundant GB that could only be assigned at the phylum-level to Firmicutes. In
addition, one differentially abundant GB in the PF codigester was classified to the family-level
of Syntrophomonadaceae, and one GB in the CF codigester was assigned to the phylum
Candidatus Parcubacteria (Table 6-1). Multi-gene alignments based on a set of 400 conserved

151
marker genes showed that some of the differentially abundant GBs in both codigesters were
closely clustered (Figure 6-5). GBs that formed sister groups based on both the conserved
marker-gene alignments and UPGMA clustering of in-silico DNA-DNA hybridization distance
values included Syntrophomonas sp. PF07 / Syntrophomonas sp. CF14, as well as
Syntrophomonas sp. PF15 / Syntrophomonas sp. CF22 (Figure 6-5; Supplemental Figure D6).
The GB of Syntrophomonas sp. PF103 was consistently clustered with the reference genomes of
Syntrophomonas wolfei subsp. wofei and Syntrophomonas wolfei subsp. methylbutyrica (Figure
6-5, Supplemental Figure D6). The Firmicutes sp. CF263 GB was placed on a branch outside of
Syntrophomonadaceae-affiliated genomes based on marker-gene alignments (Figure 6-5), yet it
clustered with the reference genome of Syntrophomonas zehnderi OL-4 based on in-silico DNA-
DNA hybridization (Supplemental Figure D6). Both GBs of Firmicutes sp. PF36 and Candidatus
Parcubacteria sp. CF263 were placed as outgroups in both phylogenetic clustering approaches
(Figure 6-5, Supplemental Figure D6).
The largest GB coverage fold-change in the 13C-incubated samples was observed for the sister
group of Syntrophomonas sp. PF15 / Syntrophomonas sp. CF22, which were not closely related
to previously-sequenced Syntrophomonas isolates (Figure 6-5; Supplemental Figure D2). Other
GBs that had high fold-changes in the 13C-incubated samples (log2 change > 3.0) included
Syntrophomonas sp. PF75, Syntrophomonas sp. PF62, Syntrophomonas sp. PF103, Firmicutes
sp. PF103, Syntrophomonas sp. PF111, and Syntrophomonas sp. CF196 (Figure 6-5;
Supplemental Figure D2). In comparison to the CF codigester, the PF codigester had a greater
number of GBs that were enriched above a log2 change of 3.0 in the 13C-incubated samples
(Figure 6-5).

152
Figure 6-5 Phylogenetic overview of differentially abundant genome bins identified in both
anaerobic codigester DNA-SIP metagenomes. The tree was constructed based on a concatenated alignment of conserved marker genes within the metagenomic contigs of each bin using PhyloPhlAn (Segata et al., 2013). The color of each genome bin node represents the codigester biomass source, and the height of the outer bars represent the genome bin coverage in the heavy gradient fractions of the 13C-incubated samples and 12C-controls. The tree was illustrated using GraPhLan (Asnicar et al., 2015). To assess the functional potential of differentially abundant GBs in 13C-incubated samples,
coverage values were extracted and summarized for KEGG ECs within the LCFA degradation
pathway (KEGG Pathway Map 00071). Long-chain fatty acid CoA ligase (EC:6.2.1.3), which is
responsible for activating free-fatty acids to acyl-CoA thioesters (Sousa et al., 2009), had the
highest EC coverage in differentially abundant GBs within 13C samples (Figure 6-6). The EC

153
categories with the next highest coverage were enoyl-CoA hydratase (EC:4.2.1.17) and acetyl-
CoA acyltransferase (EC:2.3.1.9). Genes encoding for the entire fatty acid β-oxidation cycle
were identified within the differentially abundant GBs for both codigesters (Figure 6-6), but the
coverage of acyl-CoA dehydrogenase (fadE, EC:1.3.99.-) differed between the differentially
abundant GBs in the two codigesters. Acyl-CoA dehydrogenase (EC:1.3.99) was observed in the
PF codigester GBs but not in the CF codigester GBs (Figure 6-6). The GBs in the PF codigester
also had substantially higher gene coverage for 3-hydroxyacyl-CoA dehydrogenases
(EC:1.1.1.35 and EC:1.1.1.36) in 13C-incubated samples than the CF codigester GBs (Figure
6-6).
Metabolism of unsaturated fatty acids, like oleate, requires auxiliary enzymes additional to those
used in β-oxidation, including: Δ3,Δ2-enoyl-CoA isomerase (EC:5.3.3.8), Δ3,5,Δ2,4-dienoyl-CoA
isomerase (EC 5.3.3.-), and Δ2,Δ4-dienoyl-CoA reductase (EC:1.3.1.34) (Ren et al., 2004).
Functional genes encoding for Δ3,Δ2-enoyl-CoA isomerase (EC:5.3.3.8) and Δ3,5,Δ2,4-dienoyl-
CoA isomerase (EC 5.3.3.-) were not detected in the differentially abundant GBs (Supplemental
Figure D3). However, genes encoding for Δ2,Δ4-dienoyl-CoA reductase (EC:1.3.1.34) were
detected in the differentially abundant GBs for both codigesters, and had a coverage that was an
order of magnitude higher in the PF codigester GBs (Supplemental Figure D3).
Syntrophic conversion of LCFA under methanogenic conditions involves interspecies electron
transfer between Bacteria and Archaea, which commonly involves hydrogen and/or formate as
electron shuttles (Stams and Plugge, 2009). Several formate dehydrogenases and hydrogenases
were detected in the enriched GBs of both codigesters (Supplemental Figure D7). Formate

154
dehydrogenases were more abundant than hydrogenases within the differentially abundant GBs
(Supplemental Figure D7).
Figure 6-6 Cumulative coverage values of KEGG ECs potentially involved in LCFA
degradation (KEGG map 00071), based on the coverage of all differentially abundant genome bins in the 13C-incubated DNA-SIP metagenomes. Values from duplicate biological replicates are shown for both codigesters, and the size of each marker is proportional to the log10 of the EC read coverage.
6.5 DISCUSSION
Recovering biomethane from FOG in anaerobic digestion has considerable potential to reduce
energy and carbon footprints associated with wastewater treatment (Davidsson et al., 2008;
Luostarinen et al., 2009; Wang et al., 2013). Improving our understanding of the microbial
communities involved in LCFA degradation within anaerobic digesters is key for identifying
operating strategies that can mitigate inhibitory LCFA accumulation at high FOG loading rates.
The combination of DNA-SIP with metagenomic sequencing in this study provided novel
genomic insights into the active LCFA-degrading populations in anaerobic codigesters, and
highlighted the potential for physiological diversity at the trophic level of syntrophy in anaerobic
digesters.
Coveragelog[(Reads/Mbp)]
4567
Codigester●
●
Continuous−FedPulse−Fed
1 long-chain-fatty-acid CoA ligase [EC:6.2.1.3]
2 acyl-CoA dehydrogenase[EC:1.3.8.7, EC:1.3.99.-, EC 1.3.8.1]
3 enoyl-CoA hydratase [EC: 4.2.1.17]
4 3-hydroxyacyl-CoA dehydrogenase[EC: 1.1.1.35, EC: 1.1.1.36]
5 acetyl-CoA acyltransferase[EC: 2.3.1.16, EC: 2.3.1.9]
6 acetate kinase [EC: 2.7.2.1]
7 phosphoacylase [EC: 2.3.1.8]
acetate
oleate
ADP ATPP CoA
β-oxidation
(1)
(2)
(2)
(2)
(3)
(4)
(5)
(6)
(7)
Step
(4)
●●
●●
●●
●●● ●
● ●
●●
●●●●
●●
●●● ●
●●
●●
●●●●
●●
●●
●●●●
●●EC:2.7.2.8
EC:2.7.2.1
EC:2.3.1.9
EC:2.3.1.16
EC:1.1.1.36
EC:1.1.1.35
EC:4.2.1.17
EC:1.3.8.1
EC:1.3.8.7
EC:1.3.99.−
EC:6.2.1.3
(5)

155
In prior research, it was observed that different LCFA-converting syntrophic populations were
biologically selected by the frequency of LCFA feeding during codigestion (Chapter 5).
Different syntrophic populations between the PF codigester and CF codigester coincided with
different LCFA conversion rates, with the PF codigester having significantly higher biokinetics
(Chapter 5). In this study, biokinetic modeling of methane production in the DNA-SIP
microcosms fed with either 13C- or 12C- oleate showed that the PF codigester sludge had higher
maximum oleate conversion rates than CF codigester sludge during all three DNA-SIP batch
degradation periods. This result further corroborates that biological selection from the LCFA
feeding frequency altered LCFA-bioconversion kinetics in the anaerobic codigesters (Chapter 5).
Biological selection of different syntrophic populations has also been postulated for anaerobic
reactors fed with propionate in a fill-and-draw mode (H. D. Ariesyady et al., 2007). It is
plausible that a broad range of fatty-acid concentrations from pulse-feeding could select for
multiple syntrophic fatty-acid oxidizers and/or methanogenic archaea that have different
substrate affinities and/or maximum substrate utilization rates (H. D. Ariesyady et al., 2007;
Conklin et al., 2006).
Near-complete stoichiometric conversion of 13C-labeled oleate into methane was observed based
on high methane COD recoveries in the headspace. Yet, the remaining fraction of 13C
incorporated into microbial biomass was sufficient to identify 13C-enriched DNA in heavy
density gradient fractions based on total DNA and qPCR measurements. Considering that
maximum specific growth rates of co-cultures of syntrophic fatty-acid oxidizing bacteria with
methanogenic archaea can range from 0.10 to 0.19 d-1 (Stams et al., 2012), the 6-day incubation

156
time for DNA-SIP may have permitted only a few cell generations. However, longer incubation
times in DNA-SIP can be problematic because they can lead to cross-labeling of peripheral
populations due to endogenous cell decay (Neufeld et al., 2006). In contrast to our study,
previous studies employing DNA-SIP for syntrophic propionate and butyrate degrading
communities in soil utilized incubation times ranging from 17 to 69 days (Chauhan and Ogram,
2006; Gan et al., 2012; H. Li et al., 2015; Liu et al., 2011; Lueders et al., 2004). These longer
incubation times may have been necessitated due to the low active biomass fractions in soil,
which would result in low substrate conversion rates. Thus, the higher active syntrophic biomass
fraction in the anaerobic codigester sludges promoted more rapid oleate bioconversion in the
DNA-SIP microcosms, which permitted efficient DNA labeling within a 6-day incubation
period.
Syntrophic fatty acid conversion requires that free energy from catabolism is shared between
syntrophic bacteria and methanogenic archaeal partners (Schink, 1997; Stams and Plugge, 2009).
In this study, all of the 16S rRNA OTUs that were differentially abundant in 13C-incubated
DNA-SIP samples for both codigesters belonged to the domain Bacteria, while no Archaea
OTUs were differentially abundant in 13C-incubated samples. Likewise, all of the differentially
abundant GBs recovered from DNA-SIP shotgun metagenomes were assigned to bacterial taxa.
However, the higher cumulative 16S rRNA read counts of Methanosaeta and Methanobacterium
in 13C-incubated samples relative to 12C-controls indicates that they were likely methanogenic
partners involved in syntrophic oleate degradation in both codigesters, but their OTU abundance
increases were not statistically significant. The slower incorporation of 13C into archaeal biomass
during syntrophic growth on oleate would suggest that the biomass yield of syntrophic bacteria

157
was potentially greater than for methanogenic archaea. Yet, the relative fraction of Bacteria
versus Archaea labeling has differed among previous SIP experiments focusing on syntrophic
metabolism (Gan et al., 2012; Lueders et al., 2004). Using 13C-labeled propionate to study
syntrophic communities in methanogenic paddy soil, Lueders et al. (2004) reported that a 7-
week DNA-SIP incubation resulted in no labeled syntrophic bacteria but rather labeled
methanogenic archaea. Since microbial growth yields can depend on thermodynamics (Heijnen
and Van Dijken, 1992; Kleerebezem and Van Loosdrecht, 2010), it is possible that the relative
fraction Bacteria versus Archaea labeling during SIP with syntrophic communities depended on
the free-energy available to each syntrophic partner, which could differ among environmental
systems and/or with different microbial substrate affinities.
A large fraction (>70%) of 16S rRNA OTUs significantly enriched in 13C-samples were assigned
to the genus Syntrophomonas, which agrees with previous research that identified higher
Syntrophomonas fractions within anaerobic communities degrading LCFA (Hatamoto et al.,
2007b; Shigematsu et al., 2006; Sousa et al., 2009, 2007a; Ziels et al., 2015). However, this is the
first study to determine the relative contribution of Syntrophomonas toward LCFA degradation
using DNA-SIP. The high-resolution amplicon sequence analysis with DADA2 (Callahan et al.,
2016) revealed that about half of the significantly enriched Syntrophomonas OTUs were shared
between the two codigesters, whereas each codigester had a set of unique Syntrophomonas OTUs
that contributed to oleate conversion. This finding indicates that the codigester LCFA feeding
frequency biologically selected for unique active LCFA-degrading syntrophic populations. Other
taxonomic groups that contained differentially abundant 16S rRNA OTUs included
Thermovirga, Aminivibrio, Candidatus Cloacamonas, Anaerofustis, Ruminococcaceae

158
NK4A214 group, Planctomycetes, Spirochaetae, Synergistes, Actinobacteria, and Bacteriodetes,
which do not have characterized species capable of anaerobically degrading LCFA. Thermovirga
lienii was isolated from a deep-sea oil reservoir, and was characterized to ferment amino acids
(Dahle and Birkeland, 2006). Similarly, Aminivibrio pyruvatiphilus was isolated from an
anaerobic propionate-oxidizing enrichment culture as an amino acid fermenter (Honda et al.,
2013). Ruminococcaceae have also been implicated with butyrate production from amino acids
in the human gut (Vital et al., 2014). It is possible that some of these populations were labeled
with 13C due to interspecies transfer of metabolites, such as amino acids, with syntrophic β-
oxidizing bacteria or methanogenic archaea, despite the relatively short DNA-SIP incubation in
this study.
To the best of our knowledge, this is the first study to couple DNA-SIP with differential
coverage binning to recover population GBs from environmental metagenomes. Differential
abundance analysis of GB read counts within the heavy gradient fractions of 13C-incubated
samples versus 12C-controls was shown to be an effective technique coupled to DNA-SIP
metagenomics to identify 13C-enriched GBs. The taxonomic assignment of differentially
abundant GBs agreed with the results of 16S rRNA amplicon sequencing, as over 70% of GBs
belonged to the genus Syntrophomonas. The finding that some phylogenetically distinct
Syntrophomonas GBs were unique to each codigester further suggests that microbial
communities involved in LCFA conversion can be physiologically diverse. Syntrophic bacteria
are considered metabolic-specialists (McInerney et al., 2009; Sieber et al., 2012), which has led
to the general conclusion that they have low functional redundancy in anaerobic digesters
(Carballa et al., 2015; Werner et al., 2011). A previous genome-centric analysis of anaerobic

159
digester metagenomes found low diversity within the trophic level of syntrophic acetogenesis
(Vanwonterghem et al., 2016). DNA-SIP based metagenomic binning may thus improve our
resolution of anaerobic digester trophic groups by enriching metagenome libraries with actively
growing population genomes (Coyotzi et al., 2016). The recovery of 236 microbial GBs from
anaerobic digester metagenomes led to conclusion that Syntrophomonas GBs were among a core
essential microbial group that is present independent of digester operational conditions (Treu et
al., 2016b). Our finding that the anaerobic digester feeding frequency can impact the genomic
composition of Syntrophomonas and their biokinetic activities (LCFA bioconversion rates) has
implications for developing operating strategies that steer the core digester community to obtain
better biokinetics and process stability.
The different oleate bioconversion kinetics between the two codigesters could have been
attributed to differences in functional genes of their active LCFA-degrading GBs. The
differentially abundant GBs in the PF codigester had more redundant KEGG ECs (e.g. multiple
ECs for a single reaction step) in the LCFA-degradation pathway compared to the CF codigester
GBs, which could indicate that the PF GBs potentially had a higher level of metabolic flexibility.
Using transcriptomic read mapping, Treu et al. (2016a) showed that only two Syntrophomonas
GBs were active after pulsing oleate to an anaerobic digester. In this study, 12 active
Syntrophomonas GBs were identified with targeted DNA-SIP metagenomic analysis, yet
transcriptional expression profiles could be further utilized to identify key biomarker genes for
LCFA-degradation. Such genetic biomarkers could then be used to assess the functional potential
of anaerobic digesters to convert high loadings of FOG into biomethane.

160
6.6 SUPPLEMENTAL INFORMATION AVAILABLE
The Supplemental Information for Chapter 6 is included in this document as Appendix D.

161
Chapter 7. CONCLUSIONS AND FUTURE OUTLOOK
Achieving energy-neutral wastewater treatment is of major importance due to the large carbon
and greenhouse gas footprints associated with fossil fuel-derived energy supplies (Singh et al.,
2016). This research sought to improve biomethane recovery from anaerobic digestion treatment
processes by elucidating relationships between microbial community structure and LCFA
bioconversion kinetics during the degradation of fats, oils, and greases (FOG). The objectives of
this research therefore align with a broader goal of enhancing wastewater treatment
sustainability. To improve our ability to monitor LCFA-degrading populations, quantitative PCR
(qPCR) assays were developed and validated in Chapter 3 targeting the syntrophic LCFA-
degrading bacterial genera Syntrophomonas and Syntrophus. In Chapter 4, the qPCR assays were
used to monitor changes in LCFA-degrading bacteria during FOG codigestion with municipal
wastewater sludge. Chapters 5-6 focus on the impacts of anaerobic codigester feeding on
syntrophic LCFA-degrading communities and their associated biokinetics. Overall, this research
combined methods from molecular microbiology and process engineering to elucidate the role
and effect of microbial community structure in anaerobic FOG conversion. Collectively, the
results indicated that higher concentrations of syntrophic LCFA-degrading bacteria were
indicators of higher LCFA bioconversion kinetics, which were necessary to maintain stable
digester operation at high FOG loading rates without inhibitory LCFA accumulation. The
codigester feeding strategy also impacted the syntrophic LCFA-degrading community structure
and biokinetics, thus opening a door for the application of digester operating strategies that
maximize biomethane recovery from FOG. The key findings of this study along with their
engineering significance are presented in more detail below.

162
7.1 MAJOR FINDINGS AND ENGINEERING SIGNIFICANCE
Biokinetic models, such as the IWA Anaerobic Digester Model 1 (ADM1), are commonly used
in wastewater treatment process design and analysis to predict performance and capacity under
dynamic loading scenarios (Batstone et al., 2015). For accurate predictions of anaerobic digester
performance and capacity, such biokinetic models would ideally be calibrated using actual
biomass concentrations for the different metabolic guilds (e.g. fermenters, syntrophs, and
methanogens) in the mass-balance equations. When this research project began, there was a lack
of molecular tools available to accurately monitor the abundance of LCFA-degrading bacteria in
anaerobic digesters, because they are generally present in digester sludge at low background
concentrations (Stams et al., 2012). Thus, the quantitative molecular tools developed in this
research (Chapter 3) are significant advancements for accurately measuring LCFA-degrading
biomass in anaerobic digesters. The developed qPCR assays were used to infer three separate
relationships between LCFA-degrading bacterial biomass and LCFA conversion rates throughout
this research. In Chapter 3, the relative fraction (e.g. percentage) of Syntrophomonas within the
Bacteria community was positively correlated to the methane production rate from oleate in
batch enrichment bottles. In Chapter 4, effluent LCFA concentrations were positively correlated
to the FOG loading rate normalized to the concentration of Syntrophomonas within a codigester.
And, in Chapter 5, maximum specific oleate conversion rates (qmax,oleate) were positively
correlated to the concentration of Syntrophomonas genes per g VS within codigesters fed with
oleate and manure. Therefore, this research identified that the concentration of Syntrophomonas
16S rRNA genes could be used as a surrogate biomarker for LCFA conversion rates in anaerobic
digesters. The relationship between qmax,oleate and Syntrophomonas genes (Chapter 5) could thus

163
be applied to predict appropriate FOG loading rates that do not cause inhibitory LCFA
accumulation in anaerobic digesters.
A key engineering importance of this research is that biomethane recovery was increased by
170% to 440% during FOG codigestion with minimal impacts on the digester SRT. However,
microbial adaptation was identified to limit the allowable FOG loading rate. A practical
engineering development from these research findings is that the FOG loading rate must be
lower than the qmax,LCFA to avoid LCFA accumulation during codigestion.
Digester qmax,LCFA values increased as the LCFA-degrading population increased with operating
time at each stepwise FOG loading increase. Feeding FOG on a daily or bi-daily basis may
promote higher qmax,LCFA values, and thus higher FOG loading rates, compared to continually
adding FOG. Full-scale digester operating staff could measure qmax,LCFA in batch kinetic tests
using the method outlined in Chapter 5 to determine appropriate FOG loading rates. If
measurements of the microbial community are also collected associated with the batch kinetic
tests, then modeling approaches could also be developed and implemented that predict qmax,LCFA
based on microbial indicators, as is presented in Chapter 5 using Syntrophomonas genes. As the
price of sequencing continues to decline (Goodwin et al., 2016), the use of molecular markers to
predict qmax,LCFA may become less time-consuming and expensive than conducting batch kinetic
tests.
This research also found that different syntrophic populations were biologically selected based
on the LCFA-feeding frequency during codigestion (Chapter 5). A novel DNA-SIP based
metagenomic approach was implemented to compare active LCFA-degraders within pulse- and

164
continuous fed LCFA codigesters (Chapter 6), and found distinct Syntrophomonas genomes
within both codigesters. These findings revise previous notions that syntrophic bacteria are not
functionally redundant in anaerobic digesters (Werner et al., 2011). The results also showed that
pulse-feeding LCFA selected for higher methane production kinetics (Chapter 5). The diversity
of Syntrophomonas taxa was incorporated into a biokinetic model using multiple-linear
regression and stepwise feature selection, which more accurately predicted qmax,oleate values than
did total Syntrophomonas genes alone (Chapter 5). Therefore, this research employed novel
molecular techniques to examine physiological diversity within a metabolic guild of a
wastewater treatment process, and demonstrated how to incorporate such microbial biodiversity
into biokinetic models. Overall, this research identified digester operating strategies that
improved process stability and biokinetics during FOG codigestion, which contributes to the goal
of maximizing energy recovery during wastewater treatment.
7.2 FUTURE OUTLOOKS
This research showed that syntrophic bacterial biomass could be used as a surrogate for LCFA
conversion kinetics in anaerobic digesters. However, as syntrophic metabolism occurs near
thermodynamic equilibrium (Schink, 1997), it is likely that the thermodynamic state in an
anaerobic digester also affects LCFA conversion kinetics. The thermodynamic state could be
altered by hydrogen, formate, and acetate concentrations, which can be governed by the activities
and affinities of methanogenic archaea (Schink, 1997). The thermodynamic state has been shown
to impact growth yields (Kleerebezem and Van Loosdrecht, 2010) and microbial biokinetics
(LaRowe et al., 2012) for low energy-yielding processes like syntrophy. Since methanogenic

165
archaea grow on acetate and hydrogen produced via the degradation of various substrates in
anaerobic digesters, methanogenic biomass levels may be in excess relative to syntrophic LCFA-
degrading bacterial biomass in FOG codigesters. Yet, to accurately model LCFA conversion
kinetics, more detailed biokinetic models must be developed that incorporate the thermodynamic
state (H. Junicke et al., 2016). Currently, existing biokinetic models for LCFA degradation
include empirical inhibition constants, such as in Chapter 6 and in the work of Zonta et al.
(2013). These models could be revised by relating the Gibbs free energy available from LCFA β-
oxidation to growth yields or substrate utilization kinetics (Kleerebezem and Van Loosdrecht,
2010; LaRowe et al., 2012). The tools for quantifying LCFA-degrading bacteria that were
developed in this research (Chapter 3) could be utilized to calibrate such thermodynamic-based
kinetic growth models, which could then be implemented in widely used design platforms such
as the ADM1 model. Thermodynamic-based kinetic models for microbial metabolism could also
be used to elucidate shifts in key functional pathways during anaerobic digestion, such shifts
from aceticlastic methanogenesis to syntrophic acetate oxidation at high ammonia levels (Werner
et al., 2014). Better predictions of microbial metabolism in anaerobic digestion modeling could
enable more robust process performance with high-rate methane recovery from organic waste.
While this study revealed that syntrophic populations can be physiologically diverse based on
metagenomic sequencing, microbial activity in anaerobic digesters can be better represented by
RNA expression in comparison to gene abundance (De Vrieze et al., 2016). Thus, evaluating
physiological diversity of a metabolic guild requires information about gene abundance
(metagenomics) as well as expression (transcriptomics/proteomics). Future research is therefore
needed to evaluate how the anaerobic digester LCFA feeding strategy impacted the diversity of
functional genes expressed during LCFA degradation. Information on gene expression could be

166
obtained by mapping mRNA reads onto metagenome populations bins obtained through the
DNA-SIP experiment. Such genetic biomarkers could then be used to assess the functional
potential of anaerobic digesters to convert high loadings of FOG into biomethane.
The multiple regression model developed in Chapter 5 for predicting oleate conversion kinetics
based on 6 Syntrophomonas taxa has implications for improved process monitoring of anaerobic
digesters based on real-time measurements of key microbial biomarkers. Such biomarkers used
for regression analysis could be based on the taxonomic composition within a functional group
(as in Chapter 5), or based on the proportion of functional groups within an entire community
(Louca et al., 2016). As the price of molecular sequencing platforms continues to decrease
(Goodwin et al., 2016), predictive relationships for wastewater treatment process kinetics and
performance based on multi-omic data may be more easily implemented. For instance, the
recently-developed MinION sequencer is a small (3 cm x 10cm) mobile USB-based device that
is capable of generating ~150 Mbp of DNA sequence data in 24 hrs, although it is currently
subject to high error rates (Goodwin et al., 2016). Real-time molecular sequencing data along
with treatment process state data (e.g. influent composition, effluent composition, pH,
temperature, etc.) could be incorporated into machine-learning based algorithms (Werner et al.,
2011) or genome-based process models (Louca and Doebeli, 2015) to accurately predict
biological wastewater treatment performance in real-time. The output of such real-time models
could identify operational strategies to improve treatment efficiency, and could even be
incorporated into ‘smart’ logic controllers (Regmi et al., 2015) for dynamic operational control
of biological wastewater treatment processes. Therefore, future research is warranted on novel
strategies to incorporate molecular sequence data into real-time biological wastewater treatment
167
monitoring and control, which could lead to more energy-efficient wastewater treatment and
reduce the ecological impacts associated wastewater discharge.

168
BIBLIOGRAPHY
Aiba, S., Shoda, M., Nagatani, M., 1968. Kinetics of product inhibition in alcohol fermentation. Biotechnol. Bioeng. 10, 845–864. doi:10.1002/bit.260100610
Albertsen, M., Hugenholtz, P., Skarshewski, A., Nielsen, K.L., Tyson, G.W., Nielsen, P.H., 2013. Genome sequences of rare, uncultured bacteria obtained by differential coverage binning of multiple metagenomes. Nat. Biotechnol. 31, 533–538. doi:10.1038/nbt.2579
Allison, S.D., Martiny, J.B.H., 2008. Resistance, resilience, and redundancy in microbial communities. Proc. Natl. Acad. Sci. 105, 11512–11519. doi:10.1073/pnas.0801925105
Alves, M.M., Mota Vieira, J.A., Álvares Pereira, R.M., Pereira, M.A., Mota, M., 2001. Effects of lipids and oleic acid on biomass development in anaerobic fixed-bed reactors. Part II: Oleic acid toxicity and biodegradability. Water Res. 35, 264–270. doi:10.1016/S0043-1354(00)00242-6
Alves, M.M., Pereira, M.A., Sousa, D.Z., Cavaleiro, A.J., Picavet, M., Smidt, H., Stams, A.J.M., 2009. Waste lipids to energy: how to optimize methane production from long-chain fatty acids (LCFA). Microb. Biotechnol. 2, 538–550. doi:10.1111/j.1751-7915.2009.00100.x
Angelidaki, I., Ahring, B.K., 1992. Effects of free long-chain fatty acids on thermophilic anaerobic digestion. Appl. Microbiol. Biotechnol. 37, 808–812. doi:10.1007/BF00174850
Arahal, D.R., Ventosa, A., 2006. The Family Halomonadaceae, in: Dr, M.D.P., Falkow, S., Rosenberg, E., Schleifer, K.-H., Stackebrandt, E. (Eds.), The Prokaryotes. Springer New York, pp. 811–835.
Ariesyady, H.D., Ito, T., Yoshiguchi, K., Okabe, S., 2007. Phylogenetic and functional diversity of propionate-oxidizing bacteria in an anaerobic digester sludge. Appl. Microbiol. Biotechnol. 75, 673–683. doi:10.1007/s00253-007-0842-y
Ariesyady, H., Ito, T., Okabe, S., 2007. Functional bacterial and archaeal community structures of major trophic groups in a full-scale anaerobic sludge digester. Water Res. 41, 1554–1568. doi:10.1016/j.watres.2006.12.036
Aronesty, E., 2013. Comparison of sequencing utility programs. Open Bioinform J 7, 1–8. Asnicar, F., Weingart, G., Tickle, T.L., Huttenhower, C., Segata, N., 2015. Compact graphical
representation of phylogenetic data and metadata with GraPhlAn. PeerJ 3, e1029. doi:10.7717/peerj.1029
Auch, A.F., von Jan, M., Klenk, H.-P., Göker, M., 2010. Digital DNA-DNA hybridization for microbial species delineation by means of genome-to-genome sequence comparison. Stand. Genomic Sci. 2, 117–134. doi:10.4056/sigs.531120
Baserba, M.G., Angelidaki, I., Karakashev, D., 2012. Effect of continuous oleate addition on microbial communities involved in anaerobic digestion process. Bioresour. Technol. 106, 74–81. doi:10.1016/j.biortech.2011.12.020
Batstone, D.J., Puyol, D., Flores-Alsina, X., Rodríguez, J., 2015. Mathematical modelling of anaerobic digestion processes: applications and future needs. Rev. Environ. Sci. Biotechnol. 14, 595–613. doi:10.1007/s11157-015-9376-4
Beaty, P.S., McInerney, M.J., 1987. Growth of Syntrophomonas wolfei in pure culture on crotonate. Arch. Microbiol. 147, 389–393. doi:10.1007/BF00406138
169
Bishop, C.P., Shumway, C.R., 2009. The Economics of Dairy Anaerobic Digestion with Coproduct Marketing. Appl. Econ. Perspect. Policy 31, 394–410. doi:10.1111/j.1467-9353.2009.01445.x
Bocher, B.T.W., Cherukuri, K., Maki, J.S., Johnson, M., Zitomer, D.H., 2015. Relating methanogen community structure and anaerobic digester function. Water Res. 70, 425–435. doi:10.1016/j.watres.2014.12.018
Briones, A., Raskin, L., 2003. Diversity and dynamics of microbial communities in engineered environments and their implications for process stability. Curr. Opin. Biotechnol. 14, 270–276. doi:10.1016/S0958-1669(03)00065-X
Bustin, S.A., Benes, V., Garson, J.A., Hellemans, J., Huggett, J., Kubista, M., Mueller, R., Nolan, T., Pfaffl, M.W., Shipley, G.L., Vandesompele, J., Wittwer, C.T., 2009. The MIQE Guidelines: Minimum Information for Publication of Quantitative Real-Time PCR Experiments. Clin. Chem. 55, 611–622. doi:10.1373/clinchem.2008.112797
Callahan, B.J., McMurdie, P.J., Rosen, M.J., Han, A.W., Johnson, A.J.A., Holmes, S.P., 2016. DADA2: High-resolution sample inference from Illumina amplicon data. Nat. Methods 13, 581–583. doi:10.1038/nmeth.3869
Campanaro, S., Treu, L., Kougias, P.G., De Francisci, D., Valle, G., Angelidaki, I., 2016. Metagenomic analysis and functional characterization of the biogas microbiome using high throughput shotgun sequencing and a novel binning strategy. Biotechnol. Biofuels 9. doi:10.1186/s13068-016-0441-1
Campbell, J.W., Morgan-Kiss, R.M., E. Cronan, J., 2003. A new Escherichia coli metabolic competency: growth on fatty acids by a novel anaerobic β-oxidation pathway. Mol. Microbiol. 47, 793–805. doi:10.1046/j.1365-2958.2003.03341.x
Caporaso, J.G., Bittinger, K., Bushman, F.D., DeSantis, T.Z., Andersen, G.L., Knight, R., 2010a. PyNAST: a flexible tool for aligning sequences to a template alignment. Bioinformatics 26, 266–267. doi:10.1093/bioinformatics/btp636
Caporaso, J.G., Kuczynski, J., Stombaugh, J., Bittinger, K., Bushman, F.D., Costello, E.K., Fierer, N., Peña, A.G., Goodrich, J.K., Gordon, J.I., Huttley, G.A., Kelley, S.T., Knights, D., Koenig, J.E., Ley, R.E., Lozupone, C.A., McDonald, D., Muegge, B.D., Pirrung, M., Reeder, J., Sevinsky, J.R., Turnbaugh, P.J., Walters, W.A., Widmann, J., Yatsunenko, T., Zaneveld, J., Knight, R., 2010b. QIIME allows analysis of high-throughput community sequencing data. Nat. Methods 7, 335–336. doi:10.1038/nmeth.f.303
Carballa, M., Regueiro, L., Lema, J.M., 2015. Microbial management of anaerobic digestion: exploiting the microbiome-functionality nexus. Curr. Opin. Biotechnol., Environmental biotechnology • Energy biotechnology 33, 103–111. doi:10.1016/j.copbio.2015.01.008
Cavaleiro, A.J., Pereira, M.A., Alves, M., 2008. Enhancement of methane production from long chain fatty acid based effluents. Bioresour. Technol. 99, 4086–4095. doi:10.1016/j.biortech.2007.09.005
Cavaleiro, A.J., Pereira, M.A., Guedes, A.P., Stams, A.J.M., Alves, M.M., Sousa, D.Z., 2016. Conversion of Cn-Unsaturated into Cn-2-Saturated LCFA Can Occur Uncoupled from Methanogenesis in Anaerobic Bioreactors. Environ. Sci. Technol. 50, 3082–3090. doi:10.1021/acs.est.5b03204
Cavaleiro, A.J., Salvador, A.F., Alves, J.I., Alves, M., 2009. Continuous High Rate Anaerobic Treatment of Oleic Acid Based Wastewater is Possible after a Step Feeding Start-Up. Environ. Sci. Technol. 43, 2931–2936. doi:10.1021/es8031264

170
Chauhan, A., Ogram, A., 2006. Fatty Acid-Oxidizing Consortia along a Nutrient Gradient in the Florida Everglades. Appl. Environ. Microbiol. 72, 2400–2406. doi:10.1128/AEM.72.4.2400-2406.2006
Chemerys, A., Pelletier, E., Cruaud, C., Martin, F., Violet, F., Jouanneau, Y., 2014. Characterization of Novel Polycyclic Aromatic Hydrocarbon Dioxygenases from the Bacterial Metagenomic DNA of a Contaminated Soil. Appl. Environ. Microbiol. 80, 6591–6600. doi:10.1128/AEM.01883-14
Chen, I.-M.A., Markowitz, V.M., Chu, K., Palaniappan, K., Szeto, E., Pillay, M., Ratner, A., Huang, J., Andersen, E., Huntemann, M., Varghese, N., Hadjithomas, M., Tennessen, K., Nielsen, T., Ivanova, N.N., Kyrpides, N.C., 2016. IMG/M: integrated genome and metagenome comparative data analysis system. Nucleic Acids Res. gkw929. doi:10.1093/nar/gkw929
Chen, Y., Murrell, J.C., 2010. When metagenomics meets stable-isotope probing: progress and perspectives. Trends Microbiol. 18, 157–163. doi:10.1016/j.tim.2010.02.002
Chong, S.C., Liu, Y., Cummins, M., Valentine, D.L., Boone, D.R., 2002. Methanogenium marinum sp. nov., a H2-using methanogen from Skan Bay, Alaska, and kinetics of H2 utilization. Antonie Van Leeuwenhoek 81, 263–270. doi:10.1023/A:1020535222281
Christodoulou, A.P., Rosano, H.L., 1968. Effect of pH and nature of monovalent cations on surface isotherms of saturated C16 to C22 soap monolayers. Adv Chem Ser 84, 210–234.
Cirne, D.G., Paloumet, X., Björnsson, L., Alves, M.M., Mattiasson, B., 2007. Anaerobic digestion of lipid-rich waste—Effects of lipid concentration. Renew. Energy 32, 965–975. doi:10.1016/j.renene.2006.04.003
Cole, J.R., Wang, Q., Cardenas, E., Fish, J., Chai, B., Farris, R.J., Kulam-Syed-Mohideen, A.S., McGarrell, D.M., Marsh, T., Garrity, G.M., Tiedje, J.M., 2009. The Ribosomal Database Project: improved alignments and new tools for rRNA analysis. Nucleic Acids Res. 37, D141–D145. doi:10.1093/nar/gkn879
Conklin, A., Stensel, H.D., Ferguson, J., 2006. Growth Kinetics and Competition Between Methanosarcina and Methanosaeta in Mesophilic Anaerobic Digestion. Water Environ. Res. 78, 486–496. doi:10.2175/106143006X95393
Coyotzi, S., Pratscher, J., Murrell, J.C., Neufeld, J.D., 2016. Targeted metagenomics of active microbial populations with stable-isotope probing. Curr. Opin. Biotechnol., Analytical biotechnology 41, 1–8. doi:10.1016/j.copbio.2016.02.017
Dahle, H., Birkeland, N.-K., 2006. Thermovirga lienii gen. nov., sp. nov., a novel moderately thermophilic, anaerobic, amino-acid-degrading bacterium isolated from a North Sea oil well. Int. J. Syst. Evol. Microbiol. 56, 1539–1545. doi:10.1099/ijs.0.63894-0
Davidsson, Å., Lövstedt, C., la Cour Jansen, J., Gruvberger, C., Aspegren, H., 2008. Co-digestion of grease trap sludge and sewage sludge. Waste Manag. 28, 986–992. doi:10.1016/j.wasman.2007.03.024
DeSantis, T.Z., Hugenholtz, P., Larsen, N., Rojas, M., Brodie, E.L., Keller, K., Huber, T., Dalevi, D., Hu, P., Andersen, G.L., 2006. Greengenes, a Chimera-Checked 16S rRNA Gene Database and Workbench Compatible with ARB. Appl. Environ. Microbiol. 72, 5069–5072. doi:10.1128/AEM.03006-05
Desbois, A.P., Smith, V.J., 2010. Antibacterial free fatty acids: activities, mechanisms of action and biotechnological potential. Appl. Microbiol. Biotechnol. 85, 1629–1642.
De Vrieze, J., Regueiro, L., Props, R., Vilchez-Vargas, R., Jáuregui, R., Pieper, D.H., Lema, J.M., Carballa, M., 2016. Presence does not imply activity: DNA and RNA patterns differ

171
in response to salt perturbation in anaerobic digestion. Biotechnol. Biofuels 9, 244. doi:10.1186/s13068-016-0652-5
De Vrieze, J., Verstraete, W., Boon, N., 2013. Repeated pulse feeding induces functional stability in anaerobic digestion. Microb. Biotechnol. 6, 414–424. doi:10.1111/1751-7915.12025
Dumont, M.G., Murrell, J.C., 2005. Stable isotope probing — linking microbial identity to function. Nat. Rev. Microbiol. 3, 499–504. doi:10.1038/nrmicro1162
Eaton, A.D., Franson, M.A.H., 2005. Standard Methods for Examination of Water & Wastewater. Amer Public Health Assn.
Edgar, R.C., 2013. UPARSE: highly accurate OTU sequences from microbial amplicon reads. Nat. Methods 10, 996–998. doi:10.1038/nmeth.2604
Edgar, R.C., 2010. Search and clustering orders of magnitude faster than BLAST. Bioinformatics 26, 2460–2461. doi:10.1093/bioinformatics/btq461
Edgar, R.C., Haas, B.J., Clemente, J.C., Quince, C., Knight, R., 2011. UCHIME improves sensitivity and speed of chimera detection. Bioinformatics 27, 2194–2200. doi:10.1093/bioinformatics/btr381
Elsas, J.D. van, Chiurazzi, M., Mallon, C.A., Elhottovā, D., Krištůfek, V., Salles, J.F., 2012. Microbial diversity determines the invasion of soil by a bacterial pathogen. Proc. Natl. Acad. Sci. 109, 1159–1164. doi:10.1073/pnas.1109326109
Embree, M., Nagarajan, H., Movahedi, N., Chitsaz, H., Zengler, K., 2014. Single-cell genome and metatranscriptome sequencing reveal metabolic interactions of an alkane-degrading methanogenic community. ISME J. 8, 757–767. doi:10.1038/ismej.2013.187
Eyice, Ö., Namura, M., Chen, Y., Mead, A., Samavedam, S., Schäfer, H., 2015. SIP metagenomics identifies uncultivated Methylophilaceae as dimethylsulphide degrading bacteria in soil and lake sediment. ISME J. 9, 2336–2348. doi:10.1038/ismej.2015.37
Fujita, Y., Matsuoka, H., Hirooka, K., 2007. Regulation of fatty acid metabolism in bacteria. Mol. Microbiol. 66, 829–839. doi:10.1111/j.1365-2958.2007.05947.x
Gan, Y., Qiu, Q., Liu, P., Rui, J., Lu, Y., 2012. Syntrophic Oxidation of Propionate in Rice Field Soil at 15 and 30°C under Methanogenic Conditions. Appl. Environ. Microbiol. 78, 4923–4932. doi:10.1128/AEM.00688-12
Garcia, J.-L., Patel, B.K.C., Ollivier, B., 2000. Taxonomic, Phylogenetic, and Ecological Diversity of Methanogenic Archaea. Anaerobe 6, 205–226. doi:10.1006/anae.2000.0345
Girault, R., Bridoux, G., Nauleau, F., Poullain, C., Buffet, J., Peu, P., Sadowski, A.G., Béline, F., 2012. Anaerobic co-digestion of waste activated sludge and greasy sludge from flotation process: Batch versus CSTR experiments to investigate optimal design. Bioresour. Technol. 105, 1–8. doi:10.1016/j.biortech.2011.11.024
Goodwin, S., McPherson, J.D., McCombie, W.R., 2016. Coming of age: ten years of next-generation sequencing technologies. Nat. Rev. Genet. 17, 333–351. doi:10.1038/nrg.2016.49
Gray, N.D., Sherry, A., Grant, R.J., Rowan, A.K., Hubert, C.R.J., Callbeck, C.M., Aitken, C.M., Jones, D.M., Adams, J.J., Larter, S.R., Head, I.M., 2011. The quantitative significance of Syntrophaceae and syntrophic partnerships in methanogenic degradation of crude oil alkanes. Environ. Microbiol. 13, 2957–2975. doi:10.1111/j.1462-2920.2011.02570.x
Grob, C., Taubert, M., Howat, A.M., Burns, O.J., Dixon, J.L., Richnow, H.H., Jehmlich, N., von Bergen, M., Chen, Y., Murrell, J.C., 2015. Combining metagenomics with metaproteomics and stable isotope probing reveals metabolic pathways used by a

172
naturally occurring marine methylotroph. Environ. Microbiol. 17, 4007–4018. doi:10.1111/1462-2920.12935
Guo, M., Song, W., Buhain, J., 2015. Bioenergy and biofuels: History, status, and perspective. Renew. Sustain. Energy Rev. 42, 712–725. doi:10.1016/j.rser.2014.10.013
Gustafson, W.G., Feinberg, B.A., McFarland, J.T., 1986. Energetics of beta-oxidation. Reduction potentials of general fatty acyl-CoA dehydrogenase, electron transfer flavoprotein, and fatty acyl-CoA substrates. J. Biol. Chem. 261, 7733–7741.
Hanaki, K., Matsuo, T., Nagase, M., 1981. Mechanism of inhibition caused by long-chain fatty acids in anaerobic digestion process. Biotechnol. Bioeng. 23, 1591–1610. doi:10.1002/bit.260230717
Hansen, K.H., Ahring, B.K., Raskin, L., 1999. Quantification of Syntrophic Fatty Acid-β-Oxidizing Bacteria in a Mesophilic Biogas Reactor by Oligonucleotide Probe Hybridization. Appl. Environ. Microbiol. 65, 4767–4774.
Hao, L., Bize, A., Conteau, D., Chapleur, O., Courtois, S., Kroff, P., Desmond-Le Quéméner, E., Bouchez, T., Mazéas, L., 2016. New insights into the key microbial phylotypes of anaerobic sludge digesters under different operational conditions. Water Res. 102, 158–169. doi:10.1016/j.watres.2016.06.014
Hatamoto, M., Imachi, H., Fukayo, S., Ohashi, A., Harada, H., 2007a. Syntrophomonas palmitatica sp. nov., an anaerobic, syntrophic, long-chain fatty-acid-oxidizing bacterium isolated from methanogenic sludge. Int. J. Syst. Evol. Microbiol. 57, 2137–2142. doi:10.1099/ijs.0.64981-0
Hatamoto, M., Imachi, H., Ohashi, A., Harada, H., 2007b. Identification and Cultivation of Anaerobic, Syntrophic Long-Chain Fatty Acid-Degrading Microbes from Mesophilic and Thermophilic Methanogenic Sludges. Appl. Environ. Microbiol. 73, 1332–1340. doi:10.1128/AEM.02053-06
Hatamoto, M., Imachi, H., Yashiro, Y., Ohashi, A., Harada, H., 2007c. Diversity of Anaerobic Microorganisms Involved in Long-Chain Fatty Acid Degradation in Methanogenic Sludges as Revealed by RNA-Based Stable Isotope Probing. Appl. Environ. Microbiol. 73, 4119–4127. doi:10.1128/AEM.00362-07
Heijnen, J.J., Van Dijken, J.P., 1992. In search of a thermodynamic description of biomass yields for the chemotrophic growth of microorganisms. Biotechnol. Bioeng. 39, 833–858. doi:10.1002/bit.260390806
He, X., Iasmin, M., Dean, L.O., Lappi, S.E., Ducoste, J.J., de los Reyes III, F.L., 2011. Evidence for fat, oil, and grease (FOG) deposit formation mechanisms in sewer lines. Environ. Sci. Technol. 45, 4385–4391.
Hill, M.O., 1973. Diversity and Evenness: A Unifying Notation and Its Consequences. Ecology 54, 427–432. doi:10.2307/1934352
Honda, T., Fujita, T., Tonouchi, A., 2013. Aminivibrio pyruvatiphilus gen. nov., sp. nov., an anaerobic, amino-acid-degrading bacterium from soil of a Japanese rice field. Int. J. Syst. Evol. Microbiol. 63, 3679–3686. doi:10.1099/ijs.0.052225-0
Hori, T., Haruta, S., Ueno, Y., Ishii, M., Igarashi, Y., 2006. Dynamic Transition of a Methanogenic Population in Response to the Concentration of Volatile Fatty Acids in a Thermophilic Anaerobic Digester. Appl. Environ. Microbiol. 72, 1623–1630. doi:10.1128/AEM.72.2.1623-1630.2006
Huson, D.H., Auch, A.F., Qi, J., Schuster, S.C., 2007. MEGAN analysis of metagenomic data. Genome Res. 17, 377–386. doi:10.1101/gr.5969107

173
Hwu, C.-S., Lettinga, G., 1997. Acute toxicity of oleate to acetate-utilizing methanogens in mesophilic and thermophilic anaerobic sludges. Enzyme Microb. Technol. 21, 297–301. doi:10.1016/S0141-0229(97)00050-1
Hwu, C.-S., Tseng, S.-K., Yuan, C.-Y., Kulik, Z., Lettinga, G., 1998. Biosorption of long-chain fatty acids in UASB treatment process. Water Res. 32, 1571–1579. doi:10.1016/S0043-1354(97)00352-7
Ito, T., Yoshiguchi, K., Ariesyady, H.D., Okabe, S., 2011. Identification of a novel acetate-utilizing bacterium belonging to Synergistes group 4 in anaerobic digester sludge. ISME J. 5, 1844–1856. doi:10.1038/ismej.2011.59
Jackson, B.E., Bhupathiraju, V.K., Tanner, R.S., Woese, C.R., McInerney, M.J., 1999. Syntrophus aciditrophicus sp. nov., a new anaerobic bacterium that degrades fatty acids and benzoate in syntrophic association with hydrogen-using microorganisms. Arch. Microbiol. 171, 107–114. doi:10.1007/s002030050685
Johansson, I., Svensson, M., 2001. Surfactants based on fatty acids and other natural hydrophobes. Curr. Opin. Colloid Interface Sci. 6, 178–188. doi:10.1016/S1359-0294(01)00076-0
Johnson, D.R., Lee, T.K., Park, J., Fenner, K., Helbling, D.E., 2014. The functional and taxonomic richness of wastewater treatment plant microbial communities are associated with each other and with ambient nitrogen and carbon availability. Environ. Microbiol. n/a–n/a. doi:10.1111/1462-2920.12429
Jonsson, S., Borén, H., 2002. Analysis of mono- and diesters of o-phthalic acid by solid-phase extractions with polystyrene–divinylbenzene-based polymers. J. Chromatogr. A 963, 393–400. doi:10.1016/S0021-9673(02)00647-7
Jost, L., 2006. Entropy and diversity. Oikos 113, 363–375. doi:10.1111/j.2006.0030-1299.14714.x
Ju, F., Zhang, T., 2015. Experimental Design and Bioinformatics Analysis for the Application of Metagenomics in Environmental Sciences and Biotechnology. Environ. Sci. Technol. 49, 12628–12640. doi:10.1021/acs.est.5b03719
Junicke, H., Feldman, H., Van Loosdrecht, M.C.M., Kleerebezem, R., 2016. Limitation of syntrophic coculture growth by the acetogen. Biotechnol. Bioeng. 113, 560–567. doi:10.1002/bit.25816
Junicke, H., Loosdrecht, M.C.M. van, Kleerebezem, R., 2016. Kinetic and thermodynamic control of butyrate conversion in non-defined methanogenic communities. Appl. Microbiol. Biotechnol. 100, 915–925. doi:10.1007/s00253-015-6971-9
Kabouris, J.C., Tezel, U., Pavlostathis, S.G., Engelmann, M., Dulaney, J.A., Todd, A.C., Gillette, R.A., 2009. Mesophilic and Thermophilic Anaerobic Digestion of Municipal Sludge and Fat, Oil, and Grease. Water Environ. Res. 81, 476–485. doi:10.2175/106143008X357192
Kang, D.D., Froula, J., Egan, R., Wang, Z., 2015. MetaBAT, an efficient tool for accurately reconstructing single genomes from complex microbial communities. PeerJ 3, e1165. doi:10.7717/peerj.1165
Kanicky, J.R., Poniatowski, A.F., Mehta, N.R., Shah, D.O., 2000. Cooperativity among Molecules at Interfaces in Relation to Various Technological Processes: Effect of Chain Length on the pKa of Fatty Acid Salt Solutions†. Langmuir 16, 172–177. doi:10.1021/la990719o
174
Kanicky, J.R., Shah, D.O., 2002. Effect of Degree, Type, and Position of Unsaturation on the pKa of Long-Chain Fatty Acids. J. Colloid Interface Sci. 256, 201–207. doi:10.1006/jcis.2001.8009
Karlsson, A., Einarsson, P., Schnürer, A., Sundberg, C., Ejlertsson, J., Svensson, B.H., 2012. Impact of trace element addition on degradation efficiency of volatile fatty acids, oleic acid and phenyl acetate and on microbial populations in a biogas digester. J. Biosci. Bioeng. 114, 446–452. doi:10.1016/j.jbiosc.2012.05.010
Karlsson, A., Ejlertsson, J., Nezirevic, D., Svensson, B.H., 1999. Degradation of phenol under meso- and thermophilic, anaerobic conditions. Anaerobe 5, 25–35. doi:10.1006/anae.1998.0187
Karst, S.M., Kirkegaard, R.H., Albertsen, M., 2016. mmgenome: a toolbox for reproducible genome extraction from metagenomes. bioRxiv 059121. doi:10.1101/059121
Keener, K.M., Ducoste, J.J., Holt, L.M., 2008. Properties influencing fat, oil, and grease deposit formation. Water Environ. Res. 80, 2241–2246.
Kim, S.-H., Han, S.-K., Shin, H.-S., 2004. Kinetics of LCFA Inhibition on Acetoclastic Methanogenesis, Propionate Degradation and β-Oxidation. J. Environ. Sci. Health Part A 39, 1025–1037. doi:10.1081/ESE-120028411
Kleerebezem, R., Van Loosdrecht, M.C., 2010. A generalized method for thermodynamic state analysis of environmental systems. Crit. Rev. Environ. Sci. Technol. 40, 1–54.
Klindworth, A., Pruesse, E., Schweer, T., Peplies, J., Quast, C., Horn, M., Glöckner, F.O., 2013. Evaluation of general 16S ribosomal RNA gene PCR primers for classical and next-generation sequencing-based diversity studies. Nucleic Acids Res. 41, e1–e1. doi:10.1093/nar/gks808
Koster, I.W., Cramer, A., 1987. Inhibition of Methanogenesis from Acetate in Granular Sludge by Long-Chain Fatty Acids. Appl. Environ. Microbiol. 53, 403–409.
Kuhn, M., 2008. Caret package. J. Stat. Softw. 28. Laban, N.A., Tan, B., Dao, A., Foght, J., 2015. Draft Genome Sequence of Uncultivated
Toluene-Degrading Desulfobulbaceae Bacterium Tol-SR, Obtained by Stable Isotope Probing Using [13C6]Toluene. Genome Announc. 3, e01423–14. doi:10.1128/genomeA.01423-14
Labatut, R.A., Angenent, L.T., Scott, N.R., 2011. Biochemical methane potential and biodegradability of complex organic substrates. Bioresour. Technol. 102, 2255–2264. doi:10.1016/j.biortech.2010.10.035
Lalman, J.A., Bagley, D.M., 2001. Anaerobic degradation and methanogenic inhibitory effects of oleic and stearic acids. Water Res. 35, 2975–2983. doi:10.1016/S0043-1354(00)00593-5
Lalman, J.A., Bagley, D.M., 2000. Anaerobic degradation and inhibitory effects of linoleic acid. Water Res. 34, 4220–4228. doi:10.1016/S0043-1354(00)00180-9
Lalman, J., Bagley, D.M., 2002. Effects of C18 long chain fatty acids on glucose, butyrate and hydrogen degradation. Water Res. 36, 3307–3313. doi:10.1016/S0043-1354(02)00014-3
LaRowe, D.E., Dale, A.W., Amend, J.P., Van Cappellen, P., 2012. Thermodynamic limitations on microbially catalyzed reaction rates. Geochim. Cosmochim. Acta 90, 96–109. doi:10.1016/j.gca.2012.05.011
Lee, C., Kim, J., Hwang, K., O’Flaherty, V., Hwang, S., 2009. Quantitative analysis of methanogenic community dynamics in three anaerobic batch digesters treating different wastewaters. Water Res. 43, 157–165. doi:10.1016/j.watres.2008.09.032

175
Lee, I.-S., Parameswaran, P., Rittmann, B.E., 2011. Effects of solids retention time on methanogenesis in anaerobic digestion of thickened mixed sludge. Bioresour. Technol. 102, 10266–10272. doi:10.1016/j.biortech.2011.08.079
Lee, M.J., Zinder, S.H., 1988. Isolation and Characterization of a Thermophilic Bacterium Which Oxidizes Acetate in Syntrophic Association with a Methanogen and Which Grows Acetogenically on H2-CO2. Appl. Environ. Microbiol. 54, 124–129.
Li, D., Liu, C.-M., Luo, R., Sadakane, K., Lam, T.-W., 2015. MEGAHIT: an ultra-fast single-node solution for large and complex metagenomics assembly via succinct de Bruijn graph. Bioinformatics 31, 1674–1676. doi:10.1093/bioinformatics/btv033
Li, H., Chang, J., Liu, P., Fu, L., Ding, D., Lu, Y., 2015. Direct interspecies electron transfer accelerates syntrophic oxidation of butyrate in paddy soil enrichments. Environ. Microbiol. 17, 1533–1547. doi:10.1111/1462-2920.12576
Li, H., Handsaker, B., Wysoker, A., Fennell, T., Ruan, J., Homer, N., Marth, G., Abecasis, G., Durbin, R., Subgroup, 1000 Genome Project Data Processing, 2009. The Sequence Alignment/Map format and SAMtools. Bioinformatics 25, 2078–2079. doi:10.1093/bioinformatics/btp352
Liu, P., Qiu, Q., Lu, Y., 2011. Syntrophomonadaceae-Affiliated Species as Active Butyrate-Utilizing Syntrophs in Paddy Field Soil. Appl. Environ. Microbiol. 77, 3884–3887. doi:10.1128/AEM.00190-11
Long, J.H., Aziz, T.N., Reyes III, F.L. de los, Ducoste, J.J., 2012. Anaerobic co-digestion of fat, oil, and grease (FOG): A review of gas production and process limitations. Process Saf. Environ. Prot., Special Issue on Energy from Waste 90, 231–245. doi:10.1016/j.psep.2011.10.001
Lorowitz, W.H., Zhao, H., Bryan, M.P., 1989. Syntrophomonas wolfei subsp. saponavida subsp. nov., a Long-Chain Fatty-Acid-Degrading, Anaerobic, Syntrophic Bacterium; Syntrophomonas wolfei subsp. wolfei subsp. nov.; and Emended Descriptions of the Genus and Species. Int. J. Syst. Evol. Microbiol. 39, 122–126. doi:10.1099/00207713-39-2-122
Louca, S., Doebeli, M., 2015. Calibration and analysis of genome-based models for microbial ecology. eLife 4, e08208. doi:10.7554/eLife.08208
Louca, S., Parfrey, L.W., Doebeli, M., 2016. Decoupling function and taxonomy in the global ocean microbiome. Science 353, 1272–1277. doi:10.1126/science.aaf4507
Love, M.I., Huber, W., Anders, S., 2014. Moderated estimation of fold change and dispersion for RNA-seq data with DESeq2. Genome Biol. 15, 1.
Lovley, D.R., 1985. Minimum Threshold for Hydrogen Metabolism in Methanogenic Bacteria. Appl. Environ. Microbiol. 49, 1530–1531.
Lozupone, C., Knight, R., 2005. UniFrac: a New Phylogenetic Method for Comparing Microbial Communities. Appl. Environ. Microbiol. 71, 8228–8235. doi:10.1128/AEM.71.12.8228-8235.2005
Lueders, T., Pommerenke, B., Friedrich, M.W., 2004. Stable-Isotope Probing of Microorganisms Thriving at Thermodynamic Limits: Syntrophic Propionate Oxidation in Flooded Soil. Appl. Environ. Microbiol. 70, 5778–5786. doi:10.1128/AEM.70.10.5778-5786.2004
Luostarinen, S., Luste, S., Sillanpää, M., 2009. Increased biogas production at wastewater treatment plants through co-digestion of sewage sludge with grease trap sludge from a meat processing plant. Bioresour. Technol. 100, 79–85. doi:10.1016/j.biortech.2008.06.029
176
Mabrouk, A.F., Jr, L.R.D., 1961. Solubility of linoleic acid in aqueous solutions and its reaction with water. J. Am. Oil Chem. Soc. 38, 9–13. doi:10.1007/BF02633110
Mata, J.A., Martínez-Cánovas, J., Quesada, E., Béjar, V., 2002. A Detailed Phenotypic Characterisation of the Type Strains of Halomonas Species. Syst. Appl. Microbiol. 25, 360–375. doi:10.1078/0723-2020-00122
McInerney, M.J., 1992. The genus Syntrophomonas, and other syntrophic bacteria. Prokaryotes Springer N. Y. NY 2048–2057.
McInerney, M.J., Bryant, M.P., Pfennig, N., 1979. Anaerobic bacterium that degrades fatty acids in syntrophic association with methanogens. Arch. Microbiol. 122, 129–135. doi:10.1007/BF00411351
McInerney, M.J., Sieber, J.R., Gunsalus, R.P., 2009. Syntrophy in Anaerobic Global Carbon Cycles. Curr. Opin. Biotechnol. 20, 623–632. doi:10.1016/j.copbio.2009.10.001
McMahon, K., 2001. Anaerobic codigestion of municipal solid waste and biosolids under various mixing conditions—II: microbial population dynamics. Water Res. 35, 1817–1827. doi:10.1016/S0043-1354(00)00438-3
McMahon, K.D., Martin, H.G., Hugenholtz, P., 2007. Integrating ecology into biotechnology. Curr. Opin. Biotechnol., Energy biotechnology / Environmental biotechnology 18, 287–292. doi:10.1016/j.copbio.2007.04.007
McMahon, K.D., Zheng, D., Stams, A.J.M., Mackie, R.I., Raskin, L., 2004. Microbial population dynamics during start-up and overload conditions of anaerobic digesters treating municipal solid waste and sewage sludge. Biotechnol. Bioeng. 87, 823–834. doi:10.1002/bit.20192
Menes, R.J., Travers, D., 2006. Detection of fatty acid beta-oxidizing syntrophic bacteria by fluorescence in situ hybridization. Water Sci. Technol. 54, 33. doi:10.2166/wst.2006.483
Mulat, D.G., Jacobi, H.F., Feilberg, A., Adamsen, A.P.S., Richnow, H.-H., Nikolausz, M., 2016. Changing Feeding Regimes To Demonstrate Flexible Biogas Production: Effects on Process Performance, Microbial Community Structure, and Methanogenesis Pathways. Appl. Environ. Microbiol. 82, 438–449. doi:10.1128/AEM.02320-15
Narihiro, T., Terada, T., Ohashi, A., Kamagata, Y., Nakamura, K., Sekiguchi, Y., 2012. Quantitative detection of previously characterized syntrophic bacteria in anaerobic wastewater treatment systems by sequence-specific rRNA cleavage method. Water Res. 46, 2167–2175. doi:10.1016/j.watres.2012.01.034
Neufeld, J.D., Dumont, M.G., Vohra, J., Murrell, J.C., 2006. Methodological Considerations for the Use of Stable Isotope Probing in. Microb. Ecol. 53, 435–442. doi:10.1007/s00248-006-9125-x
Nielsen, H.B., Ahring, B.K., 2006. Responses of the biogas process to pulses of oleate in reactors treating mixtures of cattle and pig manure. Biotechnol. Bioeng. 95, 96–105. doi:10.1002/bit.20963
Noutsopoulos, C., Mamais, D., Antoniou, K., Avramides, C., Oikonomopoulos, P., Fountoulakis, I., 2013. Anaerobic co-digestion of grease sludge and sewage sludge: The effect of organic loading and grease sludge content. Bioresour. Technol. 131, 452–459. doi:10.1016/j.biortech.2012.12.193
Oksanen, J., Kindt, R., Legendre, P., O’Hara, B., Stevens, M.H.H., Oksanen, M.J., Suggests, M., 2007. The vegan package. Community Ecol. Package 631–637.

177
Palatsi, J., Affes, R., Fernandez, B., Pereira, M.A., Alves, M.M., Flotats, X., 2012. Influence of adsorption and anaerobic granular sludge characteristics on long chain fatty acids inhibition process. Water Res. 46, 5268–5278. doi:10.1016/j.watres.2012.07.008
Palatsi, J., Illa, J., Prenafeta-Boldú, F.X., Laureni, M., Fernandez, B., Angelidaki, I., Flotats, X., 2010. Long-chain fatty acids inhibition and adaptation process in anaerobic thermophilic digestion: Batch tests, microbial community structure and mathematical modelling. Bioresour. Technol. 101, 2243–2251. doi:10.1016/j.biortech.2009.11.069
Palatsi, J., Laureni, M., Andrés, M.V., Flotats, X., Nielsen, H.B., Angelidaki, I., 2009. Strategies for recovering inhibition caused by long chain fatty acids on anaerobic thermophilic biogas reactors. Bioresour. Technol. 100, 4588–4596. doi:10.1016/j.biortech.2009.04.046
Parada, A.E., Needham, D.M., Fuhrman, J.A., 2016. Every base matters: assessing small subunit rRNA primers for marine microbiomes with mock communities, time series and global field samples. Environ. Microbiol. 18, 1403–1414. doi:10.1111/1462-2920.13023
Parks, D.H., Imelfort, M., Skennerton, C.T., Hugenholtz, P., Tyson, G.W., 2015. CheckM: assessing the quality of microbial genomes recovered from isolates, single cells, and metagenomes. Genome Res. 25, 1043–1055. doi:10.1101/gr.186072.114
Pereira, M.A., Cavaleiro, A.J., Mota, M., Alves, M.M., 2003. Accumulation of long chain fatty acids onto anaerobic sludge under steady state and shock loading conditions: effect on acetogenic and methanogenic activity.
Pereira, M. a., Pires, O. C., Mota, M., Alves, M. M., 2005. Anaerobic biodegradation of oleic and palmitic acids: Evidence of mass transfer limitations caused by long chain fatty acid accumulation onto the anaerobic sludge. Biotechnol. Bioeng. 92, 15–23. doi:10.1002/bit.20548
Pereira, M.A., Pires, O.C., Mota, M., Alves, M.M., 2002. Anaerobic degradation of oleic acid by suspended and granular sludge: identification of palmitic acid as a key intermediate. Water Sci. Technol. J. Int. Assoc. Water Pollut. Res. 45, 139–144.
Pereira, M. A., Sousa, D. Z., Mota, M., Alves, M. M., 2004. Mineralization of LCFA associated with anaerobic sludge: Kinetics, enhancement of methanogenic activity, and effect of VFA. Biotechnol. Bioeng. 88, 502–511. doi:10.1002/bit.20278
Phelps, T.J., Conrad, R., Zeikus, J.G., 1985. Sulfate-Dependent Interspecies H2 Transfer between Methanosarcina barkeri and Desulfovibrio vulgaris during Coculture Metabolism of Acetate or Methanol. Appl. Environ. Microbiol. 50, 589–594.
Pramanik, A., Pawar, S., Antonian, E., Schulz, H., 1979. Five different enzymatic activities are associated with the multienzyme complex of fatty acid oxidation from Escherichia coli. J. Bacteriol. 137, 469–473.
Props, R., Kerckhof, F.-M., Rubbens, P., Vrieze, J.D., Sanabria, E.H., Waegeman, W., Monsieurs, P., Hammes, F., Boon, N., 2016. Absolute quantification of microbial taxon abundances. ISME J. doi:10.1038/ismej.2016.117
Quéméneur, M., Marty, Y., 1994. Fatty acids and sterols in domestic wastewaters. Water Res. 28, 1217–1226. doi:10.1016/0043-1354(94)90210-0
Radajewski, S., Ineson, P., Parekh, N.R., Murrell, J.C., 2000. Stable-isotope probing as a tool in microbial ecology. Nature 403, 646–649. doi:10.1038/35001054
Ralston, A.W., Hoerr, C.W., 1942. The Solubilities of the Normal Saturated Fatty Acids. J. Org. Chem. 07, 546–555. doi:10.1021/jo01200a013

178
Regmi, P., Bunce, R., Miller, M.W., Park, H., Chandran, K., Wett, B., Murthy, S., Bott, C.B., 2015. Ammonia-based intermittent aeration control optimized for efficient nitrogen removal. Biotechnol. Bioeng. 112, 2060–2067.
Regueiro, L., Lema, J.M., Carballa, M., 2015. Key microbial communities steering the functioning of anaerobic digesters during hydraulic and organic overloading shocks. Bioresour. Technol. 197, 208–216. doi:10.1016/j.biortech.2015.08.076
Ren, Y., Aguirre, J., Ntamack, A.G., Chu, C., Schulz, H., 2004. An Alternative Pathway of Oleate β-Oxidation in Escherichia coli Involving the Hydrolysis of a Dead End Intermediate by a Thioesterase. J. Biol. Chem. 279, 11042–11050. doi:10.1074/jbc.M310032200
Rinzema, A., Boone, M., Knippenberg, K. van, Lettinga, G., 1994. Bactericidal Effect of Long Chain Fatty Acids in Anaerobic Digestion. Water Environ. Res. 66, 40–49.
Rittmann, B.E., Hausner, M., Loffler, F., Love, N.G., Muyzer, G., Okabe, S., Oerther, D.B., Peccia, J., Raskin, L., Wagner, M., 2006. A vista for microbial ecology and environmental biotechnology. Environ. Sci. Technol. 40, 1096–1103.
Roy, F., Albagnac, G., Samain, E., 1985. Influence of Calcium Addition on Growth of Highly Purified Syntrophic Cultures Degrading Long-Chain Fatty Acids. Appl. Environ. Microbiol. 49, 702–705.
Saidi-Mehrabad, A., He, Z., Tamas, I., Sharp, C.E., Brady, A.L., Rochman, F.F., Bodrossy, L., Abell, G.C., Penner, T., Dong, X., Sensen, C.W., Dunfield, P.F., 2013. Methanotrophic bacteria in oilsands tailings ponds of northern Alberta. ISME J. 7, 908–921. doi:10.1038/ismej.2012.163
Salvador, A.F., Cavaleiro, A.J., Sousa, D.Z., Alves, M.M., Pereira, M.A., 2013. Endurance of methanogenic archaea in anaerobic bioreactors treating oleate-based wastewater. Appl. Microbiol. Biotechnol. 97, 2211–2218. doi:10.1007/s00253-012-4061-9
Schink, B., 1997. Energetics of syntrophic cooperation in methanogenic degradation. Microbiol. Mol. Biol. Rev. 61, 262–280.
Schmidt, A., Müller, N., Schink, B., Schleheck, D., 2013. A Proteomic View at the Biochemistry of Syntrophic Butyrate Oxidation in Syntrophomonas wolfei. PLoS ONE 8, e56905. doi:10.1371/journal.pone.0056905
Schnürer, A., Schink, B., Svensson, B.H., 1996. Clostridium ultunense sp. nov., a Mesophilic Bacterium Oxidizing Acetate in Syntrophic Association with a Hydrogenotrophic Methanogenic Bacterium. Int. J. Syst. Bacteriol. 46, 1145–1152. doi:10.1099/00207713-46-4-1145
Segata, N., Börnigen, D., Morgan, X.C., Huttenhower, C., 2013. PhyloPhlAn is a new method for improved phylogenetic and taxonomic placement of microbes. Nat. Commun. 4. doi:10.1038/ncomms3304
Sekiguchi, Y., Kamagata, Y., Nakamura, K., Ohashi, A., Harada, H., 2000. Syntrophothermus lipocalidus gen. nov., sp. nov., a novel thermophilic, syntrophic, fatty-acid-oxidizing anaerobe which utilizes isobutyrate. Int. J. Syst. Evol. Microbiol. 50, 771–779. doi:10.1099/00207713-50-2-771
Shade, A., 2016. Diversity is the question, not the answer. ISME J. doi:10.1038/ismej.2016.118 Shigematsu, T., Tang, Y., Mizuno, Y., Kawaguchi, H., Morimura, S., Kida, K., 2006. Microbial
diversity of mesophilic methanogenic consortium that can degrade long-chain fatty acids in chemostat cultivation. J. Biosci. Bioeng. 102, 535–544. doi:10.1263/jbb.102.535

179
Sieber, J.R., Crable, B.R., Sheik, C.S., Hurst, G.B., Rohlin, L., Gunsalus, R.P., McInerney, M.J., 2015. Proteomic analysis reveals metabolic and regulatory systems involved in the syntrophic and axenic lifestyle of Syntrophomonas wolfei. Front. Microbiol. 6.
Sieber, J.R., Le, H.M., McInerney, M.J., 2014. The importance of hydrogen and formate transfer for syntrophic fatty, aromatic and alicyclic metabolism. Environ. Microbiol. 16, 177–188. doi:10.1111/1462-2920.12269
Sieber, J.R., McInerney, M.J., Gunsalus, R.P., 2012. Genomic Insights into Syntrophy: The Paradigm for Anaerobic Metabolic Cooperation. Annu. Rev. Microbiol. 66, 429–452. doi:10.1146/annurev-micro-090110-102844
Sieber, J.R., Sims, D.R., Han, C., Kim, E., Lykidis, A., Lapidus, A.L., McDonnald, E., Rohlin, L., Culley, D.E., Gunsalus, R., McInerney, M.J., 2010. The genome of Syntrophomonas wolfei: new insights into syntrophic metabolism and biohydrogen production. Environ. Microbiol. 12, 2289–2301. doi:10.1111/j.1462-2920.2010.02237.x
Silva, S.A., Cavaleiro, A.J., Pereira, M.A., Stams, A.J.M., Alves, M.M., Sousa, D.Z., 2014. Long-term acclimation of anaerobic sludges for high-rate methanogenesis from LCFA. Biomass Bioenergy 67, 297–303. doi:10.1016/j.biombioe.2014.05.012
Silva, S.A., Salvador, A.F., Cavaleiro, A.J., Pereira, M.A., Stams, A.J.M., Alves, M.M., Sousa, D.Z., 2016. Toxicity of long chain fatty acids towards acetate conversion by Methanosaeta concilii and Methanosarcina mazei. Microb. Biotechnol. 9, 514–518. doi:10.1111/1751-7915.12365
Silvestre, G., Illa, J., Fernández, B., Bonmatí, A., 2014. Thermophilic anaerobic co-digestion of sewage sludge with grease waste: Effect of long chain fatty acids in the methane yield and its dewatering properties. Appl. Energy 117, 87–94. doi:10.1016/j.apenergy.2013.11.075
Silvestre, G., Rodríguez-Abalde, A., Fernández, B., Flotats, X., Bonmatí, A., 2011. Biomass adaptation over anaerobic co-digestion of sewage sludge and trapped grease waste. Bioresour. Technol. 102, 6830–6836. doi:10.1016/j.biortech.2011.04.019
Singh, P., Kansal, A., Carliell-Marquet, C., 2016. Energy and carbon footprints of sewage treatment methods. J. Environ. Manage. 165, 22–30. doi:10.1016/j.jenvman.2015.09.017
Smith, A.L., Skerlos, S.J., Raskin, L., 2015. Anaerobic membrane bioreactor treatment of domestic wastewater at psychrophilic temperatures ranging from 15° C to 3° C. Environ. Sci. Water Res. Technol. 1, 56–64.
Soliva, C.R., Meile, L., Cieślak, A., Kreuzer, M., Machmüller, A., 2004. Rumen simulation technique study on the interactions of dietary lauric and myristic acid supplementation in suppressing ruminal methanogenesis. Br. J. Nutr. 92, 689–700. doi:10.1079/BJN20041250
Sousa, D.Z., Pereira, M.A., Smidt, H., Stams, A.J.M., Alves, M.M., 2007a. Molecular assessment of complex microbial communities degrading long chain fatty acids in methanogenic bioreactors. FEMS Microbiol. Ecol. 60, 252–265. doi:10.1111/j.1574-6941.2007.00291.x
Sousa, D.Z., Salvador, A.F., Ramos, J., Guedes, A.P., Barbosa, S., Stams, A.J.M., Alves, M.M., Pereira, M.A., 2013. Activity and Viability of Methanogens in Anaerobic Digestion of Unsaturated and Saturated Long-Chain Fatty Acids. Appl. Environ. Microbiol. 79, 4239–4245. doi:10.1128/AEM.00035-13

180
Sousa, D.Z., Smidt, H., Alves, M.M., Stams, A.J.M., 2009. Ecophysiology of syntrophic communities that degrade saturated and unsaturated long-chain fatty acids. FEMS Microbiol. Ecol. 68, 257–272. doi:10.1111/j.1574-6941.2009.00680.x
Sousa, D.Z., Smidt, H., Alves, M.M., Stams, A.J.M., 2007b. Syntrophomonas zehnderi sp. nov., an anaerobe that degrades long-chain fatty acids in co-culture with Methanobacterium formicicum. Int. J. Syst. Evol. Microbiol. 57, 609–615. doi:10.1099/ijs.0.64734-0
Stams, A.J.M., Plugge, C.M., 2009. Electron transfer in syntrophic communities of anaerobic bacteria and archaea. Nat. Rev. Microbiol. 7, 568–577. doi:10.1038/nrmicro2166
Stams, A.J.M., Sousa, D.Z., Kleerebezem, R., Plugge, C.M., 2012. Role of syntrophic microbial communities in high-rate methanogenic bioreactors. Water Sci. Technol. 66, 352. doi:10.2166/wst.2012.192
Sundberg, C., Al-Soud, W.A., Larsson, M., Alm, E., Yekta, S.S., Svensson, B.H., Sørensen, S.J., Karlsson, A., 2013. 454 pyrosequencing analyses of bacterial and archaeal richness in 21 full-scale biogas digesters. FEMS Microbiol. Ecol. 85, 612–626. doi:10.1111/1574-6941.12148
Svetlitshnyi, V., Rainey, F., Wiegel, J., 1996. Thermosyntropha lipolytica gen. nov., sp. nov., a Lipolytic, Anaerobic, Alkalitolerant, Thermophilic Bacterium Utilizing Short- and Long-Chain Fatty Acids in Syntrophic Coculture with a Methanogenic Archaeum. Int. J. Syst. Bacteriol. 46, 1131–1137. doi:10.1099/00207713-46-4-1131
Thauer, R.K., Jungermann, K., Decker, K., 1977. Energy conservation in chemotrophic anaerobic bacteria. Bacteriol. Rev. 41, 100–180.
Treu, L., Campanaro, S., Kougias, P.G., Zhu, X., Angelidaki, I., 2016a. Untangling the Effect of Fatty Acid Addition at Species Level Revealed Different Transcriptional Responses of the Biogas Microbial Community Members. Environ. Sci. Technol. 50, 6079–6090. doi:10.1021/acs.est.6b00296
Treu, L., Kougias, P.G., Campanaro, S., Bassani, I., Angelidaki, I., 2016b. Deeper insight into the structure of the anaerobic digestion microbial community; the biogas microbiome database is expanded with 157 new genomes. Bioresour. Technol. 216, 260–266. doi:10.1016/j.biortech.2016.05.081
Urakawa, H., Martens-Habbena, W., Stahl, D.A., 2010. High Abundance of Ammonia-Oxidizing Archaea in Coastal Waters, Determined Using a Modified DNA Extraction Method. Appl. Environ. Microbiol. 76, 2129–2135. doi:10.1128/AEM.02692-09
U.S. DOE, 2010. Annual Energy Outlook. Vanwonterghem, I., Jensen, P.D., Ho, D.P., Batstone, D.J., Tyson, G.W., 2014. Linking
microbial community structure, interactions and function in anaerobic digesters using new molecular techniques. Curr. Opin. Biotechnol., Energy biotechnology • Environmental biotechnology 27, 55–64. doi:10.1016/j.copbio.2013.11.004
Vanwonterghem, I., Jensen, P.D., Rabaey, K., Tyson, G.W., 2016. Genome-centric resolution of microbial diversity, metabolism and interactions in anaerobic digestion. Environ. Microbiol. 18, 3144–3158. doi:10.1111/1462-2920.13382
Verastegui, Y., Cheng, J., Engel, K., Kolczynski, D., Mortimer, S., Lavigne, J., Montalibet, J., Romantsov, T., Hall, M., McConkey, B.J., Rose, D.R., Tomashek, J.J., Scott, B.R., Charles, T.C., Neufeld, J.D., 2014. Multisubstrate Isotope Labeling and Metagenomic Analysis of Active Soil Bacterial Communities. mBio 5, e01157–14. doi:10.1128/mBio.01157-14

181
Vital, M., Howe, A.C., Tiedje, J.M., 2014. Revealing the Bacterial Butyrate Synthesis Pathways by Analyzing (Meta)genomic Data. mBio 5, e00889–14. doi:10.1128/mBio.00889-14
Vuono, D.C., Benecke, J., Henkel, J., Navidi, W.C., Cath, T.Y., Munakata-Marr, J., Spear, J.R., Drewes, J.E., 2015. Disturbance and temporal partitioning of the activated sludge metacommunity. ISME J. 9, 425–435. doi:10.1038/ismej.2014.139
Wan, C., Zhou, Q., Fu, G., Li, Y., 2011. Semi-continuous anaerobic co-digestion of thickened waste activated sludge and fat, oil and grease. Waste Manag. 31, 1752–1758. doi:10.1016/j.wasman.2011.03.025
Wang, L., Aziz, T.N., de los Reyes, F.L., 2013. Determining the limits of anaerobic co-digestion of thickened waste activated sludge with grease interceptor waste. Water Res. 47, 3835–3844. doi:10.1016/j.watres.2013.04.003
Wang, Q., Garrity, G.M., Tiedje, J.M., Cole, J.R., 2007. Naïve Bayesian Classifier for Rapid Assignment of rRNA Sequences into the New Bacterial Taxonomy. Appl. Environ. Microbiol. 73, 5261–5267. doi:10.1128/AEM.00062-07
Warikoo, V., McInerney, M.J., Robinson, J.A., Suflita, J.M., 1996. Interspecies acetate transfer influences the extent of anaerobic benzoate degradation by syntrophic consortia. Appl. Environ. Microbiol. 62, 26–32.
Waterhouse, A.M., Procter, J.B., Martin, D.M.A., Clamp, M., Barton, G.J., 2009. Jalview Version 2—a multiple sequence alignment editor and analysis workbench. Bioinformatics 25, 1189–1191. doi:10.1093/bioinformatics/btp033
Weng, C., Jeris, J.S., 1976. Biochemical mechanisms in the methane fermentation of glutamic and oleic acids. Water Res. 10, 9–18. doi:10.1016/0043-1354(76)90151-2
Werner, J.J., Garcia, M.L., Perkins, S.D., Yarasheski, K.E., Smith, S.R., Muegge, B.D., Stadermann, F.J., DeRito, C.M., Floss, C., Madsen, E.L., Gordon, J.I., Angenent, L.T., 2014. Microbial Community Dynamics and Stability during an Ammonia-Induced Shift to Syntrophic Acetate Oxidation. Appl. Environ. Microbiol. 80, 3375–3383. doi:10.1128/AEM.00166-14
Werner, J.J., Knights, D., Garcia, M.L., Scalfone, N.B., Smith, S., Yarasheski, K., Cummings, T.A., Beers, A.R., Knight, R., Angenent, L.T., 2011. Bacterial community structures are unique and resilient in full-scale bioenergy systems. Proc. Natl. Acad. Sci. 108, 4158–4163. doi:10.1073/pnas.1015676108
Westerholm, M., Dolfing, J., Sherry, A., Gray, N.D., Head, I.M., Schnürer, A., 2011. Quantification of syntrophic acetate-oxidizing microbial communities in biogas processes. Environ. Microbiol. Rep. 3, 500–505. doi:10.1111/j.1758-2229.2011.00249.x
Wiltsee, G., 1998. Urban waste grease resource assessment. National Renewable Energy Laboratory.
Wittebolle, L., Marzorati, M., Clement, L., Balloi, A., Daffonchio, D., Heylen, K., De Vos, P., Verstraete, W., Boon, N., 2009. Initial community evenness favours functionality under selective stress. Nature 458, 623–626. doi:10.1038/nature07840
Wittebolle, L., Vervaeren, H., Verstraete, W., Boon, N., 2008. Quantifying Community Dynamics of Nitrifiers in Functionally Stable Reactors. Appl. Environ. Microbiol. 74, 286–293. doi:10.1128/AEM.01006-07
Wittwer, C.T., Herrmann, M.G., Moss, A.A., Rasmussen, R.P., 1997. Continuous fluorescence monitoring of rapid cycle DNA amplification. Biotechniques 22, 130–139.
Wu, C., Dong, X., Liu, X., 2007. Syntrophomonas wolfei subsp. methylbutyratica subsp. nov., and assignment of Syntrophomonas wolfei subsp. saponavida to Syntrophomonas

182
saponavida sp. nov. comb. nov. Syst. Appl. Microbiol. 30, 376–380. doi:10.1016/j.syapm.2006.12.001
Wu, C., Liu, X., Dong, X., 2006. Syntrophomonas erecta subsp. sporosyntropha subsp. nov., a spore-forming bacterium that degrades short chain fatty acids in co-culture with methanogens. Syst. Appl. Microbiol. 29, 457–462. doi:10.1016/j.syapm.2006.01.003
Yalcinkaya, S., Malina, J.F., 2015. Anaerobic co-digestion of municipal wastewater sludge and un-dewatered grease trap waste for assessing direct feed of grease trap waste in municipal digesters. Int. Biodeterior. Biodegrad. 104, 490–497. doi:10.1016/j.ibiod.2015.08.007
Yamada, T., Sekiguchi, Y., 2009. Cultivation of Uncultured Chloroflexi Subphyla: Significance and Ecophysiology of Formerly Uncultured Chloroflexi “Subphylum I” with Natural and Biotechnological Relevance. Microbes Environ. 24, 205–216. doi:10.1264/jsme2.ME09151S
Yu, Y., Lee, C., Kim, J., Hwang, S., 2005. Group-specific primer and probe sets to detect methanogenic communities using quantitative real-time polymerase chain reaction. Biotechnol. Bioeng. 89, 670–679. doi:10.1002/bit.20347
Zamanzadeh, M., Parker, W.J., Verastegui, Y., Neufeld, J.D., 2013. Biokinetics and bacterial communities of propionate oxidizing bacteria in phased anaerobic sludge digestion systems. Water Res. 47, 1558–1569. doi:10.1016/j.watres.2012.12.015
Zengler, K., Richnow, H.H., Rosselló-Mora, R., Michaelis, W., Widdel, F., 1999. Methane formation from long-chain alkanes by anaerobic microorganisms. Nature 401, 266–269. doi:10.1038/45777
Zhang, C., Liu, X., Dong, X., 2005. Syntrophomonas erecta sp. nov., a novel anaerobe that syntrophically degrades short-chain fatty acids. Int. J. Syst. Evol. Microbiol. 55, 799–803. doi:10.1099/ijs.0.63372-0
Zhang, C., Liu, X., Dong, X., 2004. Syntrophomonas curvata sp. nov., an anaerobe that degrades fatty acids in co-culture with methanogens. Int. J. Syst. Evol. Microbiol. 54, 969–973. doi:10.1099/ijs.0.02903-0
Zhang, F., Liu, X., Dong, X., 2012. Thermosyntropha tengcongensis sp. nov., a thermophilic bacterium that degrades long-chain fatty acids syntrophically. Int. J. Syst. Evol. Microbiol. 62, 759–763. doi:10.1099/ijs.0.033456-0
Zhang, T., Shao, M.-F., Ye, L., 2012. 454 Pyrosequencing reveals bacterial diversity of activated sludge from 14 sewage treatment plants. ISME J. 6, 1137–1147. doi:10.1038/ismej.2011.188
Zhao, H., Yang, D., Woese, C.R., Bryant, M.P., 1993. Assignment of Fatty Acid-β-Oxidizing Syntrophic Bacteria to Syntrophomonadaceae fam. nov. on the Basis of 16S rRNA Sequence Analyses. Int. J. Syst. Bacteriol. 43, 278–286. doi:10.1099/00207713-43-2-278
Ziels, R.M., Beck, D.A.C., Martí, M., Gough, H.L., Stensel, H.D., Svensson, B.H., 2015. Monitoring the dynamics of syntrophic β-oxidizing bacteria during anaerobic degradation of oleic acid by quantitative PCR. FEMS Microbiol. Ecol. 91, fiv028. doi:10.1093/femsec/fiv028
Ziels, R.M., Karlsson, A., Beck, D.A.C., Ejlertsson, J., Yekta, S.S., Bjorn, A., Stensel, H.D., Svensson, B.H., 2016. Microbial community adaptation influences long-chain fatty acid conversion during anaerobic codigestion of fats, oils, and grease with municipal sludge. Water Res. 103, 372–382. doi:10.1016/j.watres.2016.07.043

183
Zonta, Ž., Alves, M.M., Flotats, X., Palatsi, J., 2013. Modelling inhibitory effects of long chain fatty acids in the anaerobic digestion process. Water Res. 47, 1369–1380. doi:10.1016/j.watres.2012.12.007

A1
APPENDIX A Supplemental Information for
Chapter 3:
Monitoring the Dynamics of Syntrophic β-Oxidizing Bacteria During Anaerobic Degradation of Oleic Acid by Quantitative PCR
Number of Pages: 13 Number of Tables: 2 Number of Figures: 11 Contents Supplemental Table A1: Characteristics of qPCR primers and probes………………..…… A2 Supplemental Table A2: Intermediate metabolites of LCFA degradation…..……………… A3 Supplemental Figure A1: Specificity testing of Syntrophomonas qPCR assay…………...... A4 Supplemental Figure A2: Specificity testing of Syntrophus qPCR assay…………............... A5 Supplemental Figure A3: Calibration curve for Syntrophomonas qPCR assay…………….. A6 Supplemental Figure A4: Calibration curve for Syntrophus qPCR assay………………….. A6 Supplemental Figure A5: Spiked calibration curve for Syntrophomonas qPCR assay validation
A7
Supplemental Figure A6: Spiked bioreactor samples for Syntrophomonas qPCR assay validation..
A8
Supplemental Figure A7: Spiked calibration curve for Syntrophus qPCR assay validation.. A9 Supplemental Figure A8: qPCR of methanogenic archaeal targets……………….…….. A10 Supplemental Figure A9: Community richness, evenness, and Unifrac distances……….. A11 Supplemental Figure A10: Phylogenetic tree of Syntrophomonas OTUs………...…….….. A12 Supplemental Figure A11: Comparison of predictions by Illumina sequencing and qPCR... A13

A2
Supplemental Table A1: Characteristics and performance of all qPCR primer/probe sets used in this study Oligo. Name1 Target Group Sequence Refs. Reference
Sequence2 Calibration
Slope3 Calibration Intercept3
Synm-678 (F) Syntrophomonas
CCWGGTGTAGCGGT This study
Syntrophomonas zehnderi OL-4 (NR_044008.1)
-3.30 38.7 Synm-696 (P) TGCGTAGAAATCAGGAGGAAYACCAGT Synm-738 (R) TCAGGGYCAGTCCAG Syntr-441 (F)
Syntrophus GGTGGGAAGAAATGTATKGA This
study
Syntrophus aciditrophicus SB (NR_102776.1)
-3.32 38.8 Syntr-462 (P) TTAAYAGCCTTTGTACTTGACGGTAC Syntr-559 (R) CTCTTTACGCCCAATGAT BAC-338 (F)
Bacteria ACTCCTACGGGAGGCAG Yu et
al., 20054
Methylocella silvestris BL2
(NR_074237.1) -3.41 39.1 BAC-516 (P) TGCCAGCAGCCGCGGTAATAC
BAC-805 (R) GACTACCAGGGTATCTAATCC Msc-380 (F)
Methanosarcinaceae GAAACCGYGATAAGGGGA Yu et
al., 2005
Methanosarcina barkeri DSM800 (NR_025303.1)
-3.51 39.3 Msc-492 (P) TTAGCAAGGGCCGGGCAA Msc-828 (R) TAGCGARCATCGTTTACG Mst-702 (F)
Methanosaetaceae TAATCCTYGARGGACCACCA Yu et
al., 2005
Methanosaeta concilii Opfikon (NR_028242.1)
-3.58 41.1 Mst-753 (P) ACGGCAAGGGACGAAAGCTAGG Mst-862 (R) CCTACGGCACCRACMAC MBT-857 (F)
Methanobacteriales
CGWAGGGAAGCTGTTAAGT Yu et al.,
2005
Methanobacterium formicicum DSMZ1535
(NR_025028.1)
-3.49 38.9 MBT-929 (P) AGCACCACAACGCGTGGA
MBT-1196 (R) TACCGTCGTCCACTCCTT
MMB-282 (F) Methanomicrobiales
ATCGRTACGGGTTGTGGG Yu et al.,
2005
Methanoculleus bourgensis MS2 (NR_042786.1)
-3.41 41.6 MMB-749 (P) TYCGACAGTGAGGRACGAAAGCTG MMB-832 (R) CACCTAACGCRCATHGTTTAC MCC-495 (F)
Methanococcales TAAGGGCTGGGCAAGT Yu et
al., 2005
Methanococcus voltae
(U38461.1) -3.83 44.3 MCC-686 (P) TAGCGGTGRAATGYGTTGATCC
MCC-832 (R) CACCTAGTYCGCARAGTTTA 1 F = forward primer; P = hydrolysis probe; R = reverse primer 2 Organism from which the 16S sequence for was derived for the construction of plasmids for calibration standards, followed by the accession number of the 16S sequence 3 Calculated by performing linear regressions plots of Ct values versus the log10 of the template concentrations. 4 Yu Y, Lee C, Kim J & Hwang S (2005). Biotechnol. Bioeng. 89: 670–679.
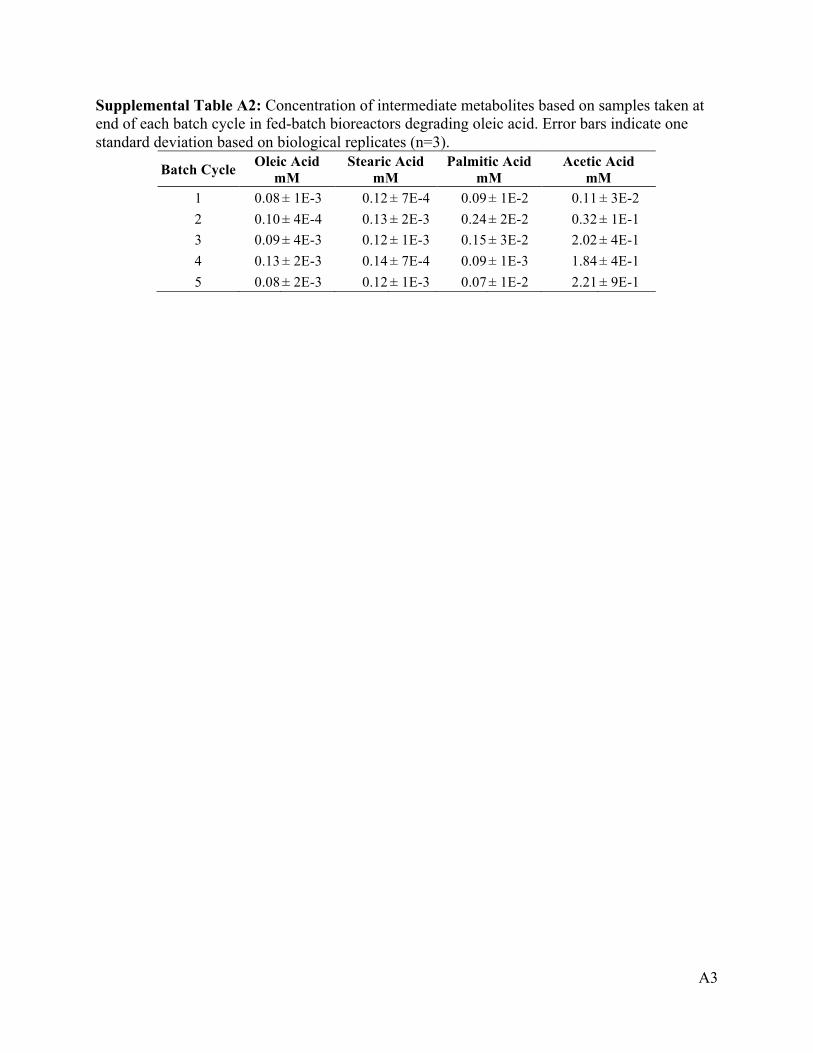
A3
Supplemental Table A2: Concentration of intermediate metabolites based on samples taken at end of each batch cycle in fed-batch bioreactors degrading oleic acid. Error bars indicate one standard deviation based on biological replicates (n=3).
Batch Cycle Oleic Acid mM
Stearic Acid mM
Palmitic Acid mM
Acetic Acid mM
1 0.08 ± 1E-3 0.12 ± 7E-4 0.09 ± 1E-2 0.11 ± 3E-2 2 0.10 ± 4E-4 0.13 ± 2E-3 0.24 ± 2E-2 0.32 ± 1E-1 3 0.09 ± 4E-3 0.12 ± 1E-3 0.15 ± 3E-2 2.02 ± 4E-1 4 0.13 ± 2E-3 0.14 ± 7E-4 0.09 ± 1E-3 1.84 ± 4E-1 5 0.08 ± 2E-3 0.12 ± 1E-3 0.07 ± 1E-2 2.21 ± 9E-1

A4
Supplemental Figure A1: Fluorescence response during specificity testing of the Syntrophomonas qPCR assay using pure-culture DNA samples. Approximately 0.5 to 2 ng of genomic DNA template was loaded in each qPCR reaction. The samples colored black did not produce a fluorescence signal at a Ct less than that of the lowest qPCR calibration standard (Ct of ~35 at 25 gene copies).
0
5
10
15
20
25
30
35
0 5 10 15 20 25 30 35 40
Fluo
resc
ence
(483
-533
)
Cycle
Syntrophomonaspalmitatica
Syntrophomonaszehnderi
Syntrophomonaswolfeisubsp.saponavida
Clostridiumacidiurici
Methanosaetaconcilii
Clostridiumultunense
Desulfitibacteralkalitolerans
Desulfotomaculumkuznetsovii
Desulfomoniletiedjei
Desulfovibrio vulgaris subsp.vulgaris
Enterococcusfaecalis
Escherichiacoli
Methanobacteriumformicicum
Methanococcusvoltae
Methanosarcinabarkeri
Methanospirillumhungatei
Pelotomaculumpropionicicum
Pseudomonasaeruginosa
Syntrophobacterpfennigii
Syntrophobacterwolinii
Streptococcuspyogenes
Syntrophusaciditrophicus
Syntrophusgentianae
NoTemplateControl

A5
Supplemental Figure A2: Fluorescence response during specificity testing of the Syntrophus qPCR assay using pure-culture DNA samples. Approximately 0.5 to 2 ng of genomic DNA template was loaded in each qPCR reaction. The samples colored black did not produce a fluorescence signal at a Ct less than that of the lowest qPCR calibration standard (Ct of ~35 at 25 gene copies).
0
5
10
15
20
25
0 5 10 15 20 25 30 35 40
Fluo
resc
ence
(483
-533
)
Cycle
Syntrophusgentianae
Syntrophusaciditrophicus
Clostridiumacidiurici
Clostridiumultunense
Desulfitibacteralkalitolerans
Desulfomoniletiedjei
Desulfotomaculumkuznetsovii
Desulfovibrio vulgaris subsp.vulgaris
Enterococcusfaecalis
Escherichiacoli
Pelotomaculumpropionicicum
Pseudomonasaeruginosa
Methanobacteriumformicicum
Methanococcusvoltae
Methanosaetaconcilii
Methansoarcinabarkeri
Methanospirillumhungatei
Streptococcuspyogenes
Syntrophobacterfumaroxidans
Syntrophobacterpfennigii
Syntrophomonaspalmitatica
Syntrophomonaswolfeisubsp.saponavida
Syntrophomonaszehnderi
NoTemplateControl

A6
Supplemental Figure A3: Threshold cycles (Ct) versus the log of the 16S rRNA gene copies of a typical standard calibration curve prepared for the Syntrophomonas primer/probe set. Duplicate points are shown for each standard dilution concentration.
Supplemental Figure A4: Threshold cycles (Ct) versus the log of the 16S rRNA gene copies of a typical standard calibration curve prepared for the Syntrophus primer/probe set. Duplicate points are shown for each standard dilution concentration.
y = -3.29x + 37.8R² = 0.99
0
5
10
15
20
25
30
35
40
0 2 4 6 8 10
Ct
Log(Syntrophomonas 16S rRNA Gene Copy)
y = -3.34x + 37.39R² = 0.99
0
5
10
15
20
25
30
35
0 2 4 6 8 10
Ct
Log(Syntrophus 16S rRNA Gene Copy)

A7
Supplemental Figure A5: Comparison of the linear dynamic range of samples in two Syntrophomonas standard dilution series that were either spiked or not spiked with ~106 16S gene copies of Desulfotomaculum kuznetsovii DNA. The linear regression and 99.9% confidence intervals shown refer to the non-spiked standard dilution series of Syntrophomonas DNA.
y = -3.345x + 38.917R² = 0.99
0
5
10
15
20
25
30
35
40
0 2 4 6 8 10
Ct
Log(Syntrophomonas 16S rRNA Gene Copy)
Non-spiked SeriesSpiked Series99.9% C.I.

A8
Supplemental Figure A6: Comparison of Syntrophomonas spp. 16S rRNA gene abundance in two random bioreactor DNA extracts quantified with and without spiking the qPCR mix with Desulfotomaculum kuznetsovii DNA. Sample A was spiked with 6 ng of D. kuznetsovii DNA, and Sample B was spiked with 0.6 ng D. kuznetsovii DNA. Error bars show 95% confidence intervals for triplicate technical replicates. Spiking Desulfotomaculum kuznetsovii DNA did not significantly impact the quantitative predictability of the Syntrophomonas qPCR primer/probe set applied to the experimental DNA samples (p > 0.1).
0.0E+00
1.0E+06
2.0E+06
3.0E+06
4.0E+06
5.0E+06
Sample A Sample B
Synt
roph
omon
as s
pp. 1
6S rR
NA
Gen
e C
opie
s Non-spiked
Spiked

A9
Supplemental Figure A7: Comparison of the linear dynamic range of samples in two Syntrophus standard dilution series that were either spiked or not spiked with ~106 16S gene copies of Desulfomonile tiedje DNA. The linear regression and 99.9% confidence intervals shown refer to the non-spiked standard dilution series of Syntrophus DNA.
y = -3.34x + 37.4R² = 0.99
0
5
10
15
20
25
30
35
40
0 2 4 6 8 10
Ct
Log(Syntrophus 16S rRNA Gene Copy)
Non-spiked SeriesSpiked Series99.9% C.I.

A10
Supplemental Figure A8: Changes in the 16S rRNA gene concentration of each methanogenic archaeal target group in the bioreactors degrading oleic acid. (n) = Methanomicrobiales; (l) = Methanosaetaceae; (u)=Methanobacteriales; (p)=Methanosarcinaceae. Methanococcales were not detected by qPCR on the bioreactor samples. Error bars indicate one standard deviation based on the biological replicates (n=3) and technical replicates (n=2).
● ● ● ●
● ●
0 5 10 15 20 25 30 35
1e+01
1e+02
1e+03
1e+04
1e+0516
S rR
NA
Gen
e C
once
ntra
tion
(
copy
/ng
DN
A)
Day

A11
Supplemental Figure A9: (A) Species richness of the bacterial communities over time determined as number of OTU's by rarefaction of random subsamples of size 38,600 from the community OTU matrices, (B) Community evenness of the bacterial communities over time determined with the Gini coefficient (higher Gini coefficient values represent lower community evenness), (C) Weighted Unifrac distance values relative to the initial bioreactor communities (higher UniFrac distances represent greater divergence from initial community structure). Error bars indicate one standard deviation based on the triplicate biological replicates.
●
●
●
●
● ●
0 5 10 15 20 25 30 35
0.950
0.955
0.960
0.965
0.970
0.975
0.980
Gin
i Eve
nnes
s C
oeffi
cien
t
Day
B
●
●
●
●
●
0 5 10 15 20 25 30 35
0.0
0.2
0.4
0.6
0.8
1.0U
niFr
ac d
ista
nce
rela
tive
to
initi
al c
ondi
tions
Day
C
●
●
●
●●
●
0 5 10 15 20 25 30 35
3000
3500
4000
4500C
omm
unity
Ric
hnes
s
Day
A

A12
Supplemental Figure A10: A phylogenetic tree of 16S rRNA gene sequences of the 7 most abundant Syntrophomonas OTU's with that of characterized Syntrophomonas species. 16S rRNA sequences of characterized species were retrieved from the NCBI database. The sequences were aligned with MUSCLE v3.8.31 (Edgar, R.C. (2004) Nucleic Acids Res, 32(5), 1792-97) and the alignment was trimmed to the 300 bp length of the OTU sequence with BMGE v1.1 (http://www.biomedcentral.com/1471-2148/10/210). The tree was constructed with RAxML 7.7.2 using GTRGAMMA model and 100 bootstraps. Rendering was performed with iTOL (Letunic I. and Bork (2011) Nucleic Acids Res, doi: 10.1093/nar/gkr201).
0.01
Syntropho
monas
curvata
Syntrophomonaszehnderi
OTU
31
OTU19
OTU28
OTU12
Syntrophom
onaswolfeisubsp..
saponavida1
Syntrophomonaspalm
itatica
Syntrophomonas
sapovorans
OTU44
OTU8
Syntrophomonas
wolfeisubsp
wolfei
OTU
16
Syntrophomonaswolfei subspmethylbutyratica
Syntrophomonasbryantii
Syntrophomonassporosyntrophas
Syntrophomonaserecta
subspsporosyntropha
Syntrophomonascellicola
7
78
37
27
10
68
68
57
61
7473
7017
14
100

A13
Supplemental Figure A11: Comparison of the relative abundance predicted by high-throughput amplicon sequencing of the 16S rRNA gene by Illumina MiSeq and by the newly developed qPCR assays for (A) Syntrophomonas and (B) Syntrophus. Error bars for high-throughput amplicon sequencing data indicate one standard deviation based on biological replicates (n=3), while error bars for qPCR data indicate one standard deviation based on biological replicates (n=3) and technical replicates (n=2).
●
●
●
●
●
●
5 10 15 20 25 30 35
5
10
15
20
Syntrophomonas Relative Abundance (%)by qPCR
Syntrop
homon
as R
elat
ive A
bund
ance
(%)
by H
igh−
thro
ughp
ut A
mpl
icon
Seq
uenc
ing
R2=0.99
A
●
●
●
●
●
●
0.000 0.005 0.010 0.015 0.020
0.0
0.1
0.2
0.3
0.4
Syntrophus Relative Abundance (%)by qPCR
Syntrop
hus
Rel
ative
Abu
ndan
ce (%
)by
Hig
h−th
roug
hput
Am
plic
on S
eque
ncin
g
R2=0.87
B

B1
APPENDIX B
Supplemental Information for Chapter 4:
Microbial community adaptation influences long-chain fatty acid conversion during anaerobic codigestion of fats, oils, and grease with municipal sludge
Number of Pages: 7 Number of Tables: 1 Number of Figures: 5 Contents: Supplemental Table B1: Characteristics of qPCR primers and probes………………….….. B2 Supplemental Figure B1: LCFA composition of codigester effluent…………………….... B3 Supplemental Figure B2: Diversity metrics for Bacteria communities………..…………... B4 Supplemental Figure B3: Bray-Curtis distances for Bacteria communities ……………... B5 Supplemental Figure B4: Diversity metrics for Archaea communities…………………... B6 Supplemental Figure B5: Bray-Curtis distances for Bacteria communities ……………... B7

B2
Supplemental Table B1: Characteristics and performance of all qPCR primer/probe sets used in this study Oligo. Name1 Target Group Sequence Refs. Reference
Sequence2 Calibration
Slope3 Calibration Intercept3
Synm-678 (F) Syntrophomonas
CCWGGTGTAGCGGT Ziels et al., 20154
Syntrophomonas zehnderi OL-4 (NR_044008.1)
-3.30 38.7 Synm-696 (P) TGCGTAGAAATCAGGAGGAAYACCAGT Synm-738 (R) TCAGGGYCAGTCCAG Syntr-441 (F)
Syntrophus GGTGGGAAGAAATGTATKGA Ziels
et al., 2015
Syntrophus aciditrophicus SB (NR_102776.1)
-3.32 38.8 Syntr-462 (P) TTAAYAGCCTTTGTACTTGACGGTAC Syntr-559 (R) CTCTTTACGCCCAATGAT BAC-338 (F)
Bacteria ACTCCTACGGGAGGCAG Yu et
al., 20055
Methylocella silvestris BL2
(NR_074237.1) -3.41 39.1 BAC-516 (P) TGCCAGCAGCCGCGGTAATAC
BAC-805 (R) GACTACCAGGGTATCTAATCC Msc-380 (F)
Methanosarcinaceae GAAACCGYGATAAGGGGA Yu et
al., 2005
Methanosarcina barkeri DSM800 (NR_025303.1)
-3.51 39.3 Msc-492 (P) TTAGCAAGGGCCGGGCAA Msc-828 (R) TAGCGARCATCGTTTACG Mst-702 (F)
Methanosaetaceae TAATCCTYGARGGACCACCA Yu et
al., 2005
Methanosaeta concilii Opfikon (NR_028242.1)
-3.58 41.1 Mst-753 (P) ACGGCAAGGGACGAAAGCTAGG Mst-862 (R) CCTACGGCACCRACMAC MBT-857 (F)
Methanobacteriales
CGWAGGGAAGCTGTTAAGT Yu et al.,
2005
Methanobacterium formicicum DSMZ1535
(NR_025028.1)
-3.49 38.9 MBT-929 (P) AGCACCACAACGCGTGGA
MBT-1196 (R) TACCGTCGTCCACTCCTT
MMB-282 (F) Methanomicrobiales
ATCGRTACGGGTTGTGGG Yu et al.,
2005
Methanoculleus bourgensis MS2 (NR_042786.1)
-3.41 41.6 MMB-749 (P) TYCGACAGTGAGGRACGAAAGCTG MMB-832 (R) CACCTAACGCRCATHGTTTAC MCC-495 (F)
Methanococcales TAAGGGCTGGGCAAGT Yu et
al., 2005
Methanococcus voltae
(U38461.1) -3.83 44.3 MCC-686 (P) TAGCGGTGRAATGYGTTGATCC
MCC-832 (R) CACCTAGTYCGCARAGTTTA 1 F = forward primer; P = hydrolysis probe; R = reverse primer 2 Organism from which the 16S sequence was derived for the construction of plasmids for calibration standards, followed by the accession number of the 16S sequence. 3 Calculated by performing linear regressions plots of Ct values versus the log10 of the template concentrations. 4 Ziels, R.M., et al., 2015. FEMS Microbiol. Ecol. 91 5 Yu, Y., et al., 2005. Biotechnol. Bioeng. 89, 670–679.

B3
Supplemental Figure B1: Specific concentrations of the long-chain fatty acids (LCFAs) oleate, palmitate, and stearate in the FOG codigester effluent during the experimental period.
● ●
●
●
●
●
●
●
●
0
20
40
60
0 50 100 150Day
Spec
ific L
CFA
Conc
entra
tion
(mg
LCFA
/g T
S)
● OleatePalmitateStearate

B4
Supplemental Figure B2: Hill diversity numbers (qD) of orders (A) q=0, (B) q=1, and (C) q=2 for the FOG codigester and control digester Bacteria communities over the course of the experimental period. Calculations were made based on Illumina MiSeq 16S amplicon sequencing data after rarefying to an equal number of reads for all samples to account for unequal sequencing depths. Error bars represent a standard deviation based on triplicate DNA extractions for each time point.
● ●
●
A
0
2000
4000
6000
0 50 100 150Day
Zero
Ord
er D
ivers
ity (0 D
)(E
quiva
lent
Num
ber o
f Spe
cies) ● Control
FOG Codigester
●
●
●
B
0
200
400
600
0 50 100 150Day
1st O
rder
Dive
rsity
(1 D )
(Equ
ivale
nt N
umbe
r of S
pecie
s) ● ControlFOG Codigester
●
●
●
C
0
25
50
75
100
0 50 100 150Day
2nd
Ord
er D
ivers
ity (2 D
)(E
quiva
lent
Num
ber o
f Spe
cies) ● Control
FOG Codigester

B5
Supplemental Figure B3 Bray-Curtis distance of the FOG codigester and control digester Bacteria communities relative to their respective initial communities at day=0. Calculations were made based on Illumina MiSeq 16S amplicon sequencing data after rarefying to an equal number of reads for all samples to account for unequal sequencing depths. Error bars represent a standard deviation based on triplicate DNA extractions for each time point.
●
●
0.2
0.3
0.4
0.5
0.6
0.7
0 50 100 150Day
Bray−C
urtis
Dis
tanc
eto
Initi
al C
omm
unity
● ControlCodigester

B6
Supplemental Figure B4 Hill diversity numbers (qD) of orders (A) q=0, (B) q=1, and (C) q=2 for the FOG codigester and control digester Archaea communities over the course of the experimental period. Calculations were made after rarefying to an equal number of reads for all samples to account for unequal sequencing depths. Error bars represent a standard deviation based on triplicate DNA extractions for each time point.
● ●●
A
0
500
1000
1500
2000
2500
0 50 100 150Day
Zero
Ord
er D
ivers
ity (0 D
)(E
quiva
lent
Num
ber o
f Spe
cies) ● Control
FOG Codigester
●●
●
B
0
20
40
60
0 50 100 150Day
1st O
rder
Dive
rsity
(1 D )
(Equ
ivale
nt N
umbe
r of S
pecie
s) ● ControlFOG Codigester
●
●
●
C
0
5
10
15
0 50 100 150Day
2nd
Ord
er D
ivers
ity (2 D
)(E
quiva
lent
Num
ber o
f Spe
cies) ● Control
FOG Codigester

B7
Supplemental Figure B5 Bray-Curtis distance of the FOG codigester and control digester Archaea communities relative to their respective initial communities at day=0. Calculations were made based on Illumina MiSeq 16S amplicon sequencing data after rarefying to an equal number of reads for all samples to account for unequal sequencing depths. Error bars represent a standard deviation based on triplicate DNA extractions for each time point.
●
●
0.0
0.2
0.4
0.6
0.8
0 50 100 150Day
Bray−C
urtis
Dis
tanc
eto
Initi
al C
omm
unity
● ControlCodigester

C1
APPENDIX C
Supplemental Information for
Chapter 5:
Syntrophic community structure and biokinetics driven by long-chain fatty acid feeding strategy in anaerobic codigestion
Number of Pages: 17 Number of Tables: 8 Number of Figures: 8 Contents: Supplemental Methods: Quantitative PCR C2 Supplemental Methods: Substrate Inhibition Modeling C3 Supplemental Table C1: Summary of the Phase I digester performances C4 Supplemental Table C2: Summary of the Phase II co-digester performancs C5 Supplemental Table C3: Batch test maximum aceticlastic conversion rates (qmax,acetate) C6 Supplemental Table C4: Effluent LCFA concentrations in the Phase I digesters C7 Supplemental Table C5: Effluent LCFA concentrations in the Phase II digesters C7 Supplemental Table C6: Oleate conversion rates (qoleate) with the digester sludges C8 Supplemental Table C7: Results nonlinear substrate inhibition model fitting C9 Supplemental Table C8: Summary of the multiple linear regression model for qmax,oleate C10 Supplemental Figure C1: A schematic of the experimental manure digesters C11 Supplemental Figure C2: Inferred absolute abundance of the genus Methanosaeta C12 Supplemental Figure C3: Correspondence analysis (CA) plot for Syntrophomonas reads C12 Supplemental Figure C4: Relative fractions of the 5 most abundant Methanosaeta OTUs C13 Supplemental Figure C5: Hill diversity numbers (qD) for Bacteria C14 Supplemental Figure C6: Hill diversity numbers (qD) for Archaea C15 Supplemental Figure C7: A phylogenetic tree 6 Syntrophomonas OTUs C16 Supplemental Figure C8: Linear regression of observed qmax, acetate values C17

C2
Supplemental Materials and Methods:
Quantitative PCR (qPCR)
qPCR analysis on syntrophic LCFA β-oxidizing bacteria was conducted targeting 16S rRNA
genes of the genus Syntrophomonas using the primers Synm-678-F (CCWGGTGTAGCGGT)
and Synm-738-F (TCAGGGYCAGTCCAG) and probe Synm-696-P
(TGCGTAGAAATCAGGAGGAAYACCAGT), developed by Ziels et al. (2015). Additionally,
qPCR was conducted targeting the domain Bacteria with the primers BAC-338-F
(ACTCCTACGGGAGGCAG) and BAC-805-R (GACTACCAGGGTATCTAATCC) and probe
BAC-516-P (TGCCAGCAGCCGCGGTAATAC), as well as the domain Archaea with the
primers ARC-787-F (ATTAGATACCCSBGTAGTCC) and ARC-1059-R
(GCCATGCACCWCCTCT) and probe ARC-915-P (AGGAATTGGCGGGGGAGCAC) (Yu et
al., 2005). All hydrolysis probes were labeled with 6-FAM at the 5′end and BHQ-1 at the 3′ end.
qPCR was performed using a MasterCycler Realplex4 (Eppendorf). Each 20 µL reaction mix
contained 5 µL DNA template, 2 µL PCR-grade water, 500 nM of each forward and reverse
primers, 200 nM of hydrolysis probe and 10 µL TaqMan™ Fast Advanced Master Mix (2X,
Applied Biosystems). All samples were analyzed in duplicate. No-template controls (NTCs)
were included with each qPCR run. Extracted DNA from the digester biomass samples was
diluted 1:10 in nuclease-free water to prevent PCR inhibition. Calibration standards for the qPCR
assays were prepared as described by Ziels et al. (2015), and were included in duplicate in each
qPCR run for all target groups. Calibration standards included 108, 107
, 106, 105
, 104, 103
, and 102
gene copies per reaction. Average slopes of calibration curves were -3.30 for Bacteria (101%
PCR efficiency), -3.56 for Archaea (91% PCR efficiency), and -3.39 (97% PCR efficiency) for
Syntrophomonas. R2 values of calibration curves were always above 0.99 for all targets.

C3
Biokinetic Modeling of Oleate Conversion:
Biokinetic parameters for oleate conversion were determined by fitting a modified form of the
Michaelis-Menten model that was empirically derived to account for substrate inhibition on
microbial growth and substrate utilization kinetics (Aiba et al., 1968). The inclusion of the
inhibition term, KI, accounted for substrate inhibition at high oleate concentrations.
! = !$%&'
() + '⋅ exp − '
(0
where: q is the specific methane production rate (mL CH4 g VS-1 d-1) at oleate concentration, S
(mg/L); qmax is the maximum specific methane production rate (mL CH4 g VS-1 d-1); Ks is the
half-saturation constant (mg/L); and KI is the substrate inhibition term (mg/L).
The biokinetic parameters, qmax, Ks, and KI were determined by nonlinear regression of the
specific methane production rates versus the initial oleate concentration using the nls package in
R version 3.2.1. The triplicate specific rate measurements at each oleate concentration were
pooled to obtain a single set of biokinetic parameters. The resulting biokinetic parameters are
shown in Table C7, and an example model fit for the Day 84 batch tests is shown below in
Methods Figure S-M1.
Figure C-Methods-1: Example substrate inhibition model fit for the day 84 oleate batch tests.

C4
Supplemental Table C1. Summary of the Phase I digester performances based on effluent VS, effluent COD, COD removal, pH, digester methane production, and specific methane yield during the transient increases in LCFA loading. Values in parentheses represent one standard deviation.
Days
Reactor
Feed VSLR
Feed OLR
% Feed VS as
LCFA
% Feed COD
as LCFA
Effluent VS
Effluent COD Digester
pH
COD removal
(%)
Daily Methane Production (@
STP)
Specific Methane
Yield
(g VS/L-d) (g COD/L-d) (g/L) (g/L) (mL/d) (mL/g VS)
-50 -0
Control 1.3 (0.1) 2.4 (0.7) 0% 0% 16.7 (1.5) 29.5 (6.2) 7.11 (0.04) 37% (6%) 994 (126) 195 (31)
Continuous Fed 1.3 (0.1) 2.4 (0.7) 0% 0% 17.0 (0.9) 28.0 (5.0) 7.10 (0.04) 41% (5%) 968 (112) 192 (33)
Pulse Fed 1.3 (0.1) 2.4 (0.7) 0% 0% 16.7 (0.8) 31.2 (7.1) 7.10 (0.04) 34% (7%) 994 (107) 195 (30)
1 - 20
Control 1.3 (0.1) 2.3 (0.3) 0% 0% 17.3 (0.6) 26.8 (3.4) 7.12 (0.02) 39% (3%) 960 (55) 176 (22)
Continuous Fed 1.26 (0.1) 2.2 (0.3) 3% 5% 16.8 (2.2) 25.7 (4.2) 7.12 (0.03) 34% (5%) 946 (68) 187 (14)
Pulse Fed 1.26 (0.1) 2.2 (0.3) 3% 5% 16.0 (2.4) 24.4 (3.4) 7.12 (0.03) 37% (7%) 996 (151) 201 (33)
21 - 45
Control 1.4 (0.1) 3.1 (0.4) 0% 0% 18.3 (0.8) 38.0 (4.6) 7.11 (0.02) 40% (4%) 975 (134) 181 (30)
Continuous Fed 1.31 (0.1) 3.0 (0.4) 6% 7% 16.8 (0.7) 35.1 (3.0) 7.11 (0.02) 45% (5%) 1104 (84) 214 (29)
Pulse Fed 1.31 (0.5) 3.0 (0.4) 6% 7% 16.6 (0.6) 36.0 (5.3) 7.10 (0.02) 44% (3%) 1194 (84) 229 (29)
46 - 65
Control 1.3 (0.1) 2.1 (0.4) 0% 0% 17.5 (0.6) 28.7 (5.9) 7.13 (0.02) 33% (5%) 1004 (79) 193 (26)
Continuous Fed 1.27 (0.1) 2.3 (0.4) 10% 16% 16.0 (0.3) 26.0 (3.0) 7.15 (0.03) 43% (2%) 1239 (105) 237 (26)
Pulse Fed 1.27 (0.2) 2.3 (0.4) 10% 16% 15.5 (0.4) 25.8 (2.1) 7.14 (0.03) 44% (6%) 1392 (453) 265 (68)
66 - 86
Control 1.4 (0.2) 2.1 (0.2) 0% 0% 17.5 (0.7) 26.6 (1.7) 7.13 (0.02) 39% (3%) 1046 (108) 198 (25)
Continuous Fed 1.53 (0.2) 2.7 (0.2) 16% 27% 16.1 (0.8) 26.3 (2.4) 7.16 (0.02) 54% (4%) 1726 (242) 290 (29)
Pulse Fed 1.53 (0.3) 2.7 (0.2) 16% 27% 16.1 (0.9) 24.7 (3.6) 7.17 (0.03) 54% (9%) 1749 (842) 282 (80)

C5
Supplemental Table C2. Summary of the Phase II co-digester performances based on effluent VS, effluent COD, COD removal, pH, digester methane production, and specific methane yield during the transient increases in LCFA loading. Values in parentheses represent one standard deviation.
Days
Feed Feed OLR
% Feed VS as
LCFA
% Feed COD
as LCFA
Effluent VS
Effluent COD Digester
pH
COD removal (%)
Daily Methane Production (@
STP)
Specific Methane
Yield
(g VS/L-d) (g COD/L-d) (g/L) (g/L) (mL/d) (mL/g VS)
Phase II: Continuous-Fed Co-digester
87-106 1.7 (0.2) 3.5 (0.2) 22% 32% 16.8 (0.9) 53 (4) 7.2 (0.04) 58% (3%) 2071 (243) 312 (44)
107-126 1.8 (0.2) 3.7 (0.3) 32% 47% 16.0 (0.5) 43 (6) 7.3 (0.04) 63% (2%) 2809 (309) 390 (59)
127 - 149 2.1 (0.2) 5.1 (0.3) 45% 54% 17.9 (3.5) 52 (7) 7.4 (0.07) 70% (3%) 4354 (615) 480 (53)
150 - 183 2.6 (0.2) 6.0 (0.3) 50% 64% 18.3 (1.0) 58 (8) 7.4 (0.04) 74% (2%) 5214 (404) 503 (55)
184 - 200 2.3 (0.1) 5.2 (0.4) 48% 62% 18.6 (1.1) 52 (10) 7.4 (0.04) 70% (1%) 4482 (364) 499 (27)
Phase II: Pulse-Fed Co-digester
0 - 103 1.4 (0.2) 2.3 (0.5) 0% 0% 17.7 (0.8) 52 (12) 7.1 (0.02) 39% (5%) 991 (106) 185 (28)
104-116 1.4 (0.2) 2.3 (0.3) 5% 10% 17.9 (0.6) 45 (2) 7.1 (0.02) 40% (2%) 1236 (292) 226 (18)
117-126 1.3 (0.3) 2.4 (0.5) 13% 22% 17.3 (0.6) 41 (8) 7.2 (0.02) 45% (2%) 1409 (559) 262 (16)
127-137 1.7 (0.4) 3.0 (1.0) 18% 30% 18.0 (1.2) 56 (9) 7.2 (0.05) 53% (4%) 1947 (836) 286 (58)
138-149 1.9 (0.7) 3.9 (2.2) 36% 52% 18.3 (1.4) 49 (2) 7.3 (0.05) 66% (2%) 3396 (1723) 465 (19)
150-183 2.6 (1.4) 6.0 (3.9) 50% 64% 18.3 (1.2) 58 (8) 7.4 (0.09) 74% (2%) 5707 (1309) 545 (71)
184-200 2.3 (1.2) 5.2 (3.3) 48% 62% 18.8 (0.9) 52 (11) 7.5 (0.09) 70% (1%) 4754 (1157) 526 (17)

C6
Supplemental Table C3: Batch test maximum aceticlastic conversion rates (qmax,acetate) with digester sludges throughout Phases I and II, at increasing initial oleate concentrations from 0 to 16 g/L. Values in parentheses indicate one standard deviation based on triplicate batch vials.
Reactor Day Observed qmax, acetate (mL CH4/g VS-d) at initial oleate concentration:
0 g /L 0.8 g/L 4 g /L 8 g/L 12 g/L 16 g/L Phase I Digesters
Control 0 45 (4) 46 (2) 42 (6) 6 (5) 0 (2) 0 (2) 41 35 (4) 32 (5) 28 (1) 11 (3) 2 (1) 0 (1) 84 39 (1) 46 (1) 36 (1) 20 (1) 6 (1) 1 (1)
Continuous-Fed 0 47 (5) 38 (6) 43 (5) 7 (2) 0 (2) 0 (6) 41 40 (3) 49 (2) 44 (2) 12 (2) 0 (2) 0 (2) 84 64 (6) 92 (5) 79 (5) 24 (2) 5 (1) 0 (1)
Pulse-Fed 0 37 (3) 34 (4) 36 (3) 7 (4) 0 (3) 0 (3) 41 32 (2) 30 (2) 34 (3) 12 (2) 1 (2) 0 (1) 84 61 (8) 84 (11) 66 (11) 19 (5) 6 (2) 1 (1)
Phase II Digesters
Continuous-Fed 129 137 (11) 168 (9) 143 (6) 10 (4) 1 (3) 0 (3) 170 111 (13) 139 (9) 120 (23) 1 (8) 0 (8) 0 (8) 204 52 (8) 95 (5) 38 (6) 0 (2) 0 (2) 0 (2)
Pulse-Fed
129 88 (5) 93 (6) 89 (5) 17 (4) 2 (4) 0 (4) 148 142 (19) 182 (16) 102 (13) 5 (2) 0 (1) 0 (2) 170 104 (9) 146 (9) 98 (25) 12 (5) 2 (5) 0 (5) 204 70 (8) 106 (5) 19 (11) 1 (3) 0 (2) 0 (1)
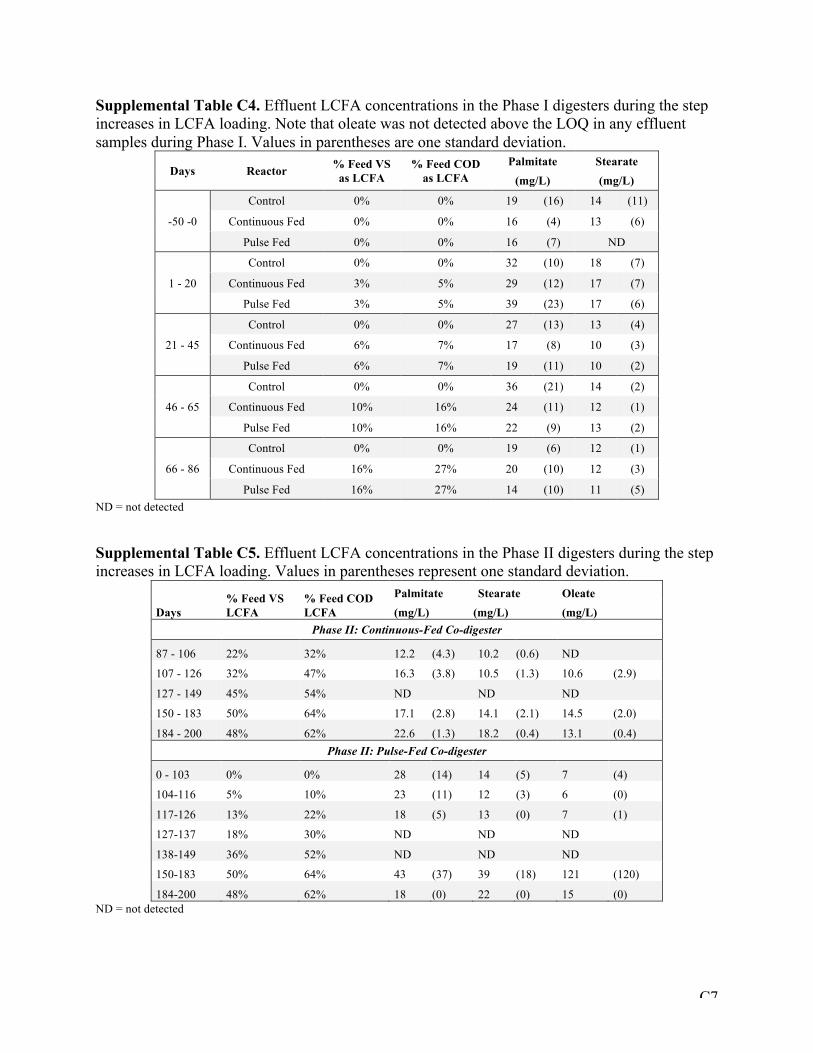
C7
Supplemental Table C4. Effluent LCFA concentrations in the Phase I digesters during the step increases in LCFA loading. Note that oleate was not detected above the LOQ in any effluent samples during Phase I. Values in parentheses are one standard deviation.
Days Reactor % Feed VS as LCFA
% Feed COD as LCFA
Palmitate Stearate (mg/L) (mg/L)
-50 -0
Control 0% 0% 19 (16) 14 (11)
Continuous Fed 0% 0% 16 (4) 13 (6)
Pulse Fed 0% 0% 16 (7) ND
1 - 20
Control 0% 0% 32 (10) 18 (7)
Continuous Fed 3% 5% 29 (12) 17 (7)
Pulse Fed 3% 5% 39 (23) 17 (6)
21 - 45
Control 0% 0% 27 (13) 13 (4)
Continuous Fed 6% 7% 17 (8) 10 (3)
Pulse Fed 6% 7% 19 (11) 10 (2)
46 - 65
Control 0% 0% 36 (21) 14 (2)
Continuous Fed 10% 16% 24 (11) 12 (1)
Pulse Fed 10% 16% 22 (9) 13 (2)
66 - 86
Control 0% 0% 19 (6) 12 (1)
Continuous Fed 16% 27% 20 (10) 12 (3)
Pulse Fed 16% 27% 14 (10) 11 (5) ND = not detected
Supplemental Table C5. Effluent LCFA concentrations in the Phase II digesters during the step increases in LCFA loading. Values in parentheses represent one standard deviation.
Days % Feed VS LCFA
% Feed COD LCFA
Palmitate Stearate Oleate (mg/L) (mg/L) (mg/L)
Phase II: Continuous-Fed Co-digester
87 - 106 22% 32% 12.2 (4.3) 10.2 (0.6) ND
107 - 126 32% 47% 16.3 (3.8) 10.5 (1.3) 10.6 (2.9)
127 - 149 45% 54% ND ND ND
150 - 183 50% 64% 17.1 (2.8) 14.1 (2.1) 14.5 (2.0)
184 - 200 48% 62% 22.6 (1.3) 18.2 (0.4) 13.1 (0.4) Phase II: Pulse-Fed Co-digester
0 - 103 0% 0% 28 (14) 14 (5) 7 (4)
104-116 5% 10% 23 (11) 12 (3) 6 (0)
117-126 13% 22% 18 (5) 13 (0) 7 (1)
127-137 18% 30% ND ND ND
138-149 36% 52% ND ND ND
150-183 50% 64% 43 (37) 39 (18) 121 (120)
184-200 48% 62% 18 (0) 22 (0) 15 (0) ND = not detected
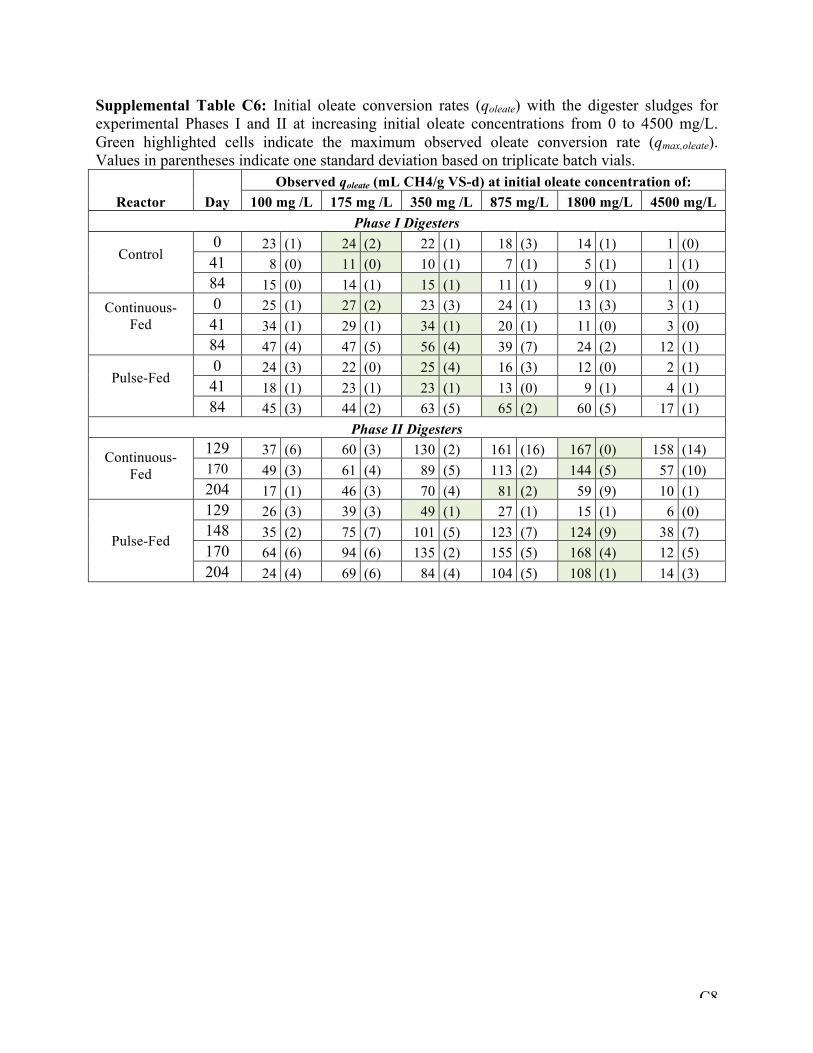
C8
Supplemental Table C6: Initial oleate conversion rates (qoleate) with the digester sludges for experimental Phases I and II at increasing initial oleate concentrations from 0 to 4500 mg/L. Green highlighted cells indicate the maximum observed oleate conversion rate (qmax,oleate). Values in parentheses indicate one standard deviation based on triplicate batch vials.
Reactor Day Observed qoleate (mL CH4/g VS-d) at initial oleate concentration of:
100 mg /L 175 mg /L 350 mg /L 875 mg/L 1800 mg/L 4500 mg/L Phase I Digesters
Control
0 23 (1) 24 (2) 22 (1) 18 (3) 14 (1) 1 (0) 41 8 (0) 11 (0) 10 (1) 7 (1) 5 (1) 1 (1) 84 15 (0) 14 (1) 15 (1) 11 (1) 9 (1) 1 (0)
Continuous-Fed
0 25 (1) 27 (2) 23 (3) 24 (1) 13 (3) 3 (1) 41 34 (1) 29 (1) 34 (1) 20 (1) 11 (0) 3 (0) 84 47 (4) 47 (5) 56 (4) 39 (7) 24 (2) 12 (1)
Pulse-Fed
0 24 (3) 22 (0) 25 (4) 16 (3) 12 (0) 2 (1) 41 18 (1) 23 (1) 23 (1) 13 (0) 9 (1) 4 (1) 84 45 (3) 44 (2) 63 (5) 65 (2) 60 (5) 17 (1)
Phase II Digesters
Continuous-Fed
129 37 (6) 60 (3) 130 (2) 161 (16) 167 (0) 158 (14) 170 49 (3) 61 (4) 89 (5) 113 (2) 144 (5) 57 (10) 204 17 (1) 46 (3) 70 (4) 81 (2) 59 (9) 10 (1)
Pulse-Fed
129 26 (3) 39 (3) 49 (1) 27 (1) 15 (1) 6 (0) 148 35 (2) 75 (7) 101 (5) 123 (7) 124 (9) 38 (7) 170 64 (6) 94 (6) 135 (2) 155 (5) 168 (4) 12 (5) 204 24 (4) 69 (6) 84 (4) 104 (5) 108 (1) 14 (3)

C9
Supplemental Table C7: Biokinetic parameters obtained with nonlinear regression fitting of the Aiba et al. (1968) substrate inhibition model to observed methane production rates at various initial oleate concentrations using experimental digester sludges throughout Phases I and II (see Supplemental Materials and Methods). Values in parentheses indicate the parameter standard error based on the model fit.
Reactor Day Ks
(mg/L) Ki
(mg/L) qmax
(mL CH4/g VS-d) Phase I Digesters
Control 0 17 (14) 2027 (249) 28 (1)
41 68 (32) 1494 (185) 15 (1) 84 18 (15) 2114 (282) 18 (1)
Continuous-Fed Co-digester
0 26 (16) 1994 (261) 33 (2) 41 11 (9) 1388 (116) 40 (1) 84 28 (18) 1804 (265) 65 (3)
Pulse-Fed Co-digester
0 18 (20) 1676 (294) 30 (2) 41 44 (21) 1356 (154) 31 (1) 84 153 (45) 2599 (302) 107 (5)
Phase II Digesters
Pulse-Fed Co-digester
129 277 (123) 783 (61) 127 (7) 148 628 (184) 2530 (217) 318 (15) 170 893 (429) 1592 (143) 603 (36) 204 1486 (931) 1622 (130) 540 (34)
Continuous-Fed Co-digester
129 373 (108) 10332 (2326) 250 (12) 170 686 (250) 3347 (403) 299 (17) 204 1450 (894) 1344 (85) 426 (22)

C10
Supplemental Table C8. Summary results of the cross-validated multiple linear regression model for predicting qmax,oleate values based on the absolute abundance of 6 Syntrophomonas OTUs. The parameter estimate for the OTUs represents their contributions towards the overall model slope, and p represents the probability of a t value greater than the one obtained. Values for the residual standard error, R2, and model F statistic are also given.
Parameter Estimate Std. Error t value p Intercept 1.6E+01 7.6E+00 2.13 3.9E-02 seq_34 3.2E-09 6.2E-10 5.19 6.0E-06 seq_35 8.8E-10 1.8E-10 4.81 2.1E-05 seq_58 2.0E-09 5.2E-10 3.75 5.4E-04 seq_154 2.4E-09 1.1E-09 2.17 3.6E-02 seq_1083 2.3E-08 6.2E-09 3.70 6.4E-04 seq_7128 -7.0E-08 3.0E-08 -2.34 2.4E-02 Residual standard error: 17.31 on 41 degrees of freedom Multiple R2: 0.9112, Adjusted R2: 0.8982 F-statistic: 70.11 on 6 and 41 DF, p-value: < 2.2e-16

C11
Supplemental Figure C1: A schematic showing the configuration of the experimental manure digesters. Note the sodium oleate feed line was only included in the codigesters.
Gascollec)on
Gassamplingport
Gasreservoirbag
Wet)pgasmeter
Digestereffluent
Peristal)cPump
Effluentcollec)on
Peristal)cPump
Sodiumoleate
ManureFeed
Mixer
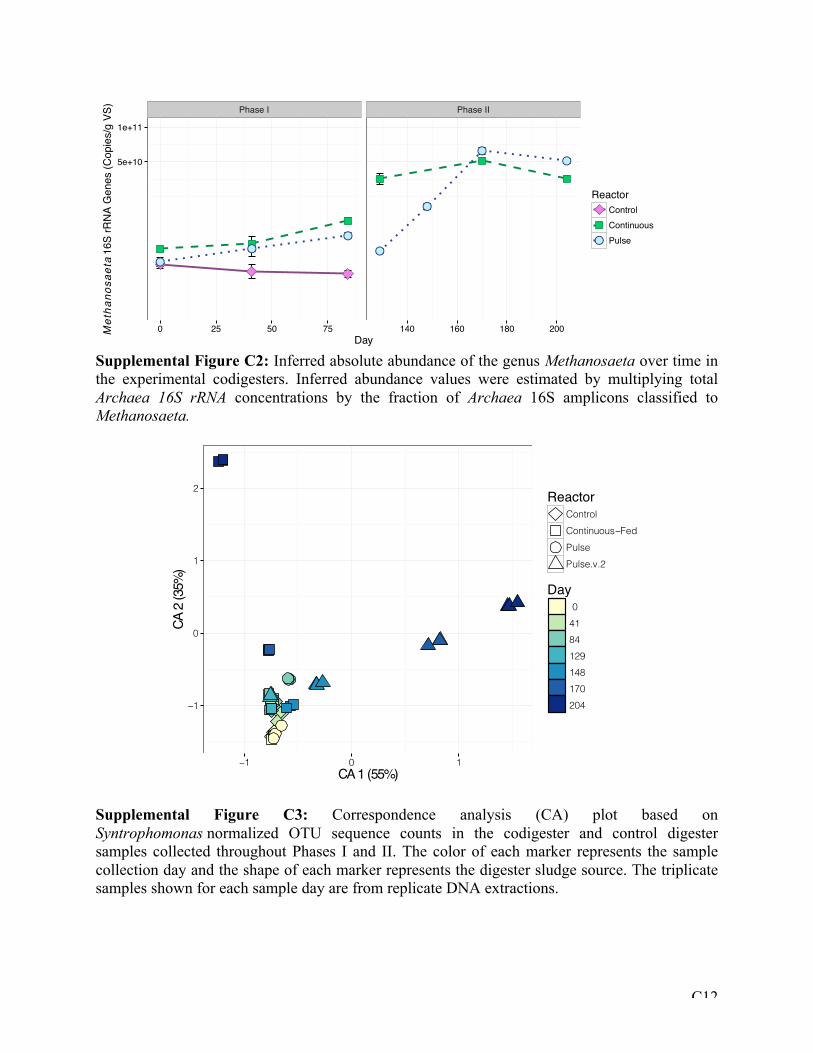
C12
Supplemental Figure C2: Inferred absolute abundance of the genus Methanosaeta over time in the experimental codigesters. Inferred abundance values were estimated by multiplying total Archaea 16S rRNA concentrations by the fraction of Archaea 16S amplicons classified to Methanosaeta.
Supplemental Figure C3: Correspondence analysis (CA) plot based on Syntrophomonas normalized OTU sequence counts in the codigester and control digester samples collected throughout Phases I and II. The color of each marker represents the sample collection day and the shape of each marker represents the digester sludge source. The triplicate samples shown for each sample day are from replicate DNA extractions.
Phase I Phase II
●●
●
●
●
●●5e+10
1e+11
0 25 50 75 140 160 180 200Day
Metha
nosaeta
16S
rRN
A G
enes
(Cop
ies/
g VS
)
Reactor
●
ControlContinuousPulse
ReactorControl
Continuous−Fed
Pulse
Pulse.v.2
Day04184129148170204
●●●
●●●
●●●
−1
0
1
2
−1 0 1CA 1 (55%)
CA 2
(35%
)

C13
Supplemental Figure C4: Relative fractions of the 5 most abundant Methanosaeta OTUs within the Methanosaeta genus of the digesters during Phases I and II based on 16S rRNA amplicon sequencing.
0
20
40
60
80
100
Re
lativ
e Fr
actio
n of
Methanosaeta
Day: 0 41 84 0 41 84 0 41 84 129 148 170 204
Reactor: Control Cont.-FedCodigester
Phase 1 Phase 2
Pulse-FedCodigester
Pulse-FedCodigester v.2
Cont.-FedCodigester
129 148 170 204
seq_22471seq_22470seq_6994seq_284seq_193

C14
Supplemental Figure C5: Hill diversity numbers (qD) of orders (A) q=0, (B) q=1, and (C) q=2 for the experimental digester Bacteria 16S rRNA sequence libraries throughout Phases I and II. Calculations were made after normalizing read counts with DESeq2 to account for unequal sequencing depths. Error bars represent a standard deviation based on triplicate DNA extractions for each time point.
Phase 1 Phase 2
●●
●
●
●
●
●20
40
60
0 25 50 75 140 160 180 200Day
Seco
nd O
rder
Dive
rsity
(2D
)(E
quiva
lent
Num
ber o
f Tax
a)
Reactor
●
ControlContinuous−FedPulse
Phase 1 Phase 2
●
●●
●
●
●
●
100
150
200
250
0 25 50 75 140 160 180 200Day
Firs
t Ord
er D
ivers
ity(1D
)(E
quiva
lent
Num
ber o
f Tax
a)
Reactor
●
ControlContinuous−FedPulse
Phase 1 Phase 2
●
●
●
●●
●
●800
900
1000
1100
1200
0 25 50 75 140 160 180 200Day
Zero
Ord
er D
ivers
ity(0D
)(E
quiva
lent
Num
ber o
f Tax
a)Reactor
●
ControlContinuous−FedPulse
A
B
C
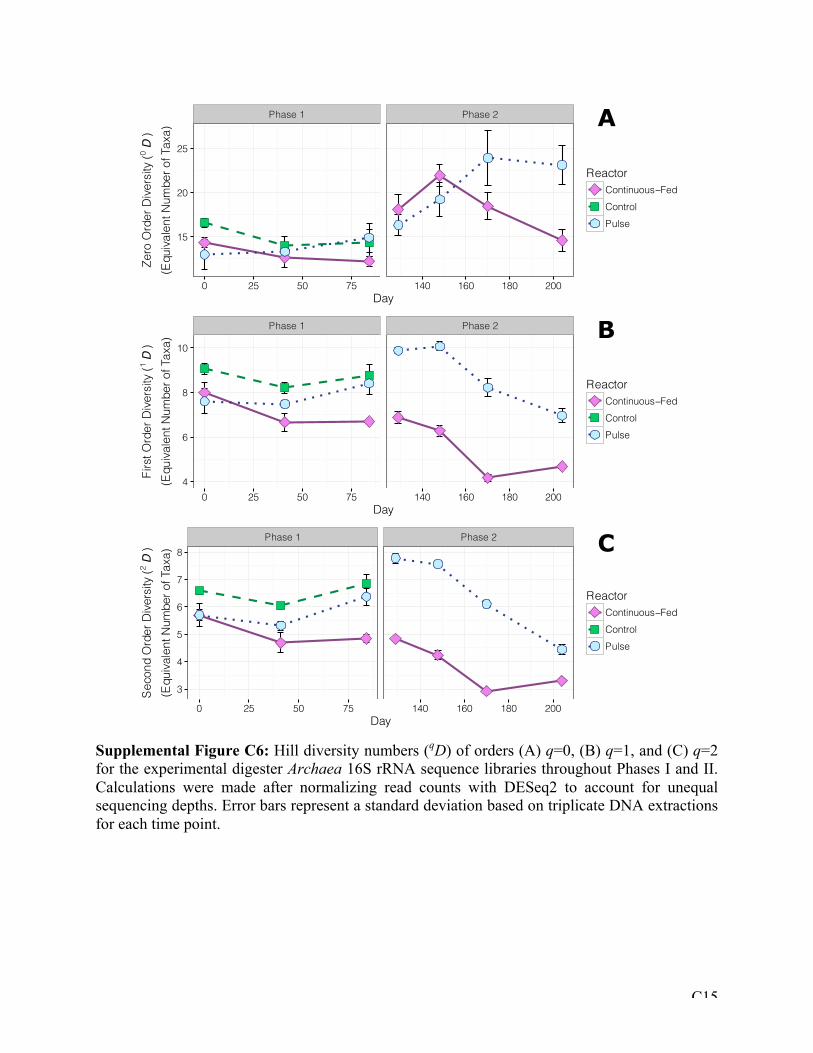
C15
Supplemental Figure C6: Hill diversity numbers (qD) of orders (A) q=0, (B) q=1, and (C) q=2 for the experimental digester Archaea 16S rRNA sequence libraries throughout Phases I and II. Calculations were made after normalizing read counts with DESeq2 to account for unequal sequencing depths. Error bars represent a standard deviation based on triplicate DNA extractions for each time point.
Phase 1 Phase 2
●●
●
● ●
●
●
3
4
5
6
7
8
0 25 50 75 140 160 180 200Day
Seco
nd O
rder
Dive
rsity
(2D
)(E
quiva
lent
Num
ber o
f Tax
a)
Reactor
●
Continuous−FedControlPulse
Phase 1 Phase 2
● ●
●
● ●
●
●
4
6
8
10
0 25 50 75 140 160 180 200Day
Firs
t Ord
er D
ivers
ity(1D
)(E
quiva
lent
Num
ber o
f Tax
a)
Reactor
●
Continuous−FedControlPulse
Phase 1 Phase 2
● ●●
●
●
●●
15
20
25
0 25 50 75 140 160 180 200Day
Zero
Ord
er D
ivers
ity(0D
)(E
quiva
lent
Num
ber o
f Tax
a)Reactor
●
Continuous−FedControlPulse
A
B
C

C16
Supplemental Figure C7: A phylogenetic tree of partial 16S rRNA gene sequences of the 6 Syntrophomonas OTUs selected in the multiple linear regression, along with other characterized Syntrophomonas species. 16S rRNA sequences of characterized species were retrieved from the NCBI database. The sequences were aligned with MUSCLE v3.8.31 (Edgar, R.C. (2004) Nucleic Acids Res, 32(5), 1792-97). The tree was constructed with ClustalW2 using the neighbor-joining method. Rendering was performed with iTOL (Letunic I. and Bork (2011) Nucleic Acids Res, doi: 10.1093/nar/gkr201).
seq
35
Syntrophomonas zehnderi strain OL-4 [N
R_044008.1]
Syntrophomonas palmitatica strain MPA [NR_112642.1]
seq 1083
Syntrophomonas curvata [NR_025752.1]
seq
154Syntrophomonas wolfei subsp. saponavida [HG970172.1]
Syntrophomonas wolfei subsp. m
ethylbutyratica strain 4J5 [NR_115800.1]
Syntrophomonas erecta subsp. sporosyntropha strain 5-3-Z [NR_115681.1]
seq
34
seq
58
seq
7128
Syntrophomonas cellicola [DQ288691.1]
Syntrophomonas w
olfei strain Goettingen G
311 [NR
_122058.1] Syntro
phom
onas
brya
ntii [H
E6540
06.1]
Syntrophomonas sporosyntrophas strain 4J7 [DQ112186.1]
Syntrophomonas
sapovorans strain OM
[NR_028684.1]Tree scale: 0.1

C17
Supplemental Figure C8: Linear regression of observed qmax, acetate values versus (A) the total Methanosaeta 16S rRNA gene concentration; and (B) the 16S rRNA gene concentration of 2 selected Methanosaeta OTUs (seq_193 and seq_284 from Fig. S4).
A
Continuous-fed
Pulse-fed
Reactor
●
Control
B
●
●
●
●
●
●
●
R2 = 0.51
P = 0.0011
Slope = 1.4e−09
40
80
120
0e+00 2e+10 4e+10 6e+10Methanosaeta 16S rRNA Gene Conc. (Copies/g VS)
Obs
erve
d q m
ax, a
ceta
te(m
L C
H4
/g V
S−d
)
●
●
●
●
●
●
●
R2 = 0.62P = 0.00032Slope = 1.02
0
50
100
150
0 50 100 150Predicted qmax, acetate (mL CH4 /g VS−d)
Obs
erve
d q m
ax, a
ceta
te(m
L C
H4
/g V
S−d
)

D1
APPENDIX D Supplemental Information for
Chapter 6:
DNA-stable isotope probing based metagenomics identifies key long-chain fatty acid degrading populations in parallel anaerobic codigesters with different oleate feeding
strategies
Number of Pages: 11 Number of Tables: 3 Number of Figures: 6 Contents: Supplemental Figure D1: Calibration curve of nd-TC versus the buoyant density D2 Supplemental Figure D2: Total DNA concentration for each density gradient fraction D3 Supplemental Figure D3: Genus and phylum level taxonomic assignments of 16S rRNA amplicon OTUs in the pulse-fed codigester that were significantly enriched in 13C
D4
Supplemental Figure D4: Genus and phylum level taxonomic assignments of 16S rRNA amplicon OTUs in the continuous-fed codigester that were significantly enriched in 13C
D5
Supplemental Figure D5: Venn-diagram of 13C enriched Syntrophomonas OTUs D5 Supplemental Figure D6: A phylogenetic tree of metagenomic GBs based on UPGMA clustering of in-situ DNA-DNA hybridization distances
D6
Supplemental Figure D7: Coverage values of KEGG ECs involved in interspecies hydrogen or formate transfer
D7
Supplemental Methods: Quantitative PCR D8 Supplemental Methods: Modeling Methane Production Kinetics D8 Supplemental Table D1: Summary of modeled methane production kinetic parameters D9 Supplemental Table D2: Characteristics of all genome bins enriched in 13C metagenomes D10 Supplemental Table D3: Read coverage values for all KEGG EC’s in Pathway Map 00071 D11

D2
Supplemental Figure D1: Calibration curve of temperature-corrected refractive index (nd-TC) versus the buoyant density of the CsCl/TE solution used during isopycnic separation of DNA.
●
●
●
●
●●
●
●
●
●
●●
●
●
●
●
●
●
●
●
●
R2 = 0.998Slope = 11.03Intercept = −13.76
1.400
1.405
1.410
1.415
1.70 1.75 1.80Buoyant Density (g/mL)
Ref
ract
ive In
dex
(nd−
TC)

D3
Supplemental Figure D2: Total DNA concentration measured by Qubit for each density gradient fraction recovered after isopycnic separation of DNA from the 13C-incubated microcosms and 12C-controls for both anaerobic codigester samples. The filled circles indicate gradient fractions that were selected and pooled for subsequent 16S rRNA amplicon sequencing and metagenomic sequencing. Each point represents an average of duplicate technical replicates.

D4
Supplemental Figure D3: Genus and phylum level taxonomic assignments of 16S rRNA amplicon OTUs in the pulse-fed codigester that were identified as significantly enriched in 13C samples versus 12C samples using DESeq2 (Love et al., 2014), along with their log2 fold change.
●●●●●
●
●●
●
●●●●●
●
●●●
●●●
●●●●●●●●
●
●●●●●
●●●●
● ● ●●●
●●
●●●
●●●
●●
●
●
●
●●
2
4
6
8
10
Syntrophomonas
Thermovirga
Aminivibrio
Syntrophothermus
Candidatus_C
loacamonas
Anaerofustis
Rum
inococcaceae_NK4A214_group
NA
Genus
Log2
Fol
d C
hang
e in
C13
vs.
C12
Phylum●●●●●●
FirmicutesSynergistetesSpirochaetaeCloacimonetesPlanctomycetesActinobacteria

D5
Supplemental Figure D4: Genus and phylum level taxonomic assignments of 16S rRNA amplicon OTUs in the continuous-fed codigester that were identified as significantly enriched in 13C samples versus 12C samples using DESeq2 (Love et al., 2014), along with their log2 fold change.
Supplemental Figure D5: Venn-diagram of Syntrophomonas 16S rRNA OTUs that were significantly enriched in 13C samples versus 12C samples for both codigesters.
●● ●●●●●●●
●
●●
●
●●●
●
●
●
●
●
●●●
●
●●
●●●
●
●●● ●●●
●●●
2
4
6
8
Syntrophomonas
Thermovirga
Syntrophothermus
Rum
inococcaceae_NK4A214_group
NA
Genus
Phylum●●●
Firmicutes
Synergistetes
Bacteroidetes
Log 2
Fol
d C
hang
e in
13
C v
s 12
C S
ampl
es
23
17
19
Pulse−Fed
Continuous−Fed
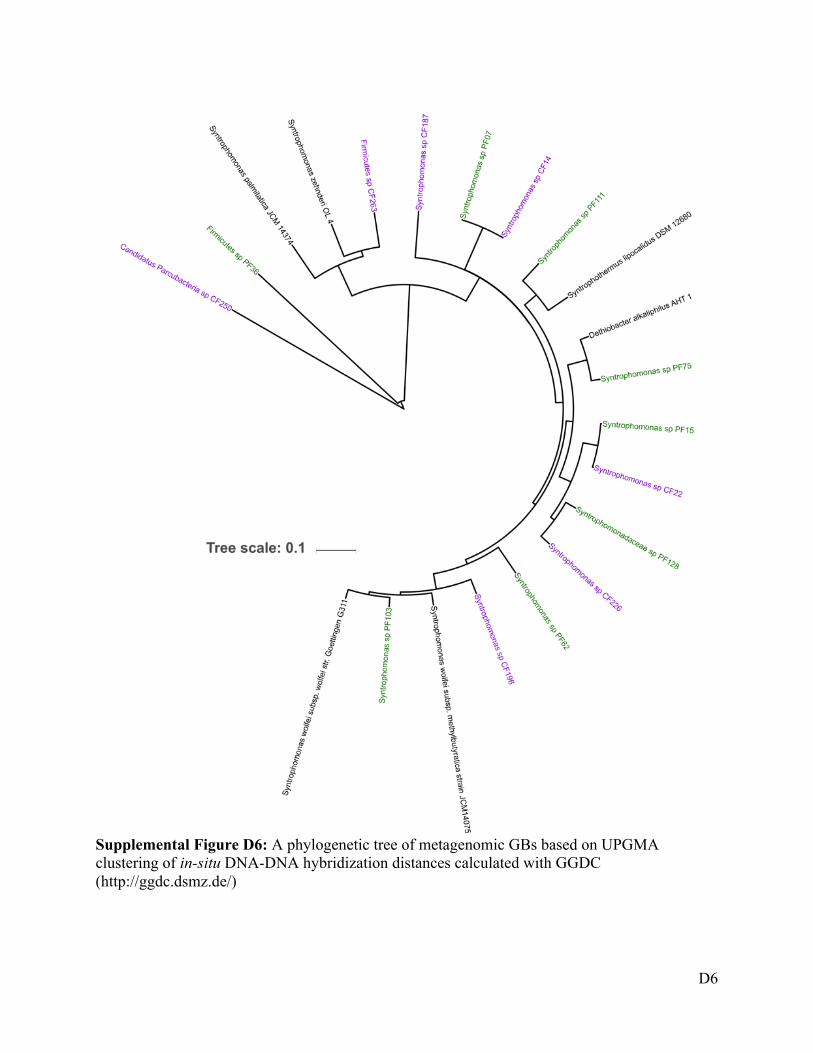
D6
Supplemental Figure D6: A phylogenetic tree of metagenomic GBs based on UPGMA clustering of in-situ DNA-DNA hybridization distances calculated with GGDC (http://ggdc.dsmz.de/)

D7
Supplemental Figure D7: Cumulative coverage values of KEGG ECs potentially involved in interspecies hydrogen or formate transfer based on all significantly enriched genome bins in the 13C-incubated samples for both codigester metagenome sets. Values from duplicate microcosms are shown for both codigesters, and the size of the marker is proportional to the log10 of the EC coverage.
● ●
● ●
● ●
● ●
● ●
● ●
● ●
● ●
● ●EC:1.12.1.3 NADP+−linked hydrogenase
EC:1.12.7.2 ferredoxin hydrogenase
EC:1.12.1.2 NAD+−linked hydrogenase
EC:1.2.1.43 NADP−dependent formate dehydrogenase
EC:1.2.1.2 formate dehydrogenase
Continuous−Fed Pulse−Fed
Coveragelog[(Reads/Mbp)]●
●
●
567
Reactor●
●
Continuous−FedPulse−Fed

D8
Supplemental Methods Quantitative PCR: qPCR analysis on 16S rRNA genes of the genus Syntrophomonas using the primers Synm-678-F
(CCWGGTGTAGCGGT) and Synm-738-F (TCAGGGYCAGTCCAG) and probe Synm-696-P
(TGCGTAGAAATCAGGAGGAAYACCAGT), developed by Ziels et al. (2015). The
hydrolysis probe was labeled with 6-FAM at the 5′end and BHQ-1 at the 3′ end. qPCR was
performed using a MasterCycler Realplex4 (Eppendorf). Each 20 µL reaction mix contained 5
µL DNA template, 2 µL PCR-grade water, 500 nM of each forward and reverse primers, 200 nM
of hydrolysis probe and 10 µL TaqMan™ Fast Advanced Master Mix (2X, Applied Biosystems).
All samples were analyzed in duplicate. No-template controls (NTCs) were included with each
qPCR run. Precipitated DNA from each CsCl density gradient fraction was diluted 1:10 in
nuclease-free water to prevent PCR inhibition. Calibration standards for the qPCR assays were
prepared as described by Ziels et al. (2015), and were included in duplicate in each qPCR run for
all target groups. Calibration standards included 108, 107
, 106, 105
, 104, 103
, and 102 gene copies per
reaction. The average slope of the calibration curve was -3.39 (97% PCR efficiency) for
Syntrophomonas, and the R2 value was above 0.99.
Modeling Methane Production Kinetics: A modified Gompertz equation was used to describe the inoculum-corrected methane production
kinetics in the samples incubated with 13C-labeled oleate and the 12C-controls:
where M is the accumulated methane (mL CH4) minus the blank control at time = t (days), P is
the maximum cumulative methane production (mL CH4), qmax is the maximum methane
production rate (mL CH4/hr), e is 2.7182818, and λ is the lag-phase time (hr). The model fitting

D9
and parameter standard error estimation was conducted with nonlinear regression in R version
3.0.2.
Supplemental Table D1: Summary of modeled methane production kinetic parameters determined by fitting the modified Gompertz equation to observed cumulative methane curves using nonlinear regression.
Feed Round Pulse-Fed Codigester Continuous-Fed Codigester
P (mL CH4)
qmax (mL CH4/hr) λ (hr) P
(mL CH4) qmax
(mL CH4/hr) λ (hr)
1 24.9 0.7 0.85 0.05 3.3 0.9 25.7 1.0 0.67 0.03 2.3 0.8 2 26.3 0.5 1.02 0.05 3.7 0.6 25.3 0.5 0.84 0.03 1.8 0.5 3 27.8 0.4 1.14 0.04 3.6 0.4 26.3 0.5 0.98 0.04 2.3 0.5

D10
Supplemental D2: Read coverage, taxonomic classification, and other characteristics of all genome bins that were significantly enriched in 13C metagenomes relative to 12C controls for both codigester sample sets. This set includes genome bins with less than 40% completeness.
Genome Bin I.D.
Coverage in 12-C Metagenomes
(reads/Mbp)a
Coverage in 13-C Metagenomes
(reads/Mbp) a
Log2 fold-
changeb
p - valueb Taxonomy c
Complete-
ness d GC Size
(Mbp)
Coding Density
d A B A B
Pulse-fed Codigester Genome Bins
bin.19 3.41E+04 2.83E+04 9.94E+05 1.11E+06 5.05 4E-224 Syntrophomonas 14% 39.8% 0.26 90%
bin.15 4.56E+04 3.95E+04 1.09E+06 1.24E+06 4.75 2E-207 Syntrophomonas 47% 41.4% 1.21 86%
bin.11 7.36E+04 6.67E+04 1.37E+06 1.59E+06 4.37 5E-180 Syntrophomonas 38% 43.7% 1.01 87%
bin.86 5.23E+03 3.59E+03 9.41E+04 8.51E+04 4.31 3E-119 Unresolved 0% 38.3% 0.25 88%
bin.75 1.12E+04 8.92E+03 1.84E+05 1.91E+05 4.20 1E-152 Syntrophomonas 90% 41.2% 2.10 89%
bin.62 1.31E+04 9.59E+03 1.61E+05 1.48E+05 3.75 3E-103 Syntrophomonas 97% 43.5% 2.66 87%
bin.137 5.48E+03 4.64E+03 6.56E+04 6.14E+04 3.63 1E-123 Syntrophomonas 23% 40.6% 1.08 86%
bin.103 1.11E+04 8.26E+03 1.13E+05 9.55E+04 3.41 5E-83 Syntrophomonas 57% 44.6% 1.12 85%
bin.36 3.16E+04 2.72E+04 2.97E+05 3.10E+05 3.35 1E-110 Firmicutes 85% 50.8% 1.60 90%
bin.87 1.77E+04 1.34E+04 1.53E+05 1.34E+05 3.19 5E-77 Syntrophomonas 18% 48.5% 0.53 89%
bin.111 1.13E+04 1.06E+04 9.55E+04 9.28E+04 3.09 3E-105 Syntrophomonas 89% 45.7% 3.38 88%
bin.2 3.48E+05 3.02E+05 2.54E+06 2.20E+06 2.85 9E-75 Syntrophomonas 39% 46.4% 0.70 91%
bin.7 1.61E+05 1.63E+05 1.04E+06 1.12E+06 2.73 2E-81 Syntrophomonas 74% 49.7% 1.27 89%
bin.128 9.25E+03 9.39E+03 5.86E+04 6.05E+04 2.66 8E-80 Syntrophomonadaceae 98% 46.4% 2.71 88%
bin.109 1.64E+04 1.48E+04 9.82E+04 9.11E+04 2.59 9E-69 Syntrophomonas 21% 47.4% 0.78 88%
bin.4 2.95E+05 2.92E+05 1.32E+06 1.52E+06 2.27 8E-53 Syntrophomonas 26% 53.3% 0.69 89%
Continuous-Fed Genome Bins
bin.22 3.36E+04 4.79E+04 9.06E+05 1.40E+06 4.69 2E-60 Syntrophomonas 74% 41.4% 2.00 86%
bin.15 7.76E+04 9.67E+04 1.45E+06 2.24E+06 4.29 1E-54 Syntrophomonas 22% 44.4% 0.54 87%
bin.170 4.91E+03 6.25E+03 6.43E+04 7.49E+04 3.56 2E-46 Syntrophomonas 36% 45.6% 0.59 85%
bin.20 9.19E+04 6.91E+04 6.21E+05 1.25E+06 3.42 3E-27 Syntrophomonas 7% 44.2% 0.25 88%
bin.17 1.42E+05 9.77E+04 8.46E+05 1.70E+06 3.29 2E-24 Syntrophomonas 31% 46.2% 0.55 90%
bin.142 8.10E+03 1.08E+04 9.25E+04 1.09E+05 3.34 3E-39 Syntrophomonas 7% 49.2% 0.27 90%
bin.283 8.56E+02 8.79E+02 6.68E+03 1.03E+04 3.21 3E-31 Unresolved 13% 45.8% 0.54 88%
bin.13 2.16E+05 1.39E+05 1.13E+06 2.28E+06 3.14 8E-22 Syntrophomonas 23% 48.5% 0.46 92%
bin.196 4.98E+03 4.92E+03 3.72E+04 5.87E+04 3.19 5E-32 Syntrophomonas 72% 42.9% 2.41 87%
bin.226 4.45E+03 3.67E+03 2.31E+04 3.77E+04 2.82 1E-23 Syntrophomonas 98% 47.6% 3.18 88%
bin.14 1.81E+05 1.74E+05 9.92E+05 1.32E+06 2.65 1E-26 Syntrophomonas 63% 49.7% 0.78 89%
bin.171 9.70E+03 9.16E+03 4.44E+04 6.36E+04 2.46 2E-21 Unresolved 0% 44.0% 0.44 85%
bin.213 8.07E+03 7.50E+03 3.63E+04 4.99E+04 2.42 3E-21 Unresolved 0% 39.0% 0.28 86%
bin.263 1.12E+03 1.22E+03 5.27E+03 7.88E+03 2.43 4E-20 Firmicutes 83% 50.6% 4.81 92%
bin.12 2.97E+05 3.06E+05 1.34E+06 1.92E+06 2.38 3E-20 Syntrophomonas 28% 52.9% 0.61 90%
bin.193 1.08E+03 7.62E+02 4.45E+03 4.89E+03 2.29 8E-17 Syntrophus 32% 53.4% 0.29 89%
bin.250 5.63E+02 4.61E+02 1.83E+03 2.85E+03 2.12 1E-11 Candidatus Parcubacteria 40% 30.8% 0.25 91%
bin.187 7.45E+03 8.50E+03 3.47E+04 3.78E+04 2.14 1E-19 Syntrophomonas 86% 45.6% 2.12 89% a Based on normalized read counts with DESeq2; b Determined with DESeq2; c Based on LCA of BLAST output; d Based on CheckM output
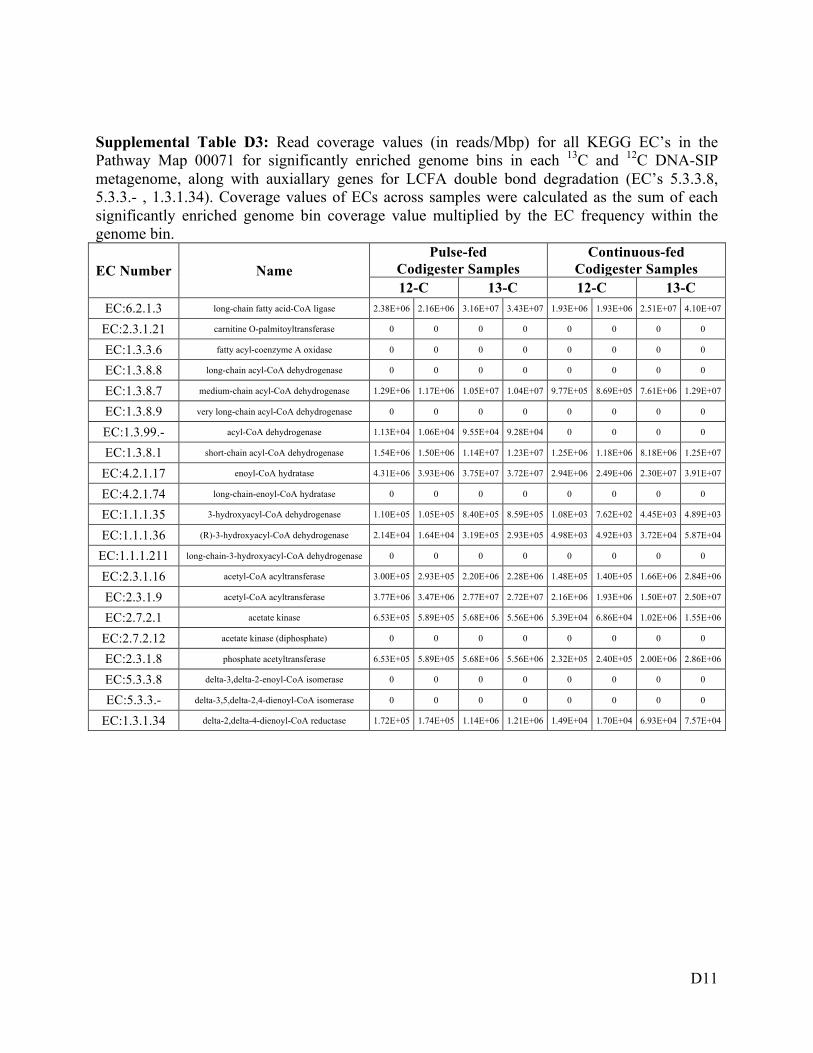
D11
Supplemental Table D3: Read coverage values (in reads/Mbp) for all KEGG EC’s in the Pathway Map 00071 for significantly enriched genome bins in each 13C and 12C DNA-SIP metagenome, along with auxiallary genes for LCFA double bond degradation (EC’s 5.3.3.8, 5.3.3.- , 1.3.1.34). Coverage values of ECs across samples were calculated as the sum of each significantly enriched genome bin coverage value multiplied by the EC frequency within the genome bin.
EC Number Name Pulse-fed
Codigester Samples Continuous-fed
Codigester Samples 12-C 13-C 12-C 13-C
EC:6.2.1.3 long-chain fatty acid-CoA ligase 2.38E+06 2.16E+06 3.16E+07 3.43E+07 1.93E+06 1.93E+06 2.51E+07 4.10E+07
EC:2.3.1.21 carnitine O-palmitoyltransferase 0 0 0 0 0 0 0 0
EC:1.3.3.6 fatty acyl-coenzyme A oxidase 0 0 0 0 0 0 0 0
EC:1.3.8.8 long-chain acyl-CoA dehydrogenase 0 0 0 0 0 0 0 0
EC:1.3.8.7 medium-chain acyl-CoA dehydrogenase 1.29E+06 1.17E+06 1.05E+07 1.04E+07 9.77E+05 8.69E+05 7.61E+06 1.29E+07
EC:1.3.8.9 very long-chain acyl-CoA dehydrogenase 0 0 0 0 0 0 0 0
EC:1.3.99.- acyl-CoA dehydrogenase 1.13E+04 1.06E+04 9.55E+04 9.28E+04 0 0 0 0
EC:1.3.8.1 short-chain acyl-CoA dehydrogenase 1.54E+06 1.50E+06 1.14E+07 1.23E+07 1.25E+06 1.18E+06 8.18E+06 1.25E+07
EC:4.2.1.17 enoyl-CoA hydratase 4.31E+06 3.93E+06 3.75E+07 3.72E+07 2.94E+06 2.49E+06 2.30E+07 3.91E+07
EC:4.2.1.74 long-chain-enoyl-CoA hydratase 0 0 0 0 0 0 0 0
EC:1.1.1.35 3-hydroxyacyl-CoA dehydrogenase 1.10E+05 1.05E+05 8.40E+05 8.59E+05 1.08E+03 7.62E+02 4.45E+03 4.89E+03
EC:1.1.1.36 (R)-3-hydroxyacyl-CoA dehydrogenase 2.14E+04 1.64E+04 3.19E+05 2.93E+05 4.98E+03 4.92E+03 3.72E+04 5.87E+04
EC:1.1.1.211 long-chain-3-hydroxyacyl-CoA dehydrogenase 0 0 0 0 0 0 0 0
EC:2.3.1.16 acetyl-CoA acyltransferase 3.00E+05 2.93E+05 2.20E+06 2.28E+06 1.48E+05 1.40E+05 1.66E+06 2.84E+06
EC:2.3.1.9 acetyl-CoA acyltransferase 3.77E+06 3.47E+06 2.77E+07 2.72E+07 2.16E+06 1.93E+06 1.50E+07 2.50E+07
EC:2.7.2.1 acetate kinase 6.53E+05 5.89E+05 5.68E+06 5.56E+06 5.39E+04 6.86E+04 1.02E+06 1.55E+06
EC:2.7.2.12 acetate kinase (diphosphate) 0 0 0 0 0 0 0 0
EC:2.3.1.8 phosphate acetyltransferase 6.53E+05 5.89E+05 5.68E+06 5.56E+06 2.32E+05 2.40E+05 2.00E+06 2.86E+06
EC:5.3.3.8 delta-3,delta-2-enoyl-CoA isomerase 0 0 0 0 0 0 0 0
EC:5.3.3.- delta-3,5,delta-2,4-dienoyl-CoA isomerase 0 0 0 0 0 0 0 0
EC:1.3.1.34 delta-2,delta-4-dienoyl-CoA reductase 1.72E+05 1.74E+05 1.14E+06 1.21E+06 1.49E+04 1.70E+04 6.93E+04 7.57E+04

RyanZielsCurriculumVitae
Phone:(360)739-9143Email:[email protected]
CURRICULUM VITAE IN SHORT (FOR MORE DETAILS, PLEASE SEE FULL CV) Ryan Ziels was raised within the Pacific Northwest in the city of Bellingham, Washington. Having developed a deep respect for the inspiring environment in the northwest region, Ryan sought an undergraduate degree in Environmental Resource Engineering (ERE) at Humboldt State University (HSU) in Arcata, California. During his undergraduate tenure, he was supported by the National Oceanic and Atmospheric Science’s Hollings Fellowship, which also provided him with his first research experience in environmental science and engineering. He graduated at the top of his class at HSU in 2011, receiving both the ERE Roscoe Schenler Award and Outstanding Graduate in ERE Award, as well as the Academic Excellence Award for the entire College of Natural Resources and Science. Having developed research skills in biological water treatment technologies through an NSF-funded undergraduate program, Ryan sought to further advance the field of environmental biotechnology by joining the graduate program in Civil and Environmental Engineering at the University of Washington (UW) in the group of Dr. David Stensel. He was awarded the prestigious NSF Graduate Research Fellowship in 2011 to support his graduate endeavors at the UW. He conducted his Master’s research at the UW on biodegradation of pharmaceutical estrogens during wastewater treatment, which resulted in several peer reviewed papers and international conference presentations. In 2013, Ryan commenced his PhD at the UW on anaerobic conversion of fats, oils, and greases for renewable methane production, which was supported by a U.S. EPA grant proposal that he primarily drafted. He was the recipient of the NSF Graduate Research Opportunities Worldwide (GROW) fellowship and UW Valle Scholarship in 2013, which supported his 8-month research exchange to the Biogas Research Center at Linköping University in Sweden. He received further support for his PhD research with a Department of Energy (DOE) Joint Genome Institute grant that he solely drafted. He was also the recipient of the prestigious Water Environment Foundation Canham Award in 2015. He received the NSF GROW fellowship a second time, to support his research exchange to the Laboratory of Microbiology at Wageningen University in the spring of 2016. Ryan expects to receive his PhD degree in Civil and Environmental Engineering from the UW in the fall of 2016.

RyanZielsCurriculumVitae
Phone:(360)739-9143Email:[email protected]
EducationalHistory
June2013-Current UniversityofWashington Seattle,WA
PhDCandidateinCivilandEnvironmentalEngineeringAdvisor:H.DavidStenselThesis:Microbialecologyanddegradationkineticsoffats,oils,andgrease(FOG)inanaerobicdigestionsystems.
Sept.2011–June2013 UniversityofWashington Seattle,WA
MSEinCivilandEnvironmentalEngineering
Advisor:H.DavidStenselThesis: Influence of Kinetic and Metabolic Selection on 17alpha-ethinylestradiolBiodegradationinActivatedSludgeWastewaterTreatmentSystems
Aug.2006–May2011 HumboldtStateUniversity Arcata,CA
BSinEnvironmentalResourcesEngineeringSummaCumLaude
ProfessionalHistory
Sept.2011-Current UniversityofWashington Seattle,WA
GraduateResearchAssistantResearch:Biologicaltreatmentprocesses:(1) Ecophysiologyofsyntrophicmicroorganismsdegradinglipidsandlong-chainfatty
acidsinbiogasprocesses§ Designed and operated anaerobic biogas reactors for converting fats, oils,
andgreasesintorenewablemethane§ Developed molecular microbiology approaches for assessing microbial
ecologyinbioreactors• Metagenomics, transcriptomics, amplicon sequencing, bioinformatics
quantitativePCR,stableisotopeprobing§ Conducted bioassays tomeasuremethane production rates and inhibition

Ryan Ziels University of Washington Email: [email protected]
kineticsfromlong-chainfattyacids§ DevelopedGC-FIDmethodfordetectingfreefattyacidsinreactorsamples
(2) Pharmaceutical biodegradation during activated sludge wastewater treatment
processes§ LC-MS/MS method development for quantification of steroid estrogens in
watersamples§ DesignedandoperatedpilottreatmentunitsatKingCountytreatmentplant.§ Conducted kinetic bioassays for measuring estrogen removal rates by
bacterialcommunities.§ Analyzedtreatmentprocessperformanceofpilotsystems
March2016-July2016LaboratoryofMicrobiologyWageningenUniversity
Wageningen,Netherlands
VisitingResearcher/NSFGraduateResearchOpportunitiesWorldwide(GROW)Fellow
Research:Developbioinformaticstechniquestoanalyzemetagenomicandtranscriptomicsequencingdatasetsfromstable-isotopeprobingexperimentsonsyntrophicanaerobiccommunitiesdegradingfattyacids.
June2013-Feb.2014LinköpingUniversityBiogasResearchCenter Linköping,Sweden
VisitingResearcher/NSFGraduateResearchOpportunitiesWorldwide(GROW)Fellow
Research:DevelopedquantitativePCR(qPCR)assaysandmetagenomicapproachestotargetsyntrophicbacterialpopulationsresponsibleforconvertingwastefats,oils,andgreaseintosubstratesformethaneinfull-scaleanaerobicdigesters.
May-August2010 ClarksonUniversity Potsdam,NY
NationalScienceFoundationREUFellowResearch:Operatedlab-scaleanaerobicdigesterstoinvestigatetheperformanceand
economicfeasibilityofanaerobicco-digestionofglycerolandwheywithmanure.
May-August2009NationalOceanicandAtmosphericAdministration
NorthwestFisheriesScienceCenterSeattle,WA
Ryan Ziels University of Washington Email: [email protected]
ErnestF.HollingsResearchFellowResearch:ModeledjuvenilesalmonmigrationthroughthenearshoreSkagitRiverdeltain
anefforttodesignandmodeleffectivehabitatrestorationstrategies.
January–August2008 RedwoodCoastEnergyAuthority Eureka,CA
EnergyEfficiencyInternImplementedEnergyWatchProgramProvidedanddesignedenergyconservationmeasurestocommercialbuildings
September2006-May2007 HumboldtStateUniversity Arcata,CA
EnergyManagementInternPlannedandperformedenergyauditsoncampusbuildingsImplementedenergy-savingprogramstoreducegreenhousegasemissions
TeachingExperience
2013-Current UniversityofWashington Seattle,WA
GuestLecturerTaughtlecturesforthecourses:§ BiologicalTreatmentSystems(CEE541)§ WastewaterTreatmentandReuse(CEE482)
2008-2011 HumboldtStateUniversity Arcata,CA
InstructionalStudentAssistantClassesTaught(undersupervisionofprofessor):WaterQualityLaboratoryComputationalMethodsforEnvironmentalEngineeringLaboratoryIntroductiontoEnvironmentalScienceandEngineeringLaboratory
Peer-RefereedPublications Ziels, R.M.,Karlsson, A., Beck, D. A. C., Ejlertsson , J., Yekta S., Bjorn A., Stensel, H. D.,
Svensson,B.H.(2016)Microbialcommunityadaptationinfluenceslong-chainfattyacid conversion during anaerobic codigestion of fats, oils, and grease withmunicipalsludge.WaterResearch.103,372-382doi: 10.1016/j.watres.2016.07.04

Ryan Ziels University of Washington Email: [email protected]
YektaS.,ZielsR.M.,BjörnA.,SkyllbergU.,EjlertssonJ.,KarlssonA.,SvedlundM.,WilenM., Svensson B.H. (2016) Effects of sulfide on anaerobic digestion of iron-richprimaryandactivatedsewagesludge.UnderReviewatWaterResearch
Ziels,R.M.,Beck,D.A.C.,Marti,M.,Gough,H.L.,Stensel,H.D.,Svensson,B.H.(2015)
Monitoring the dynamics of syntrophic β-oxidizing bacteria during anaerobicdegradation of oleic acid. FEMS Microbiology Ecology. 91(4) doi:10.1093/femsec/fiv028
Lust,M.J.,Ziels,R.M.,Strand,S.E.,Gough,H.L.,Stensel,H.D.(2015)Biodegradation
kinetics of 17alpha-ethinylestradiol in activated sludge treatment processes.EnvironmentalEngineeringScience.32(7)doi:10.1089/ees.2014.0467
Ziels,R.M.,Lust,M.J.,Gough,H.L.,Strand,S.E.,&Stensel,H.D.(2014).Influenceof
BioselectorProcesseson17α-EthinylestradiolBiodegradationinActivatedSludgeWastewaterTreatmentSystems.Environmentalscience&technology,48(11),6160-6167.doi:10.1021/es405351b
ConferenceProceedingsandOtherNon-JournalArticlesReviewedbyAbstractOnly:
Ziels,R.M.,KarlssonA.,Ejlertsson,J.,Yekta,S.,Bjorn,A.,Stensel ,H.D.,Svensson,B.H.DynamicsOfSyntrophicLCFA-degradingBacteriaDuringCo-digestionOfFOGWithMunicipal Sludge. Proceedings of the 14th IWA World Congress on AnaerobicDigestion(AD14),ViñadelMar,Chile,November2015.(Oralpresentation)
Ziels,R.M.,KarlssonA.,Ejlertsson,J.,Yekta,S.,Bjorn,A.,Stensel ,H.D.,Svensson,B.H.Importance of Syntrophic Long-Chain Fatty Acid-Degrading Bacteria DuringAnaerobicCo-DigestionofFOGWithMunicipalWastewaterSludge.ProceedingsoftheWaterEnvironmentFederation,Chicago,September2015.(Oralpresentation).
Ziels, R.M., Beck, D. A. C., Marti, M., Gough, H. L., Stensel, H. D., Svensson, B. H.Quantitative importance of syntrophic β-oxidizing bacteria during anaerobicdegradation of oleic acid. 2nd International Conference on Biogas Microbiology(ICBM),Uppsala,Sweden,June2014.(OralPresentation)
Ziels,R.M.,Ojong,P,Yekta,S.S.,Gustavsson,K.,Svensson,B.H.,Björn,A.,Ejlertsson,J.,Karlsson,A.Impactsofco-digestingwastevegetableoilwithprimaryandwasteactivatedsludgeonmicrobialcommunityandprocessperformance.GreenGasSwedenResearchOutlook,March2014.(OralPresentation)
Ziels,R.M.,Lust,M.J.,Strand,S.E.,Gough,H.L.,Stensel,H.D.InfluenceofKineticandMetabolicSelectionon17alpha-ethinylestradiolBiodegradationinActivatedSludgeWastewaterTreatmentSystems.Proceedingsofthe8thIWASpecializedConferenceonAssessmentandcontrolofmicropollutantsandhazardoussubstancesinwater:Micropol&Ecohazard,Zurich,Switzerland,June2013.(OralPresentation)
Ryan Ziels University of Washington Email: [email protected]
Ziels,R.M.,K.Venkiteshwaran,S.J.Grimberg.Organicloadingeffectsonacidificationduringthetwo-phasedanaerobicco-digestionoflactosewithdairymanure,37thNorthEastRegionalMeeting(NERM)oftheAmericanChemicalSociety(ASC),Potsdam,NY,June2010.(PosterPresentation)
Ziels,R.M.,K.Venkiteshwaran,S.J.Grimberg.Effectofsubstrateandorganicloadingonthetwo-phasedanaerobicco-digestionofglycerolandlactosewithdairymanure.SymposiumforUndergraduateResearchExperience,Potsdam,NY,July2010.(OralPresentation).
Ziels.R.M.,andC.Greene.Modellingjuvenilesalmonmigrationthroughthenearshoreusing individual-based modeling techniques. NOAA Science and EducationSymposium,SilverSpring,MD,July2009.(PosterPresentation).
HonorsandAwards• WaterEnvironmentFoundation(WEF)CanhamScholarAward(2015)• NationalScienceFoundation(NSF)GraduateResearchOpportunitiesWorldwide
Awardee;LaboratoryofMicrobiology,WageningenUniversity,Netherlands(2015)• GarrM.JonesScholarship,Brown&Caldwell(2014)• UniversityofWashingtonValleFellowship(2013)• NationalScienceFoundation(NSF)GraduateResearchOpportunitiesWorldwide
Awardee;BiogasResearchCenter,LinköpingUniversity,Sweden(2013)• NationalScienceFoundation(NSF)GraduateResearchFellowship(2011)• AcademicExcellenceintheCollegeofNaturalResourcesandScience,Humboldt
StateUniversity(2011)• OutstandingGraduateinEnvironmentalResourceEngineering,HumboldtState
University(2011)• NationalOceanicandAtmosphericAdministration(NOAA)ErnestE.Hollings
ScholarshipAward(2008-2010)• AmericanCouncilofEngineeringCompanies(ACEC)CaliforniaScholarshipAward
(2010)• Roscoe&SchenlerEngineeringExcellenceScholarshipAward,HumboldtState
University(2009)
FundedResearchProposals§ Community Science Program – Small scale Metagenome Project (U.S. DOE, Joint
Genome Institute, $90,000 worth of sequencing granted, 2015-2016) (Co-PI, solelydraftedresearchproposal)
§ Water Environment Research Federation National Research Center forResourceRecoveryandNutrientManagement(U.S.EPA,STAR_N3R14A,$218,348,2013-2016)(wasamajorcontributortodraftingresearchproposal)

Ryan Ziels University of Washington Email: [email protected]
ProfessionalandAcademicSocieties
WaterEnvironmentFederation(WEF),MemberAmericanSocietyofCivilEngineers,MemberCaliforniaWaterEnvironmentAssociation(CWEA),NorthCoastChapter,StudentLiaison
(2008-2011)RenewableEnergyStudentUnion,HumboldtStateUniversity(2006-2011)CampusCenterforAppropriateTechnology,HumboldtStateUniversity(2006-2011)
ProfessionalCertificationsEngineerinTraining(EIT)