copyright by ryan patrick griego 2016
TRANSCRIPT

Copyright
by
Ryan Patrick Griego
2016

The Thesis Committee for Ryan Patrick Griego
Certifies that this is the approved version of the following thesis:
FINDING LEADING INDICATORS TO PREVENT PREMATURE
STARTS, ASSURING UNINTERRUPTED CONSTRUCTION
APPROVED BY
SUPERVISING COMMITTEE:
Fernanda Leite
Howard Liljestrand
John Borcherding
Supervisor:
Co-Supervisor:

FINDING LEADING INDICATORS TO PREVENT PREMATURE
STARTS, ASSURING UNINTERRUPTED CONSTRUCTION
by
Ryan Patrick Griego, B.S.
Thesis
Presented to the Faculty of the Graduate School of
The University of Texas at Austin
in Partial Fulfillment
of the Requirements
for the Degree of
Master of Science in Engineering
The University of Texas at Austin
May 2016

Dedication
Dedicated to those who design and shape the built environment.

v
Acknowledgements
I would first like to thank my advisor and mentor, Dr. Fernanda Leite, for keeping
this research project on-track and for always offering me a helping hand whenever I
became stuck or had a question. This research project has been a tremendous opportunity
for me and I am sincerely grateful for all of the help you have provided. I also want to
thank Dr. John Borcherding who served on my thesis committee and provided me
valuable feedback.
I also want to thank the members of the Construction Industry Institute (CII)
Research Team 323 for their collaboration and guidance throughout the creation of this
document. Their industry expertise and input has truly been a benefit to the body of
knowledge of the construction industry and this research project would not be the same
without them. In addition, I would also like to thank fellow classmate Arturo Monarrez
for the sleepless nights programming the PSIA.
I want to thank CII and the University of Texas at Austin for making these
endeavors financially feasible. I also want to thank the Ronald E. McNair Program for
inspiring me to take the leap of exploring higher education. And finally, I would like to
thank my family and friends who were always there for me when things got difficult,
pushed me to always try a little bit harder, and inspired me to never give up.

vi
Abstract
FINDING LEADING INDICATORS TO PREVENT PREMATURE
STARTS, ASSURING UNINTERRUPTED CONSTRUCTION
Ryan Patrick Griego, MSE
The University of Texas at Austin, 2016
Supervisor: Fernanda Leite
Co-Supervisor: Howard Liljestrand
Nearly every project in the Architecture, Engineering, and Construction (AEC)
industry has at least one stakeholder who perceives a benefit from an early start to
construction. As a result, project teams face pressure to begin construction, whether or
not they are in fact ready. In order to begin early mobilization, engineering design
drawings are then rushed and assumptions left unmitigated, resulting in inaccurate plans
and, often, unrealistic schedules. The construction phase of the project is then impeded by
costly interruptions and holds. When these interruptions occur, project teams often react
by spending more money and crashing schedules even further in order to make up for the
interruptions, causing additional strain on all project stakeholders.
This research sets out to investigate premature starts to construction and to
document drivers, leading indicators, and impacts that can occur as a result. To prevent
these impacts and interruptions, the Construction Industry Institute (CII) commissioned
Research Team (RT) 323 to gain a better understanding of what constitutes a premature

vii
start to construction and what factors drive a premature start. The main objective of RT
323 was to first define what a premature start is, determine what drives a premature start,
understand what impacts occur as a result, and lastly, to investigate if there are any
leading indicators, or red flags, that could serve as early warning signs that the
construction phase of a project is mobilizing prematurely. Two research thrusts were
carried out in order to develop both a qualitative and quantitative understanding of
premature starts to construction. The secondary objective was to utilize this knowledge to
develop a tool, known as the Premature Start Impact Analysis (PSIA), which can be used
in the industry to prevent premature starts to construction. RT 323 envisions that such a
tool will be incorporated into project risk assessment and overall planning, and will
facilitate communication between stakeholders.

viii
Table of Contents
Table of Contents ................................................................................................. viii
List of Tables ...........................................................................................................x
List of Figures ........................................................................................................ xi
Chapter 1: Introduction ............................................................................................1
1.1. Purpose and Objective ...........................................................................2
1.2. Research Scope ......................................................................................3
1.3. Research Structure .................................................................................5
Chapter 2: Methodology ..........................................................................................6
2.1. Existing Knowledge ...............................................................................7
2.2. Data Acquisition ....................................................................................8
Chapter 3: Literature Review .................................................................................12
3.1. Overview ..............................................................................................12
3.2. Studies on Project Drivers ...................................................................12
3.3. Studies on Negative Project Outcomes ................................................16
3.4. Studies on Negative Project Outcome Avoidance and Practices .........19
3.5. Discussion ............................................................................................25
Chapter 4: Case Studies .........................................................................................26
4.1. Case Study 1: Cost and Schedule Driven Premature Start ..................28
4.2. Case Study 2: Owner Driven Construction ..........................................35
4.3. Case Study 3: Limited Capital Availability .........................................41
4.4. Case Study 4: Time to Market for Infrastructure Project ....................48
4.5. Case Study 5: Overly Aggressive Schedule for Early Time to Market54
4.6. Case Study 6: Incorrect Scope Assumptions .......................................60
4.7. Case Study 7: Governmental Agency Aggressive Time to Market .....66
4.8. Case Study 8: Unmitigated Assumptions and Late Permit Approval ..72
4.9. Discussion ............................................................................................79

ix
Chapter 5: Definitions ............................................................................................81
5.1. Driver Categories .................................................................................81
5.2. Leading Indicator Categories ...............................................................82
5.3. Impact Categories ................................................................................84
Chapter 6: Research Findings ................................................................................86
6.1. Qualitative Research Results ...............................................................86
6.2. Quantitative Research Results .............................................................89
6.3. Discussion ..........................................................................................104
Chapter 7: Premature Start Impact Analysis Tool ...............................................106
7.1. Development ......................................................................................106
7.2. PSIA Features ....................................................................................110
7.3. Deployment Recommendations .........................................................113
7.4. PSIA Deployment Demonstration .....................................................115
7.5. Sample Project 1 ................................................................................115
7.6. Sample Project 2 ................................................................................120
7.7. Example Application .........................................................................123
7.8. Limitations .........................................................................................125
Chapter 8: Lessons Learned .................................................................................127
8.1. Case Study and Survey Lessons Learned ..........................................127
8.2. PSIA Implementation Recommendations ..........................................130
Chapter 9: Conclusion and Recommendations ....................................................132
Appendix A: Survey ............................................................................................135
Appendix B: Pilot Case Study Questionnaire ......................................................137
Appendix C: In-Depth Case Study Questionnaire ...............................................138
References ............................................................................................................144
Vita ……………………………………………………………………………...147

x
List of Tables
Table 1: Ranking of the key cost-influencing factors (Cheng 2013) .....................14
Table 2: Field Rework Causes and Relationships (Rogge et al. 2001) ..................16
Table 3: Pilot Case Study Summary ......................................................................27
Table 4: Case Study 1 Premature Start Drivers, Leading Indicators, and Impacts 29
Table 5: Project summary of cost and schedule.....................................................30
Table 6: Case Study 2 Premature Start Drivers, Leading Indicators, and Impacts 35
Table 7: Project summary of cost and schedule.....................................................37
Table 8: Case Study 3 Premature Start Drivers, Leading Indicators, and Impacts 42
Table 9: Project summary of cost and schedule.....................................................44
Table 10: Detailed project summary of schedule ..................................................45
Table 11: Case Study 4 Premature Start Drivers, Leading Indicators, and Impacts49
Table 12: Project summary of cost and schedule...................................................50
Table 13: Case Study 5 Premature Start Drivers, Leading Indicators, and Impacts54
Table 14: Project summary of cost and schedule...................................................56
Table 15: Case Study 6 Premature Start Drivers, Leading Indicators, and Impacts61
Table 16: Project summary of cost and schedule...................................................62
Table 17: Case Study 7 Premature Start Drivers, Leading Indicators, and Impacts66
Table 18: Project summary of cost and schedule...................................................68
Table 19: Case Study 8 Premature Start Drivers, Leading Indicators, and Impacts73
Table 20: Project summary of cost and schedule...................................................75
Table 21: In-Depth Case Studies Summary ...........................................................87
Table 22: Premature Start Drivers, Leading Indicators, and Impacts ....................88
Table 23: Cost and schedule survey results. ........................................................104

xi
List of Figures
Figure 1: Diagram of Research Process ...................................................................6
Figure 2: Results from question one of the survey. ...............................................90
Figure 3: Further breakdown of the results from question one. .............................91
Figure 4: Survey respondents classified into CII defined industry sectors. ...........92
Figure 5: Question three of the survey ...................................................................93
Figure 6: Spider graph from question three of the survey .....................................95
Figure 7: Question four of the survey ....................................................................96
Figure 8: Spider graph from question four of the survey.......................................97
Figure 9: Results from questions five and six of the survey ..................................98
Figure 10: Premature start impacts plotted by severity and commonality. ............99
Figure 11: Spider graph from question five of the survey ...................................100
Figure 12: Spider graph from question six of the survey.....................................101
Figure 13: Premature start impact rating. ............................................................102
Figure 14: Combined impact commonality and severity data .............................103
Figure 15: PSIA Assessment Process Flow – Starting with Business Drivers ....107
Figure 16: PSIA Assessment Process Flow – Starting with Leading Indicators .107
Figure 17: Early Example of PSIA Graphical User Interface..............................108
Figure 18: Snippet of PSIA database ...................................................................109
Figure 19: PSIA Assessment Summary ...............................................................111
Figure 20: Driver selection and Leading Indicator selection pages. ....................112
Figure 21: An example of a complete report. ......................................................113
Figure 22: Sample Project 1 Example .................................................................116
Figure 23: PSIA output for Sample Project 1. .....................................................117

xii
Figure 24: Example expanded. ............................................................................118
Figure 25: New PSIA impact results. ..................................................................119
Figure 26: Sample project 1 driver. .....................................................................120
Figure 27: Sample project 1 leading indicators. ..................................................120
Figure 28: Sample project 2 PSIA impact results. ...............................................122

1
Chapter 1: Introduction
The Construction Industry Institute (CII) Research Team (RT) 323 was charted to
investigate premature starts to construction and to document drivers, leading indicators,
and impacts that can occur as a result. Early efforts of RT 323 involved defining what
constitutes a premature start to construction. In order to develop a basis of analysis, RT
323 defined a premature start as a decision, by at least one party, to start construction
with at least one risk that exceeds an acceptable tolerance to a party and which can result
in an interruption to construction.
With this definition, RT 323 hypothesized that various impacts occur as a direct
result of a premature start. Furthermore, RT 323 postulated that there existed drivers that
influence a premature start and leading indicators that could signal a premature start. This
motivated the team to determine to what extent is the commonality of these drivers and
leading indicators, and how severe are the impacts. RT 323 proposed that having this
information prior to mobilization could warn a project team that the construction phase is
beginning too soon and construction interruptions and negative outcomes are likely to
occur.
Even though there are numerous planning tools and templates, projects still
experience costly stops or holds. Moreover, since at least one stakeholder on virtually
every project benefits from a premature start to construction, project teams nearly always
feel pressure to begin construction—whether or not they are in fact ready. When a project
starts construction prematurely, the result is frequently that it experiences an interruption
to construction at least once. Complicating matters, when projects experience these stops
and starts, project teams often seem to react rather than take a proactive management
approach.

2
Research in this area is dated and generally more focused on project readiness,
effects of field rework, project change management, cost/schedule controls than on actual
investigation of premature starts. The focus throughout past research has been to improve
pre-project planning techniques and enhance coordination between stakeholders in order
to prevent these various impacts (Laufer 1991; Gibson and Dumont 1995; Walewski,
Gibson and Dudley 2003). However, very little research exists that investigates drivers
and impacts of premature starts to construction and what are early warning signs. New
research is needed to better document premature starts and their impacts. This
information could then be used to alert project stakeholders at all levels of an
organization. It was with this need in mind that the Construction Industry Institute (CII)
commissioned Research Team (RT) 323. First, a review of past literature was carried out
to understand what has been discussed regarding construction interruptions and what the
outcomes are followed by two research thrusts explained in section 1.2 of this chapter.
1.1. PURPOSE AND OBJECTIVE
The purpose of the research was to identify and document drivers and impacts of
premature starts to construction to establish whether there are leading indicators to signal
a premature start to avoid unintended construction interruptions. The objectives of this
research involve the following: (1) identify leading indicators that signal a potential
premature start, and (2) document drivers and impacts of premature starts to construction.
Contents of deliverables will cover the following areas:
1. Identify leading indicators associated with premature starts.
2. Describe the drivers and impacts of premature starts.
After performing these stages of research, RT 323 developed a Microsoft Excel-
based tool called the Premature Start Impact Analysis (PSIA) that incorporates the

3
research findings into an interactive tool that can be used in the industry by various team
members throughout the project lifecycle. The primary purpose of the PSIA is to identify
potential impacts based on leading indicators and drivers related to premature starts. The
tool then guides the user towards reference material and data validation compiled by RT
323, such as case studies and additional survey data. This information is presented in the
PSIA in conjunction with the anticipated impacts in order to alert the user of the
quantified impact data discovered by RT 323. The development process of the PSIA and
deployment recommendations are described in detail in Implementation Resource 323-2.
The outcome of this research will guide CII members and others involved on construction
projects to an improved understanding of the drivers, impacts, and leading indicators of
premature starts that can be used to improve project delivery.
1.2. RESEARCH SCOPE
The primary scope of this research involved reviewing past literature as well as
conducting survey and case study based research. Review of literature served as a basis
for how the research questions were developed and initial drivers, leading indicators and
impacts were identified. Because RT 323 was composed of members involved with a
wide range of project definitions, the primary research focus was on project types within
the expertise of the research team. Industry sector expertise ranges from heavy industrial
to governmental agencies and is made up of both owners and contractors. Given that
industrial construction projects are usually complex and involve several stakeholders,
project management teams deal with a high degree of uncertainty and risk. Therefore, RT
323 focused primarily on industrial construction projects. The scope was limited to the
impacts incurred during the construction phase of a project due to a premature start,
drivers and leading indicators prior to the premature start.

4
Two research thrusts were carried out in order to develop both a qualitative and
quantitative understanding of premature starts to construction. The first research thrust
focused on defining and documenting drivers and leading indicators associated with
premature starts. This thrust aimed at identifying any leading indicators that could signal
a premature start to help prevent construction interruptions. Impact data collected from
case studies was compared to the baseline scope, schedule, and cost of that particular
project. Research scope of the case studies looked at impacts incurred during the
construction phase of a project due to a premature start. The second research thrust
focused on quantifying discoveries made in research thrust one by conducting a survey.
The team chose to analyze drivers, impacts, and leading indicators in terms of
commonality, or the frequency of an occurrence on a construction project. Construction
impacts related to premature starts were observed in terms of commonality and severity.
Survey results were then partitioned by owner and contractor to determine whether or not
premature start perceptions differed from one project entity to another.
The main focus area of the research approach is limited to drivers, impacts, and
leading indicators. The primary goal of documenting drivers and impacts was to
quantitatively and qualitatively describe the types and impacts of premature starts
illustrated via in-depth case studies. Identification of leading indicators was also limited
to case studies and literature review but was extended through internal team validation.
The leading indicators were identified through case studies and literature, as described in
the Research Methodology section. Special efforts were taken to ensure that the case
studies were readable and accessible to a broad industry audience.

5
1.3. RESEARCH STRUCTURE
This thesis is divided into nine chapters that cover every aspect of the research
done by RT 323. Chapter 2 describes the research methodology and explains the research
structuring process and data collection approach. Chapter 3 will review past academic
journals and scholarly articles that served as points of departure for crafting the research
questions and for identifying gaps in knowledge. Chapter 4 contains in-depth case studies
conducted by RT 323. Each case contains a description of the project and how the project
outcome fits the definition of a premature start to construction and its pertinence to RT
323. After reviewing each case study, the research team began defining and categorizing
key terminology. These terms and definitions are found in Chapter 5. Chapter 6 includes
the research findings discovered by RT 323. Chapter 7 introduces the Premature Start
Impact Analysis (PSIA) tool, and discusses how it can be used in industry as a means of
detecting a premature start to construction. This chapter will discuss the tool development
process, features, example applications and deployment recommendations of the PSIA.
Chapter 8 will be a collective review of the lessons learned by RT 323 throughout the
research project. The ninth and final chapter concludes this research report by reviewing
the initial research objective and discussing how the research approach and results fit that
objective.

6
Chapter 2: Methodology
The research implemented by RT 323 consisted of review of existing literature,
in-depth case study analysis, and survey-based research. Prior to executing the data
collection phase of this project, RT 323 reviewed several research papers and looked
within the make-up of RT 323 to extract as much information as possible. The essential
question addressed by this research was: “What are the leading indicators to signal a
premature start to avoid unintended construction interruptions?” In order to answer this
question, RT 323 proposed two intermediate questions that explore the underlying cause
and effect of premature starts to construction. These two questions were:
1. What are the factors that drive a premature start to the construction phase?
2. What are the types and impacts of interruptions related to premature starts?
Throughout the research phase of this project, the research team chose to leverage
as much information from past research and from within the collective expertise of RT
323 participating members. Figure 1 outlines the research process take by RT 323.
Figure 1: Diagram of Research Process
7
To answer these questions, the research approach was broken down into two
separate thrusts in order to develop both a qualitative and quantitative understanding of
premature starts to construction. The qualitative thrust includes pilot case studies, in-
depth case studies, interviews of professionals on the project, and documentation of
lessons learned. The quantitative thrust involved a survey of industry professions in
various AEC disciplines.
2.1. EXISTING KNOWLEDGE
This section includes a detailed description of existing knowledge reviewed for
this research report. Because of the diverse nature of the research team, RT 323 derived
much of its knowledge base from members within the team; some of whom have over
twenty years of construction industry experience. This section will provide an overview
of collective team expertise and also describe the process of reviewing past studies and
journal articles.
2.1.1. Collective Team Expertise
RT 323 members came from various industry sectors with project definitions
ranging from the oil and gas industry to historical site renovations. The team held several
brainstorming sessions prior to conducting surveys and case studies in order to develop
comprehensive criteria for classifying a premature start. Many RT 323 members already
had a risk register of potential leading indicators and drivers from their organizations,
which helped inspire the categorical framework utilized by this research project. The
team also included individuals from organizations heavily involved with software and
graphical user interface development. Team members with this background helped design
a straightforward working environment for the PSIA so that the user experience can be as
seamless and as data rich as possible.

8
2.1.2. Literature Review
The literature review served as a point of departure for how the research question
was developed and what the study should focus on. Due to the limited research
discussion surrounding premature starts to construction, broad research topics such as
front end planning, effects of rework, risk assessment, and work packaging were
investigated. To serve as a means of analyzing a premature start in terms of what drives it
and what are some early warning signs, RT 323 searched for past studies that focused on
documenting and surveying multiple factors related to a certain outcome in order to serve
as a means of measuring current project status.
2.2. DATA ACQUISITION
The research team determined that two research thrusts would be needed in order
to develop a qualitative and quantitative understanding of premature starts to
construction. The first research thrust focused on identifying drivers and leading
indicators associated with premature starts. This thrust aimed at identifying if there were
any leading indicators that could signal a premature start to help manage/prevent these
construction interruptions, through case studies, related data, and literature review.
Leading indicators can help communicate to major project stakeholders the severity of
the potential outcome of a premature start to a project, illustrated through documented
cases. The primary research strategy of thrust one was case study research. The research
team followed a two-step analysis for the case studies. First was intra-case analysis which
focused on a description of a single project with a documented premature start, impacts,
drivers, and potential leading indicators. Second was cross-case analysis, which consisted
of a section cut of common information across all cases to identify commonalities and
patterns in drivers, impacts and leading indicators. For each case, the research team
identified key drivers that led to the premature start, the main interruption, and the
9
impacts of that interruption to construction. The ultimate objective was to find leading
indicators through understanding drivers – moving from post-mortem analysis to
proactive/leading indicator identification.
2.2.1. Qualitative Research Approach
The first research thrust focused on identifying drivers and leading indicators
associated with premature starts through case study based research. The purpose of
research thrust one was to gain a qualitative understanding of premature starts to
construction by implementing a research strategy known as “theory building case
studies” (de Vaus 2001). This strategy involves first hypothesizing about a certain
outcome and selecting cases that further develop the proposition. De Vaus explains that
“(i)n the theory building model, we begin with only a question and perhaps a basic
proposition, look at real cases and end up with a more specific theory or set of
propositions as a result of examining actual cases”. According to de Vaus, “analysis of
each case would aim to highlight differences between cases where it did and did not
work” (de Vaus 2001). This type of analysis would also involve looking at commonalities
of each case and formulating various propositions. It is with this that RT 323 chose to
pursue a qualitative approach to researching premature starts by theory building case
studies.
To accomplish this, research thrust one involved pilot case study submissions
from past projects completed by member of RT 323 that faced construction interruption.
After each pilot case study satisfied the definition of a premature start to construction,
select pilot cases studies were expanded upon as in-depth case studies. The following
sections will describe in detail the process taken to develop a well-defined and qualitative
understanding of premature starts to construction.

10
Pilot Case Studies
Case studies were completed in a three step process. First, a pilot case study was
submitted and reviewed by the research team in order to determine if the case was in fact
a premature start. Members of RT 323 received a questionnaire asking about basic project
information and what were some interruptions and impacts faced by the project team.
Each case study underwent a vetting process to see if the pilot case study was in fact a
premature start according to the definition derived by RT323. In order to qualify a project
as a premature start, the project had to: (1) have faced at least one instance where the
construction phase was interrupted, and (2) have a risk tolerance for a single party
exceeds acceptability prior to mobilization. If the pilot case study satisfied those two
items, it would move on to become and in-depth case study.
In-Depth Case Studies
If a pilot case study was deemed in fact a premature start, an interview with a
project member (project manager, project engineer, or supervisor) was conducted with a
member of project team to collect detailed information such as company profile, project
overview, cost and schedule information. The last step was to develop a write-up
describing what were the drivers of the premature start, what leading indicators or red
flags were available to the project team during construction, what impacts occurred as a
result, and what were the lessons learned. Information gathered from the case studies
were logged into a table and reviewed by the research team to determine commonality
amongst completed case studies.
2.2.2. Quantitative Research Approach
The second research thrust aimed at documenting the impacts of premature starts
to construction and quantifying the commonality of these documented drivers and leading

11
indicators, as well as commonality and severity of impacts. This thrust aimed at
describing the types and impacts of premature starts, illustrated through survey data. The
research team collected data through a survey, administered to both CII member
companies (through RT 323 direct contacts), as well as the Construction Users
Roundtable (CURT) membership during the 2015 CURT National Conference. The
objective was to support a quantitative description of the impacts of premature starts to
construction.
Survey
The survey consisted of eight questions. The first two questions were intended to
classify the respondents into owners and contractors with a breakdown of industry sector.
The purpose of this was to see if there was any difference in perception of the data
between groups. The next four questions employed a 5-point Likert scale. The research
team produced four versions of the survey to minimize the effect of recency and primacy
bias. Recency and primacy bias refers to a survey respondent’s recollection dependence
on the order of list items (Knoedler et al., 1999). The respondents’ memory of earlier test
items is best while recollection of middle and later list items worsens. Randomization of
survey list items across multiple survey samples reduces the bias over the entirety of the
survey results. The next four questions in the survey addressed drivers, leading indicators
(red flags), commonality of impacts, and severity of impacts. The final two questions of
the survey covered the respondent’s most recent project experience in terms of cost and
schedule growth, and captured approximate project value for their most recent project
relevant to this topic. The research team also asked for those who would be willing to
participate in a follow up interview.

12
Chapter 3: Literature Review
3.1. OVERVIEW
Review of literature served as a point of departure for how the research questions
were developed, and how drivers, leading indicators and impacts were identified. Due to
the limited research surrounding premature starts to construction, broad research topics
such as front end planning, effects of rework, risk assessment, and work packaging were
investigated.
3.2. STUDIES ON PROJECT DRIVERS
A speedy time-to-market with minimal field rework clearly has extensive business
value. Although this may be true, construction delays in the industry continue to plague
the global construction market and are becoming a typical characteristic of the
construction project lifecycle (Sambasivan and Soon 2007; Sweis et al. 2008). To
understand these current industry challenges, one paper investigated factors that extend a
project lifecycle and the frequency of each (Zidane et al. 2015). What the research
uncovered was that the top five causes of delay, referred to as “time-thieves”, are
“management and coordination”, “quality issues and errors”, “administration and
bureaucracy”, “decision issues” and “waiting”. It was noted that some of these factors
were more important to owners rather than contractors. Survey results indicated that the
“(t)he two first were important to all parties, of the three others were more important for
contractors and subcontractors less to the clients and sponsors”. Indication, or a red flag
warning system, of the potential factors for occurrence prior to them actually becoming
problematic was not extensively researched in the study.
When an organization experiences an interruption, project teams react by
spending additional capital on increased labor and speedier engineering documentation

13
delivery in order to get the project back on tract. This behavior often times has an adverse
effect and creates confusion, low quality drawings, and additional interruptions. One
study investigating complex industrial projects claims that they are subject to unique
types of risk (Li, Taylor, Ford 2011). The article claims “(o)ne such risk is the
combination of rework and increased project scope that can push a project from a
behavior mode of progress towards completion, past a tipping point, and into a behavior
mode of falling further and further behind”. A tipping point was considered to be a
threshold condition that, when crossed, internally threatens the success of a project
(Sterman 2000). The goal of the study was to determine a method of monitoring those
tipping points by understanding their dynamics. Understanding of tipping point
characteristics would then allow project teams to handle issues with a proactive approach
rather than being surprised and forced to react. The study created models and simulated
various project situations. An example of what Sterman (2000) discovered was that
certain well intended project control actions, such as overtime, pushed the project over
the tipping point and into various problems. A sensitivity analysis was done to understand
the extent of the negative project impact. Although this study covered actions taken
during the construction phase of a project, the research did not evaluate actions made
prior to construction mobilization.
According to a study investigating cost-influencing factors on construction
projects, cost overruns are a common problem in the construction industry (Cheng 2013).
The study claims that it is customary in the construction industry for contracts to bid low
in order to win the job, therefor, without controlling certain cost-influencing factors of
the project, construction companies will not be able to effectively control cost
expenditures. The purpose of the study was to investigate what those cost-influencing are
and how they could be monitored and controlled throughout the construction lifecycle of

14
a project. The study concluded that there were sixteen factors that showed a significant
degree of influence over project costs. These sixteen factors are shown in Table 1 along
with their severity index and rank.
Table 1: Ranking of the key cost-influencing factors (Cheng 2013).
Factor SI (severity
index)
Rank
Clearly define the scope of project in the contract 94.78 1
Cost control 94.78 1
Contract dispute (unclear drawings or guidelines/regulations 93.04 2
High fluctuation in commodity 89.57 3
The gap between the construction plan and the reality is too great 89.57 3
Material shortage or supply delay 89.57 3
Time management 88.7 4
Practical experience 87.83 5
Modifications to the scope of construction 86.96 6
The level of demand on quality 86.96 6
Project team (coordination capability and the understanding of operational
procedure)
86.96 6
Project valuation does not match the collected payment 86.09 7
Procurement contract 85.22 8
Geology, topography 84.35 9
Climate factor 82.61 10
Natural disaster 80 11
These factors were determined through surveys using the Kawakita Jiro (KJ)
method and the Modified Delphi method (MDM) with two groups and two rounds of data
collection. The paper argues that “(i)f construction companies can effectively control
these key factors and formulate prevention strategies, it is possible not only to avoid cost
overrun(s), but also to increase the overall profits for the project”. Impacts outside of
cost-overruns were not looked at in this study. Although cost overruns are a chronic

15
problem across most projects in the construction industry (Doloi 2011), there are a
multitude of impacts other than cost overruns that need to be evaluated.
Another study investigated the implementation of various innovative and non-
traditional practices and determined ten drivers that play a role in determining the use of
these practices within an organization (Vanegas et al. 1998). The purpose of this study
was to analyze the practices of reducing engineering cost and capital cost, and still
achieve business objectives. The main objectives were to evaluate different techniques,
identify innovative or non-traditional practices, and define the drivers that determine the
use of these practices. The report contains 10 of the practices, and explains what are the
benefits and risks for the company by adopting them.
Another research project utilizing the driver-impact research framework is CII RT
300 that addressed the impact of late deliverables to a construction project (Barry and
Leite 2014; Barry and Leite 2015; Barry et al. 2015). The process of determining the
impact of late deliverables began with developing a comprehensive list of indicators
through expert interviews, in-depth case studies and industry surveys. These studies set
the framework in which RT 323 would ultimately use to investigate drivers and leading
indicators that signal a premature start. RT 300 also developed a tool called the Late
Deliverables Risk Catalog (LDRC) designed to allow users to check late deliverables
such as “engineering equipment” or “external permits”. The tool then takes these inputs
and returns potential project impacts while also directing the user towards case studies
that supports the output. The tool utilizes a tree-like structure with collapsible categories
that allows a user to track specific details that pertain to the project being evaluated. The
LDRC was developed mainly for use by industrial sector construction projects. The intent
of the LDRC was not to mitigate problems caused by late deliverables but instead help
project teams identify potential issues prior to their occurrence (Barry and Leite 2014).

16
3.3. STUDIES ON NEGATIVE PROJECT OUTCOMES
Early inspiration of investigating drivers, leading indicators and impacts to
premature starts to construction as a means of predicting project success or failure was
found in a study by CII RT 153, whose objectives were to determine major causes of
rework, how to efficiently categorize and record factors, determine impacts on cost and
schedule, and identify practices to minimize the occurrence of rework (Rogge et al.
2001). RT 153 created a list (shown in Table 2) of potential predictors of field rework
using past projects as a benchmark and then conducted a survey to quantify and evaluate
the relationship of each predictor. What they discovered was that certain predictors had a
stronger influence to field rework than others.
Table 2: Field Rework Causes and Relationships (Rogge et al. 2001).
Field Rework Index (FRI)
Variable
Orig.
Quest
No.
FRI-EZ
Quest.
No.
Relationship with
Field Rework
Rating (r-
squared)
Significance
Level
Owner alignment 2 1 0.19 .00
Design rework 31 15 0.16 .00
Constructability commitment 33 16 0.16 .00
Interdisciplinary design
coordination
23 10 0.13 .00
Degree of project execution
planning
8 4 0.12 .00
Design firm’s qualifications 13 7 0.08 .00
Field verification 20 9 0.08 .00
Expected craft worker
availability
38 17 0.08 .00
Expected construction
overtime
39 18 0.07 .00
Engineering overtime 30 14 0.06 .00
Design leadership changes 19 8 0.05 .01
Design schedule compression 29 13 0.04 .01
Vendor prequalification 26 11 0.03 .02
Vendor information 28 12 0.03 .02

17
What the results from RT 153 indicate was that relationships between the various
items in the left column of Table 2 can be linked to negative construction outcomes; in
this case, field rework. This provided a starting platform for RT 323 to begin looking for
similarly influencing factors that could contribute to negative construction impacts that
are not necessary limited to rework. RT 323 chose to expand the scope and include
negative outcomes such as schedule delays and cost overruns.
Delay and disruption claims continue to be an area of uncertainty and a potential
area for dispute in the construction process (Critchlow et al. 2005). It is without doubt
that researching potential causes of construction interruptions and developing methods of
interruption avoidance can improve project team awareness and provide a proactive
management approach to eliminating disputes, litigation and claims. According to one
study that looks at delay and disruption claim avoidance, “(d)isruption costs are
essentially production related and, as such, are difficult to prove” (Aibinu 2009). What
the research suggests is that delay claims often stem from the construction phase of a
project and, as a result, are difficult to investigate because a contractor has limited means
of proving owner-driven delay that has negatively impacted construction-worker output
(Aibinu 2009). One cause of delays was identified as owner directed changes (Aibinu
2009). Owner directed changes were discovered to be potential “delay events that could
give rise to extension of time claims” because they disrupt the contractor’s work pace
leading to overall schedule slippage.
Owner directed change can also negatively impact labor productivity. According
to Ibbs (1994), change is defined as any addition, deletion, or revision to the general
scope of a contract (1994). Ibbs (2012) argues that when additions or deletions in scope
of work occur, the result is typically rework, schedule resequencing, schedule delay, and
possibly schedule suspension; each of which impact labor productivity (Ibbs 2012). With

18
this it becomes clear that change to project scope should be minimized. One study in
dispute avoidance and mitigation looks at project benchmarking of a contractors
performance (LaBarre and El-adaway 2013). The research looked at various reasons for
claims in construction including safety issues, design errors, changes, and delay. The
study went on to survey 40 construction contractors who did work for the U.S. Army
Corps of Engineers regarding various performance measures. The result of the research
was a benchmarking model that could provide contractors a means of mitigating
problems and issues that would have otherwise caused litigation and claims (LaBarre and
El-adaway 2013). The research was limited strictly to contractor performance and did not
review actions by project owners or other stakeholders.
According to another study, rework has become one of the most common
concerns on construction projects (Hwang, Zhao, Goh 2014). This research focused
mainly on client-related rework and found that rework occurs due to changes, defects,
and omissions. The research concluded that the client, rather than the contractor,
contributed most to rework. One recommendation from the study suggests that
developing a risk-register or knowledge transfer system of specific measures could
support the decision-making process to control the occurrence of rework. The scope this
research was also limited to projects based in Singapore.
Walewski et al. (2003) suggest that there are various risk factors that influence
construction cost and schedule performance from project conception to completion
(Walewski, Gibson and Dudley 2003). Some of these factors are inherent to organizations
that are solely responsible for managing them, whereas others are closely related to the
political, cultural, economic, and operational environments of the project’s location. With
this, it becomes clear that the search for factors that influence a projects outcome are not
limited to owner driven schedules, but also factors such as time to market, seasonal and

19
weather constraints, and financial obligations.
Regarding time to market, one study researched time to market as a project driver
and looked at associated implications (Mahmound-Jouini, Midlerm and Garel 2004). The
goal of the study was to understand management of time on Engineer-Procure-Construct
(EPC) projects from a time-to-delivery perspective. What the research found was that
concurrent engineering reduces time to market and has the potential to speed-up projects.
Mahmound-Jouini et al. (2004) warned however, that “(o)ne might think that in order to
reduce the delay of the project decisions must be made as quickly as possible.”
Additionally, “at the beginning of the project, understanding is too low a level and it
serves no purpose to make hasty decisions”. The paper states that “there is a risk of
getting off on the wrong track, possibly resulting in costly and time-consuming
modifications” (Mahmound-Jouini, Midlerm and Garel 2004). The decision to mobilize
field craft and heavy equipment and begin construction is a single decision that arguably
has the most financial and legal implication of the entire project. The extent of those risks
and what could be some indicators of those risks occurring was not looked at in the study.
3.4. STUDIES ON NEGATIVE PROJECT OUTCOME AVOIDANCE AND PRACTICES
Through reviewing past literature, RT 323 discovered many studies that
researched and developed some form of risk assessment or conflict avoidance tool that
can be applied to any project of carrying scope. These include items such as the Project
Definition Risk Assessment (PDRI), the Late Deliverables Risk Catalog (LDRC), the
International Project Risk Assessment (IPRA), and the Flash Track tool (Gibson and
Dumont 1995; Barry et al. 2015; Walewski, Gibson, and Dudley 2003; Austin, de la
Garza, Pishdad-Bozorgi 2015). These tools were developed by incorporating findings
from research that targeted specific aspects within the construction industry such as
20
stakeholder alignment, front-end planning, and constructability. This section will review
each of these industry practices and tools to gain a better understanding of what negative
project outcome avoidance techniques already exist and what knowledge gaps could be
closed.
The PDRI was developed by the CII Front End Planning Research Team 113 and
the Project Definition Rating Index (PDRI) for Industrial Projects Research Team 153
(Gibson and Dumont 1995; Gibson 1997). The Front End Planning Research Team was
commissioned to develop project tools that support both owners and contractors during
the pre-project planning stages of a construction project. The PDRI is an Excel-based tool
that serves as a checklist and allows users, typically all stakeholders on a given project, to
rate various project category elements. Research Team 113 also researched and defined
standardized construction terminology to incorporate into the PDRI in order to better
facilitate communication between all project stakeholders.
The categories and elements in the PDRI cover a broad range of pre-project items
such as “Equipment Scope”, “Site Information” and “Business Objectives” (Gibson and
Dumont 1995). The user of this tool is asked to score 70 weighted elements. A low score
for a category indicates the item is well defined while a high score indicates the item is
poorly defined. The total score of a project is out of 1000 points. The research showed
that successful projects scored less than 200 (Gibson and Dumont 1995). It is
recommended that scores for each element are to be determined by a group of project
team members with a neutral facilitator to lead the scoring process (Gibson and Dumont
1995).
One valuable feature of the PDRI is that each element is weighted according to
relative importance based on industry perception. During the research phase of
developing the PDRI, two workshops, involving 54 project managers and estimators from

21
the construction industry, were held so that each element could be weighted (Gibson and
Dumont 1995). These weighted elements then underwent a validation process which
involved surveying company representatives on 23 projects. The purpose of this was to
correlate PDRI scores with actual project success. Each company representative was
asked to refer back to the pre-design and pre-construction phase and determine how well
each element from the PDRI was defined at that time. The research team then developed
a method to determine project success based the relationship between pre-project
planning efforts and project success (Gibson and Dumont 1997). What was discovered
was a positive correlation between low PDRI scores and high project success.
During the development and validation of the PDRI, the research team found that
project team members and stakeholders often had conflicting criteria for determining
project success (Gibson and Dumont 1997). One of the biggest discoveries made by
developing the PDRI was not simply being able to give a project a score out of 1000, but
also allowing all project teams to understand and effectively communicate to all parties
the overall project objective (Gibson and Dumont 1995). This prompted the need for an
additional research team to investigate factors that affect project team alignment and how
it impacts project success (Gibson and Dumont 1997).
In an effort to establish standardized industry terminology, the Front End
Planning Research Team originally defined alignment as “the condition where
appropriate project participants are working within acceptable tolerances to develop and
meet a uniformly defined and understood set of project objectives” (Gibson and Dumont
1997). Under the guidance of the Front End Planning Research, CII published a follow-
up research report called “Team Alignment During Pre-Project Planning of Capital
Facilities” (Griffith and Gibson 1997). Using workshops, surveys and telephone
interviews, a list of 66 issues involving project team alignment were discovered. These

22
issues fell into separate categories such as “execution process” issues, “tools”,
“information”, and “company culture” (Griffith and Gibson 1997). From the list of 66
issues, 10 were deemed critical based on survey rankings and actual project data. The top
three critical alignment issues are “proper staffing of pre-project planning team with
representatives from all significant project stakeholders”, “develop and support effective
team leadership”, and “identify and communicate to all pre-project team members the
priorities between the project’s costs, schedule, and required features” (Griffith and
Gibson 1997). Using sample projects, the research team utilized the project success index
versus PDRI score developed by the Front End Planning research team and did a
regression analysis with 20 sample projects in order to understand if there was a
correlation between a PDRI score, alignment, and project success. The research
uncovered a positive relationship between alignment and project success. What this
allowed project teams to do is measure the degree of alignment attained on projects prior
to design and construction (Gibson and Dumont 1997). One limitation was mentioned in
the study and that is that the sample projects that were used to validate the alignment
versus project success were all large industrial projects.
Another study reviewed is on the topic of Constructability. CII initiated a
taskforce to determine which constructability practices are being used in the construction
industry and to qualitatively describe its benefits through documented cases.
Constructability refers to the “optimum use of construction knowledge and experience in
planning, design, procurement, and field operations to achieve overall project objectives”
(O’Connor and Tatum 1986). The objective of the taskforce was to determine how
constructability is currently applied based on past project characteristics. The second part
of the investigation looked at how constructability concepts apply to both design and
construction phases of a project. The goal was to then lump these characteristics into a
23
program that can be implemented to allow for constructability concepts to be applied to
any given project. To determine these key aspects of constructability, seven projects were
reviewed and constructability characteristics that apply to both construction and design
were recorded.
Through cross-case analysis, the task force determined that four common
characteristics were emphasized by projects who utilize a constructability program. The
number one characteristic is that “(o)wner and contractor (design and construction)
managers are committed to the cost effectiveness of the whole project. They recognize
the high cost influence of early project decisions” (O’Connor and Tatum 1986). Another
common characteristic is that designers are receptive to input from construction teams
and often times request feedback and evaluate recommendations objectively. The
research team summarized all of these characteristics and compiled key ingredients
required for a successful constructability program. This included clear communication of
constructability commitment, encourage teamwork, assign a single point-person to lead
the program, and start constructability as soon as possible (O’Connor and Tatum 1986).
Another research project that produced a tool is CII Research Team 311 that
looked at fast track projects in order to determine what industry practices are essential to
attain an even faster successful project delivery, known as “flash track project” (Austin,
de la Garza, Pishdad-Bozorgi 2015). The research team, recognizing the emergence and
prevalence of flash track construction projects, looked at how these projects could be
delivered efficiently by developing a complete understanding of every aspect of flash
track projects and creating a tool that obtains inputs regarding organizational capacity and
contract selection to planning and execution.
The research first identified flash track practices by reviewing literature and
interviewing personnel on EPC flash track projects (Austin, de la Garza, Pishdad-Bozorgi

24
2015). From the research, 66 practices were identified and later ranked using Analytical
Hierarchy Process. The ranks of each practice was determined by recruiting 64 individual
industry experts who had to meet minimum criteria in order to participate. This included
a minimum of fifteen years of experience in the EPC or AEC industry, five years in a
project leadership role, five years fast track project experience, and prior experience in at
least two phases of a project’s life cycle (Austin, de la Garza, Pishdad-Bozorgi 2015). RT
311 then incorporated the results into an Excel-based tool that helps users assess the
readiness of the project team prior to beginning a flash track project. The tool also
recommends strategies based on the users input to increase the likelihood of successful
project delivery.
The final research study reviewed that developed a research implementation tool
is from the CII Risk Management Integration Team (RT 181). The goal of the team was
to review and integrate risk management documentation into a tool called the Integrated
Project Risk Assessment (IPRA) (Walewski, Gibson, and Dudley 2003). The
development of this tool is based heavily on the same process utilized by the Front End
Planning Research Team that developed the PDRI. The main difference is that the PDRI
is meant to be used during the pre-planning stages of a project lifecycle while the IPRA is
designed to be used during all stages of a project lifecycle. Expert interviews from 26
upper mid- to upper-level management personnel were conducted from 26 organizations
made up of contractors and owners (Walewski, Gibson, and Dudley 2003).
Focus groups were then implemented during the research process to weight each
element. These expert interviews resulted in 82 risk elements grouped into 14 categories
representing the entire project life cycle from business plan evaluation to production and
operation. The IPRA also differs from the PDRI in that the user of the IPRA must include
a two-step input per element process rather than issuing a single value for each item. This
25
two-step process requests that the user provide a “likelihood” and “impact” score of each
risk element. To serve as a validation process, RT 181 conducted workshops with
industry professionals who used the IPRA in conjunction with past projects to see if
project success was correlated. The research stated that one limitation to the study is that
these projects were volunteered and could be biased towards successful projects while not
fully incorporating unsuccessful projects in the validation process. The time taken to
complete the IPRA with test subjects was one to four hours.
3.5. DISCUSSION
These studies inspired RT 323 to structure the research in a driver-leading
indicator framework. Because of the implication of incomplete engineering
documentation and abundance of field rework as a result, RT 323 chose to look at
engineering documentation as a potential leading indicator to signal a premature start.
After reviewing multiple sources, it became evident that drivers affect a project outcome
and contain one or more indicators that take place prior to the influencing factor.
Throughout the literature review, it became a main goal of RT 323 to determine exactly
what those leading indicators are, how they are defined within the context of the
construction industry, as well as how they can be quantified. RT 323 also chose to
develop a tool that incorporates the research findings into a user-friendly excel-based
environment. The goal was to also allow users to have quick and easy access to survey
data, case studies, and terminology developed by RT 323. This was chosen as an
objective so that projects teams can gain awareness and avoidance of beginning
construction prematurely.

26
Chapter 4: Case Studies
This section contains each in-depth case study. The case studies vary in project
scope, schedule, and budget. Project definition for these case studies include projects
related to infrastructure development, government funded renovations, and oil and gas
midstream facilities. Average baseline project cost for these case studies range from $2.4
million to $208 million (average: $64.2 million; median: $44.2 million). These results
from research thrust one serve as the framework for the creating the survey conducted in
the quantitative research thrust.
The case study research also served as an opportunity for the research team to
collect terminology from each scenario and to compare it to other scenarios of similar
outcomes. First the team identified key components that qualified the case as a premature
start to construction and categorized and defined each. This approach helped further
qualify each aspect of a premature start to construction. Definitions of each category can
be found in Chapter 5.
Two rounds of pilot case study place. Each pilot case study answered eight basic
question regarding project scope, cost, schedule, and interruption(s) that took place on the
project. Twenty pilot case studies were collected from the two rounds of submissions.
These pilot case studies were the starting point for the in-depth case studies. given that
they satisfied the definition of a premature start. After performing the first several in-
depth case studies, the team planned subsequent in-depth case studies. Of the twenty pilot
case studies, eight became in-depth case studies. For research thrust one, the team
followed a two-step case study analysis process as follows:
Intra-case analysis: description of a single project with a documented premature
start, impacts, drivers, potential leading indicators;

27
Cross-case analysis: section cut of common information across all cases to
identify commonalities and patterns in drivers, impacts and leading indicators.
For each case, RT 323 identified key drivers that led to the premature start, the
main interruption, and the impacts of that interruption to construction. See Table 3 for a
list of pilot and in-depth case studies.
Table 3: Pilot Case Study Summary
The twenty pilot case studies reflect the diversity of the construction projects and
include cases with varying levels of project definition. Each case also

28
identifies with various industry sectors, such as oil and gas to government renovation
project. The pilot case studies that fit the definition of a premature start to construction
are highlighted in grey in Table 3 and list basic project attributes. These in-depth case
studies are found below in the following sub-sections.
4.1. CASE STUDY 1: COST AND SCHEDULE DRIVEN PREMATURE START
This case study investigates the effects of having a government grant issued on
the basis of the completion of certain construction milestones and how it drove the
construction of a renewable energy plant. It will look at how time to market and an
aggressive owner schedule also influenced a premature start to construction and discuss
various impacts of that premature start in the project outcome. Table 4 identifies
(asterisked and highlighted in yellow) precisely which premature start drivers, leading
indicators and impacts occurred in this case.

29
Table 4: Case Study 1 Premature Start Drivers, Leading Indicators, and Impacts
Premature Start Drivers Leading Indicators Project Impacts *Owner Mandated Overly
Aggressive Schedule
*Engineering Documentation Not
Complete *Cost Overruns
Owner Perceived Benefit For Early
Start *Late Design Deliverables *Overtime / Unplanned Work
*Time to Market Unrealistic Schedule *Schedule Slippage
Seasonal / Weather Constraints Material Not Available *Out of Sequence Work
*Regulatory Compliance *Vendor Information Unavailable
Prior to Design *Rework
*Capital Availability Unmitigated Assumptions Poor Productivity
Contractor Eager to Get Started Unclear Project Objectives *Facility Start-up / Production
Delay
Contractor Perceived Benefit for
Early Start Lack of Regulatory License / Permits Scope Not Identified
Contractor Mobilization in Order to
Start Billing Unsupportive Management
Relationship / Reputational
Damage
Contract Terms in Place That
Incentivizes Mobilization *Poor Morale
*Safety Exposure
Litigation / Claims
*Failure to Attract / Maintain
Craft
Company Profile
The company involved in this case is a design-build contracting company
specializing in the design and construction of industrial facilities such as power plants,
oil, gas and chemical facilities, and other manufacturing facilities. The project
investigated in this case study is a renewable energy power plant located in the
northeastern region of the United States.
Project Overview
The project delivery type was Design/Build with a contract type of lump sum.
Funding for this project was supplemented by an American Recovery and Reinvestment
Act (ARRA) government grant which was to be awarded to the contractor upon the

30
completion of specified construction milestones. The first milestone that needed to be
achieved in order to qualify for the grant was the installation of a specified percentage of
building foundations. After the end of the fiscal year, the grant money would have
expired and would no longer be available to the contractor. Thus, a sense of urgency was
placed on completing the grant milestones which led to interruptions to the construction
phase of this project. In order to achieve this milestone, the equipment foundation design
process was accelerated and since the detailed equipment data sheets from the project
vendors were not yet available, conservative assumptions were made for equipment
loading. As a result, the foundation design was ultimately completed with less
information than is typical or ideal and led to many construction interruptions, involving
both the contractor and the subcontractor.
Table 5: Project summary of cost and schedule
Sector Power
Project Type Renewable Energy Power Plant
Construction Location New England, US
Contract Type Lump Sum
Baseline Project Cost (TIC) $208 million
Actual Project Cost (TIC) $240 million
Total Project Baseline Duration 24 months
Total Project Actual Duration 27 months
The premature start risk identified in this project was the acceleration of the
design process and subsequent start of construction for the equipment foundations. This
task is considered a risk because detailed equipment data sheets necessary for
comprehensive foundation designs were not yet available from the equipment vendors
when the foundation design started. The decision to start construction, despite the
aforementioned risk, was driven primarily by a government grant which was to be issued

31
to the contractor upon the completion of certain construction milestones.
Driver(s)
Throughout the course of this project two main drivers were identified; one being
the grant tied to certain construction milestones and other being the time to market push
by the contractor and owner, who both were owners in the power plant. As described
earlier in this case study each of these drivers caused interruptions in the construction
phase. The second driver identified in the project is directly related to time to market.
Being a co-investor in the project, the contractor shared risk with the owner in the sense
that they both perceived a benefit with an early start-up so that revenues from power
generation could commence as soon as possible. Because the contractor shared partial
stake in the operation of the plant, a larger emphasis was placed on getting the plant
producing power which required an aggressive schedule. In summary, the drivers
identified in this case were:
Owner Mandated Overly Aggressive Schedule
Time to Market
Regulatory Compliance
Capital Availability
Impact(s)
One impact of the accelerated foundation design process that caused interruptions
in the construction phase was fluctuations in manpower for the concrete subcontractor.
As soon as a foundation design for a piece of equipment was released for construction,
the foundation contractor increased manpower and completed the work. Once that
foundation was installed, the contractor reduced manpower and waited for the next set of
foundation drawings to be released. These fluctuations in manpower had significant cost

32
impacts as well as trade labor frustration, as steady work was not available. Key
personnel on the subcontractor team were lost due to the start/stop nature of the
foundation installation.
Another interruption to construction as a result of the accelerated foundation
designs was added rework. More than typical amounts of rework were reported as being
required as a result of the early and accelerated foundation designs. Excessive rework
increased worker safety exposure due to overtime and shift work in order to meet
milestones. Stacked resources also contributed to increased dangerous work zones. More
than typical amounts of rework, poor productivity, and an overly conservative concrete
design affected the overall quality of the project. Cost and schedule outcomes include not
being able to competitively negotiate price because of growing pressure to start
construction; total installed cost (TIC) was $240 million ($32 million more than the
contract cost). Also, although all construction milestones were met, overall construction
did not meet production date. The impacts of these interruptions are summarized below.
Cost Overruns
Out of Sequence Work
Overtime/Unplanned Work
Schedule Slippage
Rework
Poor Productivity
Scope Not Identified
Facility Start-up/Production Delay
Relationship/Reputational Damage
Poor Morale
Litigation/Claims
33
Safety Exposure
Failure to Attract/Maintain Craft
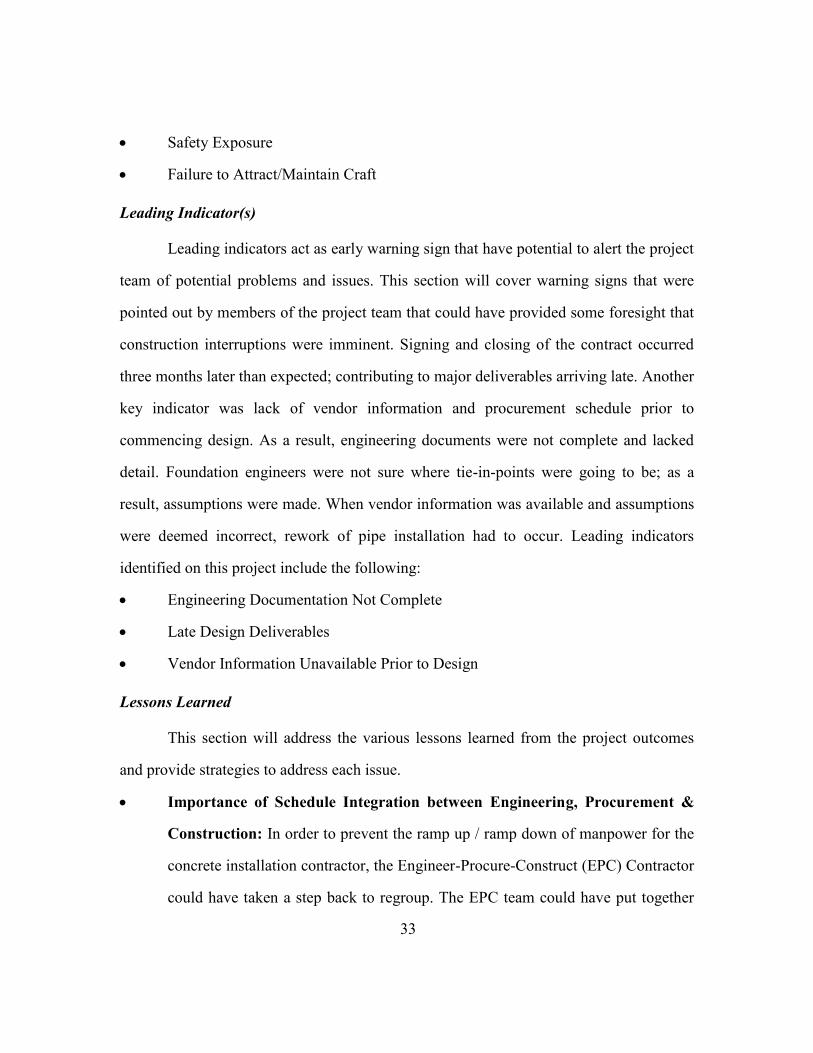
Leading Indicator(s)
Leading indicators act as early warning sign that have potential to alert the project
team of potential problems and issues. This section will cover warning signs that were
pointed out by members of the project team that could have provided some foresight that
construction interruptions were imminent. Signing and closing of the contract occurred
three months later than expected; contributing to major deliverables arriving late. Another
key indicator was lack of vendor information and procurement schedule prior to
commencing design. As a result, engineering documents were not complete and lacked
detail. Foundation engineers were not sure where tie-in-points were going to be; as a
result, assumptions were made. When vendor information was available and assumptions
were deemed incorrect, rework of pipe installation had to occur. Leading indicators
identified on this project include the following:
Engineering Documentation Not Complete
Late Design Deliverables
Vendor Information Unavailable Prior to Design
Lessons Learned
This section will address the various lessons learned from the project outcomes
and provide strategies to address each issue.
Importance of Schedule Integration between Engineering, Procurement &
Construction: In order to prevent the ramp up / ramp down of manpower for the
concrete installation contractor, the Engineer-Procure-Construct (EPC) Contractor
could have taken a step back to regroup. The EPC team could have put together

34
an execution schedule that grouped portions of the foundations into design
packages (e.g. 50% of the foundations). That design package could then be
released for construction and allowed the Civil Contractor to work steadily. The
second design package could have been released at the time the first set of
foundations was completed to allow additional steady, uninterrupted work for the
Civil Contractor. This could have potentially reduced costs, improved morale, and
maintained a predictable overall project schedule.
Conduct a detailed risk analysis on front end costs vs. potential benefits: In
this project, the completion of the commercial agreement occurred three months
after the date that it was originally planned. However, the end date of the project
did not change. In retrospect, the EPC Contractor and Owner could have jointly
moved forward with detailed design during the time period that the commercial
agreement was in negotiation. The risk (and associated sunk costs) of moving
forward with the detailed design was much lower than then risk (and associated
sunk costs) of compressing the EPC schedule for the overall project. The team
could have conducted a risk analysis at this point in the project and have
potentially saved the project from cost and schedule impacts.
Front end evaluation of available resources and their allocation to the
project: During FEED, the EPC team could have performed a more detailed
analysis of available resources and the plan for allocation of those resources to the
project. For this project, there were resource shortages that were not discovered
until those shortages were impacting cost and schedule.

35
4.2. CASE STUDY 2: OWNER DRIVEN CONSTRUCTION THROUGH OVERLY
AGGRESSIVE SCHEDULE
This case study investigates the effects of having an owner mandated aggressive
schedule and how it drove the construction of a $55 million dollar chemical plant. It will
also look at how an owner’s perceived benefit for early start-up influenced a premature
start to construction and discuss various impacts of that premature start in the project
outcome. Table 6 identifies (asterisked and highlighted in yellow) precisely which
premature start drivers, leading indicators and impacts occurred in this case.
Table 6: Case Study 2 Premature Start Drivers, Leading Indicators, and Impacts
Premature Start Drivers Leading Indicators Project Impacts *Owner Mandated Overly
Aggressive Schedule
*Engineering Documentation Not
Complete *Cost Overruns
*Owner Perceived Benefit For
Early Start *Late Design Deliverables *Overtime / Unplanned Work
Time to Market *Unrealistic Schedule *Schedule Slippage
Seasonal / Weather Constraints *Material Not Available *Out of Sequence Work
Regulatory Compliance *Vendor Information Unavailable
Prior to Design *Rework
Capital Availability Unmitigated Assumptions *Poor Productivity
Contractor Eager to Get Started Unclear Project Objectives *Facility Start-up / Production
Delay
Contractor Perceived Benefit for
Early Start Lack of Regulatory License / Permits *Scope Not Identified
Contractor Mobilization in Order to
Start Billing *Unsupportive Management
*Relationship / Reputational
Damage
Contract Terms in Place That
Incentivizes Mobilization Poor Morale
*Safety Exposure
Litigation / Claims
Failure to Attract / Maintain
Craft

36
Company Profile
The company responsible for construction on this project is a large Engineering-
Design-Construction (EPC) Contractor located in North America. The Contractor has
extensive experience in oil and gas, infrastructure, power, and industrial markets and is
one of the largest providers of engineering, construction, and technical services in the
world.
Project Overview
This case study looks at a brownfield project belonging to the heavy industrial
subsector. The project delivery type was EP-C where the Owner was responsible for the
engineering and procurement while the Construction Contractor was responsible only for
the construction. The contract type was cost reimbursable. This Construction Contractor
had no prior business relationship with this particular client and was currently facing an
aggressive Owner mandated schedule to complete construction by July 2013. After
accepting the terms of the contract the contracting company mobilized for construction.
The Construction Contractor then encountered several issues with engineering design,
fabrication and equipment, and material delivery. Significant design errors became
prevalent and materials were arriving out of sequence and contained deficiencies. An
overall critical path in the schedule could not be determined by the Construction
Contractor and many of the Owner mandated construction sequences were considered
disruptive and contradictory to typical flow of construction.
The status of engineering and procurement was unclear before the contract was
awarded to the Construction Contractor; however, it was assumed to be sufficient per
Owner information. During construction, the Owner did not provide items such as
materials purchasing order information to the Construction Contractor. The Construction
Contractor did not know when materials and equipment would be arriving to the

37
construction site for installation. Initially, the Construction Contractor maintained a low
level of craft to align with available engineering and procurement information. Because
of the lack of material and equipment delivery information from the Owner, the
Construction Contractor did an independent review of engineering and procurement
phases to better understand what was needed to continue construction. After these
reviews were conducted and several design and fabrication errors became apparent, it
became clear to the Construction Contractor that there were scope definition issues and
additional resources would be required in order to meet the Owner’s completion date of
July 2013. Several schedule revisions including additional craft resources and double
shifting were provided to the client by the Construction Contractor that ultimately set a
projected completion date of December 2013, well beyond the intended completion date
desired by the Owner. The Owner did not accept the December completion forecast and
directed the new completion date to be in September 2013. Table 7 summarizes the
various cost and schedule implications due to the aggressive schedule and project team
reacting address the heavy burden of meeting the Owner’s scope requirements.
Table 7: Project summary of cost and schedule
Sector Industrial
Project Type Chemical Company
Construction Location USA
Contract Type Cost Reimbursable
Baseline Project Cost (TIC) $55 million
Actual Project Cost (TIC) $135 million
Total Project Baseline Duration 10 months
Total Project Actual Duration 15 months

38
Driver(s)
The premature start of this project was driven primarily by the Owner in their
inability to provide the Construction Contractor with a viable construction schedule as
well as adequate information to accomplish it within a reasonable time frame.
Information such as engineering and procurement purchase order documentation would
have allowed the construction team to know what and when certain material and
equipment would be arriving on the construction site. As a result this led to many
interruptions during the construction phase of this project. Another major driver of the
premature start of this project was the lack of constructability planning prior to award of
the construction contract. For example, the Construction Contractor was never involved
in any constructability planning. Subsequently, the construction team was not included in
any constructability reviews and no input from the construction team went into the
determination of the initial project schedule. Since the Owner was eager to begin
construction, limited resources were placed on establishing a clear procurement schedule
which should have been significantly complete so that construction could proceed
unimpeded in order to meet the original completion date. In summary, the drivers
identified in this case were:
Owner Mandated Overly Aggressive Schedule
Owner Perceived Benefit For Early Start
Impact(s)
Over the lifecycle of the project there were over 450 change orders that increased
the baseline project cost from $55 million to $135 million. The majority of changes were
due to additional scope and engineering, design and fabrication errors. Construction of
the chemical plant was completed in early 2014; five months after the Owner imposed
September 2013 deadline and seven months after the original July 2013 deadline. The

39
impacts of these interruptions are summarized below.
Cost Overruns
Out of Sequence Work
Overtime/Unplanned Work
Schedule Slippage
Rework
Poor Productivity
Scope Not Identified
Facility Start-up/Production Delay
Relationship/Reputational Damage
Safety Exposure
Leading Indicators
A leading indicator that signified the premature start to construction was the
initial contract structure being an EP-C, where the Construction Contractor was
responsible solely for construction and not engineering and procurement. This structure
differed from the ideal situation where the Construction Contractor had supportive Owner
management and heavy involvement in constructability reviews during the engineering
and procurement phase of the project. Another leading indicator, possible as a result of
the aforementioned one, was design deliverables arriving late. This could have warned
the design team that construction material would be delayed or incorrect upon arrival and
cost overruns and schedule delays would likely be a result. Leading indicators identified
on this project include the following:
Engineering Documentation Not Complete
Late Design Deliverables

40
Unrealistic Schedule
Material Not Available
Vendor Information Unavailable Prior to Design
Unsupportive Management
Lessons Learned
This section will address the various lessons learned from the project outcomes
and provide strategies to address each issue.
Establish an integrated team and assess joint capability to meet project
requirements: The parties had never worked together prior to the project and
therefore didn’t understand their respective capabilities, strengths and
weaknesses. In order to ensure alignment, the Owner, Engineering and
Procurement contractor (EP) and Construction Contractor (C) should have
established a stronger relationship via meetings and information exchange, and
clarified expectations for each party. This could have resulted in an integrated
team and schedule best suited to the construction requirements.
Fully validate constructability program and path of construction in relation
to schedule and clearly document changes immediately after contract award:
The Owner and EP contractor didn’t invite Construction into the planning
meetings or design conversations and it was later discovered that those parties did
not have construction experience in large capital projects. During the first weeks
of the contract, the Construction Contractor reviewed the schedule and found it
lacked industry practices for a large construction project and failed to assert
strongly enough the need to accept the level of change to the project design and
schedule. On future projects the Construction Contractor should clearly document

41
the change requirements and gain Owner acceptance on changes as early as
possible after contract award.
Provide Construction contractor access to procurement documentation: The
Owner was responsible for procurement of engineered items but wasn’t willing to
share details on purchases due to confidentiality policies regarding vendors and
cost values. As a result, the Construction Contractor wasn’t provided any data
regarding delivery schedules, bill of materials, and wasn’t able to prepare
receiving and resources for installation. On future projects, the Construction
Contractor should include access to purchasing data in the contract, or arranged to
have some modified versions of the documents to protect confidentiality of the
Owner and suppliers.
Approval of rework/scope change should include approval of schedule
impact: Owner acknowledged the scope changes but rejected the revised
construction schedule. In future projects, the Construction Contractor can
emphasize the schedule impact on change requests to retain a trail of
communication and protect integrity of the Owner-Contractor business
relationship.
4.3. CASE STUDY 3: LIMITED CAPITAL AVAILABILITY AND UNMITIGATED
ASSUMPTIONS
This case study investigates the effects of making unmitigated assumptions prior
to construction and how it led to significant cost overruns and schedule delays of a plant
renovation project. It will also look at how limited capital availability influenced the
project team to make these assumptions, causing a premature start to construction. Table
8 identifies (asterisked and highlighted in yellow) precisely which premature start drivers,

42
leading indicators and impacts occurred in this case.
Table 8: Case Study 3 Premature Start Drivers, Leading Indicators, and Impacts
Premature Start Drivers Leading Indicators Project Impacts *Owner Mandated Overly
Aggressive Schedule
*Engineering Documentation Not
Complete *Cost Overruns
Owner Perceived Benefit For Early
Start Late Design Deliverables *Overtime / Unplanned Work
*Time to Market Unrealistic Schedule *Schedule Slippage
Seasonal / Weather Constraints Material Not Available Out of Sequence Work
*Regulatory Compliance Vendor Information Unavailable Prior
to Design Rework
*Capital Availability *Unmitigated Assumptions Poor Productivity
Contractor Eager to Get Started *Unclear Project Objectives *Facility Start-up / Production
Delay
Contractor Perceived Benefit for
Early Start *Lack of Regulatory License / Permits *Scope Not Identified
Contractor Mobilization in Order to
Start Billing Unsupportive Management
Relationship / Reputational
Damage
Contract Terms in Place That
Incentivizes Mobilization Poor Morale
Safety Exposure
Litigation / Claims
Failure to Attract / Maintain
Craft
Company Profile
The Owner Company on this project is a large multinational heavy industrial
company specializing in steel manufacturing. The project reviewed in this case study
belongs to the heavy industrial integrated steel manufacturing sector and is located in
eastern Canada.
Project Overview
The project scope was to replace two deteriorating crude liquor tanks (north and
south) with a much larger tank previously used to store fuel oil as part of another process.
This tank was no longer in service. The tanks to be replaced were used in the coke

43
making byproduct process for temporary and surge storage of crude liquor. The project
scope included three major parts: (1) the refurbishing of the five million gallon tank, (2)
engineering and construction of new and refurbished piping and plumbing, pumps, and
all control systems necessary to transport the byproduct into the repurposed five million
gallon storage tank, and (3) the process engineering associated with polycyclic aromatic
hydrocarbon control according to environmental requirements. Additional piping and
distribution systems were required to integrate the repurposed tank into the liquor
processing system. Original overall project duration was twelve months with a budget of
$2.4 million. The contract type for the new construction of pipes and systems controls
was lump sum. Table 9 and Table 10 provide additional details regarding cost and
schedule. Having passed inspection five years prior, the repurposed tank was assumed to
be in working order and that no repairs would be required. This could not be validated
pre-approval, however, as the tank was still partially full and validation would require
additional funds for pumping and disposal. The project was approved based on this scope
definition and assumption.
The project was approved on October 2011 with a planned startup in October
2012; a total baseline project duration of twelve months. The project was identified as
being schedule driven; an aggressive schedule was composed in order to have the
refurbished tank available during a scheduled maintenance outage, as well as to meet
certain discharge restrictions mandated by a governmental environment protection
organization. The Owner was enthusiastic to consume available capital funds from the
site allocation before year end. As a result of these drivers, process engineering was not
completed prior to project approval and it was assumed that the condition of the tank was
satisfactory for reuse.

44
Table 9: Project summary of cost and schedule
Sector Industrial Manufacturing
Project Type New construction and modification
Construction Location (Extremely) Brownfield
Contract Type varies (lump sum and reimbursable)
Baseline Project Cost (TIC) $2,400,000
Actual Project Cost (TIC) $4,360,000
Baseline Contract Cost $1,900,000
Actual Contract Cost $3,159,000
Total Project Baseline Duration 12 months
Total Project Actual Duration 18 months
Construction Baseline Duration 5 months
Construction Actual Duration 8 months
During process engineering, a refining process design was identified which would
allow improved environmental performance, which was a secondary project driver. The
initial plan to replace both liquor storage tanks was revised to maintain the use of the
north crude liquor tank as a buffer and employing the five million gallon tank as a
secondary settling tank. The additional settling would reduce liquor impurities prior to
processing through the bio-plant and subsequent discharge to the municipal waste water
system. The result was additional project scope, engineering, equipment and installation
cost. Following completion of process engineering, the quotation for detailed
(construction) engineering went considerably beyond the project budget estimate. The
project budget was reforecast and the decision was made to continue into
implementation.
As the project moved to the construction phase it was realized by the Owner that
significant repairs were needed on the five million gallon tank. The process design
change, as well as the repairs to the five million gallon tank, extended the project
schedule and increased costs. Table 10 depicts the baseline scheduled duration versus the

45
actual duration.
Table 10: Detailed project summary of schedule
Task
Baseline
Duration
Actual
Duration Difference
Total Project 12 months 18 months 50%
Engineering 4 months 10 months 150%
Construction 5 months 8 months 60%
Start-up/Commissioning 3 months 5 months 67%
Driver(s)
The premature start to this project was driven by three different areas. The first
driver came from the need to quickly refurbish the tank and get it operational in time for
the scheduled outage of the plant. The assumption that the five million gallon tank was
not in need of repairs was incorrect and forced the schedule to be extended and additional
funds to be spent. The second driver was the government mandate to meet effluent
discharge requirements within an acceptable timeframe. The third driver was the addition
of project scope in order to take advantage of available capital funds that would expire
once the fiscal year ended. Because of these various drivers, the project had begun
prematurely without having done any process engineering or properly validating
assumptions. The schedule was extended by nine months and the project cost exceeded
the original budget by $2.1 million. In summary, the drivers identified in this case were:
Owner Mandated Overly Aggressive Schedule
Time to Market
Regulatory Compliance
Capital Availability

46
Impact(s)
This case faced multiple impacts as described previously and are summarized
below:
Cost Overruns
Schedule Slippage
Scope Not Identified
Facility Start-up/Production Delay
Leading Indicator(s)
Expedition of project in order to make use of available capital before the end of
the fiscal year and incomplete process engineering prior to project approval were both
noted as key leading indicators of a premature start for this project. Having recognized
these indicators could have prevented a severely unrealistic schedule from being
conceived. Also, significant scope changes were approved after potential process
performance improvements were identified following process engineering. Scope shifted
accordingly but project objectives were unclear and assumptions were left unmitigated.
Leading indicators identified on this project include the following:
Engineering Documentation Not Complete
Unmitigated Assumptions
Unclear Project Objectives
Lack of Regulatory License/Permits
Lessons Learned
This section will address the various lessons learned from the project outcomes
and provide strategies to address each issue.

47
Conflict and priority of drivers lead to misalignment on project objectives:
The primary drivers of the project were to meet environmental requirements,
shutdown schedule timelines and consume available capital funds within the
calendar year. The secondary driver is the tacit expectation that the necessary
front-end work will be done so that the project is scoped correctly and has a high
probability to be delivered on schedule and budget. The focus on the primary
drivers by project stakeholders incentivized the project team to undervalue the
secondary drivers. The result was incorrect scope with assumption risk and
development of an underestimated baseline for cost and schedule. The project
team should have discussed misalignment issues with all stakeholders to ensure
that consideration is given to the potential risks and impacts and whether time is
needed to investigate and mitigate risks.
Risk assessment is necessary to identify and derive mitigating strategy for
significant aspects of a project: Reliance on prior inspections lead to
assumptions about equipment condition and influenced the approach to the
project. Conducting a risk assessment would have allowed stakeholders to
understand the potential influence on the project if the assumptions turned out to
be incorrect. This would allow management to make an informed decision about
the realistic business case prior to committing to construction. Incomplete process
engineering and invalidated assumptions regarding existing equipment condition
resulted in delays to construction and significant cost overruns.
It is necessary to have a change management process to assess and
communicate impacts: Changes to the process engineering late in the project led
to significant scope changes. The end result was a better performance from an
environmental discharge point of view. However, the associated schedule delays

48
and cost increases were viewed negatively by senior stakeholders. Adhering to a
rigorous change management process would have required the project team to
assess the process engineering change and communicate the impacts to senior
stakeholders. Communication of the changes would have allowed prioritizing and
alignment of objectives by stakeholders (i.e. improving performance at the
expense of cost and time).
4.4. CASE STUDY 4: TIME TO MARKET FOR INFRASTRUCTURE PROJECT
This case study investigates the effects of having an overly aggressive owner
schedule and how it forced numerous construction interruptions and impacts. It will also
look at the effects of multiple parties operating under a contract with unfamiliar
properties. Table 11 identifies (asterisked and highlighted in yellow) precisely which
premature start drivers, leading indicators and impacts occurred in this case.
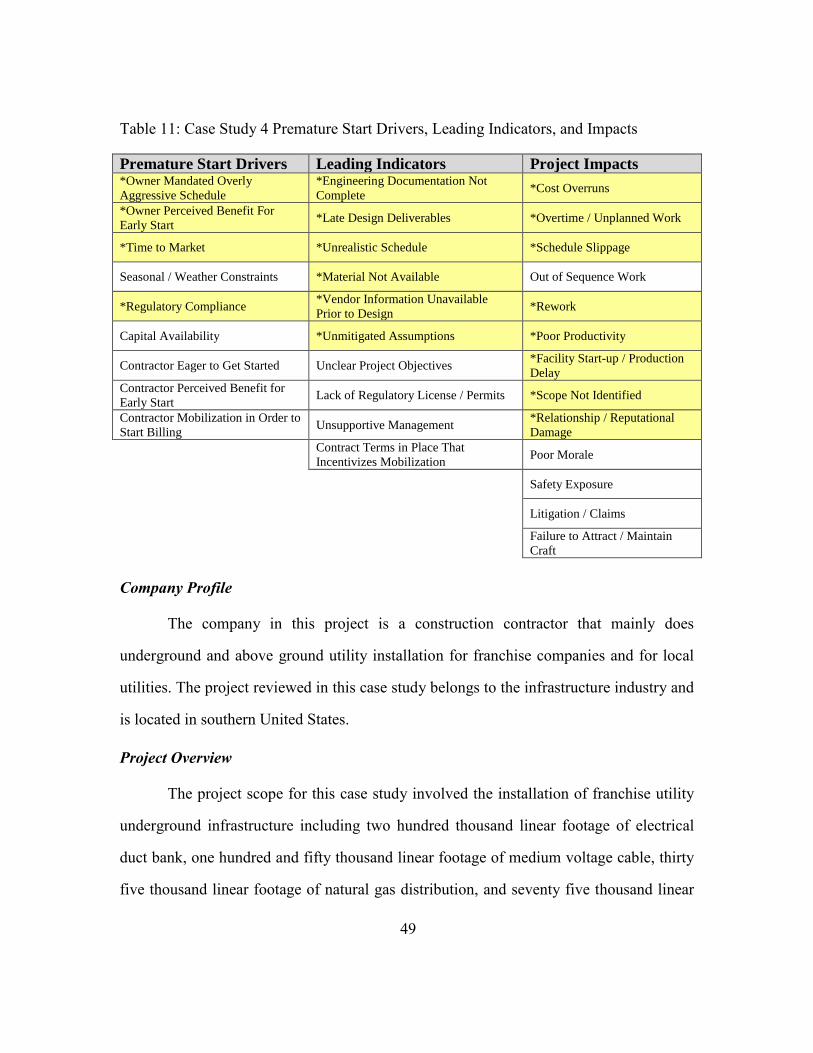
49
Table 11: Case Study 4 Premature Start Drivers, Leading Indicators, and Impacts
Premature Start Drivers Leading Indicators Project Impacts *Owner Mandated Overly
Aggressive Schedule
*Engineering Documentation Not
Complete *Cost Overruns
*Owner Perceived Benefit For
Early Start *Late Design Deliverables *Overtime / Unplanned Work
*Time to Market *Unrealistic Schedule *Schedule Slippage
Seasonal / Weather Constraints *Material Not Available Out of Sequence Work
*Regulatory Compliance *Vendor Information Unavailable
Prior to Design *Rework
Capital Availability *Unmitigated Assumptions *Poor Productivity
Contractor Eager to Get Started Unclear Project Objectives *Facility Start-up / Production
Delay
Contractor Perceived Benefit for
Early Start Lack of Regulatory License / Permits *Scope Not Identified
Contractor Mobilization in Order to
Start Billing Unsupportive Management
*Relationship / Reputational
Damage
Contract Terms in Place That
Incentivizes Mobilization Poor Morale
Safety Exposure
Litigation / Claims
Failure to Attract / Maintain
Craft
Company Profile
The company in this project is a construction contractor that mainly does
underground and above ground utility installation for franchise companies and for local
utilities. The project reviewed in this case study belongs to the infrastructure industry and
is located in southern United States.
Project Overview
The project scope for this case study involved the installation of franchise utility
underground infrastructure including two hundred thousand linear footage of electrical
duct bank, one hundred and fifty thousand linear footage of medium voltage cable, thirty
five thousand linear footage of natural gas distribution, and seventy five thousand linear

50
footage of communication. The utility lines are to feed a large manufacturing/retail site.
The project is greenfield and underwent construction in 2015.
The contractor was initially under a lump sum contract with the developer of the
retail site. On this project, the company providing utility service acted as a joint venture
operation with the developer of the retail site and would hire the contractor to complete
all of the duct bank construction as well as installation of all franchise and utility lines.
This is the first time the contractor had this type of work relationship. The
Owner/Developer was under obligation to have the retail site operational as well as have
30 acres of land powered and ready for utility connection. Typically, the contractor
worked directly for the utility organization rather than a joint venture Owner/Developer.
Because of this initial contract type, the construction schedule was created by the
developer and provided to the contractor who had no prior experience working with the
Owner. Approximately 90 percent of the retail facility had been completed prior to the
initial bid package so a rush to begin construction was felt by the developer. Accepting
the contract terms the contractor immediately mobilized and quickly ran into issues and
interruptions with the initial bid package.
Table 12: Project summary of cost and schedule
Sector Infrastructure
Project Type Utility Infrastructure
Construction Location Southwest USA
Contract Type Unit Price
Baseline Contract Cost $2,380,000
Actual Contract Cost $3,644,000
Construction Baseline Duration 12 months
Construction Actual Duration 21 months
The initial bid package had inefficient data from the utility company, due to poor

51
communication between the franchise utility engineers and the developer. The developer
created an overly aggressive schedule which would require the contractor to staff
additional crews in order to meet the high demands of the developer. To offset these
additional costs, the contractor included a significant contingency amount in the initial
lump sum bid to cover the cost and risk of meeting the developer’s goals. During initial
construction phase, many design issues came about regarding discrepancies between
Owner-provided drawings and design requirements from the utilities. The project was
supposed to be completed prior to the facility opening, so there was a schedule-driven
atmosphere amongst the construction team.
Driver(s)
Drivers of this project were determined to be time to market by each of the project
stakeholders. The Owner/Developer mandated an overly aggressive schedule that
triggered multiple interruptions, the utility was imposing regulatory compliance on the
contractor, and the facility soon to open needed power, natural gas, and communication
lines in order to open to the market. In summary, the drivers identified in this case were:
Owner Mandated Overly Aggressive Schedule
Owner Perceived Benefit For Early Start
Time to Market
Regulatory Compliance
Impact(s)
The contracting company had never worked with the Owner/Developer and
Utility incorporating this type of contract. From the beginning, there was poor
communication and coordination between the utility engineers and with the Owner
engineers. This often times caused delays in construction, resulting from discrepancies

52
between drawings provided by the Owner and final design requirements from the Utility
Company. Excessive manpower and equipment were added to meet the Utility’s schedule
commitment to the Owner to energize the site, causing budget overruns. This case faced
multiple impacts as described above but can be summarized below.
Cost Overruns
Overtime/Unplanned Work
Schedule Slippage
Rework
Poor Productivity
Scope Not Identified
Facility Start-up/Production Delay
Relationship/Reputational Damage
Leading Indicators
Potential leading indicators of a premature start for this project include late design
deliverables and incomplete documentation such as an incomplete geotechnical report
and design drawings without approved plans. As a result, excessive contingency was
added to the initial bid to mitigate the risk from the Owner’s aggressive schedule. The
Developer assumed engineering drawings from franchise companies would be sufficient
and provided to contractor. Leading indicators identified on this project include the
following:
Engineering Documentation Not Complete
Late Design Deliverables
Unrealistic Schedule
Material Not Available
53
Vendor Information Unavailable Prior to Design
Unmitigated Assumptions
Lessons Learned
This section will address the various lessons learned from the project outcomes
and provide strategies to address each issue.
Misunderstanding of stakeholder roles and project scope: Owner’s
engineering and Consulting Firm did not have a clear understanding of what was
involved to have all Franchise Utilities installed to the project. Multiple Franchise
companies, (i.e. Natural Gas, Power, Telecom,) were not identified and involved
in the engineering process even though they were major stakeholders. If proper
communication and coordination had taken place between all Stakeholders prior
to sending out request for proposal documents to the contractor scope would be
clear, designs would be accurate and initial cost budgets would be inline.
Engineering firm lacking Subject Matter Experts on Power Line and Utility
design and construction: Because of the Owner’s engineering and consulting
firm did not have in house subject matter experts on power line and utility
construction, the Owner was subject to a large gap in overall scope. This, coupled
with the demands of contracted opening dates with city officials and investors, the
Owner was subject to releasing a request for proposal that was incomplete. If the
engineering consulting firm had originally procured a utility engineering company
that had a background and knowledge of scope and budgeting costs, a complete
scope could have been released, and the Owner could have potentially been aware
of the costs, man power, and capabilities contractors possess to deliver this kind
of product.

54
4.5. CASE STUDY 5: OVERLY AGGRESSIVE SCHEDULE FOR EARLY TIME TO MARKET
This case study investigates a project driven largely by time-to-market. This case
study outlines an extreme case of an owner mandated overly aggressive schedule and
explains the impacts and interruptions faced by the project design and construction team.
Table 13 identifies (asterisked and highlighted in yellow) precisely which premature start
drivers, leading indicators and impacts occurred in this case.
Table 13: Case Study 5 Premature Start Drivers, Leading Indicators, and Impacts
Premature Start Drivers Leading Indicators Project Impacts *Owner Mandated Overly
Aggressive Schedule
*Engineering Documentation Not
Complete *Cost Overruns
*Owner Perceived Benefit For
Early Start Late Design Deliverables Overtime / Unplanned Work
*Time to Market Unrealistic Schedule *Schedule Slippage
Seasonal / Weather Constraints Material Not Available Out of Sequence Work
Regulatory Compliance *Vendor Information Unavailable
Prior to Design *Rework
Capital Availability *Unmitigated Assumptions *Poor Productivity
Contractor Eager to Get Started *Unclear Project Objectives *Facility Start-up / Production
Delay
Contractor Perceived Benefit for
Early Start Lack of Regulatory License / Permits *Scope Not Identified
Contractor Mobilization in Order to
Start Billing *Unsupportive Management
Relationship / Reputational
Damage
Contract Terms in Place That
Incentivizes Mobilization *Poor Morale
Safety Exposure
Litigation / Claims
Failure to Attract / Maintain
Craft
Company Profile
This case study will look at an Owner-managed midstream oil and gas project
located on greenfield site conditions in Southwest United States. The Owner of the
project is a large independent upstream oil and gas company specializing in drilling and

55
production. The company has various other operations that support fracturing wells but
their primary function is drilling and production operations.
Project Overview
Case study 5 will look at the premature start of construction for a forty acre oil
and gas midstream plant located in the Southwest United States, purposed to separate and
treat sour crude oil, natural gas, and water. The gas is sold to a third party and the liquids
are temporarily stored on site and later transported to market. The new plant to be
constructed was designed in order to replace an existing plant that was not large enough
to handle additional development. The new plant was planned to accept flow from a six-
well pad from the north and a three-well pad from the west, with the capacity to
accommodate future development. The construction of the central gathering point (CGP),
the point where flow lines from the wells would be directed, would include grading and
civil work, installation of two five thousand barrels of oil per day (BOPD) heater treaters,
one fifty million cubic feet per day (MMCFD) amine plant, one fifty MMCFD glycol
plant, four five thousand barrel storage tanks for oil production, two twenty five thousand
barrel floating roof tanks for oil transportation, twelve 750 barrel storage tanks for water,
two compressors and associated mechanical and electrical equipment and piping
On April 2013, the decision was made to fully develop the area and would include
approximately ninety wells on twenty well pads, and one CGP. The original budgeted
amount to complete the project (the CGP) was $39.2 million. The project objective for
this site will be to separate and treat ten thousand barrels per day of oil and fifty million
cubic feet per day of gas.

56
Table 14: Project summary of cost and schedule
Sector Oil and Gas
Project Type Midstream
Construction Location Southwest USA
Contract Type Time and Material
Baseline Project Cost $32,400,000
Actual Project Cost (TIC) $41,800,000
Construction Baseline Duration 8 months
Construction Actual Duration 9 months
During the early stages of the project there were several issues involving access,
drilling, completions and facilities construction. The first issue involved access to the
proposed facility by way of a road whose ownership was under dispute. Because the
landowners in the development’s area had no mineral rights, they had little incentive to
work with the company during construction and disputed the use of the road with the
company. This led to legal discussions between the company and the private landowner
for the use of the access road. Because all legal aspects prior to mobilization were not
completely resolved, access and development had been delayed.
Early on in the project, internal teams within the organization were not
communicating effectively with one another. Facilities construction engineers took the
unofficial role of project manager in order to get the project moving. Large group
meetings then took place in order to determine a working schedule for the purpose of
building in a sequence as to accommodate the construction of the wells. These meetings,
led mostly by the facilities engineer, were held so the project team could determine what
each department needed for construction and also to determine in what sequence these
items be delivered to them. Several department objectives were conflicting or misaligned
for the overall success and risk of the development, for example:
57
1. Land department objective to acquire low cost site versus site location and timing.
2. Drilling/Reservoir/Geoscience department objective to select high productivity
wells versus effect of changes to others, Facilities, Commodity Sales, etc.
3. Commodity Sales objective to negotiate best terms versus Facilities executing
capital before definitive terms due to timing.
The initial plan was for the northern six wells to be drilled first, while the CGP
was being constructed, so that the completion of both items would be completed at the
same time. The drilling of six wells would be ninety days. The plant facility would have
to be completed before this time in order to begin receiving oil and gas from the six
newly drilled wells. At one point early on during construction, the team received
notification from management to redirect attention to the western three well pads instead
of the northern six in order to speed the productions time to market.
This sequence shift from drilling the western wells first instead of the northern
instantly reduced the schedule window by half. This schedule change dramatically
increased pressure for the facility design and construction team since they now had to
expedite an already behind schedule construction plan.
At this point, the facility design and construction for the CGP was significantly
delayed. The original plan was to have the design for the facility completed by September
2013, construction starting in October 2013 and to have the facility operational by the
following April. Due to the lack of resources to complete design in-house, facility design
did not start until July 2013. At this point, the facility engineer determined that a
contractor was needed to complete the facility design in order meet the aggressive
schedule set by the management within the company.

58
Driver(s)
The two main drivers identified on this project were: Owner Mandated Overly
Aggressive Schedule and Time to Market. The project schedule changed at the start of
design, moving completion from April 1 to January 1, 2014 in order to begin extracting
petroleum as soon as possible. During this time, the Engineering Consultant worked on
design with unclear direction while the Owner procured equipment. The Owner in this
case perceived a large benefit with early start-up, placing a high level of risk on the
facility engineer and project team to begin construction. In summary, the drivers
identified in this case were:
Owner mandated Overly Aggressive Schedule
Owner Perceived Benefit For Early Start
Time to Market
Impact(s)
The premature start of construction in this case caused many negative impacts that
had to be dealt with mainly by the Owner. Installation cost, low productivity, leftover
materials, and abandoned scope are examples of these negative impacts. Abandoned
scope included certain facilities being constructed but not utilized such as a large 25k
barrel tanks for oil export pipeline. The impacts of these interruptions are summarized
below.
Cost Overruns
Schedule Slippage
Rework
Poor Productivity
Scope Not Identified
Facility Start-up/Production Delay

59
Poor Morale
Leading Indicators
The schedule cut early on was a clear leading indicator that the schedule became
too aggressive. An uncertain business plan and unclear project objectives further
compounded the problem stemming from the aggressive schedule shift. Vendor data was
not available as well leading to scant and overly conservative assumptions. Another
leading indicator that the construction phase was beginning prematurely was that the
execution plan was not ideally drafted. Since the execution plan was haphazardly put
together, scheduling required guesswork. Leading indicators identified on this project
include the following:
Unsupportive management Engineering Documentation Not Complete
Vendor Information Unavailable Prior to Design
Unmitigated Assumptions
Unclear Project Objectives
Unsupportive Management
Lessons Learned
This section will address the various lessons learned from the project outcomes
and provide strategies to address each issue.
Establish Initial Project Alignment: When the project was sanctioned,
objectives were unclear. The Company should have established objectives,
drivers, and risks before proceeding to take initial steps in the project. This would
have avoided department objectives conflicting with company objectives.
Develop Interface Management Protocol: Lack of interface plans resulted in a
misunderstanding by each department of potential impacts of change to the

60
departments involved. On this project, large meetings were inefficient for
information exchange and integrity. Meeting schedule should have been
established chronologically over a period of time with the relevant parties. An
interface management protocol should also have been established to facilitate the
exchange of information and change, i.e. communication accountability matrix,
change management/approval process.
4.6. CASE STUDY 6: INCORRECT SCOPE ASSUMPTIONS DRIVING EXCESSIVE
MANPOWER FLUCTUATIONS AND COST OVERRUNS
The case study investigates a currently ongoing brownfield construction project
involving the installation of petro-chemical equipment. This case experiences a multitude
of drivers causing several interruptions and impacts throughout the construction project.
The project owner’s aggressive schedule, incorrect scope from the original bid, and
project managers reacting rather than taking a proactive planning approach were
identified as key drivers of the premature start, which led to impacts such as cost
overruns, out of sequence work, and failure to attract and maintain craft labor. Table 15
identifies (asterisked and highlighted in yellow) precisely which premature start driver,
leading indicator and impact occurred in this case.

61
Table 15: Case Study 6 Premature Start Drivers, Leading Indicators, and Impacts
Premature Start Drivers Leading Indicators Project Impacts
*Owner Mandated Overly
Aggressive Schedule
*Engineering Documentation Not
Complete *Cost Overruns
*Owner Perceived Benefit For
Early Start *Late Design Deliverables *Overtime/Unplanned Work
*Time to Market *Unrealistic Schedule *Schedule Slippage
Seasonal/Weather Constraints *Material Not Available *Out of Sequence Work
Regulatory Compliance *Vendor Information Unavailable
Prior to Design *Rework
Capital Availability *Unmitigated Assumptions *Poor Productivity
*Contractor Eager to Get Started *Unclear Project Objectives *Facility Start-up/Production
Delay
*Contractor Perceived Benefit for
Early Start Lack of Regulatory License/Permits Scope Not Identified
Contractor Mobilization in Order
to Start Billing *Unsupportive Management
*Relationship/Reputational
Damage
Contract Terms in Place That
Incentivizes Mobilization *Poor Morale
Safety Exposure
Litigation/Claims
*Failure to Attract/Maintain
Craft
Company Profile
The company on this project is a large Engineer-Procure-Construct (EPC)
contracting company focusing primarily on the design and construction of petrochemical
transfer and refining facilities. Their worksites can be found in regions throughout the
United States. The EPC contractor owns technology for a specific process of oil refining
involving petrochemical furnaces and serves as a primary reason for its involvement in
this project.
Project Overview
Given the technological expertise of the EPC in this area, the Owner Company of
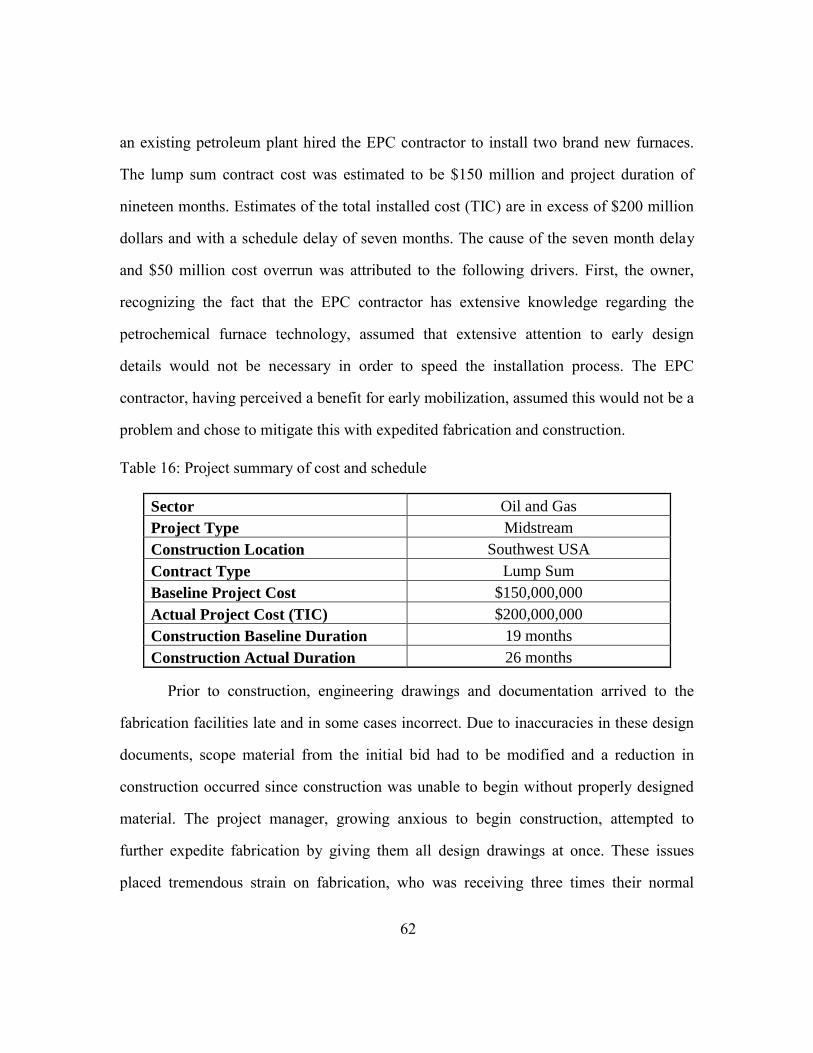
62
an existing petroleum plant hired the EPC contractor to install two brand new furnaces.
The lump sum contract cost was estimated to be $150 million and project duration of
nineteen months. Estimates of the total installed cost (TIC) are in excess of $200 million
dollars and with a schedule delay of seven months. The cause of the seven month delay
and $50 million cost overrun was attributed to the following drivers. First, the owner,
recognizing the fact that the EPC contractor has extensive knowledge regarding the
petrochemical furnace technology, assumed that extensive attention to early design
details would not be necessary in order to speed the installation process. The EPC
contractor, having perceived a benefit for early mobilization, assumed this would not be a
problem and chose to mitigate this with expedited fabrication and construction.
Table 16: Project summary of cost and schedule
Sector Oil and Gas
Project Type Midstream
Construction Location Southwest USA
Contract Type Lump Sum
Baseline Project Cost $150,000,000
Actual Project Cost (TIC) $200,000,000
Construction Baseline Duration 19 months
Construction Actual Duration 26 months
Prior to construction, engineering drawings and documentation arrived to the
fabrication facilities late and in some cases incorrect. Due to inaccuracies in these design
documents, scope material from the initial bid had to be modified and a reduction in
construction occurred since construction was unable to begin without properly designed
material. The project manager, growing anxious to begin construction, attempted to
further expedite fabrication by giving them all design drawings at once. These issues
placed tremendous strain on fabrication, who was receiving three times their normal

63
workload. With such a short time frame the fabrication team fell behind and, in turn,
further delayed construction.
The project team chose to mitigate this issue by implementing a second round of
manpower reduction. This second round of layoffs proved to be very costly. The project
team had to increase wages in order to bring skilled labor onto the jobsite. It was reported
by a member of the project team that during construction, the company was paying the
highest wages in the region. Further implications of this issue will be addressed in this
case study.
Driver(s)
The delay of construction can be attributed to each project stakeholder. The
Owner wanted a working facility quickly and the Contractor wanted to mobilize quickly.
Construction on this project was determined to have begun prematurely and the cause of
this was attributed to five separate drivers. It was noted by the case study interviewee that
the contract schedule negotiations bypassed processes in order to cut corners assuming
the construction team can make up for the tight project duration. In summary, the drivers
identified in this case were:
Owner Mandated Overly Aggressive Schedule
Owner Perceived Benefit for Early Start
Time to Market
Contractor Eager to Get Started
Contractor Perceived Benefit for Early Start
Impacts(s)
This project faced unfavorable cost and schedule outcomes including a $50
million overrun and seven month delay. The aggressive schedule drove an unreasonable

64
approach to construction planning which had major implications in productivity.
Unpredictable hiring and layoffs affected the reputation of the project with local labor
and affected the ability to recruit and staff; further compounded after the second round of
layoffs. The impacts of these interruptions are summarized below.
Cost Overruns
Out of Sequence Work
Overtime/Unplanned Work
Schedule Slippage
Rework
Poor Productivity
Facility Start-up/Production Delay
Relationship/Reputational Damage
Poor Morale
Failure to Attract/Maintain Craft
Leading Indicators
Leading indicators act as early warning sign that have potential to alert the project
team of potential problems and issues. This section will cover warning signs that were
pointed out by members of the project team. The planning process was not seen as
beneficial. Drawing completion and issue restraints were not recognized early on in the
project and fabricator delivery ability was not properly evaluated. Material Control and
issue to fabricators was not properly managed. Below are identified leading indicators
that could have provided the project an early warning that the project was soon to face a
variety of impacts. Leading indicators identified on this project include the following:
Engineering Documentation Not Complete

65
Late Design Deliverables
Unrealistic Schedule
Material Not Available
Vendor Information Unavailable Prior to Design
Unmitigated Assumptions
Unclear Project Objectives
Unsupportive Management
Lessons Learned
This section will address the various lessons learned from the project outcomes
and provide solutions that address each issue.
Scope definition: Understanding of owner specifications should have been part of
the execution plan before start of project. The project team intentionally released
steel documents without design being completed in order to meet schedule
milestones. Impacts to construction were not completely understood when a
decision was made by engineering to release the steel drawings before the design
was complete.
Follow All Company Procedures and Regulations: Company procedures were
not followed. If the team had waited until all stress testing and design were
completed and understood, many negative project outcomes could have been
avoided. The team could have waited until intermediate and smaller steel design
was completed.
Premature Mobilization Awareness: Having discipline to recognize early
mobilization and the actual availability for work fronts must be measurable.
Having earlier awareness of premature mobilization impacts could have warned

66
the project team of negative project outcomes before the project fell behind
schedule.
4.7. CASE STUDY 7: GOVERNMENTAL AGENCY AGGRESSIVE TIME TO MARKET
SCHEDULE
This case study investigates a government agency beginning a construction
project with an aggressive owner schedule for a project site that had very strict
construction guidelines and with limited site availability. It will also look at how
improper assumptions and failure to mitigate them led to interruptions in the project
schedule. Table 17 identifies (asterisked and highlighted in yellow) precisely which
premature start drivers, leading indicators and impacts occurred in this case.
Table 17: Case Study 7 Premature Start Drivers, Leading Indicators, and Impacts
Premature Start Drivers Leading Indicators Project Impacts *Owner Mandated Overly
Aggressive Schedule
*Engineering Documentation Not
Complete *Cost Overruns
*Owner Perceived Benefit For
Early Start Late Design Deliverables *Out of Sequence Work
*Time to Market *Unrealistic Schedule *Overtime/Unplanned Work
Seasonal/Weather Constraints Material Not Available *Schedule Slippage
Regulatory Compliance Vendor Information Unavailable Prior
to Design *Rework
*Capital Availability *Unmitigated Assumptions Poor Productivity
Contractor Eager to Get Started *Unclear Project Objectives *Scope Not Identified
Contractor Perceived Benefit for
Early Start Lack of Regulatory License/Permits
Facility Start-up/Production
Delay
Contractor Mobilization in Order
to Start Billing Unsupportive Management
Relationship/Reputational
Damage
Contract Terms in Place That
Incentivizes Mobilization Poor Morale
Litigation/Claims
Safety Exposure
Failure to Attract/Maintain Craft

67
Company Profile
This Owner Company on this project is a government entity responsible for
renovation and maintenance of museums and national historic sites around the United
States. The project reviewed in this case study involves the restoration of a 19th century
gallery.
Project Overview
The project scope includes the complete renovation and replacement of all major
building infrastructure systems and improvement of interior conditions within the historic
site. This also includes preservation of the structure along with providing efficient, safe
and sustainable building conditions. Additional scope requirements include the complete
removal of hazardous material from the building. For the Owner, preservation of historic
context is important just as important as upgrading the facility by including items such as
Wi-Fi.
The project delivery method for this project was Design-bid-build. The Owner
hired a local Contractor and awarded $11.2 million to complete the project scope. The
entire project budget was not available to the Owner prior to bid, so incremental funding
would be required as basis of payment for the Contractor. Incremental funding included
an additional $4.6 million and another installment of $4 million to be awarded to the
contractor throughout the project lifecycle with a total award package of $19.8 million.
This amount served as the total amount funded in base contract.

68
Table 18: Project summary of cost and schedule
Sector Buildings
Project Type Historic Site Renovation
Construction Location Brownfield
Contract Type Design, Bid, Build
Baseline Project Cost $19,839,700.
Actual Project Cost (TIC) $27,749,100
Total Project Baseline Duration 15 months
Total Project Actual Duration 18 months
The Owner had to get the project obligated or else the owner would lose funding
opportunity for the project. When the project went out to bid, not all life safety
requirements were included. The Owner decided to proceed and get documents out at
95% completion even though comments from life safety group had not been properly
addressed. The plan was to get all life safety requirements addressed throughout the
construction phase of the project. This assumption that all safety requirements would be
properly addressed during construction proved to be quite costly and caused several
interruptions during the construction phase of the project.
One safety requirement was the removal of hazardous material from the site. The
Owner, having done a preliminary study of the gallery, knew hazardous material existed
in the gallery. When the Contractor started construction, more hazardous material in
different locations was discovered and adjustments had to be made in the project
schedule. Anticipated amounts of hazardous material were significantly underestimated
by the Owner and as the Contractor uncovered hazmat, material was removed via change
order. During hazmat removal, parts of the site had to stop construction and nothing
could move through the area to support other construction elements.
A second safety requirement that had to be resolved during construction was the
structural casing of blast proof windows that had to be installed at the site. A series of

69
testing had to be done by the Owners security office offsite during construction. No
evidence of testing existed in the original submittal and existing windows had to be
dismantled prior to design of new windows. What the security office did was design
windows based on assumptions. What the safety office found during testing was that
additional steel support needed to be added to the building structure in order for the blast
proof windows to be effective. The construction team had to open all window casings
which revealed that a top down redesign of the blast windows. Since the original
windows were designed based on assumptions all of the steel work that was needed for
proper structural integrity fell out of the performance package. Every single window had
certain fabrication requirements due to historic context and all changes had to be
mitigated during construction.
Driver(s)
This project identified with four premature start drivers. The original duration of
the project was planned to be 15 months as mandated by Owner thus leading to Owner
Mandated Overly Aggressive Schedule being the main driver identified as the cause of
the premature start. Additionally, the project start was driven also by the fact that capital
funding needed to be spent prior to end of the fiscal year. This led the Owner to identify
Capital Availability as another driver to the premature start. Below are all of the drivers
that identify with this project premature start:
Owner Mandated Overly Aggressive Schedule
Owner Perceived Benefit of Early Start
Time to Market
Capital Availability

70
Impact(s)
Throughout the project the duration had to be modified due to the aggressive
nature of the schedule. The first schedule extension was due to the Contractor discovering
more hazardous material on site than what was originally reported by the Owner’s
preliminary investigation. These unknown conditions revealed 27 days of additional work
that fell out of the performance package. The second schedule extension of 40 days was
due to additional work related to the blast proof window installation. Along with these
schedule extensions and delays were significant cost implications. The impacts of these
interruptions are summarized below:
Cost Overruns
Out of Sequence Work
Overtime/Unplanned Work
Schedule Slippage
Rework
Poor Productivity
Scope Not Identified
Leading Indicators
Potential leading indicators of a premature start for this project include
incomplete engineering documentation such as not addressing the life safety requirements
and assuming they could be mitigated during construction. Leading indicators identified
on this project include the following:
Engineering Documentation Not Complete
Unrealistic Schedule
Unclear Project Objectives
Unmitigated Assumptions

71
Lessons Learned
This section will address the various lessons learned from the project outcomes
and provide strategies to address each issue.
Follow Agency Standard Procedures and Guidelines: Allow sufficient time to
complete coordination of all project discipline and/or requirements to ensure that
bid documents are 100% and/or For Construction. In order to meet demands to
send construction documents out for bidding purpose, certain disciplines were not
able to complete their review. Documents did not include all necessary
requirements. Upper Management should have held firm to agencies standard
procedures and guidelines and, if trying to meeting funding deadlines, allow the
process to start earlier or use other contracting vehicles.
Continuous Monitoring of Project Duration: The team should have re-
evaluated the project duration through the entire review process, 35%, 50%, and
95%, and then again prior to production of 100%. This would have ensured that
the duration for all work activities have been considered and factored into the
project schedule. During 65% review, the Director requested that project duration
be reduced from 24 months to 13 months. Construction Management argued that
a minimum 15 months be allowed for the project, although more would be needed
to perform current scope of work.
Keep Agency Director Informed of Project at Every Review Stage: The
project team did not provide strong documentation of project scope and project
schedule from CMs, Cost Engineers, and Schedulers at each review stage to
Directors. As a result, they failed to understand what is being included in the
project construction documents prior to bid. This would eliminate demands to
shorten schedule duration, delete or reduce scope all just to reduce project budget.

72
This would also have ensured that project objectives were cleared and accepted
when the design package went out for bid.
Allow Time to Mitigate All Assumptions: During demolition and hazardous
material abatement activities, more hazardous materials were discovered in areas
that were not previously tested. As a result, additional days were added to the
project to complete removal of additional hazardous materials. The team should
have included ample time in the review process to survey building, perform initial
or additional testing to fully identify all unknowns, such as hazardous materials,
limited cavity spaces for routing conduits/wiring, loading restrictions, etc.
Develop team charter and roles during early pre-project planning: Project
disruptions were caused by team members who assumed project lead roles, but
lacked the necessary qualifications for managing the design and construction
efforts on this project, as well as coordination of multiple requirements and
people. Once project schedule slipped drastically, the amount of unresolved
change orders, and moral of internal staff began to impact General Contractor’s
and his subcontractors’ performance, then Upper Management stepped in and
made required change in project lead. The project team allowed personalities to
dictate or make demands that impacted the project outcome. Requirements from
all upper Management, who may not be on project management team, should
have been in place to sign charter and agree to not force changes to construction
management, life-safety, and security policies and procedures.
4.8. CASE STUDY 8: UNMITIGATED ASSUMPTIONS AND LATE PERMIT APPROVAL
FOR LNG PIPELINE INSTALL
This case study investigates a construction project involving the installation of a

73
natural gas pipe line that did not have proper regulatory licensing in place prior to
mobilizing and ultimately leading to various negative impacts. Table 19 identifies
(asterisked and highlighted in yellow) precisely which premature start drivers, leading
indicators and impacts occurred in this case.
Table 19: Case Study 8 Premature Start Drivers, Leading Indicators, and Impacts
Premature Start Drivers Leading Indicators Project Impacts
*Owner Mandated Overly
Aggressive Schedule
Engineering Documentation Not
Complete *Cost Overruns
*Owner Perceived Benefit For
Early Start Late Design Deliverables *Out of Sequence Work
*Time to Market *Unrealistic Schedule *Overtime/Unplanned Work
*Seasonal/Weather Constraints Material Not Available *Schedule Slippage
Regulatory Compliance Vendor Information Unavailable
Prior to Design *Rework
Capital Availability *Unmitigated Assumptions *Poor Productivity
*Contractor Eager to Get Started Unclear Project Objectives Scope Not Identified
*Contractor Perceived Benefit for
Early Start *Lack of Regulatory License/Permits
*Facility Start-up/Production
Delay
*Contractor Mobilization in Order
to Start Billing Unsupportive Management
*Relationship/Reputational
Damage
*Contract Terms in Place That
Incentivizes Mobilization Poor Morale
*Litigation/Claims
*Safety Exposure
Failure to Attract/Maintain Craft
Company Profile
The Owner company on this project belongs to the heavy industrial oil and gas
sector specializing in midstream gathering and transport. Areas of operation include
North America, Canada, and various offshore sites. For this project, engineering and
procurement was done in-house by the Owner’s engineering team. The Owner hired a

74
Contractor for construction.
Project Overview
This was a greenfield, natural gas infrastructure pipeline project in northern
United States. The project was being funded through a joint venture agreement between
three entities. Project scope consisted of seventeen miles of 24” high performance (HP)
steel pipeline. The total original expected budget for the project was $44.2 million. The
Owner who completed the engineering and procurement for the project awarded the
project in two sections to two different general contractors, Contractor #1 and Contractor
#2. Contractor #1 would build from the north and Contractor #2 would build from the
south. Both portions were awarded by hard bid based on issued for construction (IFC)
drawing packages.
The Northern portion of the project was completed in November of 2013 by
Contractor #1. The southern half of the project was expected to start in October 2013
(November 2013 actual start) and was to be completed in December of 2013 (not
completed until May of 2014) by Contractor #2. The cause of the November delay
happened because Contractor #2 could not begin construction until the northern portion
of the project was completed. The second reason was that clarification of the bid took
longer than expected.

75
Table 20: Project summary of cost and schedule
Sector Oil and Gas
Project Type Midstream Pipe Line
Construction Location Northeast USA
Contract Type Design, Bid, Build
Baseline Project Cost $44.2 million
Actual Project Cost (TIC) $50.5 million
Total Project Baseline Duration 3 months (southern pipe install)
Total Project Actual Duration 7 months
Critical startup of an associated compressor station was dependent on completion
of the southern portion of the project. The facility was complete in February, but startup
of it was delayed until May once the pipeline was in service. The interruption was caused
on the southern half of the project by a lack of railroad crossing permits. The drill was
originally scheduled for start on December 1st of 2013, and beat the winter weather, but
it actually started in mid-February once the railroad company finally felt comfortable
approving the crossing. Then, due to the late start to the Horizontal Directional Drill
(HDD), the project was delayed further. During the time of construction, the winter of the
first polar vortex was occurring and access roads to the bore site were degraded. Terrain
is described as mountainous and trucks had difficulty traveling uphill. Drilling mud
circulation lost pressure due to the cold temperature. The bore also hit unexpected rock
and caused drilling tools to get hung up in the hole causing further delays.
Driver(s)
This project faced several elements that drove the project to begin prematurely.
One significant driver was Seasonal / Weather Constraints. The project start was rushed
because the winter weather in the region made underground drilling very difficult and
very costly. Due to the fact that we really needed to get the compressor station
commissioned to avoid contractual penalties from the upstream producer, the owner was
76
highly motivated to begin construction on both the facility and the pipeline and be in-
service by January 2014. Also, the owner received better pipeline construction rates if
the project was completed before January due to higher construction rates that kicked into
effect Jan.1. Winter construction also proved to result in more Environmental Health and
Safety (EHS) incidents which there was a big push to decrease total incident rate in 2014.
The contractor and associated sub-contractor for the HDD had already had a rig in the
area and dedicated to the project and were incurring costs on it. The earlier they could get
started, the less mobilization they had to pay for on this rig and the more efficiently they
could use it on this project, which was reflected in their lower pricing when competitively
bid out. In summary, the drivers identified in this case were:
Owner Mandated Overly Aggressive Schedule
Owner Perceived Benefit of Early Start
Time to Market
Seasonal / Weather Constraints
Contractor Eager to Get Started
Contractor Perceived Benefit for Early Start
Contractor Mobilization in Order to Start Billing
Impact(s)
The impacts that resulted were 14% cost growth and 5 months delay to the in-
service date. These were caused by much out of sequence work associated with work
around for the pipeline contractor having to work on other parts of the pipeline while
waiting for the owner to obtain the permit. The contractors had to work overtime and
through the winter to make up the lost schedule days which resulted in rework as more
than average number of cut-outs were required upon final inspection. Additionally, there

77
were a higher than average number of environmental and safety incidents and ongoing
concerns from reclamation work associated with winter construction. There was
reputational damage and trust lost with the railroad company as well as with the Owner’s
customers and joint venture partners on their ability to meet the schedule. $14MM in
pending litigation with the general pipeline Contractor #2 also not reflected in the
estimate at completion. This is mainly a result of standby due to poor communication to
the HDD Contractor on when they could mobilize the rig based on expected dates to
receive the railroad crossing, unexpected rock hit during drilling, and winter weather
construction. The impacts of these interruptions are summarized below:
Cost Overruns
Out of Sequence Work
Overtime/Unplanned Work
Schedule Slippage
Rework
Poor Productivity
Facility Start-up / Production Delay
Relationship / Reputational Damage
Litigation / Claims
Safety Exposure
Leading Indicators
Potential leading indicators of a premature start for this project include lack of the
railroad crossing permit from the railroad company. The Owner typically allocates 90
days in the schedule for obtaining this permit. Due to the railroad company changing
ownership since our last dealings with them, this one took much longer than the 90 days

78
at 212 days. The project went ahead to construction without a railroad permit hoping to
get permit in 90 days. Other leading indicators include Contract Terms in Place That
Incentivizes Mobilization. Leading indicators identified on this project include the
following:
Unrealistic Schedule
Unmitigated Assumptions
Lack of Regulatory License / Permits
Contract Terms in Place That Incentivizes Mobilization
Lessons Learned
This section will address the various lessons learned from the project outcomes
and provide strategies to address each issue.
Unmitigated Assumptions on Permit Approval: The owner had based all of
their construction workflow on the previous permit turnaround timeline which
was on average 90 days. Construction mobilization took effect after the 90 day
clock was over but the permit was still not approved nor would be for quite some
time. If the owner had worked more diligently with the railroad committee and
communicated progress on permit approval to the team in a more timely fashion,
construction would have had more foresight into the mobilization of their crews.
The process should be started much earlier in the lifecycle of the project.
Owners Continuous Drive for Overly Aggressive Schedule: This is a
reoccurring leading indicator for the owner. The pressures of the onset of winter
and avoiding being the bottleneck for the facility startup added to the owners
drive for a schedule that was unrealistic. Planning such projects out ahead to
allow contingency time in the schedule for permit approvals and wintertime

79
construction delays should be a part of the owners project development on future
projects. In the end, although the intent to save costs for the core customers and
begin revenue from production were at the heart of the owner, its clear beginning
such work without all bases covered oftentimes delivers the opposite results.
4.9. DISCUSSION
From the in-depth case studies, the following initial drivers were identified:
owner’s schedule (time to market, early completion/occupation date), production and
commodity prices, grant and financial requirements/capital availability, liquidated
damages, and cultural issues. This initial list of drivers was revised and expanded after
the development of several more in-depth case studies. Also, lists of leading indicators
and project impacts were developed based on RT 323’s collective team expertise, as well
as in-depth case studies. In total, nine drivers, ten leading indicators, and thirteen impacts
were identified in research thrust one and can be seen below.
Premature Start Drivers: Owner Mandated Overly Aggressive Schedule; Owner
Perceived Benefit for Early Start; Time to Market; Seasonal/Weather Constraints;
Regulatory Compliance; Capital Availability; Contractor Eager to Get Started;
Contractor Perceived Benefit for Early Start; Contractor Mobilization in Order to
Start Billing.
Leading Indicators: Engineering Documentation not Complete; Late Design
Deliverables; Unrealistic Schedule; Material not Available; Vendor Information
Unavailable Prior to Design; Unmitigated Assumptions; Unclear Project
Objectives; Lack of Regulatory License/Permits; Unsupportive Management;
Contract Terms in Place that Incentivizes Mobilization.
Project Impacts: Cost Overruns; Overtime/Unplanned Work; Schedule Slippage;

80
Out of Sequence Work; Rework; Poor Productivity; Facility Start-up/Production
Delay; Scope not Identified; Relationship/Reputational Damage; Poor Morale;
Safety Exposure; Litigation/Claims; Failure to Attract/Maintain Craft.
As the case study research progressed, development and discovery of new terms
diminished, prompting RT 323 to cease pursuing additional case studies. Having reached
the point of diminishing returns, RT 323 decided to base the remaining research approach
off the categories and terms listed above. Each of these drivers, leading indicators, and
impacts are defined in the next chapter of this report.

81
Chapter 5: Definitions
From the in-depth case studies, three categories were identified: drivers, leading
indicators, and impacts. Each category contains terms that were defined and documented.
Since these categories and terms were to be used in subsequent research thrust, each term
had to be clearly defined. Careful consideration was given to each definition and was
evaluated by both owners and contractors. This ensured a non-biased approach to
defining and categorizing each term. This chapter contains a list of those definitions
developed by RT 323, including definitions for drivers, leading indicators, and impacts.
5.1. DRIVER CATEGORIES
Drivers are understood as a condition or requirement that initiates a sequence of
events. Below is a list of drivers of premature starts identified by RT 323 and their
respective definitions.
Time to Market: Represents the owner’s market-driven timeline for getting a
product to the consumer.
Capital Availability: Represents the point at which an organization has approved
funding. Capital funding is threatened at a future time if you don’t start now.
Owner mandated overly aggressive schedule: Owner has set dates without
sufficient design and planning. Not feasible or valid based on expert input.
Owner perceived benefit for early start: Owner believes that by starting early
benefits will be found, for example a lower risk to schedule, public relations
opportunities.
Contractor perceived benefit from early start: Contractor believes that by
starting early benefits will be found, for example a lower risk to schedule,
manpower availability, contractual incentives more achievable.
82
Contractor eager to get started: The natural tendency for construction
contractors to begin work as early as possible believing the project will benefit.
The construction contractor is dedicating resources and pushing to mobilize early,
imposing pressure on the owner to release premature construction drawings.
Contractor mobilization in order to start billing: The construction contractor
has resources to dedicate to the project and/or is incentivized to mobilize early in
order to retain these resources and commence project billing. Contract terms and
owner oversight could be important factors for this driver.
Regulatory Compliance: Any requirements imposed by an outside agency with
authority over the approval and/or requirement of the project. An example would
be air permit approval from Department of Environmental Quality prior to a
natural gas facility startup or receiving an occupancy permit from the delegated
agency prior to occupying a newly constructed building.
Seasonal/Weather constraints: External environmental factors in a specified
region that should be considered in the project scope, budget, and schedule
creation. These constraints can be imposed by an authorized agency or by natural
circumstances. An example of this would be planning summer construction on a
building project in an artic climate to avoid large crane work and hanging roof
panels in a cold, windy environment or planning a bridge project in Louisiana
outside of hurricane season.
5.2. LEADING INDICATOR CATEGORIES
Leading Indicators are understood as an early warning sign or red flag that could
signal a premature start to construction. Below is a list of leading indicators of premature
starts identified by RT 323 and their respective definitions.

83
Unrealistic schedule: A schedule that does not have ‘buy-in’ by all stake holders;
for example a schedule that is known to be more aggressive than previous
experience would suggest, a schedule risk analysis (SRA) reflects low chance of
success.
Engineering Documentation Not Complete: The information to be provided by
engineering is either incorrect or missing.
Material not available: Materials or Equipment are not onsite or at the workface
at the time the craft requires.
Unclear project objectives: Drivers for the project are not well known
throughout all stake holders.
Unmitigated Assumptions: Assumptions determined at the beginning of the
project were not considered or resolved.
Contract terms in place that incentivize mobilization: The contract is
structured in a manner that milestone payments are tied to mobilization or
conditions that may influence mobilizing.
Unsupportive management: Management of the project does not have a focus
on the possible impacts of mobilization; for example incompetent or disengaged
manager.
Late Design Deliverables: Engineering information was not provided to the
project when promised.
Lack of Regulatory license/permits: License and / or permits were late in
approval.
Vendor information unavailable prior to design: Original Equipment
Manufacturer information was not provided and / or approved when required.

84
5.3. IMPACT CATEGORIES
Impacts are understood as a result or outcome due to a premature start to
construction. Below is a list of impacts of premature starts identified by RT 323 and their
respective definitions.
Cost Overruns: A cost overrun, also known as a cost increase or budget overrun,
involves unexpected costs incurred in excess of budgeted amounts due to an
underestimation of the actual cost during budgeting.
Overtime / Unplanned Work: Unplanned overtime required to overcome an
unexpected bottleneck or to alleviate a 'behind schedule' situation due to an
interruption, outage.
Rework: Correcting of defective, failed, or non-conforming item, during or after
inspection. Rework includes all follow-on efforts such as disassembly, repair,
replacement, and reassembly. Rework could be required because of unidentified
scope, vendor, engineering, or construction errors.
Out of sequence work: Work not conforming to the order of the intended plan.
Poor Productivity: Performing below the expected baseline productivity rate.
Scope not Identified: A result of an existing condition or objective NOT
identified or inferred.
Schedule Slippage: A delay in completion of project milestones or activities.
Facility Start-up / Production Delay: Delay to the use of a capital asset.
Litigations / Claims: A dispute due to an event or change beyond the terms of an
agreement.
Safety Exposure: Creating an environment or situation that increases safety risk.
Failure to attract / Maintain Craft: Creating an environment or situation that
makes it difficult to recruit and/or retain skilled and productive craft labor.

85
Poor Morale: An environment or culture where enthusiasm is reduced. This
could be due to delays, standby, rework, or management issues.
Relationship / Reputation Damage: Strain on a personal or professional
relationship which can harm reputation.

86
Chapter 6: Research Findings
This chapter contains the research results and findings from all research thrusts
and data acquisition techniques utilized by RT 323. The chapter is broken up into three
parts. The first section discusses the results from the qualitative case study based
approach. Following the results from the first research thrust, the second research thrust
results are outlined and discussed in detail. The final section of this chapter will discuss
the implications of the overall research findings.
6.1. QUALITATIVE RESEARCH RESULTS
The first research thrust focused on identifying drivers and leading indicators
associated with premature starts through case study based research. RT 323 began this
research phase with pilot case studies submissions from each team member. Each pilot
case study was carefully reviewed in order to ensure that the project fit the definition of a
premature start. After two rounds of pilot case study submissions, RT 323 evaluated a
total of twenty pilot case studies, of which eight were classified as a premature start case.
Each case study contains at least one element of a premature start to construction. The
drivers of each premature start differ from case to case but the single most common
driver, found on every case study, was owner mandated overly aggressive schedule. The
two least common premature start drivers, found on only once on two separate cases, was
contractor mobilization in order to start billing and contractor perceived benefit to start
early. Table 21 briefly summarizes each case study and which drivers were discovered on
that particular project.

87
Table 21: In-Depth Case Studies Summary
Owner /
Contractor
Description Industry
Sector
Project
Cost $
Drivers
1 Contractor
Renewable
Energy Project
Heavy
Industrial
$240M
Owner Mandated Overly Aggressive
Schedule, Time to Market, Capital
Availability
2 Contractor
Chemical Plant
Refurbish
Heavy
Industrial
$135M
Owner Mandated Overly Aggressive
Schedule, Owner Perceived Benefit For
Early Start
3 Owner Tank
Refurbishment
Project
Heavy
Industrial
$4.3M
Owner Mandated Overly Aggressive
Schedule, Time to Market, Regulatory
Compliance, Capital Availability
4 Contractor
Franchise Utility
Ductbank
Infrastructure
$3.7M
Owner Mandated Overly Aggressive
Schedule, Owner Perceived Benefit For
Early Start, Time to Market, Regulatory
Compliance
5 Owner
Oil and Gas
Gathering Site
Heavy
Industrial
$41.3M
Owner Mandated Overly Aggressive
Schedule, Owner Perceived Benefit For
Early Start, Time to Market
6 Contractor Install New
Furnaces
Heavy
Industrial
$200M Owner Mandated Overly Aggressive
Schedule, Owner Perceived Benefit For
Early Start, Time to Market, Contractor
Eager to Get Started, Contractor Perceived
Benefit for Early Start
7 Owner Historic
Renovation
Buildings
$27.7M
Owner Mandated Overly Aggressive
Schedule, Owner Perceived Benefit For
Early Start, Time to Market, Regulatory
Compliance, Capital Availability
8 Owner
Natural Gas
Pipeline Install
Heavy
Industrial
$50.5M
Owner Mandated Overly Aggressive
Schedule, Owner Perceived Benefit For
Early Start, Time to Market, Seasonal /
Weather Constraints, Contractor Eager to Get
Started, Contractor Perceived Benefit for
Early Start, Contractor Mobilization in Order
to Start Billing
For research thrust one, the team followed a two-step case study analysis process
as follows:
Intra-case analysis: description of a single project with a documented premature
start, impacts, drivers, potential leading indicators;
Cross-case analysis: section cut of common information across all cases to
identify commonalities and patterns in drivers, impacts and leading indicators.
For each case study, RT 323 identified the company or organization profile to
serve as background information for the reader. Project team members were interviewed;

88
a narrative containing drivers that led to the premature start, the main interruption, and
the impacts of that interruption to construction were documented. These items were then
tabulated, as shown in Table 22.
Table 22: Premature Start Drivers, Leading Indicators, and Impacts
Premature Start Drivers Leading Indicators Project Impacts
Owner Mandated Overly
Aggressive Schedule Engineering Documentation Not
Complete Cost Overruns
Owner Perceived Benefit For Early
Start Late Design Deliverables
Overtime/Unplanned
Work
Time to Market Unrealistic Schedule Schedule Slippage
Seasonal/Weather Constraints Material Not Available Out of Sequence Work
Regulatory Compliance Vendor Information Unavailable
Prior to Design Rework
Capital Availability Unmitigated Assumptions Poor Productivity
Contractor Eager to Get Started Unclear Project Objectives Facility Start-up /
Production Delay
Contractor Perceived Benefit for
Early Start
Lack of Regulatory License /
Permits Scope Not Identified
Contractor Mobilization in Order
to Start Billing Unsupportive Management
Relationship /
Reputational Damage
Contract Terms in Place That
Incentivizes Mobilization Poor Morale
Safety Exposure
Litigation / Claims
Failure to Attract /
Maintain Craft
These categories represent the extent of premature start drivers, leading
indicators, and impacts that were identified and documented through research thrust one.
Definitions of each item can be found in Implementation Resource 323-2. Research thrust
two expanded research thrust one by quantifying each category by surveying industry
professionals. Through this method, the research team obtained a rating of commonality
of each driver, leading indicator, and impact.

89
6.2. QUANTITATIVE RESEARCH RESULTS
This section discusses the outcomes from the survey-based research conducted by
RT 323. Outcomes from the case study based research approach were taken into account
during data gathering from the survey approach. This included using the categories and
terms defined during the case study research phase. In order to capture the construction
background of each respondent, question one and two ask which industry sector and
company he respondent is associated with. Question one askes “which of the following
best describes your company”. Possible answer to question one could be either of the
following: Owner, Construction Contractor, Engineering Firm, and Other.

90
Figure 2: Results from question one of the survey.
Figure 2 represents the breakdown of survey respondents. The majority of survey
respondents were made up of owners and contractors. Slightly over one-tenth of the
respondents were from engineering firms. Those companies that fell into the “other”
category were suppliers, vendors, and insurance companies.

91
Figure 3: Further breakdown of the results from question one.
Figure 3, derived from question one, groups the respondents by owner and
contractor. Based on what the respondents entered in the “other” category, the team split
them into either an owner or contractor classification. Of the 16% of “others”, only 2-3%
fell into the owner category. Of the respondents, there was roughly a 50/50 split between
owners and contractors. This relatively equal split indicates that there should be minimal
bias in the results by one viewpoint versus another. Of the respondents, 93 associated
with Owners and 99 associated with Construction Contractors. There still appears to be
an even breakdown between owners and contractors. Of the contractor category, there
was representation from both construction and engineering which broadens the
viewpoints for consideration of the data. Also in the contractor portion of “other”, there
was representation from procurement companies, which helps confirm representation

92
from all aspects of the EPC spectrum.
Question two of the survey addresses which industry sector the responding
companies belong to. Figure breaks down the respondents by CII-defined industry
sectors. These results suggest that the data captured a broad range of industry types
indicating a broader viewpoint taken with the data. Although the data shows we have
covered the four main sectors (i.e., heavy industrial, light industrial, buildings,
infrastructure), the predominant classification was heavy industry at 76% of the
respondents.
Figure 4: Survey respondents classified into CII defined industry sectors.

93
For questions three through six, the respondents were asked to answer while
thinking of their overall construction project related experience rather than one individual
project. This was meant to obtain a comprehensive look at the occurrence of drivers and
leading indicators throughout the construction industry rather than a single project, which
would potentially be considered an outlier. The subsequent questions utilize the Likert
scale by asking respondents to answer questions by selecting a number one through five,
where one is least common and five is most common.
Question three addresses the likelihood of occurrence of a premature start driver.
The question is worded as follows: “Rate how often each driver causes a premature start
to construction. Results are illustrated in Figure 5.
Figure 5: Question three of the survey asking respondents to rate how often each driver
causes a premature start to construction.
Figure 5 shows for any of the listed potential drivers, the frequency for which

94
they cause a premature start to construction. The number displayed represents the average
rating out of 5 for each driver. From the data, the top three drivers which cause a
premature start to construction are “Owner mandated overly aggressive schedule”,
“Owner perceived benefit for early start”, and “Time to Market”, respectively. It is
interesting to note that the most significant drivers appear to be owner initiated.
Figure 6, taken from question three responses, is a spider chart that shows the
comparison between driver commonality, shown for both owners and contractors. The
average rating between the two categories suggests strong similarities between owners
and contractors due to the general shape of each graph being similar. Also, it should be
noted that for all drivers except for two (e.g., Capital Availability and Seasonal and
Weather Constraints), the contractor’s ratings on drivers is on average higher than that of
owners. This could advise that contractors are more concerned about the commonality of
each of the drivers than owners. An interesting point on the chart is that of the highest
rated driver, “Owner mandated overly aggressive schedule” at 4.10 out of 5, there is the
biggest gap between owner and contractor rating, although both are rated high. Owners
may be aware of the commonality of this driver and understand its owner created, but do
not understand its impact on the contractors.

95
Figure 6: Spider graph from question three of the survey, separated by Owner and
Contractor.
The next question of the survey, question four, asks the respondents to rate how
often the following leading indicators are associated with a premature start. The purpose
of this question was to obtain a quantitative representation of the leading indicators
discovered through the case study-based research.

96
Figure 7: Question four of the survey asking respondents to rate how often each leading
indicators is associated to a premature start to construction.
Figure 7 shows the frequency that the listed potential leading indicators are
associated with premature starts to construction. The number displayed represents the
average rating out of 5 for each “red flag” or leading indicator. From the data, the top
three leading indicators which cause a premature start to construction are “Engineering
Documentation not Complete”, “Late Design Deliverables”, and “Unrealistic Schedule”,
respectively. It is interesting to note that the top two most significant drivers appear to be
contractor related deliverables, while the third highest could be imposed by either owner
or contractor.

97
Figure 8: Spider graph from question four of the survey separating Owner and
Contractor.
Figure 8 is taken from question 4 responses, is a spider chart that shows the
comparison between leading indicator commonality between the owner and contractor
respondents. The average rating between the two categories suggests strong similarities
between owners and contractors due to the general shape of each graph being similar.
Also, it should be noted that for all leading indicators, the contractor’s ratings is on
average higher than that of owners, suggesting they are more sensitive to interrupted
construction. This could warn that contractors are more aware of the leading indicators
than owners. An interesting point on the chart is that of the highest rated leading
indicators, “engineering documentation not complete” and “late design deliverables”, are
contractor induced. While both owners and contractors see it as an issue due to high
ratings, contractors may be more aware of the deficiency imposed by them on the owners.
It’s possible though that there are other owner imposed drivers that may drive these

98
indicators.
Questions five and six pertain to premature start related impacts. Respondents
were first asked to rate how often each impact occurs as a direct result from a premature
start. Secondly, they were asked to rate the severity of each impact as a result of a
premature start. Survey respondent results can be seen in the following figures.
Figure 9: Results from questions five and six of the survey asking respondents to rate the
commonality and severity of each impact resulting from a premature start.
Figure 9 represents data from questions five and six. The red bars in the bar graph
show impact commonality while the blue bars represent impact severity. They are plotted
on the chart together to investigate whether there is or is not a relationship between the
two. The impact commonality is shown from highest ranking to lowest ranking with the
corresponding severity. For all except four impacts, commonality is greater than severity.
These four impacts are “Scope not identified”, “Facility start-up/production delay”,

99
“Safety exposure”, and Litigation/claims”. The perception of these impacts favors
severity, which is understandable. Scope not identified and Facility start-up
delay/production delay can seriously jeopardize project success if encountered. Similarly,
safety exposure in industry is extremely scrutinized and an important criteria for
workforce selection that it should be less common. An industry experience with
litigations and claims is extremely impactful to reputation and can severely damage
relationships.
In general there is a fair agreement in trends between commonality and severity,
such that the most common impacts are also the most severe and the least common are
also the least severe. This is further shown in Figure 10 below.
Figure 10: Premature start impacts plotted by severity and commonality.

100
Figure 11: Spider graph from question five of the survey separating Owner and
Contractor.
Figure 11, taken from question five responses, is a spider chart that shows the
comparison between impact commonality between the owner and contractor respondents.
The average rating between the two categories suggests strong similarities between
owners and contractors due to the general shape of each graph being similar. This is the
first chart where owners had some ratings higher than contractors. The impacts that
owners rated higher than contractors are “Rework”, “Overtime/unplanned work”, and
“Schedule slippage”, in this order. Schedule slippage, from the owner’s perspective, can
be seen as a key priority for a lot of owners on projects. Thus the impacts from rework
and overtime/unplanned work, risk the owners schedule and costs on the project.

101
Figure 12: Spider graph from question six of the survey separating Owner and
Contractor.
Figure 12, taken from question six responses, is a spider chart that shows the
comparison between impact severity between the owner and contractor respondents. This
graph shows the most pronounce differences between owners and contractors ratings on
the impacts, in terms of degree of severity. This suggests once again that the contractors
are more sensitive to the severity of these impacts. “Facility start-up/production delay”
and “Schedule slippage” having higher ratings for the owners than the contractors is
expected, but counter to expected results for “cost overruns”, the contractors rating is
higher for this impact. Of the other ratings where the contractors were higher, it’s
expected they would be higher than the owners, and suggests that the owners understand
the impact severities but don’t appreciate the impact severity on the contractors. This is
most evident for “out of sequence work”, “poor productivity”, and “litigation/claims”,

102
which can all affect a contractors relationship to his customers and his craft.
Figure 13: Premature start impact rating developed my multiply the commonality rating
by the severity rating.
Figure 13 represents the product of Commonality and Severity for each impact.
The trend by categories is identical to the trend as categorized by impact commonality
and severity which suggests consistency in the data. This reinforces the relationship
between impact commonality and severity.
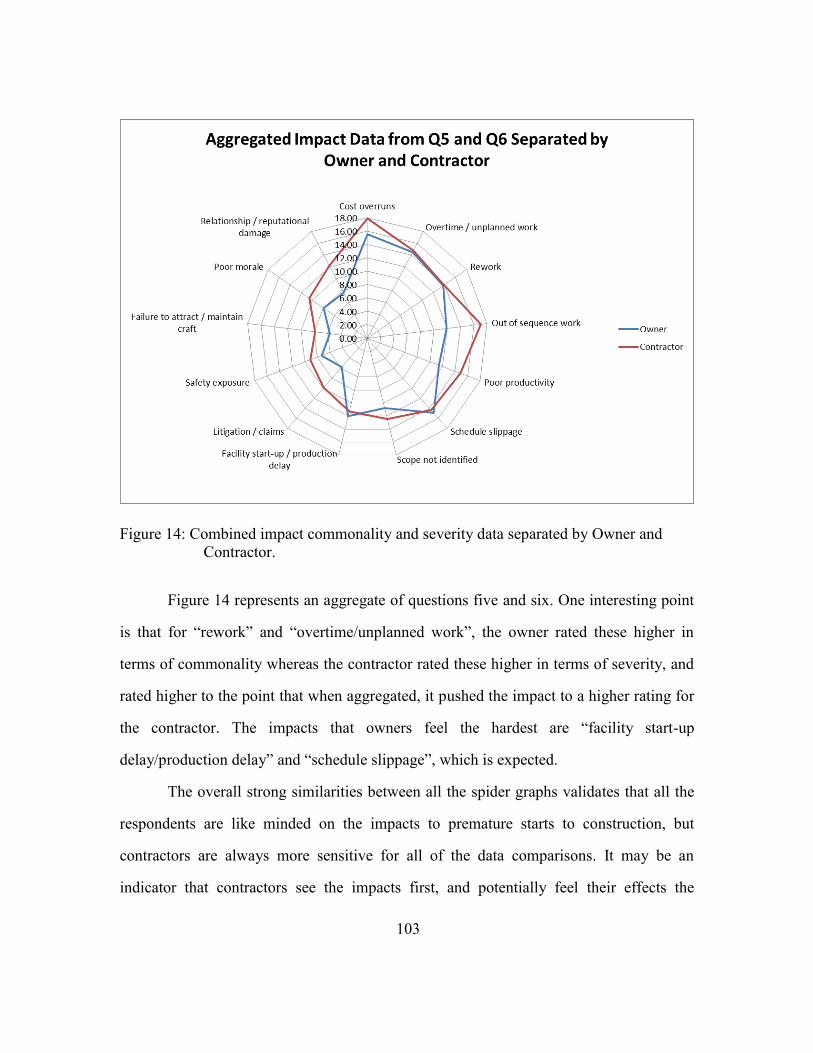
103
Figure 14: Combined impact commonality and severity data separated by Owner and
Contractor.
Figure 14 represents an aggregate of questions five and six. One interesting point
is that for “rework” and “overtime/unplanned work”, the owner rated these higher in
terms of commonality whereas the contractor rated these higher in terms of severity, and
rated higher to the point that when aggregated, it pushed the impact to a higher rating for
the contractor. The impacts that owners feel the hardest are “facility start-up
delay/production delay” and “schedule slippage”, which is expected.
The overall strong similarities between all the spider graphs validates that all the
respondents are like minded on the impacts to premature starts to construction, but
contractors are always more sensitive for all of the data comparisons. It may be an
indicator that contractors see the impacts first, and potentially feel their effects the

104
greatest.
Question seven asked respondents to answer the question based on their most
recent project experience that had a premature mobilization. Note that this differs from
questions three through six, which asked respondents to answer based on all construction
project related experience. Question seven had four sub-questions, all related to project
cost and schedule.
Table 23: Cost and schedule survey results.
Reponses to question seven indicated strong similarity between the cost and
schedule growth associated with the respondent’s projects that experienced a premature
start to construction. Given over 130 respondents across all of the industry sectors, the
data suggests that one should expect a 15% cost and schedule growth on projects that
experience a premature start to construction. Thus, if a leading indicator is identified in
the planning phases of a project suggesting a potential for construction interruptions, one
can draw on this potential for 15% growth and re-evaluate contingency and/or proceeding
with the project. Question 7c suggests that since there is such a broad range of project
costs reported in the data, the applicability of this research spans the spectrum of small to
large value projects.
6.3. DISCUSSION
Through research thrust one, RT 323 discovered common factors that can be seen
on multiple projects of various scope definition, industry sector, and total project value.
Average Min Median Max
Q7.a - Approx. Project Cost Growth (%) 23.4% 0.5% 15.0% 200.0%
Q7.b - Approx. Schedule Growth (%) 23.2% 0.0% 15.0% 200.0%
Q7.c - Approx. Project Cost (TIC, million of dollars) $185 $0.115 $65 $5,000
Q7.c - Approx. Contract Cost (million of dollars) $134 $0.100 $30 $4,000
Q7 - What was the approximate cost and schedule growth?
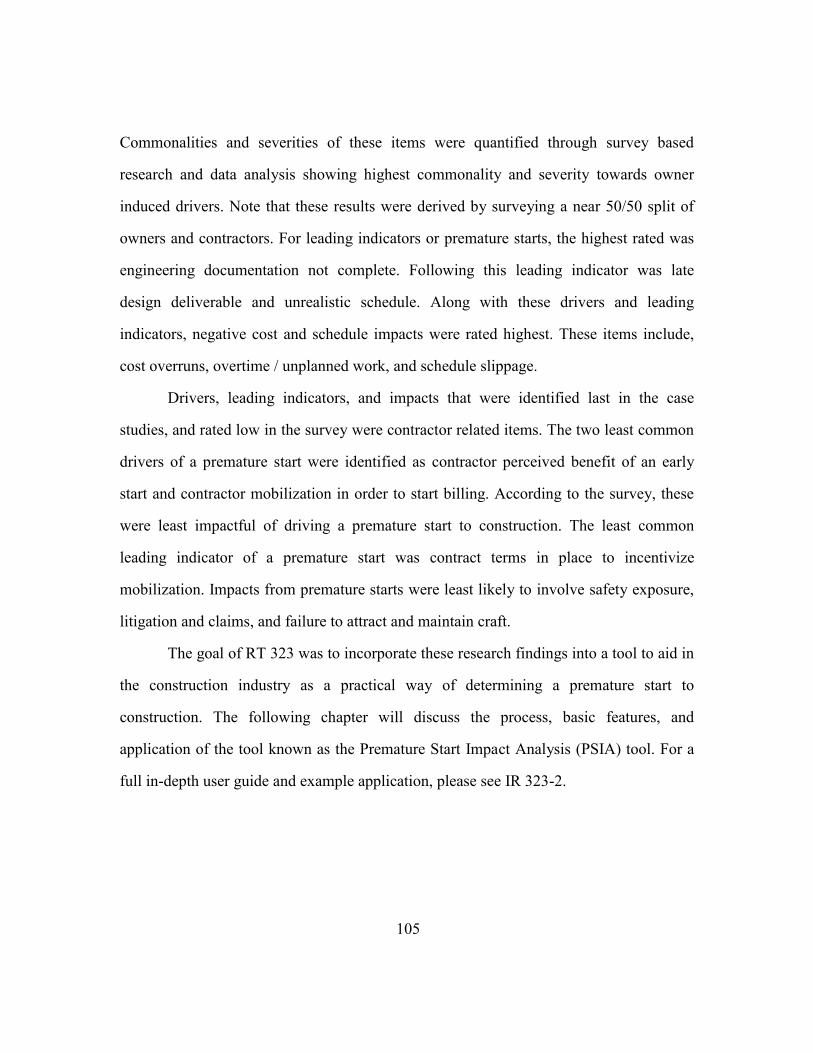
105
Commonalities and severities of these items were quantified through survey based
research and data analysis showing highest commonality and severity towards owner
induced drivers. Note that these results were derived by surveying a near 50/50 split of
owners and contractors. For leading indicators or premature starts, the highest rated was
engineering documentation not complete. Following this leading indicator was late
design deliverable and unrealistic schedule. Along with these drivers and leading
indicators, negative cost and schedule impacts were rated highest. These items include,
cost overruns, overtime / unplanned work, and schedule slippage.
Drivers, leading indicators, and impacts that were identified last in the case
studies, and rated low in the survey were contractor related items. The two least common
drivers of a premature start were identified as contractor perceived benefit of an early
start and contractor mobilization in order to start billing. According to the survey, these
were least impactful of driving a premature start to construction. The least common
leading indicator of a premature start was contract terms in place to incentivize
mobilization. Impacts from premature starts were least likely to involve safety exposure,
litigation and claims, and failure to attract and maintain craft.
The goal of RT 323 was to incorporate these research findings into a tool to aid in
the construction industry as a practical way of determining a premature start to
construction. The following chapter will discuss the process, basic features, and
application of the tool known as the Premature Start Impact Analysis (PSIA) tool. For a
full in-depth user guide and example application, please see IR 323-2.

106
Chapter 7: Premature Start Impact Analysis Tool
The Premature Start Impact Analysis (PSIA) tool is used as an objective source of
information to support decisions regarding construction readiness. The tool contains
valuable industry data but requires the user to first provide input in order to generate
output tailored to an organization’s and project’s conditions.
7.1. DEVELOPMENT
The PSIA is a Microsoft Excel-based application that utilizes several macros. The
PSIA works by gathering user input and generating an assessment report by referencing a
database within the Excel workbook. The PSIA includes all data collected through the
research process, including 194 survey results, summary calculations, data categories and
definitions, and example case studies. The tool organizes data in a relational structure to
link business drivers to leading indicators, and links potential impacts to combinations of
these factors with applicable case studies that provide detailed real-world examples of
premature starts. The assessment process follows a fixed series of activities, except for
the starting step. You can begin the input process either by: 1) selecting your project’s
business drivers or 2) selecting your project’s leading indicators. Figure 15 and Figure 16
depict the process starting with business drivers, and depicts the process starting with
leading indicators.
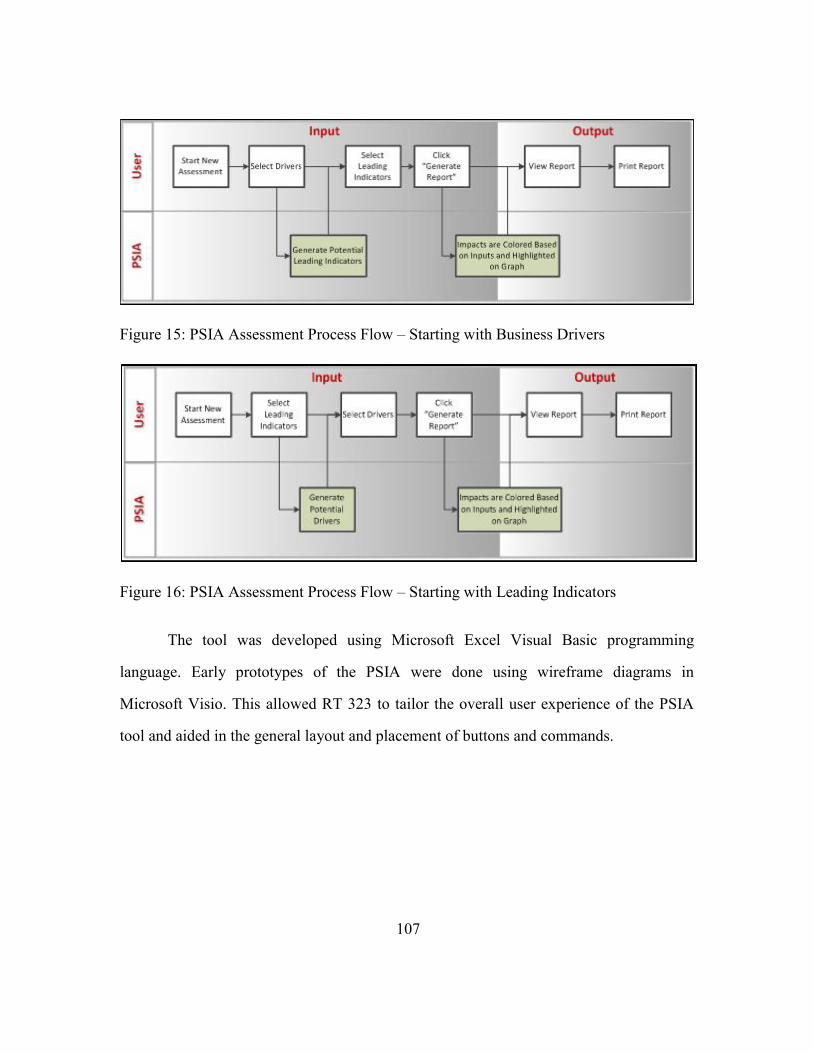
107
Figure 15: PSIA Assessment Process Flow – Starting with Business Drivers
Figure 16: PSIA Assessment Process Flow – Starting with Leading Indicators
The tool was developed using Microsoft Excel Visual Basic programming
language. Early prototypes of the PSIA were done using wireframe diagrams in
Microsoft Visio. This allowed RT 323 to tailor the overall user experience of the PSIA
tool and aided in the general layout and placement of buttons and commands.

108
Figure 17: Early Example of PSIA Graphical User Interface
Once a layout was reviewed by the team, the design of the tool moved from Visio
to Excel. In order to make the tool an interactive experience, extensive use of macros and
Visual Basic coding were implemented. Moreover, the inclusion of a comprehensive
database depicting the outcomes of each case study was added. Incorporating a database
of case studies allowed for additional features to be included in the design of the PSIA.
Such features include prompting the user to RT 323 case studies that pertain specifically
to the user inputs. The tool works by taking the user inputs and references a database that
contains all possible driver-leading indicator-impact relationships supported by the
qualitative case study-based research. Figure 18 represents a snippet of the database that
is being referenced. The database was created by going through each possible driver-
leading indicator-impact combination and checking if any of the case studies support that
particular combination.

109
Figure 18: Snippet of PSIA database
The first column of the spreadsheet lists all of the drivers. With the instance of a
single driver, there exists a leading indicator occurrence. Within each driver-leading
indicator relationship, there are associated impacts. The columns label “CS1” through
“CS8: represent each case study. An “x” in that column indicates that that particular case
study experienced that driver-leading indicator-impact combination. For example, case
study 5 (CS5) experienced cost overruns due to an “Owner Mandated Overly Aggressive
Schedule” and had “Engineering Documentation Not Compete” as a leading indicator. It
did not, however, experience “Out of Sequence Work” due to the same driver-leading
indicator combination.
The purpose of this database was to have the user input drivers and leading
indicators recognized on their current project and have the tool return potential impacts
that were identified in this research. For example, if the user selects “Owner Mandated
Overly Aggressive Schedule” as a potential driver and selects “Engineering
Documentation Not Complete”, the output warns the user that “Cost Overruns are Likely
to Occur”. The tool also references the case study that supports this claim as well as the

110
survey data collected during the qualitative phase of this research. For a full explanation
of PSIA features and example applications, refer IR 323-2.
7.2. PSIA FEATURES
In order to make the PSIA more user friendly, the tool was created on a software
platform that is familiar with most professionals in the construction industry: Microsoft
Excel. The first few sheets contain help pages with user instructions. The user instruction
sheet contains a guided step by step instruction and screenshots of various stages of the
analysis process. Inputs and outputs are condensed in one single sheet, known as the
‘Assessment Summary’, in order to provide an easy means of determining where the user
is along the analysis process. Figure 19 illustrates what this sheet looks like.
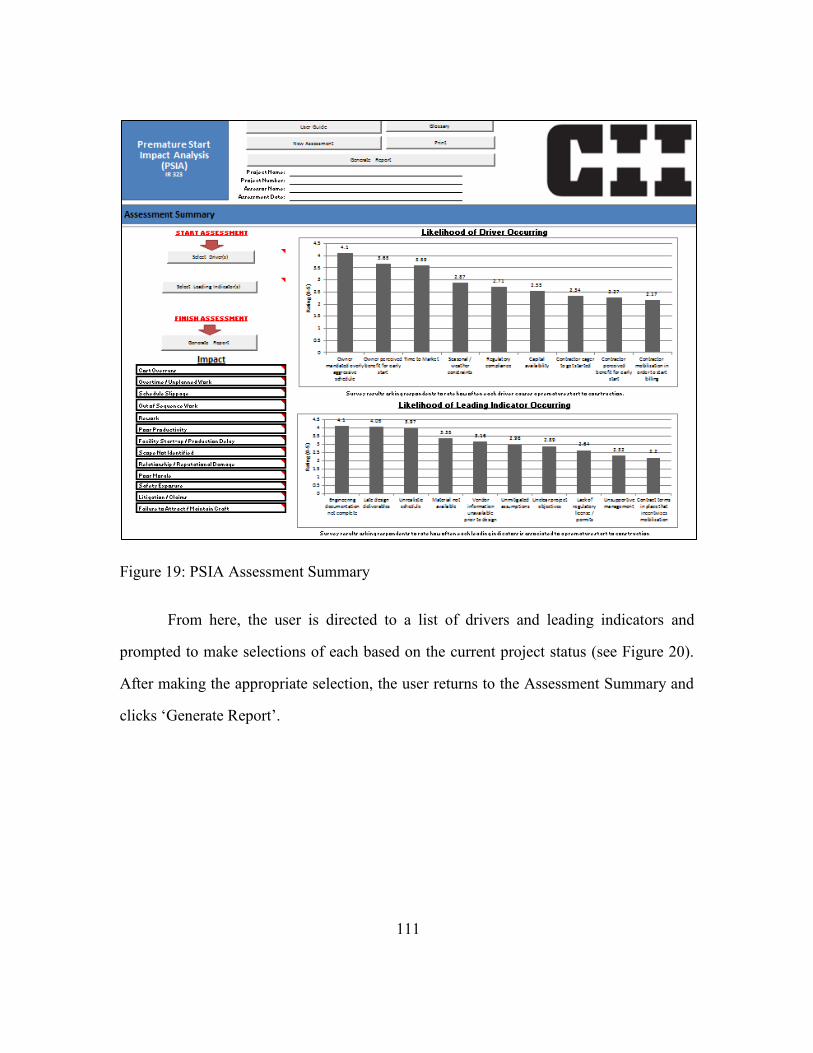
111
Figure 19: PSIA Assessment Summary
From here, the user is directed to a list of drivers and leading indicators and
prompted to make selections of each based on the current project status (see Figure 20).
After making the appropriate selection, the user returns to the Assessment Summary and
clicks ‘Generate Report’.
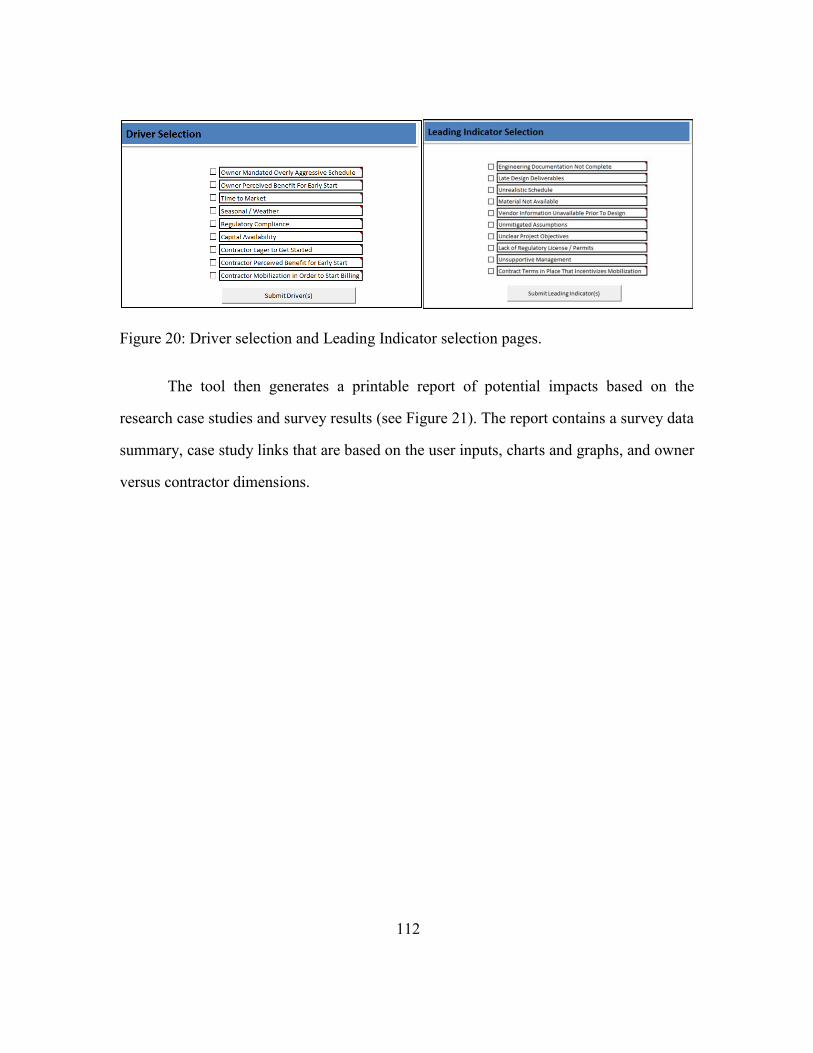
112
Figure 20: Driver selection and Leading Indicator selection pages.
The tool then generates a printable report of potential impacts based on the
research case studies and survey results (see Figure 21). The report contains a survey data
summary, case study links that are based on the user inputs, charts and graphs, and owner
versus contractor dimensions.
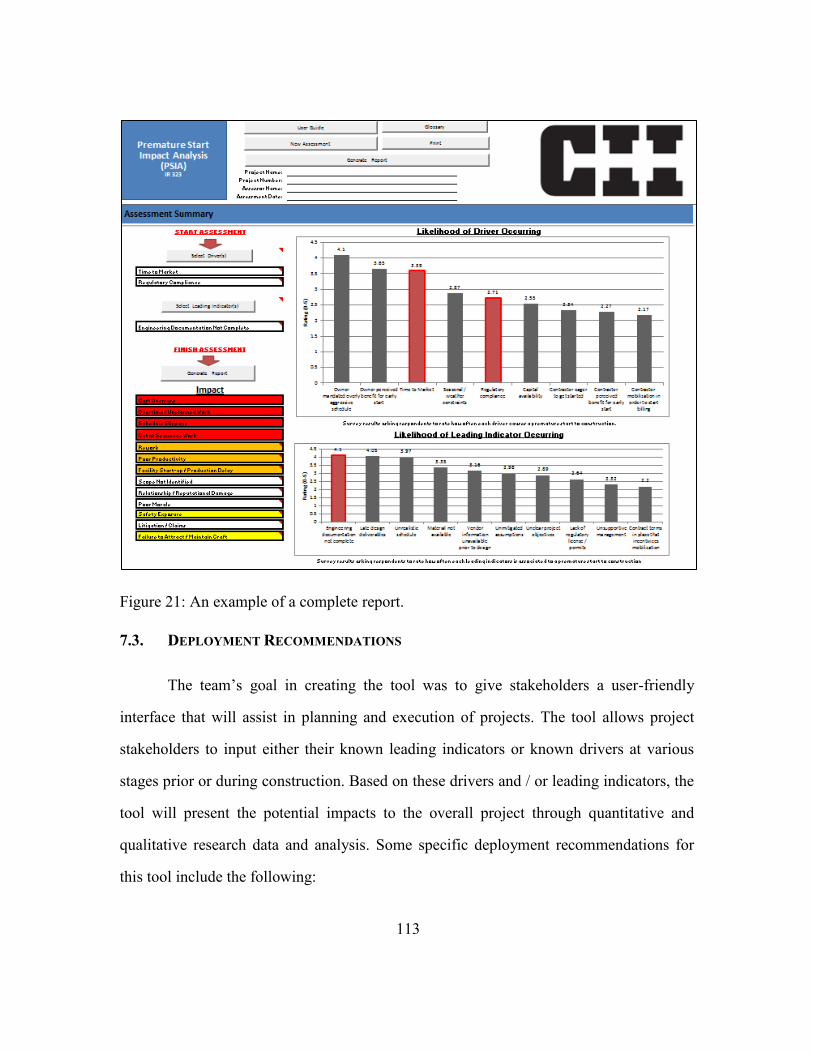
113
Figure 21: An example of a complete report.
7.3. DEPLOYMENT RECOMMENDATIONS
The team’s goal in creating the tool was to give stakeholders a user-friendly
interface that will assist in planning and execution of projects. The tool allows project
stakeholders to input either their known leading indicators or known drivers at various
stages prior or during construction. Based on these drivers and / or leading indicators, the
tool will present the potential impacts to the overall project through quantitative and
qualitative research data and analysis. Some specific deployment recommendations for
this tool include the following:

114
Project Risk Assessment
The inputs and outputs of this tool are tied directly to the Risk Assessment
Process for the User’s projects. The primary output of the tool is the identification of
potential impacts to a project based on the known drivers and leading indicators of
premature starts to construction. These impacts are essentially potential risks to the
project that the project management team must assess and mitigate. The tool ‘impacts’
can be utilized to populate the project’s risk register. The tool also provides the
commonality and severity of identified risks which can be used to weight the potential
risks in an existing company risk register. Ultimately, the tool helps to facilitate open
communication regarding the project based on hard data that feeds the development of
risk avoidance and mitigation strategies and plans.
Dispute Prevention and Resolution
The tool provides a platform for interface between different project stakeholders.
For example, project managers and construction managers can use the tool to physically
demonstrate the potential impacts of starting construction prematurely to owners or their
internal senior management. The tool provides tangible data for review and analysis and
facilitates open discussion regarding risks and their potential impacts.
Knowledge Sharing and Transfer
The tool can serve as a training aid for less trained or experienced project
stakeholders. It can also simply serve as a tool to share information among team
members. By knowing and understanding the potential impacts, team members can make
more informed project decisions.

115
Lessons Learned
The tool output includes links to detailed case studies which provide real world
examples of impacts stemming from premature starts to construction. It also provides real
examples of drivers and leading indicators that led to real impacts to projects. These
examples are essentially lessons learned that can be applied to current and future projects.
7.4. PSIA DEPLOYMENT DEMONSTRATION
In order to test the applicability of the PSIA, RT 323 chose to use completed
construction projects from the pilot case study rounds that were not used as in-depth case
studies. This section will go through two projects that experienced interruptions and use
the PSIA to see if certain impacts could have been avoided. Note that the projects
reviewed in this section were NOT used in the development of the PSIA. Projects that
were used in the development of the PSIA were in-depth case studies only and the project
characteristics had to clearly satisfy the definition of a premature start as defined by RT
323. Of the twelve pilot case studies that did not qualify as a premature start, only two
projects had clear project drivers and leading indicators. The remaining ten pilot case
studies either had only drivers and no identifiable leading indicators or only leading
indicators and no discernable driver. The two projects used in this demonstration will be
referred to as sample projects.
7.5. SAMPLE PROJECT 1
This project is an eleven month brownfield chemical plant construction project
with an original firm bid of $25 million. The goal of owner was to complete the project
two months early for aggressive marketability. During the engineering design phase,
piping and instrumentation design (P&ID) was delayed one month, yet no schedule
changes were made except for reduction and removal of float times. Construction start

116
data was not modified. Prior to mobilization, the foundation design was based on
assumptions of soil conditions, though geotechnical survey was scheduled. The original
design was for 30 shallow (20’) drilled piers that were to be done by the civil contractor.
After a geotechnical survey was completed, new foundation design required that 120, 70’
piles would be needed. This required the owner to issue a new contract to get a piling
contractor. Although the owner was able to rather quickly get a contractor on site who
had piles in stock, the contractor made surveying error and drove all of the piles in the
wrong location. This error was not discovered until in the process of pouring pile caps.
This required a “global” shift of the plant which delayed the schedule by approximately
one month, costing the owner $650,000. The desire for early plant startup was not met.
The driver of this project was clearly “time to market”. A leading indicator for
this project, due to late delivery of piping and instrumentation design, could be classified
as “late design deliverables”. If we input these items in the PSIA, as shown in Figure 22,
we should expect to receive outputs that indicate negative impacts that are consistent with
what actually was experienced by the project team.
Figure 22: An example of user driver and leading indicator inputs for Sample Project 1.

117
Once the user has selected the appropriate driver and leading indicator, the report
can then be generated. The output of PSIA is shown in Figure 23.
Figure 23: PSIA output for Sample Project 1.
The PSIA correctly identified two project impacts that were identified; “cost
overruns and “schedule slippage”. The original plant start-up date was not met so the
PSIA also correctly identified “facility start-up / production delay” as a potential impact.
Sample Project 1 also stated that certain assumptions concerning soil conditions were
made prior to mobilization and was later discovered that deeper piers were needed. As a
result, a new contractor had to quickly drill new piles which later turned out to be in
wrong locations throughout the site. One of the leading indicators discovered by RT 323
was “unmitigated assumptions”. The definition of “unmitigated assumptions” according

118
to RT 323 research is any “assumption determined at the beginning of the project which
was not considered or resolved”. This leading indicator could also be selected in the
PSIA user input (Figure 24).
Figure 24: Example expanded.
If the report is generated a second time, now with the inclusion of “unmitigated
assumptions”, the results would be different (Figure 25).

119
Figure 25: New PSIA impact results.
As shown in Figure 25, all impacts were highlighted indicating that these impacts
are potential outcomes of the project given “time to market” as a driver and “late design
deliverables” and “unmitigated assumptions” as leading indicators. Note how the addition
of “unmitigated assumptions” added six new potential impacts to the PSIA results. The
most notable addition to the potential impacts that correlates to the sample project was
“scope not identified”. The plant had to be shifted from its original global location due to
the contractor incorrectly driving piles into the wrong location. This was directly
attributed to soil conditions assumed by the owner, only to later discover that the
assumptions were incorrect. This lead to a rushed hiring of a civil contractor to drill the
piers into new locations, which were later deemed incorrect. As a result, the original
scope of work was not met.
Sample Project 1 contained one of the top three premature start drivers (Figure
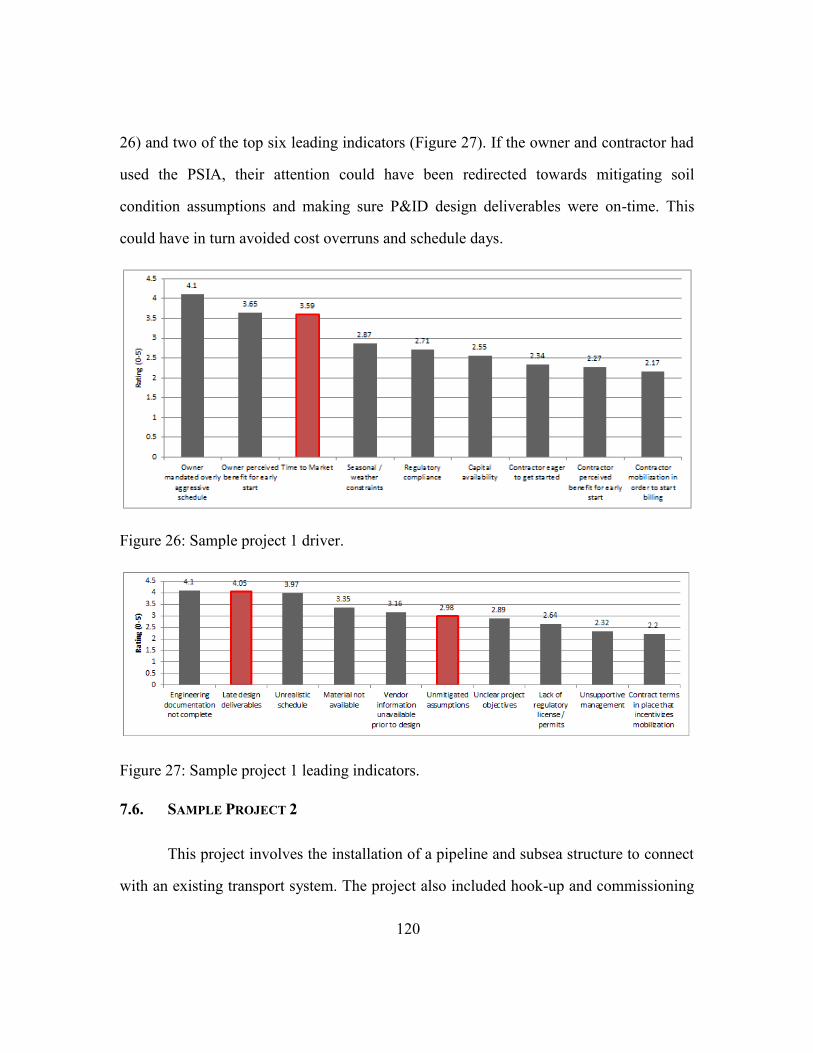
120
26) and two of the top six leading indicators (Figure 27). If the owner and contractor had
used the PSIA, their attention could have been redirected towards mitigating soil
condition assumptions and making sure P&ID design deliverables were on-time. This
could have in turn avoided cost overruns and schedule days.
Figure 26: Sample project 1 driver.
Figure 27: Sample project 1 leading indicators.
7.6. SAMPLE PROJECT 2
This project involves the installation of a pipeline and subsea structure to connect
with an existing transport system. The project also included hook-up and commissioning

121
of new wells and pipeline. The owner of this project was bound by production contracts
to satisfy minimum feedstock gas quantities to an onshore gas processing plant. Because
this was the primary feedstock for local electricity provider, a hard-date production
agreement was executed between owner and onshore gas plant due to criticality of gas
supply. During execution of the project, with majority of detail design completed, labor
dispute discussions broke down between local labor unions and the original contractor.
The original contractor opted to exercise termination clause with owner due to inability to
resolve the labor dispute after they had already procured pipe and begun fabrication
process onshore. The owner re-tendered the contract with an alternative contractor who
then was brought onboard and assumed ownership of project goods/materials. The
alternative contractor successfully installed the project, though overall owners schedule
was substantially delayed due to termination of original contractor. The owner faced a
penalty fee for not meeting feedstock requirements on the hard-date set by the contract.
For this project, the owner was bound by contract to a local electricity provider to
deliver a minimum feedstock on a hard deadline, in which not doing so would result in a
penalty. With that, it could be said that the driver for this project is “regulatory
compliance”. Recall that the definition for regulatory compliance is “any requirements
imposed by an outside agency with authority over the approval and/or requirement of the
project”. Although the electricity provider does not have authority of approving the
project, it does, however, require that key resources to be delivered through the project
making the pipeline install a requirement. The leading indicators on this project are not so
easily identifiable. When an owner hires a contractor, the contractor is assumed to have
good relationships, knowledge, and understanding of the local labor unions. Because of
the assumption regarding the contractor’s relationship with craft labor, “unmitigated
assumptions” is the leading indicator that is most applicable. For sample project 2, the

122
driver was selected as “regulatory compliance” and the leading indicator was
“unmitigated assumptions”. With these two drivers and leading indicators selected, the
outcome is shown in Figure 28.
Figure 28: Sample project 2 PSIA impact results.
The PSIA identified six negative project outcomes. Sample project 2 incurred a
monetary penalty so the original project budget was exceeded. “Facility start-up /
production delay” was not identified by the PSIA, however, “schedule” slippage was a
reported potential impact and for a project that has a hard deadline, this could be a critical
impact that needs to be further evaluated. This could be done by using other means of
risk assessment such as the PDRI which covers topics such as labor shortage, strikes, and
contract disputes (Gibson and Dumont 1995).

123
7.7. EXAMPLE APPLICATION
The following sections provide example applications for the PSIA by different
stakeholders within the project team. These examples apply to both owner and contractor
organizations.
Senior Project Management
The PSIA is effective when used by Senior Project Managers at the start of each
phase of the project. Project Managers can use the PSIA to assist in the project’s risk
assessment process. This tool provides an indication of the commonality and severity of
potential impacts which are direct inputs to the project team’s risk assessment and prompt
discussion regarding mitigation action. The PSIA data can also be used to compare the
severity of potential impact to the cost of mitigation. The PSIA also provides information
to help Project Managers when developing the project schedule and project execution
plan with regard to pre-construction activities and site mobilization. When engaged in
client meetings, a contractor’s Project Manager can defend a position to delay starting
construction using hard data. Or an owner’s Project Manager can clearly explain
motivations when faced with a contractor eager to start digging. In any scenario the PSIA
provides a Project Manager with unbiased validated data to use in both preventative and
reactionary modes on a project.
Construction Management
The PSIA is effective when used by Construction Management at the start of each
phase of the project. Construction Management can use the PSIA to assist in the project’s
risk assessment process. This tool provides an indication of the commonality and severity
of potential impacts which are direct inputs to the project team’s risk assessment and
prompt discussion regarding mitigation action. The PSIA data can also be used to
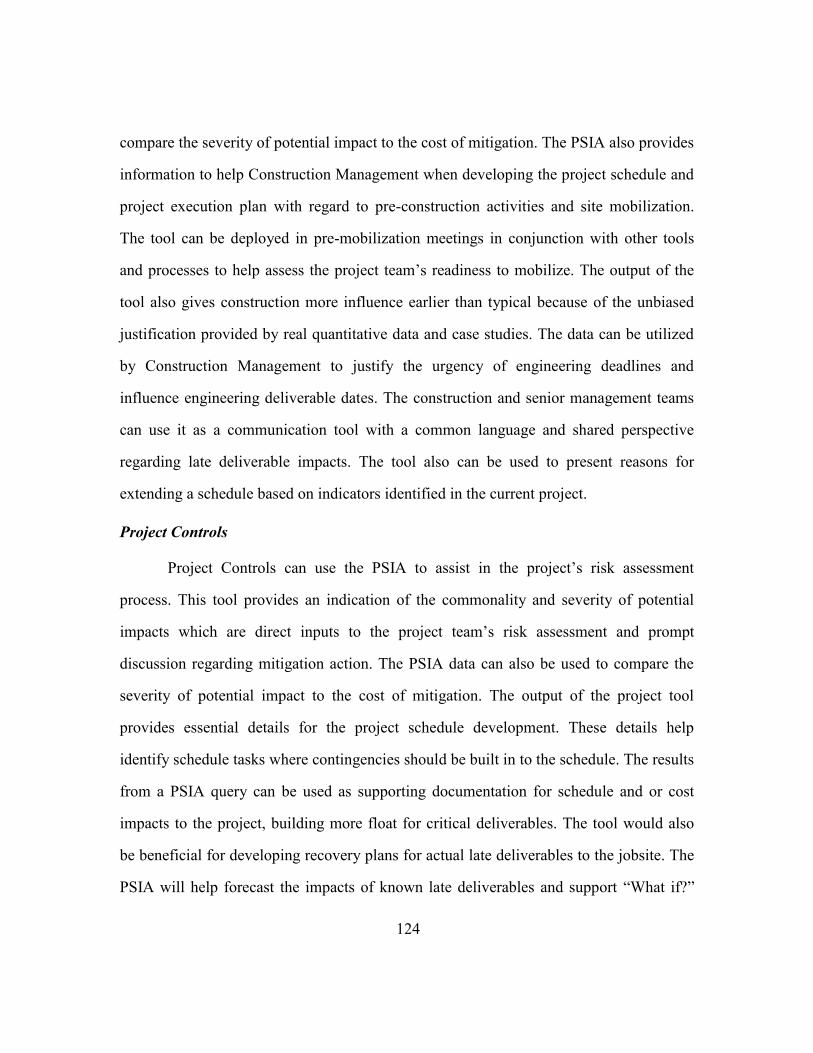
124
compare the severity of potential impact to the cost of mitigation. The PSIA also provides
information to help Construction Management when developing the project schedule and
project execution plan with regard to pre-construction activities and site mobilization.
The tool can be deployed in pre-mobilization meetings in conjunction with other tools
and processes to help assess the project team’s readiness to mobilize. The output of the
tool also gives construction more influence earlier than typical because of the unbiased
justification provided by real quantitative data and case studies. The data can be utilized
by Construction Management to justify the urgency of engineering deadlines and
influence engineering deliverable dates. The construction and senior management teams
can use it as a communication tool with a common language and shared perspective
regarding late deliverable impacts. The tool also can be used to present reasons for
extending a schedule based on indicators identified in the current project.
Project Controls
Project Controls can use the PSIA to assist in the project’s risk assessment
process. This tool provides an indication of the commonality and severity of potential
impacts which are direct inputs to the project team’s risk assessment and prompt
discussion regarding mitigation action. The PSIA data can also be used to compare the
severity of potential impact to the cost of mitigation. The output of the project tool
provides essential details for the project schedule development. These details help
identify schedule tasks where contingencies should be built in to the schedule. The results
from a PSIA query can be used as supporting documentation for schedule and or cost
impacts to the project, building more float for critical deliverables. The tool would also
be beneficial for developing recovery plans for actual late deliverables to the jobsite. The
PSIA will help forecast the impacts of known late deliverables and support “What if?”

125
analysis during recovery from a specific event.
Engineering and Procurement
The impacts identified by this tool can help engineering and procurement team
members plan and prioritize their resources such as staffing and budget. For example, in a
situation where the commonality and severity of an impact is high based on identified
drivers and leading indicators, the engineering/procurement manager can increase their
staff, work hours or other resources to reduce the potential of the impact. The tool
provides data that will facilitate the communication of design expectations / design
completion required to prevent interruptions to construction. It also facilitates
communication between the engineering / procurement team and the construction team
regarding this topic and thus leads to a more efficient design process. The tool will
provide procurement supportive data to more accurately emphasize requirements for
vendor data.
Executive / Business Management
The PSIA provides an unbiased industry-based reference to help resolve disputes
over commercial issues or disagreements with owners/contractors and supply-chain
organizations. It will provide management with less construction experience the ability to
understand the issues and impacts. At a portfolio level, the PSIA helps identify lessons
learned that can be applied to future projects.
7.8. LIMITATIONS
The PSIA helps project teams identify potential issues and the project outcomes
that might be affected, and prompt project teams to develop plans to mitigate or avoid
risk. It does not, however, provide actions to mitigate risks associated with premature

126
starts to construction. The PSIA does not provide the actual cost increases or time delays
associated with a premature start. Each project team will have to estimate the value/cost
of any impacts on a case-dependent basis; this is because the quantitative impacts of late
deliverables can be vastly different from one project to another, depending upon project
size, type, complexity, and other variables.
Because the data used as the basis for PSIA and associated resources was
collected within an 18-month period, they do not capture all possible impacts. Although
RT 323 identified the most likely cases, the unique circumstances of every project can
produce situations that have not occurred in the past and that cannot be foreseen through
research. The intent of RT 323 is for the PSIA to be updated and maintained by
individual companies to include new impacts experienced on their projects.
Since this research has been primarily focused on industrial construction projects,
the PSIA predominantly addresses conditions leading to premature starts in these types of
projects. Not all industries, drivers, leading indicators are represented in case studies. RT
323 selected case studies to represent a variety of drivers and indicators, industries,
organization types, and other criteria.

127
Chapter 8: Lessons Learned
Throughout the data collection phase from both research thrusts, RT 323
developed a list of lessons learned and recommendations for preventing premature starts
to construction. This chapter includes two sections: one discussing the lessons learned of
the survey and case study research, the other discussing PSIA implementation
recommendations.
8.1. CASE STUDY AND SURVEY LESSONS LEARNED
Throughout research thrust one, many commonalities amongst project drivers and
outcomes with unique similarities were discovered. At the end of each case study a
lessons learned section was drafted based on the interviewee’s project experience. The
lessons learned for the case studies were interpreted by schedule, risk, communication,
and alignment. The identified lessons learned were categorized by these four items and
discussed in detail below.
Schedule
The in-depth case studies provide several examples of the extent of impact that
premature starts can have on a project schedule. The case studies highlight the concept
that starting construction prior to having a thorough plan and necessary design
deliverables can result in rework, cost overruns, schedule slippage, etc. In all case studies,
had the project teams spent the time and resources necessary to identify the drivers and
leading indicators to premature starts, the impact to the project schedule would have been
mitigated. Specific schedule related lessons learned from the in-depth case studies
include the following:
Importance of schedule integration between Engineering, Procurement &
128
Construction;
Approval of rework/scope change should include approval of schedule impact;
Awareness and management of owners’ continuous drive for overly aggressive
schedule; and
Continuous monitoring of project duration.
Risk
The in-depth case studies also highlight the need for identifying drivers and
leading indicators to premature starts during the risk assessment and mitigation process.
The impacts of starting early may be more or less severe than the impact to the project if
a construction activity does not start. Thus, by identifying leading indicators early, a
project team can assess the potential impacts of starting early and compare those to the
potential impact of not starting. Although premature start analysis does not take the place
of a thorough risk assessment, it certainly serves as significant input in the risk mitigation
process. Specific risk related lessons learned from the in-depth case studies include:
Conduct detailed risk analysis on front end costs vs. potential benefits;
Follow agency standard procedures and guidelines; and
Risk assessment is necessary to identify and derive mitigating strategy for
significant aspects of the project.
Interface / Communication
In the Construction industry, communication is the most difficult and most
important task that we perform. In several of the case studies, a breakdown in
communication often resulted in an impact to the overall project success. Often, one of
the project stakeholders did not know or understand that another stakeholder was lacking
necessary information needed to perform. The lack of design deliverables and vendor

129
data specifically resulted in premature starts and impacts to cost, schedule and
productivity. Early in the project, stakeholders need to identify and communicate the
need for specific information and align their resources so that this information can be
produced in a sequence that supports the project schedule. Clear communication can
mitigate the leading indicators and drivers that lead to premature starts. Specific
communication related lessons learned from the in-depth case studies include:
Fully validate constructability program and path of construction in relation to
schedule and clearly document changes immediately after contract award;
Provide construction contractor access to procurement documentation;
Assess unmitigated assumptions prior to permit approval;
Keep agency director informed of project at every review stage;
Assure scope definition is understood by all project stakeholders;
Understand premature mobilization implications;
Develop interface management protocol; and
Have a change management process to assess and communicate impacts.
Alignment
Project stakeholders often have their own perceived needs and agendas when
conducting their project. However, the best results for a project are achieved when
stakeholders’ needs and agendas are aligned. The in-depth case studies reveal that drivers
such as a ‘perceived benefit to getting started’ or ‘overly aggressive schedules’ often
result in premature starts and ultimately, negative impacts to construction. This fact
suggests that early and periodic alignment meetings can go a long way in ensuring the
success of a project. Specific alignment related lessons learned from the in-depth case
studies include:

130
Front end evaluation of available resources and their allocation to the project;
Establish an integrated team and assess joint capability to meet project
requirements;
Allow time to mitigate assumptions;
Develop team charter and roles during early pre-project planning;
Follow all company procedures and regulations;
Establish initial project alignment;
Misunderstanding of stakeholder roles and project scope; and
Conflict and priority of drivers lead to misalignment on project objectives.
8.2. PSIA IMPLEMENTATION RECOMMENDATIONS
One of the most important planning decisions on a major capital project is
determining the right time to start construction. RT 323 has learned how premature starts
can lead to cascading impacts that not only affect cost and schedule but can compromise
safety, damage valuable business relationships and drive companies into costly litigation.
Restarting and recovering from these decisions is extremely difficult where skilled trades
and scarce resources come into play. Multiple parties, each with different business
objectives and motivations, strongly influence the planning process and can swiftly move
the project toward the wrong decision.
CII identified the need for research and implementation tools to support decision
making around construction starts. Through collection and analysis of data from expert
input, industry surveys and case studies, RT 323 has identified the most common
business drivers, leading indicators and impacts for premature starts. Notable findings
include:
The top business drivers are owner initiated, as acknowledged by both owners and

131
contractors.
The top leading indicators are related to incomplete or delayed design
deliverables.
The top impacts represent a wider range of issues and are closely distributed from
cost and schedule overruns to compromised safety, facility production delay and
litigations and claims. There is a fair agreement among owners and contractors for impact
commonality and severity, such that the most common impacts are also the most severe
and the least common are also the least severe.
RT 323 recommends the use of its PSIA. The PSIA should be applied as part of a
project’s overall risk assessment process as an objective tool to identify risk associated
with construction readiness. Project leaders should use it as evidence to support planning
discussions or to defend decisions to postpone construction starts. It may also be used as
a means of negotiating with other parties. Like other risk assessment tools and
techniques, it should be used at different stages of construction planning, where different
indicators are likely to appear and decision impacts may be greatest, not just when the
construction mobilization go/no-go order is imminent.
The PSIA can be completed in less than ten minutes since only a few questions
are asked to the user. For this reason, the PSIA may be used multiple times during one
single evaluation. The PSIA alone will not ensure successful projects. When combined
with sound business planning, alignment, and good project execution, it can greatly
improve the probability of meeting or exceeding project objectives.

132
Chapter 9: Conclusion and Recommendations
The primary value of this research is to guide CII members and others involved in
projects to an improved understanding of the drivers, impacts, and leading indicators of
premature starts that can be used to improve project delivery. RT 323 envisions that such
findings will be incorporated into project risk assessment and overall planning, and will
facilitate communication between stakeholders. The main outcomes of this research will:
Help contractors in demonstrating and communicating to owners and stakeholders
the severity of the potential outcome of a premature start to a project; and
Provide a better understanding of how a premature start can impact a project.
Throughout the research, RT 323 discovered many actions an organization can
and should take in order to avoid a premature start to construction. The team developed
the following list of items that readers should take into account when considering project
schedule, risk and stakeholder alignment:
Recognize the importance of schedule integration between engineering,
procurement and construction;
Conduct a detailed risk analysis on front end costs versus potential benefits;
Fully validate the constructability program and path of construction in relations to
schedule;
Provide construction contract access to procurement documentation; and
Establish an integrated team and assess joint capabilities to meet project
requirements.
In order to aid in the implementation of RT 323 findings, the team recommends
integrating the PSIA into their organizations pre-project planning risk assessment
process. Some specific deployment recommendations for this tool include the following:

133
Project risk assessment;
Dispute prevention and resolution;
Knowledge sharing and transfer; and
Lessons learned.
The PSIA helps project teams identify potential issues and the project outcomes
that might be affected, and prompt project teams to develop plans to mitigate or avoid
risk. It does not provide actions to mitigate risks associated with premature starts to
construction. The PSIA, similar to a compass, will let you know if your project is headed
in the right direction. The PSIA alone, however, will not prevent a premature start, but it
can alert project teams to understand the risks of a premature start and to utilize other CII
best practices and tools such as:
Project Definition Rating Index (Gibson and Dumont 1995);
Late Deliverables Risk Catalog (Barry et al. 2015);
Flash Track Tool (Austin, de la Garza, Pishdad-Bozorgi 2015);
Alignment (Griffith and Gibson 1997);
Constructability (O’Connor and Tatum 1986); and
Project Risk Assessment (Walewski, Gibson, and Dudley 2003).
In summary, premature starts to construction can be driven my many influencing
factors and cause a variety of negative impacts. Through case study research and review
of literature, these drivers have shown to have leading indicators that can be identified
prior to mobilization and prevent construction interruptions. These drivers, leading
indicators, and impacts are well known within the construction industry, as shown
through survey data, but the connection to premature starts had yet to be established prior
to this research. This research provides a list of leading indicators that can alert project
teams that mobilization of the construction phase may be premature; thereby causing a

134
multitude of impacts that will affect cost and schedule. It is the hope of RT 323 that the
overall research findings of this project will facilitate a meaningful discussion of
premature starts to construction and provide industry professional’s insight to the key
drivers and impacts of premature starts.
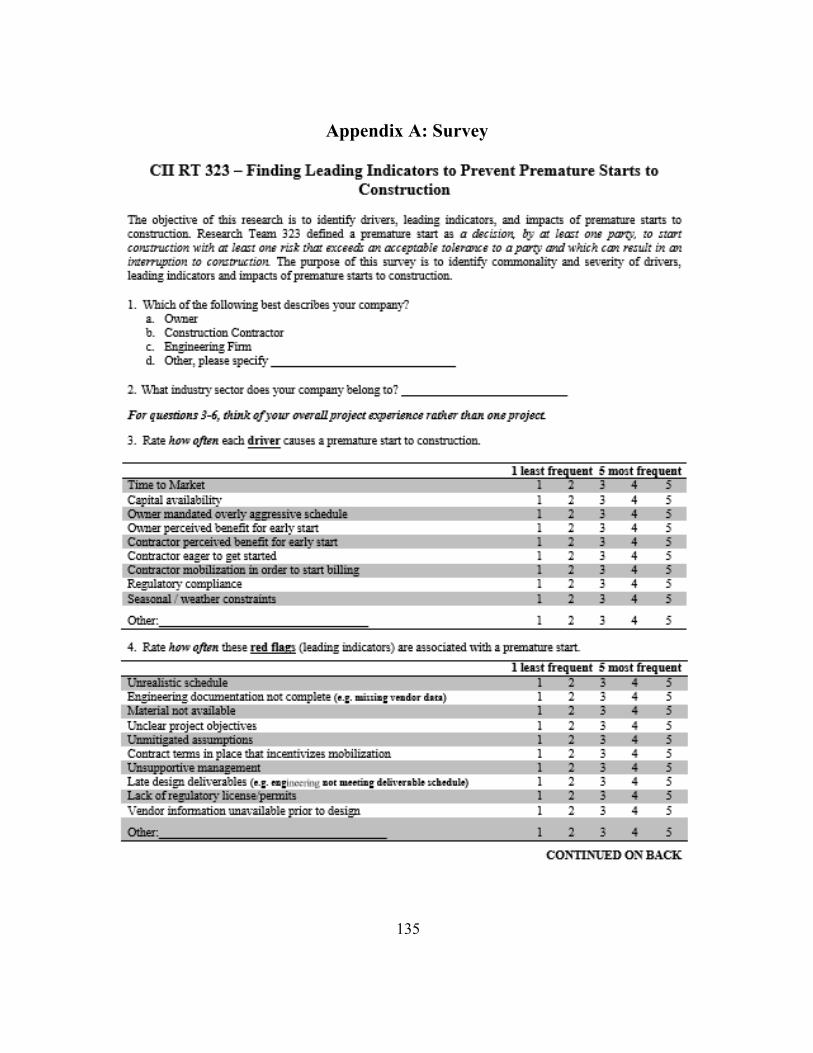
135
Appendix A: Survey

136

137
Appendix B: Pilot Case Study Questionnaire
PILOT-CASE STUDY QUESTIONNAIRE
1. Project Description: Please include scope, phase, cost, scale of project,
greenfield/brownfield, contract type
a. Scope:_________________________________
b. Phase:_________________________________
c. Scale:__________________________________
d. Greenfield:______________________________
e. Contract Type:___________________________
2. What year was the project completed or, if still under construction, what
year is the project to be completed?
3. Description of the interruption: what happened/what’s the incident referring
to/causes?
4. What was done to mitigate the interruption?
5. What were the drivers/reasons of the premature start?
6. What were the impacts of the interruption?
7. Was risk assessment done prior to premature start?
8. Was FEED or any stage gate process done before start of construction?

138
Appendix C: In-Depth Case Study Questionnaire
The Construction Industry Institute Research Team 323 is currently studying what are the
drivers of a premature construction phase and what happens as a result. Once drivers
have been determined this research will identify any indicators of those drivers and how
might they signal a premature start.
All information gathered from this questionnaire will be for RT 323 only. Any
information or summaries shared with the public in the final report will not contain any
identifiable information about the project.
Name (optional) & Position/Title:
Overall Project Status (please select the best choice from the list below):
☐ Less than 10% complete
☐ More than 10% complete but less than 50% complete
☐ More than 50% complete but less than 90% complete
☐ Complete
General Project Questions 1. To what subsector (within the industrial sector) does this project belong? (e.g. oil &
gas, power, manufacturing, etc.)
2. What is the type of project site? (select one)
☐ Greenfield
☐ Brownfield
☐ Other, please specify:
3. How would you classify your project?
☐ Heavy Industrial
☐ Light Industrial
☐ Building
☐ Heavy Civil (Highways, bridges, dams)
Infrastructure

139
4. What is the project delivery type? (select one)
☐ EPC (i.e. engineer-procure-construct) or Design/Build
☐ Design/Bid/Build
☐ Construction Management (at risk)
☐ Owner-Managed
☐ Other, please specify:
5. What is the construction contract type? (select one)
☐ Lump Sum
☐ Unit Price
☐ Cost Reimbursable
☐ Time and Material
☐ Other:
6. What is the original estimated total capital cost of this project and what percent
complete was the design when this original estimate was prepared?
a. Total Installed Cost (TIC)/Design Percent Complete:
b. Construction/Fabrication Cost/Design Percent Complete:
7. What is the original overall duration for this project? ___ Months
8. What is the original scheduled start and completion date for each applicable element
of this project?
Engineering ___ _____________
Procurement ___ ____________
Construction __________________
9. What is the actual start and completion date for each applicable element of this
project?
Engineering ___ _____________
Procurement ___ ____________
Construction __________________

140
10. For this contract what is the scope of supply (check all that apply)?
☐ Engineering
☐ Procurement
☐ Construction (Direct Hire)
☐ Construction Management
☐ Start Up
☐ Commissioning
☐ Operation
11. In regards to the project in question, what was the number of recent (within past 5
years) projects previously completed within this similar business relationship?
☐ 0
☐ 1 to 3
☐ More than 5
Premature Start Driver Questions 12. What drove the premature start? (select all that apply; example in parentheses)
☐ Owner mandated overly aggressive schedule
☐ Owner perceived benefit for early start
☐ Time to market
☐ Seasonal/weather constraints
☐ Regulatory compliance
☐ Capital availability
☐ Contractor eager to get started
☐ Contractor perceived benefit for early start
☐ Contractor mobilization in order to start billing
☐ Other:
13. Who set the required completion date for this project? (select one)
☐ Owner Project Team
☐ Project Team/Contractor’s Organization
☐ External Customer
☐ Government/Compliance
☐ Owner’s Business Management
☐ Other, please specify:

141
14. Is this project considered a “fast-track” project? (select one)
☐ Yes
☐ No
☐ Don’t Know
15. At what percent of design completion was the project mobilized for construction?
(select one)
☐ 0-25%
☐ 25-50% (not validated)
☐ 50-75%
☐ 75-100%
16. How much time on this project was spent in reactionary mode rather than proactive
planning? (select one)
☐ None
☐ Some
☐ Most
☐ All
17. What is the basis for design percentage completion in the previous question?
☐ Validated Earned Value Status report from the engineer
☐ Third party provided with no substantiation
☐ Best guess
☐ Other (please describe):
18. Which of the items below best describe team/scope alignment for this project:
☐ No team building or scope alignment sessions were conducted with any
project stakeholders throughout the project life cycle
☐ One team building and/or scope alignment session was conducted but not
all the project stakeholders were present and no follow up occurred
☐ Multiple team building and alignment sessions were conducted throughout
the project life cycle and all project stakeholders were involved in the
process and follow up actions were noted and acted upon in a timely
manner
19. Which item below best describes your best assessment of the overall project team
experience executing this type of project?
☐ This team has never worked together before and experience level on
average is inadequate to meet the demands and complexities of the project

142
☐ This team has several players who have worked together before on a very
similar project (contract type, scope, schedule and budget) and have
adequate experience to address the complexities and demands of the
project
☐ The majority of the project team have worked together on a previous
similar successful projects (contract type, scope, schedule and budget) and
have significant experience to address any complexity or demand the
project may present
20. If the project is complete, what is the change in cost and schedule compared to the
original budget and schedule? (percent and/or actual value)
☐ Cost: _ __ ______________
☐ Schedule: _ _________________
21. Was CII’s Project Definition Rating Index (PDRI) or a similar
sanctioning/authorization tool used to assess the project’s readiness prior to
project sanction/authorization?
☐ Yes
☐ No
☐ Don’t Know (believe a PDRI was not performed)
22. Were all of the pre-defined deliverables (FEED Study) completed prior to project
sanction/authorization?
☐ Yes
☐ No
☐ Don’t Know
23. Has this project followed a formal stage gate and/or formal authorization process?
☐ Yes
☐ No
☐ Don’t Know
Premature Start Impact Questions 24. What were some impacts of the premature start?

143
25. Which of the following impacts took place as a result of a premature start? (select all
that apply; examples in parentheses)
☐ Cost Overruns
☐ Out of Sequence Work
☐ Overtime/Unplanned Work
☐ Schedule Slippage
☐ Rework
☐ Poor Productivity
☐ Scope Not Identified
☐ Facility Start-up/Production Delay
☐ Relationship/Reputational Damage
☐ Poor Morale
☐ Litigation/Claims
☐ Safety Exposure
☐ Failure to Attract/Maintain Craft
☐ Other:
Leading Indicator Questions 26. What were some early warning signs or red flags of the premature start?
27. Which of the following best describes a leading indicator of the premature start?
(select all that apply; examples in parentheses)
☐ Unrealistic schedule requirements
☐ Engineering documents not complete (lacked detail)
☐ Lack of regulatory license/permits
☐ Unclear project objectives
☐ Unmitigated assumptions
☐ Vendor information unavailable prior to design
☐ Material not available
☐ Late design deliverables
☐ Unsupportive management
☐ Contract terms in place that incentivizes mobilization
☐ Other:

144
References
Austin, R.; de la Garza, Jesus M.; Pishdad-Bozorgi, P. (2015). Successful Delivery of
Flash Track Projects. Research Summary 311-1. Austin, TX: Construction
Industry Institute.
Austin, R.; de la Garza, Jesus M.; Pishdad-Bozorgi, P. (2015). Flash Track Tool: User
Guide. Implementation Resource 311-2. Austin, TX: Construction Industry
Institute.
Barry, W.; Leite, F. (2014). The true impact of late deliverables at the construction site.
Research Summary 300-1. Austin, TX: Construction Industry Institute.
Aibinu, A. A. (2009). “Avoiding and Mitigating Delay and Disruption Claims Conflict:
Role of Precontract Negotiation.” In: Journal of Legal Affairs and Dispute
Resolution in Engineering and Construction Volume 1, Issue 1, 47-58
Barry, W.; Leite, F. (2014). The true impact of late deliverables at the construction site.
Research Summary 300-1. Austin, TX: Construction Industry Institute.
Barry, W.; Leite, F. (2015). Late Deliverables to Construction: How Understanding the
Impacts Can Benefit Dispute Prevention and Resolution. In: ASCE Journal of
Legal Affairs and Dispute Resolution in Engineering and Construction. Volume 7,
Issue 2.
Barry, W.; Leite, F.; O'Brien, W.J. (2015). The Late Deliverable Risk Catalog:
Evaluating the Impacts and Risks of Late Deliverables to Construction Sites. In:
ASCE Journal of Construction Engineering and Management. Volume 141, Issue
4.
Cheng, Y-M. (2013). “An exploration into cost-influencing factors on construction
Project”. International Journal of Project Management 32, 850-860
Critchlow, J.; Farr, A.; Briggs, S.; Pickavance, K.; and Lavers, A. 2005. “The great delay
analysis debate.” In: A paper Presented by the Society of Construction Law in
Association with the Centre of Construction Law and Management, King’s
College on 18th October 2005.
Doloi, H. K. (2011) « Understanding stakeholders’ perspective of cost estimation in
project management ». International Journal of Project Management 29, 622-636
Gibson, G.E. Jr. (1997). Pre-Project Planning Tools: PDRI and Alignment. Research
Summary 113-1. Austin, TX: Construction Industry Institute.
Gibson, G. E. Jr.; Dumont, P. R. (1995). Project definition rating index (PDRI) for
industrial projects. Research Report 113-11. Austin, TX: Construction Industry
Institute.

145
Griffith A.F.; Gibson, G. E. Jr.. (1997). Team Alignment During Pre-Project Planning of
Capital Facilities. Research Report 113-12. Austin, TX: Construction Industry
Institute.
Hwang, B.G.; Zhao, X.; Goh, K.J. (2014). “Investigating the client-related rework in
building projects; The case of Singapore.” International Journal of Project
Management 32, 698-708
Ibbs, W. C., et al. (1994). “Project change management.” Special Publication 43-1,
Construction Industry Institute, University of Texas, Austin, TX.
Ibbs, W. C. (2012). “Construction Change: Likelihood, Severity, and Impact on
Productivity.” In: Journal of Legal Affairs and Dispute Resolution in Engineering
and Construction Volume 4, Issue 3: 67-73
Knoedler, A. J.; Hellwig, K. A.; Neath, I. (1999). “The Shift from Recency to Primacy
with Increasing Delay.” Journal of Experimental Psychology: Learning, Memory,
and Cognition 25, 474-487.
LaBarre, P. S.; El-adaway, I. H. (2013). “Project Benchmarking: Tool for Mitigating
Conflicts, Claims, and Disputes through Improved Performance.” In: Journal of
Legal Affairs an Dispute Resolution in Engineering and Construction. Volume 6,
Issue 1.
Laufer, A. (1991). Construction planning in uncertain environments. National Building
Research Institute. Technion IIT. Haifa 31-000, Israel
Li, H.; Chan, N.; Huang, T.; Guo, H. L.; Lu, W.; Skitmore, M. (2009). “Optimization
construction planning schedules by virtual prototyping enabled resource
analysis.” Automation in Construction 18, 912–918
Li, J; Taylor, T. R. B.; Ford, D. N. (2011). Impact of Project Controls on Tipping Point
Dynamics in Construction Projects. In: Proceedings of the 2011 International
System Dynamics Conference, Washington, D.C.
Mahmound-Jouini, S; Midler C.; Garel, G. (2004). “Time-to-market vs. time-to-delivery:
Managing speed in Engineering, Procurement and Construction.” International
Journal of Project Management 22, 359-367
O’Brien, W. J.; Leite, F.; Meeks, S. (2013). Enhanced work packaging: design through
workface execution. Research Report 272-11. Austin, TX: Construction Industry
Institute.
O’Conner, J.T. (1998). Planning for Startup. In: Construction Industry Institute, The
University of Texas at Austin.
O’Conner, J.T. (1986). Constructability: A Primer. In: Construction Industry Institute,
The University of Texas at Austin.
Research Team 323. (2016) “Finding Leading Indicators to Prevent Premature Starts and

146
Assuring Uninterrupted Construction”. Research Summary 323-1. Construction
Industry Institute. July, 2016.
Research Team 323. (2016) “Premature Start Impact Analysis Tool: User Guide and Case
Studies”. Implementation Resource 323-2, Construction Industry Institute. July,
2014.
Rogge, D. F.; Cogliser, C.; Alaman, H.; McCormack, S. (2001). An investigation of field
rework in industrial construction. Research Report 153-11. Austin, TX:
Construction Industry Institute.
Sambasivan, M.; Soon, Y. W. (2007). “Causes and effects of delays in Malaysian
construction industry.” International Journal of Project Management 25, 517-
526.
Sterman, J. D. (2000). Business Dynamics: System Thinking and Modeling for A Complex
World. Irwin McGraw-Hill, Boston, MA, USA
Sweis, G.; Sweis, R.; Abu Hammad, A; Shboul, A. (2008). “Delays in construction
projects: The case of Jordan.” International Journal of Project Management 26,
665-674.
Vanegas, J. A.; Hastak, M.; Pearce, A. R.; Maldonado, F. (1998). A framework and
practices for cost-effective engineering in capital projects in the A/E/C industry.
Research Report 112-11. Austin, TX: Construction Industry Institute.
Vaus, David de. Research Design in Social Research. Thousand Oaks, California: SAGE
publications Ltd, 2001. Print.
Walewski, J.; Gibson Jr., G.E.; Dudley, G. (2003). Development of the international
project risk assessment (IPRA) tool. Research Report 181-11. Austin TX:
Construction Industry Institute.
Zidane, Y. J-T.; Johansen, A.; Andersen, B.; Hoseini, E. (2015). “Time-thieves and
bottlenecks in the Norwegian construction projects.” Procedia Economics and
Finance 21, 486-493

147
Vita
Ryan Patrick Griego was born and raised in Albuquerque, New Mexico where he
attended the University of New Mexico. After earning his B.S. in Civil Engineering
(2014) he was awarded a scholarship to attend the University of Texas at Austin to
conduct research and pursue an M.S. in the Construction Engineering and Project
Management Program. He studied under the guidance of Dr. Fernanda Leite and will
graduate with a Master of Science in Engineering degree in May 2016. He is an
accomplished guitar player, rock climber, and poker player.
Permanent address (or email): [email protected]
This thesis was typed by Ryan Patrick Griego.