copyright © 2013 pearson education, inc. publishing as prentice hall. process costing chapter5 1
TRANSCRIPT

Copyright © 2013 Pearson Education, Inc. Publishing as Prentice Hall. 1
Process Costing
Chapter5
Copyright © 2013 Pearson Education, Inc. Publishing as Prentice Hall. 2
Objective 1Distinguish between the flow of costs in
process costing and job costing
Copyright © 2013 Pearson Education, Inc. Publishing as Prentice Hall. 3
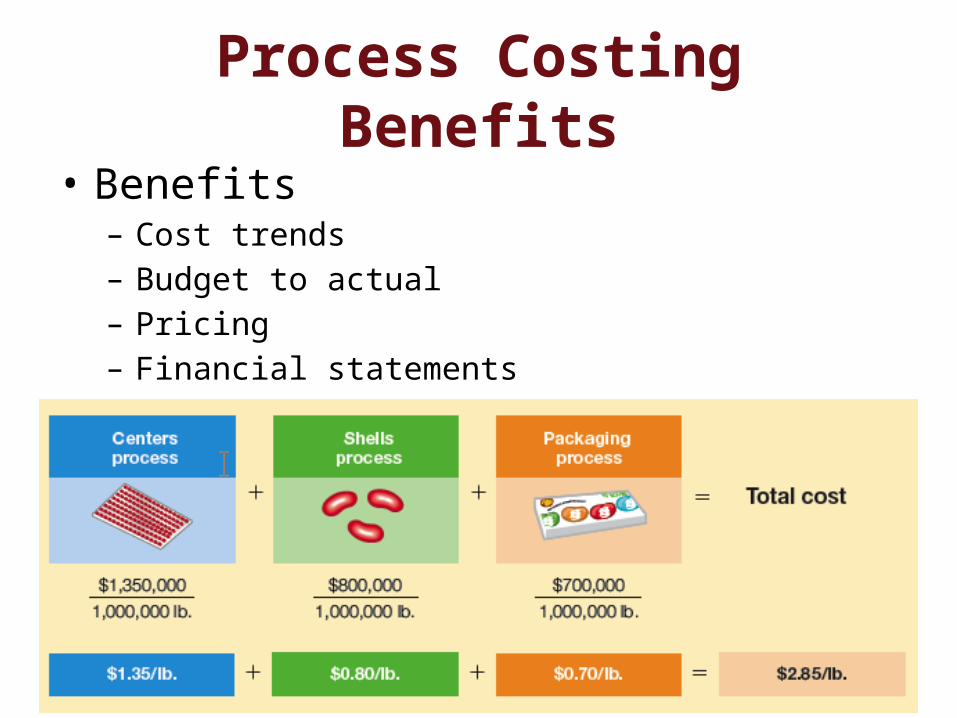
Process Costing Benefits• Benefits
– Cost trends– Budget to actual– Pricing– Financial statements

Copyright © 2013 Pearson Education, Inc. Publishing as Prentice Hall. 4
Job and Process Costing Differences?
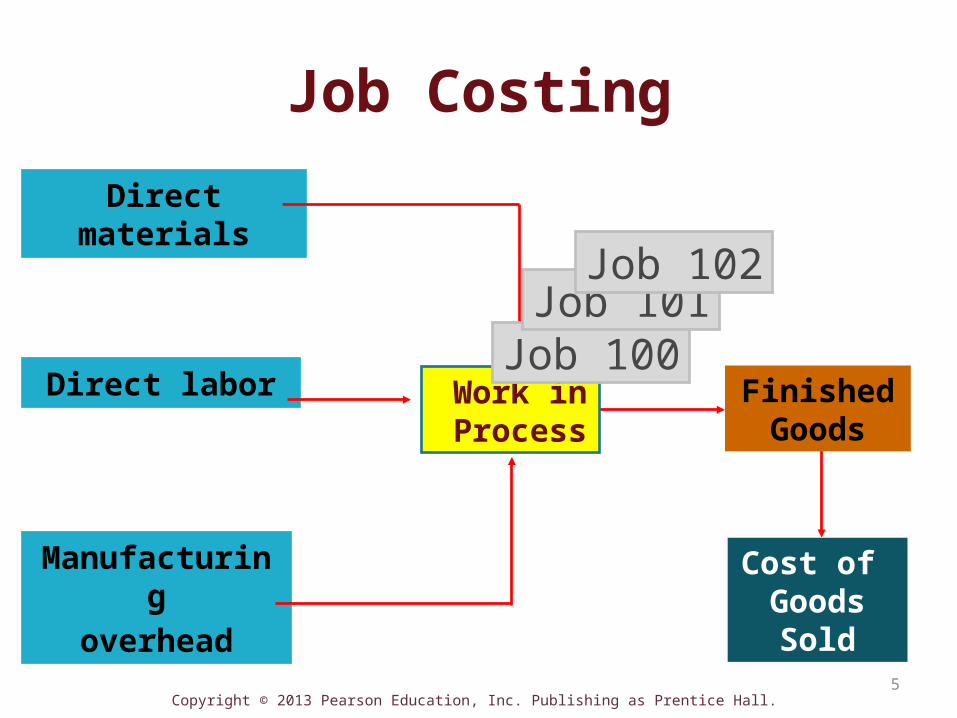
• Job Cost Systems– Individual job cost records– DM, DL, and MOH assigned to individual jobs– Cost of finished jobs flow into FG Inventory– Cost of sold jobs flow out of FG Inventory into
COGS
Copyright © 2013 Pearson Education, Inc. Publishing as Prentice Hall. 5
Job Costing
Cost of GoodsSold
Direct labor
Direct materials
FinishedGoods
Manufacturing
overhead
Work in Process
Job 100Job 101
Job 102

Copyright © 2013 Pearson Education, Inc. Publishing as Prentice Hall. 6
Job Costing and Process Costing Differences?
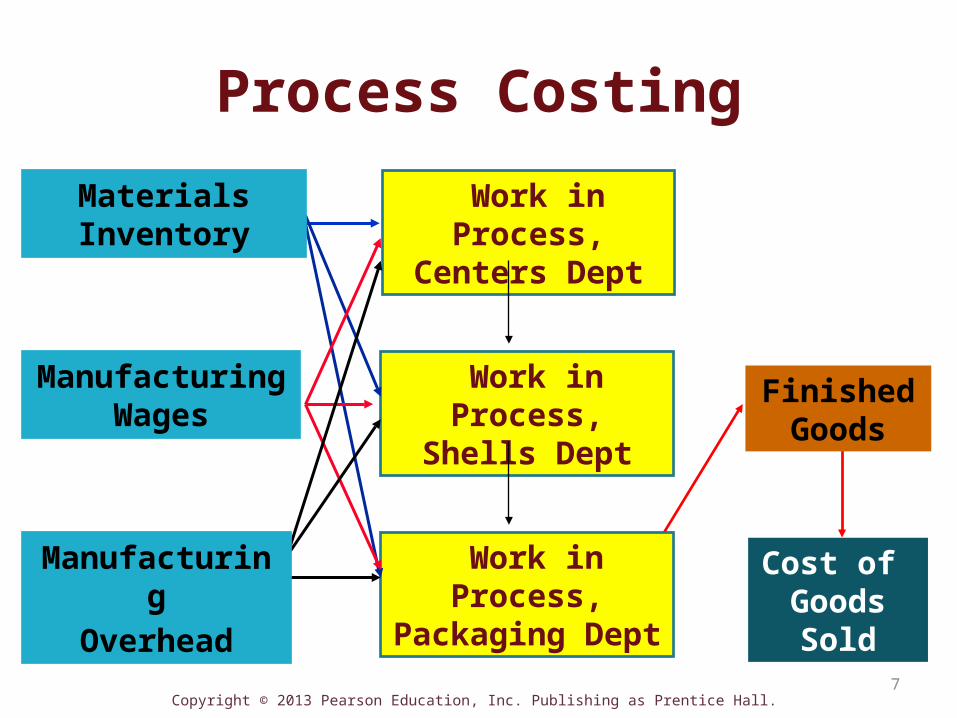
• Process Cost Systems– Series of manufacturing processes– Cost per process is accumulated and moved from
one process to another process– Costs transferred to FG Inventory only from the
WIP Inventory of the LAST manufacturing process– When units are sold, cost is transferred out of FG
Inventory into COGS
Copyright © 2013 Pearson Education, Inc. Publishing as Prentice Hall. 7
Process Costing
Cost of GoodsSold
Manufacturing Wages
FinishedGoods
Work in Process,Centers Dept
Work in Process,Shells Dept
Work in Process,Packaging Dept
Manufacturing
Overhead
Materials Inventory
Copyright © 2013 Pearson Education, Inc. Publishing as Prentice Hall. 8
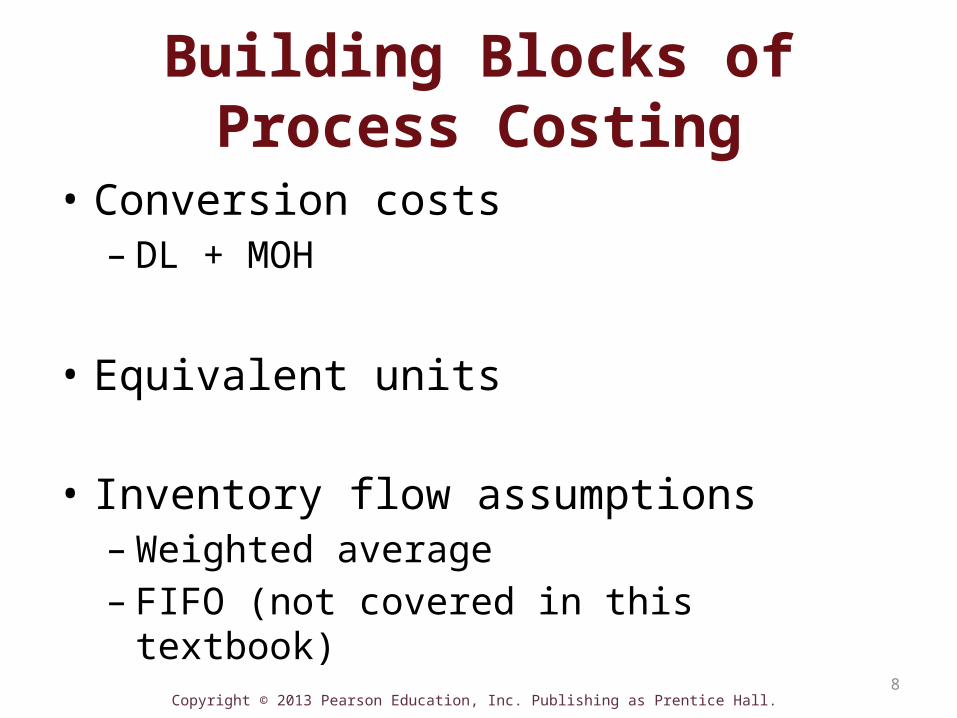
Building Blocks of Process Costing
• Conversion costs– DL + MOH
• Equivalent units
• Inventory flow assumptions– Weighted average– FIFO (not covered in this textbook)

Copyright © 2013 Pearson Education, Inc. Publishing as Prentice Hall. 9
Objective 2Compute equivalent units

Copyright © 2013 Pearson Education, Inc. Publishing as Prentice Hall. 10
Building Blocks of Process Costing
• Equivalent units – Amount of work done during a period in terms of
fully complete units of output
Copyright © 2013 Pearson Education, Inc. Publishing as Prentice Hall. 11
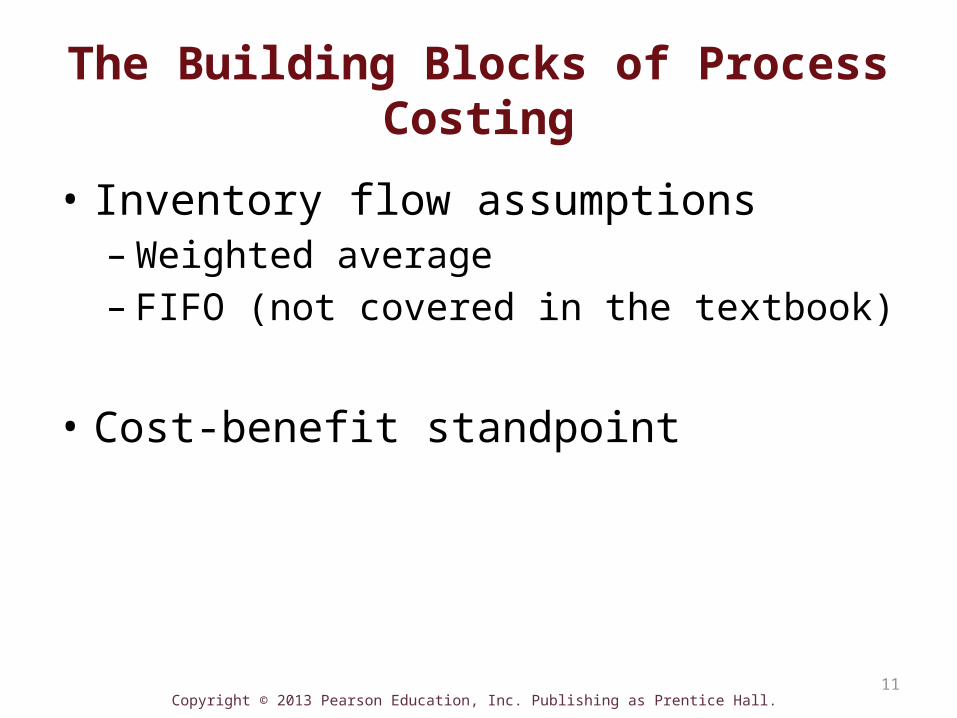
The Building Blocks of Process Costing
• Inventory flow assumptions– Weighted average – FIFO (not covered in the textbook)
• Cost-benefit standpoint

Copyright © 2013 Pearson Education, Inc. Publishing as Prentice Hall. 12
Objective 3Use process costing in the first
production department
Copyright © 2013 Pearson Education, Inc. Publishing as Prentice Hall. 13
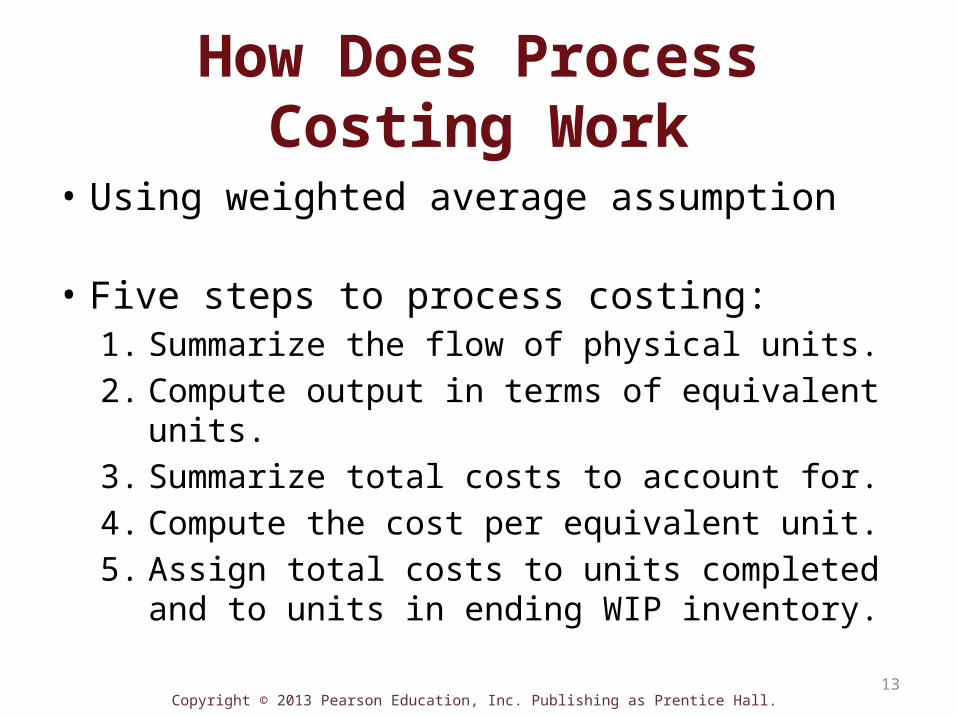
How Does Process Costing Work
• Using weighted average assumption
• Five steps to process costing:1. Summarize the flow of physical units.2. Compute output in terms of equivalent units.3. Summarize total costs to account for.4. Compute the cost per equivalent unit.5. Assign total costs to units completed and to units
in ending WIP inventory.

Copyright © 2013 Pearson Education, Inc. Publishing as Prentice Hall. 14
Step 1: Summarize the Flow of Physical Units – Exhibit 5-5 on p. 264
• Total physical units to account for? – How many individual (physical) units were worked on (completed or not)
• Total physical units accounted for? – What happened to those products ? (Finished or still in process)
Copyright © 2013 Pearson Education, Inc. Publishing as Prentice Hall. 15
Now turn to S5-4
Copyright © 2013 Pearson Education, Inc. Publishing as Prentice Hall. 16
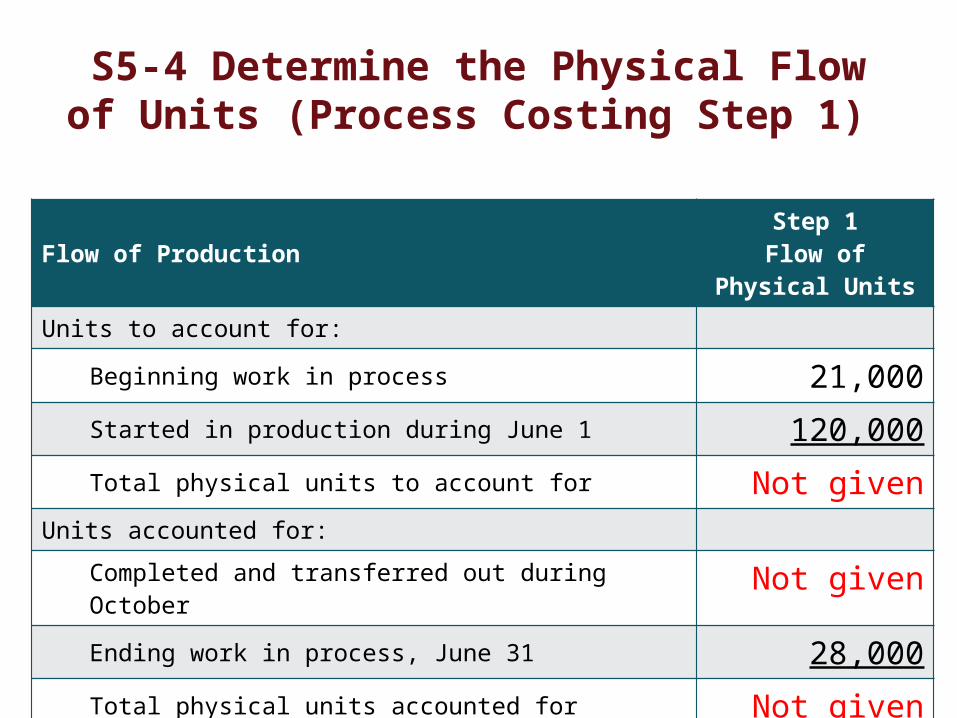
S5-4 Determine the Physical Flow of Units (Process Costing Step 1)
Flow of Production Step 1Flow of Physical Units
Units to account for:
Beginning work in process 21,000Started in production during June 1 120,000Total physical units to account for Not given
Units accounted for:
Completed and transferred out during October Not givenEnding work in process, June 31 28,000Total physical units accounted for Not given

Copyright © 2013 Pearson Education, Inc. Publishing as Prentice Hall. 17
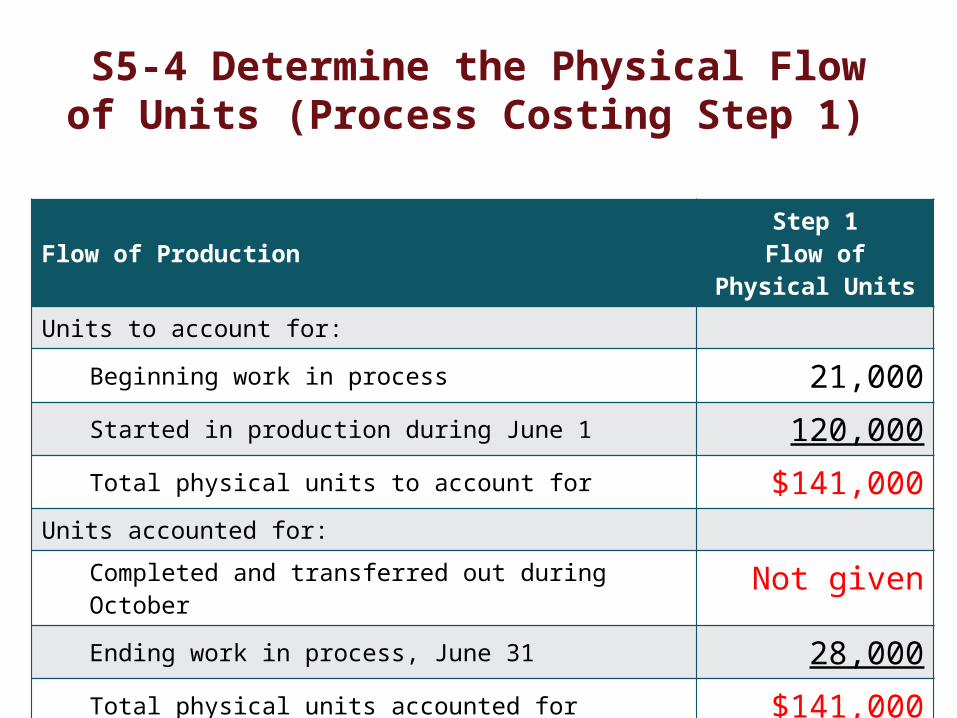
S5-4 Determine the Physical Flow of Units (Process Costing Step 1)
Flow of Production Step 1Flow of Physical Units
Units to account for:
Beginning work in process 21,000Started in production during June 1 120,000Total physical units to account for $141,000
Units accounted for:
Completed and transferred out during October Not givenEnding work in process, June 31 28,000Total physical units accounted for Not given
Copyright © 2013 Pearson Education, Inc. Publishing as Prentice Hall. 18
S5-4 Determine the Physical Flow of Units (Process Costing Step 1)
Flow of Production Step 1Flow of Physical Units
Units to account for:
Beginning work in process 21,000Started in production during June 1 120,000Total physical units to account for $141,000
Units accounted for:
Completed and transferred out during October Not givenEnding work in process, June 31 28,000Total physical units accounted for $141,000
Copyright © 2013 Pearson Education, Inc. Publishing as Prentice Hall. 19
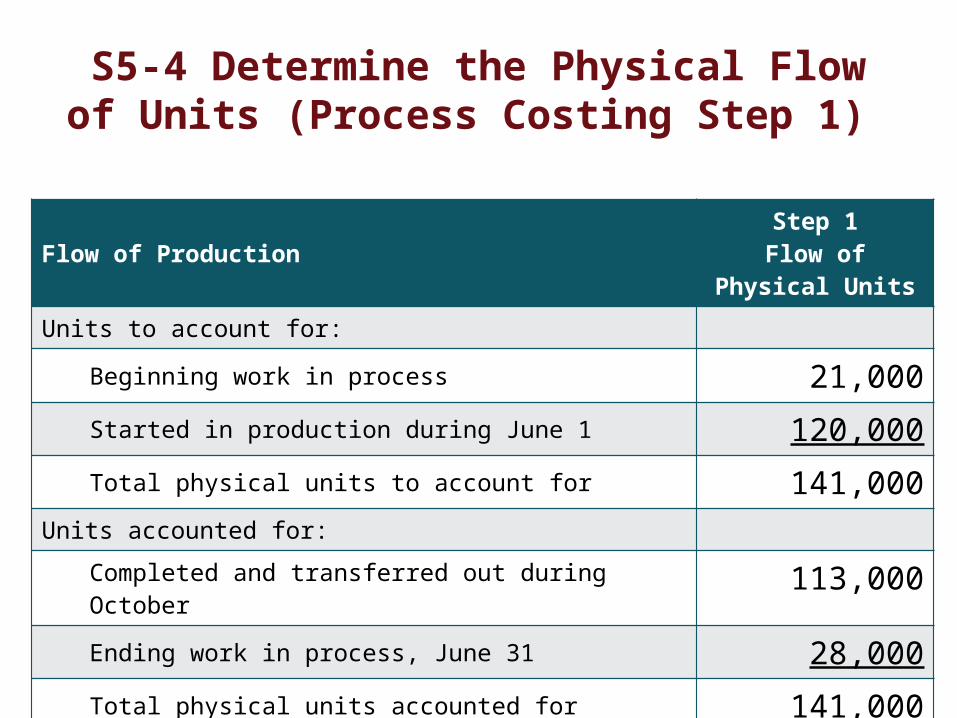
S5-4 Determine the Physical Flow of Units (Process Costing Step 1)
Flow of Production Step 1Flow of Physical Units
Units to account for:
Beginning work in process 21,000Started in production during June 1 120,000Total physical units to account for 141,000
Units accounted for:
Completed and transferred out during October 113,000Ending work in process, June 31 28,000Total physical units accounted for 141,000

Copyright © 2013 Pearson Education, Inc. Publishing as Prentice Hall. 20
Step 2: Compute Output in Terms of Equivalent Units – Exhibit 5-5
Copyright © 2013 Pearson Education, Inc. Publishing as Prentice Hall. 21
S5-6
Copyright © 2013 Pearson Education, Inc. Publishing as Prentice Hall. 22
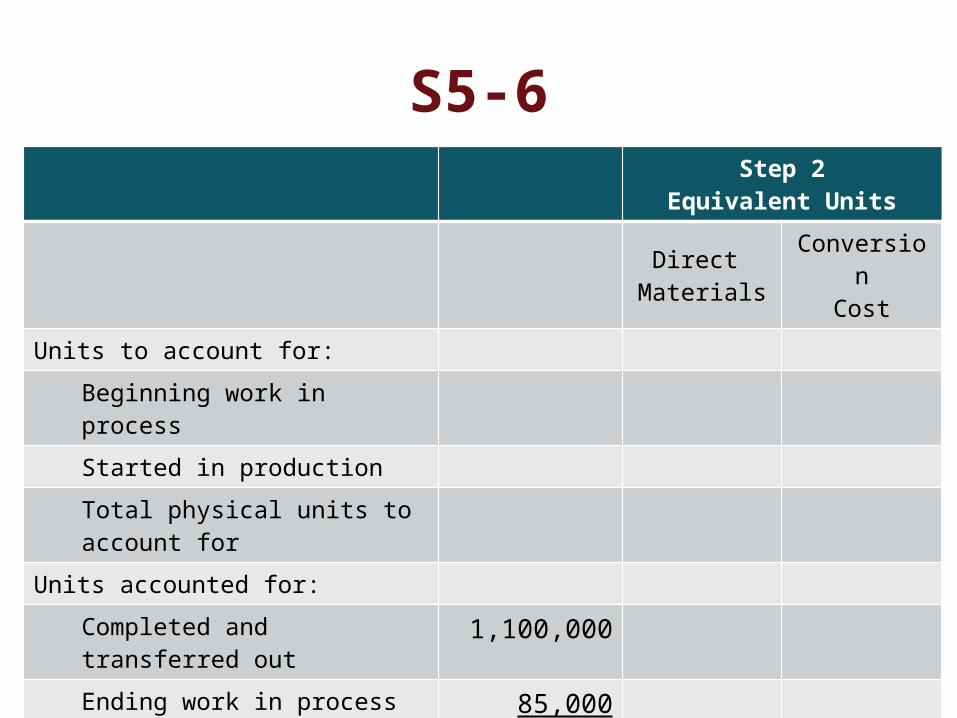
S5-6Step 2
Equivalent UnitsDirect
MaterialsConversion
CostUnits to account for:
Beginning work in process
Started in production
Total physical units to account for
Units accounted for:
Completed and transferred out 1,100,000Ending work in process 85,000Total physical units accounted for 1,185,000
Total equivalent units
Copyright © 2013 Pearson Education, Inc. Publishing as Prentice Hall. 23
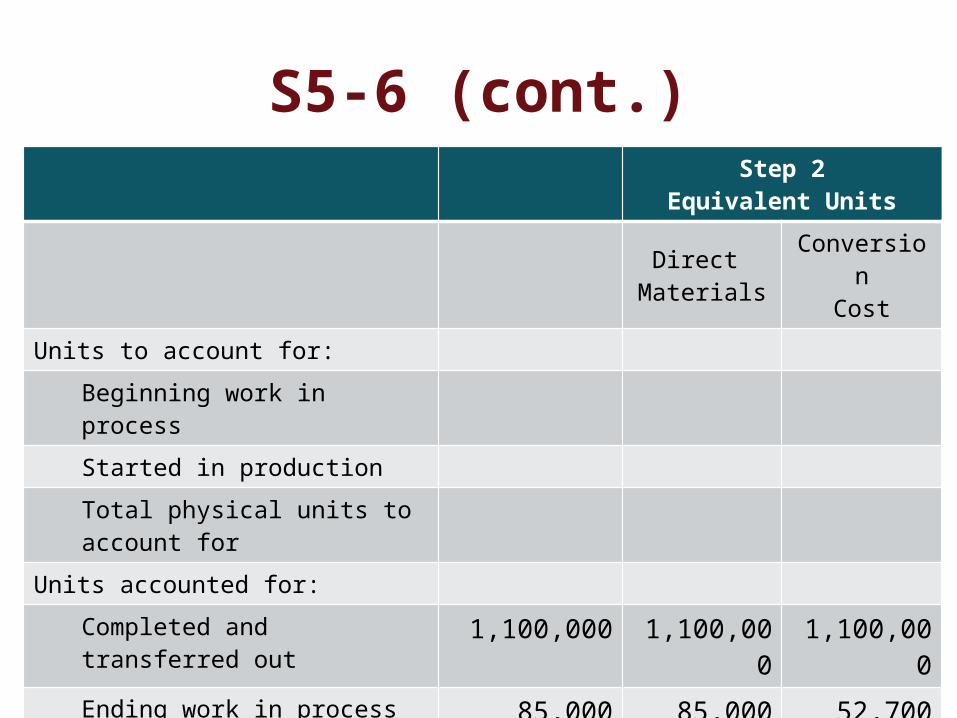
S5-6 (cont.)Step 2
Equivalent UnitsDirect
MaterialsConversion
CostUnits to account for:
Beginning work in process
Started in production
Total physical units to account for
Units accounted for:
Completed and transferred out 1,100,000 1,100,000 1,100,000Ending work in process 85,000 85,000 52,700Total physical units accounted for 1,185,000
Total equivalent units 1,185,000 1,152,700
Copyright © 2013 Pearson Education, Inc. Publishing as Prentice Hall. 24
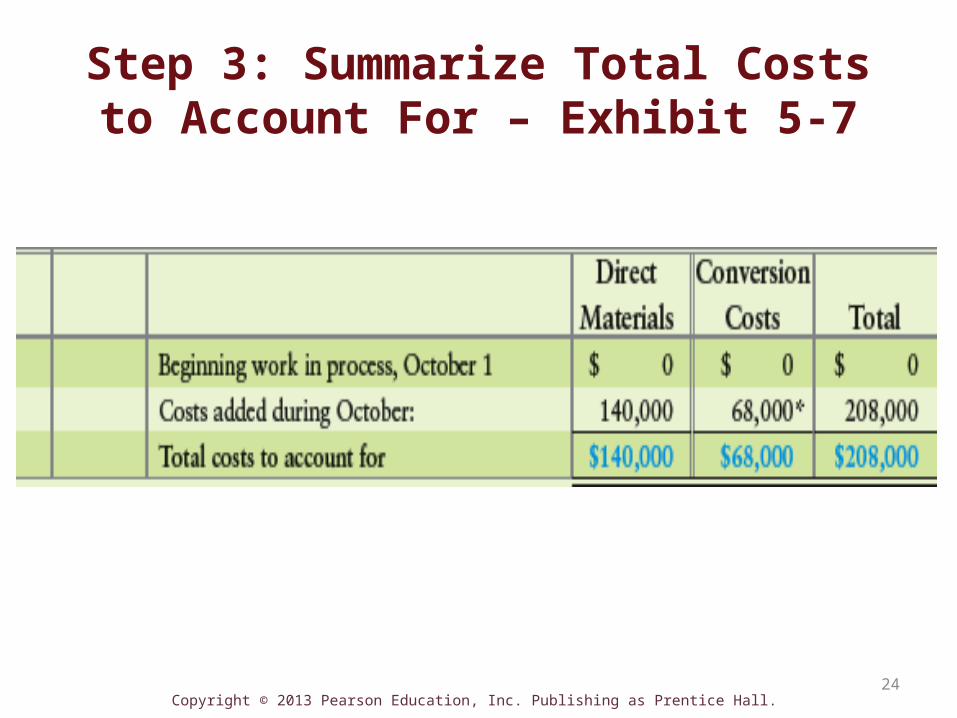
Step 3: Summarize Total Costs to Account For – Exhibit 5-7

Copyright © 2013 Pearson Education, Inc. Publishing as Prentice Hall. 25
Now turn to S5-7
Copyright © 2013 Pearson Education, Inc. Publishing as Prentice Hall. 26
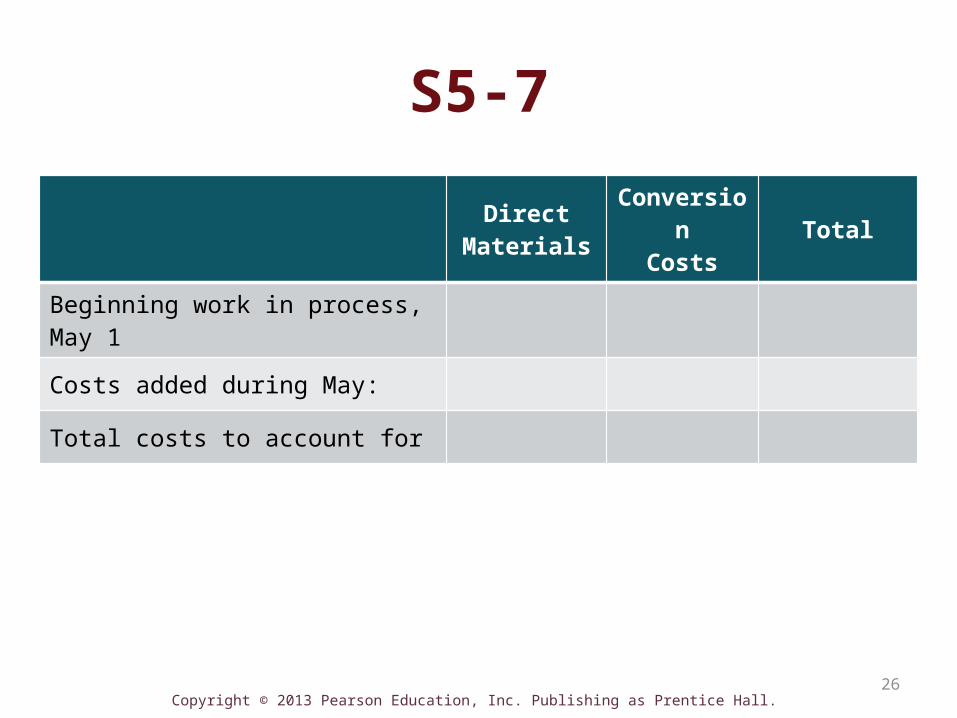
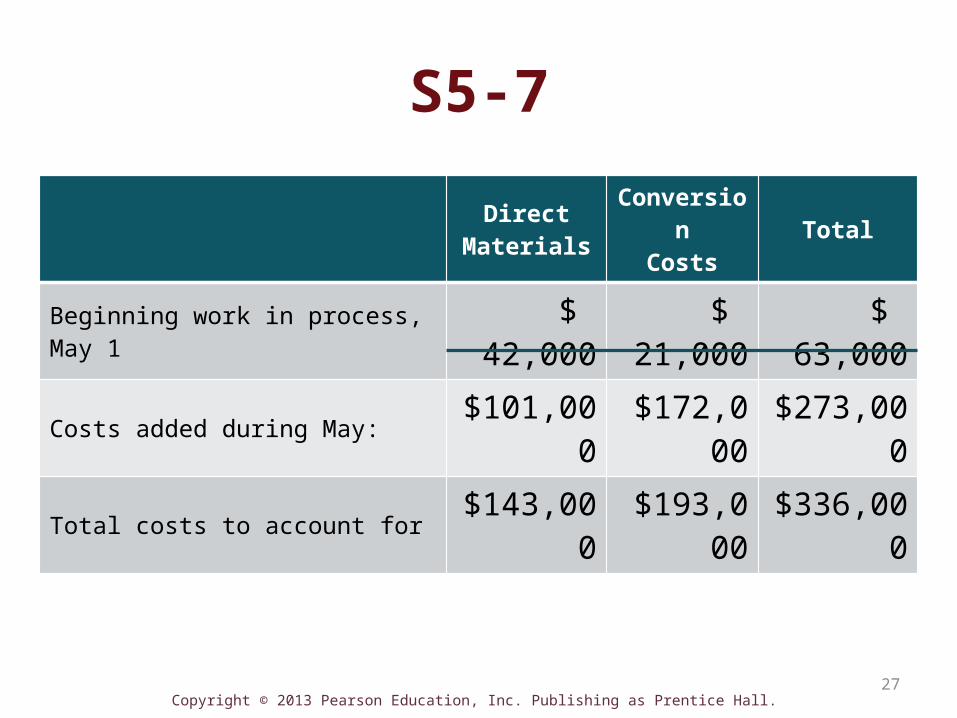
S5-7Direct
MaterialsConversion
Costs Total
Beginning work in process, May 1
Costs added during May:
Total costs to account for
Copyright © 2013 Pearson Education, Inc. Publishing as Prentice Hall. 27
S5-7Direct
MaterialsConversion
Costs Total
Beginning work in process, May 1 $ 42,000 $ 21,000 $ 63,000
Costs added during May: $101,000 $172,000 $273,000
Total costs to account for $143,000 $193,000 $336,000

Copyright © 2013 Pearson Education, Inc. Publishing as Prentice Hall. 28
Step 4: Compute the Cost per Equivalent Unit – Exhibit 5-8
Copyright © 2013 Pearson Education, Inc. Publishing as Prentice Hall. 29
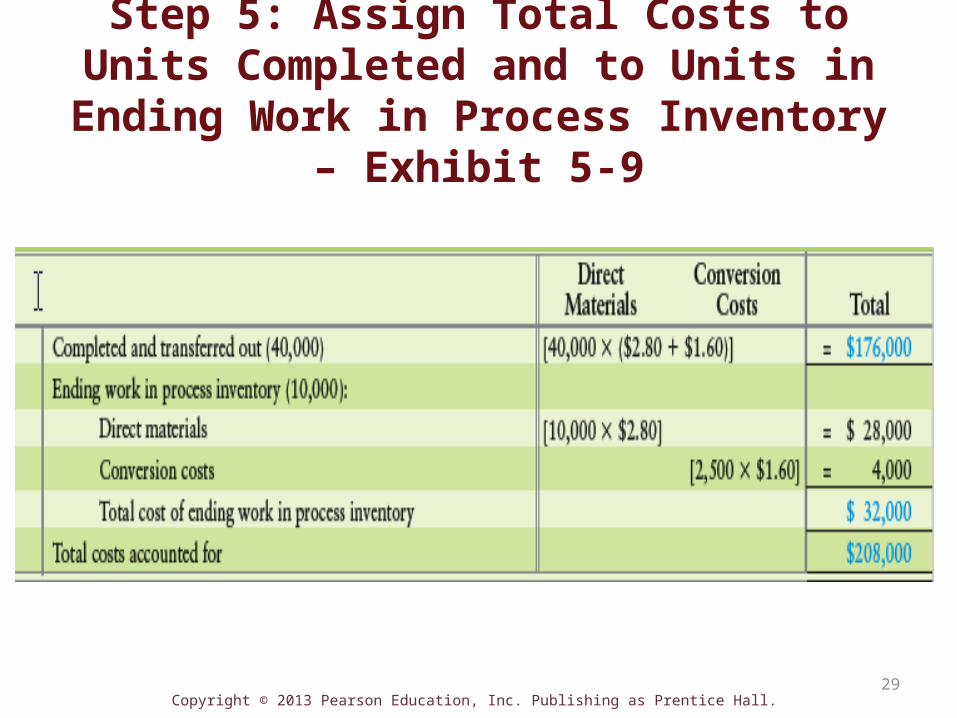
Step 5: Assign Total Costs to Units Completed and to Units in Ending Work in Process
Inventory – Exhibit 5-9
Copyright © 2013 Pearson Education, Inc. Publishing as Prentice Hall. 30
Now turn to S5-10
Copyright © 2013 Pearson Education, Inc. Publishing as Prentice Hall. 31
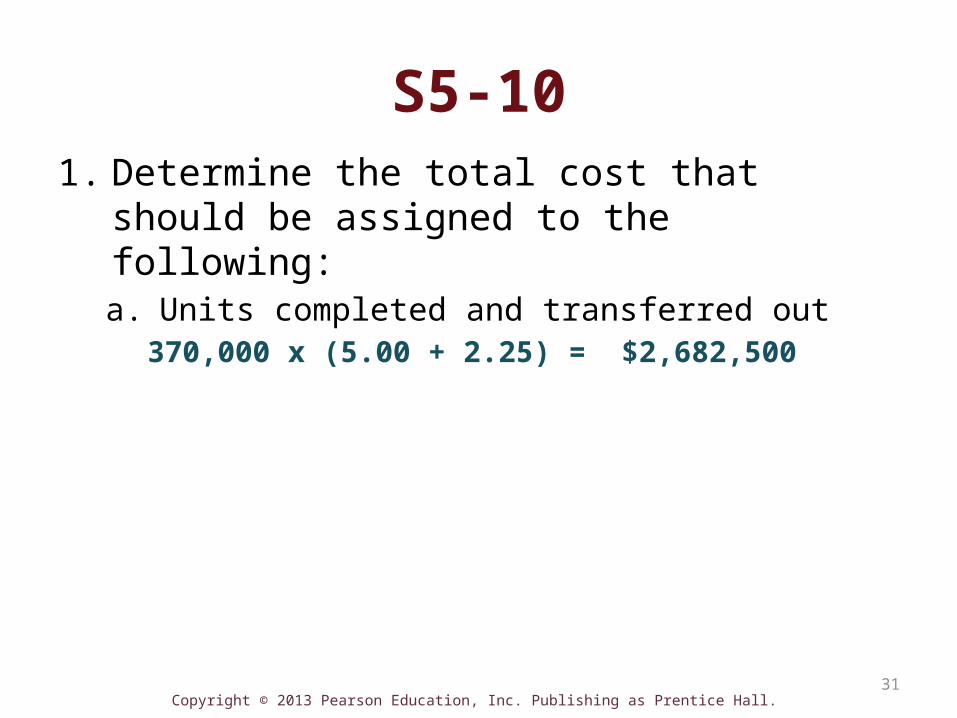
S5-101. Determine the total cost that should be assigned to
the following:a. Units completed and transferred out
370,000 x (5.00 + 2.25) = $2,682,500
Copyright © 2013 Pearson Education, Inc. Publishing as Prentice Hall. 32
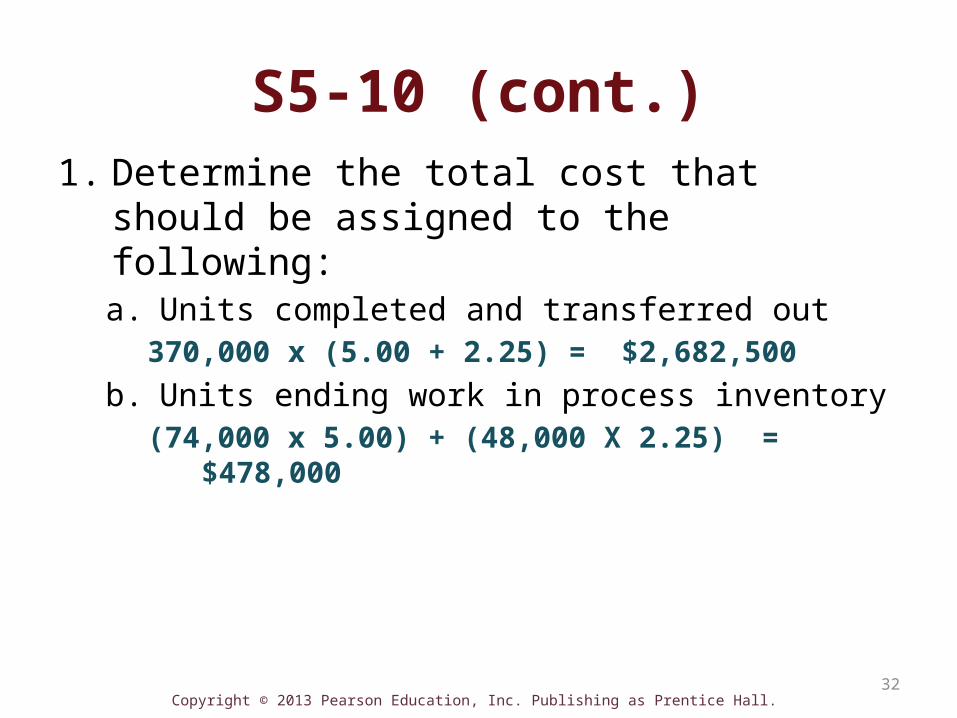
S5-10 (cont.)1. Determine the total cost that should be assigned to
the following:a. Units completed and transferred out
370,000 x (5.00 + 2.25) = $2,682,500 b. Units ending work in process inventory
(74,000 x 5.00) + (48,000 X 2.25) = $478,000
Copyright © 2013 Pearson Education, Inc. Publishing as Prentice Hall. 33
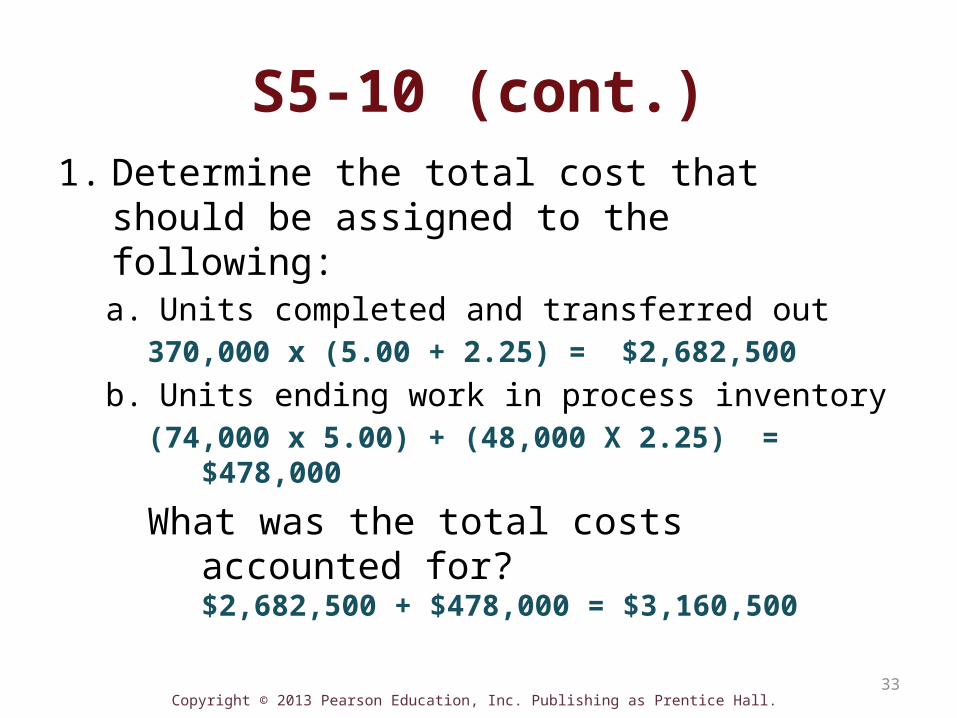
S5-10 (cont.)1. Determine the total cost that should be assigned to
the following:a. Units completed and transferred out
370,000 x (5.00 + 2.25) = $2,682,500 b. Units ending work in process inventory
(74,000 x 5.00) + (48,000 X 2.25) = $478,000
What was the total costs accounted for?$2,682,500 + $478,000 = $3,160,500

Copyright © 2013 Pearson Education, Inc. Publishing as Prentice Hall. 34
S5-10 (cont.)1. Determine the total cost that should be assigned to
the following:a. Units completed and transferred out
370,000 x (5.00 + 2.25) = $2,682,500 b. Units ending work in process inventory
(74,000 x 5.00) + (48,000 X 2.25) = $478,000
What was the total costs accounted for? $2,682,500 + $478,000 = $3,160,500
2. What was Oscar’s average cost of making one unit of its product?
$5.00 + $2.25 = $7.25
Copyright © 2013 Pearson Education, Inc. Publishing as Prentice Hall. 35
Sustainability and Process Costing
• Employs lean and green practices
• Efficient and environmentally friendly?
• Many parties benefit

Copyright © 2013 Pearson Education, Inc. Publishing as Prentice Hall. 36
S5-8
Copyright © 2013 Pearson Education, Inc. Publishing as Prentice Hall. 37
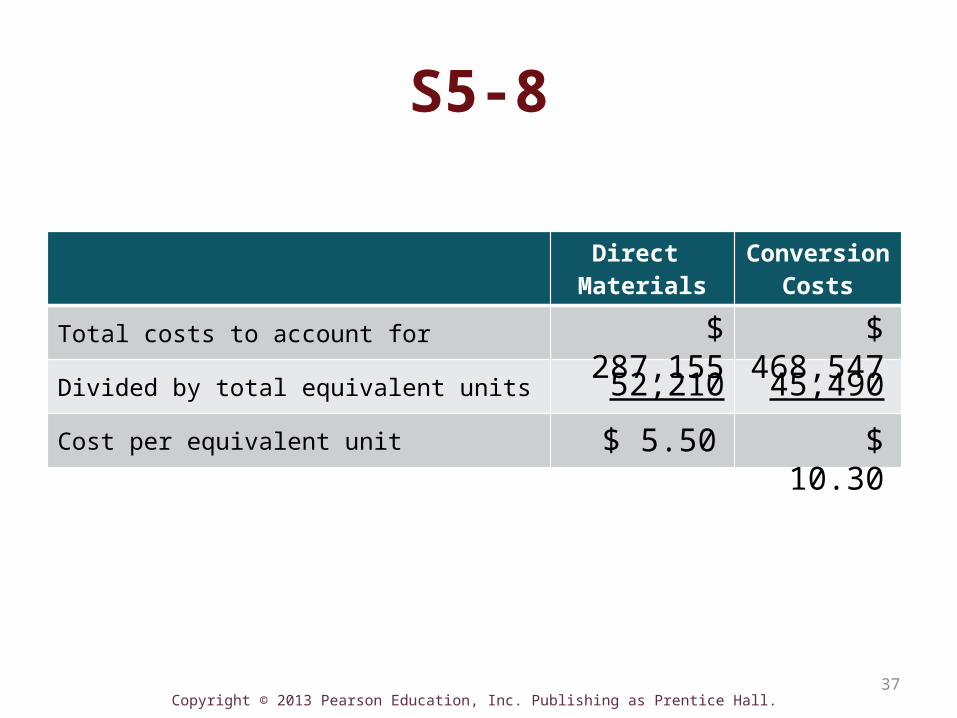
S5-8
Direct Materials
ConversionCosts
Total costs to account for
Divided by total equivalent units
Cost per equivalent unit
$ 287,155 $ 468,547
52,210 45,490
$ 5.50 $ 10.30

Copyright © 2013 Pearson Education, Inc. Publishing as Prentice Hall. 38
Objective 4Prepare journal entries for a process
costing system
Copyright © 2013 Pearson Education, Inc. Publishing as Prentice Hall.
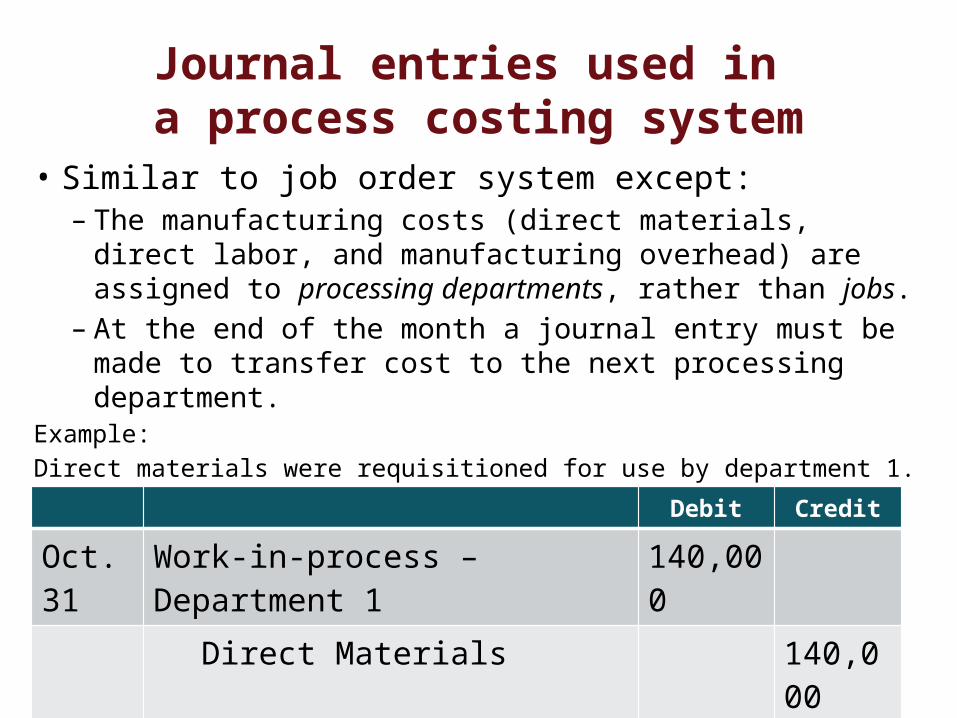
Journal entries used in a process costing system
• Similar to job order system except:– The manufacturing costs (direct materials, direct labor, and
manufacturing overhead) are assigned to processing departments, rather than jobs.
– At the end of the month a journal entry must be made to transfer cost to the next processing department.
Example:Direct materials were requisitioned for use by department 1.
Debit Credit
Oct. 31
Work-in-process – Department 1 140,000
Direct Materials 140,000Materials requisitioned to department 1
Copyright © 2013 Pearson Education, Inc. Publishing as Prentice Hall.
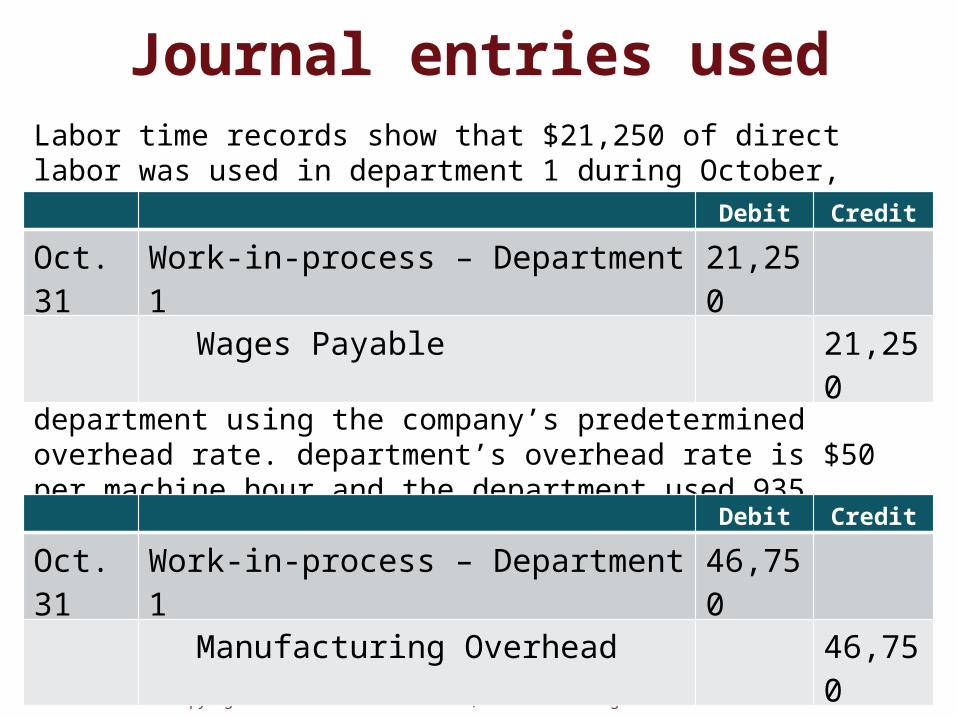
Journal entries usedLabor time records show that $21,250 of direct labor was used in department 1 during October, resulting in this journal entry
Manufacturing overhead is allocated to the department using the company’s predetermined overhead rate. department’s overhead rate is $50 per machine hour and the department used 935 machine hours
Debit Credit
Oct. 31 Work-in-process – Department 1 46,750Manufacturing Overhead 46,750
Debit Credit
Oct. 31 Work-in-process – Department 1 21,250Wages Payable 21,250
Copyright © 2013 Pearson Education, Inc. Publishing as Prentice Hall.
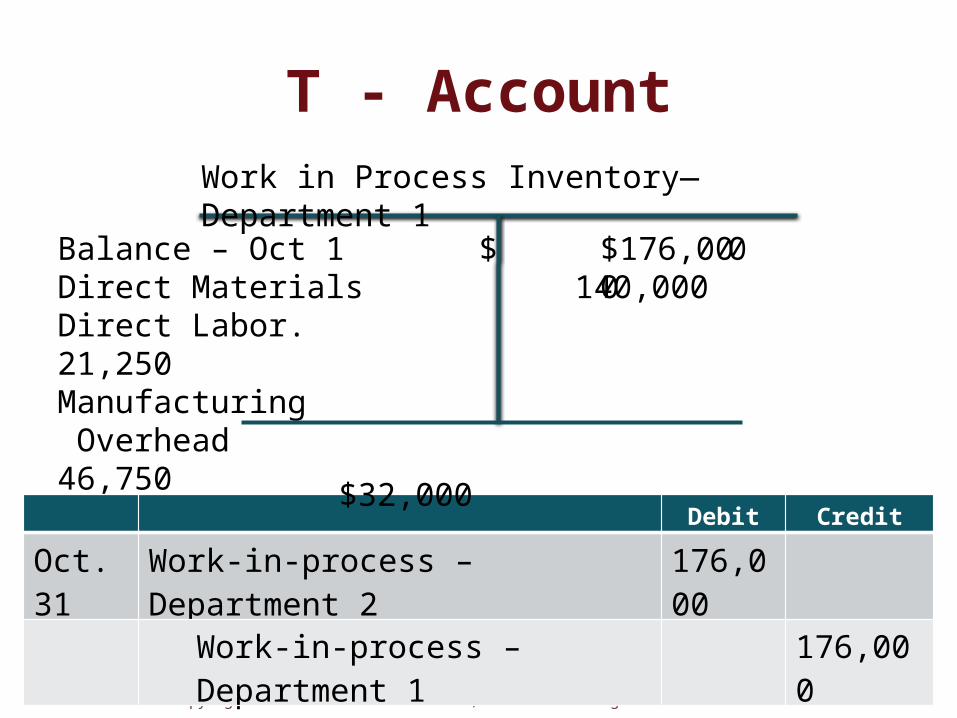
T - AccountWork in Process Inventory—Department 1
Balance – Oct 1 $ 0Direct Materials 140,000Direct Labor. 21,250Manufacturing Overhead 46,750
$176,000
Debit Credit
Oct. 31 Work-in-process – Department 2 176,000Work-in-process – Department 1 176,000
$32,000
Copyright © 2013 Pearson Education, Inc. Publishing as Prentice Hall. 42
Turn to E5-28A

Copyright © 2013 Pearson Education, Inc. Publishing as Prentice Hall.
E5-28A, Req. 1Debit Credit
May 31 Work-in-process – Blending 5,980
Raw Materials Inventory 5,980To record direct materials used by Blending
Debit Credit
May 31 Work-in-process – Blending 850Wages Payable 850
To record direct labor used in Blending
Debit Credit
May 31 Work-in-process – Blending 1,733Manufacturing Overhead 1,733
To record Mfg overhead allocated to Blending
Copyright © 2013 Pearson Education, Inc. Publishing as Prentice Hall.
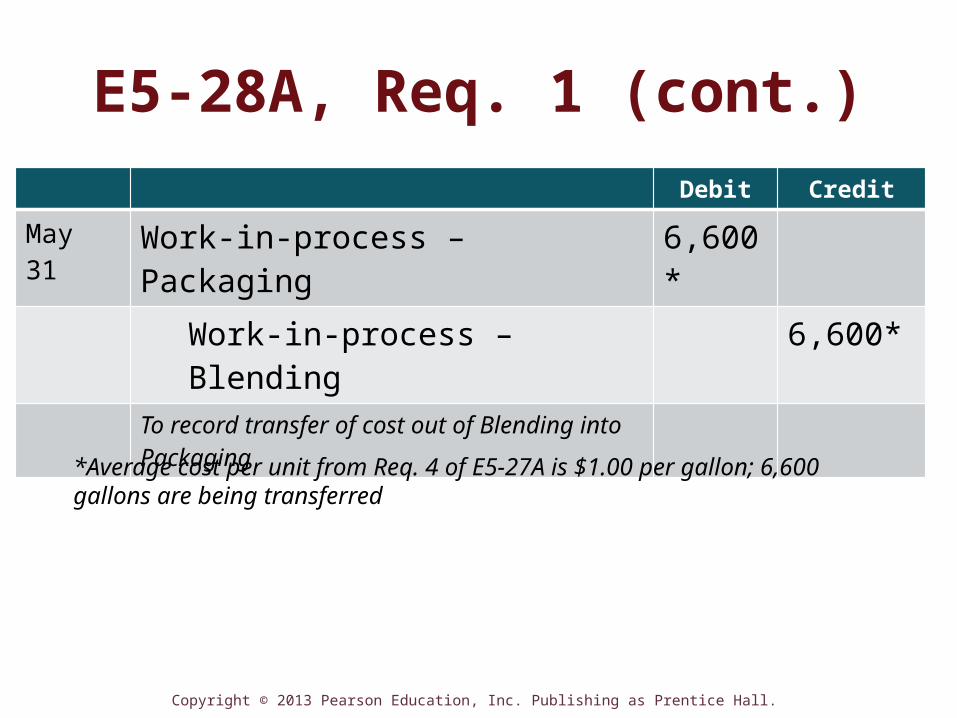
Debit Credit
May 31 Work-in-process – Packaging 6,600*Work-in-process – Blending 6,600*
To record transfer of cost out of Blending into Packaging
E5-28A, Req. 1 (cont.)
*Average cost per unit from Req. 4 of E5-27A is $1.00 per gallon; 6,600 gallons are being transferred

Copyright © 2013 Pearson Education, Inc. Publishing as Prentice Hall.
E5-28A, Req. 2Work in Process Inventory— Blending
Balance – May 1 $ 0Direct Materials 5,980Direct Labor 850Mfg Overhead 1,733
$6,600
$1,963
Copyright © 2013 Pearson Education, Inc. Publishing as Prentice Hall. 46
Objective 5Use process costing in a second or later
production department

Copyright © 2013 Pearson Education, Inc. Publishing as Prentice Hall. 47
Process Costing in a Second or Later Processing Department
• Same five-step process
• Include cost of units transferred in when calculating equivalent units (EU) and cost per EU
• Transferred-in costs$208,000 $176,000
$32,000
Copyright © 2013 Pearson Education, Inc. Publishing as Prentice Hall. 48
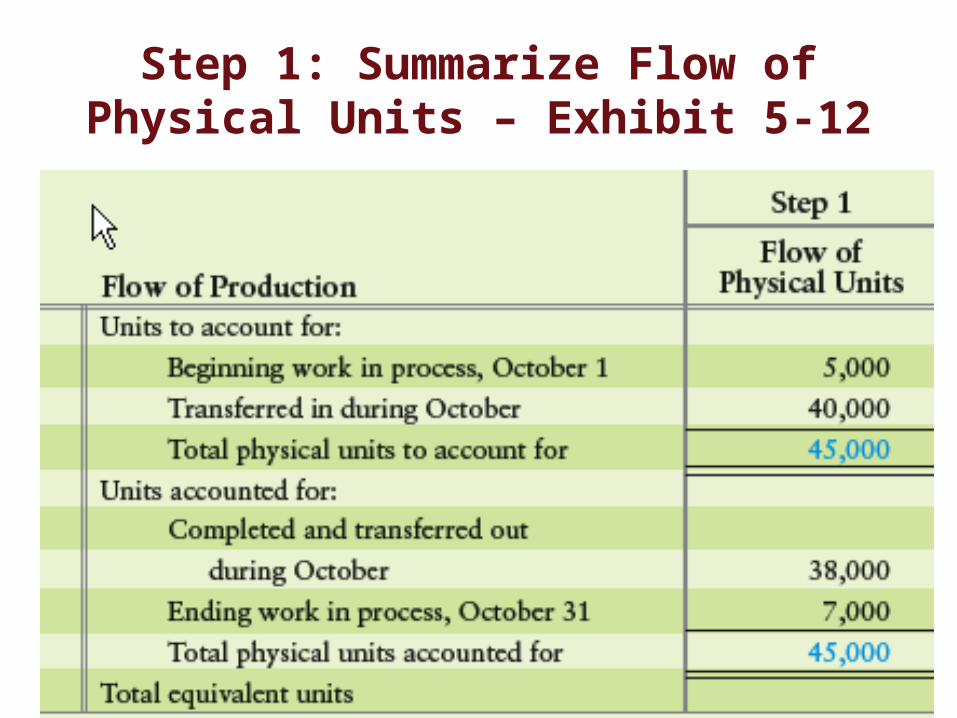
Step 1: Summarize Flow of Physical Units – Exhibit 5-12

Copyright © 2013 Pearson Education, Inc. Publishing as Prentice Hall. 49
Step 1 Step 2: Equivalent UnitsFlow of
Physical Units Transferred In Direct Materials
Conversion Cost
Step 2: Compute Output in Terms of Equivalent Units – Exhibit 5-12
See Exhibit 5-12 on page 276 for additional details

Copyright © 2013 Pearson Education, Inc. Publishing as Prentice Hall. 50
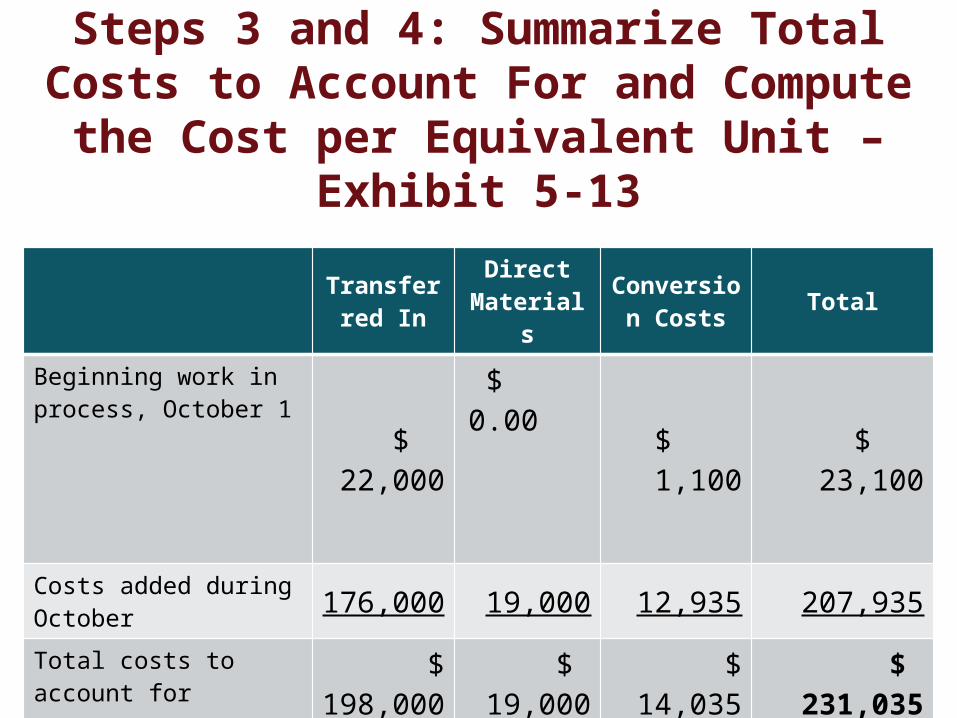
Steps 3 and 4: Summarize Total Costs to Account For and Compute the Cost per Equivalent Unit –
Exhibit 5-13
Transferred In
Direct Materials
Conversion Costs Total
Beginning work in process, October 1 $ 22,000
$ 0
$ 1,100 $ 23,100
Costs added during October 176,000 19,000 12,935 207,935Total costs to account for
Divide by total equivalent units
Cost per equivalent unit *
Copyright © 2013 Pearson Education, Inc. Publishing as Prentice Hall. 51
Steps 3 and 4: Summarize Total Costs to Account For and Compute the Cost per Equivalent Unit –
Exhibit 5-13
Transferred In
Direct Materials
Conversion Costs Total
Beginning work in process, October 1 $ 22,000
$ 0.00
$ 1,100 $ 23,100
Costs added during October 176,000 19,000 12,935 207,935Total costs to account for $ 198,000 $ 19,000 $ 14,035 $ 231,035Divide by total equivalent units 45,000 38,000 40,100
Cost per equivalent unit $ 4.40 $ 0.50 $ 0.35
Copyright © 2013 Pearson Education, Inc. Publishing as Prentice Hall. 52
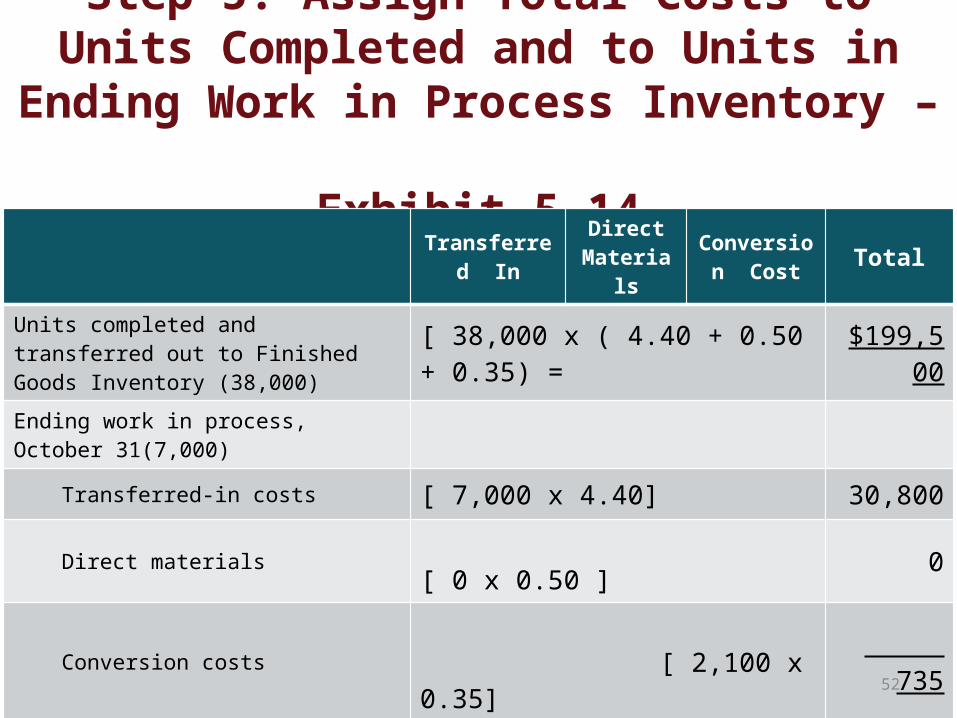
Step 5: Assign Total Costs to Units Completed and to Units in Ending Work in Process Inventory –
Exhibit 5-14Transferred In Direct
MaterialsConversion
Cost Total
Units completed and transferred out to Finished Goods Inventory (38,000) [ 38,000 x ( 4.40 + 0.50 + 0.35) = $199,500
Ending work in process, October 31(7,000)
Transferred-in costs [ 7,000 x 4.40] 30,800
Direct materials [ 0 x 0.50 ] 0
Conversion costs [ 2,100 x 0.35] 735
Total ending work in process, October 31 $ 31,535
Total costs accounted for $ 231,035

Copyright © 2013 Pearson Education, Inc. Publishing as Prentice Hall. 53
End of Chapter 5