copyright 2008 the mcgraw-hill companies 20-1 facts about income inequality causes of income...
TRANSCRIPT

Copyright 2008 The McGraw-Hill Companies20-1
Facts About Income InequalityCauses of Income InequalityEquality Versus EfficiencyThe Economics of PovertyU.S. Income Maintenance SystemLast Word
Key Terms
End Show
20Income Inequality and Poverty
Copyright 2008 The McGraw-Hill Companies20-2
Facts About Income InequalityCauses of Income InequalityEquality Versus EfficiencyThe Economics of PovertyU.S. Income Maintenance SystemLast Word
Key Terms
End Show
Chapter Objectives• How Income Inequality in the United
States is Measured and Described• The Extent and Sources of Income
Inequality• How Income Inequality Has
Changed Since 1970• The Economic Arguments For and
Against Income Inequality• How Poverty is Measured and its
Incidence by Age, Gender, Ethnicity, and Other Characteristics
• The Major Components of the Income-Maintenance Program in the United States
Copyright 2008 The McGraw-Hill Companies20-3
Facts About Income InequalityCauses of Income InequalityEquality Versus EfficiencyThe Economics of PovertyU.S. Income Maintenance SystemLast Word
Key Terms
End Show
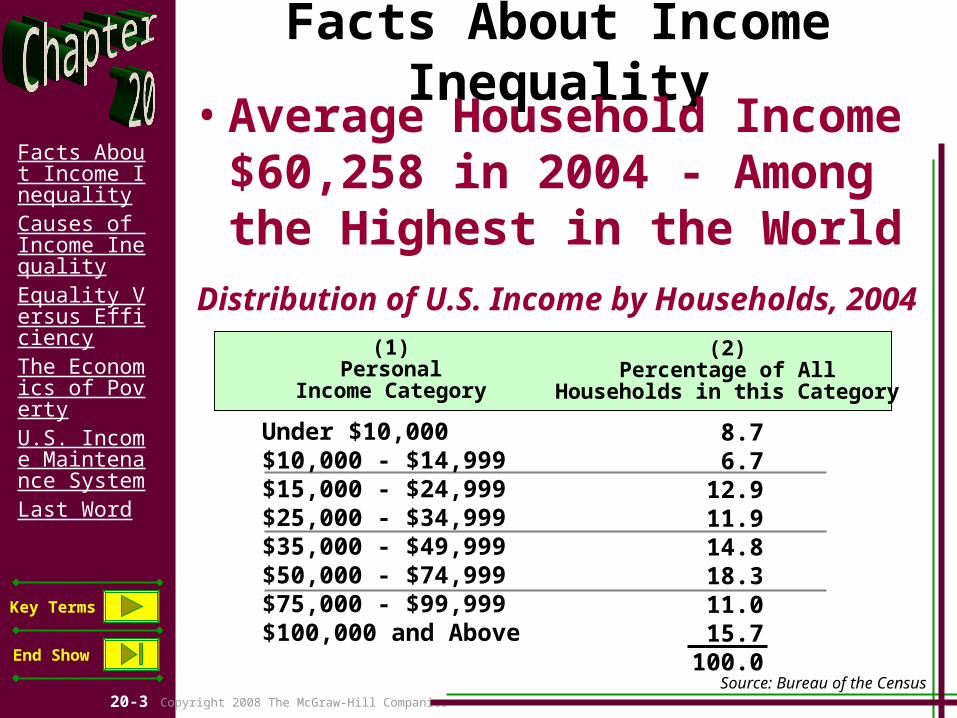
Facts About Income Inequality• Average Household Income
$60,258 in 2004 - Among the Highest in the World
(1)Personal
Income Category
(2)Percentage of All
Households in this Category
Under $10,000$10,000 - $14,999$15,000 - $24,999$25,000 - $34,999$35,000 - $49,999$50,000 - $74,999$75,000 - $99,999$100,000 and Above
Distribution of U.S. Income by Households, 2004
8.76.7
12.911.914.818.311.015.7
100.0Source: Bureau of the Census
Copyright 2008 The McGraw-Hill Companies20-4
Facts About Income InequalityCauses of Income InequalityEquality Versus EfficiencyThe Economics of PovertyU.S. Income Maintenance SystemLast Word
Key Terms
End Show
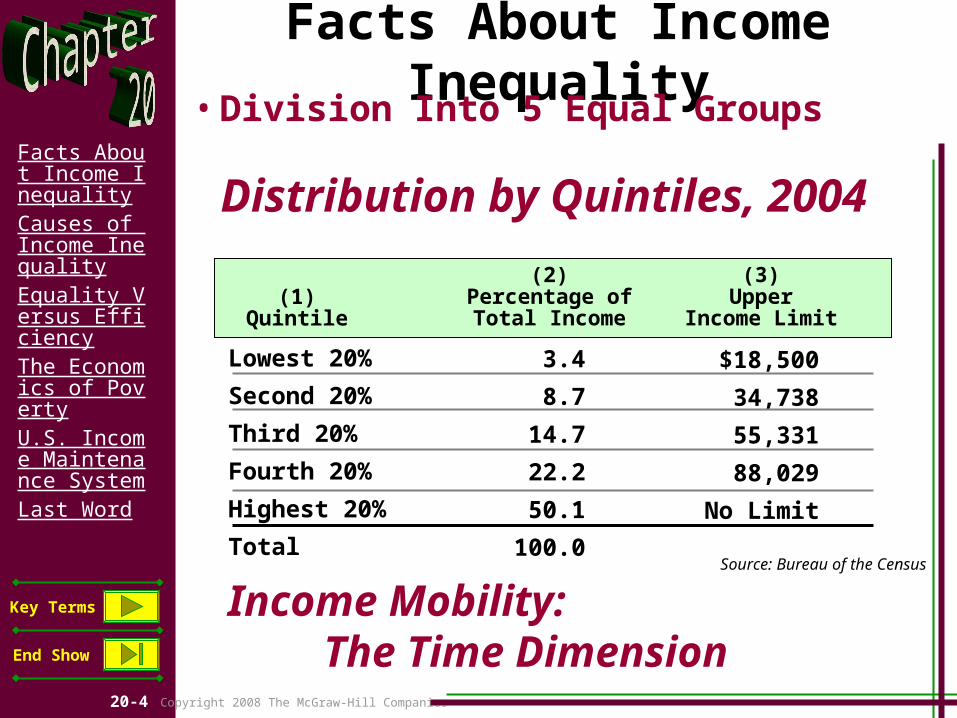
Facts About Income Inequality• Division Into 5 Equal Groups
(1)Quintile
(2)Percentage ofTotal Income
Lowest 20%
Second 20%
Third 20%
Fourth 20%
Highest 20%
Total
Distribution by Quintiles, 2004
3.4
8.7
14.7
22.2
50.1
100.0Source: Bureau of the Census
(3)Upper
Income Limit
$18,500
34,738
55,331
88,029
No Limit
Income Mobility: The Time Dimension

Copyright 2008 The McGraw-Hill Companies20-5
Facts About Income InequalityCauses of Income InequalityEquality Versus EfficiencyThe Economics of PovertyU.S. Income Maintenance SystemLast Word
Key Terms
End Show
Facts About Income Inequality• Lorenz Curve and Gini Ratio
The Lorenz Curve
20 40 60 80 100
20
40
60
80
100
0
Perfect Equality
Lorenz Curve(Actual Distribution)
Complete Inequality
A B
ab
c
d
e
f
Gini Ratio =Area A
Area A + Area B
Percentage of Households
Per
cen
tag
e o
f In
co
me
W 20.1
G 20.1
Copyright 2008 The McGraw-Hill Companies20-6
Facts About Income InequalityCauses of Income InequalityEquality Versus EfficiencyThe Economics of PovertyU.S. Income Maintenance SystemLast Word
Key Terms
End Show
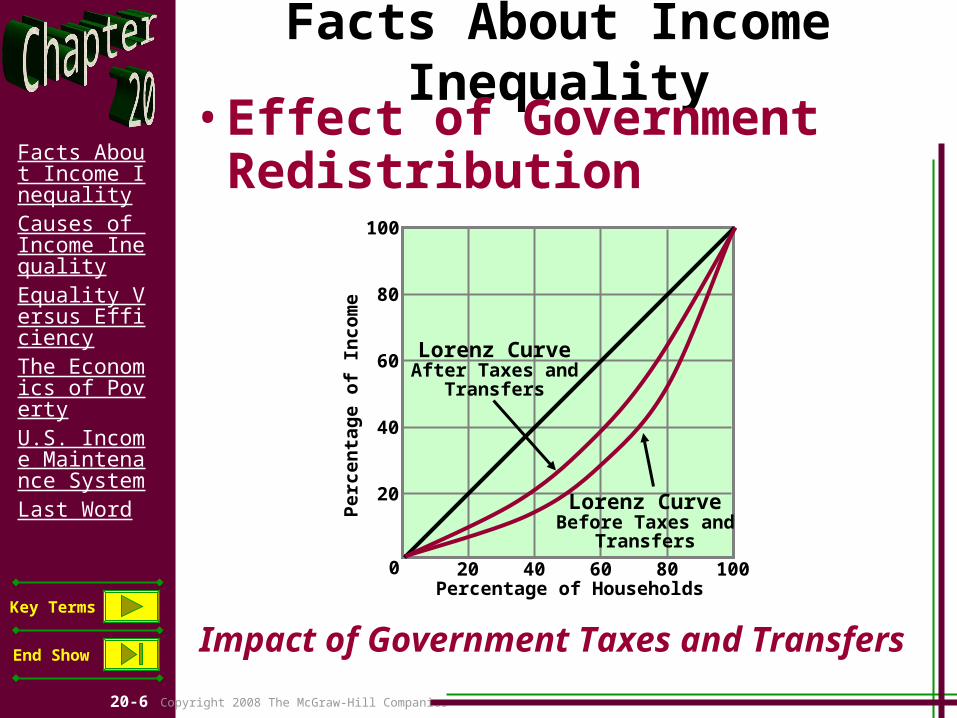
Facts About Income Inequality• Effect of Government
Redistribution
20 40 60 80 100
20
40
60
80
100
0
Lorenz CurveBefore Taxes and
Transfers
Percentage of Households
Per
cen
tag
e o
f In
co
me
Lorenz CurveAfter Taxes and
Transfers
Impact of Government Taxes and Transfers

Copyright 2008 The McGraw-Hill Companies20-7
Facts About Income InequalityCauses of Income InequalityEquality Versus EfficiencyThe Economics of PovertyU.S. Income Maintenance SystemLast Word
Key Terms
End Show
Facts About Income Inequality• Effect of Government
Redistribution• Noncash Transfers• Percentage of Total Income
Received, 2003
(1)Quintile
(2)Before TaxesAnd Transfers
Lowest 20%
Second 20%
Third 20%
Fourth 20%
Highest 20%
.8
7.2
14.8
24.0
53.1
Source: Bureau of the Census
(3)After Taxes
And Transfers
4.5
10.7
16.4
24.0
44.4
Copyright 2008 The McGraw-Hill Companies20-8
Facts About Income InequalityCauses of Income InequalityEquality Versus EfficiencyThe Economics of PovertyU.S. Income Maintenance SystemLast Word
Key Terms
End Show
Causes of Income Inequality• Ability• Education and Training• Discrimination• Preferences and Risks• Unequal Distribution of
Wealth• Market Power• Luck, Connections, and
Misfortune
Copyright 2008 The McGraw-Hill Companies20-9
Facts About Income InequalityCauses of Income InequalityEquality Versus EfficiencyThe Economics of PovertyU.S. Income Maintenance SystemLast Word
Key Terms
End Show
Causes of Income Inequality• Income Inequality Over Time
• Rising Income Inequality Since 1970
• Causes of Growing Inequality– Greater Demand for Highly
Skilled Workers
– Demographic Changes
– International Trade, Immigration, and Decline in Unionism

Copyright 2008 The McGraw-Hill Companies20-10
Facts About Income InequalityCauses of Income InequalityEquality Versus EfficiencyThe Economics of PovertyU.S. Income Maintenance SystemLast Word
Key Terms
End Show
Causes of Income Inequality
GLOBAL PERSPECTIVE
GuatemalaBrazil
South AfricaMexico
United StatesItaly
SwedenGermany
0 10 20 30 40 50
48.3
46.9
44.7
43.1
29.9
26.8
22.2
22.1
Source: World Bank, World Development Indicators, 2005
Percentage of Total Income Received by the Top One-Tenth of Income Receivers, Selected Nations
Copyright 2008 The McGraw-Hill Companies20-11
Facts About Income InequalityCauses of Income InequalityEquality Versus EfficiencyThe Economics of PovertyU.S. Income Maintenance SystemLast Word
Key Terms
End Show
Equality Versus Efficiency
• The Case for Equality: Maximizing Total Utility
• The Case for Inequality: Incentives and Efficiency
• The Equality-Efficiency Tradeoff
Copyright 2008 The McGraw-Hill Companies20-12
Facts About Income InequalityCauses of Income InequalityEquality Versus EfficiencyThe Economics of PovertyU.S. Income Maintenance SystemLast Word
Key Terms
End Show
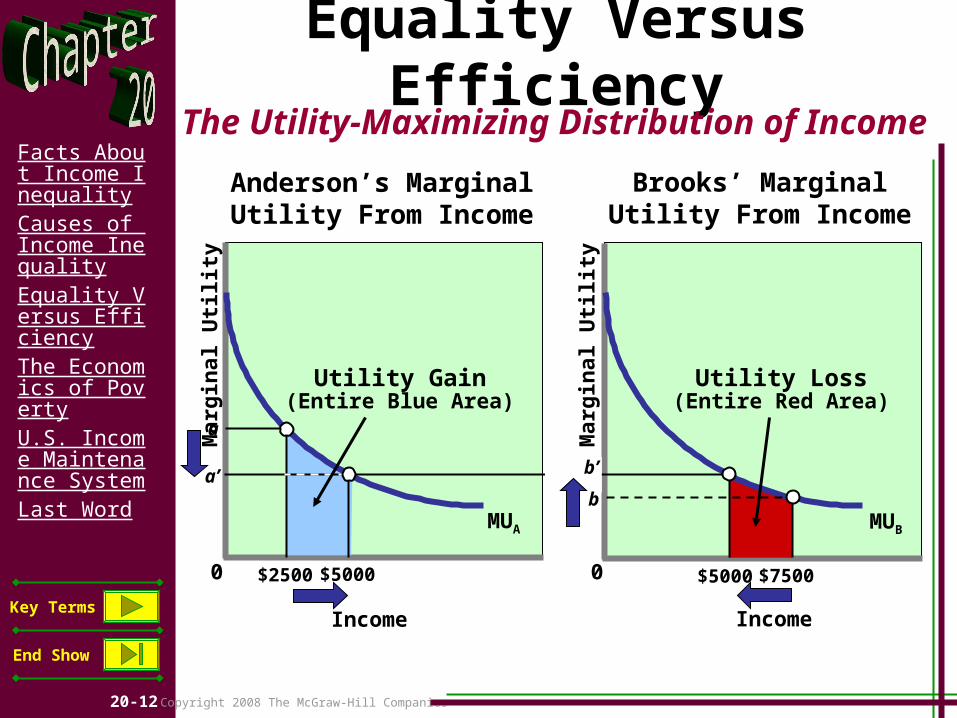
Equality Versus EfficiencyThe Utility-Maximizing Distribution of Income
Anderson’s MarginalUtility From Income
Brooks’ MarginalUtility From Income
0 0M
arg
inal
Uti
lity
Mar
gin
al U
tilit
y
Income Income
$5000 $5000$2500 $7500
MUBMUA
a
a’ b’
b
Utility Gain(Entire Blue Area)
Utility Loss(Entire Red Area)
Copyright 2008 The McGraw-Hill Companies20-13
Facts About Income InequalityCauses of Income InequalityEquality Versus EfficiencyThe Economics of PovertyU.S. Income Maintenance SystemLast Word
Key Terms
End Show
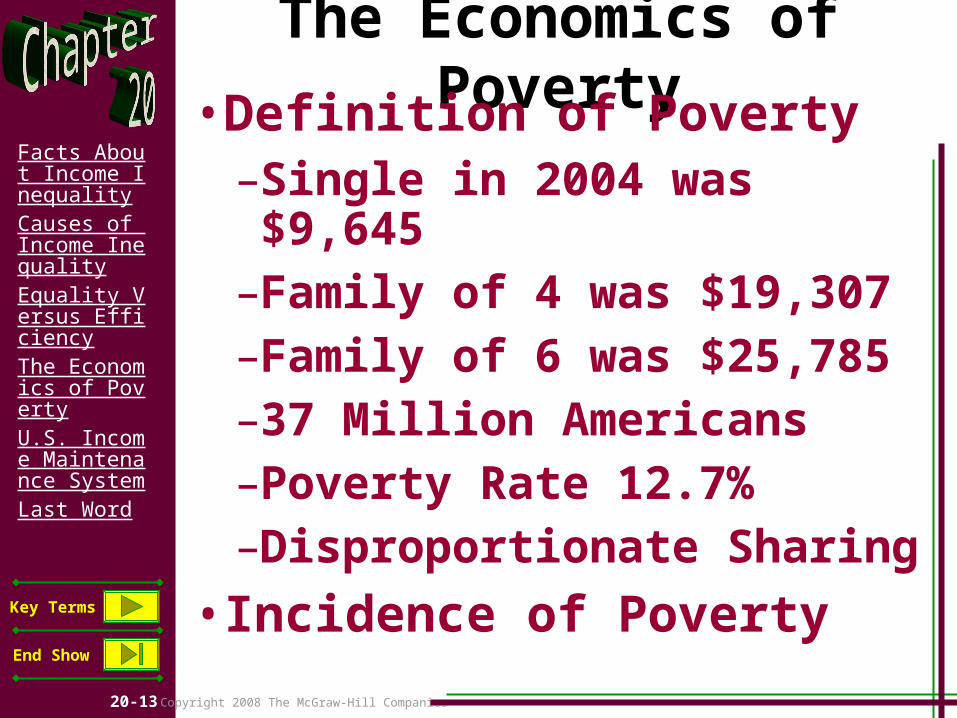
The Economics of Poverty• Definition of Poverty
–Single in 2004 was $9,645–Family of 4 was $19,307–Family of 6 was $25,785–37 Million Americans–Poverty Rate 12.7%–Disproportionate Sharing
• Incidence of Poverty

Copyright 2008 The McGraw-Hill Companies20-14
Facts About Income InequalityCauses of Income InequalityEquality Versus EfficiencyThe Economics of PovertyU.S. Income Maintenance SystemLast Word
Key Terms
End Show
The Economics of Poverty
Female-HouseholdersAfrican-Americans
HispanicsForeign-Born (Not Citizens)
Children Under 18Women
Total PopulationMen
WhitesAsian
Persons 65 or OlderMarried-Couple Families
Full-Time Workers
0 10 20 30
24.7
21.9
21.4
17.8
13.9
12.7
11.5
10.8
9.8
9.8
5.5
2.8
28.4
Poverty Rates Among Selected Population Groups,2004
Copyright 2008 The McGraw-Hill Companies20-15
Facts About Income InequalityCauses of Income InequalityEquality Versus EfficiencyThe Economics of PovertyU.S. Income Maintenance SystemLast Word
Key Terms
End Show
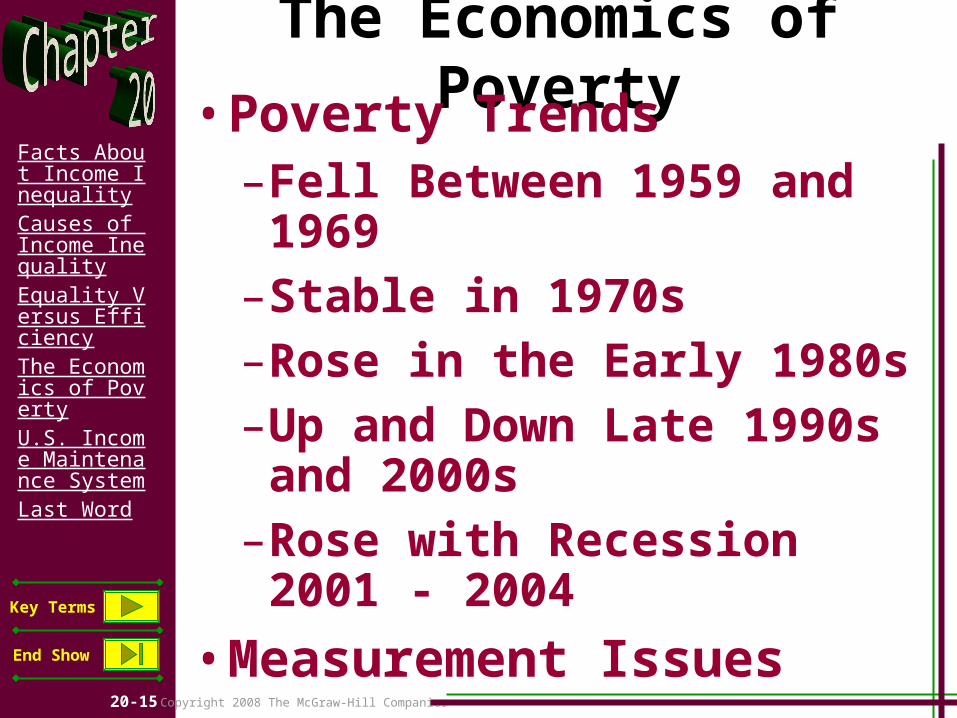
The Economics of Poverty• Poverty Trends
–Fell Between 1959 and 1969–Stable in 1970s–Rose in the Early 1980s–Up and Down Late 1990s
and 2000s–Rose with Recession 2001 -
2004
• Measurement Issues

Copyright 2008 The McGraw-Hill Companies20-16
Facts About Income InequalityCauses of Income InequalityEquality Versus EfficiencyThe Economics of PovertyU.S. Income Maintenance SystemLast Word
Key Terms
End Show
U.S. Income-Maintenance System
• Entitlement Programs–Social Insurance Programs–Social Security –Medicare–Unemployment
Compensation–Public Assistance “Welfare”–Supplemental Security
Income (SSI) Program–Temporary Assistance for
Needy Families (TANF)–Food-Stamp Program
Copyright 2008 The McGraw-Hill Companies20-17
Facts About Income InequalityCauses of Income InequalityEquality Versus EfficiencyThe Economics of PovertyU.S. Income Maintenance SystemLast Word
Key Terms
End Show
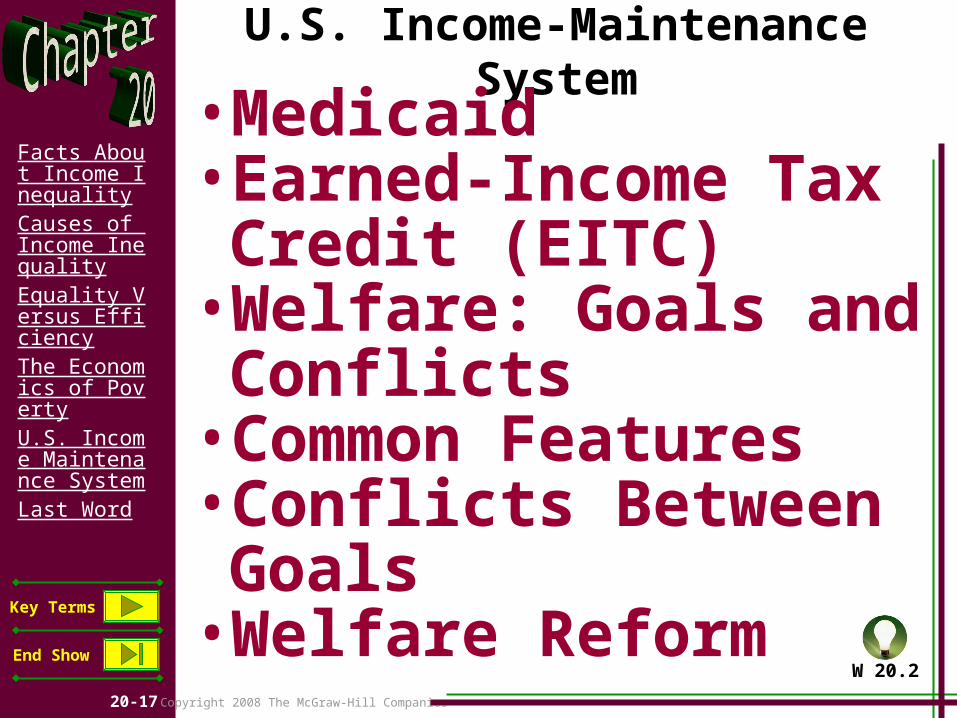
U.S. Income-Maintenance System
• Medicaid• Earned-Income Tax
Credit (EITC)• Welfare: Goals and
Conflicts• Common Features• Conflicts Between
Goals• Welfare Reform
W 20.2

Copyright 2008 The McGraw-Hill Companies20-18
Facts About Income InequalityCauses of Income InequalityEquality Versus EfficiencyThe Economics of PovertyU.S. Income Maintenance SystemLast Word
Key Terms
End Show
U.S. Family Wealth and Its Distribution
• Family Wealth Rose Rapidly and Became More Unequal Between 1995 and 2004
Last
Word
Median and Average Family Wealth, 1995-2004 In 2004 Dollars
Year Median Average
1995199820012004
$70,80083,10091,70093,100
$260,800327,500421,500448,200

Copyright 2008 The McGraw-Hill Companies20-19
Facts About Income InequalityCauses of Income InequalityEquality Versus EfficiencyThe Economics of PovertyU.S. Income Maintenance SystemLast Word
Key Terms
End Show
U.S. Family Wealth and Its Distribution
• Family Wealth Rose Rapidly and Became More Unequal Between 1995 and 2004
Last
Word
Percentage of Total Family Wealth Held by Different
Percentile Groups, 1995-2004
1995199820012004
32.2%31.430.230.5
34.6%33.932.733.4
Year Bottom 90% Top 1%Bottom 10%
Percentile of Wealth Distribution
67.8%68.669.830.5
Copyright 2008 The McGraw-Hill Companies20-20
Facts About Income InequalityCauses of Income InequalityEquality Versus EfficiencyThe Economics of PovertyU.S. Income Maintenance SystemLast Word
Key Terms
End Show
Key Terms• income inequality• Lorenz curve• Gini ratio• income mobility• noncash transfers• equality-efficiency t
radeoff• poverty rate• entitlement progra
ms• social insurance pr
ograms• Social Security• Medicare
• unemployment compensation
• public assistance programs
• Supplemental Security Income (SSI)
• Temporary Assistance for Needy Families (TANF)
• food-stamp program
• Medicaid• earned-income tax
credit (EITC)

Copyright 2008 The McGraw-Hill Companies20-21
Facts About Income InequalityCauses of Income InequalityEquality Versus EfficiencyThe Economics of PovertyU.S. Income Maintenance SystemLast Word
Key Terms
End Show
Next Chapter Preview…
TheEconomicsof HealthCare