copyright 1989 by the american psychological...
TRANSCRIPT
Journal of Experimental Psychology: Human Perception and Performance 1989, Vol. 15, No, 3, 507-528
Copyright 1989 by the American Psychological Association, Inc. 0096-1523/89/$00.75
Hefting for a Maximum Distance Throw: A Smart Perceptual Mechanism
Geoffrey P. Bingham Haskins Laboratories, New Haven, Connecticut
and The Center for the Ecological Study of Perception and Action University of Connecticut
R. C. Schmidt and Lawrence D. Rosenblum The Center for the Ecological Study of Perception and Action
University of Connecticut and Haskins Laboratories, New Haven, Connecticut
Objects for throwing to a maximum distance were selected by hefting objects varying in size and weight. Preferred weights increased with size reproducing size-weight illusion scaling between weight and volume. In maximum distance throws, preferred objects were thrown the farthest. Throwing was related to hefting as a smart perceptual mechanism. Two strategies for conveying high kinetic energy to projectiles were investigated by studying the kinematics of hefting light, preferred, and heavy objects. Changes in tendon lengths occurring when objects of varying size were grasped corresponded to changes in stiffness at the wrist. Hefting with preferred objects produced an invariant phase between the wrist and elbow. This result corresponded to an optimal relation at peak kinetic energy for the hefting. A paradigm for the study of perceptual properties was compared to size-weight illusion methodology.
A task familiar to many from childhood is that of standing on a beach, in a field, or on a cliff and selecting, by hefting, the stone that can be thrown the farthest distance. Like the perfect skipping stone, the optimal throwing stone evokes an ardent glow of confidence in one's ability to discover and use this appealingly simple, yet distinct tool. What is the optimal throwing stone? Assuming a spherical shape and a fairly homogeneous mass distribution, the relevant object properties are size and weight. What is the appropriate configuration of size and weight and how is it determined? Are people truly able to select from objects varying in size and weight those optimal for throwing to a maximum distance? If so, how?
The human perception-action system has been described as a system that temporarily assembles smart, special purpose, deterministic machines over relevant physical properties of the organism and the environment to perform specific tasks (Bingham, 1988b; Fowler & Turvey, 1978; Kugler & Turvey, 1987; Saltzman & Kelso, 1987; Solomon & Turvey, 1988).
Geoffrey P. Bingham was supported while performing this work by a National Institute of Health Individual Fellowship Award (AM- 07412). He also wishes to acknowledge the help and advice of Roy Davis of the Department of Engineering and Computer Science at Trinity College; Bruce Kay of the Department of Mechanical Engi- neering at the Massachusetts Institute of Technology; Kevin Munhall of the Department of Psychology at the University of Western On- tario; and Elliot Saltzman, Bruno Repp, and Len Katz of Haskins Laboratories. Also, we appreciated the constructive criticism of Jim Cutting, Sverker Runeson, and an anonymous reviewer. Thanks to Ed Wiley and Dick Sharkany at Haskins for providing technical assistance.
Correspondence concerning this article should be addressed to Geoffrey P. Bingham, who is now at the Department of Psychology, Indiana University, Bloomington, Indiana 47405.
507
According to this approach, a stone for throwing would be a component of a softly assembled throwing machine. For optimal performance, the projectile's properties must be scaled to the remaining components of this task-specific de- vice according to its dynamical organization. How might the optimal configuration of projectile mass and size, as deter- mined by the dynamics of throwing, be perceived through hefting? Runeson (1977a) suggested that perceptual mecha- nisms are "smart," meaning that they take advantage of peculiar, task-specific circumstances in the interests of effi- ciency and reliability in task performance. Taking advantage of task-specific circumstances often may be the only means of achieving successful performance.fBingham, 1988b). Heft- ing shares both anatomy and certain kinematic, and by im- plication dynamic, properties with throwing. These common aspects could provide the circumstantial basis for smart per- ceptual organization. If hefting and throwing exhibit similar dynamical organization, then hefting could contain informa- tion about the dynamics of throwing. In particular, hefting with an object might provide information about that object as a potential component of a throwing machine. The required information would be, in part, about the mass of the potential projectile. Mass is a dynamic property (Bingham, 1988a).
Perceptual information about dynamics must be mapped through the kinematics of actions and events to spatial- temporal patterns that can be detected by perceptual systems (Bingham, 1987a, 1987b, 1988a, 1988b; Runeson, 1977b; Runeson & Frykholm, 1983). Information about the mass- related properties of events resides in resulting patterns of motion. For instance, Runeson and Frykholm (1983) dem- onstrated that the amount of weight being lifted by a person can be judged accurately given only visual apprehension of the pattern of lifting motions. Bingham (1987a) showed that
508 G. P. BINGHAM, R. C. SCHMIDT, AND L. D. ROSENBLUM
visual judgments of weight lifted in a one-arm curl reflected changes in the kinematic form of lifts represented in phase plane plots of the one degree of freedom motion. Bingham (1987b) showed that the form of trajectories on the phase plane allowed a variety of both animate and inanimate events to be identified, where each event corresponded to a particular dynamical organization producing a specific kinematic form.
Perception via the haptic system involves the kinematic specification of dynamics no less than does the visual system (Bingham, 1988b). Hefting does not provide privileged access to dynamic properties. The dynamic states of the muscles are monitored through the kinematic states of so-called mechano- receptors, which are stretched or compressed by the forces impinging on them. For instance, Pacinian corpuscles em- bedded in muscle respond to a change in their diameter, while Ruffini-type end organs in muscle or Golgi tendon organs respond to changes in length (Bloch & Iberall, 1982; Lee, 1984). Among the perceptual systems, the haptic system in hefting is notable for being accessible to kinematic measure- ment. Thus, one can examine kinematic properties of hefting in search of properties informative of the configuration of size and weight corresponding to optimal throwability.
The hefting of objects varying in size and weight has been studied frequently in psychological laboratories. An old chest- nut in the literature of perceptual psychology is the size- weight "illusion." The effect occurs when people hefting ob- jects varying in volume are asked to judge weight. For two objects of equal physical weight, the object with a larger volume will be judged as lighter, often substantially so. The effect can be described alternatively as follows: For two objects of different volume to be judged of equal apparent weight, the larger object must actually weigh more than the object with smaller volume. This effect has been called an illusion because the relative weight of objects is misperceived. Alter- natively, psychophysicists have suggested that the human perceptual system simply detects "heaviness" as a perceptual property corresponding to a specific nonlinear relation be- tween the weight and the volume of objects being hefted (Cross & Rotkin, 1975; Stevens & Rubin, 1970). Neither characterization, however, provides an account for the size- weight relation. How is it that the human perceptual system detects this specific relation between size and weight of hefted objects?
Based on the observation that selecting the optimal stone to throw to a maximum distance shares relevant object prop- erties with tasks producing the size-weight effect, we decided to investigate hefting for throwing using an experimental design similar to that employed in the original size-weight illusion studies. Participants were asked to heft objects varying in both size and weight and to judge, for objects of a given size, preferred weights for throwing to a maximum distance. In a second experiment, the objects were thrown to maximum distances by participants in the hefting study to determine whether preferred objects were optimal for throwing. Finally, in two more experiments, the kinematics and dynamics of hefting with the objects were recorded and analyzed. The hypothesis was that the size-weight relation corresponds to a perceivable property produced by the functionally constrained dynamics of hefting and throwing.
Experiment 1: Hefting for Max imum Distance Throws
The first step was to perform a pilot study to check our intuition that people can select the optimal stone for throwing to a maximum distance. A set of stones varying in size and weight was collected. Maximal diameters varied between .015 m and .10 m, while weights were between .008 kg and .500 kg. Two of the authors tested their ability to select an optimal stone by throwing the stones three times each to a maximum distance and examining distances relative to those of stones selected beforehand as preferred. Throwing was performed on a football field that was marked conveniently for distance. The landing position of each stone was marked with a ticket of paper labeled with the stone's weight. In each case, the landing positions formed a distribution on the field with the preferred stone most often lying at the farthest distance. Distances generally decreased as weights either increased or decreased from the preferred weight. The results of this pilot test convinced us that the task was appropriate for study.
The results of the pilot test indicated, that, for each thrower, there is an object of optimum weight for throwing to a maximum distance. Plotting distance as a function of weight, the curve would exhibit an extremum corresponding to the maximum distance at the optimal weight. Progressively lighter or heavier objects would be represented at points along the curve falling progressively away from the extremum on either side. This distance function would reflect performance in the task of throwing objects to a maximum distance.
The perceptual question is whether throwers can perceive which weights are optimal in advance of throwing them. The pilot results suggest that the optimal weights are apprehended successfully. If indeed participants can perceive the optimum weights, then within the context of the perceptual task, the distance function must be replaced by a perceptual function with an extremum that corresponds to the extremum in the distance function. The current experiments were performed to determine whether such a perceptual function exists. If it does, then the existence of a mapping that preserves ordinal scaling between the performance function and the perceptual function is implied. 2
A single distance function with an extremum corresponding to the optimal weight was anticipated as weight was varied for objects of a given size. However, the size of objects was to be varied as well. The question was whether the optimum
Comparison of these results with size-weight illusion results was based on the fact that both judgment tasks establish a functional equivalence between objects of different size. In hefting for throwing. the equivalence is in optimality for throwing to a maximum distance. In hefting for heaviness, the equivalence is in apparent heaviness.
2 However, the direction of ordering may be inverted. The extre- mum in the perceptual function need not be a maximum as is the extremum in the distance function. It might be a minimum. Further- more, whether the mapping between performance and perceptual functions preserves stronger scaling properties remains for future investigations. For instance, does the mapping between the perceptual curve and the distance curve preserve the rate of curvature, meaning that participants could judge the relative deterioration in performance with variations in weight away from the optimum weight?
HEFTING AND THROWING 509
weight value would change with changes in object size. Would the locat ion o f the ex t r emum over the weight axis change? In Exper iment 1, part icipants were asked to heft objects varying in size and weight and to judge, for each size, the objects o f opt imal weight for throwing to a m a x i m u m distance.
Participants were asked to select their top three preferences in each size. Three preferences were used as a more sensitive measure o f preference. A measu remen t p rob lem arose because we were sampling the perceptual funct ion discont inuously with no prior knowledge o f the relative steepness or shallow- ness o f the funct ion on ei ther side o f the ex t remum. The quest ion was whether the e x t r e m u m would m o v e up (or down) the weight axis as the size o f the objects was varied. I f the e x t r e m u m was less pronounced , then discrete sampling o f a shallow curve might not pick up shifts in the locat ion o f the ex t r emum induced by size changes. Using a weighted mean o f the top three preferences provided a broader sample more likely to reflect any shifts that might occur. Across partici- pants, no regular pat tern in the weights corresponding to Preferences 1, 2, and 3 was expected beyond potential shifts in their m e a n values.
Method
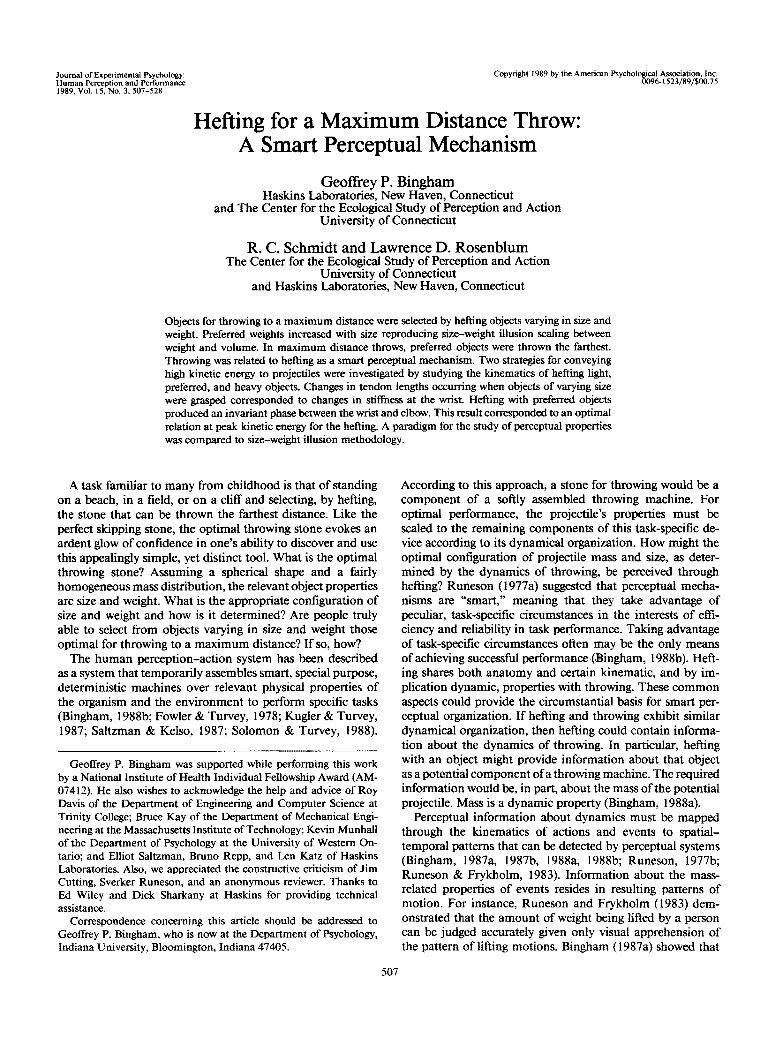
Apparatus. The experiments required spherical objects that var- ied in size and weight and that were durable enough to withstand impacts from maximum distance throws. Spheres were approximated by cutting cuboctahedrons from blocks of high-density styrofoam. A ¢uboctahedron is a semiregular polyhedron that can be formed by truncating the vertices of a cube. The result is a polyhedron with a total of 14 faces, 6 square and 8 triangular as shown in Figure 1 (left side). This shape was chosen as providing a reasonably good approx- imation to a sphere while affording precision and reliability in sizing and shaping. Eight objects were cut in each of four sizes with radii of .025 m, .0375 m, .05 m, and .0625 m. These sizes correspond roughly to kiwi fruit, apple, grapefruit, and cantaloupe size.
Object weights were adjusted as follows. Each object was sliced in half. The center was scooped out symmetrically from each half and tightly packed with a stochastically homogeneous mixture of clay and lead shot. The two halves were placed back together. Then, each object was wrapped tightly with elastic tape that slightly rounded the corners and edges. The weight series within each size approximated a geometric progression with W~ + 1 = Wn x 1.55. The weights within each size are presented in Table 1. Weights across sizes were made to correspond to the extent allowed within limits set by the maximum possible weight for a given size.
Figure t. Left: A cuboctahedron. Right: The manner of hefting, including the approximate range of motion in the elbow and wrist.
Table 1 Object Weights Within Size
Radius (m) O~ect weights (kg)
.025 .004 .018 .028 .036 .059 .086 .122 .192
.0375 .012 .031 .051 .087 .133 .194 .300 .450
.05 .031 .051 .090 .122 .178 .294 .448 .717
.0625 .038 .052 .080 .119 .180 .300 .459 .700
Participants. Eleven University of Connecticut undergraduates from a course in introductory psychology participated in the experi- ment for course credit. Eight of the participants were men and three were women. Two of the men were left-handed.
Experimental procedure. Participants were run individually in an experimental session lasting about 45 min. At the beginning of each session, a set of anthropomorphic measures was taken, including age, height, weight, hand span from outstretched thumb tip to fourth finger tip, hand length to the tip of the middle finger, palm width, index finger length, forearm length, and arm length (Chaffin & Andersson, 1984).
Hefting and judgment were performed with the participant and experimenter standing on opposite sides of a l-m high table. An experimental assistant sat nearby and recorded judgments, observa- tions, and participant comments on an experiment protocol sheet. The experimenter described to the participant the common childhood experience of standing on a beach and selecting a stone of optimal size and weight for throwing to a maximum distance. All participants indicated that they were familiar with this experience. Next, the experimenter placed five different-sized styrofoam cuboctahedrons on the table in order of increasing size. The sizes were the same as described above, together with an object of radius equal to .0125 m or, roughly, acorn size. This small object was added to avoid a potential floor effect in judgments. The participant was asked to judge visually the optimal size object for throwing to a maximum distance. The preferred object was indicated by pointing. Following this, the experimenter described the hefting and judgment task.
From eight different objects of a given size, participants were asked to select in order of preference three preferred objects for throwing to a maximum distance. As already described, three preferences, as opposed to one, were used to provide greater sensitivity to possible variations in preferred weights over the different object sizes. The weighted mean of the three preferences was used as a measure of preferred weight in addition to the first preference weights.
The same hefting and judgment procedure was repeated for each of the four different object sizes. The order of presentation of the different sizes was randomized among participants. The participant was asked to turn his or her back to the table while the experimenter removed the eight objects of a given size from a container and arranged them on the table in order of increasing weight from left to right. The participant then turned to face the table and was asked to extend his or her preferred hand for hefting with the palm up and the forearm level. Beginning with the lightest object and proceeding in order of increasing weight, the experimenter placed each object in the participant's extended hand to be hefted.
Preceding the hefting and judgment trials, the experimenter dem- onstrated the manner in which hefting was to be performed. The object and hand were to be bounced at the wrist by a fairly gentle oscillation of the forearm about the elbow, as shown in Figure 1 (right side). At least three bounces were to be performed on each hefting trial. A hefting trial was completed by the experimenter's removing the object from the participant's hand and replacing it in its position on the table. Once all eight objects of a size had been hefted, the participant was allowed by pointing to select any of the objects for repeated hefting. The number of repeated hefts was unrestricted.
510 G. P. BINGHAM, R. C. SCHMIDT, AND L. D. ROSENBLUM
Participants typically performed repeated hefts with those objects eventually chosen as preferred as well as with the next lighter and the next heavier objects. When they had finished hefting, participants indicated their preferred three objects by pointing to them in the order of preference.
Once hefting and judgment were completed for all four sizes, the participant's first preference objects for each size were placed on the table in order of increasing size. The participant hefted these using the same procedure as described above and was asked to select three preferred objects for a maximum distance throw in order of prefer- ence. The participant was asked then to demonstrate the method he or she would use to perform the throw. Following this, participants were asked for general comments concerning their experience of the task.
Design. A two-way, 4 x 3 repeated measures design was used with 11 observations in each cell. The first factor was size (.025 m, .0375 m, .05 m, and .0625 m). The second factor was preference (1st choice, 2rid choice, and 3rd choice). Both factors were within subjects.
Results and Discussion
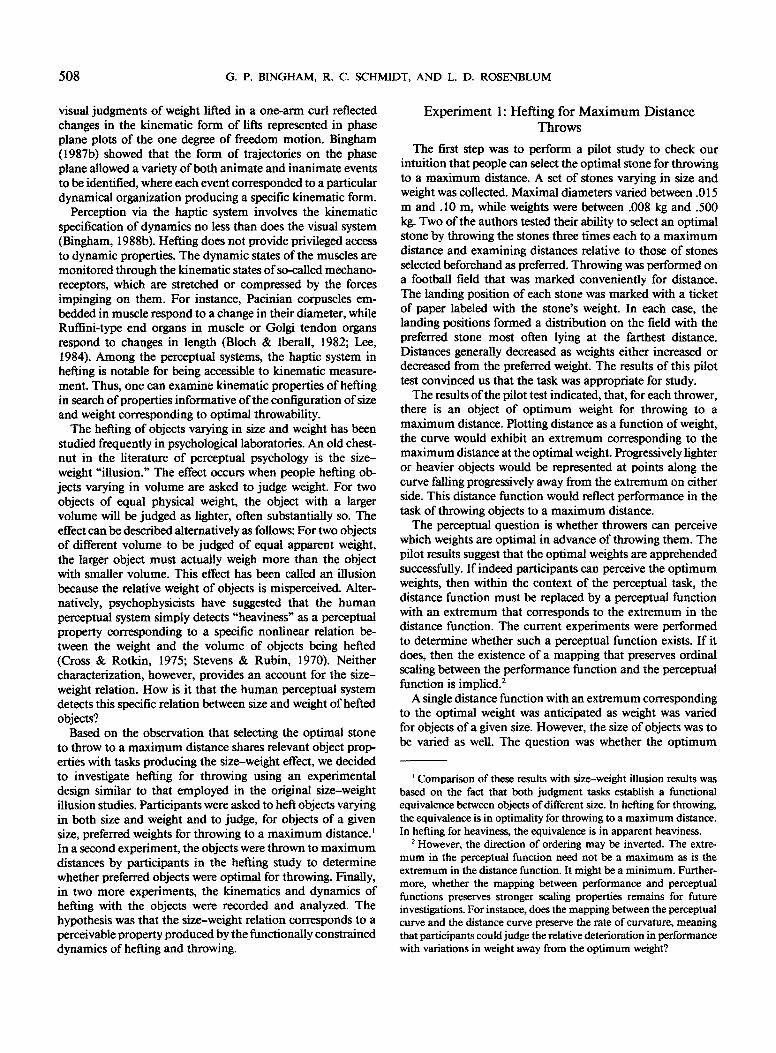
All of the participants found the task to be appealing and quite natural. In comments made while performing the judg- ment task, participants tended to express strong preferences for the objects that they judged to be optimal. The mean results across participants reproduced the pattern of the size- weight effect, namely, the qualitative result that weights judged of equal apparent heaviness increased over increasing volume. Both first preference weights and mean preferred weights for throwing increased over increasing volume. A mean preferred weight for each size was computed by weight- ing judgments according to preference. First preference weight was multiplied by 3, second preference by 2, and third pref- erence by I. The mean preferred weight for each size is shown in Figure 2, in which the increase in weight over increasing size is evident.
030
0.25
0,20
0.15
0.10
0.05
0.00
M e a n Preferred Weights
l l I I l
0.0250 0.0375 0.0500 0.0625
Radius (m)
Figure 2. Mean preferred weights selected by I 1 participants for four different sizes of objects. (Weight in kilograms. Size by radius in meters.)
An analysis of variance (ANOVA) was perfornled on first preference weights with size (.025 m, .0375 m, .05 m, and .0625 m) as a factor. Size was significant, F(3, 30) = 21.37, p < .001. Weight increased with size. An ANOVA also was performed on weights for all three preferences with size and preference (lst, 2nd, and 3rd choice) as factors. Size was significant, F(3, 30) = 33.59, p < .001. Preference was not significant. Weight again increased with size. The lack of any consistent trend in preferences across participants indicated that no significant information was lost by using in scaling a mean across three preferred weights as a measure more sen- sitive to variations in preferred weight.
The difference in mean preferred weight between succeed- ing size levels was much smaller for the two largest sizes than for the smaller sizes. Proceeding from the smallest to largest object size, the differences between mean preferred weights were .054 kg, .085 kg, and .019 kg. The former differences were both significant, p < .05, in a Fisher post hoc test. However, the latter difference was not significant. This result suggests that increases in preferred weights were bounded. Because the increases in weight were a function of increases in size, a bound on increases in weight must correspond to a particular size of hefted object. This surmise is supported by the results obtained when participants were asked how they would perform the throw with an optimal object.
When asked how they would perform the throw, all partic- ipants indicated that they would use a typical baseball-style overhand throw. However, seven of the participants sponta- neously remarked that such a throwing style would be appro- pilate for all of the sizes except for the .0625-m size. For the largest objects, these participants judged that either a lob or shotput throwing style would be more suitable. This result indicates that the size and weight of the largest objects fall in the neighborhood of a critical point where a transition be- tween action modes is mandated (see Bingham, 1988b, for additional discussion of this point). This boundary region would be an interesting and potentially fruitful subject for future research.
When asked to select the optimal size object for throwing from visual inspection alone, six of the participants chose the .0375-m object, while five chose the .025-m object. At the end of the experiment, participants were asked to choose the optimal size object once again, but this t ime their first pref- erence for weight was provided in each size, and participants were allowed to heft the objects in making their choice. In this case, six of the participants chose the .025-m object, while five chose the .0375-m object. Overall, the two smaller sizes were judged consistently as optimal for long distance throw- ing. There is a distinct lower bound on preferred size. No participant choose the .0125-m object included in the visually examined set. Thus, the preferred sizes correspond to a judged optimum.
We hypothesized that throwing was an appropriate func- tional context in which to reproduce the pattern of judgments characteristic of the size-weight illusion. The qualitative pat- tern of results corresponding to the size-weight illusion was reproduced, confirming our hypothesis. A quantitative com- parison between the hefting for throwing results and typical hefting for heaviness results was difficult because heaviness judgment results had not been reported in terms of a scaling
HEFTING AND THROWING 511
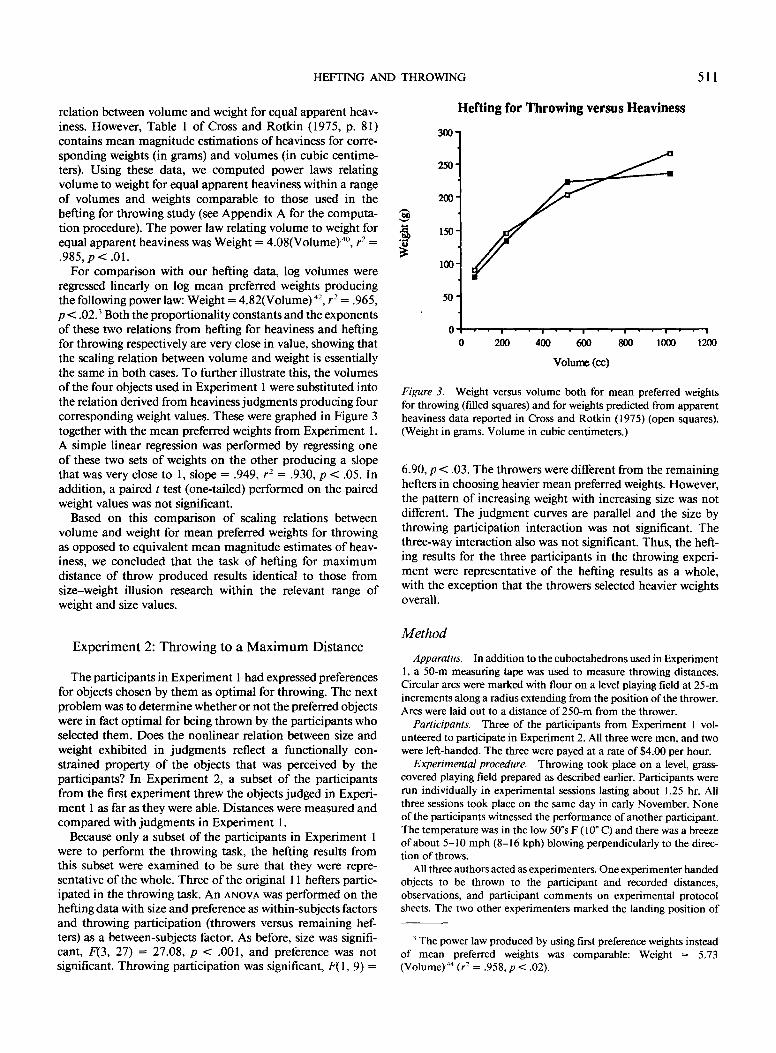
relation between volume and weight for equal apparent heav- iness. However, Table 1 of Cross and Rotkin (1975, p. 81) contains mean magnitude estimations of heaviness for corre- sponding weights (in grams) and volumes (in cubic centime- ters). Using these data, we computed power laws relating volume to weight for equal apparent heaviness within a range of volumes and weights comparable to those used in the hefting for throwing study (see Appendix A for the computa- tion procedure). The power law relating volume to weight for equal apparent heaviness was Weight = 4.08(Volume) 4°, r 2 = .985, p < .01.
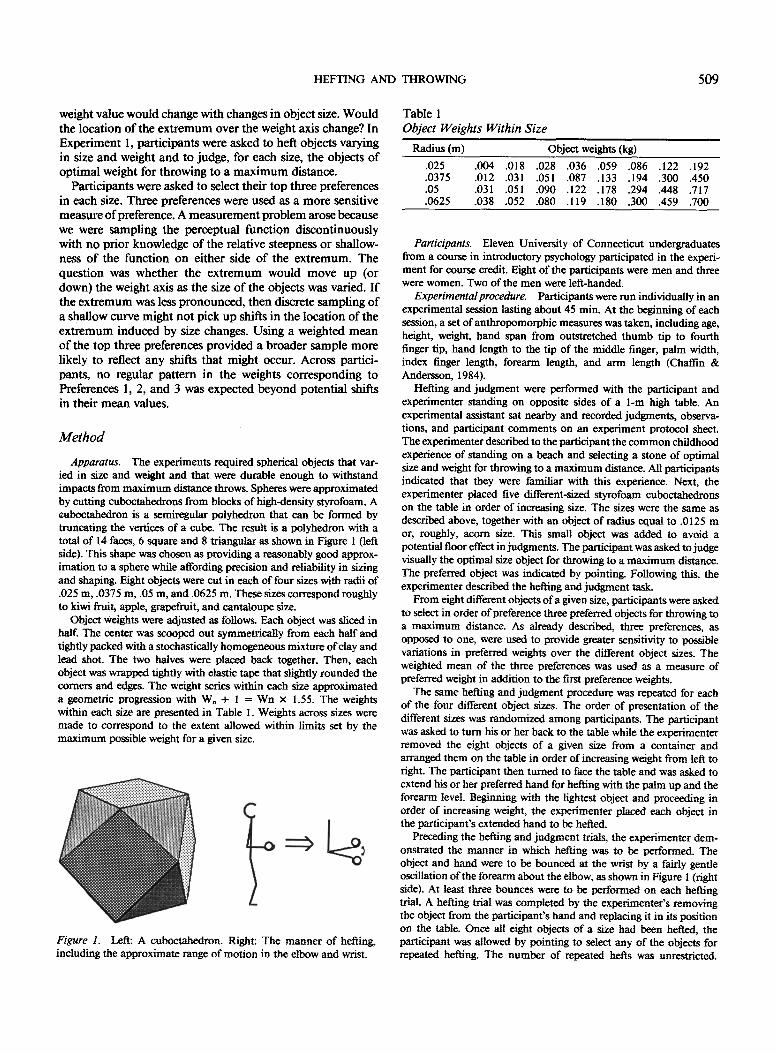
For comparison with our hefting data, log volumes were regressed linearly on log mean preferred weights producing the following power law: Weight = 4.82(Volume) 42, r-" = .965, p < .02 . 3 Both the proportionality constants and the exponents of these two relations from hefting for heaviness and hefting for throwing respectively are very close in value, showing that the scaling relation between volume and weight is essentially the same in both cases. To further illustrate this, the volumes of the four objects used in Experiment 1 were substituted into the relation derived from heaviness judgments producing four corresponding weight values. These were graphed in Figure 3 together with the mean preferred weights from Experiment 1. A simple linear regression was performed by regressing one of these two sets of weights on the other producing a slope that was very close to 1, slope = .949, r 2 = .930, p < .05. In addition, a paired t test (one-tailed) performed on the paired weight values was not significant.
Based on this comparison of scaling relations between volume and weight for mean preferred weights for throwing as opposed to equivalent mean magnitude estimates of heav- iness, we concluded that the task of hefting for maximum distance of throw produced results identical to those from size-weight illusion research within the relevant range of weight and size values.
20o] 150-
100-
50-
He f t ing for T h r o w i n g versus H e a v i n e s s
0 I I • . i I • i • I
0 200 400 600 800 1000 1200
Volume (ee)
Figure 3. Weight versus volume both for mean preferred weights for throwing (filled squares) and for weights predicted from apparent heaviness data reported in Cross and Rotkin (1975) (open squares). (Weight in grams. Volume in cubic centimeters.)
6.90, p < .03. The throwers were different from the remaining hefters in choosing heavier mean preferred weights. However, the pattern of increasing weight with increasing size was not different. The judgment curves are parallel and the size by throwing participation interaction was not significant. The three-way interaction also was not significant. Thus, the heft- ing results for the three participants in the throwing experi- ment were representative of the hefting results as a whole, with the exception that the throwers selected heavier weights overall.
E x p e r i m e n t 2: T h r o w i n g to a M a x i m u m Dis t ance
The participants in Experiment 1 had expressed preferences for objects chosen by them as optimal for throwing. The next problem was to determine whether or not the preferred objects were in fact optimal for being thrown by the participants who selected them. Does the nonlinear relation between size and weight exhibited in judgments reflect a functionally con- strained property of the objects that was perceived by the participants? In Experiment 2, a subset of the participants from the first experiment threw the objects judged in Experi- ment l as far as they were able. Distances were measured and compared with judgments in Experiment 1.
Because only a subset of the participants in Experiment 1 were to perform the throwing task, the hefting results from this subset were examined to be sure that they were repre- sentative of the whole. Three of the original 1 1 hefters partic- ipated in the throwing task. An ANOVA Was performed on the hefting data with size and preference as within-subjects factors and throwing participation (throwers versus remaining hef- ters) as a between-subjects factor. As before, size was signifi- cant, F(3, 27) = 27.08, p < .001, and preference was not significant. Throwing participation was significant, F ( l , 9) --
Method
Apparatus. In addition to the cuboctahedrons used in Experiment 1, a 50-m measuring tape was used to measure throwing distances. Circular arcs were marked with flour on a level playing field at 25-m increments along a radius extending from the position of the thrower. Arcs were laid out to a distance of 250-m from the thrower.
Participants. Three of the participants from Experiment 1 vol- unteered to participate in Experiment 2. All three were men, and two were left-handed. The three were payed at a rate of $4.00 per hour.
Experimental procedure. Throwing took place on a level, grass- covered playing field prepared as described earlier. Participants were run individually in experimental sessions lasting about 1.25 hr. All three sessions took place on the same day in early November. None of the participants witnessed the performance of another participant. The temperature was in the low 50% F (10" C) and there was a breeze of about 5-10 mph (8-16 kph) blowing perpendicularly to the direc- tion of throws.
All three authors acted as experimenters. One experimenter handed objects to be thrown to the participant and recorded distances, observations, and participant comments on experimental protocol sheets. The two other experimenters marked the landing position of
3 The power law produced by using first preference weights instead of mean preferred weights was comparable: Weight = 5.73 (Volume) 44 (r 2 = .958, p < .02).
512 G. P. BINGHAM, R. C. SCHMIDT, AND L. D. ROSENBLUM
the thrown objects, measured distances, and recovered the thrown objects.
Upon arrival, the participant was allowed to warm up his throwing arm bY tossing a midweight .0375-m object to one of the experimen- ters for a few minutes. Following this, the procedure was described to the thrower. The thrower was allowed to use his preferred throwing style with each object with the restriction that only a single step should be taken. All three throwers used an overarm baseball-style throw for all objects and tended to perform somewhat more of a lob with the largest diameter objects. The lobs were overarm throws using less flexion at the elbow and less extension at the wrist, that is, tending to a straight arm throw about the shoulder.
Five objects in each of the four sizes were thrown. Within a given size, each thrower threw his preferred three objects together with the next heavier and the next lighter objects bounding the preferred three in weight. In one instance, a thrower had selected the heaviest weight in a size as one of his preferred three and thus, the next two lighter weights below the three were included for throwing. Each object was thrown three times. Throws were blocked by weight within object size, resulting in three blocks of five different weights within four different diameters. Size order was randomized across throwers; weight order was randomized across blocks. Each thrower performed a total of 60 throws (i.e., 3 trials x 5 weights × 4 diameters).
After each throw, the distance was measured by the experimenters on the field and called aloud to the experimenter who recorded it. Throwing distance was measured from the position of the thrower's foremost foot to the position at which the thrown object first con- tacted the ground. Air flight distance was used to eliminate potential variance introduced by slight irregularities in the ground surface causing the object to bounce and roll in different directions once it had contacted the ground. The five objects in a block of trials were retrieved at the end of each block.
The throwing task was performed more than a week after the hefting task. Throwers were not informed about the relation between their three preferred objects and the five objects of each size to be thrown by them. The objects of each size were labeled 1 (lightest) to 8 (heaviest), with .01-m square labels to enable the experimenters to keep track of them during the throwing experiment. Each thrower was asked after the throwing was completed whether he could in any way remember or recognize his preferred objects from the hefting task. All throwers reported that they could not, although they could detect relative optimality during the throwing by virtue of the feel of the objects, as they had during the original hefting task.
Results and Discussion
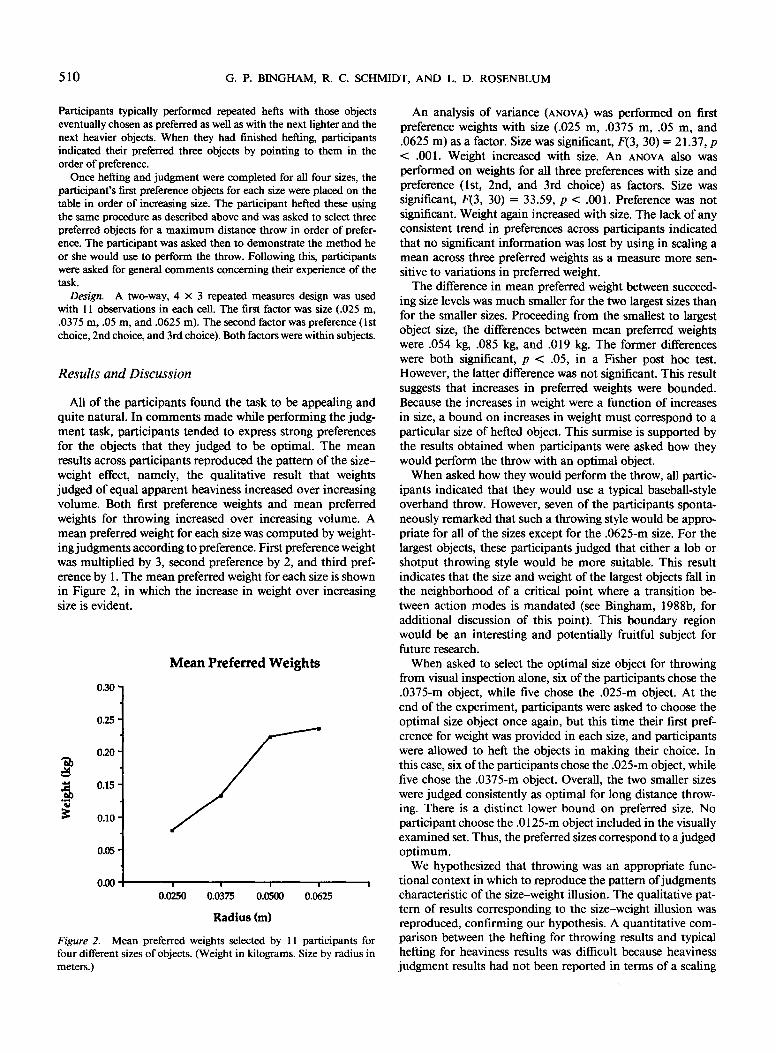
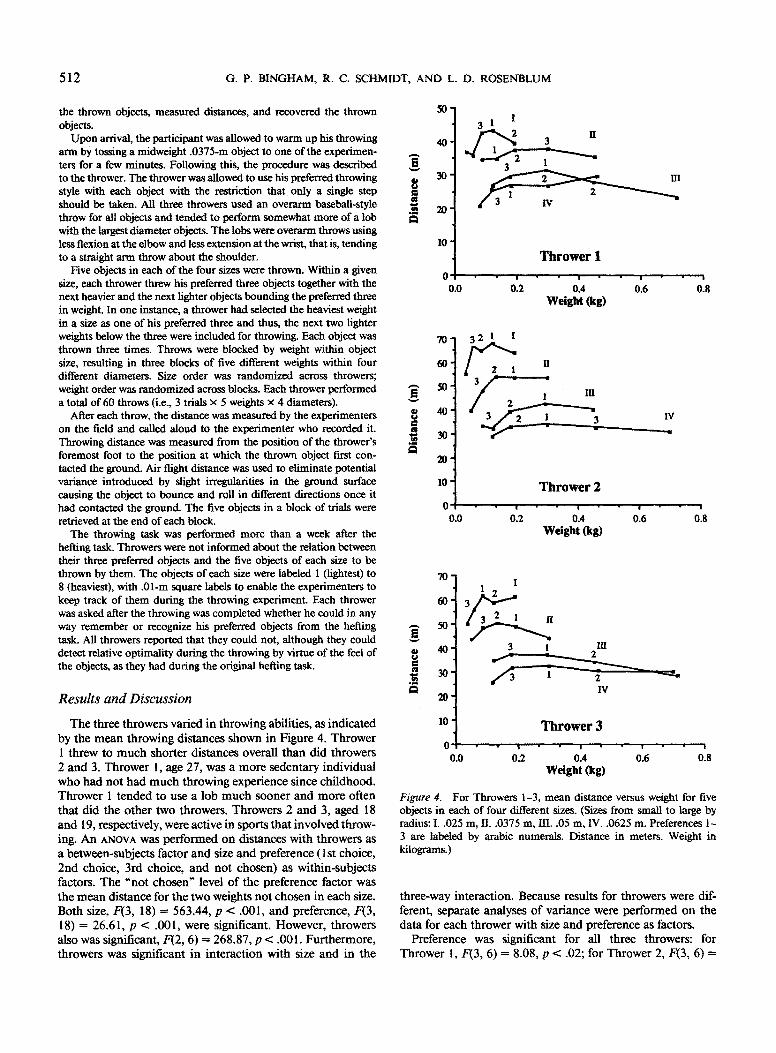
The three throwers varied in throwing abilities, as indicated by the mean throwing distances shown in Figure 4. Thrower 1 threw to m u c h shorter distances overall than did throwers 2 and 3. Thrower 1, age 27, was a more sedentary individual who had not had m u c h throwing experience since childhood. Thrower 1 tended to use a lob m u c h sooner and more often that did the o ther two throwers. Throwers 2 and 3, aged 18 and 19, respectively, were active in sports that involved throw- ing. An ANOVA was per formed on distances with throwers as a between-subjects factor and size and preference ( l s t choice, 2nd choice, 3rd choice, and not chosen) as within-subjects factors. The "no t chosen" level o f the preference factor was the mean distance for the two weights not chosen in each size. Both size, F(3, 18) = 563.44, p < .001, and preference, F(3, 18) = 26.61, p < .001, were significant. However , throwers also was significant, F(2, 6) ---- 268,87, p < .001. Fur thermore , throwers was significant in interact ion with size and in the
$ 0 ¢J
w ° ~
40
311
20
10
0 0.0
70
60
50"
40.
10
0 '
0.0
3 n
5a 2
Thrower 1 | - i
0.2 0.4 Weight (kg)
!
II l
1 llI
Thrower 2
0.2 0.4 Weight (kg)
0.6
!
0.6
IV
° |
0.8
i
0.8
' 7 0 -
60-
50-
40"
30-
20-
10"
0 0.0
I 1 2
3 ! llI
2 IV
Thrower 3 i | i i
0.2 0.4 0.6 0.8 Weight (kg)
Figure 4. For Throwers 1-3, mean distance versus weight for five objects in each of four different sizes. (Sizes from small to large by radius: I..025 m, II..0375 m, III..05 m, IV..0625 m. Preferences 1- 3 are labeled by arabic numerals. Distance in meters. Weight in kilograms.)
three-way interaction. Because results for throwers were dif- ferent, separate analyses o f variance were per formed on the data for each thrower with size and preference as factors.
Preference was significant for all three throwers: for Thrower 1, F(3, 6) = 8.08, p < .02; for Thrower 2, F(3, 6) -
HEFTING AND THROWING 513
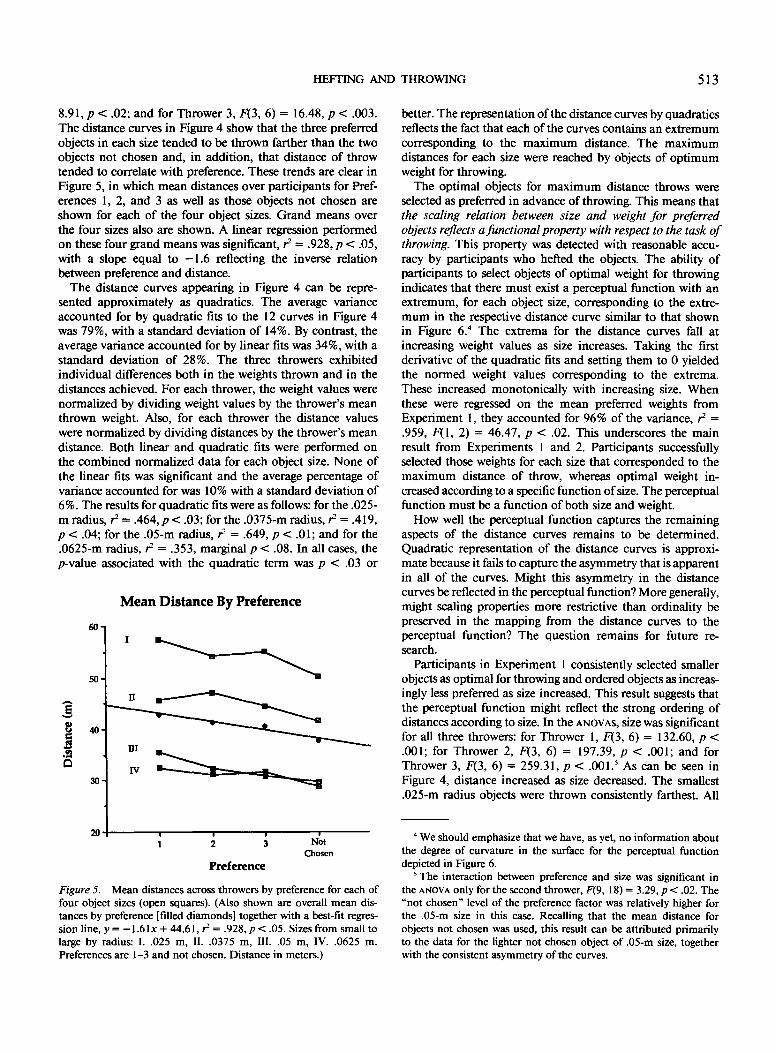
8.91, p < .02; and for Thrower 3, F(3, 6) = 16.48, p < .003. The distance curves in Figure 4 show that the three preferred objects in each size tended to be thrown farther than the two objects not chosen and, in addition, that distance of throw tended to correlate with preference. These trends are clear in Figure 5, in which mean distances over participants for Pref- erences 1, 2, and 3 as well as those objects not chosen are shown for each of the four object sizes. Grand means over the four sizes also are shown. A linear regression performed on these four grand means was significant, r 2 = .928, p < .05, with a slope equal to - 1 . 6 reflecting the inverse relation between preference and distance.
The distance curves appearing in Figure 4 can be repre- sented approximately as quadratics. The average variance accounted for by quadratic fits to the 12 curves in Figure 4 was 79%, with a standard deviation of 14%. By contrast, the average variance accounted for by linear fits was 34%, with a standard deviation of 28%. The three throwers exhibited individual differences both in the weights thrown and in the distances achieved. For each thrower, the weight values were normalized by dividing weight values by the thrower's mean thrown weight. Also, for each thrower the distance values were normalized by dividing distances by the thrower's mean distance. Both linear and quadratic fits were performed on the combined normalized data for each object size. None of the linear fits was significant and the average percentage of variance accounted for was 10% with a standard deviation of 6%. The results for quadratic fits were as follows: for the .025- m radius, r 2 = .464, p < .03; for the .0375-m radius, r 2 = .419, p < .04; for the .05-m radius, r ~ = .649, p < .01; and for the .0625-m radius, r 2 = .353, marginal p < .08. In all cases, the p-value associated with the quadratic term was p < .03 or
60"
50,
30
20
Mean Distance By Preference
.9 Ill
I I e g
l 2 3 Not Chosen
P r e f e r e n c e
Figure 5. Mean distances across throwers by preference for each of four object sizes (open squares). (Also shown are overall mean dis- tances by preference [filled diamonds] together with a best-fit regres- sion line, y = -1 .6Ix + 44.61, r a = .928, p < .05. Sizes from small to large by radius: I..025 m, II..0375 m, III..05 m, IV..0625 m. Preferences are 1-3 and not chosen. Distance in meters.)
better. The representation of the distance curves by quadratics reflects the fact that each of the curves contains an extremum corresponding to the maximum distance. The maximum distances for each size were reached by objects of opt imum weight for throwing.
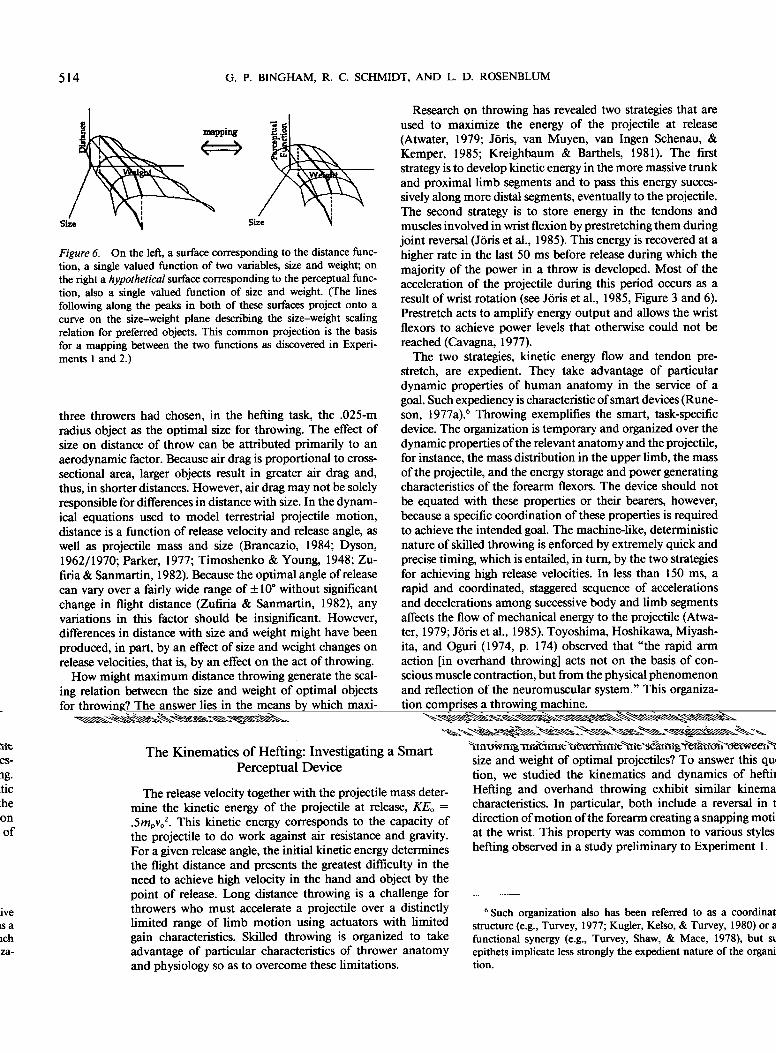
The optimal objects for maximum distance throws were selected as preferred in advance of throwing. This means that the scaling relation between size and weight for preferred objects reflects a functional property with respect to the task of throwing. This property was detected with reasonable accu- racy by participants who hefted the objects. The ability of participants to select objects of optimal weight for throwing indicates that there must exist a perceptual function with an extremum, for each object size, corresponding to the extre- mum in the respective distance curve similar to that shown in Figure 6. 4 The extrema for the distance curves fall at increasing weight values as size increases. Taking the first derivative of the quadratic fits and setting them to 0 yielded the normed weight values corresponding to the extrema. These increased monotonically with increasing size. When these were regressed on the mean preferred weights from Experiment l, they accounted for 96% of the variance, r 2 = .959, F(1, 2) = 46.47, p < .02. This underscores the main result from Experiments l and 2. Participants successfully selected those weights for each size that corresponded to the maximum distance of throw, whereas optimal weight in- creased according to a specific function of size. The perceptual function must be a function of both size and weight.
How well the perceptual function captures the remaining aspects of the distance curves remains to be determined. Quadratic representation of the distance curves is approxi- mate because it fails to capture the asymmetry that is apparent in all of the curves. Might this asymmetry in the distance curves be reflected in the perceptual function? More generally, might scaling properties more restrictive than ordinality be preserved in the mapping from the distance curves to the perceptual function? The question remains for future re- search.
Participants in Experiment 1 consistently selected smaller objects as optimal for throwing and ordered objects as increas- ingly less preferred as size increased. This result suggests that the perceptual function might reflect the strong ordering of distances according to size. In the ANOVAS, size was significant for all three throwers: for Thrower l, F(3, 6) = 132.60, p < .001; for Thrower 2, F(3, 6) = 197.39, p < .001; and for Thrower 3, F(3, 6) = 259.31, p < .001. s As can be seen in Figure 4, distance increased as size decreased. The smallest .025-m radius objects were thrown consistently farthest. All
4 We should emphasize that we have, as yet, no information about the degree of curvature in the surface for the perceptual function depicted in Figure 6.
5 The interaction between preference and size was significant in the ANOVA only for the second thrower, F(9, 18) = 3.29, p < .02. The "not chosen" level of the preference factor was relatively higher for the .05-m size in this case. Recalling that the mean distance for objects not chosen was used, this result can be attributed primarily to the data for the lighter not chosen object of .05-m size, together with the consistent asymmetry of the curves.
514 G. P. BINGHAM, R. C. SCHMIDT, AND L. D. ROSENBLUM
n •
% ,."
Figure 6. On the left, a surface corresponding to the distance func- tion, a single valued function of two variables, size and weight; on the fight a hypothetical surface corresponding to the perceptual func- tion, also a single valued function of size and weight. (The lines following along the peaks in both of these surfaces project onto a curve on the size-weight plane describing the size-weight scaling relation for preferred objects. This common projection is the basis for a mapping between the two functions as discovered in Experi- ments 1 and 2.)
three throwers had chosen, in the hefting task, the .025-m radius object as the optimal size for throwing. The effect of size on distance of throw can be attributed primarily to an aerodynamic factor. Because air drag is proportional to cross- sectional area, larger objects result in greater air drag and, thus, in shorter distances. However, air drag may not be solely responsible for differences in distance with size. In the dynam- ical equations used to model terrestrial projectile motion, distance is a function of release velocity and release angle, as well as projectile mass and size (Brancazio, 1984; Dyson, 1962/1970; Parker, 1977; Timoshenko & Young, 1948; Zu- firia & Sanmartin, 1982). Because the optimal angle of release can vary over a fairly wide range of _+ 10* without significant change in flight distance (Zufiria & Sanmartin, 1982), any variations in this factor should be insignificant. However, differences in distance with size and weight might have been produced, in part, by an effect of size and weight changes on release velocities, that is, by an effect on the act of throwing.
How might maximum distance throwing generate the scal- ing relation between the size and weight of optimal objects for throwing? The answer lies in the means by which maxi- mum velocities of release are generated.
The Kinemat ic s o f Heft ing: Invest igat ing a Smar t Perceptual Device
The release velocity together with the projectile mass deter- mine the kinetic energy of the projectile at release, KEo = .Smovo 2. This kinetic energy corresponds to the capacity of the projectile to do work against air resistance and gravity. For a given release angle, the initial kinetic energy determines the flight distance and presents the greatest difficulty in the need to achieve high velocity in the hand and object by the point of release. Long distance throwing is a challenge for throwers who must accelerate a projectile over a distinctly limited range of limb motion using actuators with limited gain characteristics. Skilled throwing is organized to take advantage of particular characteristics of thrower anatomy and physiology so as to overcome these limitations.
Research on throwing has revealed two strategies that are used to maximize the energy of the projectile at release (Atwater, 1979; Jrris, van Muyen, van Ingen Schenau, & Kemper, 1985; Kreighbaum & Barthels, 1981). The first strategy is to develop kinetic energy in the more massive trunk and proximal limb segments and to pass this energy succes- sively along more distal segments, eventually to the projectile. The second strategy is to store energy in the tendons and muscles involved in wrist flexion by prestretching them during joint reversal (Jrris et al., 1985). This energy is recovered at a higher rate in the last 50 ms before release during which the majority of the power in a throw is developed. Most of the acceleration of the projectile during this period occurs as a result of wrist rotation (see JOris et al., 1985, Figure 3 and 6). Prestretch acts to amplify energy output and allows the wrist flexors to achieve power levels that otherwise could not be reached (Cavagna, 1977).
The two strategies, kinetic energy flow and tendon pre- stretch, are expedient. They take advantage of particular dynamic properties of human anatomy in the service of a goal. Such expediency is characteristic of smart devices (Rune- son, 1977a). 6 Throwing exemplifies the smart, task-specific device. The organization is temporary and organized over the dynamic properties of the relevant anatomy and the projectile, for instance, the mass distribution in the upper limb, the mass of the projectile, and the energy storage and power generating characteristics of the forearm flexors. The device should not be equated with these properties or their bearers, however, because a specific coordination of these properties is required to achieve the intended goal. The machine-like, deterministic nature of skilled throwing is enforced by extremely quick and precise timing, which is entailed, in turn, by the two strategies for achieving high release velocities. In less than 150 ms, a rapid and coordinated, staggered sequence of accelerations and decelerations among successive body and limb segments affects the flow of mechanical energy to the projectile (Atwa- ter, 1979; Jrris et al., 1985). Toyoshima, Hoshikawa, Miyash- ita, and Oguri (1974, p. 174) observed that "the rapid arm action [in overhand throwing] acts not on the basis of con- scious muscle contraction, but from the physical phenomenon and reflection of the neuromuscular system." This organiza- tion comprises a throwing machine.
A projectile is an integral component of throwing construed as a task-specific device. How does the organization of a throwing machine determine the scaling relation between the size and weight of optimal projectiles? To answer this ques- tion, we studied the kinematics and dynamics of hefting. Hefting and overhand throwing exhibit similar kinematic characteristics. In particular, both include a reversal in the direction of motion of the forearm creating a snapping motion at the wrist. This property was common to various styles of hefting observed in a study preliminary to Experiment 1.
6 Such organization also has been referred to as a coordinative structure (e.g., Turvey, 1977; Kugler, Kelso, & Turvey, 1980) or as a functional synergy (e.g., Turvey, Shaw, & Mace, 1978), but such epithets implicate less strongly the expedient nature of the organiza- tion.
HEFTING AND THROWING 515
The hefting motion used by participants in Experiment 1 had been standardized. We intended that the standardized form of hefts be relatively simple so as to facilitate the accurate recording of the kinematics. However, we also required that the standardized heft capture the characteristics of typical unconstrained hefts and allow the perceptual task to be per- formed effectively. A study was performed to examine the manner in which participants hefted and handled the objects when performing the judgment task. Three participants were videotaped while performing hefting and judgment.
Each of the three participants used a different style of hefting and handling of the objects. The first participant performed small amplitude oscillations of the hand about the wrist while holding the object. Occasionally and most often with objects chosen as preferred, the object was tossed upward and caught. The second participant almost always tossed and caught the objects. In addition, he performed gentle oscilla- tions at the elbow that caused the hand and object to bounce and oscillate about the wrist. The third participant performed this latter motion as well as throwing motions. The throwing motions were those typical of an overhand throw except that the object was not released (Atwater, 1979; Broer & Houtz, 1967; Hay, 1978). A notable characteristic of these motions was that they included extreme extension of the wrist as the forearm was moved forward, followed by a snapping forward of the hand and object. All three styles of hefting and handling had in common a distinct bouncing from the position of maximal extension at the wrist. On the basis of this observa- tion, the standard hefting motion chosen for Experiment 1 consisted of a gentle oscillation about the elbow, producing an oscillation of the hand and object about the wrist with a bounce from the position of maximal extension.
The objective in Experiments 3 and 4 was to discover the information specifying to hefters the dynamic property of hefting corresponding to optimal projectiles. That informa- tion should be contained in kinematic properties of hefting, specifically, in invariant patterns of motion corresponding to hefts with optimal projectiles. To be informative, such a kinematic property must correspond to the dynamic property underlying optimal throwability. The alternative suggested by the dynamics of throwing was to explore the kinetic energy exhibited in hefting. The precise timing among segment mo- tions required in throwing for the effective and efficient transfer of kinetic energy indicates that the phase relations between movements at different joints should be explored in hefting as a potential source of information for optimal throw- ability. We begin, however, in Experiment 3 by considering the effect of changes in object size on the second strategy for maximizing kinetic energy at release, that is, the storage of energy in the extrinsic muscles and tendons through the wrist.
Exper iment 3: Object Size, Tendon Displacement, and Dynamics at the Wrist
In Experiment l, increases in preferred weight were evoked by increasing the radius of the objects being hefted. To understand the relation between preferred weight and size, one needs to understand the effect of changes in object radius on hefting. An obvious locus for an effect is in the grasp.
Flexion of the fingers required for a grasp is achieved by muscles in the forearm via the extrinsic tendons that run through the carpal tunnel of the wrist to attachments on the palmar side of the distal finger segments (Rasch & Burke, 1978). These same muscles and tendons that act in finger flexion also contribute to wrist flexion by virtue of their spanning both wrist and finger joints. One can demonstrate this relation by placing one's wrist in hyperextension with the fingers flexed and relaxed, and then attempting to extend the fingers fully. Most people are not able to extend the fingers fully without some flexion at the wrist. This is because the muscles (i.e., the flexor digitorum superfieialis and the flexor digitorum profundus) are not long enough to permit full extension in all of the joints that they cross. The greatest free play in the extrinsic tendons exists when the fingers are somewhat flexed and relaxed and the hand is in the "position of rest" (Napier, 1980). As the fingers extend, the tendons are displaced and pulled handward through the carpal tunnel of the wrist by virtue of their being wrapped around bony protrusions existing at the end of the finger segments on the proximal side of the finger joints (Armstrong & Chaffin, 1978).
Armstrong and Chaffin (1978) measured in cadaver hands the amounts of tendon displacement corresponding to specific degrees of joint rotation. Using these data, they developed a modeling equation that predicts the tendon displacement corresponding to joint displacements for each of the finger joints and for hands of specific sizes. The model describes tendon displacement toward the forearm as the finger joints flex away from positions of peak extension; that is, the origin or zero displacement corresponds to all finger joints being at maximum extension.
Using this model, Bingham estimated the amount of tendon displacement occurring as a result of his grasping each of the four different sized objects used in Experiments 1 and 2. The model required, as input, measures of finger joint thicknesses and measures of joint angles as degrees from straight finger. Output was tendon displacement at the wrist in centimeters. Measurements were performed on the second (index finger) and third (middle finger) digits. The following were the results for the four objects in the order of increasing radius: for digit two, 1.4 cm, 1.3 cm, .9 cm, and .6 cm, respectively, and for digit three, 2.4 cm, 1.7 cm, 1.2 cm, and .6 cm, respectively. The average differences in displacement between successive size levels were .27 cm and .6 cm for the two digits, respec- tively. These results indicate that increases in the radius of projectiles shorten the portion of the extrinsic tendons run- ning from the muscles in the forearm to the wrist. Alterna- tively, the overall length of the muscle and tendon is in- creased. 7 The stiffness of muscle and tendon increases with length, because muscle and tendon stiffness is nonlinear, exhibiting the profile of a hard spring (Inman & Ralston, 1968). The implication is that the stiffness at the wrist joint increases with increases in the radius of grasped objects by virtue of increasing muscle and tendon length. A change in
7 The absolute values of these measurements cannot be interpreted. Only digits 2 and 3 were measured to provide a sense of the trend in tendon displacement. Digits 4 and 5 also are involved in grasping the two larger objects, in particular.
516 G. P. BINGHAM, R. C. SCHMIDT, AND L. D. ROSENBLUM
stiffness would result in a change in intersegment t iming. Because t iming is propor t ional to a ratio o f stiffness and mass, increases in preferred mass might be expected in response to increases in stiffness i f t iming is to be preserved.
Exper iment 3 was designed to test the hypothesis that larger objects correspond to greater stiffness at the wrist. Participants hefted objects varying in radius with weight held nearly con- stant. Each heft was per formed by lifting the hand and object using the elbow and then al lowing them to drop by briefly reversing mo t ion at the elbow. At the bo t tom of the drop, the hand and object were allowed to bounce at the wrist. The passive bouncing mot ion was allowed to dampen out wi thout interference. The recorded trajectories at the wrist were typical o f those produced by damped ha rmonic oscillators (Seto, 1964). Given the frequency, mass, and logari thmic decrement associated with an underdamped ha rmonic oscillator, the stiffness can be computed . This approach was used to derive a measure o f variat ion in stiffness at the wrist corresponding to variations in the radius o f hefted objects.
M e t h o d
Apparatus. For Experiments 3 and 4, objects similar to those used in Experiments 1 and 2 were constructed. The method of construction was the same as before. The only differences were in weight. Three objects varying in weight were constructed in each of the four sizes. First, a series of light objects, one of each size, consisted only of styrofoam wrapped with elastic tape. The weights corresponding to objects of increasing radius from .025 m to .0625 m were .004 kg, .012 kg, .030 kg, and .037 kg. Second, a series of preferred objects consisted of an object for each size of the mean preferred weight from Experiment 1. The weights corresponding to objects of increasing radius were .080 kg, .135 kg, .225 kg, and .252 kg. Third, a series of heavy objects consisted of .200-kg objects for the two smaller sizes and .500-kg objects for the two larger sizes. Only the light objects were used in Experiment 3, whereas the full set was used in Experi- ment 4.
A TECA-PN4 Polgon goniometer was used to record changes in angular position at the wrist and elbow while hefts were being performed. This device requires a polarized light source, with rapidly spinning polarity, placed approximately 1.5 m to the side of the hefter. The polarized light was picked up by four TECA photocells: one on either side of each of the two joints being measured. Three of the photocells were fastened to the upper arm and to the forearm's proximal and distal halves, respectively, using velcro strips. The fourth photocell was attached to a metal plate projecting from the dorsal side of the hand. A metal T was affixed to a weight-lifting glove so that the plate forming the stem of the T projected through elastic webbing in the back of the glove. A weight-lifting glove, which is cut off at the fingers, was used to minimize interference with grasping while enabling secure attachment of the photocell. Double-sided surgeon's tape was used to fix the top of the T to the back of the hefter's hand. The result was very stable. Voltage signals proportional to angular position at each joint were recorded on an SE 7000 12- track FM tape drive for future analysis.
At a later time, the recorded voltage signals were sampled and input to a VAX computer via a DATEL ST-PDP 12-bit analog-to- digital converter at a sampling rate of 200 Hz. Software developed at Haskins Laboratories was used to filter and to analyze position and time data used in Experiment 1.
Participants. Three graduate students at the University of Con- necticut, two of them authors of this article, participated in the
experiment, in addition to the first author. Two of the participants were in their mid-20s and the remaining two were in their early 30s. All participants were men and fight-handed. None had any motor disabilities. One of the participants began to experience pain in his wrist midway through the experiment. This occurred in two separate sessions. These data were excluded from analysis, leaving data from three participants.
Experimentalprocedure. The data reported in Experiments 3 and 4 were collected in a single experimental session for each participant. For both experiments, hefters were required to heft objects in the same manner as in Experiment 1. Hefters sat upright in a chair and extended their right hand with the palm up, the forearm horizontal, and the upper arm vertical. In Experiment 3, hefting was not per- formed continuously and, thus, did not exhibit a periodic motion as in Experiments 1 and 4. Rather, participants performed discrete hefts in which the hand, object, and forearm were raised, flipping the hand and object at the top of the trajectory by a brief reversal of motion at the elbow. This was followed by a dropping of the hand and object, which were allowed to bounce passively at the bottom of the trajec- tory. Participants were instructed to allow this bouncing motion to dampen out passively and to wait for motion to cease before initiating the next heft. After examination of the recorded form of these trajectories, one of the participants was found to have violated con- sistently this noninterference instruction. An occasional heft had the form characteristic of noninterference, but most did not. Hayes and Hatze 0977) controlled for a similar noninterference instruction by examining simultaneous EMG recordings of relevant muscle groups during oscillation of the limb. One of their three participants was found to be unable to avoid active interference in the movements of the limb. The same must be the case for the participant in this experiment. The data from the two remaining participants were analyzed and included in the results reported below. The four light objects of different size were hefted in order of increasing size by both participants. For each object, the participant began performing discrete hefts at regular intervals of a couple of seconds. After the participant had performed four or five such hefts, trajectories of an additional eight hefts were recorded. This portion of an experimental session lasted about 10 min.
Finally, a number of anthropometric measures were taken for each participant, including height, weight, hand length to the second knuckle of the middle finger, forearm length, upper arm length, palm length, palm width, maximal wrist extension, and maximal wrist flexion.
Resul t s and Discussion
A wrist trajectory typical o f those recorded in this experi- men t appears in Figure 7. Each heft consists of, first, an irregular rising por t ion corresponding to active wrist flexion followed by a smooth rising por t ion produced by the flipping of the hand by jo in t reversal at the elbow. This is followed by smooth and steep dropping, bounce at peak extension, and, then, smooth rising o f the hand and object. After the resulting rest posit ion was held for a momen t , the sequence was re- peated.
The positions and t imes o f peak flexion, peak extension, and bounce peak flexion were measured for hefts. Measure- ments were performed only on hefts for which a bounce flexion peak could be distinguished clearly. A total of 9 -10 hefts were measured for each object.
The differential equat ion for a one-dimensional , damped harmonic oscillator is:
m2(t) + cSc(t) + kx(t) = O,

HEFTING AND THROWING
0 i t ~2 13 , 14 15 i G 17 i fl i g
Figure 7. A typical wrist trajectory. (Angular position versus time in seconds. The dotted line corresponds to 0". Data recorded from Participant 1 while hefting the .200-kg [heavy] object with radius of.025 m.)
517
where the variables t, x, ~?, and 57 represent time, position, velocity, and acceleration, and the parameters m, c, and k represent mass, damping, and stiffness. The stiffness, k, can be computed for a given trajectory assuming that values of the mass, m, the (angular) frequency, Wd, and the logarithmic decrement, O, are known (Seto, 1964). The logarithmic dec- rement is the natural logarithm of the ratio of amplitudes from two successive cycles, s The equation for stiffness is:
k = m(wd)2[(O/~r) 2 + 1].
The stiffness for each heft was computed using this relation together with amplitudes, frequencies, and masses derived from measured values. The mass values used included the mass of the objects added to the mass of the hand as estimated from body weight and a coefficient given in Chaffin and Andersson (1984).
Light objects were made purely of styrofoam (and tape) with very slight variations in weight. Thus, the light objects effectively isolate changes in size from changes in weight. The scattergram of computed stiffnesses versus object radii appears in Figure 8. Except for the largest object, the clear trend is for stiffness to increase with increases in object size. A simple linear regression was performed on stiffness values for the first three object sizes. The result was significant for both partici- pants: for Participant l, F(I , 13) = 131.23, r: = .704, p < .001; for Participant 2, F(l , l l ) = 5.81, r 2 = .346, p < .05. Both regressions resulted in positive slopes reflecting increases in stiffness with increases in object radius. These results are
1 O00,
1500
0
Figure 8.
S t i f f m u vs Object Sizo
| ! 0 • • |
!
o
.o~ .o~ .~s .o6~ R~im (m)
Stiffness versus radius for light objects. (Hefts from two participants. Stiffness in kilograms per seconds squared. Radius in meters.)
consistent with the hypothesis that the effect of increases in object radius is to lengthen the extrinsic tendons and muscles responsible for finger and wrist flexion and, thus, to increase stiffness at the wrist due to the exponential form of the length- tension relation.
The decrease in stiffness values appearing for the largest object is not consistent with this hypothesis. In Experiment l, hefters remarked that a different throwing style would be appropriate for the largest sized objects. In Experiment 2, throwers threw the largest objects in a different style from the rest, using a lob in which the wrist and elbow were kept fairly rigid. This indicates that the muscle-tendon prestretch strat- egy was not being used to the same extent with these objects. Hand lengths from the wrist to the second knuckle of the middle finger were measured for Participants 1 and 2 in Experiment 3. They were 15.5-cm and 14.2-cm long, respec- tively, as compared to the 12.5-cm diameter of the largest objects. The large size of these objects made them more difficult to grasp stably and more likely to escape a grasp upon perturbation. All of these facts lead to the conclusion that the largest objects cause difficulties in grasping and, thus, require a different mode of throwing that does not involve the mus- cules and tendons spanning the wrist in an active role, but rather, only in a passive, support role. Further, the stiffness values for the .0625-m objects would result from less vigorous hefting motions used to avoid dropping them. Indeed, the mean half-cycle "drop" period for the .0625-m objects was longer, .151 ms as opposed to periods of.131, .132, and .136 ms for the remaining objects.
On the basis of these observations together with the results of the regression on stiffnesses for the first three sizes, we concluded that our hypothesis was confirmed and that the effect of increasing the radius of hefted objects was an increase in the stiffness at the wrist joint due to the lengthening of the extrinsic tendons and muscles spanning the wrist and finger joints. Additional support for this hypothesis was found in an analysis of the pattern of individual differences from Experi- ment I.
Although all participants in Experiment 1 exhibited a pat- tern of increasing preferred weight over increasing size, they
s The amplitudes are measured from the rest position of the oscil- lator. This position could not be determined accurately with measured trajectories from the wrist. However, O* computed from half-cycle angular excursions measured from peak flexion to peak extension can be shown to be equal to 0/2. Thus, 0" x 2 = O.
518 G. P. BINGHAM, R. C. SCHMIDT, AND L. D. ROSENBLUM
varied in the absolute values of preferred weights. Overall mean preferred weight for individual participants varied be- tween .097 kg and .212 kg. Anthropometric measures includ- ing height, body weight, hand span, hand length, palm width, palm length, first finger length, forearm length, and arm length, as well as gender, were regressed on overall mean preferred weights. One outlier appeared in most of the regres- sions, strongly increasing the 90% confidence intervals around computed slopes. The following results are with the outlier removed. The pattern of results is the same but percentages of variance accounted for by factors is increased. Only gender, r 2 = .581, F(1, 8) = 11.07, p < .01; hand length, r -~ = .627, F(1, 8) = 13.46, p < .01; and palm length, r 2 = .639, F(I, 8) = 14.16, p < .01, were significant, whereas palm width (p < .06) was marginal. Hand length and palm width regressed simultaneously on gender were significant, F(2, 7) = 33.40, p < .001, and accounted for 90% of the variance in gender, r -~ = .905. In a multiple regression on overall mean preferred weights, hand length, palm width, and arm length accounted for 94% of the variance, r 2 = .941, F(3, 6) = 32.18, p < .001. Beta coefficients, which provide a measure of the unique contribution of each factor, indicate that hand length (~ = 1.49) and palm width (~ = 2.27) contribute strongly in a positive direction, whereas arm length (~ -- - .53) contributes more weakly in a negative direction. ~ Many studies have compared individual differences in throwing ability with var- ious anthropometric measures including arm length, but not including hand dimension variables. These studies have been reviewed by Atwater (1979), who concluded that no consistent correlation had been found.
The effect of object size must be relative to the proportions of the person hefting the object. We found that preferred weights increase directly with increases in hand length and palm width and inversely with increases in arm length. Hand length by palm width describes hand size. This, in turn, reflects the size of the bony protrusions at the joints. The amount of tendon displacement that occurs with joint rota- tion is determined by the size of these protrusions and, thus, by hand size (Armstrong & Chaffin, 1978). Overall tendon length, on the other hand, would be proportional to arm length as well as hand length. Increase in hand size (and, thus, in relative tendon displacements) has greater effect inversely with overall tendon length. Thus, the pattern of results on individual differences in preferred weights corresponds well with this understanding of the effect of object size on the actuators for the wrist and hand. Objects that are larger relative to the size of the hefter's hand result in greater tendon displacement in the grasp, which, in turn, increases the stiff- ness at the wrist joint.
One of the two strategies used in skilled throwing for achieving high kinetic energy in the projectile at release in- volves the storage of energy in the tendons and muscles spanning the wrist joint. The results of Experiments 1 and 3 indicate that this storage medium stiffens with increasing object size. However, the predominant strategy for achieving high kinetic energy levels is the second strategy, which in- volves a proximal to distal flow of energy along the segments of the limb. The development and flow of energy to the projectile at release takes place in less than a second with the
forward arm swing occurring over about 100 ms (Atwater, 1979). This rapid action requires skilled and stereotypically precise coordinative timing. In particular, the efficacy of the energy flow depends on the precise timing and coordination of successive accelerations and decelerations in progressively more distal segments. The majority of the power in a throw is developed in the last 50 ms before release and corresponds to movement about the wrist (Jrris et al., 1985). Stiffening of the wrist joint must have an impact on the timing and coordination of motion in the forearm and hand with coin- ciding effect on the development of peak kinetic energy. Experiment 4 was designed to study these effects.
Exper iment 4: In ter joint Coord ina t ion and Cont r ibu t ions to Peak Kinet ic Energy
In view of the stereotypically precise coordinative timing required among movements of the limb segments in throwing, the phasing between, hefting movements of the wrist and elbow was measured in Experiment 4 to determine the effects of changes in object size and weight. Continuous, periodic hefting motions identical to those performed in Experiment 1 were recorded using light, preferred, and heavy objects. Preferred objects corresponded to the mean preferred weight in each size selected by hefters in Experiment 1. Heavy objects were approximately twice the weight of the preferred object for each size, whereas light objects all had weights near 0 kg. To evaluate the independent effect of size changes on phasing, two size series were used. In each series, all objects were approximately of the same weight. In the first series, light objects in all four sizes had weights approximately equal to 0 kg. The second series included the two smaller heavy objects and the two larger preferred objects. In this series, objects in all fours sizes had weights approximately equal to .200 kg. To evaluate the independent effect of weight changes on phasing, performance with 0-kg objects was compared to that with .200-kg objects. Following this, phase differences were studied for preferred objects in which weight varied across object sizes according to the scaling function discovered in Experiment 1. Next, using anthropometric data, the kinetic energies corre- sponding to these measured trajectories were computed and compared across weight and size conditions. Finally, the results of this comparison were correlated with the results of the phase analysis of the kinematics.
M e t h o d
The apparatus and participants were the same as described in Experiment 3.
Experimental procedure. Hefting was performed in the same manner as in Experiment 1. Participants were instructed to perform hefts continuously, in a regular, periodic motion, and to perform them at a rate that was most comfortable as if they were to continue hefting all day. Studies have shown that periodic limb motions
9 With the outlier included, this regression accounted for 70% of the variance and the 90% confidence limits on Bs changed from .969- 2.005 to -.114-2.065, from .073-3.461 to -.756-5.603, and from -.756--.312 to - 1.08--.089 for the three factors, respectively.

HEFTING AND THROWING 519
performed at preferred rates exhibit highly stable and reproducible periods and amplitudes (Kay, Kelso, Saltzman, & Schtner, 1987; Kugler & Turvey, 1987; Turvey, Rosenblum, Schmidt, & Kugler, 1986). For each trial, participants were allowed to perform hefting until they had established a preferred rate. The participant then indicated this to the experimenter, who began recording 15 s of data. Four trials were run with each of the 12 objects, resulting in a total of 48 trials for each of the three participants. The order of objects was randomized within the four blocks of trials. This portion of an experimental session lasted approximately an hour.
Data processing. Fifteen seconds of data were recorded for each trial in Experiment 4, as described above. After digital sampling, 10 s of data per trial were available for further analysis.
Software developed at Haskins Laboratories was used to smooth position-time data, using a 35-ms triangular window, and to compute instantaneous angular velocities by means of a two-point central difference algorithm. Velocities were smoothed using the same tri- angular window. A number of measurements were performed on these trajectories, including mean periods, mean amplitudes, and mean phase differences for each trial. Phase differences are reported as a decimal fraction of the (mean) cycle period (see Kay, Munhall, Vatikiotis-Bateson, & Kelso, 1985; Kay et al., 1987, for details of the signal processing).
Using elbow and wrist velocities, wrist position, forearm length, hand length, palm length, body weight, object weight, and object radius, the kinetic energy of the forearm, hand, and object was computed continuously over the hefting trajectories (see Appendix B for the details of this computation). These kinetic energy trajectories exhibited a single distinct peak in each hefting cycle. Furthermore, as described later, trajectories corresponding to the individual terms
summed in the kinetic energy equation also exhibited such peaks. Phase difference measurements were performed on these peaks.
Results and Discussion
As expected, the periods and amplitudes of hefts were stable and reproducible both within trials and over trials for each hefter. For instance, standard deviations for wrist cycle periods across trials for Participants 1-3 were .026 ms , . 111 ms, and .069 ms, respectively, including systematic variations that occurred over weight conditions. These represent an average of 8% of the corresponding mean periods. Likewise, standard deviations for wrist flexion amplitudes were 6.62 °, 7.65 °, and 13.23 °, representing an average of 14% of corresponding mean amplitudes. Representative wrist and elbow trajectories to- gether with velocities are shown in Figure 9 for Participant I.
In all, there were six features of the elbow and wrist position and velocity trajectories to be compared via phase measure- ments, including peak flexion of the elbow and wrist (EF and WF), peak extension of the elbow and wrist (EE and WE), and peak (extension) velocity of the elbow and wrist (EV and WV). Velocity peaks for flexion were not equally apparent in the data from all three participants and, so, were not included in the phase analysis. Given six features to be compared, there were 5 degrees of freedom to be fixed. Five phase differences were measured directly. Using these, the remaining phase relations were computed.
,I I1 12 13 14 ,, 15 I 6 J? 18 f9
, - . _ _ _ . .
e , 11 !2 13 14 is I G ~7 |8 19,
e 11 12 13 14 IS 16 l? 18 19
..... i l 12 13 14 ~5 ~6 t? ~8 19
Figure 9. Representative wrist and elbow trajectories for Participant 1, hefting an object of radius .0375 m and weight .012 kg~ (From top to bottom, simultaneous elbow position, elbow velocity, wrist position, and wrist velocity. The dotted line corresponds to 0* position and a velocity of 0, respectively. For position-time plots, flexion is up and extension down. For velocity-time plots, flexion velocity is above the dotted line and extension velocity is below. Time in seconds. Scales on vertical axes are not identical for wrist and elbow plots.)
520 G. P. BINGHAM, R. C. SCHMIDT, AND L. D. ROSENBLUM
The phase differences that were measured directly, produc- ing a mean phase lag for each trial, were as follows: WF versus EF, WE versus EE, WF versus EV, WF versus WE, and WV versus WE. The phase differences that were computed from these were as follows: WV versus EV, WF versus WV, EF versus EE, EF versus EV, and EV versus EE. There were a total of 10 phase differences.
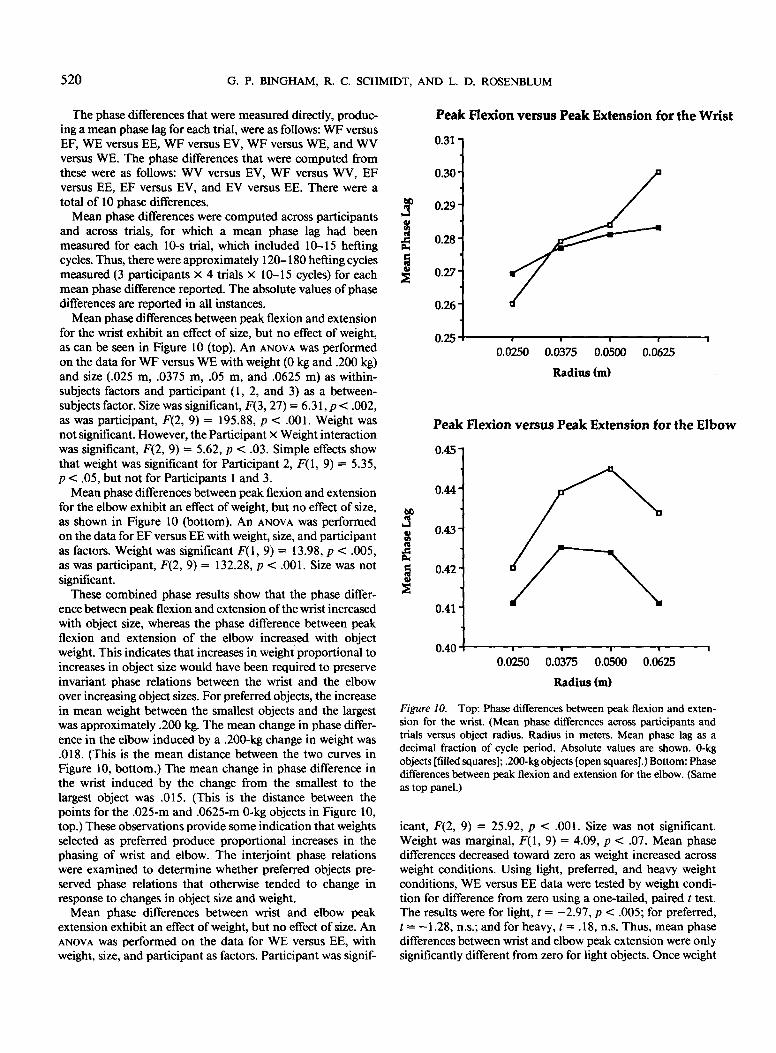
Mean phase differences were computed across participants and across trials, for which a mean phase lag had been measured for each 10-s trial, which included 10-15 hefting cycles. Thus, there were approximately 120-180 hefting cycles measured (3 participants x 4 trials x 10-15 cycles) for each mean phase difference reported. The absolute values of phase differences are reported in all instances.
Mean phase differences between peak flexion and extension for the wrist exhibit an effect of size, but no effect of weight, as can be seen in Figure 10 (top). An ANOVA was performed on the data for WF versus WE with weight (0 kg and .200 kg) and size (.025 m, .0375 m, .05 m, and .0625 m) as within- subjects factors and participant (1, 2, and 3) as a between- subjects factor. Size was significant, F(3, 27) = 6.31, p < .002, as was participant, F(2, 9) = 195.88, p < .001. Weight was not significant. However, the Participant x Weight interaction was significant, F(2, 9) = 5.62, p < .03. Simple effects show that weight was significant for Participant 2, F(I, 9) = 5.35, p < .05, but not for Participants 1 and 3.
Mean phase differences between peak flexion and extension for the elbow exhibit an effect of weight, but no effect of size, as shown in Figure 10 (bottom). An ANOVA was performed on the data for EF versus EE with weight, size, and participant as factors. Weight was significant F(1, 9) = 13.98, p < .005, as was participant, F(2, 9) = 132.28, p < .001. Size was not significant.
These combined phase results show that the phase differ- ence between peak flexion and extension of the wrist increased with object size, whereas the phase difference between peak flexion and extension of the elbow increased with object weight. This indicates that increases in weight proportional to increases in object size would have been required to preserve invariant phase relations between the wrist and the elbow over increasing object sizes. For preferred objects, the increase in mean weight between the smallest objects and the largest was approximately .200 kg. The mean change in phase differ- ence in the elbow induced by a .200-kg change in weight was .018. (This is the mean distance between the two curves in Figure 10, bottom.) The mean change in phase difference in the wrist induced by the change from the smallest to the largest object was .015. (This is the distance between the points for the .025-m and .0625-m 0-kg objects in Figure 10, top.) These observations provide some indication that weights selected as preferred produce proportional increases in the phasing of wrist and elbow. The interjoint phase relations were examined to determine whether preferred objects pre- served phase relations that otherwise tended to change in response to changes in object size and weight.
Mean phase differences between wrist and elbow peak extension exhibit an effect of weight, but no effect of size. An ANOVA was performed on the data for WE versus EE, with weight, size, and participant as factors. Participant was signif-
P e a k Flex ion ver sus P e a k Extens ion for the Wrist
0.31
0 . ~
0.29"
0.28"
0.~"
0 . ~
0.251 , 0.0250
! i g
0.0375 0.0500 0.0625
Radius (m)
P e a k Flex ion versus P e a k Extens ion for the E l b o w
O0 ,,d
0.45"
0.44'
0.43'
0.42'
0.41'
0.40 I | I I
0.0250 0.0375 0.0500 0.0625
Radius (m)
Figure 10. Top: Phase differences between peak flexion and exten- sion for the wrist. (Mean phase differences across participants and trials versus object radius. Radius in meters. Mean phase lag as a decimal fraction of cycle period. Absolute values are shown. 0-kg objects [filled squares]; .200-kg objects [open squares].) Bottom: Phase differences between peak flexion and extension for the elbow. (Same as top panel.)
icant, F(2, 9) = 25.92, p < .001. Size was not significant. Weight was marginal, F(I, 9) = 4.09, p < .07. Mean phase differences decreased toward zero as weight increased across weight conditions. Using light, preferred, and heavy weight conditions, WE versus EE data were tested by weight condi- tion for difference from zero using a one-tailed, paired t test. The results were for light, t = -2.97, p < .005; for preferred, t = -1.28, n.s.; and for heavy, t -- .18, n.s. Thus, mean phase differences between wrist and elbow peak extension were only significantly different from zero for light objects. Once weight

HEFTING AND THROWING 521
levels were increased to the level of preferred weights, wrist and elbow peak extensions were effectively in phase or syn- chronous.
Mean phase differences between wrist and elbow peak velocity exhibit an effect of size, but no effect of weight. An ANOVA Was performed on the data for WV versus EV, with weight, size, and participant as factors. Size was significant F(3, 27) = 4.12, p < .02, as was participant, F(2, 9) = 16.79, p < .001. Weight (0 kg and .200 kg) was not significant. The Participant x Size interaction was significant, F(6, 27) = 3.04, p < .02. Simple effects show that size was not significant for Participant 3.
Similar to WV versus EV, mean phase differences between wrist and elbow peak flexion exhibit an effect of size, but no effect of weight. An ANOVA was performed on the data for WF versus EF with weight, size, and participant as factors. Size was significant, F(3, 27) = 6.29, p < .002. Participant was significant, F(2, 9) = 75.97, p < .001. Weight was not significant. The Participant x Size interaction was significant, F(6, 27) = 3.1 l, p < .02. Simple effects show that size was not significant for Participant 3.
Interjoint phase relations between the wrist and the elbow exhibited significant changes with changes in the size and weight of the objects hefted. These phase relations were ana- lyzed to determine the effect of variations of size and weight for preferred objects. Because size and weight covaried for preferred objects according to the scaling relation discovered in Experiment 1, only a single factor, size, was used to test for an effect of size or weight. ANOVAS were performed on preferred weight data for each of the interjoint phase differ- ence measures with size and participant as factors. Only the participant factor was significant, p < .01, for WE versus EE and WV versus EV. Size was not significant. In addition to participant, size was significant, F(3, 27) = 3.53, p < .03, for WF versus EF. However, in this case, size was significant in simple effects only for Participant 2, F(3, 27) = 3.44, p < .03. Because homogeneity of variance was obtained across means within each of the phase measures, changes in significance of factors in ANOVAS can be attributed to changes in the relative pattern of means. These results indicate that phase relations between the wrist and the elbow, which were subject to change with changes in object size or weight, remained invariant over changes in size for objects of preferred weights as shown in Figure 11. The invariance of these phase differences for pre- ferred objects advocates interjoint phase relations as the ki- nematic property of hefting that might have provided infor- mation for optimal throwability to hefters. If so, however, the question arises, How might this particular set of phase differ- ence values indicate optimal throwability?
Discovering the significance of these phase relations re- quired investigation of the underlying dynamics. Because the kinetic energy of a projectile at the moment of release is the primary determinant of flight distance, the kinetic energy of hefting was selected as the appropriate aspect of the dynamics for investigation. Variations in the combined kinetic energy of the forearm, hand, and object were examined over the hefting trajectories.
A kinetic energy trajectory was computed for each trial using the following relation, which is described in detail in
Inter-Joint Phase Differences for Preferred
0.25-
0.20"
0.15"
0.10"
0.05 -
0.00"
-0.05 I I I I I
0.0250 . 0.0375 0.0500 0.0625
Radius (m)
Figure 11. Interjoint phase differences for preferred objects. (Mean phase differences across participants and trials versus object radius. Radius in meters. Mean phase lag as a decimal fraction of cycle period. Absolute values are shown. WE vs. EE [filled squares]. WF vs. EV [open squares]. WV vs. EV [filled triangles]. WF vs. EF [open triangles]. EV vs. 1st Ext [crosses].)
Appendix B:
KE(t) = O~(t)[f(Ow(t))] + ~.(t)~w(t)[f2(f~w(t))] + ~ ( t ) [ C ] .
A single and distinct kinetic energy peak was found to occur during extension for each hefting cycle. This peak occurred in the vicinity of the peak extension velocities for the wrist and elbow. From the kinetic energy equation, it is clear that both elbow and wrist velocities contribute to this peak, but the exact nature of the respective contributions is not obvious. However, close inspection of the equation provides some insight as to how to proceed.
Kinetic energy is proportional to velocity squared (i.e., KE = l/2mv2). As such, kinetic energy is always positive because mass is positive. The kinetic energy equation in this case includes three terms on the right side, two of which involve either wrist or elbow velocity squared. Because the respective coefficients always remain positive, these terms are always positive. However, this is not true of the third "coupling" term, which involves the product of elbow and wrist velocities.
The coupling term can become negative whenever either one, but not both, of the velocities becomes negative. Recall that sign on velocity indicates direction of travel, so that this term becomes negative whenever the wrist and elbow joints are traveling in opposite directions, for instance, elbow flexing and wrist extending. Because in throwing the requirement is to maximize kinetic energy at its peak, assuming that this can be made to correspond to the moment of release, a positive value of the coupling term would be optimal at the peak value for the sum of the remaining two noncoupling terms. That is, the addition of energy by the coupling term to the peak total
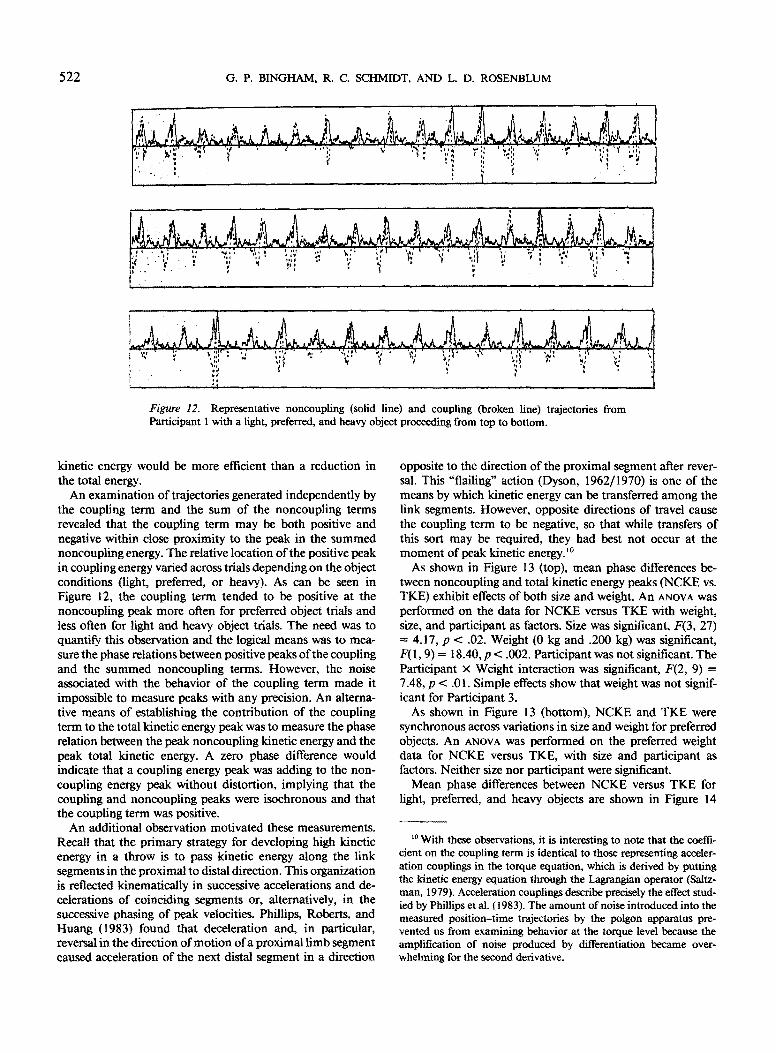
522 ~. P. BINGHAM, R. C. SCHMIDT, AND L. D. ROSENBLUM
, , i .d i
i , .
" t ~' t
I I. ,J . . . . . . . . . . . . , . . . . . . . . @
Figure 12. Representative noncoupling (solid line) and coupling (broken line) trajectories from Participant 1 with a light, preferred, and heavy object proceeding from top to bottom.
kinetic energy would be more efficient than a reduction in the total energy,
An examination of trajectories generated independently by the coupling term and the sum of the noncoupling terms revealed that the coupling term may be both positive and negative within close proximity to the peak in the summed noncoupling energy. The relative location of the positive peak in coupling energy varied across trials depending on the object conditions (light, preferred, or heavy). As can be seen in Figure 12, the coupling term tended to be positive at the noncoupling peak more often for preferred object trials and less often for light and heavy object trials. The need was to quantify this observation and the logical means was to mea- sure the phase relations between positive peaks of the coupling and the summed noncoupling terms. However, the noise associated with the behavior of the coupling term made it impossible to measure peaks with any precision. An alterna- tive means of establishing the contribution of the coupling term to the total kinetic energy peak was to measure the phase relation between the peak noncoupling kinetic energy and the peak total kinetic energy. A zero phase difference would indicate that a coupling energy peak was adding to the non- coupling energy peak without distortion, implying that the coupling and noncoupling peaks were isochronous and that the coupling term was positive.
An additional observation motivated these measurements. Recall that the primary strategy for developing high kinetic energy in a throw is to pass kinetic energy along the link segments in the proximal to distal direction. This organization is reflected kinematically in successive accelerations and de- celerations of coinciding segments or, alternatively, in the successive phasing of peak velocities. Phillips, Roberts, and Huang (1983) found that deceleration and, in particular, reversal in the direction of motion of a proximal limb segment caused acceleration of the next distal segment in a direction
opposite to the direction of the proximal segment after rever- sal. This "flailing" action (Dyson, 1962/1970) is one of the means by which kinetic energy can be transferred among the link segments. However, opposite directions of travel cause the coupling term to be negative, so that while transfers of this sort may be required, they had best not occur at the moment of peak kinetic energy. ~°
As shown in Figure 13 (top), mean phase differences be- tween noncoupling and total kinetic energy peaks (NCKE vs. TKE) exhibit effects of both size and weight. An ANOVA was performed on the data for NCKE versus TKE with weight, size, and participant as factors. Size was significant, F(3, 27) -- 4.17, p < .02. Weight (0 kg and .200 kg) was significant, F(1, 9) = 18.40, p < .002. Participant was not significant. The Participant × Weight interaction was significant, F(2, 9) = 7.48, p <: .01. Simple effects show that weight was not signif- icant for Participant 3.
As shown in Figure 13 (bottom), NCKE and TKE were synchronous across variations in size and weight for preferred objects. An ANOVA was performed on the preferred weight data for NCKE versus TKE, with size and participant as factors. Neither size nor participant were significant.
Mean phase differences between NCKE versus TKE for light, preferred, and heavy objects are shown in Figure 14
10 With these observations, it is interesting to note that the coeffi- cient on the coupling term is identical to those representing acceler- ation couplings in the torque equation, which is derived by putting the kinetic energy equation through the Lagrangian operator (Saltz- man, 1979). Acceleration couplings describe precisely the effect stud- led by Phillips et al. (1983). The amount of noise introduced into the measured position-time trajectories by the polgon apparatus pre- vented us from examining behavior at the torque level because the amplification of noise produced by differentiation became over- whelming for the second derivative.
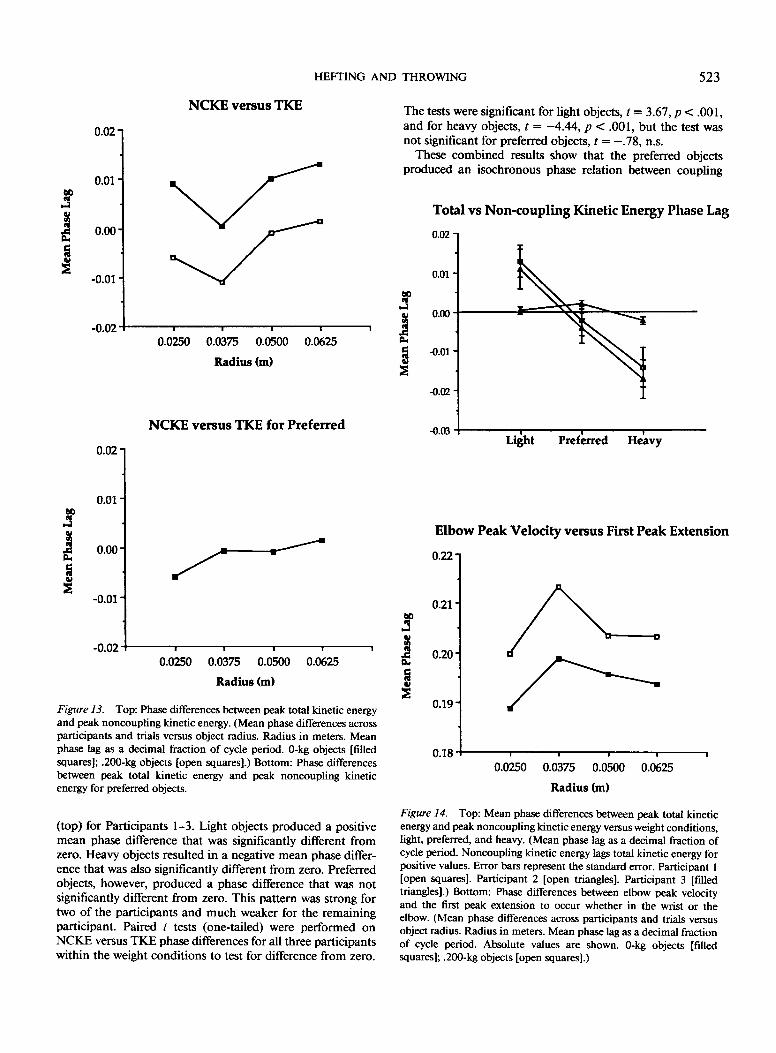
HEFTING AND THROWING 523
0.02"
0.01
0.00
-0.01'
-0.02
NCKE versus TKE
| l i i
0.0250 0.0375 0.0500 0.0625
Radius (m)
J
0.02"
0.01
0.00
-0.01
-0.02
NCKE versus TKE for Preferred
/ m
i ! ! |
0.0250 0.0375 0.0500 0.0625
Radius (m)
Figure 13. Top: Phase differences between peak total kinetic energy and peak noncoupling kinetic energy. (Mean phase differences across participants and trials versus object radius. Radius in meters. Mean phase lag as a decimal fraction of cycle period. 0-kg objects [filled squares]; .200-kg objects [open squares].) Bottom: Phase differences between peak total kinetic energy and peak noncoupling kinetic energy for preferred objects.
,d
The tests were significant for light objects, t = 3.67, p < .001, and for heavy objects, t = -4.44, p < .001, but the test was not significant for preferred objects, t = - .78, n.s.
These combined results show that the preferred objects produced an isochronous phase relation between coupling
J (U
Total vs Non-coupling Kinetic Energy Phase Lag
0.02
0.01
0.00
-0.01
-0.02
-0.03 Li t Preferred Heavy
Elbow Peak Velocity versus First Peak Extension
0 . 2 2 "
0.21
0.20
0.19"
0.18
l a
I i i i
0.0250 0.0375 0.0500 0.0625
Radius (m)
(top) for Participants 1-3. Light objects produced a positive mean phase difference that was significantly different from zero. Heavy objects resulted in a negative mean phase differ- ence that was also significantly different from zero. Preferred objects, however, produced a phase difference that was not significantly different from zero. This pattern was strong for two of the participants and much weaker for the remaining participant. Paired t tests (one-tailed) were performed on NCKE versus TKE phase differences for all three participants within the weight conditions to test for difference from zero.
Figure 14. Top: Mean phase differences between peak total kinetic energy and peak noncoupling kinetic energy versus weight conditions, light, preferred, and heavy. (Mean phase lag as a decimal fraction of cycle period. Noncoupling kinetic energy lags total kinetic energy for positive values. Error bars represent the standard error. Participant 1 [open squares]. Participant 2 [open triangles]. Participant 3 [filled triangles].) Bottom: Phase differences between elbow peak velocity and the first peak extension to occur whether in the wrist or the elbow. (Mean phase differences across participants and trials versus object radius. Radius in meters. Mean phase lag as a decimal fraction of cycle period. Absolute values are shown. 0-kg objects [filled squares]; .200-kg objects [open squares].)
524 G. P. BINGHAM, R. C. SCHMIDT, AND L. D. ROSENBLUM
and noncoupling kinetic energy at the total kinetic energy peak, as shown in both Figures 13 (bottom) and 14 (top). In contrast, objects that were lighter or heavier than preferred produced phase differences that were significantly different from zero, as shown in Figure 14 (top). The phase relation between NCKE and TKE varied with both the size and the weight of objects being hefted, as seen in Figure 13 (top). Phase differences increased with increases in size and de- creased with increases in weight. The scaling relation between size and weight for preferred objects scales weight increases so as to cancel changes induced in phasing by size increases, with a consistent zero phase difference as a result.
In addition to this isochrony of positive kinetic energy term peaks, the preferred objects also corresponded to phase rela- tions between wrist and elbow movements that remained invariant over changes in object size. The remaining question was whether the two results were related. How might the kinetic energy result relate to the phasing between the elbow and the wrist?
As described above, changes in the sign of the kinetic energy coupling term occurred at joint reversals. In particular, if one joint reached peak extension first while both wrist and elbow joints were extending, then the sign of the coupling term would have changed from positive to negative as the two joints began to move in opposite directions. Because the total kinetic energy peak occurred during extension of the wrist and elbow near peak extension, the relative phase of the first peak extension reached, whether it be for the wrist or for the elbow, would have determined the behavior of the coupling term in the region of peak total kinetic energy. Furthermore, because peak total kinetic energy consisted of contributions from both the wrist and elbow peak velocities, the phasing between wrist and elbow peak velocities would have influ- enced the relative phase of the peak total kinetic energy. Finally, elbow peak velocity often occurred in close proximity to wrist peak flexion, which marked another sign change in the kinetic energy coupling term.
These factors were captured in a single phase relation by computing the phase difference between peak elbow velocity and the first peak extension reached (EV vs. 1st Ext), whether it be in the wrist or in the elbow. EV versus 1 st Ext was found to represent all three interjoint phase relations. WV versus EV, WE versus EE, and two vectors coding for participants were regressed simultaneously on EV versus 1 st Ext data for the preferred objects only. The result was significant, r 2 = .924, p < .001, and the partial Fs were significant, p < .01, in all cases. The same regression performed on all the data also was significant, r 2 --- .919, p < .001, and the partial Fs were all significant, p < .00 I. (Recall that WV vs. EV and WF vs. EF exhibited the same results in response to manipulations in object size and weight. In regression, WV vs. EV accounted for 82% of the variance in WF vs. EF.) Thus, EV versus 1st Ext captures the majority of the variance in the interjoint phase differences between elbow and wrist. Like those phase differences, the EV versus 1 st Ext phase difference was invar- iant over variations in object size for preferred weights, as seen in Figure 11.
As shown in Figure 14 (bottom), the pattern of mean phase differences for EV versus 1st Ext was the same, although
inverted, as the pattern for NCKE versus TKE shown in Figure 13 (top). EV versus 1 st Ext together with two vectors coding for participants were regressed simultaneously on NCKE versus TKE data for all three participants. The result was significant, r 2 = .217, p < .001. Partial Fs for all vectors were significant, p < .001. Separate regressions of EV versus 1st Ext were performed on NCKE versus TKE data for each participant: for Participant 1, r 2 = .310, p < .001; for Partic- ipant 2, r 2 = .147, p < .01; and for Participant 3, r 2 = .099, p < .05. The slope was negative in all three instances, reflecting the inverted nature of the relationship. Although the kinetic energy peaks were quite sharp, the elbow and wrist velocity and extension peaks were rather broad in comparison. This contributed some random noise variance to the relations between NCKE versus TKE and EV versus 1st Ext. Consid- ering the complexity of the kinetic energy waveforms and the relative simplicity of the single kinematic phase measure, these relations are quite good. They provide strong evidence for a correspondence between the phasing of peaks in the kinetic energy terms and the phasing of peak flexions, extensions, and velocities in elbow and wrist movements.
The three conclusions drawn from Experiment 4 were as follows. First, preferred objects corresponded to a dynamic property of hefting construed as a smart perceptual mecha- nism. Preferred objects corresponded to an optimal, isochron- pus phase relation among the peaks associated with the terms of the kinetic energy equation. Second, preferred objects corresponded to a kinematic property of hefting. Preferred objects corresponded to a set of invariant phase relations between elbow and wrist movements. These phase relations remained invariant over changes in object size for objects of preferred weights. Third, the pattern of results for the dynamic property corresponded to the pattern of results for the kine- matic property. Therefore, the kinematic property was hy- pothesized to provide information for the dynamic property of the hefting machine. Because the kinetic energy developed during a throw determines flight distance and because the kinetic energy coupling term relates to one of the means by which kinetic energy is developed and transferred eventually to a projectile, the interjoint phase relations were interpreted as providing information for the perceived property, "optimal object for throwing to a maximum distance."
Genera l Discussion
The approach advocated in this article constitutes a depar- ture from many extant methods for investigating perceptual properties, in part because investigation is initiated and or- ganized with respect to the successful performance of mun- dane tasks as opposed to the referents of words.
The Methodological Myth of Special Access
The use of natural language categories for inspiration in formulating research on perceptual properties is illustrated by entire traditions of research on heaviness, weight, size, dis- tance, loudness, brightness, slant, texture, color, force, veloc- ity, shape, and myriad other words taken straight from the dictionary. The problem inherent to this latter approach is
HEFTING AND THROWING 525
than an isomorphism is assumed implicity to exist between perceptual properties and natural language vocabulary. This assumption is made when, in fact, the specific nature of the mapping between perceptual properties and the categories found in natural languages is unknown. Word use tends to cut across functional contexts and, as a result, words map to a cross section of perceptual properties. For example, "heav- iness" may be used to refer to objects in the context of different tasks involving different task-specific manipulations. The ref- erent of heaviness is subject to considerable variation depend- ing on the task. Heaviness may involve rotational inertia in swinging a bat and linear inertia in pushing a cart. Rotational inertia varies with a lever arm and with the specific placement of the axis of rotation in extended bodies, whereas linear inertia is indifferent to these considerations.
Confusing words with perceptual properties is bound to result in a confused and distorted impression of how percep- tion works. Using natural language categories to guide the formulation of perceptual research is to foster a methodolog- ical myth of special access. We cannot assume that language gives us special access to perceptual properties. Rather, the nature of the mapping between words and perceptual prop- erties remains to be discovered. Describing this mapping requires the development of an independent understanding and description of perceptual properties.
Relation to the Size-Weight Illusion
The research described in this article was intended to illus- trate a methodological paradigm for the study of perceptual properties. The paradigm uses a mundane task with a well- defined goal to guide intuition and the formulation of succes- sive research questions, as well as to provide a frame of reference for the interpretation of perceptual properties and for the evaluation, interpretation, and comparison of experi- mental results. The selection of a commonly performed mun- dane task provides some assurance that the task captures functional capabilities of the human perception and action systems (Brunswik, 1956; Gibson, 1966, 1979). A second reason for using commonly performed tasks is to control for ignorance of skill acquisition and potential variance due to levels of skill in performing tasks (Runeson, 1988).
In Experiments 1-4, the task of selecting, among objects varying in size and weight, optimal objects for throwing to a maximum distance was investigated partly as a means of placing the classic size-weight illusion result in the context of a commonly well-performed, mundane task. The well-known illusion result is that objects judged of equal apparent heavi- ness exhibit weight increases with increases in size. In the decades since this result was first obtained, much research has been performed in an effort to provide an explanation for the effect. No convincing account has been given.
Approaching the effect within the context of psychophysical scaling, Stevens and Rubin (1970) and Cross and Rotkin (1975) succeeded in providing a precise description of the scaling relation between the volumes and weights of objects perceived to be of equal apparent heaviness. ~ Our results from Experiment I were found to reproduce this scaling
relation within a comparable range of sizes and weights. However, we do not claim to have provided by means of our studies a comprehensive account for the size-weight illusion or for the extended set of scaling relations described by the psychophysicists. There are two reasons for this. First, the sizes and weights used in Experiments 1-4 corresponded only to a very restricted portion of the range of sizes and weights described by Cross and Rotldn (1975). Second, and more important, the problem being investigated in Experiments 1- 4 was very different from that investigated in size-weight illusion research. The difference lies in the functional context. Participants judged objects for optimal throwability. Not enough is known to be able to provide a definitive comparison of this task with the task of judging heaviness. More to the point, the task of judging heaviness per se is ill-defined and inadequately constrained for purposes of evaluation and com- parison.
An important property of the size-weight effect, as noted by Stevens and Rubin (1970) and Cross and Rotkin (1975), is that it occurs only within a limited range of weights. For example, in a study performed by Ross and DiLollo (1970), the effect was found to be extremely weak for weights in the range from .700 kg to .900 kg, although it was found to be quite strong for weights in the range from. 100 kg to ,300 kg. Stevens and Rubin observed that the effect has been known to be restricted to "small" weights since the 19th century (Wolfe, 1898) and that the restricted nature of the effect requires accounting in a model as much as the specific non- linear form of the relation itself. Stevens and Rubin surmised that lifting is the functional context implicit in references to small weights and that lifting ability constrains the range of weights for which the size-weight effect occurs.
Although these investigators referred to a functional context to account for the restricted range of weights over which the effect occurs, they did not refer to that functional context to account for the specific nonlinear relation between weight and volume exhibited in perceptual judgments. Would not "lifting" also constrain "heaviness" in this respect? In these investigations, the immediate functional context was an ex- perimental task in which the goal was to perform a judgment. Participants were instructed to perform a single heft or to lift each object for a second or two without holding, shaking, or tilting it. The goal was to judge "heaviness." The difficulty is that no functional context for "heaviness" was described explicitly for participants. The implicit context might have been to judge "heaviness" with respect to the task of judging "heaviness." However, because no specific instructions to this effect were provided, generic lifting might have acted equally well as the implicit context in heaviness judgments. Either circumstance creates problems. Judging heaviness to "judge heaviness" is at least odd, if not in some way paradoxical. Alternatively, the goal associated with "lifting" is ambiguous. The goal either is not constrained sufficiently to determine a particular task or is so constrained as to render a property
~ Stevens and Rubin (1970) and Cross and Rotkin (1975) did not report their findings in exactly this form, but they are subject to this interpretation without controversy.
526 G. P. BINGHAM, R. C. SCHMIDT, AND L. D. ROSENBLUM
perceived by hefting irrelevant. Lifts are performed in the context of myriad manipulat ion tasks that require a variety of different movement trajectories. Merely describing the task as lifting leaves the characteristics of the movement trajectory unconstrained with respect to amplitude, velocity, direction and contour of the path, as well as the orientation of the object being lifted. Technically, however, a lift has been performed as soon as the weight of an object is supported by the lifter. If "taking on an object's weight" is the intended goal, then the goal is accomplished either simultaneously with or before the detection by hefting of the information corre- sponding to heaviness. In this case, the information could not be used in the performance of the task and, so, is irrelevant. This is the paradox implicit in judging "heaviness" for "judg- ing heaviness."
Evaluating the relevance of heaviness, as a perceived prop- erty, to lifting, as an activity, is not possible. Word use cuts across functional contexts and a single word, such as lifting, does not describe adequately a particular task. Nor does heaviness denote adequately a unique perceptual property independent of the goal associated with a task to be per- formed. Because of the ambiguities associated with mappings between words and perceptual properties, evaluating or inter- preting heaviness and relating it to "optimal object for throw- ing to a maximum distance" is an ill-posed problem.
If, however, we restrict consideration to the Stevens and Rubin (1970) data or to the Cross and Rotkin (1975) data, we could compare, in principle, the resultant scaling relations and, on the basis o f this comparison alone, contrast the nature of the respective functional equivalences, that is, object of equal apparent heaviness versus object optimal for throwing to a maximum distance. Unless the latter equivalence is amended, a difference is immediately apparent. Only one weight in a given size can be optimal for throwing, whereas any weight in a given size can be equated to some weight in another size according to apparent heaviness. Equal apparent heaviness is a more open-ended relation. However, if the perceptual function used in judging optimality for throwing is of higher order scaling than ordinal, then functional equiv- alence with respect to throwing can be amended to a more open-ended form. If people can judge potential decrements in throwing performance according to departures of weight from that optimal for a given size, then judgments of relative optimality for throwing in each size could be elicited. A possible comparison between the more extensive scaling re- lations that would result and scaling relations from judgments of apparent heaviness must await further research.
Still, one might ask how the results from the current re- search could be at all comparable to those from the studies on apparent heaviness. The answer entailed by the approach taken in Experiments 3 and 4 is that the scaling relations are based on the same or on closely related dynamics. Different task-specific devices may overlap in the dynamic resources employed. Any task that involves grasping will require the use of the extrinsic muscles and tendons for the hand. Exactly how they are used will vary with the nature of the overarehing task. Nevertheless, one is forced to speculate that the dynamics of these structures are involved in a comparable fashion in both instances. More than this one cannot say.
Refe rences
Armstrong, T. J. & Chaffin, D. B. (1978). An investigation of the relationship between displacements of the finger and wrist joints and the extrinsic finger flexor tendons. Journal of Biomechanics, 11, 119-128.
Atwater, A. E. (1979). Biomechanics of overarm throwing movements and of throwing injuries. In R. S. Hutton, & D. I. Miller (Eds.), Exercise and sport sciences reviews V. 7 (pp. 43-85). Philadelphia: Franklin Institute Press.
Bingham, G. P. (1987a). Kinematic form and scaling: Further inves- tigations on the visual perception of lifted weight. Journal of Experimental Psychology: Human Perception and Performance, 13, 155-177.
Bingham, G. P. (1987b). Dynamical systems and event perception: A working paper. Parts I-Ill. Perception/Action Workshop Review, 2(1), 4-14.
Bingham, G. P. (1988a). A note on dynamics and kinematics, ISEP Newsletter, 3(a), 3-6.
Bingham, G. P. (1988b). Task specific devices and the perceptual bottleneck. Human Movement Science, 7(2-4), 225-264.
Bloch, E. H., & Iberall, A. S. (1982). Toward a concept of the functional unit of mammalian skeletal muscle. American Journal of Physiology, 242, R411-420.
Brancazio, P. J. (1984). Sport Science. New York: Simon & Schuster. Broer, M. R., & Houtz, S. J. (1967). Patterns of muscular activity in
selected sport skills. Springfield, IL: Charles C Thomas. Brunswik, E. (1956). Perception and the representative design of
psychological experiments. Berkeley, CA: University of California Press.
Cavagna, G. A. (1977). Storage and utilization of elastic energy in skeletal muscle. In R. S. Hutton (Ed.), Exercise and sport sciences reviews V.5. Santa Barbara, CA: Journal Publications Affiliates.
Chaffin, D. B., & Andersson, G. (1984). Occupational biomechanics. New York: Wiley.
Cross, D. V., & Rotkin, L. (1975). The relation between size and apparent heaviness. Perception & Psychophysics, •8(2), 79-87.
Dyson, G. H. G. (1962/1970). The mechanics of athletics. London: University of London Press.
Fowler, C. A., & Turvey, M. T. (1978). Skill acquisition: An event approach with special reference to searching for the optimum of a function of several variables. In G. Stelmach (Ed.), Information processing in motor control and learning. New York: Academic Press.
Gibson, J. J. (1966). The senses considered as perceptual systems. Boston: Houghton Mifflin.
Gibson, J. J. (1979). The ecological approach to visual perception. Boston: Houghton Mifflin.
Hay, J. G. (1978). The biomechanics of sport techniques. Englewood Cliffs, NJ: Prentice-Hall.
Hayes, K. C., & Hatze, H. (1977). Passive visco-elastic properties of the structures spanning the human elbow joint. European Journal of Applied Physiology, 37, 265-274.
Inman, V. T., & Ralston, H. J. (1968). The mechanics of voluntary muscle. In P. E. Kiopsteg & P. D. Wilson (Eds.), Human limbs and their substitutes (chapter 11, pp. 296-317), New York: Hafner.
J6ris, H. J. J., van Muyen, A. J. E., van Ingen Schenau, G. J., & Kemper, H. C. G. (1985). Force, velocity and energy flow during the overarm throw in female handball players. Journal of Biome- chanics, 18, 409-414.
Kay, B. A., Kelso, J. A. S., Saltzman, E. L., & Sch6ner, G. (1987). Space-time behavior of single and bimanual rhythmic movements: Data and limit cycle model. Journal of Experimental Psychology: Human Perception and Performance, 13, 178-192.
Kay, B. A., Munhall, K. G., Vatikiotis-Bateson, E., & Kelso, J. A. S.
HEFTING AND THROWING 527
(1985). A note on processing kinematic data: Sampling, filtering, and differentiation. Haskins Laboratories Status Report on Speech Research, SR-81, 291-303.
Kreighbaum, E., & Barthels, K. M. (1981). Biomechanics: A quali- tative approach for studying human movement. Minneapolis: Burg- ers.
Kugler, P. N., Kelso, J. A. S., & Turvey, M. T. (1980). On the concept of coordinative structures as dissipative structures: I. Theoretical lines of convergence. In G. E. Stelmach & J. Requin (Eds.), Tutorials in motor behavior(pp. 3-47). New York: North-Holland.
Kugler, P. N., & Turvey, M. T. (1987). Information, natural law, and the self-assembly of rhythmic movement: Theoretical and experi- mental investigations. Hillsdale, NJ: Erlbaum.
Lee, W. A. (1984). Neuromotor synergies as a basis for coordinated intentional action. Journal of Motor Behavior, 16, 135-170.
Napier, J. (1980). Hands. New York: Pantheon Books. Parker, G. W. (1977). Projectile motion with air resistance quadratic
in the speed. American Journal of Physics, 45, 606-610. Phillips, S. J., Roberts, E. M., & Huang, T. C. (1983). Quantification
of intersegmental reactions during rapid swing motion. Journal of Biomechanics, 16, 411-417.
Rasch, P. J., & Burke, R. K. (1978). Kinesiology and applied anatomy (6th ed.). Philadelphia: Lea & Febiger.
Ross, J., & DiLollo, V. (1970). Differences in heaviness in relation to density and weight. Perception & Psychophysics, 7, 161-162.
Runeson, S. (1977a). On the possibility of "smart" perceptual mech- anisms. Scandinavian Journal of Psychology, 18, 172-170.
Runeson, S. (1977b). On the visual perception of dynamic events. PhD Thesis, Department of Psychology, University of Uppsala, Uppsala, Sweden.
Runeson, S. (1988). Perceptual skills. Unpublished manuscript. Runeson, S., & Frykholm, G. (1983). Kinematic specification of
dynamics as an informational basis for person and action percep- tion: Expectation, gender recognition, and deceptive intention. Journal of Experimental Psychology: General, 112, 585-615.
Saltzman, E. (1979). Levels of sensorimotor representation. Journal
of Mathematical Psychology, 20, 91-163. Saltzman, E., & Kelso, J. A. S. (1987). Skilled actions: A task dynamic
approach. Psychological Review, 94, 84-106. Seto, W. W. (1964). Theory and problems of mechanical vibrations.
New York: McGraw-Hill. Solomon, Y., & Turvey, M. T. (1988). Haptically perceiving the
distances reachable with hand-held objects. Journal of Experimen- tal Psychology: Human Perception and Performance, 14, 404-427.
Stevens, J. C., & Rubin, L L (1970). Psycbophysical scales of apparent heaviness and the size-weight illusion. Perception & Psy- chophysics, 8, 225-230.
Timoshenko, S., & Young, D. H. (1948). Advanced dynamics. New York: McGraw-Hill.
Toyoshima, S., Hoshikawa, T., Miyashita, M., & Oguri, T. (1974). Contribution of the body parts to throwing performance. In R. C. Nelson & C. A. Morehouse (Eds.), Biomechanics IV (pp. 169-174). Baltimore, MD: University Park Press.
Turvey, M. T. (1977). Preliminaries to a theory of action with reference to vision. In R. Shaw & J. Bransford (Eds.), Perceiving, acting, and knowing (pp. 211-266). Hillsdale, NJ: Edbaum.
Turvey, M. T., Rosenblum, L. D., Schmidt, R. C., & Kugler, P. N. (1986). Fluctuations and phase symmetry in coordinated rhythmic movements. Journal of Experimental Psychology: Human Percep- tion and Performance, 12, 564-583.
Turvey, M. T., Shaw, R. E., & Mace, W. M. (1978). Issues in the theory of action: Degrees of freedom, coordinative structures and coalitions. In J. Requin (Ed.), Attention and performance VII (pp. 557-595). Hillsdale, NJ: Erlbaum.
Wells, D. A. (1967). Lagrangian dynamics. New York: McGraw-Hill. Winter, D. A. (1979). Biomechanics of human movement. New York:
Wiley. Wolfe, H. K. (1898). Some effects of size on judgments of weight.
Psychological Review, 5, 25-54. Zufiria, J. A., & Sanmartin, J. R. (1982). Influence of air drag on the
optimal hand launching of a small, round projectile. American Journal of Physics, 50, 59-64.
A p p e n d i x A
The following procedure was used to compute a power law relating volume to weight for equal apparent heaviness using data from Cross and Rotkin (1975). The power law was computed for a range of weights and volumes comparable to that used in Experiment 1. In the first step, log mean magnitude estimates of heaviness were re- gressed linearly on log volume for each weight used by Cross and Rotkin from 51 g to 6168 g. In the second step, the resulting formulas could be used to compute volumes corresponding to each weight for any particular single magnitude estimation value. In the third step, log values of the resulting volumes could be regressed linearly on log weights to derive the power law relating volume to weight for a particular value of equal apparent heaviness. However, the values of proportionality constants and exponents in this power law varied depending on the particular magnitude estimation value used in the second step of the derivation. For comparison with the hefting for throwing data, a magnitude estimation value was selected that pro- duced volumes for corresponding weights that were close to those used in our hefting experiments. This was accomplished as follows.
First, the volumes of the cuboc~hedrons were computed by ap-
proximation to spheres. Next, log mean preferred weights were re- gressed on log volumes producing a linear relation. Four of the weight values used by Cross and Rotkin were substituted into this relation, producing four corresponding volumes. The four weights used were those that were close to mean preferred weights in the hefting for throwing study. The four were 51 g, 92 g, 168 g, and 308 g. Returning to, the formulas derived in Step 1 above relating magnitude estima- tions of heaviness to volume, we found the magnitude estimation value producing volumes closest to those computed using the relation derived from our data. In this way, a magnitude estimation value of 2 was selected. In Step 2 above, volumes corresponding to the four weights from 51 g to 308 g were computed for an equal apparent heaviness estimate of 2. The resulting volumes were used to regress log volume on log weight. The power law relating volume to weight for an equal apparent heaviness of 2 was Weight = 4.08(Volume) 4° (r 2 = .985, p < .01). A magnitude estimate of t.5 produced an exponent of .42, whereas a magnitude estimate of 2.5 produced an exponent of .38.
A p p e n d i x B
Following the analysis in Saltzman (1979), the kinetic energy equation was developed in terms of generalized (angular) coordinates (see also Wells, 1967.) Equations describing the linear and angular
kinetic energies of each of the two segments, forearm and hand- object, were derived. Coefficients taken from Winter (1979) and from Chaffin and Andersson (1984) were used, together with anthropo-
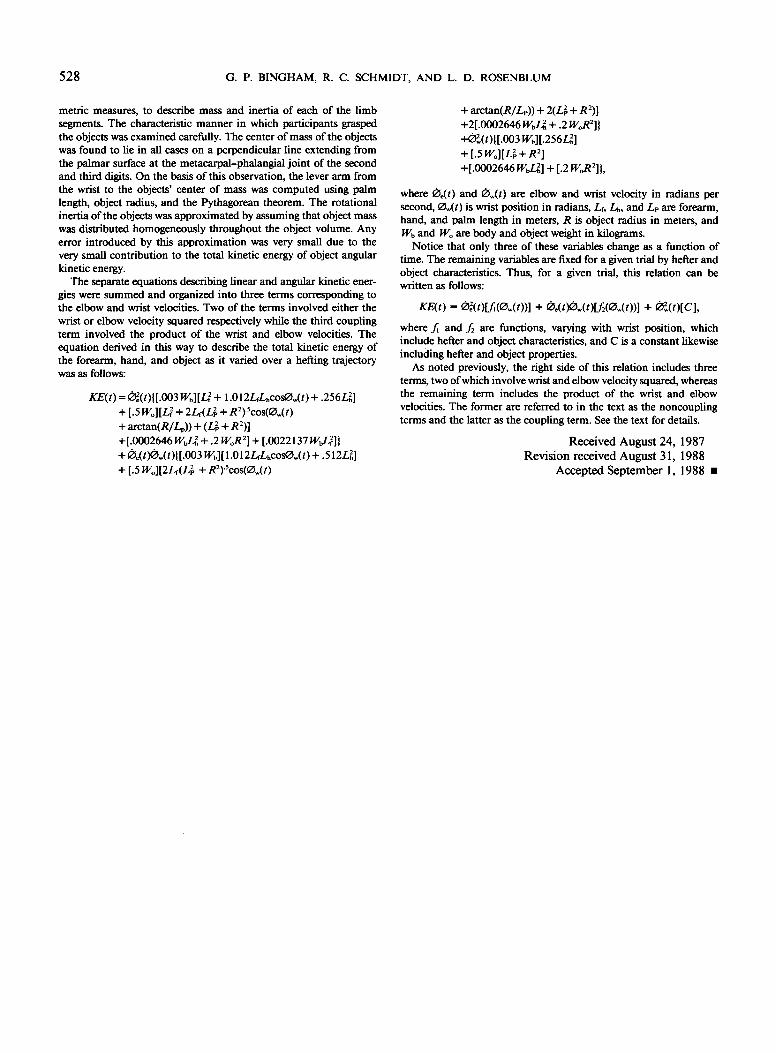
528 G . P . BINGHAM, R. C. SCHMIDT, AND L. D. ROSENBLUM
metric measures, to describe mass and inertia of each of the limb segments. The characteristic manner in which participants grasped the objects was examined carefully. The center of mass of the objects was found to lie in all cases on a perpendicular line extending from the palmar surface at the metacarpal-phalangial joint of the second and third digits. On the basis of this observation, the lever arm from the wrist to the objects' center of mass was computed using palm length, object radius, and the Pythagorean theorem. The rotational inertia of the objects was approximated by assuming that object mass was distributed homogeneously throughout the object volume. Any error introduced by this approximation was very small due to the very small contribution to the total kinetic energy of object angular kinetic energy.
The separate equations describing linear and angular kinetic ener- gies were summed and organized into three terms corresponding to the elbow and wrist velocities. Two of the terms involved either the wrist or elbow velocity squared respectively while the third coupling term involved the product of the wrist and elbow velocities. The equation derived in this way to describe the total kinetic energy of the forearm, hand, and object as it varied over a hefting trajectory was as follows:
KE(t) = ~(t){[.003 Wb][L 2 + 1.012LfLhcoS~(t) + .256L~] + [.5 Wo][L~ + 2Lf(L~ + R2)Scos(O~(t) + arctan(R/Lv)) + (L 2 + R2)]
+[.0002646 W~L~ + .2 WoR 2] + [.0022137 WbLf2] } + tDe(t)O~t )[ [.003 Wb][1.O12LfLhcosO~t) + .512L 2] + [.5 Wo][2Lf(L~, + R2)'Scos(Ow(t)
+ arctan(R/Lp)) + 2(L~ + R 2)] +2[.0002646 WbL 2 + .2 WoR2] I + ~ ( t )1[.003 Wb]I.256L 2] + [.5 Wol[L~ + R 21 +[.0002646 WJ~] + [.2 WoR2]},
where ~e(t) and ~w(t) are elbow and wrist velocity in radians per second, O~(t) is wrist position in radians, Lf, Lh, and Lp are forearm, hand, and palm length in meters, R is object radius in meters, and Wb and I¥o are body and object weight in kilograms.
Notice that only three of these variables change as a function of time. The remaining variables are fixed for a given trial by heifer and object characteristics. Thus, for a given trial, this relation can be written as follows:
KE(t) = ¢~(t)[f(O,(t))] + (~c(t)(?~w(t)[f2(C~(t))] + O2~(t)[C],
where f~ and f2 are functions, varying with wrist position, which include heifer and object characteristics, and C is a constant likewise including heifer and object properties.
As noted previously, the right side of this relation includes three terms, two of which involve wrist and elbow velocity squared, whereas the remaining term includes the product of the wrist and elbow velocities. The former are referred to in the text as the noncoupling terms and the latter as the coupling term. See the text for details.
Received Augus t 24, 1987 Revis ion received Augus t 31, 1988
Accepted Sep t ember 1, 1988 •