copy - defense technical information center technical report m-90/15 july 1990 us army corps u rll...
TRANSCRIPT

USACERL Technical Report M-90/15July 1990
US Army Corps u rLL COPY Automated Pavement Evaluationof EngineersConstruction EngineeringResearch Laboratory
AD-A224 176
AutoPAVER, a Software Package forAutomated Pavement Evaluation
byMark D. GinsbergM. Y. ShahinJeanette A. Walther
This research developed a method that improvesdata collection and reduces data entry times forPavement Condition Index (PCI) surveys for usewith PAVER, a pavement maintenance manage-ment system. The method, AutoPAVER, is amicrocomputer software package used to analyzepictures of pavement surfaces and to forward theD T ICresulting analysis to PAVER. The user works ELECTEinteractively with the system to identify and E E Tclassify pavement distresses. Distress measure- _JUL25 5 0ment apd data entry are done by the computer. D
)A
Approved for public release; distribution is unlimited.

The contents of this report are not to be used for advertising, publication,or promotional purposes. Citation of trade names does not constitute anofficial indorsement or approval of the use of such commercial products.The findings of this report are not to be construed as an official Depart-ment of the Army position, unless so designated by other authorizeddocuments.
DESTROY THIS REPORT WHEN IT IS NO LONGER NEEDED
DO NOT RETURN IT TO THE ORIGINATOR
REPORT DOCUMENTATION PAGE F.r ApprovedI OUB No. 0704-0188
Pubic repotng burden fr the colleion d inormuation is setimled to werage 1 hour per response, including the time for reviwirg instrudions. searding existing data souces.gathering and mointaining the dat needed, and corpleting and rwiswang the collection of informiation. Send comments regarding ths burden estimate or any other aspect d this
oi infoat including gestion for reducng this burden. to Washington Heedquatem Services. Diclorale tr information Operatione and Report. 1215 JeersmonDavis Highway, Suite 1204, Arlington. VA 222-4302. end to the Office of Managemnt and Budget. Paperwork Reduction Projlct (0704-0188), Washington, DC 205.
1. AGENCY USE ONLY (Leave Blank) 2. REPORT DATE REPORT TYPE AND DATES COVERED
July 1990 Final4. TITLE AND SUBTITLE 5. FUNDING NUMBERS
AutoPAVER, a Software Package for Automated Pavement Evaluation PR AT41
6. AUTHOR(S) TASK MBWU DA9
Mark D. Ginsberg, M.Y. Shahin, and Jeanette A. Walther7. PERFORMING ORGANIZATION NAME(S) AND ADORESS(ES) 8. PERFORMING ORGANIZATION
REPORT NUMBER
U.S. Army Construction Engineering Research Laboratory (USACERL) TR M-90/152902 Newmark Drive, PO Box 4005Champaign, IL 61824-4005
9. SPONSORINGMONITORING AGENCY NAME(S) AND ADORESS(ES) 10. SPONSORING/MONITORINGAGENCY REPORT NUMBER
U.S. Army Engineering and Housing Support CenterATTN: CEHSC-FB-PFort Belvoir, VA 22060
11. SUPPLEMENTARY NOTES
Copies are available from the National Technical Information Service, 5285 Port Royal Road,Springfield, VA 22161
12a. DISTRIBUTIOWAVAILABILITY STATEMENT 12b. DISTRIBUTION CODE
Approved for public release; distribution is unlimited.
13. ABSTRACT (Maximum 200 words)
This research developed a method that improves data COllection and reduces data entry times forPavement Condition Index (PCI) surveys for use with PAVER, a pavement maintenance managementsystem. The method, AutoPAVER, is a microcomputer software package used to analyze pictures ofpavement surfaces and to forward the resulting analysis to PAVER. The user works interactively with thesystem to identify and classify pavement distresses. Distress measurement and data entry are done by thecomputer.
14. SUBJECT TERMS 1 5. NUMBER OF PAGES
25AutoPAVERPAVER 16. PRICE CODE
Pavement condition index
17. SECURITY CLASSIFICATION 18. SECURITY CLASSIFICATION 19. SECURITY CLASSIFICATION 20. LIMITATION OF ABSTRACTOF REPORT OF THIS PAGE OF ABSTRACT
Unclassified Uaclassificd Unclassified SARNSN 7540-01-280-5500 Slerd Form 298 (Rv. 2-8
Preerbed by ANSI SW 239-1I2g6102

FOREWORD
This project was conducted for the U.S. Army Engineering and Housing Support Center (USAEHSC),under project 4A162731AT41, Task MB, Work Unit DA9, "Automated Pavement Evaluation/DynamicModeling of Pavement Performance/Maintenance Costs." Mr. Ken Gregg, CEHSC-FB-P, was theTechnical Monitor.
The work was performed by the Engineering and Materials (EM) Division, U. S. Army ConstructionEngineering Research Laboratory (USACERL). The USACERL Principal Investigator was Dr. M. Y.Shahin. Dr. Paul A. Howdyshell is Acting Chief of the EM Division. The USACERL Technical Editorwas William J. Wolfe, Information Management Office.
COL Everett R. Thomas is Commander and Director of USACERL, and Dr. L.R. Shaffer is TechnicalDirector.
2

CONTENTS
Page
SF 298 1FOREWORD 2
1 INTRODUCTION ................................................. 5BackgroundObjectivesApproachMode of Technology Transfer
2 IMAGE-PROCESSING TECHNOLOGY ................................. 7Terminology for Image ProcessingImage-processing HardwareClassifying AlgorithmsPoint ProcessesArea ProcessesNonlinear Area ProcessesPattern and Object IdentificationGeometric ProcessesFrame Processes
3 AUTOPAVER FEATURES .......................................... 15AutoPAVER Menu OptionsUsing AutoPAVER
4 CONCLUSIONS .................................................. 20
DISTRIBUTION
Acoession For
NTIS GRA&I
DTIC TABUnannouneedJusti icatio
ByDistribution/
s ._.Availability Codes
I
I
II 1 I I AveIfi / o I r IIIIIII
Dist Speolal
3

AUTOPAVER, A SOFTWARE PACKAGE FORAUTOMATED PAVEMENT EVALUATION
1 INTRODUCTION
Background
PAVER' is a field-tested and validated pavement maintenance management system for use bymilitary installations, U.S. Army Corps of Engineers (USACE) Districts, airports, and civilianmunicipalities. PAVER is designed to optimize the allocation of funds for pavement maintenance andrepair. PAVER's key component is the Pavement Condition Index (PCI), an objective rating of pavementcondition based on the quantity and severity of observed distress. The PCI provides a consistent measureof a pavement's structural integrity and operational condition.
Information about a pavement's condition is usually gathered by someone who must view thepavement, determine which distresses are present, measure the size of the affected area, and record allinformation for later use by PAVER. This process is the most time consuming part of using the PAVERsystem. In order to accumulate accurate data, a field crew must travel to the site and cordon off the areafor painstaking measurements. Traffic must be routed around the inspection area. The crew must visuallyinspect the affected areas, classify the pavement damage, and, using a tape measure, gauge the exactdimensions of each distress. If the pavement is cracked, the crew categorizes the type of crack andmeasures the length and width of the cracked area. Other types of distresses demand different types ofmeasurement. Holes, for instance, require measurements for subsequent computation of surface area. Theprocess as a whole is not only slow and cumbersome, but physically dangerous to the crew, since it mustwork adjacent to the flow of traffic. A method is needed to improve the efficiency of data collection andto reduce data entry times for PCI surveys.
Objectives
The objectives of this work were: (1) to develop a microcomputer software package that analyzespictures of pavement surfaces and forwards the resulting information to PAVER, (2) to describe howimage processing can be implemented in pavement analysis, and (3) to describe the capabilities ofAutoPAVER by outlining its user interface.
'M. Y. Shahin, K. A. Cation, and M. R. Broten, Pavement Maintenance Management: the Micro Paver System, Technical ReportM-87/12/ADA187360 (U.S. Army Construction Engineering Research Laboratory [USACERL], July 1987); D. R. Uzarski andR. C. Soule, The Practical Use of PA VER in Planning, Programming, and Developing Projects for Pavement Maintenance andRepair, Technical Report M-86/04/ADA167312 (USACERL, March 1986); M. Y. Shahin and S. D. Kohn, Overview of the"PAVER" Pavement Management System and Economic Analysis of Field Implementing the "PAVER" Pavement ManagementSystem, Technical Manuscript M-310/ADA1I6311 (USACERL, January 1982).
5

Approach
AutoPAVER simplifies the workload of gathering and transmitting data to the PAVER program.Pavement sections are photographed and the photos are then fed into an image-processing system. Theuser works interactively with the software program by categorizing pavement damage, and then byidentifying and outlining pavement distresses in the screen image. AutoPAVER uses sophisticatedalgorithms to measure the user-defined distresses and then performs the necessary data entry.
Mode of Technology Transfer
AutoPAVER will be made available to PAVER users through U.S. Army distribution centers.
6

2 IMAGE-PROCESSING TECHNOLOGY
Image processing is the science of modifying and analyzing pictures. The basic goals of imageprocessing include enhancement or modification of an image to improve its appearance or highlightinformation, measurement of image elements, classification or matching of image elements, andrecognition of items in an image.
AutoPAVER relies on image-processing techniques to help analyze and transform an image intouseful PAVER information. Image processing is performed using step-by-step procedures calledalgorithms. These algorithms are often implemented using computers that are flexible and have relativelylow processing and memory costs. The algorithms are expressed as, and become nearly synonymous with,programs for the computer. An algorithm can specify operations such as how to acquire the image.Special image-processing hardware often supplements the computer.
Terminology for Image Processing
Before discussing the details of image processing, it is important to provide a frame of reference withrespect to the terminology used in this report. Because so many branches of science have used imageprocessing independently, people have invented many different terms that describe the same ideas. Thisreport describes applications of computer-assisted image processing using terminology from the computerscience and electrical engineering disciplines.
Image-Processing Hardware
AutoPAVER requires electronic equipment suitable for acquiring, processing, and displayingmonochrome images. The necessary hardware consists of a camera, a frame grabber (a digitizing circuitwith a section of computer memory dedicated to holding an image), a computer that can access imagememory, and a video monitor to display the contents of the memory (i.e., the picture being processed).
The digitizing circuit places a camera image into the image memory. This process involves digitizinga video frame by breaking it into an array of digital intensity values called pixels (short for "pictureelements"). If the image is already represented as pixels, as in a computer graphic, image acquisitionconsists of simply moving the image from disk to the image memory.
The computer reads and writes information in image memory. The display device reads imagememory and shows a representation of it. An entire video image stored in image memory is often calleda "frame buffer" or "frame store." The most common frame size is derived from the National TelevisionStandard for Color (NTSC) which results in a frame size of 512 by 480 pixels.
Most low cost computers work with data that is represented by eight bits (binary digits). ForAutoPAVER, each pixel has an eight-bit byte, which yields 2' (256) different shades of gray. Zerorepresents black, 255 represents white, and all the shades of gray fall in the range between zero and 255.
The computer manipulates the pixels in the image memory. The display device converts processedpixels back into spatially organized image intensities. This display device is usually a digital-to-analog(D/A) converter that drives a monochrome or color television monitor.
7

The computer used to develop and run AutoPAVER is an 80386 personal computer, fitted with anEGA monitor. The second monitor, used for graphics viewing and enhancement, is a Sony PVM-1271Q.The frame grabber is Image Technology Inc.'s PC Vision Plus, and the camera used is a Sony X6-57(CTD). It is worth noting that the CCD (Charge Coupled Device) feature suits a camera to this type ofresearch, since it allows an image to be viewed on a computer monitor for a great length of time withoutthe danger of "burning the image" permanently into the screen display. The pointing device used in thisstudy is a Microsoft Mouse.2
Classifying Algorithms
Image-processing algorithms can be classified in several ways. If an algorithm changes a pixel'svalue, it is called a "point process." If the algorithm changes a pixel's value based on the values of thatpixel and neighboring pixels, it is called an "area process." If the algorithm changes the position orarrangement of the pixels, it is called a "geometric process." Algorithms that change pixel values basedon a comparison of two or more images are called "frame processes" (because individual video imagesare called "frames").
Image measurement is based on some broad assumptions about what items will appear in the picture.Classification of objects is relatively simple; recognition requires more knowledge (and assumptions) aboutwhat can appear in an image. For example, the number of pixels in an image of pavement within a certainrange of values can simply be counted. If it is known that bleeding asphalt corresponds to these values,the image can be classified into bleeding and nonbleeding areas. If the machine is provided with furtherknowledge about the structure of bleeding asphalt, it might be able to recognize these areas in the image.Color may also be used to highlight the recognized areas.
Based on this classification framework and the AutoPAVER hardware, some example algorithms willbe described. These examples are not necessarily exhaustive; they are intended only to facilitate anunderstanding of the image-processing options for this technology.
Point Processes
A point process algorithm scans through the image area using the pixel value at each point tocompute a new value at that point.
Optical Negative
To produce the photographic negative of an image, the computer is programmed to take each pixelvalue f (0 <= f <= 255) and replace it with g (g = 255 - f).
Brightness
Point processes also can be used to enhance or modify pixel values. For example, adding 40 to eachpixel value brightens the image and could improve the picture's appearance.
If the pixel value and its location are used, then a point process can be used to correct shading orsmoothly change pixel values in an image area. Shading is an image artifact caused by slow spatial shifts
"Microsoft is a registered trademark of the Microsoft Corp, Redmond, WA.
8

in scene lighting or camera bias and sensitivity. A point process that computes the inverse of a shadingfunction can eliminate or correct much of this shading.
By smoothly changing the pixel values in an area, the contrast of areas can be highlighted oradjusted. This function can produce results similar to the photographic darkroom techniques of burningand dodging (methods of adjusting local contrast).
Histogram Stretching
To calculate an "intensity histogram," the number of times a particular pixel value occurs in an imageis counted. Using AutoPAVER hardware based on eight-bit pixels, 256 pixel values are possible. Animage can be scanned and the number pixels with a given value counted. The result can be stored as oneentry in a 256 place table. Such a table is called a "histogram."
The histogram is a type of image measurement. Because it examines a single pixel at a time, thehistogram is the result of a point process that leaves the pixel's value unchanged.
Information provided by the histogram is useful for image enhancement and classification. If allpixel values are bunched in a small range (making the picture appear featureless), this information can beused to improve image contrast. Starting at intensity zero, the histogram can be searched for the first pixelvalue with more than a specified number of pixel counts. One might choose a value occurring in onlya small area of the screen, say 30. Next, a similar search is performed starting at the highest pixel value.The region of the histogram between these two (low and high) values accounts for most of the pixels inthe image. Then a point process is performed that sets pixel values below the low value to zero and abovethe high value to 255. This is sometimes called a "histogram clip." The pixels with intermediate valuesare adjusted so that they span the range of zero to 255.
Histogram stretching is a simple form of contrast enhancement. Note that the image has lost someinformation--the pixel values below the low value and above the high value have been set to constants.In general, image-processing operations lose some information in return for selecting or accentuating otherinformation.
Notice that the histogram stretching algorithm uses three simpler algorithms: a histogram, ahistogram clip, and a point process. Most algorithms are compounds of other algorithms. Therefore, theprogram writer must know which algorithms to apply and in what order to apply them to reach aprocessing goal.
Pseudocoloring
Pseudocoloring of a monochrome image is another example of a point process. In this case, the pixelvalue is the argument (input) for three different functions, and the output of these functions drives the red,green, and blue guns of a color monitor. This process allows a monochrome image to be colored bysubstituting any color for a particular shade of gray. Using eight-bit pixels, 256 colors can be displayedat once.
Area Processes
An area process uses information from neighboring pixels to modify pixel values or assert theexistence of some property of the neighborhood. Area processes can generate a wide range of effects:spatial filtering (such as filtering out repeated elements), changing an image's structure, or "sharpening"the image's appearance by accentuating intensity changes. Other effects include: finding objects by
9

matching images, measui:,g image properties, making assertions about object edges in the image,
removing noise, and hl- rnng or smoothing the image.
Convolution
Convolution is a classic image-processing algorithm commonly used for spatial filtering and findingima-e features. Since convolution requires many repeated calculations, and hence a great deal of computermemory, some subtle implementation issues must be considered.
The convolution operation replaces a pixel's value with the sum of that pixel's value plus those ofits neighbors, each weighted (multiplied) by a factor. The weighting factors are called the "convolutionkernel." The programmer labels the image points p (i, j) and the kernel (weighting) points k (x,y), wherex and y range over values representing the relative placement of neighboring pixels.
Choose, as an example, a neighborhood consisting of a pixel plus its immediate eight neighbors (left,right, up, down, and diagonals). Label the center pixel as p (1,1). This center pixel is replaced by thelinear sum of its neighbors times their respective weighting factors, k.
p(l,1) = p(0,0) x k(0,0) + p(1,0) x k(1,0) + p(2,O) x k(2,0) [Eq 11
+ p(0,1) x k(0,1)+ p(l,1) x k(l,l)+ p(2,1) x k(2,1)
+ p(0,2) x k(0,2) + p(1,2) x k(1,2) + p(2,2) x k(2,2)
To convolve an image, this operation is repeated at every pixel position in the image. This processis like sliding a kernel matrix over each row of pixels in the image matrix, and at each point, multiplyingthe kernel values with the image value "under" it, summing the result, and then replacing the pixel at thecenter of the kernel with that value. The equation then becomes:
p(i, j) = p(i-1, j-l) x k(0,0) + p(i, j-l) x k(l,0) + p(i+l, j-l) x k(2,O) [Eq 21
+ p(i-l, j) x k(O,1) + p(i, j) x k(l,l) + p(i+l, j) x k(2,1)
+ p(i-1, j+l) x k(0,2) + p(i, j+l) x k(1,2) + p(i+l, j+l) x k(2,2)
Implementation Issues
There are several interesting issues to be met here: Convolving an area of size X by Y with a kernelof size N by M requires X x Y x N x M multiplications and additions. Thus, a 512 by 480 image witha three by three kernel requires 2,211,840 multiplication/addition operations; this process can take a longtime on a computer without fast multiplication hardware.
If the kernel is scanned over the image and replaces only the value under the center of the kernelat a given position, what happens to the edges of the image? For example, with the three by three kernel,a one-pixel border (box) is left around the image where pixels are not replaced. The convolution willalways leave a border of "garbage" equal to half the kernel size around the image. This border of garbagemay be ignored, set to zero, or have the nearest meaningful value copied into it.
10
The convolution on any pixel could result in a value larger than can be held in a pixel--possibly aslarge as the number of kernel elements times the number of bits in a pixel. In the generic systemdescribed previously, for example, that would be 3 x 3 x 256 = 2304, for which 12 bits per pixel wouldbe needed--but there are only eight bits per pixel. Enough accuracy in the calculations must be kept toallow for this range. The convolution result can be scaled (e.g., each result divided by two) if it is to goback into the image memory.
In a related issue, kernel values, and therefore the convolution output, can be positive or negative.Negative intensity is mathematically useful, but since the program only recognizes values between zeroand 255, negative intensities will not generate a screen display. The option to modify the convolutionoutput desired to allow only positive, negative (negated to positive values), absolute values, or signedvalues as output. This also means that an additional sign bit must be kept in the calculations. Thus, foreight-bit pixels and a three by three kernel, 12 bits for the sum and an additional bit for the sign areneeded.
Convolution itself is relatively simple, but the implementation issues complicate it. Unfortunately,this condition is true of most image-processing algorithms. For example, the issues of internal accuracyand what to do at the edge of the image appear in most other area processes. Any useful program mustaddress these issues to implement and use the algorithms effectively.
Matched and Spatial Filters
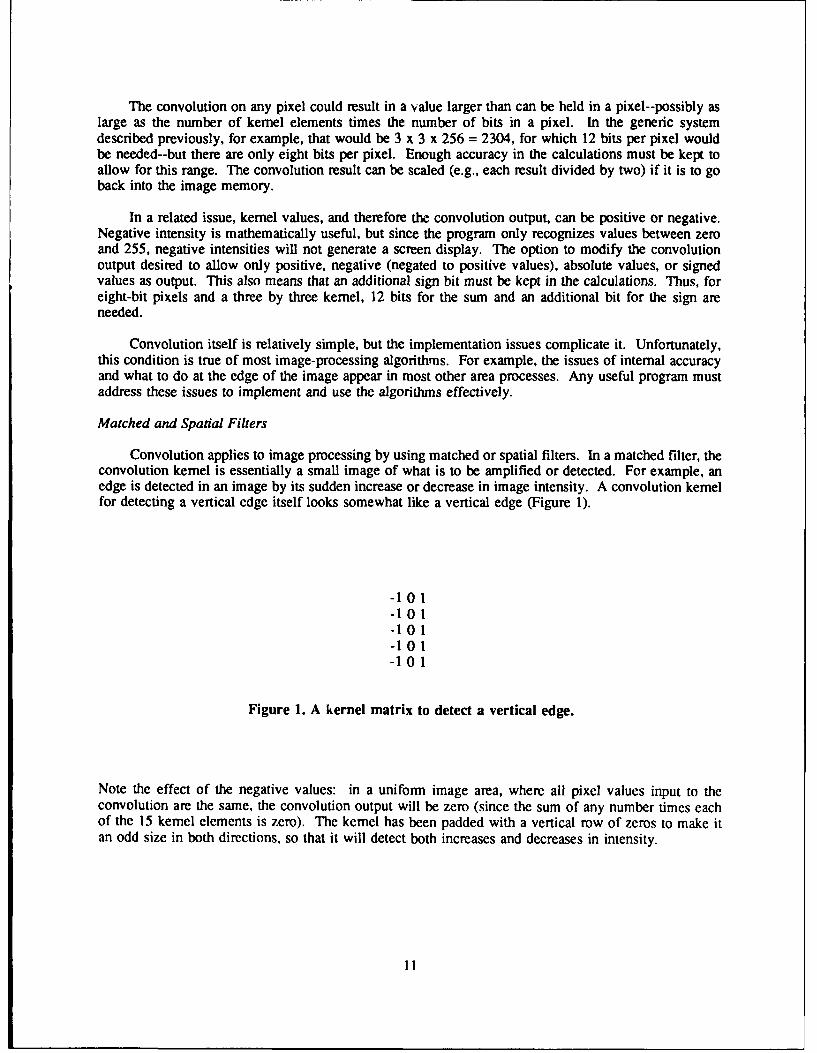
Convolution applies to image processing by using matched or spatial filters. In a matched filter, theconvolution kernel is essentially a small image of what is to be amplified or detected. For example, anedge is detected in an image by its sudden increase or decrease in image intensity. A convolution kernelfor detecting a vertical edge itself looks somewhat like a vertical edge (Figure 1).
-101-101-101-101-101
Figure 1. A kernel matrix to detect a vertical edge.
Note the effect of the negative values: in a uniform image area, where all pixel values input to theconvolution are the same, the convolution output will be zero (since the sum of any number times eachof the 15 kernel elements is zero). The kernel has been padded with a vertical row of zeros to make itan odd size in both directions, so that it will detect both increases and decreases in intensity.
11
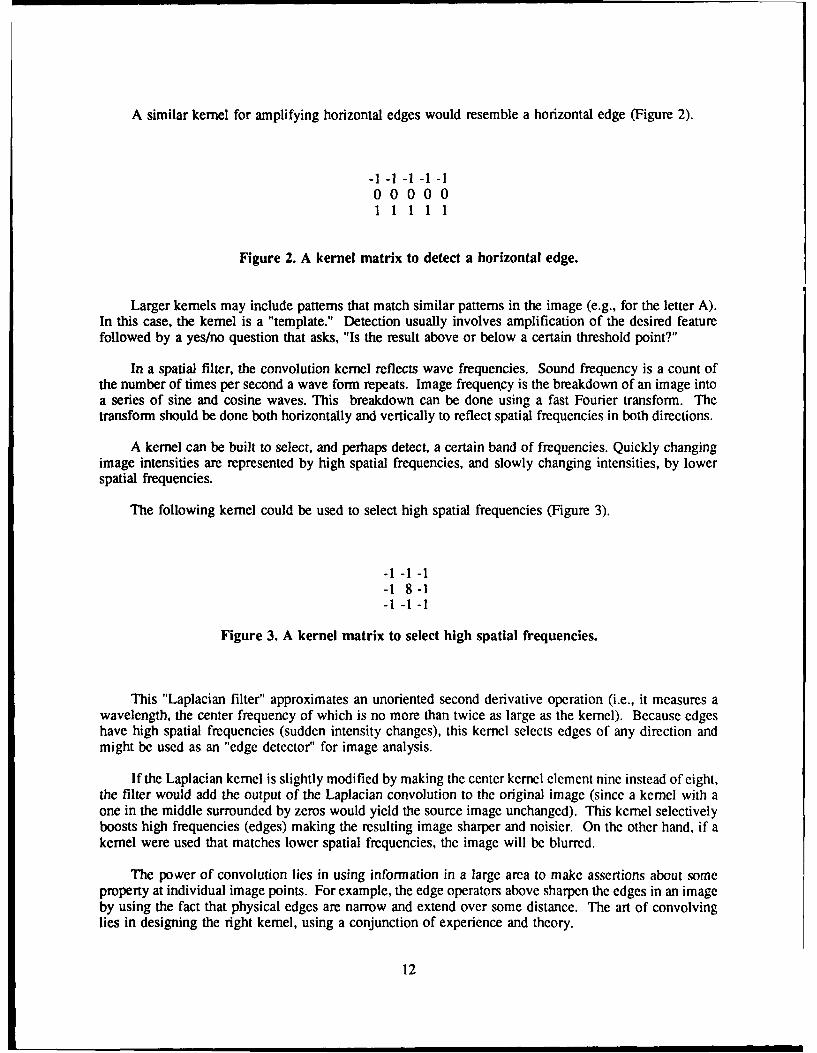
A similar kernel for amplifying horizontal edges would resemble a horizontal edge (Figure 2).
-1 -1 -1 -1 -1000001 1 1 1 1
Figure 2. A kernel matrix to detect a horizontal edge.
Larger kernels may include patterns that match similar patterns in the image (e.g., for the letter A).In this case, the kernel is a "template." Detection usually involves amplification of the desired featurefollowed by a yes/no question that asks, "Is the result above or below a certain threshold point?"
In a spatial filter, the convolution kernel reflects wave frequencies. Sound frequency is a count ofthe number of times per second a wave form repeats. Image frequency is the breakdown of an image intoa series of sine and cosine waves. This breakdown can be done using a fast Fourier transform. Thetransform should be done both horizontally and vertically to reflect spatial frequencies in both directions.
A kernel can be built to select, and perhaps detect, a certain band of frequencies. Quickly changingimage intensities are represented by high spatial frequencies, and slowly changing intensities, by lowerspatial frequencies.
The following kernel could be used to select high spatial frequencies (Figure 3).
-1 -1 -1-1 8 -1-1 -1 -1
Figure 3. A kernel matrix to select high spatial frequencies.
This "Laplacian filter" approximates an unoriented second derivative operation (i.e., it measures awavelength, the center frequency of which is no more than twice as large as the kernel). Because edgeshave high spatial frequencies (sudden intensity changes), this kernel selects edges of any direction andmight be used as an "edge detector" for image analysis.
If the Laplacian kernel is slightly modified by making the center kernel element nine instead of eight,the filter would add the output of the Laplacian convolution to the original image (since a kernel with aone in the middle surrounded by zeros would yield the source image unchanged). This kernel selectivelyboosts high frequencies (edges) making the resulting image sharper and noisier. On the other hand, if akernel were used that matches lower spatial frequencies, the image will be blurred.
The power of convolution lies in using information in a large area to make assertions about someproperty at individual image points. For example, the edge operators above sharpen the edges in an imageby using the fact that physical edges are narrow and extend over some distance. The art of convolvinglies in designing the right kernel, using a conjunction of experience and theory.
12

Nonlinear Area Processes
Convolution is relatively easy to implement, use, and analyze because it is a linear operation: itrequires only sums of first degree products. Nonlinear operations, while a bit more difficult, are alsouseful and can be more powerful than a convolution. "Powerful" means either that they provide a bettersignal-to-noise ratio for detecting image elements or that they can detect features with less computation.Consider the following two examples of nonlinear area processes.
Sobel Filtering
A Sobel filter compares the result of two convolutions. The first convolution computes the degreeto which an edge is oriented in the X direction, while the second computes the same for the Y direction.Simple trigonometry is used to estimate the strength and orientation of edge. The two kernels, X and Y,are shown in Figure 4.
-1 01 121X: -2 0 2 Y: 0 0 0
-1 0 1 -1-2-1
Figure 4. Sobel filter kernel matrices.
Thus, the edge strength and orientation are represented by:
Strength = sqrt(X2 + y 2) [Eq 3]
Orientation = arctan (Y/X)
This is a first derivative (oriented) edge finder, and the vector field it produces cannot be directlyshown on a two dimensional image. The Sobel is a good edge detector and is frequently used as the firststep in machine-vision algorithms. Because the Sobel algorithm uses a lot of computer memory, variousapproximations have been developed to implement it.
Median Filtering
A median filter replaces the pixel at the center of a neighborhood of pixels with the median ofthe neighborhood pixel values. The neighborhood values, including the center pixel, are sorted intoascending order, and the median (middle) value is used to replace the center pixel. The effect of a medianfilter is to remove spot and low level noise while retaining larger scale image features.
Pattern and Object Identification
Before it can classify image elements, the computer must first contain a definition of "imageelement." This definition can be elaborate, but a simple example will suffice: an element is a connectedgroup of pixels. A "connected" pixel has the same value as a neighbor at 0, 90, 180, or 270 degrees.
13
To simplify the computation, the image can be "binarized"; that is, all pixel values above zero andbelow 255 can be converted. This is often done in machine vision since the process can control thelighting and objects in the image. The image is searched from top to bottom to locate elements with morethan N (number of) connected pixels. The specified minimum of N pixels, eliminates the small spots ofnoise introduced by thresholding. Each element is labeled by changing its pixel value to a predeterminednumber. The number of pixels in an element can also be recorded for further classification.
Geometric Processes
Geometric processes change the spatial arrangement of pixels. They are often used to correct fordistortions caused by camera optics or viewpoint. They also can enlarge a particular image area. Typicalgeometric processes rotate, stretch, and translate the image position. Other geometric processes can warpthe image. Geometric algorithms can be expressed by a set of equations (a matrix) that maps a pixel atlocation x,y into a new address x',y'. For example, to rotate a square area clockwise by 90 degrees, thepixels are mapped by the following equation.
x'=(512- 1)-y; y'=x [Eq 41
Because digital pixels are oriented in a strict checkerboard pattern, most geometric transforms arefound to have gaps between the output pixels. If source pixels are placed in the destination area accordingto the transformatiop equations, the exact placement in the output image is rarely an integer. (This is oneproblem with digitized images that never occurs in continuous tone images such as photographic prints.)
Frame Processes
Algorithms that use more than one image are sometimes called "frame processes." A simpleexample is to subtract one image from another. The resulting differences can be used to compare the twoimages (e.g., to look for missing parts on a machine or circuit board, or to look at the same piece ofpavement photographed several years apart to see the progression of damage). Frame processes can alsobe used to improve image quality and to detect motion.
If a television camera views a still object, a predefined number (N) of successive image framescan be summed to reduce noise introduced by the camera. This process requires a frame memory withenough bits per pixel to accommodate the sum. Dividing the sum by N produces an averaged image. Ifthe noise is not correlated from frame to frame, the improvement in signal to noise will be of the ordersqrt(N). A typical low cost video camera has about three bits of noise, so that averaging with an N ofeight or 16 will noticeably improve the image.
14

3 AUTOPAVER FEATURES
AutoPAVER Menu Options
AutoPAVER includes a menu driven interface to guide the user through its various functions.Upon invoking AutoPAVER, the user sees a Main Menu bar across the top of the screen containing theeight Main Menu commands: PICTURE, LUTS, FILTERS, CONVOL, VIDEO, AUTOPAVER,MACROS, and CONFIG. By placing the mouse pointer on any one of the main menu commands anddepressing and holding the mouse button, the user calls a pop up window that extends downward fromthe selected main menu entry, and that lists the submenu elements for that main menu command. Bydr r- Ing the mouse pointer to the appropriate command and releasing the mouse button, the user selectsIL,,,ant AutoPAVER operations. Table I shows each Main Menu command with its correspondingsubmenu.
Table 1
Main and Submnenu Commands
PICTURE LUTS FILTERS CONVOL VIDEO AUTOPAVER MACROS CONFIG
Quadrant P Pseudocolor High Puas Sharpen Offset/Gain AP Load Load Save Global
Load M Paeudocolor Low Pass Average Vertical Wedge AP Save Save Save Local
Save Negative Band Pass Horizontal -lorzenial. Wedge AP Save As Save As Read Global
Save As Hist Stretch Band Cut Laplacian Upaide down Send Watch Me Read Local
Print Hist Plot Binarize Lap4 Grab Send To Play Back Read Path
Quit Brighten Reatore Median Snap Change Pvmnt Picture Path
About AutoPAVER Dim Edge Clear Sheet AutoPAVER Path
Unify Sobel Dimensions PAVER Path
Linearize PAVER Tools Macro path
Drawing Tools
The following section lists the AutoPAVER menu options with a brief descriptionof each.
PICTURE
About AutoPAVER - Lists program's developers and gives point of contact.
Quadrant - Menu to choose which quadrant that "Unify" and CONVOL will modify.
Load - Menu to load picture from disk.
Save - Saves picture to disk in picture file last used.
15

Save As - Saves picture to disk under a new name.
Print - Sends picture to printer. Currently supports Epson-FX, which is a two color printer.Consequently it is best to use Binarize to adjust how the picture will look and then Unify to changeframe store before printing.
Quit - Prompts to leave program.
LUTS (Changes Look Up Tables only)
P Pseudocolor - One method of pseudocoloring. Use Horizontal Wedge or Vertical Wedge to explorehow this works.
M Pseudocolor - A second method of pseudocoloring. Use Horizontal Wedge or Vertical Wedge to
explore how this works.
Negative - Produces an optical negative.
Hist Stretch - Histogram Stretch (explained above in section 2) causes overall picture to have bettercontrast.
Hist Plot - Posts up histogram of current quadrant of the screen in the current quadrant of the screen.This is arranged from zero (black) on the left to 255 (white) on the right.
Brighten - Increases all gray values.
Dim - Decreases all gray values.
Unify - Copies LUTS values onto frame store (includes filter effects).
Linearize - Clears LUTS tables to normal black and white.
FILTERS (Changes look up tables only)
High Pass - Leaves whiter values (above adjustable cutoff) untouched and maps darker values ontochosen replacement color.
Low Pass - Leaves darker values (below adjustable cutoff) untouched and maps lighter values ontochosen replacement color.
Band Pass - Leaves middle gray levels (between adjustable cutoffs) untouched and maps higher andlower values onto replacement color.
Band Cut - Leaves extreme gray levels (outside adjustable cutoffs) untouched and maps middle levels
onto replacement color.
Binarize - Forces all colors (either side of adjustable cutoff) to be mapped to black and white.
Restore - Removes filter effects.
16

CONVOL (Convolutions)
Sharpen - Causes image to appear sharper by local contrast stretching. (User selects degree ofstretching.)
Average - Causes image to appear fuzzier (or less noisy) by local contrast averaging.
Vertical - Vertical edge detector. Leaves bright areas near vertical edges and darkens other areas.
Horizontal - Horizontal edge detector. Leaves bright areas near horizontal edges and darkens otherareas.
Laplacian - Edge detector approximates the magnitude of the second derivative.
Lap4 - Edge detector sensitive to horizontal and vertical edges. An alternate form of Laplacian.
Median - Takes median of pixel neighborhood (user selectable).
Edge - Edge detector approximates result from Sobel kernel (below) only faster
Sobel - Commonly used edge detector. Leaves thick indication lines thereby allowing easiersegmentation of the image.
VIDEO
Offset/Gain - Allows user adjustment of offset and gain of the camera. (Offset and gain are analogousto the brightness and contrast knobs of a television set.)
Vertical wedge - Standard test pattern.
Horizontal wedge - Standard test pattern
Upside down - Turns image upside down.
Grab - Continuous view from camera.
Snap - Snaps a picture with the camera.
AUTOPAVER
AP Load - Menu to load AutoPAVER analysis file.
AP Save - Saves AutoPAVER analysis file under analysis file name last used.
AP Save As - Prompts for name of file and store AutoPAVER analysis.
Send - Sends PAVER data to filename last used.
Send To - Selects new filename and send PAVER data to that file.
17

Change Pvmrit - Toggles pavement type (asphalt/concrete).
Clear Sheet - Clears all analysis previously drawn by user.
Dimensions - Sets the dimensions of the image in the video screen.
PAVER Tools - Posts the PAVER distress types for current pavement type.
Drawing Tools - Posts up the various drawing tools.
MACROS (For often repeated operations.)
Load - Menu to select macro file.
Save - Saves current macro set to macro file last used.
Save As - Prompts user for macro file name and save current macros there.
Watch Me - Starts macro recording.
Play Back - Repeats a macro.
CONFIG
Save Global - Saves the current configuration to the global configuration file (i.e., the configurationused when AutoPAVER is executed from any drive or directory other than those with a localconfiguration).
Save Local - Saves the current configuration to the local configuration file (i.e., the configuration used
when AutoPAVER is executed from that particular drive/directory).
Read Global - Loads the global configuration file.
Read Local - Loads the local configuration file.
Picture Path - Selects drive and path where picture files are kept.
AutoPAVER Path - Selects drive and directory where AutoPAVER analysis files are kept.
PAVER Path - Selects drive and path where PAVER data files kept.
Macro Path - Selects drive and path where macro files are kept.
Using AutoPAVER
The AutoPAVER system has the appearance and simplicity of a coloring book. The system requirestwo video displays, one for the AutoPAVER menu interface, and the other for the graphic display ofpavement. On the first screen, the user selects commands and AutoPAVER operations that will affect thevideo display on the second screen. When the user slides the mouse pointer past the edge of the menu
18

screen, the pointer reappears on the graphics screen. In this way, the user travels between the two screens,using the mouse pointer in the program screen to select commands, and then in the graphic screen, tooutline distressed areas of the displayed section of pavement. The user views a photograph of a pavementsection on the graphics monitor, indicates to the system what type of pavement distress appears in thepicture, and marks the distress (on the video screen) with a pointing device (i.e., a mouse). The systemperforms all numerical calculations and automatically forwards this information to PAVER. The usermakes no numerical measurements or calculations, and needs no manual numerical record keeping.
Using the CONFIG submenu, the user must enter the following information into AutoPAVER inorder for the system to be properly configured:
1. The base memory address of the frame grabber2. The base I/O address of the frame grabber3. The picture drive/directory4. The AutoPAVER analysis drive/directory5. The PAVER data drive/directory6. The Macro file drive/directory.
One subtlety in using AutoPAVER is that sometimes the data which makes up the frame buffer (howthe computer sees the picture) is different than that which is shown on the data analysis screen. Wheneverthis happens, there will be a warning indicator on the second line of the computer screen.
Many times this is a desirable situation. It helps user to "try out" certain ways of displaying the datawithout changing the frame buffer. To delete the warning indicator, simply use the mouse pointer toclick on the warning indicator icon, and a computer will prompt to change the frame buffer from the waythe screen looks to a simple display of the frame buffer as the computer sees it (e.g., "Change FrameBuffer?"). Simply choose which display you want and the computer will take care of the rest.
19
4 CONCLUSIONS
A microcomputer software package, AutoPAVER, was developed that analyzes pictures of pavementsurfaces and forwards the resulting information to the PAVER pavement management system.AutoPAVER accomplishes pavement analysis through the use of image-processing techniques andalgorithms. The AutoPAVER system uses a commercially available computer equipment and is accessedthrough a menu-driven software interface.
The AutoPAVER system saves both time and labor since it relieves the user of dangerous traffic-blocking chores while examining pavement, and because it performs all numerical tallying and recordkeeping unassisted. Development of various methods for automatic detection of pavement distresses isunder way and will be added to AutoPAVER as each becomes available.
AutoPAVER is beneficial as an intermediate step between a totally manual field inspection method
and a totally automated image-processing system. The system offers three principal advantages:
1. Data entry time is eliminated and the time required to measure distresses is reduced.
2. There is no need to control or block traffic for this procedure since available commercialequipment can take pavement photographs at the speed of traffic.
3. A record of the pavement condition is kept on either 35 mm film or video tape. This will beuseful for verifying data and also for future research.
20

USACERL DISTRIBUTION
Chief of Engineers USA AMCCOM 61299 Tyndall AFB, FL 32403ATTN: CEHEC-IM-LH (2) ATTN: AMSMC-RI AFESCIEngineenng & Service LabATTN: CEHEC-IM-LP (2) ATTN: AMSMC-ISATTN: CECC-P NAVFACATTN: CECW Military Dist of Washington ATTN: Division Offices (11)ATTN: CECW-O ATTN; DEN ATTN: Facilities Engr Cmd (9)ATMN: CECW-P Cameron Station (3) 22314 ATTN: Naval Public Works Canter (9)ATTN: CECW-RR Fort Lealey J. MNair 20319 ATIN: Naval Civil Engr Lab (3)ATTN: CEMP Fort Myer m 1 ATTN: Naval Constr Battalion Ctr 93043ATIN: CEMP-CAMrN: CEMP-E Military Traffic Mgmt Command Engineering Societies LibraryATTN: CERD Falls Church 20315 New Yotk. NY 10017AMIN: CERD-L Oakland Army Bae 94626AMTN: CERD-C Bayom 07002 National Guard Bureau 20310ArN: CERD-M Sunny Point MOT 28461 Instlation DivisionATMN: CERMATTN: DAEN-ZCE NARADCOM. ATIN: DRDNA-F 01760 US Govenment Printing Office 20401ATMN: DAEN-ZCI Receiving/Depository Section (2)ATMN: DAEN-ZCM TARCOM Fac, Div. 48090ATTN: DAEN-ZCZ US Army Env. Hygiene Agency
TRADOC (19) ATTN: HSHB-ME 21010CEHSC HQ. TRADOC, ATTN: ATEN-DEH 23651
ATTN: CEHSC-ZC 22060 ATiN: DER Natl Institute of Standards & Tech 20899ATTN: DET 1H 79906ATTN: CEHSC-F 22060 TSARCOM, ATrN: STSAS-F 63120 Defense Technical Ino. Center 22304ATTN: CEHSC-FB-P 22060 ATMN: DIC-FAB (2)ATTN: CEHSC-TT-F 22060 USAIS
Foet Huachuca 85613US Army Engineer Disuicts ATIN: Facilities Engineer (3) 244
ATTN: Library (41) Fort Ritchie 21719 7190
US Army Engineer Divisions WESTCOMATTN: Library (14) Fort Shafter 96858
ATTN: DERROKJUS Combined Forces Command 96301 ATN: APEN-A
ATMN: EUSA-HHC-CFCJEngrSHAPE 09055
US Military Academy 10996 ATIN: Survivability Sect. CCB-OPSATrN: Facilities Engineer ATTN: Infrastuctunm Branch, LANDAATTN: Dept of Geography &
Computer Sciences HQ USEUCOM 09128ATTN: MAEN-A ATTN: ECJ 4/7-LOE
AMC - Dir., int., & SVCS. Fort Belvoir VAATTN: DEH (23) ATTN: Autalian Liaisn Officer 22060
ATTN: Water Resoum Center 22060DLA ATTN: DLA-WI 22304 ATTN: Engr Studies Center 22060
ATTN: Engr Topographic Lab 22060DNA ATIN: NADS 20305 ATrN: AT.A-TE-SW 22060
ATITN: CECC-R 22060FORSCOM (28)
FORSCOM Enginee. ATTN: Spt Det. 15071 CECRL ATTN: Library 03755ATTN: DER
CEWESATTN: Library 39130HSC
PL Sam Homuon AMC 71234 HQ, XVMI Airbene Corp andATIN: HSLO-F Ft. Brag 28307
Fitzsimons AMC 80045 ATTN: AFZA-DIH-EEATTN. HSIG-DEH
Walter Reed AMC 20307. Chanute APB, IL 61363ATTN: Facilities Engineer 3345 CES/DE, Stop 27
INSCOM - Ch, lind. Div. AMMRC 02172Arlington Hall Station 22212 ATTN: DRXMR-AP
ATTN: Engr & Hog Div ATTN: DRXMR-WEVint Hill Farms Station 22136
ATTN: IAV-DEH Norton AFB, CA 92409Ft. Belvoir 22060 ATTN: AFRCE-MXJDE
ATTN: Facilities Engineer (3)

EMC Team Distribution
Cid of Engines Albuqueque 7103 US Army Foreign S& & Toch CtrATrN: (CMP-ZA ATIN: Ouid Hap Div ATrN: Chadounevil, VA 22901ATIN: CEMP-ZM (2) Las Angee 90053 AWTN: Far Fas Offic 96328ATTN: DAEN.ZCP ATIN: Cie SPLED-F
Sm Fnmcisco 94105 USA ARRADCOM 07801CEIHSC ATN: Gaid, Hap Div ATTN: DRDAR-LCA-OK
AT'N: CESC-FB Sacrmmto 95814ATrN: tid, SPKED-D HQ. USAMRDC 21701
US Amy Engineer Disuict ATIN: -Chi& SPKCO-C ATTN: SURD-PLCNew York 10278 For Eau 96301
ATTN. Chid. Din Br ATIN': 1F01D-L Wa Pin. NY 10996Pittburgh 15222 Podand 97206 ATN: Dept of Mechanics
ATrN: Chief ORPCD ATIN: Geoat" Bg Br ATIN: LbraryATMN: Chid, Far Div ATN: Chia& PMl-
Philadelphia 19106 ATTN: Cid , EN-DB-ST FL Belvoir, VA 22060ATTN: Chid, NAPEN-D Seae 98124 ATTN: Tan Resources Cener
Baltimore 21203 ATN: Chid, NPSCOATrN: Chie. apg Div ATIN: Cid NPSEN-FM Ft. Daning. GA 3190S
Nfd'k 23510 ATrN: Chid. N-DO-ST ATtN: Ar7B-DEH-BGATIN: Chid, NAOEN-M Walls Walls 99362 ATIN: ATZB-EH-EATIN: Cmid, NAOEN-D ATIN: Chid, 15p Div
Hungtan 25701 Alaska 99506 F. Leavenwoth, KS 66027ATTN: (mid. ORHED-G ATFN: NPAEN.G-M ATTN: AIZLCA-SA
W on 21401ATTN: Chief, SAWEN-D US Amy Enia Division FL Lee, VA 23801
Chadesom 29402 New England 02154 ATIN: AMXMC-D (2)ATTN: Qsie, F Div ATIN: Chia& NEED-T
Savamah 31402 ATrN: laboratmy FL 16kI sCIA 30330ATN: Chid, SASAS-L ATIN: Chid, NEUCD ATIN-: AFEN-CD
Jacksmnvile 32232 Narth Atlic 10007ATN: Casar Branch ATrN: Chid, NADEN-T FL Monce VA 23651
Mobile 36652 Middle East (Rear) 22601 ATZN: ATEN-ADATTN: Chid SAMEN-D ATN: Chist ]ED T ATrN: ATEN-FE-MEATTN: Chief, SAMEN-F South Atlantic ATIN: ATEN-FN (2)ATN: Chid. SAM .-C ATN: Laboratory 30060
Nashville 37202 ATIN: Chj SADEN-TC 30303 Ft. Richasn, AK 99505ATTN: Chief, ORNED-P AT: 7 0.C 3ADEN-TS 30303 ATTN. AFVR-DE-E
Masephi 31103 Neuwihe 3510WATrN: Chief, Constr Div ATrN: Chie. HNDED-CS Rocky Mountain Arsenal 10022ATrN: Chid, LMMED-D ATrN: Chie. HNDD-M ATN: SARRM-CO-FEP
Vicksburg 39130 ATN: Chid, HNDED-SRATIN: Chie, Ep Div Lowe issispi 39180 USAWES 39130
L.wlvIe 40201 ATTN: CCd, LMVED-G ATTN: CjluctmursATIN: Chief, Enp Div Oio River ATrN: Sails & Paveents Lab
Ditat 43231 ATrN: Labrtory 45227ATTN: (hid. NCEED-T ATTN: C d'. En Div 45201 Naval Facilities En Command 22332
St. Paul 55101 Misaeni River AIN: Code 2003ATIN" Chif ED-D AIN: -(Ci. MRDE3.G 68101ATN: Chid NCSED-GH ATrN: Laboratory 63102 COMMANDER (CODE 2636) 93555
Rock Islan 61204 Southwetenm 752M Naval Weapas CenterATIN: Chie, NCRED-O ATTN: Labotoy
SL Leads 63101 ATIN: Chid, SWDED-MA Little Rock AFB 72099ATTN Chi4 D-D AT7 Od. SWDED-TO AT7N. 3140DEEEaras City 64106 South Pacific 9496
ATrN" Chief, En Div ATN: Laboratory Building Research Board 20418Omaha 63102 PaifileOem 9"858
ATIN: Chid, Engr Div ATTN: Chief, Enp Div Dept of Trnsponstion Library 20590New Odeas 70160 ATTN: P1MS Branch
ATTN: Chi., LAMED-DG ATTN: PODED.D Transportation Reasarh Boa 20413Little Rock 72203 North Pacific
ATIN: Chid, Eap Div ATN: Metnlal Lab 97060Tuls 74121 ATTN: Chief En Div 97208
ATN: Chif, Enr Div 108PL Wank 76102 7th US Army 09407 +1
ATTN: Cief, SWFED-D ATN: AETrM-Y"-MG-EH 07190Galwvese
ATN: Chief, SWOAS-L 77553 HQ. Combined Fold Army (ROKjUS)ATFN: Chid, SWOCO.C 77553 ATN: CFAR-EN 96351ATIN: Chief. SWGED-DC 77550