copper report 31 jan 2010
TRANSCRIPT
8/14/2019 Copper Report 31 Jan 2010
http://slidepdf.com/reader/full/copper-report-31-jan-2010 1/8
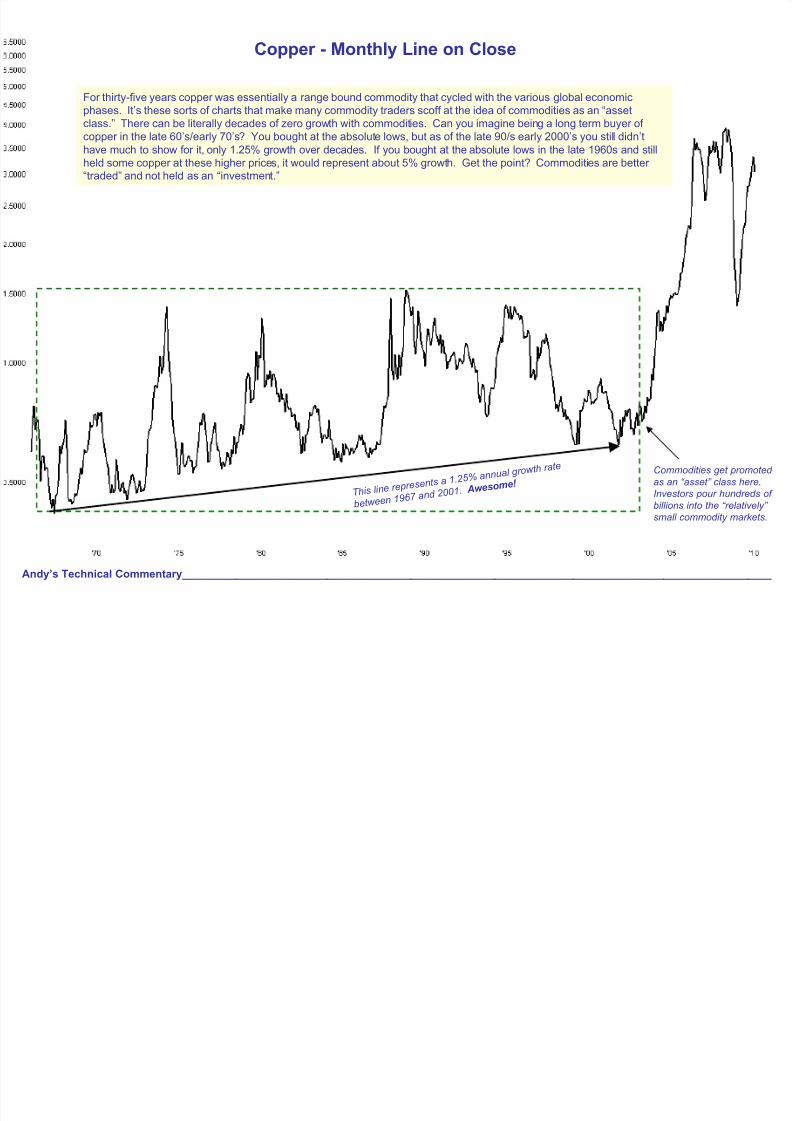
Copper - Monthly Line on Close
Andy’s Technical Commentary__________________________________________________________________________________________________
Commodities get promoted
as an “asset” class here.
Investors pour hundreds of
billions into the “relatively”
small commodity markets.
For thirty-five years copper was essentially a range bound commodity that cycled with the various global economicphases. It’s these sorts of charts that make many commodity traders scoff at the idea of commodities as an “assetclass.” There can be literally decades of zero growth with commodities. Can you imagine being a long term buyer of
copper in the late 60’s/early 70’s? You bought at the absolute lows, but as of the late 90/s early 2000’s you still didn’thave much to show for it, only 1.25% growth over decades. If you bought at the absolute lows in the late 1960s and stillheld some copper at these higher prices, it would represent about 5% growth. Get the point? Commodities are better “traded” and not held as an “investment.”
T his line r epr esent
s a 1.25% annual g
r owth r ate
between 1967 and
2001. Awesom
e!
8/14/2019 Copper Report 31 Jan 2010
http://slidepdf.com/reader/full/copper-report-31-jan-2010 2/8
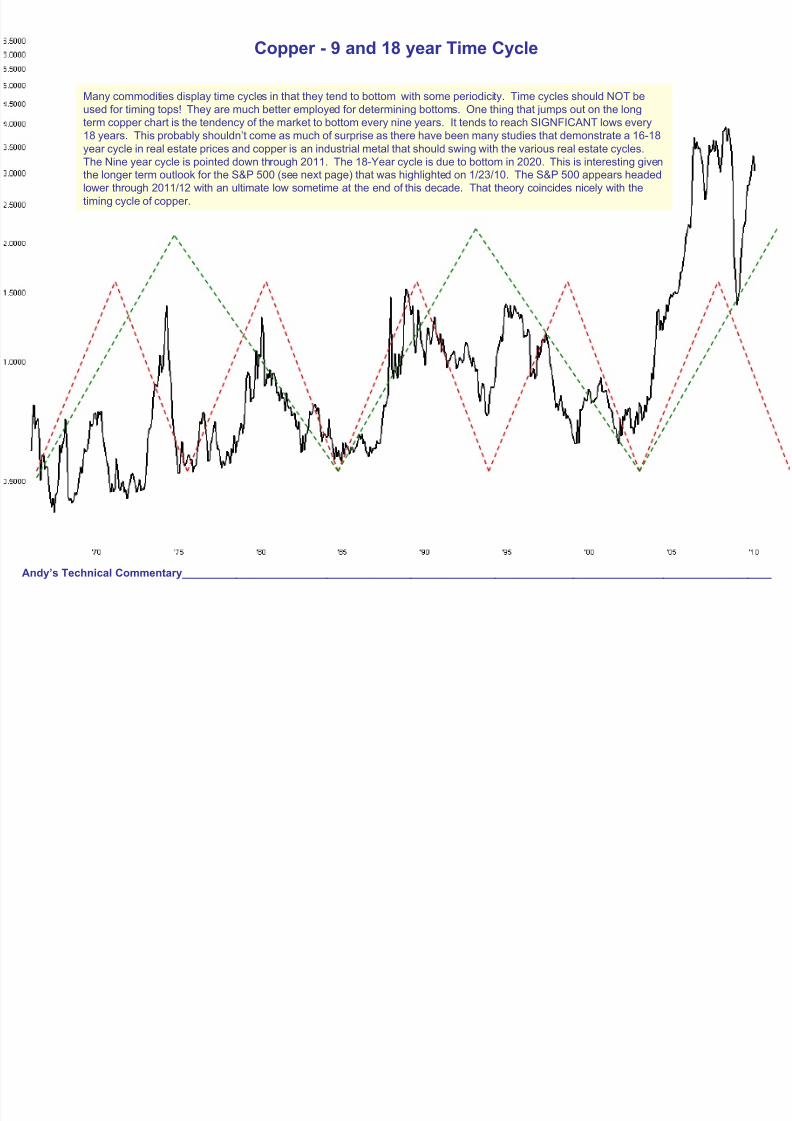
Copper - 9 and 18 year Time Cycle
Andy’s Technical Commentary__________________________________________________________________________________________________
Many commodities display time cycles in that they tend to bottom with some periodicity. Time cycles should NOT beused for timing tops! They are much better employed for determining bottoms. One thing that jumps out on the longterm copper chart is the tendency of the market to bottom every nine years. It tends to reach SIGNFICANT lows every
18 years. This probably shouldn’t come as much of surprise as there have been many studies that demonstrate a 16-18year cycle in real estate prices and copper is an industrial metal that should swing with the various real estate cycles.The Nine year cycle is pointed down through 2011. The 18-Year cycle is due to bottom in 2020. This is interesting giventhe longer term outlook for the S&P 500 (see next page) that was highlighted on 1/23/10. The S&P 500 appears headedlower through 2011/12 with an ultimate low sometime at the end of this decade. That theory coincides nicely with thetiming cycle of copper.
8/14/2019 Copper Report 31 Jan 2010
http://slidepdf.com/reader/full/copper-report-31-jan-2010 3/8
Supercycle Wave III concludes amid
“euphoria” over stocks.
< A >
< B >
This large Supercycle Wave IV triangle is my preferred model for the next several years. Essentially, it’s going to be a longslog as the U.S. grapples with credit deflationary forces and the efforts of government/Fed to arrest the deflation. Some timeat the end of this decade, after the Baby Boomers have finally cashed out of the stock market to provide for their ownretirements, it should be a good time to enter the market.
S&P 500 Weekly (Log Scale)
Andy’s Technical Commentary__________________________________________________________________________________________________
< D >2014/15
2020?
< E >
IV2011/2012- Y -
< C >( C )
- W -
( A )
( B )
- X -
Reprinted from 1/23/10
8/14/2019 Copper Report 31 Jan 2010
http://slidepdf.com/reader/full/copper-report-31-jan-2010 4/8
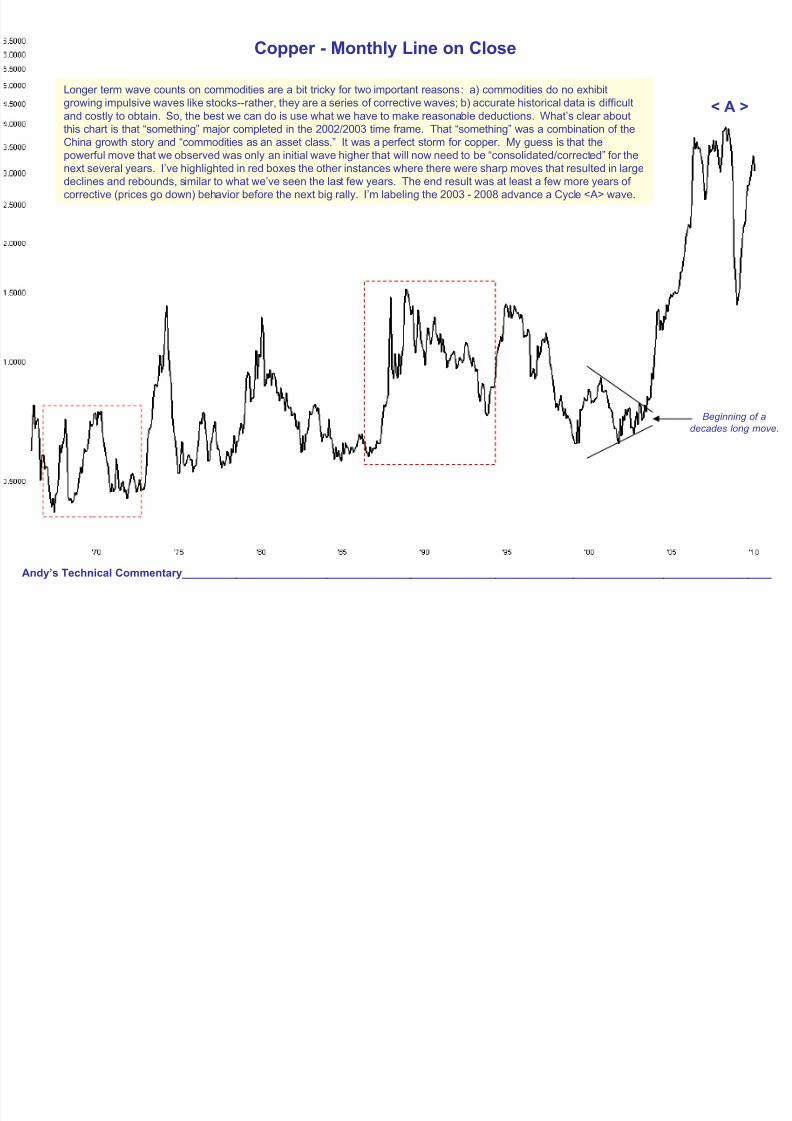
Copper - Monthly Line on Close
Andy’s Technical Commentary__________________________________________________________________________________________________
Longer term wave counts on commodities are a bit tricky for two important reasons: a) commodities do no exhibitgrowing impulsive waves like stocks--rather, they are a series of corrective waves; b) accurate historical data is difficultand costly to obtain. So, the best we can do is use what we have to make reasonable deductions. What’s clear aboutthis chart is that “something” major completed in the 2002/2003 time frame. That “something” was a combination of the
China growth story and “commodities as an asset class.” It was a perfect storm for copper. My guess is that thepowerful move that we observed was only an initial wave higher that will now need to be “consolidated/corrected” for thenext several years. I’ve highlighted in red boxes the other instances where there were sharp moves that resulted in largedeclines and rebounds, similar to what we’ve seen the last few years. The end result was at least a few more years of corrective (prices go down) behavior before the next big rally. I’m labeling the 2003 - 2008 advance a Cycle <A> wave.
< A >
Beginning of adecades long move.
8/14/2019 Copper Report 31 Jan 2010
http://slidepdf.com/reader/full/copper-report-31-jan-2010 5/8
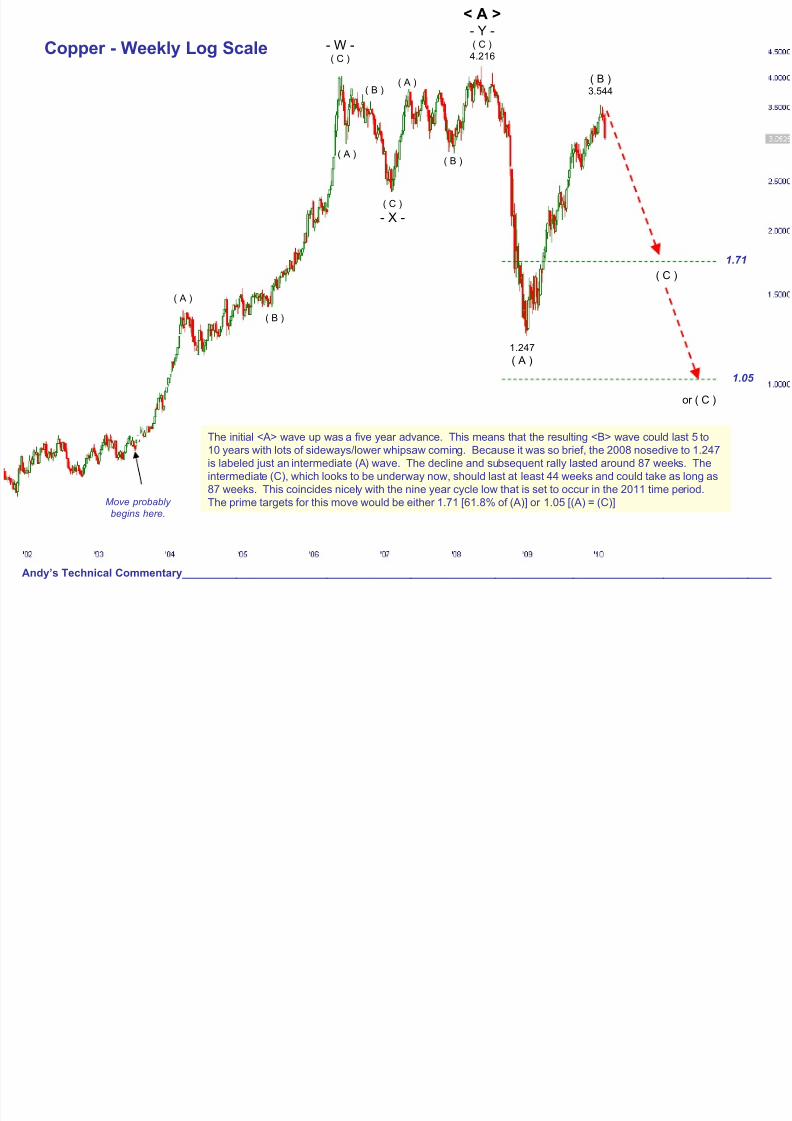
Copper - Weekly Log Scale
Andy’s Technical Commentary__________________________________________________________________________________________________
The initial <A> wave up was a five year advance. This means that the resulting <B> wave could last 5 to10 years with lots of sideways/lower whipsaw coming. Because it was so brief, the 2008 nosedive to 1.247is labeled just an intermediate (A) wave. The decline and subsequent rally lasted around 87 weeks. Theintermediate (C), which looks to be underway now, should last at least 44 weeks and could take as long as87 weeks. This coincides nicely with the nine year cycle low that is set to occur in the 2011 time period.The prime targets for this move would be either 1.71 [61.8% of (A)] or 1.05 [(A) = (C)]
( A )
( B )
- W -( C )
( C )
- X -
( A )
( B )( A )
( B )
< A >- Y -( C )
4.216
1.247
( A )
( B )3.544
( C )
1.71
1.05
or ( C )
Move probably
begins here.
8/14/2019 Copper Report 31 Jan 2010
http://slidepdf.com/reader/full/copper-report-31-jan-2010 6/8
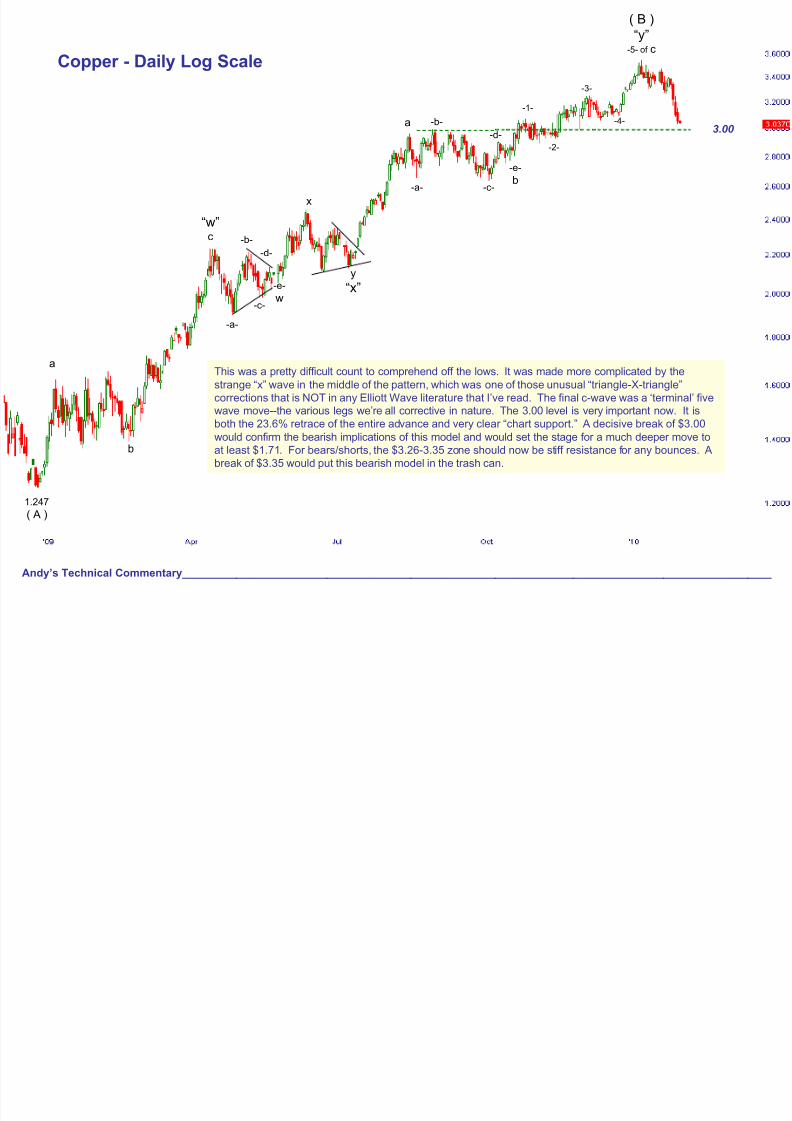
Copper - Daily Log Scale
Andy’s Technical Commentary__________________________________________________________________________________________________
This was a pretty difficult count to comprehend off the lows. It was made more complicated by thestrange “x” wave in the middle of the pattern, which was one of those unusual “triangle-X-triangle”corrections that is NOT in any Elliott Wave literature that I’ve read. The final c-wave was a ‘terminal’ five
wave move--the various legs we’re all corrective in nature. The 3.00 level is very important now. It isboth the 23.6% retrace of the entire advance and very clear “chart support.” A decisive break of $3.00would confirm the bearish implications of this model and would set the stage for a much deeper move toat least $1.71. For bears/shorts, the $3.26-3.35 zone should now be stiff resistance for any bounces. Abreak of $3.35 would put this bearish model in the trash can.
1.247
( A )
“w”c
a
b
y“x”
-a-
-e-
w
-d-
-c-
-b-
x
a
-a-
-b-
-c-
-d-
-e-
b
-1-
-2-
-3-
-4-
( B )“y”
-5- of c
3.00
8/14/2019 Copper Report 31 Jan 2010
http://slidepdf.com/reader/full/copper-report-31-jan-2010 7/8
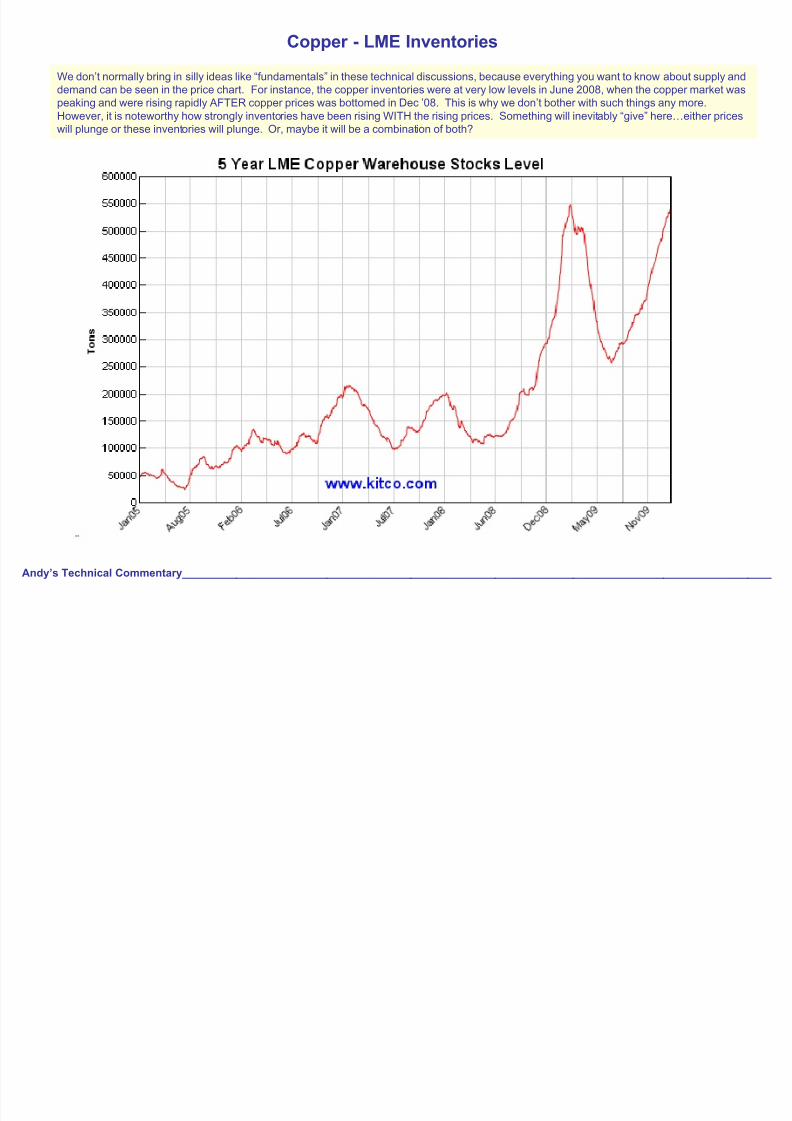
Copper - LME Inventories
Andy’s Technical Commentary__________________________________________________________________________________________________
We don’t normally bring in silly ideas like “fundamentals” in these technical discussions, because everything you want to know about supply anddemand can be seen in the price chart. For instance, the copper inventories were at very low levels in June 2008, when the copper market waspeaking and were rising rapidly AFTER copper prices was bottomed in Dec ’08. This is why we don’t bother with such things any more.However, it is noteworthy how strongly inventories have been rising WITH the rising prices. Something will inevitably “give” here…either priceswill plunge or these inventories will plunge. Or, maybe it will be a combination of both?
8/14/2019 Copper Report 31 Jan 2010
http://slidepdf.com/reader/full/copper-report-31-jan-2010 8/8
DISCLAIMER WARNING DISCLAIMER WARNING DISCLAIMER
This report should not be interpreted as investment advice of any kind. This report is technical
commentary only. The author is NOT representing himself as a CTA or CFA or Investment/TradingAdvisor of any kind. This merely reflects the author’s interpretation of technical analysis. Theauthor may or may not trade in the markets discussed. The author may hold positions opposite of what may by inferred by this report. The information contained in this commentary is taken fromsources the author believes to be reliable, but it is not guaranteed by the author as to the accuracyor completeness thereof and is sent to you for information purposes only. Commodity tradinginvolves risk and is not for everyone.
Here is what the Commodity Futures Trading Commission (CFTC) has said about futures trading:Trading commodity futures and options is not for everyone. IT IS A VOLATILE, COMPLEX ANDRISKY BUSINESS. Before you invest any money in futures or options contracts, you shouldconsider your financial experience, goals and financial resources, and know how much you canafford to lose above and beyond your initial payment to a broker. You should understand commodityfutures and options contracts and your obligations in entering into those contracts. You should
understand your exposure to risk and other aspects of trading by thoroughly reviewing the riskdisclosure documents your broker is required to give you.