copenhagen, 16 may 2018 - cementirholding.com … · copenhagen, 16 may 2018 european midcap event...
TRANSCRIPT

1
Copenhagen, 16 May 2018
EUROPEAN MIDCAP
EVENT
CONFERENCE

2
1. GROUP OVERVIEW
2. BUSINESS PLAN 2018 - 2020
3. FIRST QUARTER 2018 RESULTS
Agenda

3
• Caltagirone Spa Group is a family-controlled industrial concern with consolidated
operating revenue of EUR 1.48 billion in 2017
• The Group holds financial investments in several listed companies
* Mkt caps, in Euro million, are based on prices as of May 14th, 2018
** Directly and indirectly as of December 31st, 2017
Mkt cap: 347
Mkt cap: 161 Mkt cap: 40 (A) Mkt cap: 1,138Not listed (B)
Cap: 168 Cap: 11
5.2%
65.9%
28.9%
1.5%
35.6% 80.3% 56.5% 46.1%
(A) Vianini Industria Spa changed its company name to “Vianini Spa” on July 22, 2016.
(B) Vianini Lavori Spa shares were delisted as of Dec. 7, 2015, following the voluntary
tender offer proposed by FGC Finanziaria Srl.
CONSTRUCTIONREAL ESTATE
Group structure and main shareholders*

4
• Substantial M&A activity over the last 20 months for a total value of over 800 M€
− Acquisition of Sacci completed of 29 July 2016 for 125 M€
− Acquisition of the Group Compagnie des Ciments Belges (CCB), completed on 25
October 2016 for 312 M€
− Sale of all assets and activities in Italy (including Sacci), executed on 2 January 2018 for
315 M€
− Acquisition of an additional 38.75% stake in Lehigh White Cement Company,
completed on 29 March 2018 for 107 M$ (approx. 87 M€)
Cementir Group changed over the past two years…
100% of Group’s revenue being realized abroad from 2018

5
• Greater stability of results and reduction of the risk profile due to:
− Exit from the Italian market, after years of losses
− Decreased exposure to the Turkish and Egyptian markets
• Leader market positions:
− Global leadership in white cement
− Market leader in Denmark
− Market leader in ready-mixed concrete in Scandinavia
− Third player in Belgium
− Market leader in white cement in the United States
Attractive business and geographical portfolio
…better diversification and leading market positions

6
Transaction
Rationale
• On September 19th, 2017 Cementir Holding signed an agreement with
Heidelberg / Italcementi to sell 100% of the share capital of Cementir Italia
Spa, including its entirely owned participations in Cementir Sacci Spa and
Betontir Spa (Cementir Italia group)
• Enterprise Value = 315 M€ on a cash and debt-free basis
• Closing on 2 January 2018
• Strategic opportunity for Cementir to:
• take advantage of the consolidation ongoing on the Italian cement industry
and benefit from current valuation environment
• take other opportunities abroad
Financial
impacts
• In 2017 Cementir Italia group achieved:
• Revenue of 148 M€, EBITDA of -3.7 M€
• Losses from discontinued operations of -33.1 M€
• Cash-in of 315 M€ on 2 January 2018
Divestment of the Italian business

7
Integration of CCB was concluded successfully
• CCB is a leading player in Belgium in the cement,
aggregates and ready-mixed concrete businesses
• Fully integrated cement plant with total capacity of 2.3
million tons
– Gaurain-Ramecroix is the largest plant in France-
Benelux with a state-of-the-art technology and long-life
mineral reserves (over 80 years)
– The plant serves Belgium and nearby countries
(North-Eastern France, the Netherlands and Germany)
• A network of 10 ready-mixed plants in Belgium and 5 in
France, acquired in 2017
• 3 Aggregates quarries (including the largest quarry in
Europe)
Cost optimizations and operational, commercial and distribution improvements
Introduction of the Group’s SAP information system
France
The Netherlands
Belgium
Germany
Luxembourg

8
Transaction
Rationale
Financial
impacts
Lehigh White Cement Company – Acquisition of the majority
with a further 38.75% stake
• On February 14th, 2018 Cementir Holding signed an agreement with Heidelberg /
Lehigh Cement Company to acquire an additional 38.75% stake in Lehigh White
Cement Company (LWCC)
• Cash consideration = 106.6 M$ on a cash and debt-free basis
• Closing on 29 March 2018
• Majority interest of 63.25% (Cemex 36.75%)
• LWCC is the leading supplier and distributor of white cement in the US
• Reinforce the group’s position as global leader in white cement, directlly managing
assets
• Take advantage of our global presence and expertise to fully exploit the product
offering and consolidate LWCC customer base
• Line-by-line consolidation from 1° April 2018 (instead of the equity method)
• In 2017 revenue of 149 M$ and EBITDA of 26 M$

9
Waco TX
York. PA
Tampa
Lehigh White Cement Company
• LWCC is the only producer of white cement on the
United States and the leading supplier
• 2 white cement plants with total capacity of 255,000
tons in Waco (Texas) and York (Pennsylvania)
• Annual sales in 2017 of over 600,000 tons
• An extensive distribution network of over 40
terminals in 28 states across the US which distribute
manufactured and imported cement from its partners
in all North America
− The terminal in Tampa FL is owned by
Cementir
• In the USA there are no raw materials to be used for
white cement production except for those in the 2
sites of LWCC.
• Possibility to improve the future performance thanks to
the Group's penetration capacity focusing on logistic
and cost structure
• In 2018 EBITDA of LWCC is expected at around 10
M€ (consolidated for 9 months) due to some non
recurring costs

10
Aalborg Region Sinai Region Malaysia Region
China Region
With a capacity of 3.3 Mt, Cementir Holding is by far the greatest competitor in this market
Strong presence in the
Australian market
Lehigh White
Cement
White cement: a global business “Lead” by Cementir Holding

11
• Availability of white cement raw material is scarce compared to
grey cement
• Used in constructions where aesthetics are of high importance
• Production costs are higher than grey cement
• Terrazzo
• Coloured mortars
• Pre-cast concrete elements
• Cast stone
• Glass fibre reinforced concrete
• Swimming pools
• Paving stones
• Roofing tiles
• Garden ornaments
• Plasters and grouts
• Street furniture
• Road barriers
White cement is a premium product
White cement applications
1
2 3
4
6 87
1/ Masonry blocks for Velodrom (Olympic Games London)
2/ Precast elements, Holstebro Court House
3/ Street furniture by Gunnar Näsman
4/ Precast elements, Tuborg Nord
5/ Coloured mortars
6/ Precast tunnel elements
7/ Paving stones
8/ Paving stones
5
White cement: premium product

12
Expansion supported by external growth strategy
Since 2001 over EUR 1.7 billion invested in acquisitions to increase geographical and product
diversification
254,0
600,0
152,2 112,54,0 22,2 10,8 8,5 5,2 10,7
125,0
312,0
87,0
2001 2004 2005 2006 2007 2008 2009 2010 2011 2012 Jul 2016 Oct 2016 Mar 2018
(M€)
2001 - Cimentas AS and Cimbeton AS
Entered the Turkish cement market with 2 plants
2004 - Aalborg Portland A/S and Unicon A/S
Transforming deal:
- Product diversification (new products: white cement
and aggregates and strong position in ready-mix)
- Geographical presence (new countries: Denmark,
Norway, Sweden, Egypt, Malaysia, China, US)
2005
Edirne plant Cement in Turkey
Vianini Pipe Inc. Concrete product in US
2006
Elazig Cimento A/S plant Cement in Turkey
4K-Beton A/S Ready-mix in Denmark
2008 - Kudsk & Dahl
Aggregates in Denmark
2009 - Sureko
Entered the waste management in Turkey
2010 - 14 ready-mix plants
Ready-mix in Italy
2012 - NWM Holding Ltd
Entered the waste management in UK
From being an Italian cement producer, Cementir is today an international player operating in 18 countries
Over the last 18 months
the Group has been deeply
reshaped through M&A activity
Jul. 2016 - Sacci
Cement and ready-mix in Italy
Oct 2016 - Compagnie des Ciments Belges
- Cement, aggregates and ready-mix in Belgium
- Ready-mix in France
Jan. 2018 – Sale of all assets and activities in Italy
Disposal of cement and RMC businesses
Cash in of 315 M€ in January 2018
Mar. 2018 – Closing of acquisition of 38.75% stake in
Lehigh White Cement Company
Majority stake of 63.25%
White cement in the U.S.

13
Group overview - International presence *
Cementir Holding operates in 18 countries with approx. 13.1 mt of cement capacity
DENMARK - SCANDINAVIA
Grey cement capacity: 2.1 million t
White cement capacity: 0.85 million t
RMC sales: 2.4 million m3
Aggregates sales: 4.2 mt
Terminals: 10
BELGIUM / FRANCE
Grey cement capacity: 2.3 million t
RMC sales: 1.0 million m3
Aggregates sales: 5.2 mt
Terminals: 1
TURKEY
Grey cement capacity: 5.4 million t
RMC sales: 1.6 million m3
Waste management facilities: 2
EGYPT
White cement capacity: 1.1 million t
CHINA
White cement capacity: 0.7 million t
MALAYSIA
White cement capacity: 0.35 million t
USA
White cement capacity: 0.26 million t **
Cement products plants: 1
Terminals: 1
UK
Waste management facilities: 1
Terminals: 1
AUSTRALIA
Terminals: 4
ICELAND
Terminals: 3
POLAND
Terminals: 1
LATVIA
Terminals: 1
HOLLAND
Terminals: 1
* Volumes sold in 2017
** Cementir Holding holds 63.75% of Lehigh White Cement Company

14
Key financials
Revenue from sales and services (M€) Ebitda (M€) and Ebitda Margin (%)
Net debt / Ebitda Net debt (M€)
1,9x
1,4x1,1x
2,8x
2,4x
0x
1x
2x
3x
2013 2014 2015 2016 2017
325 278222
562 537
0
100
200
300
400
500
600
Dec-2013 Dec-2014 Dec-2015 Dec-2016 Dec-2017
989 948 969 1.0281.140
0
200
400
600
800
1.000
1.200
2013 2014 2015 2016 2017
1.288 *
* with the inclusion of Cementir Italia group
170 192 194 198 223
17,2%
20,3%20,0%
19,3%19,5%
15%
16%
17%
18%
19%
20%
21%
0
100
200
300
2013 2014 2015 2016 2017

15
At the end 2017 86% of revenues derive from international operations
From 2018 100% of revenues will be generated abroad
Italy 100%
Cement 100%
2001 Full Year Revenue by geography
2001 Full Year Revenue by product
Central Mediterranean
(Italy) 14%
Eastern Mediterranean 17%
Cement (White & Grey) 56%
Ready-mix concrete 32%
2017 Revenue by geography
2017 Revenue by product
Aggregates 6%
Nordic & Baltic and US 63%
Asia Pacific 6%
Other activities 4%
Waste 2%
From local to global player

16
1. GROUP OVERVIEW
2. BUSINESS PLAN 2018 - 2020
3. FIRST QUARTER 2018 RESULTS
Agenda

17
Actual
2017
Guidance
2018
Target
2020
Revenue from sales(EUR billion)
1.14 1.25 1.34
EBITDA(EUR million)
213 235 270
EBIT(EUR million)
140 160 194
Annual Capex(EUR million)
92 80 70-75
Extraordinary Capex(EUR million)
87
Net financial debt (EUR million)
537 260 50
Net financial debt /
EBITDA2.5x 1.1x 0.2x ➢ Excluding perimeter expansion
➢ Net financial debt reduction also due to sale of Cementir
Italia (315 M€) and cash out of LWCC (87 M€)
➢ Optimization of investments for developing production
capacity and maintaining plant efficiency
➢ Capex / Net sales ratio < 7%; in 2020 = 5.4%
➢ Profitability increase in all business and geographical areas
➢ Increase of both fuels price and freight costs from 2018
➢ Containment of Fixed costs vs inflation
➢ Increase in volumes of grey and white cement in all
geographical areas; prices in line with the relevant markets
➢ Higher sales volumes of ready-mixed concrete and
aggregates
Financial targets for 2020
➢ Acquisition of 36.75% of Lehigh White Cement Company
(106.6 M$)
*
*
* Excluding Italian companies sold on 2 January 2018 and EBITDA excludes also non
recurring revenue of 10.1 M€
** Excluding the effects of IFRS 16 which will be effective from 1 January 2019
➢ Assuming D&A of approx. 75-76 M€ *
**

18
Greater profitability
Improve cash flow generation
Strengthen the leadership in white cement
Innovation and development of special products
Increase the use of alternative fuels and raw materials
People development
Strategy - Six key priorities
1
2
3
4
5
6

19
Key priorities: Greater profitability
Several actions and initiatives to improve profitability and operating
efficiency in all areas:
• Processes rationalization and containment of costs, while increasing volumes in all
business areas and geographical areas;
• Focus on pricing and value added products and services
• Optimization of purchases and logistics
− New trading company Spartan Hive to manage raw materials, fuels, spare parts and
finished products
− Targeted actions in the various geographical areas
• Process improvement for reducing fuel and electricity consumption, also through
continuous improvement projects, counterbalancing increases in fuel and freight costs

20
Key priorities: Improve cash flow generation
Focus on cash generation
• Optimization of working capital, which remains essentially stable despite increasing volumes in
all business areas and geographical areas (specific targets on the rotation of inventories, the
days sales outstanding, ageing of receivables and payment terms of suppliers)
• Rigorous investment plan to maintain the production capacity and plants’ efficiency, with a
Capex / Net Sales ratio below 7%
• Progressive reduction of Net financial debt /EBITDA, to seize potential opportunities for further
growth through acquisition
Net financial debt / EBITDA
2,7x
1,9x
1,4x
1,1x
2,8x
2,4x
1,1x
0,2x
0,0x
0,5x
1,0x
1,5x
2,0x
2,5x
3,0x
3,5x
2012 2013 2014 2015 2016 2017 2018E 2019E 2020E
Net financial debt / EBITDA
Guidance 2018
Target 2020
21
Key priorities: Consolidation of the leadership in white cement
Leverage on a stronger commercial presence in North America and unique
global competitive position
• Group white cement volumes sold from 2.25 Mt in 2017 up to around 3 Mt in 2020, with the
contribution of Lehigh White
• Leadership position in many markets supplied
− Market leader in West and North Europe, Egypt, China, Malaysia, Australia and US
• In 2020, out of 3 Mt of total volumes sold, 1.5 Mt are exported.
− This would represent close to 27% of global white cement being traded, confirming the
Group as leader in global trading flows
• Commercial presence with local sales force and/or controlled logistic setup in 20 key target
markets, with sales in more than 70 countries

22
EXPLOITOUR UNIQUE PRODUCTION /
COMMERCIAL FOOTPRINT IN WHITE
CEMENT, BY CROSS-REGIONAL
SYNERGIES, WITHIN AN
INTEGRATED GLOBAL PERSPECTIVE
AND GUIDANCE
PURSUEPRODUCT INNOVATION &
NEW BUSINESS MODELLING
WITHIN DOWNSTREAM
APPLICATIONS & TECHNOLOGIES FOR
WHITE CEMENT
CATCHEXTERNAL GROWTH
OPPORTUNITIES, BOTH IN
CONSOLIDATED AND IN NEW
MARKETS
ENHANCE GLOBAL MARKETING &
BRANDING
AS AN ASSET
GROUP GLOBAL
LEADERSHIP IN
WHITE CEMENT DEVELOP
A UNIQUE VALUE PROPOSITION TO
THE CURRENT AND POTENTIAL
CUSTOMER BASE IN EXISTING AND
NEW GEO MARKETS
White cement strategy at a glance

23
2012
Consumption
2017
Capacity
2017
Consumption
2017
Per capita
Consumption
2022E
Consumption
Consumption
CAGR
2017-2022E
(Mt) (Mt) (Mt) (kg) (Mt) (%)
Asia (excl China) 2.1 2.9 2.4 0.9 3.1 5.3%
China 4.8 7.3 4.9 3.7 5.7 3.1%
Europe 2.8 7.1 3.1 3.6 3.4 1.9%
Eastern Europe & CIS 1.1 2.7 1.1 2.3 1.3 3.4%
Western Europe 1.7 4.4 2.0 4.8 2.1 1.0%
Middle East & Africa (MEA) 5.7 8.6 5.3 8.6 5.8 1.8%
Middle East 3.9 5.2 3.5 15.6 3.8 1.7%
Africa (mainly North) 1.8 3.4 1.8 1.5 2.0 2.1%
North America 1.1 0.8 1.6 4.4 1.7 1.2%
Latin America 0.9 1.8 1.2 1.9 1.3 1.6%
Total 17.4 28.5 18.5 2.5 21.0 2.5%
• Niche product sold globally
• White cement demand accounts for less than
1% of global cement demand
• Non-cyclical product with annual growth rate of
2-4%
• Demand moves broadly in line with grey
cement consumption, however it is less of a
commodity product and consumption can be
advanced by the creation of positive
perceptions in terms of fashion /aesthetics and
effective promotion through marketing
• White cement is used for both renovation
(decoration and repairs & maintenance work)
and new build
• Mainly B2B product, being in the formulation of
premix products
• Resistance to high temperature
• Scarcity of raw materials, completely absent in
certain countries (Brasil, Australia, parts of
Africa)
White cement belt
* Source: CW Research – Global White Cement Market and Trade Report 2017
#1 worldwide with 3.3 Mt of production capacity
Global leadership in white cement

24
Key priorities: Innovation and development of special products
InWhite project is the global innovation engine for white cement
Value addedsolutions
• Binders
• Pre-mix
• Premium solutions
New business models
• Through downstreamsvertical integration
• Partnerships
Product innovationand premium applications
• Complementary products / markets
Mega trends in the Building Industry
• Modularity – modules combined for a tailor made architectonic design of building
• Circular economy and sustainability
• Energy-efficient buildings
• Speed of construction
• High aesthetical quality of finishedsurfaces
• Low maintenance costs
• Anti-seismic and fire-resistant
Our Strategy

25
Key priorities: Innovation and development of special products
Innovative solutions under development
Ultra-high Performance
Concrete (UHPC)
• Premium pre-mixes for high added-value applications
Glass Fiber Reinforced
Concrete (GFRC) Magnetic Concrete mix
• Pre mixes and product concept for high efficiency magnetic applications
3D Concrete printing
• Premium pre mix fit for purpose for 3D concrete printing
• Premium pre-mixes for high added-value applications

26
Key priorities: Increase the use of alternative fuels and raw materials
Defined targets to promote the use of alternative fuels and raw materials and
energy efficiency targets:
• Counterbalance increase of fossil fuels
• Challenging regulatory framework for CO2 emissions: main actions to reduce CO2
− Optimize the use of alternative fuels with biomass (CO2 neutral)
− Reduce thermal consumption (SHC)
− Reduce the clinker content of cement
− Utilize renewable energy resources
• Major projects in Denmark, Turkey and Belgium for grey cement production
− Aalborg plant (Denmark) -> increase RDF volumes for grey cement production (from 42%
to 45% in 2020)
− Izmir plant (Turkey) –> increase volumes of alternative fuels (from 7% to 18% in 2020)
− Edirne plant (Turkey) –> increase volumes of alternative fuels (from 27% to 38% in 2020)
− Gaurain plant (Belgium) –> increase volumes of alternative fuels (from 36% to 40% in
2020)

27
Key priorities: People development
Focus on developing and enhancing people’s competencies, skills and motivation through
an inclusive and differentiated evaluation and development system to realize people’s
full potential and improve individual and organization performance in a context of strong
competition and fast change

28
New Group organizational model
To ensure effective execution of our strategy and achievement of expected
results and flexibility for acquisitions
The model is built on four key pillars:
▪ GROUP STANDARDIZATION AND HARMONIZATION
▪ ADAPTABILITY
▪ AGILITY
▪ GLOCALITY
It is based on the integration of various structures, according to a clear and effective repartition of organizational
accountabilities:
1. CORPORATE, as the leading, enabling, controlling and integrating body
2. REGIONS, accountable for realizing Group strategy and reaching and monitoring business objectives, coordinating
several Business Units
3. BUSINESS UNITS, accountable for the management of the full value chain in the areas of their competence and ensuring
the related business results
4. PROFESSIONAL FAMILIES, responsible for setting guidelines, coordinating functional areas across the Group,
developing the resources mapped in the family and foster Group integration

29
Among the main factors which could negatively affect the achievements of the targets of this
Business Plan:
• Changes in macroeconomic conditions and economic growth and other changes in
business conditions
• A prolonged instability in Egypt
• Strong devaluation of currencies in the emerging countries
Several factors could impact the targets of the Plan

30
1. GROUP OVERVIEW
2. BUSINESS PLAN 2018 - 2020
3. FIRST QUARTER 2018 RESULTS
Agenda

31
• In Q1 2018 the results of the Italian industrial businesses are no longer consolidated and the US will be
consolidated line-by-line from Q2 2018
• Group revenue from sales at 242.3 M€ (246.3 M€ in Q1 2017) due to the contraction in sales in Norway
and Denmark for unfavorable weather conditions, in Egypt for military controls whereas Turkey and
Belgium made significant progress. Negative impact of FX of 13 M€
• EBITDA reached 24.1 M€ (27.5 M€ in Q1 2017), negative impact of FX of 2 M€
‒ EBITDA improved in Turkey and China
‒ Lower result in Egypt, due to the curfew introduced in February and the consequent shutdown al all
transport services, as well as lower earnings in Norway and, to a lesser extent in Belgium, Denmark,
Sweden and Malaysia
• EBIT of 6.3 M€ (9.8 M€ in Q1 2017)
• Net financial income of 0.5 M€, siginificant improvement vs Q1 2017 (expense of 5.8 M€)
‒ Increased mark-to-market value of some hedging instruments and returns on the cash held
• Profit before taxes from continuing operations at 7.2 M€ (4.7 M€ in Q1 2017)
• Net financial debt of 387.1 M€ at 31 March 2018 (536.6 M€ at 31 Dec. 2017)
Executive summary – First quarter 2018
32
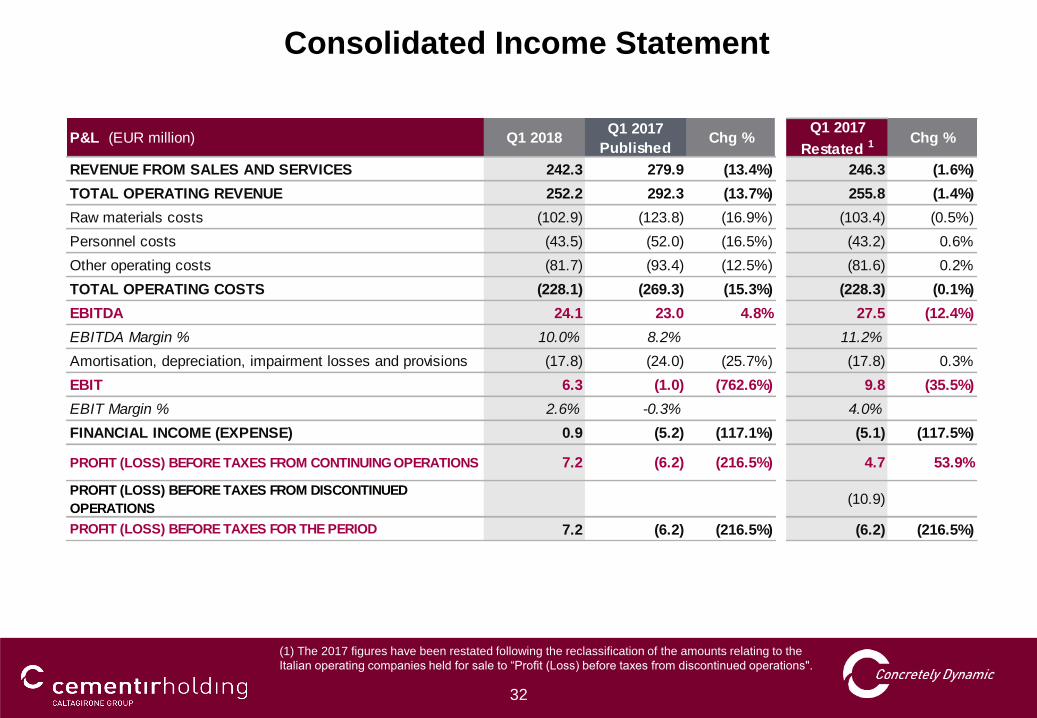
Consolidated income statementConsolidated Income Statement
(1) The 2017 figures have been restated following the reclassification of the amounts relating to the
Italian operating companies held for sale to “Profit (Loss) before taxes from discontinued operations".
REVENUE FROM SALES AND SERVICES 242.3 279.9 (13.4%) 246.3 (1.6%)
TOTAL OPERATING REVENUE 252.2 292.3 (13.7%) 255.8 (1.4%)
Raw materials costs (102.9) (123.8) (16.9%) (103.4) (0.5%)
Personnel costs (43.5) (52.0) (16.5%) (43.2) 0.6%
Other operating costs (81.7) (93.4) (12.5%) (81.6) 0.2%
TOTAL OPERATING COSTS (228.1) (269.3) (15.3%) (228.3) (0.1%)
EBITDA 24.1 23.0 4.8% 27.5 (12.4%)
EBITDA Margin % 10.0% 8.2% 11.2%
Amortisation, depreciation, impairment losses and provisions (17.8) (24.0) (25.7%) (17.8) 0.3%
EBIT 6.3 (1.0) (762.6%) 9.8 (35.5%)
EBIT Margin % 2.6% -0.3% 4.0%
FINANCIAL INCOME (EXPENSE) 0.9 (5.2) (117.1%) (5.1) (117.5%)
PROFIT (LOSS) BEFORE TAXES FROM CONTINUING OPERATIONS 7.2 (6.2) (216.5%) 4.7 53.9%
PROFIT (LOSS) BEFORE TAXES FROM DISCONTINUED
OPERATIONS(10.9)
PROFIT (LOSS) BEFORE TAXES FOR THE PERIOD 7.2 (6.2) (216.5%) (6.2) (216.5%)
Chg %P&L (EUR million) Q1 2018Q1 2017
PublishedChg %
Q1 2017
Restated 1

33
• Cement volumes to 2.1 Mt (+4.1%) thanks to significant growth in Turkey and good performance in
Malaysia, while the other geographic areas saw negative performance, except for Belgium which
remained stable
• Ready-mixed concrete volumes to 1.1 Mm3 up 7.1% driven by the excellent performance of the
Turkish market and to a lesser extent by Belgium and France, despite the fall in sales in the
Scandinavian region, especially Norway and Denmark
• Aggregates volumes to 2.2 up 8.6% Mt thanks to the positive performance in Belgium and Denmark
Cement, ready-mixed concrete and aggregates volumes
Grey and white cement (metric tons) 2,079 2,573 (19.2%) 1,997 4.1%
Ready-mixed concrete (m3) 1,140 1,088 4.8% 1,064 7.1%
Aggregates (metric tons) 2,179 2,006 8.6% 2,006 8.6%
Q1 2017
Restated 1 Chg %Sales volumes (thousands) Q1 2018Q1 2017
PublishedChg %
(1) The 2017 figures have been restated following the reclassification of the amounts relating to the
Italian operating companies held for sale to “Profit (Loss) before taxes from discontinued operations".

34
• Net financial debt at EUR 387.1 million at 31 March 2018, down EUR 149.6 million vs Dec-17 due to:
− Receipt of 315 M€ consideration for the sale of Cementir Italia group
− Payment of 106.6 M$ (~ 87 M€) to acquire 38.75% of Lehigh White Cement Co.
− developments in working capital and annual maintenance of plants
Net financial debt
EUR million

35
•This presentation has been prepared by and is the sole responsibility of Cementir Holding S.p.A. (the “Company”) for the sole purpose described herein. In no case
may it or any other statement (oral or otherwise) made at any time in connection herewith be interpreted as an offer or invitation to sell or purchase any security
issued by the Company or its subsidiaries, nor shall it or any part of it nor the fact of its distribution form the basis of, or be relied on in connection with, any contract
or investment decision in relation thereto. This presentation is not for distribution in, nor does it constitute an offer of securities for sale in Canada, Australia, Japan or
in any jurisdiction where such distribution or offer is unlawful. Neither the presentation nor any copy of it may be taken or transmitted into the United States of
America, its territories or possessions, or distributed, directly or indirectly, in the United States of America, its territories or possessions or to any U.S. person as
defined in Regulation S under the US Securities Act 1933 as amended.
•The content of this document has a merely informative and provisional nature and is not to be construed as providing investment advice. The statements contained
herein have not been independently verified. No representation or warranty, either express or implied, is made as to, and no reliance should be placed on, the
fairness, accuracy, completeness, correctness or reliability of the information contained herein. Neither the Company nor any of its representatives shall accept any
liability whatsoever (whether in negligence or otherwise) arising in any way in relation to such information or in relation to any loss arising from its use or otherwise
arising in connection with this presentation. The Company is under no obligation to update or keep current the information contained in this presentation and any
opinions expressed herein are subject to change without notice. This document is strictly confidential to the recipient and may not be reproduced or redistributed, in
whole or in part, or otherwise disseminated, directly or indirectly, to any other person.
•The information contained herein and other material discussed at the presentation may include forward-looking statements that are not historical facts, including
statements about the Company’s beliefs and current expectations. These statements are based on current plans, estimates and projections, and projects that the
Company currently believes are reasonable but could prove to be wrong. However, forward-looking statements involve inherent risks and uncertainties. We caution
you that a number of factors could cause the Company’s actual results to differ materially from those contained or implied in any forward-looking statement. Such
factors include, but are not limited to: trends in company’s business, its ability to implement cost-cutting plans, changes in the regulatory environment, its ability to
successfully diversify and the expected level of future capital expenditures. Therefore, you should not place undue reliance on such forward-looking statements. Past
performance of the Company cannot be relied on as a guide to future performance. No representation is made that any of the statements or forecasts will come to
pass or that any forecast results will be achieved.
•By attending this presentation or otherwise accessing these materials, you agree to be bound by the foregoing limitations.
For further information please contact our Investor Relations Office:
T +39 06 32493481 F +39 06 32493274 E [email protected]
Legal disclaimer