control of unsteady separated associated with dynamic stall of airfoils · · 2013-08-30control...
TRANSCRIPT
MCAT Institute
Progress Report9Z-01S
NASA-CR-I90688
i,,v -o_ - c ¢_....,,
P, 3,,_--
CONTROL OF UNSTEADYSEPARATED FLOW
ASSOCIATED WITH THEDYNAMIC STALL OF AIRFOILS
Michael C. Wilder
(NASA-CR-1906BS) CONTROL OF N92-32177
UNSTEADY SEPARATEO FLO_ ASSOCIATED
NITH THE DYNAMIC STALL _F AIRFOILS
Final Report, 2 Mar. - 15 Jul. 19q2 Unclas
(MCAT Inst.) 32 p
G3/02 0116629
August 1992 NCC2-637
MCAT Institute
3933 Blue Gum Drive
San Jose, CA 95127
https://ntrs.nasa.gov/search.jsp?R=19920022933 2018-06-24T11:32:03+00:00Z
MCAT Institute
Progress Report9Z-015
CONTROL OF UNSTEADYSEPARATED FLOW
ASSOCIATED WITH THEDYNAMIC STALL OF AIRFOILS
Michael C. Wilder
August 1992 NCC2-637
MCAT Institute
3933 Blue Gum Drive
San Jose, CA 95127
Control of Unsteady Separated Flow Associated with the
Dynamic Stall of Airfoils
M. C. Wilder
Summary
This is the final report for the MCA] Institute research proposal no. MCAT
91-22, covering the period March 2, 1992 - July 15, 1992. The two principal
objectives of this research were, (1) achieving an improved understanding of
the mechanisms involved in the onset and development of dynamic stall under
compressible flow conditions, and (2) the investigation of the feasibility of
employing adaptive airfoil geometry as an active flow control device in the
dynamic stall regime.
The results of compressible dynamic stall experiments involving both
oscillating and transiently pitching airfoils were reported in the MCAT Institute
Progress Report no. NCC2-637 by S. Ahmed (ref. 1). The dynamic stall
phenomenon was examined by employing schlieren flow visualization, laser
Doppler velocimetry (LDV) measurements, and point diffraction interferometry
(PDI) for a sinusoidally oscillating airfoil, and by using schlieren flow
visualization for a transiently pitching airfoil executing a constant-pitch-rate
ramp-up motion from 0 to 60 degrees angle of attack. The results of these
studies, along with a discussion of the design methodology, fabrication scheme,
and proposed deformation schedule for an adaptive geometry airfoil were
presented in the progress report (ref. 1).
Presented inthis final report are the results of a quantitative (PDI) study of
the compressibility effects on dynamic stall over the transiently pitching airfoil,
as well as a discussion of a preliminary technique developed to measure the
deformation produced by the adaptive geometry control device, and bench test
results obtained using an airfoil equipped with the device.

Nomenclature
C
M
Uoo
C_
&
(_+
chord length
Mach number
freestream velocity
angle of attack
pitch rate (radians/sec)
nondimensional pitch rate -C
U_
Introduction
The utilization of dynamic stall as a method for increasing the
maneuverability and agility of aircraft has received significant attention during
the past few years. When an airfoil is rapidly pitched beyond the static stall
angle, a dynamic stall vortex forms near the leading edge, resulting in a
dynamic lift overshoot. This dynamic lift, unfortunately, is short lived, and the
benefits are lost as the vortex propagates past the trailing edge. Several
methods, such as leading edge slats (ref. 2), moving walls (ref. 3), suction and
blowing (ref. 4), and leading edge deformation (ref. 5) have been investigated
for their ability to delay the formation and propagation of the dynamic stall
vortex, and with the advent of so called 'smart materials', the concept of
dynamically varying the shape of an aerodynamic surface during a maneuver is
becoming feasible. A material developed at NASA Ames Research Center (ref.
6) is being investigated for its ability to provide active flow control. Originally
developed as an electro-expulsive de-icing device for aircraft wings,.the idea
here is to employ the material to dynamically adapt the leading edge geometry
of the airfoil in such a way as to delay or prevent the onset of stall.
Before attempting to control dynamic stall, it is first necessary to have a
thorough understanding of the mechanisms responsible for the formation and
development of the dynamic stall vortex. Dynamic stall is a complex
phenomenon which has been shown to depend on a variety of parameters,
including, the airfoil shape, the leading edge geometry, the degree of
unsteadiness, the Reynolds number, and the free stream Mach number to name
2
a few (ref. 7). Compressibility effects have been shown to change the way that
dynamic stall develops, thus a better understanding of these effects has been of
importance and interest in the development of supermaneuverable and highly
agile aircraft. It is well known (ref. 8) that the effects of compressibility set in atlow freestream Mach numbers (M = 0.2 - 0.3) on airfoils operating at high lift
levels, due to the development of extremely strong suction peaks near the
leading edge. These suction peaks are strong enough, in fact, to accelerate the
local flow to supersonic speed. The fact that dynamic lift still persists even when
these compressibility effects appear (ref. 9) supports the argument that the
benefits of dynamic stall can be exploited in flight systems.
Compressible Dynamic_.Stall over a Transiently Pitching Airfoil
An extensive investigation of an airfoil undergoing a constant-pitch-rate
maneuver was performed, using the technique of point diffraction interferometry
(PDI). The investigation was carried out iq the Compressible Dynamic Stall
Facility (CDSF) of the Fluid Mechanics Laboratory at NASA Ames Research
Center. The PDI technique produces constant density interference fringe
patterns which are recorded photographically. The interference fringe patterns
quantitatively map the global flow characteristics, as well as the surface flow
details, and local pressure and Mach number are obtainable using the
isentropic flow relations. The PDI technique lends itself especially well to
mapping unsteady surface pressure distributions on an airfoil since the number
of fringes (and hence, the number of stations at which the pressure is
determined) naturally increases as the pressure gradient increases. In this
investigation, a 3in. chord length NACA 0012 airfoil was pitched about its
quarter chord point from 0 to 60 degrees angle of attack for Mach "numbers
ranging from 0.2 to 0.45 and for pitch rates between 2000°/sec and 3600°/sec.
Tables la and Ib indicate the range and combination of parameters investigated.
The results indicate that, even though the maximum suction pressure on the
airfoil for a given instantaneous angle of attack is dependent upon both pitch
rate and Mach number, the maximum coefficient of pressure obtainable (just
prior to stall) depends only on the freestream Mach number, and decreases with
increasing Mach number (see Figs. 5 and 6 of Appendix A). Pitch rates up to
3600°/sec were examined, and at these high rates locally supersonic flow is
obtained over the leading edge, even for moderate freestream Mach numbers.
3
The observations also showed the formation of multiple shocks on the leading
edge at high pitch rates, and the presence of multiple vortices at low pitch rates,confirming the results of earlier schlieren studies (ref. 10).
The results of this investigation are presented in Appendix A in the form of
an extended abstract submitted to the 31st AIAA Aerospace Sciences Meeting,
to be held January 1993. This Appendix also provides a description of the
experimental facilities, the constant pitch-rate apparatus, and the PDI technique.
Adaptive Geometry Flow Control Device
The PDI investigations have revealed that the leading-edge pressure
gradients, which ultimately lead to separation, develop less rapidly in the
dynamic cases than in the static case. In order to make use of the beneficial
effects of the dynamic lift generated, however, the development of these
gradients must be delayed still further ................. leading-edge geometry is
being examined for its ability to provide this delay. As an active flow control
device, it is envisioned that the leading edge will dynamically increase in
thickness as the airfoil executes the pitch-up maneuver. This "Dynamically
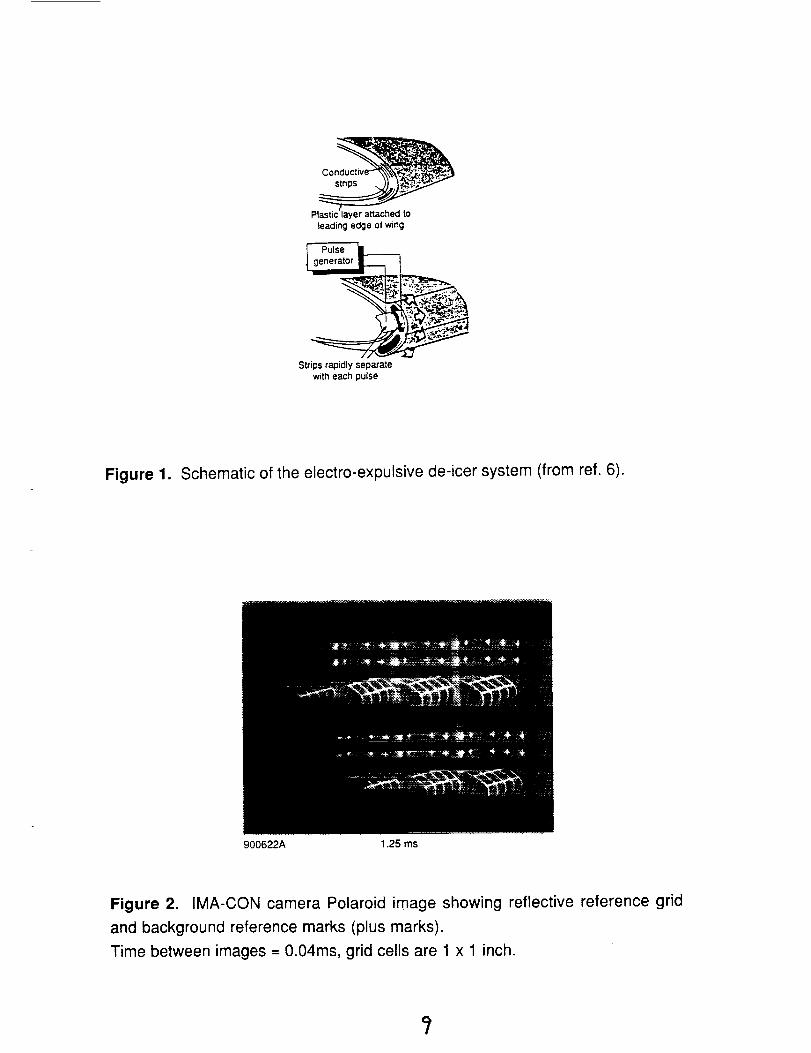
Deforming Leading Edge", or DDLE for short, will be constructed of a material
developed at NASA Ames Research Center as an electro-expulsive de-icing
device for aircraft (refer to Fig. 1 and ref. 6). The material consists of two
conductive strips embedded in elastic sheets. When charged, the
electromagnetic force induced within the ........ causes them to repel one
another making the elastic sheets bulge; the greater the applied charge, the
larger the bulge.
A requisite first step in developing this concept was to precisely
determine the nature of the deformation produced by this material. A sample of
the material, attached to the leading edge of a 10 in. chord NACA 0012 airfoil,
was provided by the Civil Technology Office and used in a series of bench tests.
In these tests, the deformation was imaged on 3 x 4 in. high speed Polaroid
sheet film using an IMA-CON camera. The camera recorded eight to twelve
instantaneous images on each sheet of film, at a framing rate of 25,000 frames
per second. Figure 2 is a representative Polaroid image with the first frame
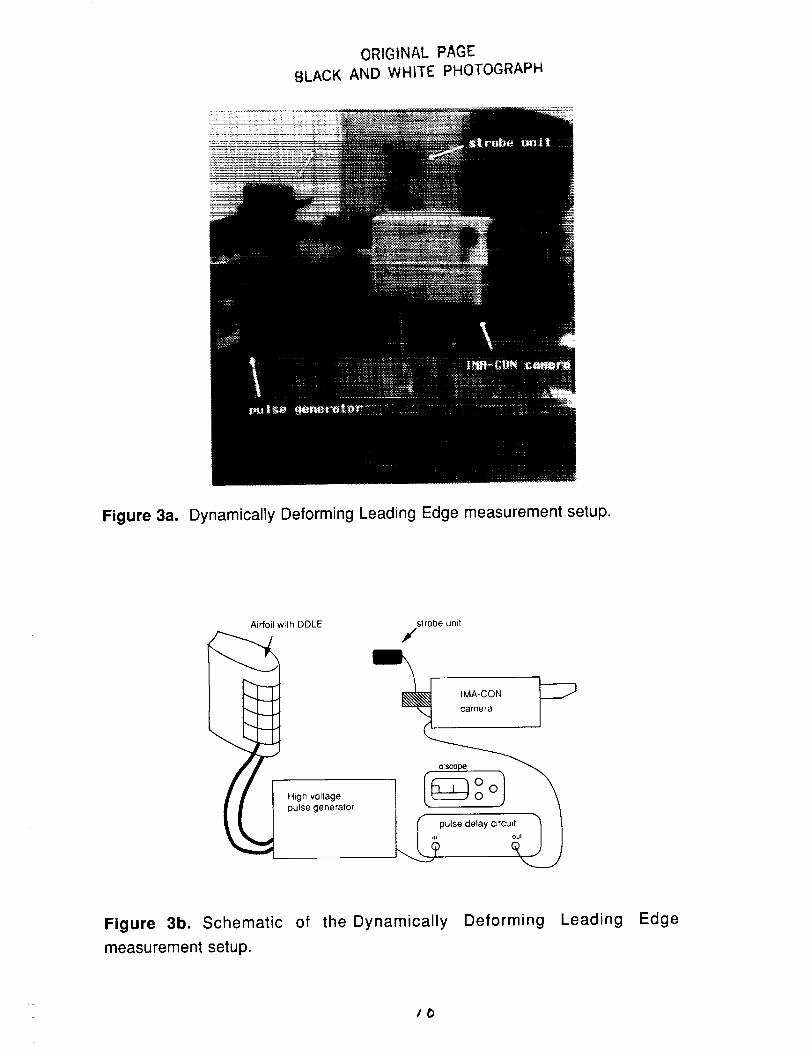
occurring 1.25ms after the start of the deformation. The camera and a strobe
4
light were triggered by the same pulse generator which drove the leading edge
deformation, however, the camera/strobe trigger pulse was passed through anadjustable delay circuit. This delay circuit allowed the camera to capture any
portion of the complete cycle of the deformation in fine detail (the time betweenimages was 0.04ms, while the deformation cycle took approximately 3 ms). The
experimental setup is shown in Fig. 3a and Fig. 3b schematically illustrates the
experiment. An orthogonal grid of retro-reflective tape, applied to the surface of
the airfoil, provided a reference for quantifying the surface deflections. The
photographs were digitized and the shape of the grid lines were recorded using
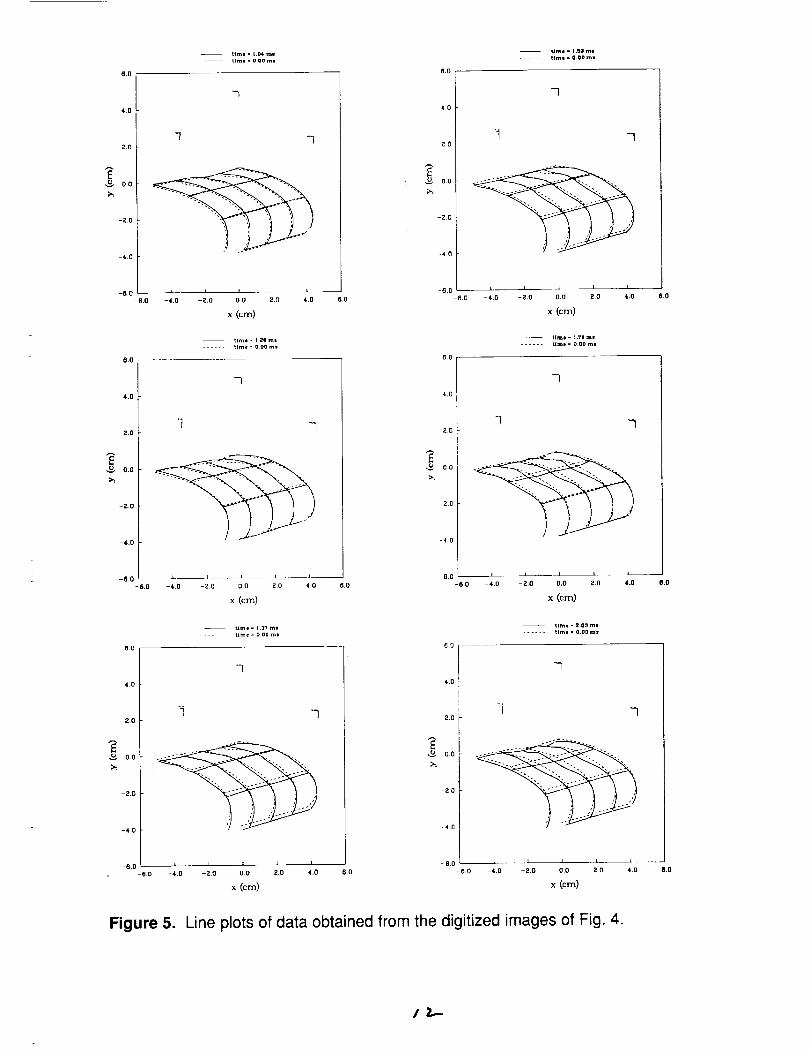
image processing software available on the IRIS work station. Shown in Figs. 4
and 5, respectively, are a sequence of the digitized photographic images, and
the same sequence shown as line plots. The data for the line plots were
obtained via the image processing software. Figure 6 is the profile view of the
mid-span grid line showing the maximum and minimum deformation relative to
the undeformed (neutral) surface. These data have also been animated using
the C-graphics library subroutines available on the Personal IRIS workstation.
The sample of the material utilized in these bench tests contains only one
conductive strip, and the deformation is clearly three-dimensional. These
results are being employed to improve the material design in order to produce
the desired span-wise two-dimensional deformation, which will increase the
thickness of the leading 25% of the airfoil chord length.
The dynamically deforming leading edge will be incorporated in a 6 in.
chord airfoil, which is twice the length of the airfoil employed in the previous
dynamic stall tests performed in the CDSF. As was described in the progressreport (ref. 1), design calculations have been performed to check the
adaptability of the larger airfoil to the test facility. A stronger model mount was
designed to support the increased loads, which necessitated reducing the size
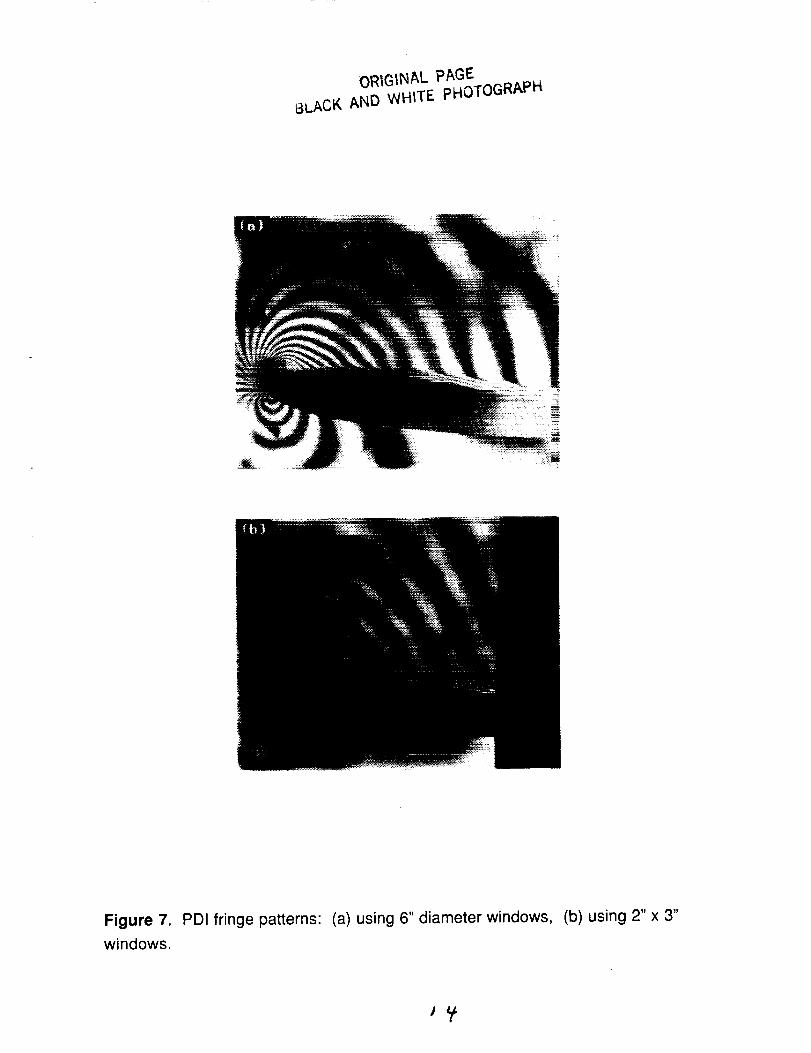
of the glass windows in the test section. Replacing the present 6 in. diameter
windows will be 2 x 3 in. rectangular windows. Rectangular windows have
been chosen to reduce cost and simplify manufacturing and assembly
procedures; particularly desirable for a proof-of-concept study such as this. To
insure that the rectangular windows will have no adverse effect on the formation
of PDI interference fringes, an interferogram was produced with a 2 x 3 in. mask
placed over the existing round windows. This interferogram is shown, in Fig. 7,
5
in comparison with one made under the same conditions but using the roundwindows. Less light reaches the film plane due to the smaller window area (this
will be corrected for by focusing the laser beam to a correspondingly smaller
area), but no anomalies were observed in the fringe pattern.
Conclusions
Interferograms taken during the pitch-up of an airfoil in a moderately
compressible flow have offered new insight into the character of the dynamic
stall vortex occurring under compressible flow conditions. Preliminary analysis
suggests that this vortex is significantly different from that seen in
incompressible dynamic stall for airfoils undergoing ramp motion. In fact, the
later stages of development of the dynamic stall process is clearly affected by
the ramp-motion process when compared to oscillating airfoil behavior even in
compressible flow.
A material has been examined which may have the potential to be used as
an adaptive geometry active flow control device. Incorporated in the leading
edge of an airfoil, the material will allow the leading edge thickness to be varied
dynamically. A technique for measuring the time varying shape of the
dynamically deforming leading edge has been developed. The measurements
were employed to suggest refinements to the material design in order to
produce a more controllable deformation.
Acknowledgements
The funds for this research were provided, through the NASA contract no.
NCC2-637, from the Navy-NASA Joint Institute of Aeronautics, AFOSR, ARO,
and NAVAIR. The guidance and valuable expertise provided by Dr. M. S.
Chandrasekhara, Associate Director of the Navy-NASA Joint Institute of
Aeronautics, and by Dr. L. W. Cart of the U. S. Army AFDD are gratefully
appreciated and acknowledged. This research was performed in the
Compressible Dynamic Stall Facility of the Fluid Mechanics Laboratory (FML),
NASA Ames Research Center. The support of Dr. S. S. Davis, Chief, Fluid
Dynamics Research Branch and that of the FML staff is greatly appreciated.
6
References
[1]. Ahmed, S., "Control of Unsteady Separated Flow Associated with the
Dynamic Stall of Airfoils," MCAT Institute Progress Report no. NCC2-637,
December 1991.
[2]. Carr, L. W., and McAlister, K. W., "The Effect of a Leading Edge Slat on the
Dynamic Stall of an Oscillating Airfoil," AIAA Paper 83-2533, October 1983.
[3]. Ericsson, L. E., "Moving Wall Effects on Dynamic Stall Can Be Large - Fact
or Fiction?," AIAA Paper 91-0430, January 1991.
[4]. Acharya, M., and Metwally, M. H., "Evolution of the Unsteady Pressure Field
of a Pitching Airfoil," AIAA Paper 90-1472, June 1990.
[5]. Huyer, S. A., and Luttges, M. W., "Unsteady Separated Flows Driven by
Periodic Leading Edge Deformation," AIAA Paper 87-1234, June 1987.
[6]. Jonathan Beard, "Plastic Ribbon Shakes the Ice off Aircraft," New Scientist,
May 12, 1990, p. 36.
[7]. McCroskey, W. J., "The Phenomenon of Dynamic Stall," NASA TM 81264,
March 1981.
[8]. Chandrasekhara, M. S. and Carr, L. W., "Flow Visualization Studies of the
Mach Number Effects on the Dynamic Stall of an Oscillating Airfoil," AIAA Paper
No. 89-0023, January 1989.
[9]. Chandrasekhara, M. S., Cart, L. W., and Ahmed, S., "Comparison of Pitch
rate History on Dynamic Stall," Proc. NASA/AFOSR/ARO Workshop on Physics
of Forced Unsteady Separation, April 17 - 19, 1990, Moffett Field, CA.
[10]. Chandrasekhara, M.S., Ahmed, S., and Carr, L. W., "Schlieren Studies of
Compressibility Effects on Dynamic Stall of Airfoils in Transient Pitching
Motion," AIAA Paper No. 90-3038, August 1990.
?
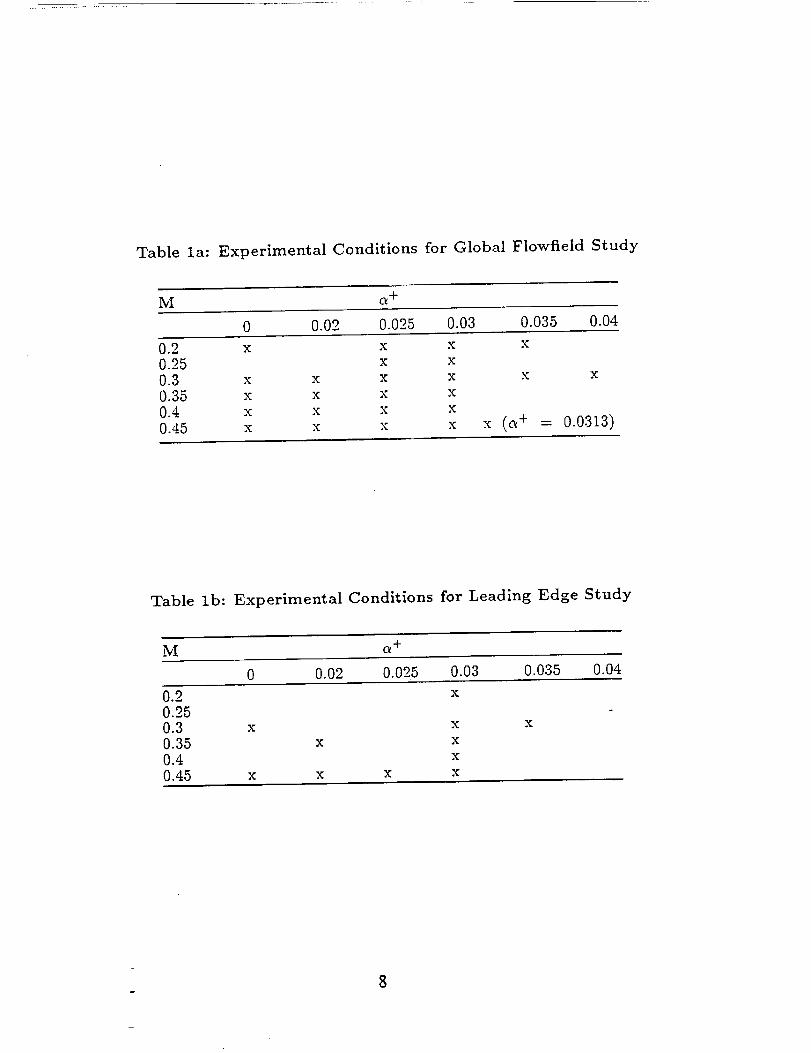
Table la: Experimental Conditions for Global Flowfield Study
M ce ÷
0 0.02 0.025 0.03 0.035 0.04
0.2 x x x x
0.25 × ×
0.3 x x x x x x0.35 x x x x0.4 x x x x
0.45 x x x x x (c_ + = 0.0313)
Table lb: Experimental Conditions for Leading Edge Study
0 0.02 0.025 0.03 0.035 0.04
0.2 x0.250.3 x x x0.35 x x0.4 x0.45 x x x x
Plastic layer attached to
leading edge of wing
Strips rapidly sep_ate
with each pulse
Figure 1. Schematic of the electro-expulsive de-icer system (from ref. 6).
900622A 1.25 ms
Figure 2. IMA-CON camera Polaroid image showing reflective reference grid
and background reference marks (plus marks).
Time between images = 0.04ms, grid cells are 1 x 1 inch.
ORIGINAL PAGE
BLACK AND WHITE PHOTOGRAPH
Figure 3a. Dynamically Deforming Leading Edge measurement setup.
Airfoil with DDLE
High voltagepulse generator
strobe unit
/
IMA-CON
Figure 3b. Schematic of the Dynamically Deforming Leading Edge
measurement setup.
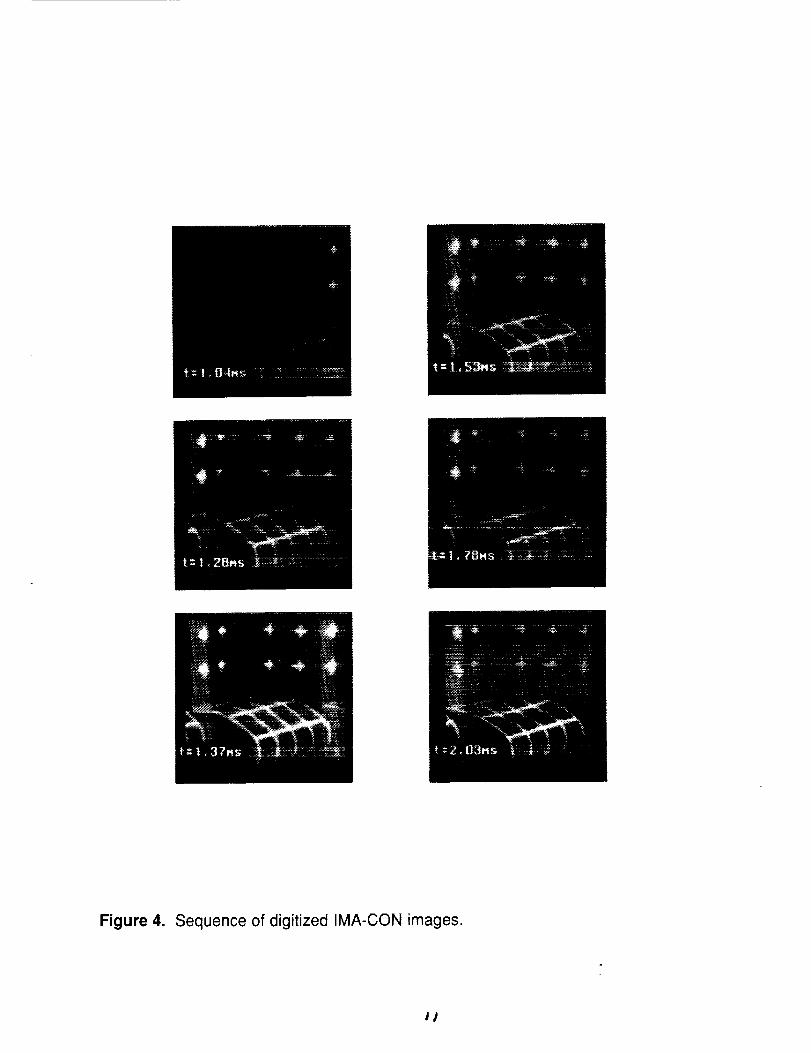
Figure 4. Sequence of digitized IMA-CON images.
I!
tirol. [ .o/_ ml ¢lme - 1.53 ms
.... Uml. o,oo ml ...... time = O,OO ml
8.0
40
2.0
o.o
-2.0
-4-.0
7
-8,0
-8.0 -4.0
8.0
4.0
Z,O
o.o
-2,0
-4.0
-8.0
8,0
8.0
4.0
2.0
o o o
-2.0
-4.0
7
• _ -6.0 _ j [ I I
-2.0 0.0 2.0 4.0 6.0 -8.0 -4.0 -2,0 0.0 2.0 4.0
× (cm) x (cm)
4,0
timJ = 1.71 ml
.... tlme = o O0 mltlme = l.zg me
...... tlme 000 m.
7
7 7
-6.0 -4.0
2.0
4.0
7
7 7
I t _ __ J- I 6.0 I I = I. I
-2.0 0.0 2.0 4.0 6.0 -6.0 -4.0 -2.0 0.0 2.0 4.0
X (cm) X (cm)
2,0
o.o
time = 1.37 m_ time - |.03 ml
- - - time = 000 mJ ..... time = 0.00 ms
--2.0
--40
7
7 7
6.0
4,10
20
o.o
ZO
_4.1"i
"7
7 7
--- I I I 1---6.0 I i Z I I - fl.O
-6.0 -4.0 -2.0 0.0 2.0 4.0 8.0 -6.0 -4.0 -2.0 0,0 2_0 40
X (cm) X (era)
Figure 5. Line plots of data obtained from the digitized images of Fig. 4.
8.0
8.0
B.O
/Z,--

2.0
o=,=1
t.5
t.O
0.5
time = 0.00 ms
time = 1.20 ms
...... time = 2.03 ms
I I I0.0 I
0.0 0.5 1.0 1.5 2.0 2.5
x (in)
Figure 6. Profile view of the mid-span reference grid line showing maximum
deflections from the neutral surface.
/3
oR|G|NAL pAGE
t_LACK AND WHITE PHOTOGRAPH
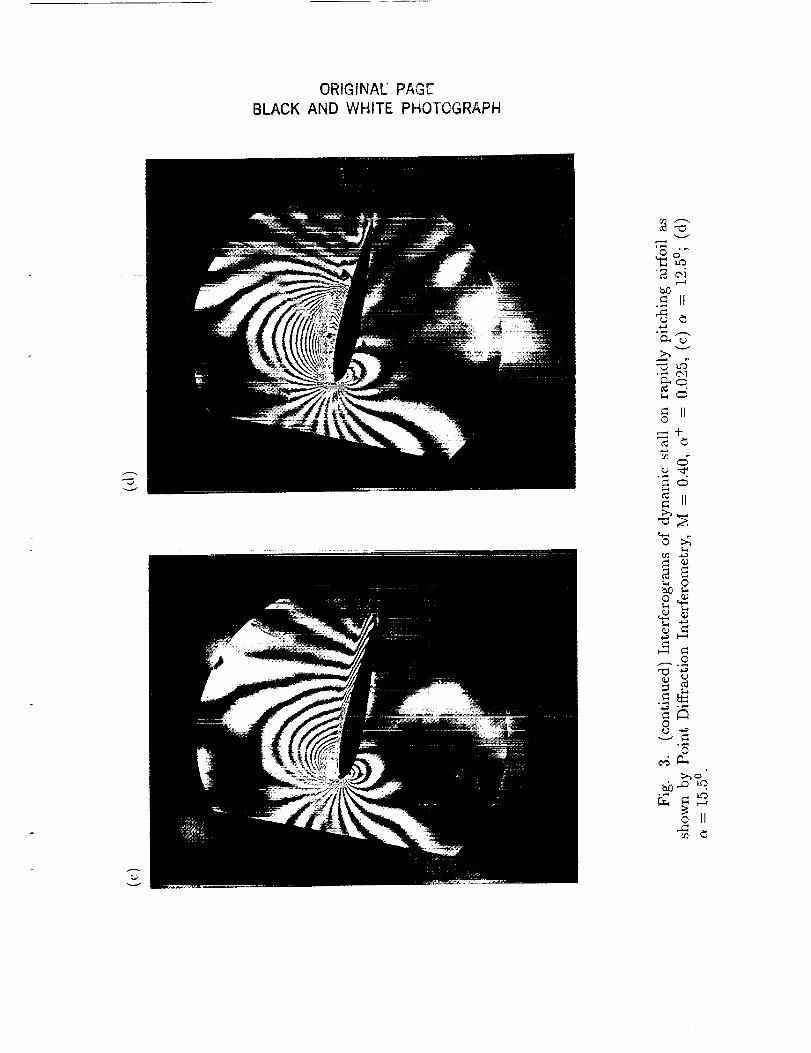
Figure 7. PDI fringe patterns: (a) using 6" diameter windows, (b) using 2" x 3"
windows.
J,f

APPENDIX A
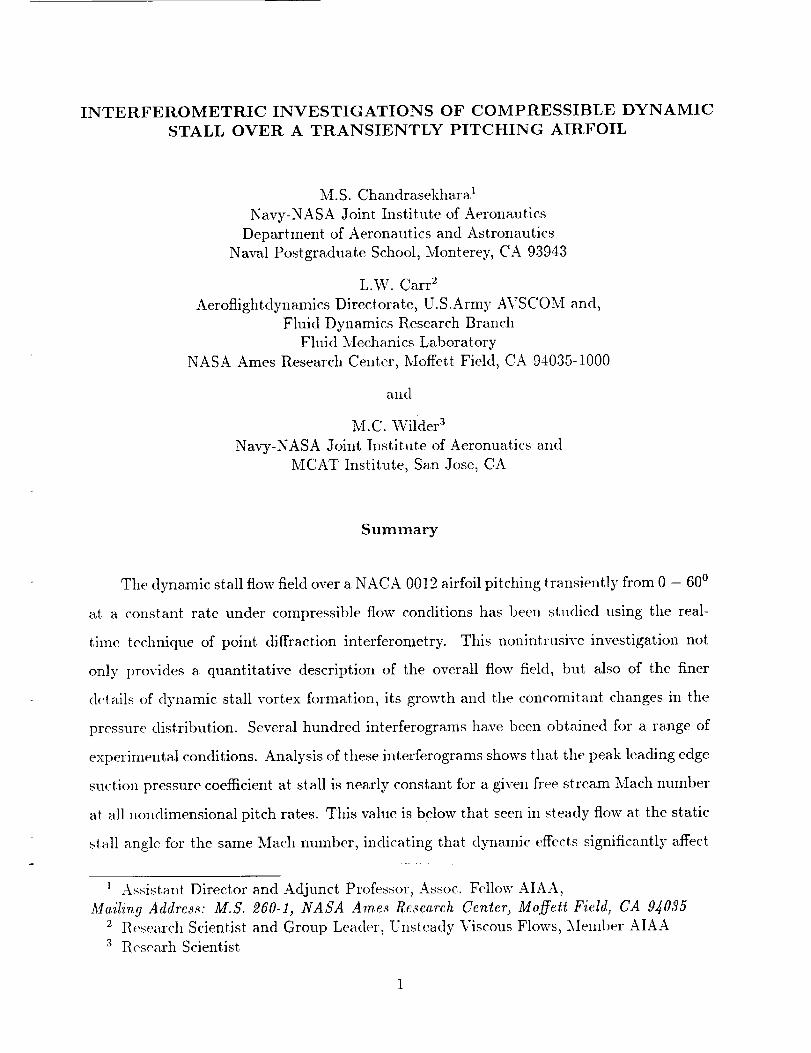
INTERFEROMETRIC INVESTIGATIONS OF COMPRESSIBLE DYNAMIC
STALL OVER A TRANSIENTLY PITCHING AIRFOIL
M.S. Chandrasekhara'
Navy-NASA Joint Institute of Aeronautics
Department of Aeronautics and Astronautics
Naval Postgraduate School, Monterey, CA 93943
L.W. Carr 2
Aeroflightdynamics Directorate, U.S.Army A\.'SCOM and,
Fluid Dynamics Research Branch
Fluid Mechanics Laboratory
NASA Ames Research Center, Moffett Field, CA 94035-1000
and
M.C. Wilder 3
Navy-NASA Joint Institute of Aeronuatics and
MCAT Institute, San Jose, CA
S uminary
The dynamic stall flow field over a NACA 0012 airfoil pitching transiently from 0 - 600
at a constant rate under compressible flow conditions has been studied using tile real-
time technique of point diffraction interferometry. This nonintrusive investigation not
only provides a quantitative description of the overall flow field, but also of the finer
details of dynamic stall vortex formation, its growth and the concomitant changes in the
pressure distribution. Several hundred interferograms have been obtained fi)r a range of
experimental conditions. Analysis of these interferograms shows that the peak leading edge
suction pressure coefficient at stall is nearly constant for a given h'ee stream Math number
at all nondimensional pitch rates. This value is below that seen in steady flow at the static
stall angle for tile same Mach number, indicating that dynamic effects significantly affect
1 Assistant Director and Adjunct Professor, Assoc. Fellow AIAA,
Mailing Address: M.S. 260-1, NASA Ames Research Center, Moffett Field, CA 9_035
2 Research Scientist and Group Leader, Unsteady Viscous Flows, Member AIAA
3 Ilesea.rh Scientist
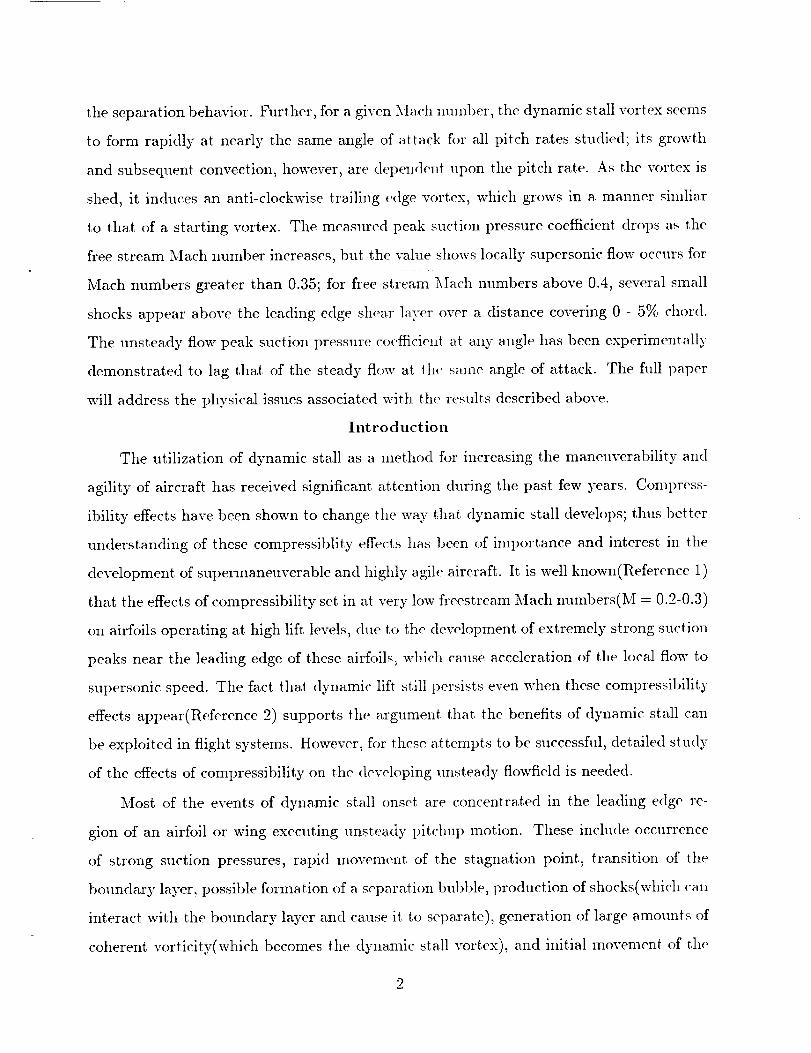
the separation behavior. Further, for a given Math nmnber, tile dynamic stall vortex seems
to form rapidly at nearly the same angle of attack fi)r all pitch rates studied; its growth
and subsequent convection, however, are dependent upon the pitch rate. As the vortex is
shed, it induces an anti-clockwise trailing ('dge vortex, which grows in a manner simliar
to that of a starting vortex. The measured peak suction pressure coefficient, drops as the
fl'ee stream Math number increases, but. the value shows locally supersonic flow occurs for
Ivlach numbers greater than 0.35; for fl'ee stream Mach numbers above 0.4, several small
shocks appear above the leading edge shear layer over a distance covering 0 - 5% chord.
The unsteady flow peak suction pressure coefficient at any angle has been experimentalls'
demonstrated to lag that of the steady flow at the' same angle of attack. The fldl paper
will address the physical issues associated with the results described above.
Int ro d uction
The utilization of dynamic stall as a method fi_r increasing the maneuverability and
agility of aircraft has received significant attention during the past few years. Compress-
ibility effects have been shown to change the way that dynamic stall develops; thus better
understanding of these compressiblity effects has been of importance and interest in the
development of supermaneuverable and highly agile aircraft. It. is well known(Reference 1)
that the effects of compressibility set in at. very low freestream Math numbers(M = 0.2-0.3)
on airfoils operating at high lift levels, due to the development of extremely strong suction
peaks near the leading edge of these airfoils, which cause acceleration of the local flow to
supersonic speed. The fact that dynamic lift still persists even when these compressibilits_
effects appear(Reference 2) supports the argument, that the benefits of dynamic stall can
be exploited in flight systems. However, for these attempts to be successfld, detailed study
of the effects of compressibility on the developing unsteady flowfield is needed.
Most of the events of dynamic stall onset are concentrated in the leading edge re-
gion of an airfoil or wing executing unsteady pitchup motion. These include occurrence
of strong suction pressures, rapid movement of the stagnation point., transition of the
boundary layer, possible formation of a separation bubble, production of shocks(which ('an
interact with the boundary layer and cause it. to separate), generation of large amounts of
coherent, vorticity(which becomes the dynamic stall vortex), and initial movement of the
2
dynamic stall vortex over the airfoil. In contrast to dynamic stall onset, the later stagesof
dynamic stall devch)pmentrequiresknowledgeabout the flowfield away fl'om the surface
of tile airfoil. Glol)al characteristicsof the flowfield are neededin order to understand the
interactions that occuras the vortex movesdown the airfoil; as the vortex movespast.the
trailing edge,additional eventssuchasgenerationof a trailing edgevortex, redistribution
of the flow field over the airfoil, etc, occur which needto be documented if this dynamic
flowfieht is to be controlled and utilized.
Experiments focusedon theseissuesare ongoing in the CompressibleDynamic Stall
Faeility(CDSF) at the Fluid MechanicsLaboratory(FML) at. NASA Ames Research Center.
These experiments are directed toward improved understanding of these complex fluid
interactions, and toward establishing a benchmark data base fi)r computational studies.
These experiments involve quantitative documentation of the dynamic stall flow field of
an airfoil executing a constant-pitch-rate maneuver fl'om 0 to 60 degrees angle of attack
for a range of pitch rates at. freestream Mach nmnbers varying from 0.20 to 0.45. A real-
time point diffraction interferometry technique has been used to obtain global information
throughout the fldl pitching process, as well as details of the flow near the leading edge
during the onset, of dynamic stall. These interferograms are presently being analysed; some
of the results of this analysis are described below. More detailed analysis of the results
will be presented in the full paper.
Description of the Facility, Technique and
Instrumentation
The Compre_._.qiblc Dynamic Stall Facility (CDSF) was established for conducting dy-
nmnic stall research in the FML as a part of the Na'_5"-NASA Joint Institute of Aeronautics.
This facility is specifically designed for study of dynamic stall over a range of Mach num-
bers, using non-intrusive optical flow diagnostic techniques. It is operated as a part of
the in-draft tunnel complex at the FML (for details see Carr and Chandrasekhara3). The
CDSF is unique in that the airfoil is supported between two 2.54 ('m thick optical quality
glass windows by pins that are smaller than the local airfoil thickness. Thus, the entire flow
field including the airfi_il surfacescanbe viewedunobstructed by any support mechanism.
This enablesthe study of the flow at the surfacenear the leadingedge,where the dynamic
stall vortex forms, aswell as the flow field away from the airfoil.
The modifications to the CompressibleDynamic Stall Facility to produce the rapid
ramp-type pitching of an a.irfi_ilat constant,pitch rates areshownin Figure 1 (earlier work
in this facility wasperformed on an oscillating airfoil; for details, seeCha.ndrasekharaand
Carr1). The present systemusesa a hydraulic drive to produce the unsteady motion; the
specificationsare asfi_llows:
angleof attack, n:
pitch rate, d:
maxinmm accelerationrate:
changein a' during acceleration:
minimum accelerationtime:
free stream Mach number:
airfoil chord:
Reynoldsnumber:
0-60°
0-3600 °/see
600,000 °�see2
<_6° of pitch
4 ms
0.1-0.5
7.62cm
2x10 ,_ _ lxl06
The pitch rate of 3600 °/see on the 7.62 cm chord airfoil corresponds to a 90°/sec pitch
rate of a 3m chord airplane wing at. any given Math number; thus, the rates obtainable
from the design are directly applicable to flight conditions. In order to limit or isolate the
effects of transients on separation, the change in angle of attack during a.ecelera.tion and
the acceleration time itself were limited to less than 6 ° and 4 ms, respectively. To properly
sinmlate a maneuver, an angle of attack range of 0- 60 ° was selected. To provide for
reasonable experiment times, the facility has a recycle time of 2 seconds (30 runs/minute).
The system uses both the airfoil position and velocity information in its feed back loops
to properl 5" perform any required maneuver which can be selected through software. The
complete details of the final design are presented in Chandrasekhara and Carr 4.
The airfoil position was read by a. digital optical encoder, whose output was input to
the digital I/O board of a micro\\__X II Work Station and timed with its int('rnal clock.
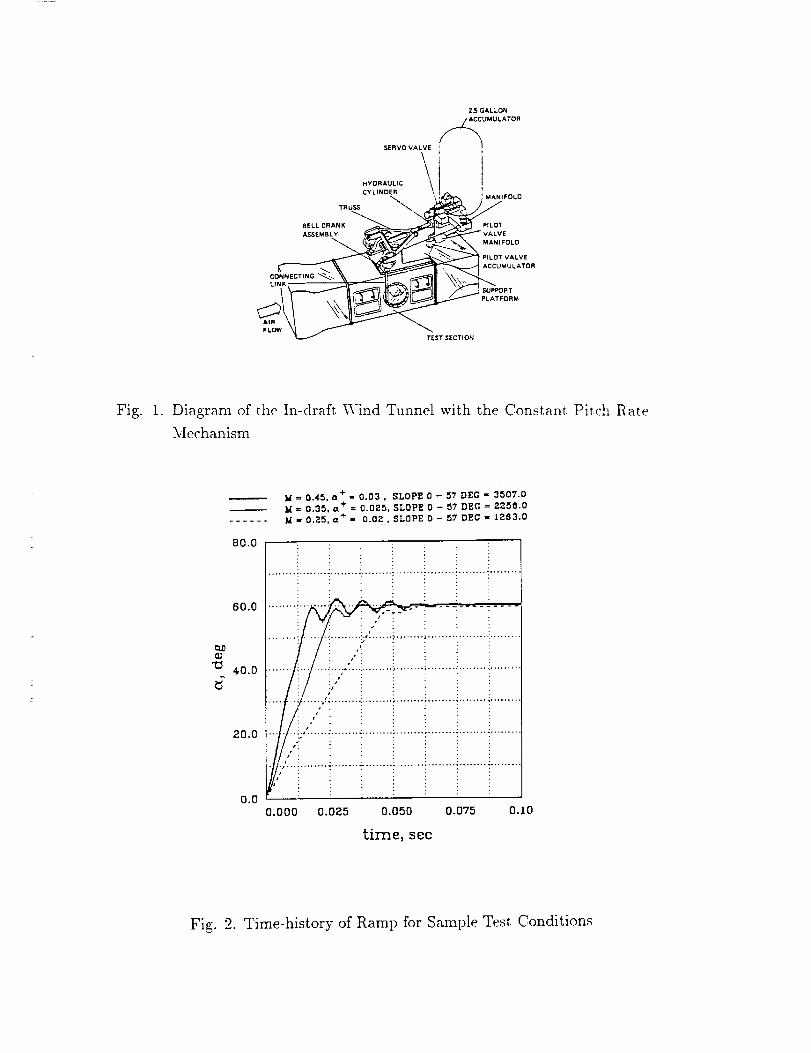
Figure 2 shows an example of the actual rates obtained, including the variation of the
angleof attack during the various parts of the pitch-up motion in an experiment. As can
be seen,the airfoil goesthrough its static stall anglewith a linear rate of changeof angleof
attack. For the highest rate, the motion is completed in 18 ms,beyond which the system
is settling down (at the highest angle). All the testswere limited to the linear range.
The CDSF is equipped with a wide range of non-intrusive optical flow diagnostic
instrumentation suchas stroboscopicschlieren,laser Doppler velocimetry, holographicin-
terferometry and point diffraction interferometry systems.The present paper will present
results obtained using the point diffraction interferometry system.
Point Diffraction Interferometry Technique
The point diffraction interferometry techniqueused in this study utilizes the ability
of a point discontinuity (in the form of a pin-hole) located at the image of a point source
to diffract a portion of the incident light into a spherical referencewave front. In the
present application, the primary optics of an existing schlieren system were used (see
Reference5 for details), with a pulsedNd:YAG laser replacing the conventional spark as
the light source,and a specially created point diffractor replacing the usual knife edge.
The laser light wasexpanded through a microscopeobjective to fill the schlierenmirror,
transmitted through the test. section, and refocusedby another schlieren mirror. The
exposedphotographic plate used to create the point-diffraction spot was placed at the
fi:)cusof this secondmirror, and the laser waspulsedwith enoughenergyto burn a hole,
or spot, in the emulsion located at the focal plane of the secondmirror. The spot was
created in situ by passing light through the test section at a no-flow condition. The spot
was precisely tailored to the application under investigation, automatically correcting for
nonunifi)rmities in the light source or optics. The tunnel was turned on and the real-
time interference fringes were recorded on Polaroid film(ASA 3000), and were available for
immediate viewing. More detail about the point diffraction interferometry technique used
in this study can be found in References 6 and 7.
Results
5
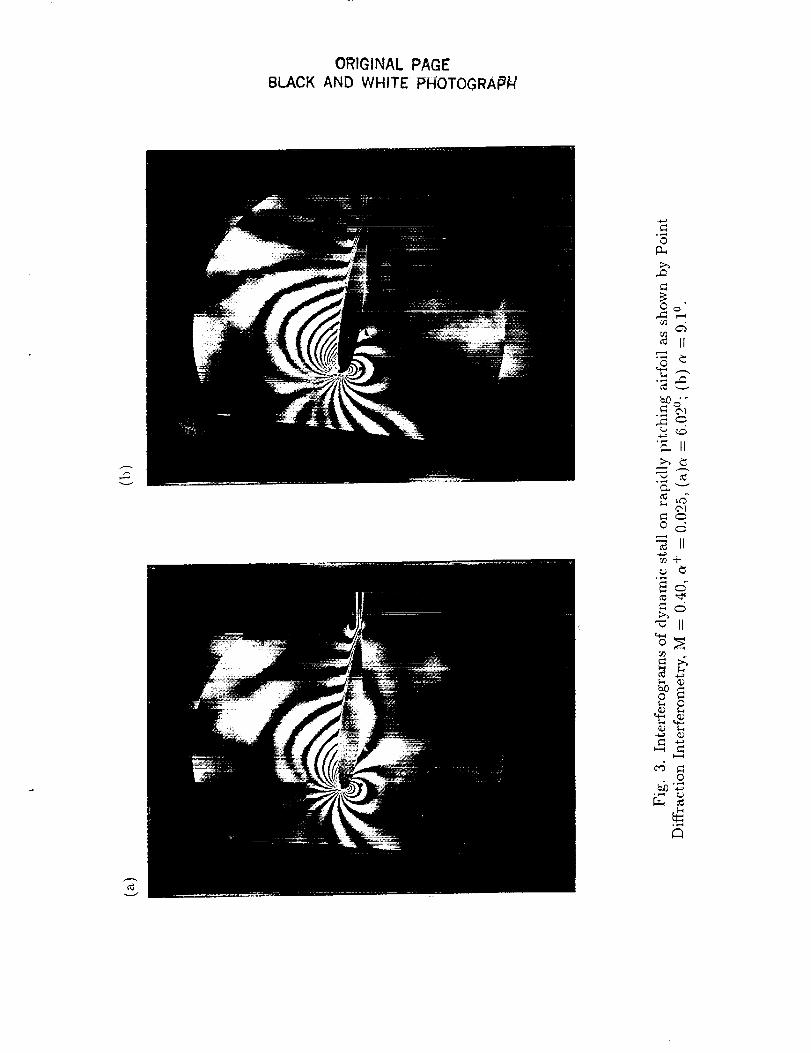
Severalsequencesof interferogramswere obtained for a range of Mach numbersand
pitch rates, ranging fl'om 0.3 - 0.45 and 2000°/sec - 3600°�see, respectively. Figure 3
presents one such sequenceereat.edfor M = 0.40, tt + = 0.025 (a.t a pitch rate of 2585
degrees/see, where the non-dimensional pitch rate is defined as r_+ ac- _). The laser
light, source was strobed at the appropriate phase angle (including the correct delay due
to the time it takes to lase) by using hardware specially built fox' this purpose. The actual
instantaneous angle of attack at which the laser fired was read by fl'eezing the encoder
display using speciall 5' built light sensitive (photo-diode based) hardware. These images
present instantaneous quantitative measurements of the actual density fiehl associated
with the development of dynamic stall on the airfoil and offer the first insight into the
compressible field away from the airfoil sm'fa.ce for airfoils undergoing ramp moti_m.
Figure 3a shows that at a = 6.02 °, the flow on the rapidly pitching airfi:_il is smoothly
progressing through the region _,f high negative pressure; compare this to Figure 3b, at
(_. = 9.1 °, where a leading edge bubble has developed. Figure 3c shows that at the angle of
attack of 12.5 ° the dynamic stall process has begun, as can be seen near the leading edge.
The flow over the airfoil is still attached as can be seen by the fl'inges in the, boundary
layer on the rear part of the airfi_il; in fact, the outer flow passes smoothly around the
vortex and blends into the boundary layer without any discontinuities. As the angle of
attack is increased to 15.5 ° degrees (Figure 3d), the presence of the dynamic stall vortex
is clearly observal)le. It should be noted t.hat, up to this angle of attack, the ramp-nlotion
dynamic stall process appears very similar to that which occurs on airf_ils oscillating in
pitch. However, the ramp-motion stall process becomes signficantly different as the angle
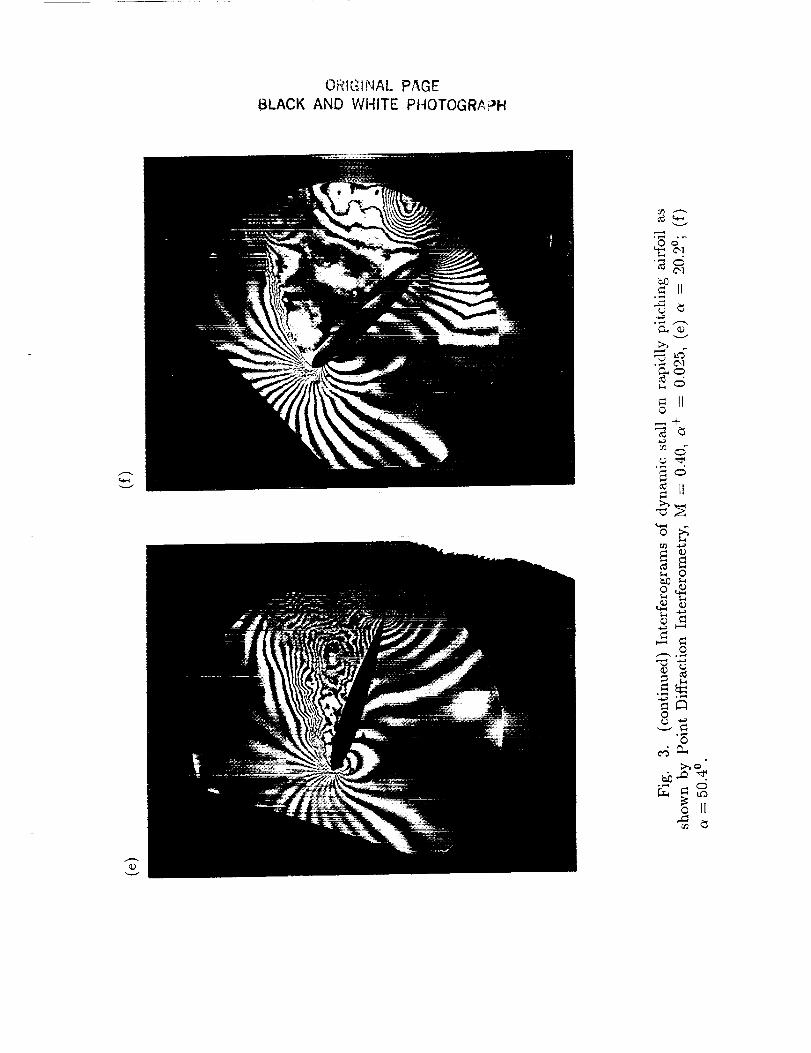
continues to increase. Figure 3e, at. c_. = 20.2 °, shows the character of the flow when
the dynamic stall w)rtex is at 75%. chord; here there is a strong interaction between the
ds,namic stall vortex and a vortex which is forming at the trailing edge. This interaetion is
very obvious in Figure 3f, which shows the flowfield as the airfoil dynamically passes 50.4
degrees angle of attack. Here the trailing-edge vortex has moved away fl-om the airfoil;
note the very strong pressure gradients in the flow below the airfoil near the trailing edge.
These gradients do not appear in the flow directly above the flow line emanating from the
trailing edge of the airfoil, demonstrating that the airfoil is still supporting a significant
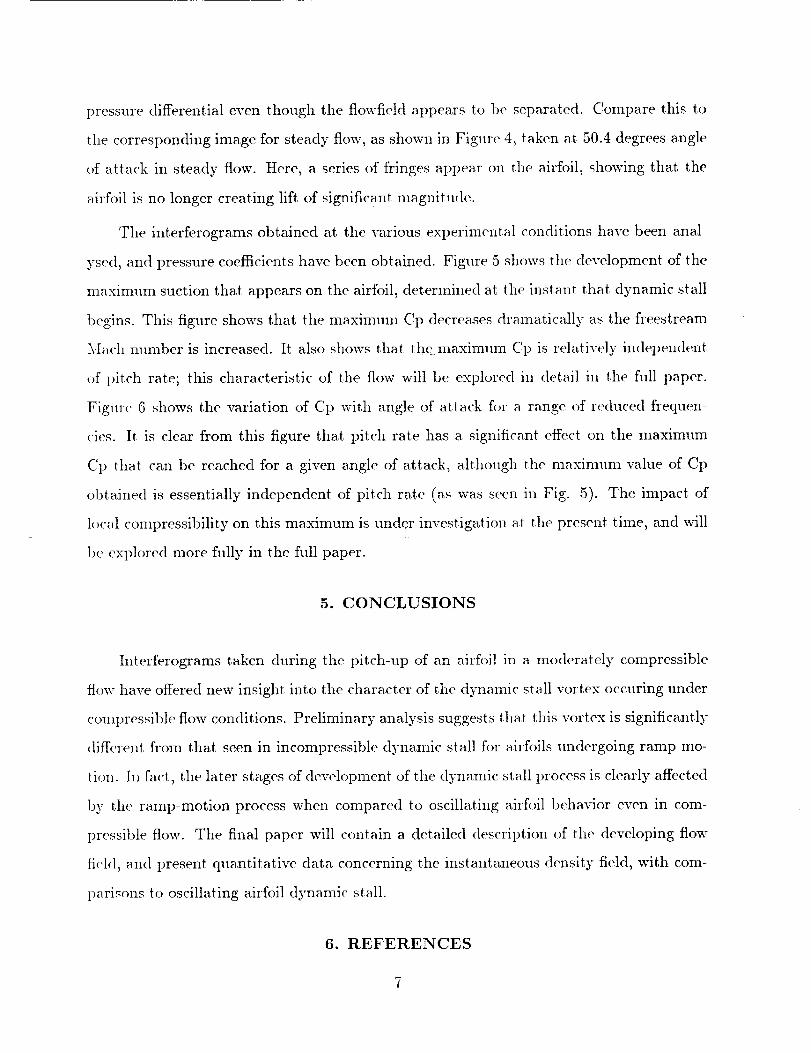
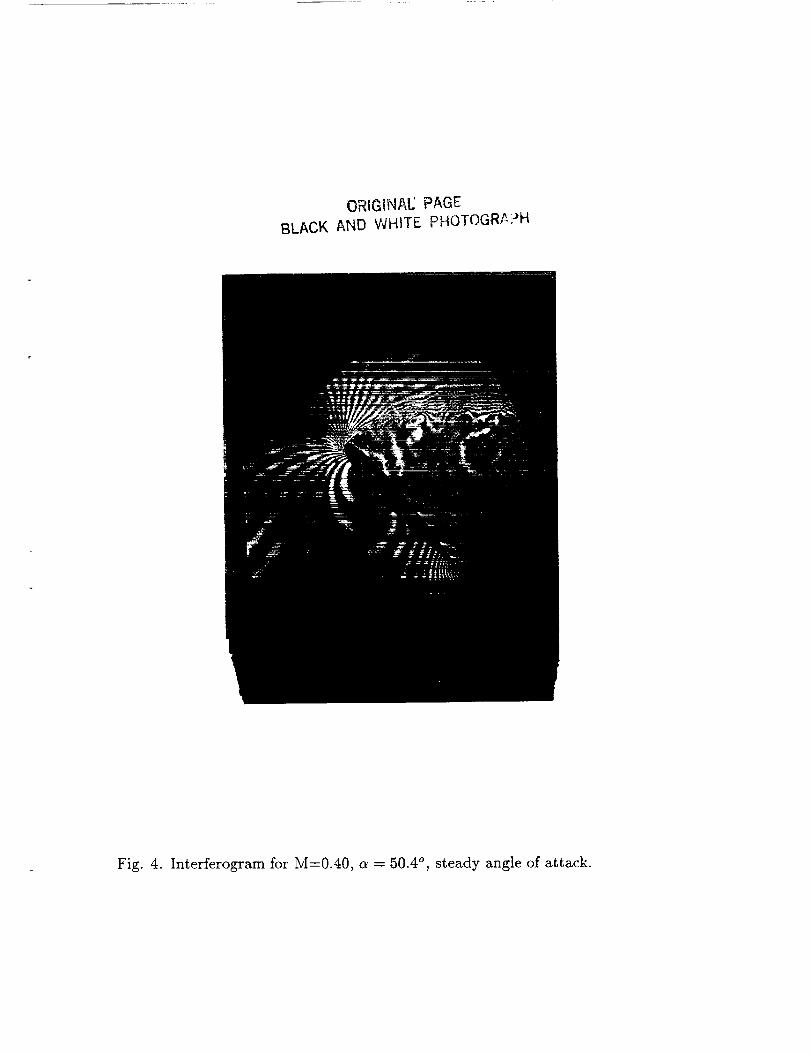
pressuredifferential even though the fiowfield appears to be separated. Compare this to
tile correspondingimagefor steady flow, asshownin Figure 4, taken at 50.4degreesangle
of attack in steady flow. Here, a seriesof fringes appearon the airfi)il, showing that the
airfl:)il is no longer creating lift of significant magnitude.
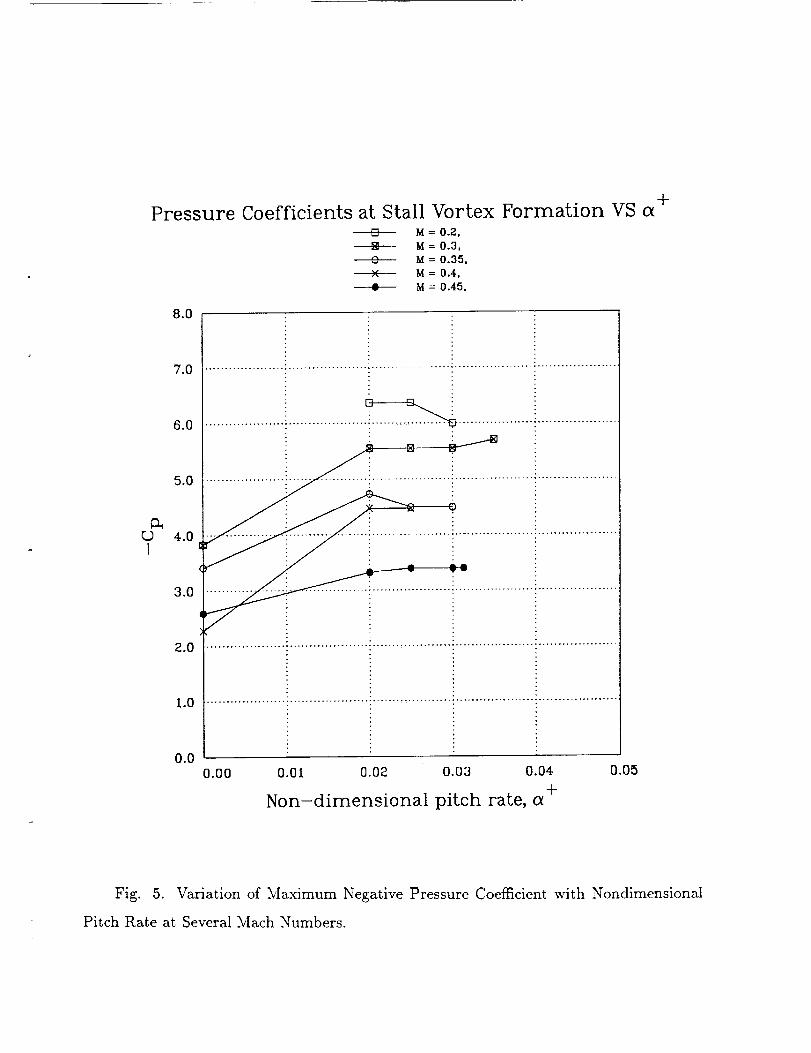
The interferograms obtained at the various experimental conditions havebeen anal-
ysed,and pressurecoefficientshave beenobtained. Figure 5 showsthe developmentof the
maximum suction that appearson the airfoil, determined at the instant that dynamic stall
begins. This figure showsthat the maxirnmn Cp decreasesdramatically as the freestream
Math number is increased. It also showsthat the maximmn Cp is rela.tively independent
of pitch rate; this characteristic of the flow will be explored in detail in the full paper.
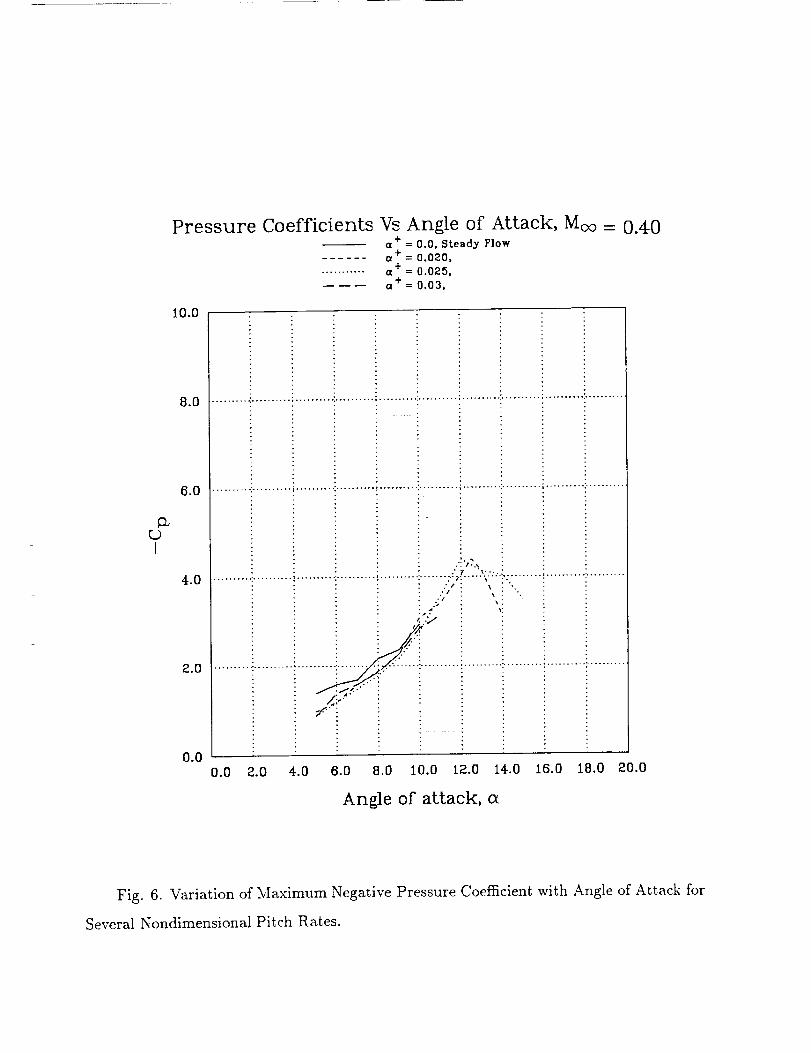
Figure 6 shows the variation of Cp with angleof attack fin" a range of reduced frequen-
cies. It is clear from this figure that pitch rate has a significant effect on the maximum
Cp that can be reachedfor a given angle of attack, although the maxinmm value of Cp
obtained is essentiMly independent of pitch rate (a.swas seenin Fig. 5). The impact of
local compressibility on this maximum is under investigation at the present time, and will
1)eexplored more fully in the full paper.
5. CONCLUSIONS
Interferograms taken during the pitch-up of a.nairfoil in a moderately compressible
fl()w haveofferednew insight into the characterof the dynamic stall vortex oeeuringunder
compressibleflow conditions. Preliminary analysissuggeststhat this vortex is significantly
different from that, seenin incompressibledynamic stall fi)r airfoils undergoing ramp mo-
tion. In fact, the later stagesof developmentof the dynamic stall processis clearly affected
by t.heramp-motion processwhen compared to oscillating airfl:)il behavior even in com-
pressibleflow. The final paper will contain a detailed description of the developingflow
fi('l(l, and present quantitative data.concerningthe instantaneousdensity field, with com-
parisonsto oscillating airfoil dynamic stall.
6. REFERENCES
7
[1]. M.S.Chandrasekharaand L.W.Carr, "Flow Visualization Studiesof the Mach Number
Effects on tile Dynamic Stall of an Oscillating Airfoil", AIAA Paper No. 89-0023,Jan.
1989.
[2]. M.S.Chandrasekhara, L.W.Carr, and S.Ahmed, "Comparison of Pitch rate History
on Dynamic Stall", Prec. NASA/AFOSR/ARO Work_hop on Physic_ of Forced UTu_teady
Separation, April 17 - 19, 1990, Moffett Field, CA.
[3]. L.'_\r.Carr, and M.S.Chandrasekhara, _'Design and Development of a Compressible
Dynamic Stall Facilits", AIAA Paper No. 89-0647.
[4]. M.S.Chandrasekhara and L.W. Carr, "'Design and Development of a Facilit 5" for Com-
pressible Dynamic Stall Studies of a Rapidly Pitching Airfoil", Proceedings of the 13 _h
ICIASF Conference, Goettingen, \¥est Germany, Sept• 18-21, 1989.
[5]. Carr, L.W., Chal_drasekhara, M.S., Ahmed, S., and Brock, N.J., "A Study of Dynamic
Stall Using Real Time Interferomet.ry", AIAA Paper No. 91-0007, presented at the AIAA
29th Aerospace Sciences Meeting, Reno, NV, January 7-11, 1991•
[6.] Carr, L.W., Chandrasekhara, M.S., and Brock, N.J., "A Quantitative Study of Un-
steady Compressible Flow Over an Oscillating Airfoil", AIAA Paper No. 91-1683, pre-
sented at the AIAA 22nd Fluid Dynamics, Plasma Dynamics and Lasers Conference, Hon-
olulu, HI, June 24-27, 1991.
S[7.] Brock, N.J., (handra_ekhara, M.S., and Carr, L.W., "A Real Time Interferome-
try System fi:_r Unsteady Flow Measurements", presented at the ICIASF '91 Conference,
Rockville, MD, October 25-28, 1991.
2.5 GALLON
_CUMU LATOR
SERVO VALVE I
\ iCYLINDER
TR U'¢_S_ FOLD
CINK SUPPORT
TEST SECTION
Fig. 1. Diagram of the In-draft Wind Tunnel with the Constant Pitch Rate
Mechanism
M= 0.45, a += 0.03, sLoPE0-5?'DEG= 3507.0N = 0.35, a + = 0.025, SLOPE 0 - 57 DEC = 2256.0
...... M = 0.25, a + - 0.02 , SLOPE 0 - 57 DEC = 1283.0
80.0
60.0 ........ : ........ " ..... _- .... "-" .......
........ ! "': ......... _, .... : : : :
:, ': : : .
"12 40.0
t. " ..; ........ ; ........ ; ........ 4 .........
20.0
I t_ ;
0.0
0.000 0.025 0.050 0.075
time, see
0.I0
Fig. 2. Time-history of Ramp for Sample Test Conditions
ORIGINAL PAGE
BLACK AND WHITE PHOTOGRAP_
O
v
]1_+
_d
%.-i
oN
N?
_ 0
0_:_ .,-,
• _ _,_
Cl
ORiGINAl: PAGE
BLACK AND WHITE PHOTOGRAPH
,%,1
aO
o ,...,
"_-_,
,....-,
o,...+
_ 0
I.....4
0
o,._
o
o
o II
ORIGINAL PAGE
BLACK AND WHITE PHOTOGRA,_H
%-
o,1
o_-_
O
,--_+
or_
O
0
.p,q
0
°_,,q0
o II
£)RIG!NA!E PAGE
BLACK AND WHITE pt--iOTOGR_,?H
Fig. 4. Interferogram for M=0.40, a = 50.4 °, steady angle of attack.
+Pressure Coefficients at Stall Vortex Formation VS a
M = 0.2,
+ M = 0.3,
M = 0.35,
---X---- M = 0.4,
+ M = 0.45,
8.0
I
7.0
6.0
5.0
4.0
3.0
a.O
I.O
0.0
iiiiiii!iiii!!iiiiiiiiii!!!!
0.00 0.01 O.Oa 0.03 0.04 0.05
+Non-dimensional pitch rate, a
Fig. 5. Variation of Maximum Negative Pressure Coefficient with Nondimensional
Pitch Rate at Several Math Numbers.
Pressure
I0.0
Coefficients Vs Angle of Attack, Moo =a + = 0.0, Steady Flow
+...... a = 0.020,
+........... a = 0.025,_+ = 0.03,
0.40
(JI
8.0
6.0
4.0
2.0
0.0
.......... . .......... i .......... , .......... , ........... , ......... , .......... , .......... , .......... . ..........
.'_ 's :..,
............................................................ ::'/....'.,._-...:................................
• / •.9 _' :
j,
//.'"i
.i i i ?
2
: i
0.0 2.0 4.0 e.o 8.o 1o.o [z.o _4.o 16.o le.o zo.o
Angle of attack, a
Fig. 6. Variation of Maximum Negative Pressure Coefficient with Angle of Attack for
Several Nondimensional Pitch Rates.