control and management of a solar-wind …jestec.taylors.edu.my/vol 13 issue 6 june...
TRANSCRIPT

Journal of Engineering Science and Technology Vol. 13, No. 6 (2018) 1420 - 1439 © School of Engineering, Taylor’s University
1420
CONTROL AND MANAGEMENT OF A SOLAR-WIND HYBRID SYSTEM FOR POWER QUALITY IMPROVEMENT
B. TOUAL1,3,*, L. MOKRANI2, A. KOUZOU3, M. MACHMOUM4
1Department of Electrical Engineering, University of Batna 2, Algeria 2LACoSERE Laboratory, University of Laghouat, Algeria
3LAADI Laboratory, University of Djelfa, Algeria 4IREENA, 37 Boulevard de l'Université, Bp 406, 44602 Saint-Nazaire, Nantes, France
*Corresponding Author: [email protected]
Abstract
The main aim of this paper is to present a modified Maximum Power Point
Tracking (MPPT) control strategy of a solar-wind hybrid power system, which
allows producing a maximum of energy while enhancing the produced power
quality by reducing its fluctuation rate. Indeed, the Photovoltaic System (PVS) is
based on a PV field of panels connected to the grid through a DC-DC and DC-
AC PWM converters and the Wind Energy Conversion System (WECS) is based
on a stator field oriented Doubly Fed Induction Generator (DFIG) which its rotor
is connected to the network via a back to back AC-DC-AC PWM converter. The
proposed control strategy ensures a conventional Maximum Power Point
Tracking (MPPT) for the WECS. Furthermore, it guarantees a smooth power
injected in the grid by applying a modified MPPT technique applied to the PV
system. This strategy uses a part of the PVS available power to compensate the
WECS power fluctuations due to wind gusts and generates simultaneously the
maximum of smoothed power from the residual part. The simulations results
obtained in the case of the proposed control strategy have been compared to those
of a conventional MPPT technique and of a Guaranteed Minimum Available
Power (GMAP) control strategy. It is obvious that the proposed modified MPPT
keeps a good compromise between the quantity and the quality of the total hybrid
system produced power.
Keywords: Back to back AC-DC-AC PWM converter, Boost converter, Field
oriented DFIG, Power quality improvement, PVS, WECS.
1. Introduction
In recent years, the use of electric hybrid systems has increased in many industrial

Control and Management of a Solar-Wind Hybrid System for Power . . . . 1421
Journal of Engineering Science and Technology June 2018, Vol. 13(6)
Nomenclatures
Cconv Boost capacitor (Fig. 4), F
Cp Turbine power coefficient
CS Reference saturation current 10 tpv VnV
pvsc eI , A
d Duty cycle of the boost converter (Fig. 4)
Egap Gap energy, depending on the material of the cell, eV Iconv Boost input current (Fig. 4), A
Icconv Boost capacitor current (Fig. 4), A
Iinv Inverter input current (Fig. 4), A
Iph Photo-current, A
Ipv Photovoltaic current (Fig. 4), A
Ipvsc Cell short-circuit current Ipvsc Iph, A
IS Reverse saturation current of the diode nTKqE
SgapeTC
3, A
K Boltzmann constant, J/K
Kconv Boost converter transistor (Fig. 4)
Lconv Boost converter inductance (Fig. 4), H
Lr Rotor inductance, H
n PV cell ideality factor, 51 n
q Electron charge constant, C
R Blade radius, m
S Surface swept by the turbine blades, m²
T Cell temperature, K
Vdc DC bus voltage of the PVS (Fig. 4), V
Vt Thermodynamic potential qKT , V
Vpv Photovoltaic voltage (Fig. 4), V
Vpv0 Open circuit voltage, V
v Wind speed, m/s
v0 Average component of the wind speed, m/s
Greek Symbols
β Pitch angle of the turbine blades, deg
Specific speed of the turbine vR t
Air density, kg/m3
Blondel dispersion coefficient
Ωt Turbine rotation speed, rad/s
Ωe DFIG rotation speed, rad/s
r Rotor pulsation (Fig. 7), rad/s
Abbreviations
DC Direct Current
DFIG Doubly Fed Induction Generator
GSC Grid Side Converter
HS Hybrid System
MPPT Maximum Power Point Tracking
PVS Photovoltaic System
WECS Wind Energy Conversion System

1422 B. Toual et al.
Journal of Engineering Science and Technology June 2018, Vol. 13(6)
and domestic sectors such as embedded systems, cars, planes, boats, the electrical
power supply of different devices (laptops, mobile telephony, mobile players, toys,
etc.) and electrical power plants.
In the near future, the use of these hybrid power systems will become more and
more important due to their adequacy to industrial developments in several
countries and to the reduction in oil production, as well as to the increase of
pollution degree related to continuous emissions of dangerous gases [1]. For these
reasons, other alternative energy sources that are sustainable and easy to operate
have been strongly proposed and investigated in the whole world, such as the solar
energy and the wind energy as presented in Table 1 [2, 3]. Therefore, there is an
increasing pace of scientific research in the field of hybrid power systems based on
renewable energy sources [4-9].
Table 1. Important global indicators for renewable energy in the world [2, 3].
Unit 2010 2011 2012 2013 2016
Renewable power installed
capacity (with hydro) GW 1250 1355 1470 1560 2017
Renewable power installed
capacity (without hydro) GW 315 395 480 560 921
Solar PV installed capacity GW 40 71 100 139 303
Wind power installed
capacity GW 198 238 283 318 487
Concentrating solar thermal
power installed capacity GW 1.1 1.6 2.5 3.4 4.8
It can be seen clearly from Table 1 that the WEC and PV systems are becoming
important parts of power generation. Their basic energy sources (wind and solar),
present the right choice due to the world abundance of windy sites and illuminated
sites as well as windy and illuminated sites in a better combination of the weather
in the whole world.
In addition, these sources are clean, economic, sustainable, safe, not expensive
and easy to operate, especially for the photovoltaic systems, where there is no noise
and no additional mechanical requirement.
In the context of a better exploitation of the solar and the wind renewable energy
sources, several studies have been presented, where the main aim was the
improvement of the used techniques to ensure the maximization of the produced
power from such sources while respecting the quality requirement imposed by the
network or the consumer demand.
For the PV systems, several previous researches have proposed different
solutions to enhance the profitability of these systems by methods such as the
improved MPPT technique, which allows a rapid tracking of the maximum power
point based on the simultaneous adjustment of the voltage of the panel (Incremental
Conductance Algorithm) and the position of the panel. Moreover, the technique
which proposes the improvement of the coupling architecture of the photovoltaic
panels and the techniques that have been proposed to improve the used static
converters and their control techniques [10-15].

Control and Management of a Solar-Wind Hybrid System for Power . . . . 1423
Journal of Engineering Science and Technology June 2018, Vol. 13(6)
In addition, other research studies have been focused on the improvement of the
efficiency and the produced energy quality of the wind power systems. These studies
use techniques such as the reactive power compensation and the active filtering of
harmonic currents generated by nonlinear loads, as well as the control loops
improvement to overcome the influence of the inertia on the frequency [16-18].
Kumar and Bhimasingu [19] proposed a new topology of a multilevel modular
inverter which is characterized by a decreased DC bus voltage and the elimination
of the diodes and the capacitors in comparison with other conventional topologies,
where the main aim of this proposed topology was to enhance the produced power
of a hybrid system based on renewable energy.
The work presented in this paper focuses mainly on resolving the dilemma of
the quantity of produced power by a grid-connected HS while ensuring a high
power quality even in presence of wind gusts. Indeed, this studied HS is composed
of two systems, the PVS and the WECS that are connected to the power system
network according to the topology shown in Fig. 1.
Fig. 1. Description of the studied hybrid system.
The objective of this work is, therefore, the control of the hybrid plant under
three operating modes. The first mode is the conventional MPPT mode, where
the control system aims to ensure in real time the maximization of the HS total
produced power without considering power quality. While the second mode aims
to take into account the quality problem of the HS total produced power. In this
case, a simple standard decoupled control technique of the HS power is used to
produce a maximum smoothed power. The third mode is proposed to ensure the
energy production with reduced fluctuations. It is based on a WECS MPPT
control, accompanied with the PVS that participates in increasing the overall
power production and ensures at the same time the compensation of the WECS
produced power fluctuation.
𝑨𝑪
𝑫𝑪
𝑫𝑪
𝑨𝑪
𝑫𝑪
𝑫𝑪
𝑾𝒊𝒏𝒅
𝑫𝑭𝑰𝑮
𝑷𝑽
𝑺𝒖𝒏
𝑫𝑪
𝑨𝑪
𝑵𝒆𝒕𝒘𝒐𝒓𝒌
𝑾𝑬𝑪𝑺 𝑷𝑶𝑾𝑬𝑹
𝑷𝑽𝑺 𝑷𝑶𝑾𝑬𝑹
𝑯𝑺 𝑷𝑶𝑾𝑬𝑹
𝑷𝒍𝒂𝒏𝒕

1424 B. Toual et al.
Journal of Engineering Science and Technology June 2018, Vol. 13(6)
2. Description and Modelling of the PVS
This research study of PVS is based on a solar plant of 400 kW composed of a field
of 2000 photovoltaic modules BP SX 3200 (80 parallel branches of 25 modules in
series) with a power of 200 Wp for each module [20]. These modules are connected
to the power line via a boost converter and a PWM controlled inverter (SOLAR
MAX 330 CSV) with a power of 400 kW. This system is equipped with a voltage
regulation to control the boost converter in order to ensure a given DC bus voltage
at the input side of the inverter. Moreover, the inverter control can ensure a
decoupled control of the active and reactive powers (see Fig. 2).
Fig. 2. Description of the photovoltaic studied system.
Indeed, several previous works have focused on the development of different
MPPT techniques to optimize the power extraction of photovoltaic sources. All
these techniques were based on blind scanning of the MPP. Among these
techniques, on can find for example the Perturb and Observe (P.O) technique and
its modified version proposed in [21, 22]. However, in the present work, the PVS
MPPT control is performed on the basis of an MPP given by a photovoltaic cell
implemented in the photovoltaic field to read the meteorological conditions and to
generate the reference power to be produced and injected in the network. The boost
converter ensures a continuous connection between the PVS and the load (grid) in
order to avoid the power waste. Moreover, this converter is controlled in such a
way to guarantee an MPPT operation mode, or a given produced power level
limited by the weather conditions, whereas, the control of the grid side converter
ensures the transfer of this produced power to the grid. The duty cycle value of the
boost converter is limited according to the range values (min-max) of the boost
converter output voltage (according to input inverter voltage limits).
2.1. Modelling and design of the PV generator
There are many possible mathematical representations with varying complexity
that can be used to model the PV cell current-voltage behaviour. However,
depending on the application, several factors are required to be taken into account
𝐷𝐶
𝐷𝐶
𝑉𝑝𝑣
𝐼𝑝𝑣
𝑃𝑝𝑣𝑟𝑒𝑓 𝑑𝑐
𝑃𝐼
𝐼𝑝𝑣 𝑃𝑝𝑣
𝐼𝑝𝑣𝑟𝑒𝑓
𝑃𝑝𝑣 (𝑅𝑒𝑞𝑢𝑖𝑟𝑒𝑑)
𝑃𝑝𝑣 (𝑀𝑃𝑃𝑇)
𝑃𝐼
𝑐𝑜𝑛𝑑𝑖𝑡𝑖𝑜𝑛𝑠 𝑤𝑒𝑎𝑡ℎ𝑒𝑟
𝑑𝑐𝑚𝑎𝑥 = 1 − 𝑉𝑝𝑣𝑟𝑒𝑓 𝑉𝑑𝑐𝑚𝑎𝑥
𝑅𝑓 𝐿𝑓
𝑅𝑓 𝐿𝑓
𝑅𝑓 𝐿𝑓
𝐷𝐶
𝐴𝐶
𝑉𝑎𝑏𝑐 𝑔𝑟𝑖𝑑
𝑉𝑎𝑏𝑐 𝑔𝑟𝑖𝑑 𝐼𝑎𝑏𝑐
3 2
𝐼𝑑 ,𝑞 𝑉𝑑 ,𝑞
𝐼𝑑𝑟𝑒𝑓
𝐼𝑞𝑟𝑒𝑓
3 2
𝐶𝑜𝑛𝑡𝑟𝑜𝑙
ℎ𝑦𝑠𝑡𝑒𝑟𝑒𝑠𝑖𝑠
𝐼𝑎𝑏𝑐𝑟𝑒𝑓
𝑆𝑎𝑏𝑐
𝐼𝑎𝑏𝑐
𝑉𝑑𝑐
𝑑𝑐𝑚𝑖𝑛 = 1 − 𝑉𝑝𝑣𝑟𝑒𝑓 𝑉𝑑𝑐𝑚𝑖𝑛
𝐸𝑣𝑎𝑙𝑢𝑎𝑡𝑖𝑛𝑔 𝑝𝑜𝑤𝑒𝑟𝑠
𝑃 𝑄
𝑅𝑒𝑔𝑢𝑙𝑎𝑡𝑖𝑜𝑛
𝑃𝑟𝑒𝑓 𝑄𝑟𝑒𝑓
𝑃𝑉
𝑝𝑖𝑙𝑜𝑡 𝑐𝑒𝑙𝑙
𝑃𝑙𝑎𝑛𝑡

Control and Management of a Solar-Wind Hybrid System for Power . . . . 1425
Journal of Engineering Science and Technology June 2018, Vol. 13(6)
to obtain a suitable modelling of the PV cell I-V characteristics. In this work, a
model with an exponential and four parameters (L4P) is used. Indeed, this model
has been widely used. It considers the photovoltaic cell as a dependent current
source of illumination and temperature, connected in parallel with a diode and a
shunt resistance Rsh and a series resistance Rser, (see Fig. 3).
Fig. 3. Equivalent diagram of an L4P cell.
Based on simplification of the parallel resistance which has generally an
important value (Ish very small), the current given by the photovoltaic cell can be
expressed as follows [23, 24]:
1 nVRIV
SphpvtserpvpveIII (1)
To generalize the above equations to be valid for various meteorological
conditions temperature and illumination, the short-circuit current and the open
circuit voltage of the photovoltaic cell are expressed as follows:
rvrefpvpv
rcpvscrefrpvsc
TTVV
TTIggI
00
(2)
where: g, T, c, v, Ipvscref, Vpv0ref, gr, and Tr are respectively, the illumination value,
the temperature value, the temperature influence factor on the short-circuit current,
the temperature influence factor on the open circuit voltage, the reference of the
short-circuit current, the reference of the open circuit voltage, the rated illumination
and the rated temperature.
By considering the inverter input voltage range 900,600dcV V, the solar
farm produces a maximum power equal to the used inverter rated power (Pmax= 400
kW) under a voltage not higher than 900 V.
Consequently, the number of modules in series Ns and the number of parallel
braches Np can be calculated as follows:
modmaxmax
modmax
PNPN
VVN
sp
opdcs (3)
where: Vdcmax, Vopmod and Pmaxmod are respectively, the maximum of the DC bus
voltage, the optimal value of the PV module voltage and the maximum power of
the PV module.
𝑉𝑝𝑣
𝑅𝑠𝑒𝑟 𝐼𝑝𝑣
𝐼𝑑
𝐼𝑝ℎ 𝑅𝑠ℎ 𝐷
𝐼𝑠ℎ
1426 B. Toual et al.
Journal of Engineering Science and Technology June 2018, Vol. 13(6)
With an optimal modular voltage of 24.5 V and a rated power of 200 Wp in this
case, a number of 25 modules in series and a number of 80 parallel branches have
been used to build the PV plant subject of our study, which is containing 2000
modules of BP SOLAR SX 3200.
2.2. Boost converter modelling
It is important to clarify that the PV energy is not like a conventional energy source
because in a conventional energy source, where the energy which is not delivered
to the load is not consumed and remains in the source. In PV energy source, the
energy is wasted since it is available for free. Thus by using the boost converter,
current flows constantly into the input port of the converter due to use of a parallel
switch in its topology. Therefore, in PV system, the energy efficiency of the boost
converter may be higher than of the buck converter for example [25].
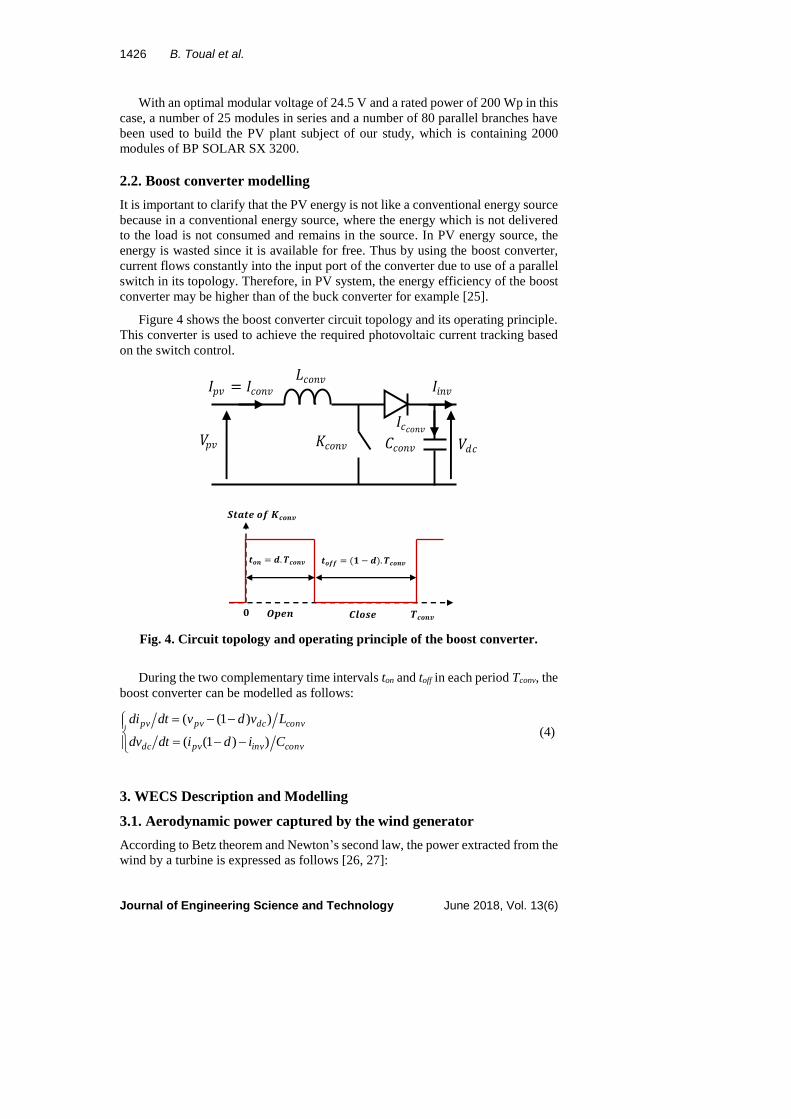
Figure 4 shows the boost converter circuit topology and its operating principle.
This converter is used to achieve the required photovoltaic current tracking based
on the switch control.
Fig. 4. Circuit topology and operating principle of the boost converter.
During the two complementary time intervals ton and toff in each period Tconv, the
boost converter can be modelled as follows:
convinvpvdc
convdcpvpv
Cididtdv
Lvdvdtdi
))1((
))1(( (4)
3. WECS Description and Modelling
3.1. Aerodynamic power captured by the wind generator
According to Betz theorem and Newton’s second law, the power extracted from the
wind by a turbine is expressed as follows [26, 27]:
𝐿𝑐𝑜𝑛𝑣
𝐾𝑐𝑜𝑛𝑣 𝑉𝑝𝑣
𝐼𝑝𝑣 = 𝐼𝑐𝑜𝑛𝑣
𝑉𝑑𝑐
𝐼𝑖𝑛𝑣
𝐼𝑐𝑐𝑜𝑛𝑣
𝐶𝑐𝑜𝑛𝑣
𝒕𝒐𝒏 = 𝒅.𝑻𝒄𝒐𝒏𝒗 𝒕𝒐𝒇𝒇 = (𝟏 − 𝒅).𝑻𝒄𝒐𝒏𝒗
𝑶𝒑𝒆𝒏 𝑪𝒍𝒐𝒔𝒆
𝑺𝒕𝒂𝒕𝒆 𝒐𝒇 𝑲𝒄𝒐𝒏𝒗
𝟎 𝑻𝒄𝒐𝒏𝒗

Control and Management of a Solar-Wind Hybrid System for Power . . . . 1427
Journal of Engineering Science and Technology June 2018, Vol. 13(6)
3
2
1SvCP pt (5)
Equation (6) represents the expression of the Cp for a wind turbine of 1.5 MW
which is used in this study (these wind turbine parameters are summarized in [28]):
)2)(3(00184.0
23.05.18
1.0sin200167.05.0
pC
(6)
3.2. Wind turbine modelling
Considering that the friction coefficients have low and negligible values and that
the wind speed distribution is uniform over all the blades, the mechanical model of
the wind turbine can be presented as shown in Fig. 5.
Fig. 5. Simplified mechanical model of the wind turbine.
3.2.1. Wind speed modelling
The wind dynamic properties are very important for the study of a wind energy
conversion system because the wind power evolves with the cube of the wind speed
in the optimal conditions. Indeed, the wind speed is a three-dimensional vector.
However, the direction of the wind velocity vector considered in this model is
limited to the horizontal dimension. Consequently, the behavioural model of the
wind is simplified considerably. The wind speed v is usually represented by a scalar
function which varies over time as follows [29].
m
i
iii tAvtv
1
0 sin
(7)
where Ai, i and i are respectively, the amplitude, the angular frequency and the
initial phase of each spectral component fluctuating.
Table 2 presents the annual mean wind speed in Adrar site subject to the present
work which is located in the south of Algeria and it presents the windiest zone in
Algeria. It can be seen that the dominant wind speeds in this site are between 3.5
and 7.5 m/s.
Based on the obtained wind speed data of Adrar site, two different wind profiles are
shown in Fig. 6. The first profile contains wind gusts and reflects the stochastic nature
of the wind speed. On the other, the second profile is a filtered profile with slow
dynamics (in this case the fast wind gusts have been filtered from the actual speed). This
𝑊𝑖𝑛𝑑
𝑇𝑢𝑟𝑏𝑖𝑛𝑒
𝑠𝑝𝑒𝑒𝑑 𝑚𝑢𝑙𝑡𝑖𝑝𝑙𝑖𝑒𝑟
𝑅𝑜𝑡𝑜𝑟 𝑜𝑓 𝑡ℎ𝑒 𝐷𝐹𝐼𝐺

1428 B. Toual et al.
Journal of Engineering Science and Technology June 2018, Vol. 13(6)
last profile is considered and used to pilot the studied WECS in the MPPT mode (the
WECS MPPT zone is located almost between 3.5 m/s and 7.5 m/s [28]).
Table 2. Annual mean wind speed in Adrar site (south of Algeria) [30].
Wind
class
(m/s)
Weibull
frequency
in (%)
Wind
class
(m/s)
Weibull
frequency
in (%)
Wind
class
(m/s)
Weibull
frequency
in (%)
0.5 1.7 8.5 8.34 16.5 0.28
1.5 5.20 9.5 6.54 17.5 0.15
2.5 8.20 10.5 4.86 18.5 0.07
3.5 10.58 11.5 3.42 19.5 0.03
4.5 11.85 12.5 2.29 20.5 0.02
5.5 12.07 13.5 1.46 21.5 0.01
6.5 11.39 14.5 0.88 22.5 0.00
7.5 10.05 15.5 0.51 23.5 0.00
(a) Real profile. (b) Filtered profile.
Fig. 6. Different wind profiles.
3.2.2. Turbine model
The aerodynamic torque developed by the wind turbine is as follows [29]:
3
2
1SvC
PT p
tt
taer
(8)
3.2.3. Dynamic equation of the generator shaft
By transformation of the mechanical parameters of the turbine to the generator
shaft, the shaft dynamic model can be defined by the following equation [28, 29]:
emgee TTD
dt
dJ
(9)
where: J, Ωe, D, Tg and Tem are respectively, the turbine inertia brought to the
generator shaft, the DFIG rotation speed, the turbine friction coefficient brought to
the generator shaft, the effect of the turbine torque on the generator shaft and the
DFIG torque.
0 0.5 1 1.5 26
6.2
6.4
6.6
6.8
7
7.2
7.4
7.6
Time (s)
Win
d r
eal speed (
m/s
)
0 0.5 1 1.5 26
6.2
6.4
6.6
6.8
7
7.2
7.4
7.6
Time (s)
Win
d filte
red s
peed (
m/s
)
0 0.5 1 1.5 26
6.2
6.4
6.6
6.8
7
7.2
7.4
7.6
Time (s)
Win
d r
eal speed (
m/s
)
0 0.5 1 1.5 26
6.2
6.4
6.6
6.8
7
7.2
7.4
7.6
Time (s)
Win
d filte
red s
peed (
m/s
)

Control and Management of a Solar-Wind Hybrid System for Power . . . . 1429
Journal of Engineering Science and Technology June 2018, Vol. 13(6)
with:
et J
G
JJ
2 (10)
where: Jt, Je and G are respectively, the turbine inertia, the generator inertia and the
multiplier gain.
and:
et D
G
DD
2 (11)
where: Dt and De are the turbine friction coefficient and the generator friction
coefficient respectively.
3.3. Relationship between DFIG stator powers and rotor currents
The two-phase reference (d-q) frame, which is associated with the stator-rotating
field, is used in this paper. The active and reactive powers of the DFIG stator can
be obtained based on the Park transformation of the DFIG equations and the stator
flux orientation on the d axis. Equation (12) presents the expressions of the active
and reactive powers based on simplification hypothesis due to the high power rate
of the studied wind turbine where the stator resistors are neglected [15].
drssss
ss
qrs
ss
ivL
M
L
vQ
iL
MvP
2
2
3
2
3
(12)
where: idr, iqr, Ls, M, vs and s are respectively, the rotor current according to d axis,
the rotor current according to q axis, the stator inductance, the mutual inductance,
the statorique voltage and the statorique pulsation.
From equation (12), it is clear that the control of the stator active power and
reactive power is decoupled, which means that their control can be achieved
independently. Indeed, with a constant magnetizing inductance and a powerful
network, the Ps power will be directly proportional to the current iqr, and Qs power
will have a linear relation with the current idr as shown in Eq. (12).
This last equation allows synthesizing the control algorithm of the DFIG
produced powers based on the generation of the rotor reference voltages (Vdrref and
Vqrref) from the references of the stator powers (Psref and Qsref) using two control
loops DFIG, the stator power external control loop and the rotor current internal
control loop as shown in Fig. 7.
3.4. Back to back converter control
The DFIG rotor is coupled to the network via a back-to-back AC-DC-AC PWM
converter. This converter is composed of the Rotor Side Converter (RSC) and the
Grid Side Converter (GSC). These two static converters are controlled to track the
1430 B. Toual et al.
Journal of Engineering Science and Technology June 2018, Vol. 13(6)
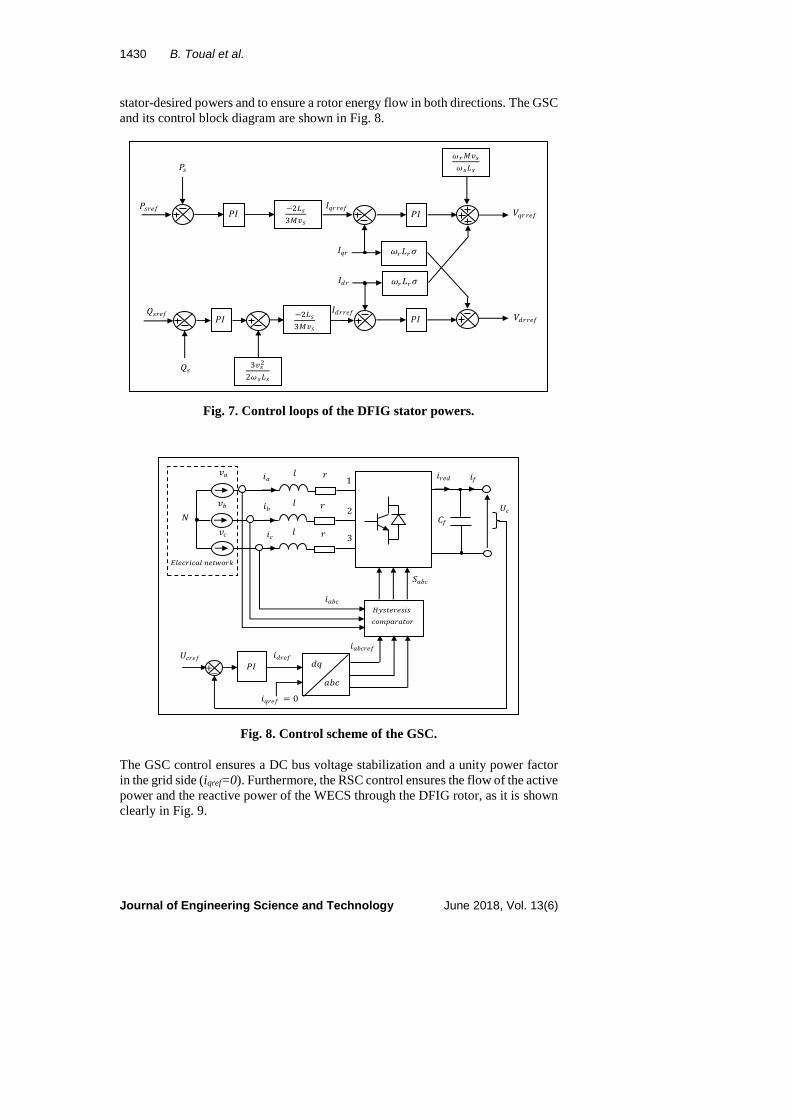
stator-desired powers and to ensure a rotor energy flow in both directions. The GSC
and its control block diagram are shown in Fig. 8.
Fig. 7. Control loops of the DFIG stator powers.
Fig. 8. Control scheme of the GSC.
The GSC control ensures a DC bus voltage stabilization and a unity power factor
in the grid side (iqref=0). Furthermore, the RSC control ensures the flow of the active
power and the reactive power of the WECS through the DFIG rotor, as it is shown
clearly in Fig. 9.
𝑃𝐼 𝑃𝐼
𝑃𝑠
𝑃𝑠𝑟𝑒𝑓
𝜔𝑟𝑀𝑣𝑠
𝜔𝑠𝐿𝑠
𝐼𝑞𝑟 𝜔𝑟𝐿𝑟𝜎
𝜔𝑟𝐿𝑟𝜎
𝐼𝑑𝑟
𝑉𝑞𝑟𝑟𝑒𝑓
𝑃𝐼
𝑉𝑑𝑟𝑟𝑒𝑓
𝑄𝑠𝑟𝑒𝑓
𝑄𝑠
𝑃𝐼
−2𝐿𝑠
3𝑀𝑣𝑠
−2𝐿𝑠
3𝑀𝑣𝑠
3𝑣𝑠
2
2𝜔𝑠𝐿𝑠
𝐼𝑞𝑟𝑟𝑒𝑓
𝐼𝑑𝑟𝑟𝑒𝑓
𝑈𝑐
𝑈𝑐𝑟𝑒𝑓
𝑃𝐼 𝑑𝑞
𝑎𝑏𝑐
𝑖𝑑𝑟𝑒𝑓
𝑆𝑎𝑏𝑐
𝑙
𝑙
𝑙
𝑟
𝑟
𝑟
𝑣𝑐
𝑣𝑏
𝑣𝑎
𝑖𝑐
𝑖𝑏
𝑖𝑎 𝑖𝑟𝑒𝑑 𝑖𝑓
𝐶𝑓
𝑖𝑎𝑏𝑐
𝑖𝑎𝑏𝑐𝑟𝑒𝑓
1
2
3
𝑁
+ −
𝐸𝑙𝑒𝑐𝑟𝑖𝑐𝑎𝑙 𝑛𝑒𝑡𝑤𝑜𝑟𝑘
𝑖𝑞𝑟𝑒𝑓 = 0
𝐻𝑦𝑠𝑡𝑒𝑟𝑒𝑠𝑖𝑠
𝑐𝑜𝑚𝑝𝑎𝑟𝑎𝑡𝑜𝑟

Control and Management of a Solar-Wind Hybrid System for Power . . . . 1431
Journal of Engineering Science and Technology June 2018, Vol. 13(6)
Fig. 9. WECS powers decoupling control.
4. Simulation Results and Discussion
The studied hybrid system in this work is composed of the PVS presented in section
2, and the WECS presented in section 3. These two systems are electrically coupled
to be connected to the infinite bus of a powerful balanced three-phase power system
network. Initially, it is supposed that the hybrid system operates at its optimal point
corresponding to the initial meteorological conditions (T=25°C and g=1000 W/m2)
for the PVS and (v=6.5 m/s) for the WECS. In this situation, the PVS and the
WECS produce the maximum possible power from the transferred powers of the
solar and wind sources. When the temperature and the illumination change
according to the profiles presented in Fig. 10 and the wind speed changes according
to the profile presented in Fig. 6(b), new power references values corresponding to
this new situation will be obtained according to the considered control strategy.
(a) Temperature profile. (b) Illumination profile.
Fig. 10. Temperature and illumination profiles applied
to the studied PVS (According to Adrar site data).
𝑣
𝑣
𝛺𝑒𝑜𝑝𝑡
𝑣𝑞𝑟𝑟𝑒𝑓
𝑣𝑑𝑟𝑟𝑒𝑓
𝑁𝑒𝑡𝑤𝑜𝑟𝑘
𝑣𝑎𝑏𝑐𝑟𝑟𝑒𝑓
𝑈𝑐𝑟𝑒𝑓
𝑖𝑎𝑏𝑐
𝑓𝑎𝑏𝑐
𝑆𝑎𝑏𝑐
𝑈𝑐
𝑑𝑞
𝑎𝑏𝑐
𝑀𝐿𝐼
𝑟
𝑟
𝑟
𝑙
𝑙
𝑙
𝐶𝑜𝑛𝑡𝑟𝑜𝑙
𝐷𝐹𝐼𝐺
1
2𝜌𝐶𝑝𝑚𝑎𝑥 𝑆𝑣
3 𝑣𝐺
𝑅𝜆𝑜𝑝𝑡
1 −𝛺𝑒𝑜𝑝 𝑡
𝛺𝑠
𝑠𝑙𝑜𝑝𝑡
𝑃𝑡𝑜𝑝 (1 − 𝑠𝑙𝑜𝑝𝑡)
𝑃𝑡𝑜𝑝
𝑃𝑠𝑟𝑒𝑓
𝑄𝑠𝑟𝑒𝑓
𝐶𝑜𝑛𝑡𝑟𝑜𝑙 𝑏𝑙𝑜𝑐𝑘
𝑃𝑠
𝑄𝑠
𝑇𝑟𝑖𝑎𝑛𝑔𝑙𝑒 𝑠𝑖𝑛𝑢𝑠
𝑃𝑠𝑟𝑒𝑓
0 0.5 1 1.5 20
10
20
30
40
50
60
Time (s)
Tem
pera
ture
(C
)
0 0.5 1 1.5 20
200
400
600
800
1000
1200
1400
Time (s)
Illu
min
ation (
W/m
2)
0 0.5 1 1.5 20
10
20
30
40
50
60
Time (s)
Tem
pera
ture
(C
)
0 0.5 1 1.5 20
200
400
600
800
1000
1200
1400
Time (s)
Illu
min
ation (
W/m
2)

1432 B. Toual et al.
Journal of Engineering Science and Technology June 2018, Vol. 13(6)
The obtained simulation results following these meteorological conditions
drawn from real data of Adrar site are presented according to each proposed
operating mode in the following sections.
4.1. Conventional MPPT mode
The PVS MPPT technique used here is based on the use of a pilot cell implemented
in the photovoltaic farm. It is used to estimate on-line the illumination and the
temperature and deduce the PV system command value as shown in Fig. 2. The
same idea is applied to the wind turbine, where the on-line measurement of the
wind speed is used to calculate the maximal active power reference that can be
produced by the WECS as shown in Fig. 9.
Figures 11 and 12 show the obtained results of the PVS and the WECS under
the standard MPPT mode.
As it can be seen, both systems (PVS and WECS) of the hybrid system have
been successfully controlled to operate in the MPPT mode. In fact, the PVS optimal
current and voltage track their optimal references for various temperature and
illumination levels. On the other hand, it can be noted that the DC bus voltage of
the inverter input is maintained within its limits as shown clearly in Fig. 11.
In the WECS side, the stator active power and its reference follow the wind
profile applied to the turbine to guarantee the MPPT operation mode Fig. 12. It is
noted also that the DC bus voltage remains closer to its reference value of 2000 V
as shown clearly in Fig. 12.
(a) PVS active and reactive powers. (b) PVS voltage and current.
(c) Photovoltaic current. (d) Photovoltaic voltage.
0 0.5 1 1.5 2-5
-4
-3
-2
-1
0
1x 10
5
Time (s)
PV
S p
ow
ers
P (
W)
and Q
(V
AR
)
P
Pref
Q
Qref
0 0.5 1 1.5 2-800
-600
-400
-200
0
200
400
600
800
Time (s)
PV
S v
olta
ge (
V)
and c
urr
ent (A
)
Ia
Va
0.86 0.88 0.9 0.92
-500
0
500
Time (s)
Voltage (
V)
and c
urr
ent (A
) pro
duced b
y the p
hoto
voltaic
syste
m
Current
Voltage
0 0.5 1 1.5 2100
200
300
400
500
600
700
800
900
Time (s)
Pho
tovo
ltaic
cur
rent
(A
)
Ipv
Ipv
optimal
0 0.5 1 1.5 2300
350
400
450
500
550
600
650
Time (s)
Pho
tovo
ltaic
vol
tage
(V
)
Vpv
Vpv
optimal
0 0.5 1 1.5 2100
200
300
400
500
600
700
800
900
Time (s)
Pho
tovo
ltaic
cur
rent
(A
)
Ipv
Ipv
optimal
0 0.5 1 1.5 2300
350
400
450
500
550
600
650
Time (s)
Pho
tovo
ltaic
vol
tage
(V
)
Vpv
Vpv
optimal

Control and Management of a Solar-Wind Hybrid System for Power . . . . 1433
Journal of Engineering Science and Technology June 2018, Vol. 13(6)
(e) Chopper ratio. (f) Input voltage of the PVS inverter.
Fig. 11. PVS simulation results in the case of the MPPT mode.
(a) DFIG stator powers. (b) DFIG rotor powers.
(c) DFIG stator voltage and current. (d) DC bus voltage.
(e) GSC voltage and current. (f) Zoom of GSC voltage
and current.
Fig. 12. WECS simulation results in the case of the MPPT mode.
0 0.5 1 1.5 20
0.1
0.2
0.3
0.4
0.5
Time (s)
Chopper
ratio
0 0.5 1 1.5 20
200
400
600
800
1000
Time (s)
Input vo
ltage o
f th
e P
VS
inve
rter
(V)
0 0.5 1 1.5 20
0.1
0.2
0.3
0.4
0.5
Time (s)
Chopper
ratio
0 0.5 1 1.5 20
200
400
600
800
1000
Time (s)
Input voltage o
f th
e P
VS
invert
er
(V)
0 0.5 1 1.5 2-12
-10
-8
-6
-4
-2
0
2x 10
5
Time (s)
DF
IG s
tato
r po
wer
s P
s (W
) an
d Q
s (V
AR
)
Ps
Psref
Qs
Qsref
0 0.5 1 1.5 2-12
-10
-8
-6
-4
-2
0
2x 10
5
Time (s)
DF
IG r
otor
pow
ers
Pr
(W)
and
Qr
(VA
R)
Pr
Qr
0 0.5 1 1.5 2-12
-10
-8
-6
-4
-2
0
2x 10
5
Time (s)
DFI
G s
tato
r pow
ers
Ps
(W) a
nd Q
s (V
AR
)
Ps
Psref
Qs
Qsref
0 0.5 1 1.5 2-12
-10
-8
-6
-4
-2
0
2x 10
5
Time (s)
DFI
G ro
tor p
ower
s P
r (W
) and
Qr (
VA
R)
Pr
Qr
0 0.5 1 1.5 2-2000
-1000
0
1000
2000
Time (s)
DF
IG s
tato
r vo
ltage (
V)
and c
urr
ent (A
)
Ias
Vas
0 0.5 1 1.5 20
500
1000
1500
2000
Time (s)
DC
bus
volta
ge (
V)
0.86 0.88 0.9 0.92
-500
0
500
Time (s)
Volta
ge (
V)
and c
urr
ent (A
) pro
duce
d b
y th
e p
hoto
volta
ic s
yste
m
Current
Voltage
0 0.5 1 1.5 2-2000
-1000
0
1000
2000
Time (s)
DF
IG s
tato
r vo
ltage
(V
) an
d cu
rren
t (A
)
Ias
Vas
0 0.5 1 1.5 20
500
1000
1500
2000
Time (s)
DC
bus
vol
tage
(V
)
0.86 0.88 0.9 0.92
-500
0
500
Time (s)
Vol
tage
(V
) an
d cu
rren
t (A
) pr
oduc
ed b
y th
e ph
otov
olta
ic s
yste
m
Current
Voltage
0 0.5 1 1.5 2-400
-300
-200
-100
0
100
200
300
400
Time (s)
GS
C v
olta
ge (
V)
and c
urr
ent (A
)
VGSC
IGSC
0.98 1 1.02 1.04 1.06 1.08-400
-300
-200
-100
0
100
200
300
400
Time (s)
Zoom
of G
SC
volta
ge (
V)
and c
urr
ent (A
)
VGSC
IGSC
0 0.5 1 1.5 2-400
-300
-200
-100
0
100
200
300
400
Time (s)
GS
C v
olta
ge (
V)
and c
urr
ent (A
)
VGSC
IGSC
0.98 1 1.02 1.04 1.06 1.08-400
-300
-200
-100
0
100
200
300
400
Time (s)
Zoom
of G
SC
volta
ge (
V)
and c
urr
ent (A
)
VGSC
IGSC

1434 B. Toual et al.
Journal of Engineering Science and Technology June 2018, Vol. 13(6)
Globally, the hybrid system injects a fluctuated active power of about 1 MW in
the grid that may sometimes exceed this value, thanks to the MPPT operating mode
of the PVS and the WECS as shown in Fig. 13.
Fig. 13. Simulation results of the HS operating in the MPPT mode.
4.2. Power quality improvement mode
In this mode, the HS is managed to inject a power with improved quality into the
power system network according to two techniques. The first technique aims to
ensure an improved delivered power according to the of available WECS and PVS
powers. The second technique, which is proposed in this paper, is based on a
modified MPPT control strategy that guarantees the HS maximum produced power
of improved quality.
4.2.1. Improved HS produced power quality based on network-required power
For the same temperature and illumination profiles that are shown in Fig. 10, and
for the same wind speed profile which is shown in Fig. 6(b), the total HS produced
power follows the required power of the network power system demand according
to the weather condition. In this case, the total active power produced by the HS is
shown in Fig. 14 (a), while the active powers of the PVS, the WECS and the HS
are shown simultaneously in Fig. 14 (b).
It can be noticed that this control technique allows to the hybrid system
producing a smooth active power. Initially, the PVS and the WECS provide an
active power of 0.8 MW during 1s. Then, they produce a power of 1 MW between
1 s and 1.5 s and finally, a power of 0.9 MW is produced after 1.5 s.
(a) HS global produced power. (b) Details of the produced powers.
Fig. 14. Simulation results (production of different smooth power levels).
0 0.5 1 1.5 2-15
-10
-5
0
5x 10
5
Time (s)
PV
S, W
EC
S a
nd H
S a
ctive p
ow
ers
(W
)
PPVS
PWECS
PHS
0 0.5 1 1.5 2-3000
-2000
-1000
0
1000
2000
3000
Time (s)
HS
voltage (
V)
and tota
l curr
ent (A
)
IHS
VHS
0 0.5 1 1.5 2-15
-10
-5
0
5x 10
5
Time (s)
PV
S, W
EC
S a
nd H
S a
ctive p
ow
ers
(W
)
PPVS
PWECS
PHS
0 0.5 1 1.5 2-3000
-2000
-1000
0
1000
2000
3000
Time (s)
HS
voltage (
V)
and tota
l curr
ent (A
)
IHS
VHS
0.86 0.88 0.9 0.92
-500
0
500
Time (s)
Voltage (
V)
and c
urr
ent (A
) pro
duced b
y the p
hoto
voltaic
syste
m
Current
Voltage
0 0.5 1 1.5 2-14
-12
-10
-8
-6
-4
-2
0x 10
5
Time (s)
HS
tota
l act
ive p
ow
er
(W)
PHS
PHS-ref
0 0.5 1 1.5 2
-1
-0.5
0
0.5
1x 10
6
Time (s)
PV
S, W
EC
S a
nd H
S a
ctiv
e p
ow
ers
(W
)
PPVS
PWECS
PHS
0 0.5 1 1.5 2-14
-12
-10
-8
-6
-4
-2
0x 10
5
Time (s)
HS
tota
l act
ive p
ow
er
(W)
PHS
PHS-ref
0 0.5 1 1.5 2
-1
-0.5
0
0.5
1x 10
6
Time (s)
PV
S, W
EC
S a
nd H
S a
ctiv
e p
ow
ers
(W
)
PPVS
PWECS
PHS

Control and Management of a Solar-Wind Hybrid System for Power . . . . 1435
Journal of Engineering Science and Technology June 2018, Vol. 13(6)
4.2.2. Modified MPPT mode for power quantity-quality compromise enhancement
To improve the performance of the HS in terms of produced power quantity and
quality simultaneously, the previous MPPT operation mode is modified to resolve
this dilemma. In this case, a part of the PVS available power is used to compensate
the total HS produced power fluctuations resulting from the WECS power
fluctuation (due to wind speed gusts). Whereas, another part of the PVS available
power is exploited to perform the quantity of the total HS produced power. This
can be achieved by considering a slowly and lightly sun illumination during none
cloudy days of this Saharan zone comparatively to the rapid and stochastic variation
of the wind speed.
In this mode, the PVS reference power is divided into two components. The
first one is a fluctuating component constituting the oscillating part of the PVS
reference power, which is used to compensate the rapid changes in the power of the
WECS that is still operating in the MPPT mode. On the other hand, the second
component is constant which will contribute to increasing the total HS produced
power. This proposed technique ensures simultaneously the minimization or even
the elimination of the fluctuations contained in the total HS produced power and at
the same time, maximization of the total HS produced power.
In the next section, the effectiveness of the proposed technique in terms of the
HS produced power quantity and quality is evaluated and compared to the two cases
of conventional MPPT operating mode and available power operation mode. In the
first case, the PVS and the WECS operate in their MPPT mode. Note that the PVS
contributes to the production of the total HS power production without taking into
account the power fluctuation minimization as shown in Fig. 15. It is obvious (see
Fig. 15) that the PVS produces only a constant component (according to the
constant weather conditions) which is added to the WECS produced power.
In the second scenario is the guaranteed minimum available power (GMAP)
control mode (Fig. 16). In this case, both the PVS and the WECS produce smooth
powers, which correspond respectively to available PVS power and to the guaranteed
minimum available wind power. In this case, the PVS and the WECS contribute to
improving the quality of energy to the detriment of the power quantity comparatively
to the first case. In the third scenario (see Fig. 17), the PVS contributes in improving
the total HS produced power quality by means of a part of its available power, while
enhancing the produced power level by the use of the residual available power. This
technique can be applied during the day, to produce different levels of smooth and
maximal power according to the weather condition variations.
Fig. 15. Simulation results of the classical MPPT mode
(with T=25°C and g=1000W/m2).
0 0.5 1 1.5 2-15
-10
-5
0
5
x 105
Time (s)
HS
tota
l and
mea
n ac
tive
pow
ers
in W
att
and
the
dist
ortio
n le
vel b
etw
een
them
0 0.5 1 1.5 2-15
-10
-5
0
5
x 105
Time (s)
PV
S, W
EC
S a
nd H
S a
ctiv
e po
wer
s (W
)
PHS
PWECS
PPVS
HS total power
HS mean power
Distortion level
Distortion Rate
DR=9.45 %
Pmean
=-1.0432 MW

1436 B. Toual et al.
Journal of Engineering Science and Technology June 2018, Vol. 13(6)
Fig. 16. Simulation results of the guaranteed minimum available power
(GMAP) control mode (with T=25°C and g=1000W/m2).
Fig. 17. Simulation results of the modified MPPT mode
(with T=25°C and g=1000W/m2).
To quantify the effectiveness of the three presented control strategies, some
results and performance indexes (the HS mean produced power, distortion rate and
exploitation level) are calculated and summarized in Table 3.
Table 3. Effectiveness of the three studied strategies.
Mean
Power
(MW)
Distortion
Rate (%)
Exploitation level
versus maximum
available power
(%)
Classical MPPT mode -1.043 9.45 100
GMAP control mode -0.861 0.95 82.55
Modified MPPT mode -0.932 1.48 89.35
As it can be seen from the results presented in Table 3 that the last case,
corresponding to the modified MPPT operating mode, presents the best mode,
which allows achieving the required compromise quality-quantity compared to the
other control modes. It means that this control mode can ensure for the HS a high -
level mean produced power with less fluctuation.
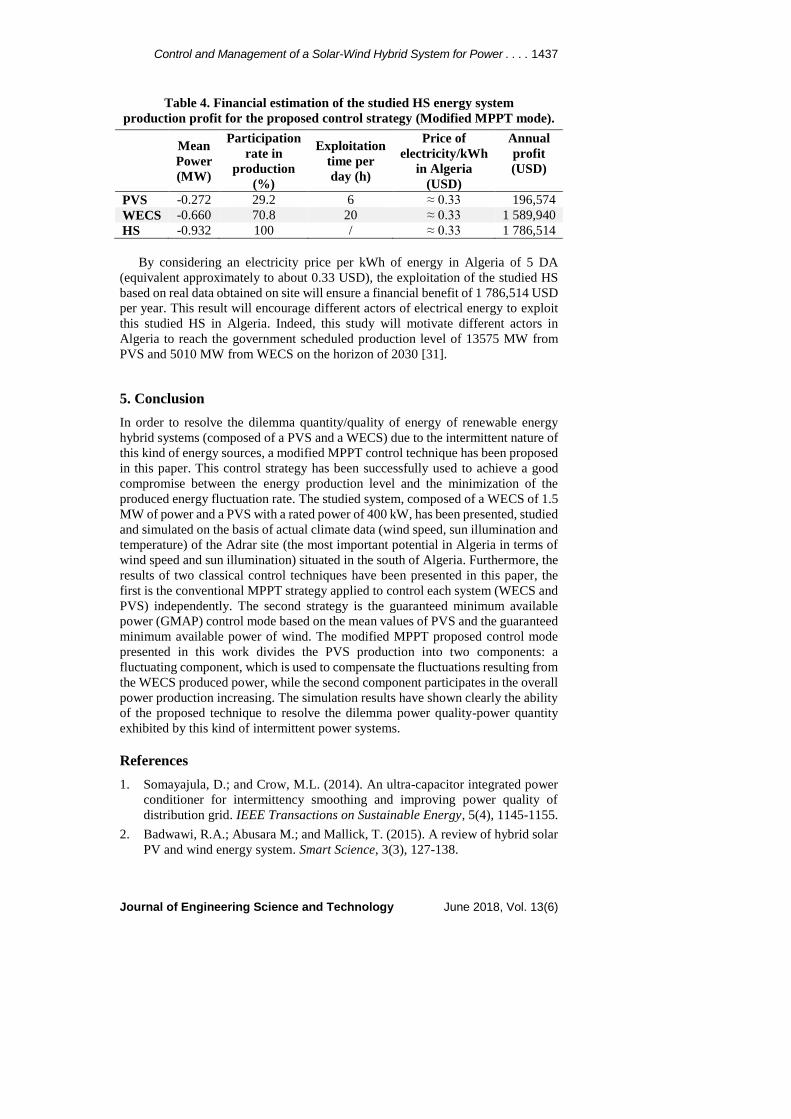
Once more, on the basis of the results presented in Table 3, an economic study
is achieved. Indeed, Table 4 presents an estimation of the annual financial benefit
that can be reached by applying the proposed control strategy to the HS (it is
assumed that the PVS is exploited for an average duration of 6 hours per day and
the WECS is exploited for an average duration of 20 hours per day, some hours per
day are left to take into account the probability of wind/illumination absence and/or
maintenance operation).
0 0.5 1 1.5 2-15
-10
-5
0
5
x 105
Time (s)
HS
tota
l and
mea
n ac
tive
pow
ers
in W
att
and
the
dist
ortio
n le
vel b
etw
een
them
0 0.5 1 1.5 2-15
-10
-5
0
5
x 105
Time (s)
PV
S, W
EC
S a
nd H
S a
ctiv
e po
wer
s (W
)
PHS
PWECS
PPVS
HS total power
HS mean power
Distortion level
DR=0.95 %
Pmean
=-0.861 MW
0 0.5 1 1.5 2-15
-10
-5
0
5
x 105
Time (s)
HS
tota
l and
mea
n ac
tive
pow
ers
in W
att
and
the
dist
ortio
n le
vel b
etw
een
them
0 0.5 1 1.5 2-15
-10
-5
0
5
x 105
Time (s)
PV
S, W
EC
S a
nd H
S a
ctiv
e po
wer
s (W
)
PHS
PWECS
PPVS
HS total power
HS mean power
Distortion levelLimitation with
weather conditions
DR=1.48 %
Pmean
=-0.932 MW
Control and Management of a Solar-Wind Hybrid System for Power . . . . 1437
Journal of Engineering Science and Technology June 2018, Vol. 13(6)
Table 4. Financial estimation of the studied HS energy system
production profit for the proposed control strategy (Modified MPPT mode).
Mean
Power
(MW)
Participation
rate in
production
(%)
Exploitation
time per
day (h)
Price of
electricity/kWh
in Algeria
(USD)
Annual
profit
(USD)
PVS -0.272 29.2 6 ≈ 0.33 196,574
WECS -0.660 70.8 20 ≈ 0.33 1 589,940
HS -0.932 100 / ≈ 0.33 1 786,514
By considering an electricity price per kWh of energy in Algeria of 5 DA
(equivalent approximately to about 0.33 USD), the exploitation of the studied HS
based on real data obtained on site will ensure a financial benefit of 1 786,514 USD
per year. This result will encourage different actors of electrical energy to exploit
this studied HS in Algeria. Indeed, this study will motivate different actors in
Algeria to reach the government scheduled production level of 13575 MW from
PVS and 5010 MW from WECS on the horizon of 2030 [31].
5. Conclusion
In order to resolve the dilemma quantity/quality of energy of renewable energy
hybrid systems (composed of a PVS and a WECS) due to the intermittent nature of
this kind of energy sources, a modified MPPT control technique has been proposed
in this paper. This control strategy has been successfully used to achieve a good
compromise between the energy production level and the minimization of the
produced energy fluctuation rate. The studied system, composed of a WECS of 1.5
MW of power and a PVS with a rated power of 400 kW, has been presented, studied
and simulated on the basis of actual climate data (wind speed, sun illumination and
temperature) of the Adrar site (the most important potential in Algeria in terms of
wind speed and sun illumination) situated in the south of Algeria. Furthermore, the
results of two classical control techniques have been presented in this paper, the
first is the conventional MPPT strategy applied to control each system (WECS and
PVS) independently. The second strategy is the guaranteed minimum available
power (GMAP) control mode based on the mean values of PVS and the guaranteed
minimum available power of wind. The modified MPPT proposed control mode
presented in this work divides the PVS production into two components: a
fluctuating component, which is used to compensate the fluctuations resulting from
the WECS produced power, while the second component participates in the overall
power production increasing. The simulation results have shown clearly the ability
of the proposed technique to resolve the dilemma power quality-power quantity
exhibited by this kind of intermittent power systems.
References
1. Somayajula, D.; and Crow, M.L. (2014). An ultra-capacitor integrated power
conditioner for intermittency smoothing and improving power quality of
distribution grid. IEEE Transactions on Sustainable Energy, 5(4), 1145-1155.
2. Badwawi, R.A.; Abusara M.; and Mallick, T. (2015). A review of hybrid solar
PV and wind energy system. Smart Science, 3(3), 127-138.
1438 B. Toual et al.
Journal of Engineering Science and Technology June 2018, Vol. 13(6)
3. Ren21 Secretariat (2017). Renewables 2017. Global status report. Retrieved
December 28, 2017, from http://www.ren21.net/wp-content/uploads/2017/06/
178399_GSR_2017_Full_Report_0621_Opt.pdf.
4. Al Busaidi, A.S.; Kazem, H.A.; Al-Badi, A.H.; and Khan, M.F. (2016). A
review of optimum sizing of hybrid PV - Wind renewable energy systems in
Oman. Renewable and Sustainable Energy Reviews, 53, 185-193.
5. Martin, M.; and Davis, W. (2016). Integration of wind, solar and biomass over
a year for the constant production of CH4 from CO2 and water. Computers
and Chemical Engineering, 84, 313-325.
6. Trifkovic, M.; Sheikhzadeh, M.; Nigim, K.; and Daoutidis, P. (2014).
Modeling and control of a renewable hybrid energy system with hydrogen
storage. IEEE Transactions on Control Systems Technology, 22(1), 169-179.
7. Thounthong, P.; Sikkabut, S.; Mungporn, P.; Piegari, L.; Nahid-Mobarakeh, B.;
Pierfederici, S.; and Davat, B. (2015). DC bus stabilization of li-ion battery based
energy storage for a hydrogen/solar power plant for autonomous network
applications. IEEE Transactions on Industry Applications, 51(4), 2717-2725.
8. Shang, C.; Srinivasan, D.; and Reindl, T. (2016). An improved particle
swarm optimisation algorithm applied to battery sizing for Stand-alone
hybrid power systems. International Journal of Electrical Power & Energy
Systems, 74, 104-117.
9. Xiong, X.; Chi, K.T.; and Ruan, X. (2015). Bifurcation analysis and
experimental study of a multi-operating-mode photovoltaic-battery hybrid
power system. IEEE Transactions on Emerging and Selected Topics in
Circuits and Systems, 5(3), 316-325.
10. Huynh, D.C.; and Dunnigan, M.W. (2016). Development and comparison of
an improved incremental conductance algorithm for tracking the MPPT of a
solar PV panel. IEEE Transactions on Sustainable Energy, 7(4), 1421-1429.
11. Qin, S.; Barth, C.B.; and Pilawa-Podgurski, R.C.N. (2016). Enhancing
microinverter energy capture with submodule differential power processing.
IEEE Transactions on Power Electronics, 31(5), 3575-3585.
12. Wu, B.; Li, S.; Liu, Y.; and Smedley, K.M. (2016). A new hybrid boosting
converter for renewable energy applications. IEEE Transactions on Power
Electronics, 31(2), 1203-1215.
13. Jiang, J.A.; Su, Y.L.; Kuo, K.C.; Wang, C.H.; Liao, M.S.; Wang, J.C.; Huang,
C.K.; Chou, C.Y.; Lee, C.H.; and Shieh, J.C. (2016). On a hybrid MPPT
control scheme to improve energy harvesting performance of traditional two-
stage inverters used in photovoltaic systems. Renewable and Sustainable
Energy Reviews, 69, 1113-1128.
14. Zhang, L.; Sun, K.; Hu, H.; and Xing, Y. (2014). A system-level control
strategy of photovoltaic grid-tied generation systems for European efficiency
enhancement. IEEE Transactions on Power Electronics, 29(7), 3445-3453.
15. Boutoubat, M.; Mokrani, L.; and Machmoum, M. (2013). Control of a wind
energy conversion system equipped by a DFIG for active power generation
and power quality improvement. Renewable Energy, 50, 378-386.
16. Mahvash, H.; Taher, S.A.; and Rahimi, M. (in press). A new approach for
power quality improvement of DFIG based wind farms connected to weak
utility grid. Ain Shams Engineering Journal.

Control and Management of a Solar-Wind Hybrid System for Power . . . . 1439
Journal of Engineering Science and Technology June 2018, Vol. 13(6)
17. Kamel, R.M. (2016). Standalone micro grid power quality improvement using
inertia and power reserves of the wind generation systems. Renewable Energy,
97, 572-584.
18. Ram, J.P.; Rajasekar, N.; and Miyatake, M. (2017). Design and overview of
maximum power point tracking techniques in wind and solar photovoltaic
systems: A review. Renewable and Sustainable Energy Reviews, 73, 1138-1159.
19. Kumar, Y.V.P.; and Bhimasingu, R. (2016). A simple modular multilevel
inverter topology for the power quality improvement in renewable energy based
green building microgrids. Electric Power Systems Research, 140, 147-161.
20. Tansi, B.N. (2011). An assessment of Cameroon’s renewable energy resource
potential and prospects for a sustainable economic development. Master
Thesis. Faculty of Environmental Sciences and Process Engineering,
Brandenburg University of Technology Cottbus, Germany.
21. Motahhir, S.; El Ghzizal, A.; Sebti, S.; and Derouich, A. (2016). Shading effect
to energy withdrawn from the photovoltaic panel and implementation of
DMPPT using C language. International Review of Automatic Control
(IREACO), 9(2), 88-94.
22. Motahhir, S.; El Ghzizal, A.; Sebti, S.; and Derouich, A. (2015). Proposal and
implementation of a novel perturb and observe algorithm using embedded
software. Proceedings of the 3rd International Renewable and Sustainable
Energy Conference (IRSEC). Marrakech, Morocco, 1-5.
23. Kichou, S.; Berges, S.S.; Guglielminotti, L.; Mora-Lopez, L.; and Munoz-
Ceron, E. (2016). Comparison of two PV array models for the simulation of
PV systems using five different algorithms for the parameters identification.
Renewable Energy, 99, 270-279.
24. Abd El Satar, M.; Ali, H.; and Elbaset, A.A. (2016). New seven parameters
model for amorphous silicon and thin film PV modules based on solar
irradiance. Solar Energy, 138, 26-35.
25. Motahhir, S.; El Ghzizal, A.; Sebti, S.; and Derouich, A. (2017). MIL and SIL
and PIL tests for MPPT algorithm. Cogent Engineering, 4, 1378475.
26. Taleb, M. (2017). A grid-connected hybrid wind-solar power system. Journal
of Engineering Science and Technology (JESTEC), 12(6), 1697-1708.
27. Ouyang, T.; Kusiak, A.; and He, Y. (2017). Modeling wind-turbine power
curve: A data partitioning and mining approach. Renewable Energy, 102, 1-8.
28. El Aimani, S. (2004). Modélisation de différentes technologies d’éoliennes
intégrées dans un réseau de moyenne tension. Ph.D. Thesis. Electrical
Engineering. University of Science and Technology of Lille, Lille, France.
29. Boukhezzar, B.; and Siguerdidjane, H. (2009). Nonlinear control with wind
estimation of a DFIG variable speed wind turbine for power capture
optimization. Energy Conversion and Management, 50(4), 885-892.
30. Ksentini, A. (2016). Gestion et optimisation du site idéal des éoliennes en
Algérie pour une zone autonome. Ph.D. Thesis. Faculty of Technology
Department of Electrical Engineering. University of Batna 2, Fesdis, Algeria.
31. Sahraoui, H. (2016). Modélisation et commande des convertisseurs DC-DC
utilisés dans les systèmes photovoltaïques (théorie et expérimentation). Ph.D.
Thesis. Faculty of Technology Department, University of Batna 2, Fesdis, Algeria.