contract research report 380/20012.2.2 combi-boiler the wall-mounted combi-boiler was a vaillant vcw...
TRANSCRIPT

HSEHealth & Safety
Executive
Joint Industry Programme oncarbon monoxide issues
Experimental work to study the interactionbetween air extraction equipment and
open-flued appliances - Phase 1
Prepared byAdvantica Technologies Limited
(formerly BG Technology)for the Health and Safety Executive
CONTRACT RESEARCH REPORT
380/2001
HSEHealth & Safety
Executive
Joint Industry Programme oncarbon monoxide issues
Experimental work to study the interactionbetween air extraction equipment and
open-flued appliances - Phase 1
R W Hill and G PoolAdvantica Technologies Limited
(formerly BG Technology)Ashby Road
LoughboroughLeicestershire LE11 3GR
United Kingdom
The results of full-scale experiments are reported to determine the effect of extract fans on open fluedgas appliances. Three types of gas appliance (a gas fire, a central heating boiler, and a combi boiler)and two type of extractor (window mounted, and cooker hood) were used. Two different ventilatorheights were also used.
Tests were carried out with different extract rates, and with both initially cold and hot flues. Theextraction rate was increased until a reversed flow in the flue could be maintained. Temperatures in theroom containing the appliance were measured. Concentrations of carbon monoxide, carbon dioxideand oxygen were monitored at several heights in different rooms of the experimental house facility, andalso close to the boiler, and in the air extract system.
During the final part of the test the ventilator was gradually opened from the minimum sizerecommended by the appropriate British Standard until the flue pulled normally.
This report and the work it describes were funded by the Health and Safety Executive (HSE). Itscontents, including any opinions and/or conclusions expressed, are those of the authors alone and donot necessarily reflect HSE policy.
HSE BOOKS

ii
© Crown copyright 2001Applications for reproduction should be made in writing to:Copyright Unit, Her Majesty’s Stationery Office,St Clements House, 2-16 Colegate, Norwich NR3 1BQ
First published 2001
ISBN 0 7176 2121 9
All rights reserved. No part of this publication may bereproduced, stored in a retrieval system, or transmittedin any form or by any means (electronic, mechanical,photocopying, recording or otherwise) without the priorwritten permission of the copyright owner.

iii
CONTENTS 1 INTRODUCTION 1 2 EXPERIMENTAL FACILITIES 2
2.1 The Test Enclosure 2 2.2 Gas Appliances 2 2.3 Gas Supply 3 2.4 Air Extraction Equipment 3 2.5 Experimental Measurements 4
3 EXPERIMENTAL PROGRAMME 8 4 EXPERIMENTAL PROCEDURE 10 5 RESULTS 11
5.1 Combi boiler 11 5.2 Central Heating Boiler 14 5.3 Gas fire 15
6 DISCUSSION 16 6.1 Combustion Products 16 6.2 Temperatures 18 6.3 Differential Pressures 18 6.4 Extra Ventilator area Required 19
7 CONCLUSIONS 20 8 RECOMMENDATIONS 21 9 BIBLIOGRAPHY 22 APPENDIX A COLLECTED FIGURES FOR TESTS 1 TO 21 39

iv

v
SUMMARY
INTRODUCTION
The effective removal of combustion products through the flue of an open-flued gas appliance can be affected by a number of processes, e.g. blockage of the flue or inadequate ventilator air provis ion to the appliance. The operation of air extraction equipment in a property can also cause the combustion products to be inefficiently removed by depressurising the area within which the appliance is located and offering a preferred pathway into the property.
This report describes work carried out to determine what factors contribute to this process in a full scale domestic property, and produces some guidelines for the installers of gas appliances and extract fans.
METHODOLOGY
A programme of work was carried out in a full scale brick built house using 3 types of open-flued gas appliance. Extract rates, gas concentrations, temperatures, and pressures were monitored during the tests.
RESULTS
a) Flue reversal can be obtained in the Gas Fire and Central Heating boiler using low (<90m3/hr) extraction rates. Higher extraction rates were required with the Combi boiler to produce flue reversal.
b) The rate of production of carbon monoxide was dependent on the appliance. Larger quantities were produced at higher (>200m3/hr) extraction rates.
c) Closure of an intervening door between the appliance and the extract system caused dramatic / significant increases in the quantity of carbon monoxide produced by the Combi and Central Heating Boilers respectively.
d) The temperature rise alone, compared to normal operation of the appliances, would be unlikely to warn an occupant of a problem.
e) A linear relationship (with some scatter) was seen between the extra ventilator area required to make the flue revert to normal flow and the excess extraction rate (The excess extraction rate is defined as flow rate used - flow rate required to just reverse the cold flue)
f) In all the tests the extra ventilator area required to make a reversed flue flow normally was greater than 50cm2
CONCLUSIONS
Any further work should cover a wider range of appliances. Examples of items to be included are:- • Low level extractors (e.g. tumble driers)
• Different designs of draught diverters on types of appliance already tested
• Different types of appliances (e.g. flame effect gas fires)

vi
1
1 INTRODUCTION
Open-flued appliances work by taking air for combustion from the volume surrounding the appliance, and venting the combustion products via the flue to the atmosphere. If the process of venting is impeded, e.g. by an adverse flow in the flue, unwanted combustion products can be spilled into the volume around the appliance. Whilst current legislation requires anti-vitiation devices to be fitted to new appliances, a substantial population of older appliances (up to 40 million altogether) currently installed in the UK includes a significant number without such safety features. The anti-vitiation devices fitted to new appliances may also not work effectively under such conditions.
Open-flued appliances are designed with a draught diverter to cope with intermittent downdraught in the flue (caused generally by wind effects around the flue terminal) to ensure the products of combustion do not directly affect the appliance burners. However for these short periods the combustion products enter the room by the draught diverter, rather than being evacuated by the flue.
A potential way of producing adverse flow in the flue is the operation of an extraction fan near the open-flued appliance. This causes de-pressurisation of the room and consequently air from outside may flow down the flue into the room, causing the combustion products to be spilled into the room. Examples of appliances with extraction fans are cooker hoods, tumble driers, fan assisted open-flued appliances, as well as wall / window mounted extraction fans themselves.
The work used three different types of appliance, and looked at the effect of the type and location of the extract fan, and the position of a ventilator (sized to comply with BS5440#1
minimum requirements on area). At the end of a typical experiment the extract fan was left on and the extra ventilator area necessary to allow normal operation of the flue was determined.

2
2 EXPERIMENTAL FACILIT IES
2.1 THE TEST ENCLOSURE
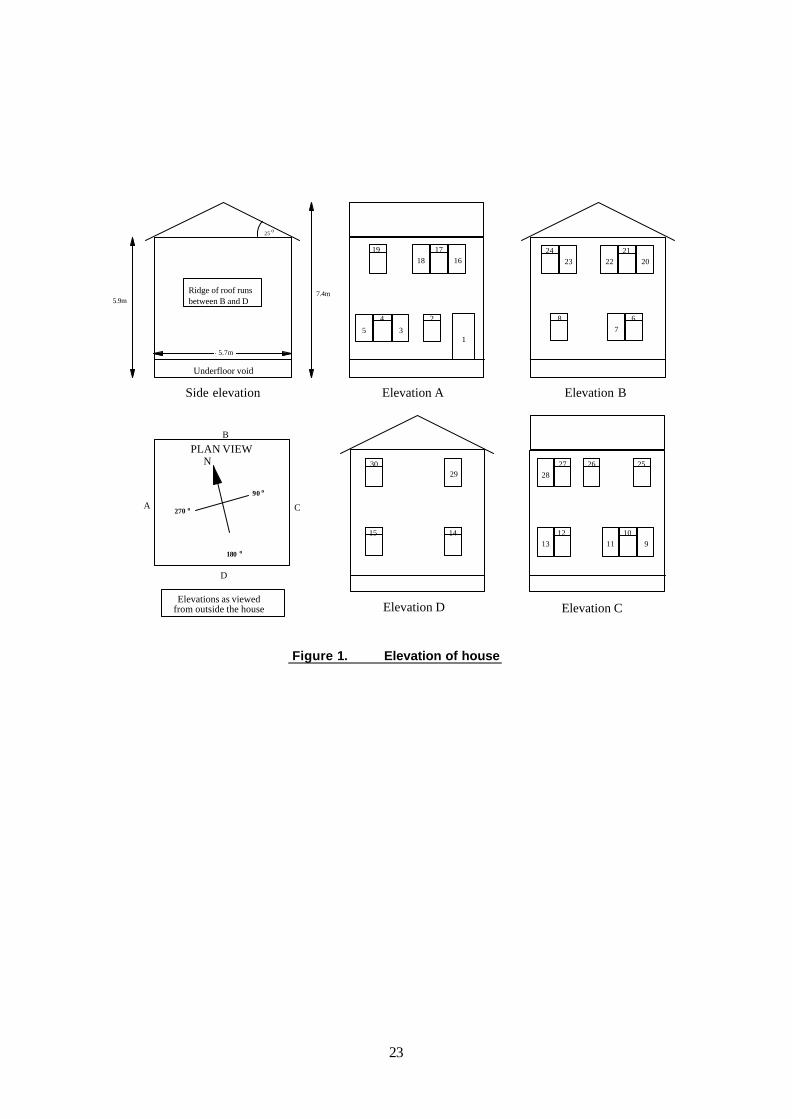
The programme of experiments was carried out in the Ventilation Test House facility at the BG Technology Fauld Test Site. This test facility is a purpose-built two-storey detached house of standard brick cavity wall construction, with a pitched tiled roof (see Figure 1). The upper and lower floors each have dimensions of approximately 5.7m x 5.7m x 2.3m high and are connected by a staircase. Both the upper and lower floors have been subdivided into connecting rooms by installing standard internal partition walls. Doorways were located in these partitions and doors fitted. (The dimensions of the internal interconnecting doorways are 1.98m x 0.78m). The layout of the ground and first floor is shown in Figure 2.
The lower floor was raised above ground level to provide an under floor void of approximate dimensions 5.7m x 5.7m x 0.9m. This was normally ventilated but the ventilators and access openings were blocked off for this study to provide an unventilated void.
The house had one entrance door and twenty-nine windows. The number and locations of the windows are such that when the upper and lower floors were subdivided, all rooms contained at least two windows on different walls. This arrangement allowed a wide range of ventilation regimes to be investigated. Ventilation was available within a room via openings of adjustable area at high level (located in the upper portion of a window, 1.93m from the floor) and/or at low level (0.38m from the floor). The positions of the ventilators are shown in Figure 3. In all tests Door D was closed and the top, bottom and sides were sealed with tape. Doors not directly into the rooms used in a particular test were closed, but not sealed. The door(s) directly into these rooms were sealed by tape, except as stated in Table 3.
The gas appliances and extract fans were located on the ground floor of the test house facility (see Figure 2) during this test programme. The positions used are shown in Figure 3 and details of the configuration used for each test are described under the test details.
2.2 GAS APPLIANCES
The gas appliances used were a floor standing box radiant gas fire, a wall-mounted central heating boiler, and a wall-mounted combi-boiler. Details of these appliances are presented below. The locations of the appliances are shown in Figure 3.
2.2.1 Gas fire
This floor standing appliance was a Cannon K26 Misermatic box radiant gas fire with a maximum heat input of 6.45kW. The fire was mounted in a Firebox and flued by 125mm diameter twin walled flue. The flue was terminated in the loft space, and had a length of approximately 5 metres. (To make the flue pull less susceptible to the effects of wind conditions, the flue was terminated in the loft space. There was no evidence of any combustion product build up in the loft space influencing the experiments.)
2.2.2 Combi-boiler
The wall-mounted combi-boiler was a Vaillant VCW GB 280H model with a maximum heat input of 35.4kW (120,800Btu/hr). The appliance was supported on a trolley and was located at a height of 0.95m from the floor, with the back of the boiler approximately 0.2m from the wall. The appliance was flued by 125mm diameter twin walled flue which terminated in the loft space, and had a length of approximately 3½ metres.

3
2.2.3 Central heating boiler
The wall-mounted central heating boiler was a Myson Apollo 40C model with a maximum heat input of 15.4kW (52,600Btu/hr). It was supported on a trolley and located at a height of 1.23m from the floor, with the back of the boiler approximately 0.1m from the wall. The appliance was flued by 100mm diameter twin walled flue which terminated in the loft space, and had a length of approximately 3½ metres.
2.2.4 Operating arrangements
The gas fire did not have a thermostat installed and, following ignition, was operated continuously at the maximum heat output setting.
The Combi-boiler, and Central Heating boile r were operated continuously (at maximum heat output) by ensuring a constant flow of water was passing through them. In this way, the water outlet temperature was prevented from becoming high enough to cause the appliance to turn off or cycle. The hot water produced was taken via a flexible hose and disposed of outside the building.
2.3 GAS SUPPLY
Natural gas was supplied to the appliances from high pressure cylinders (approximately 120bar cylinder pressure). The cylinder pressure was reduced using a two-stage pressure reduction system based upon a Fisher 1301F inlet regulator followed by a Fisher 630-312 governor. The outlet pressure of the two-stage pressure reduction system was adjusted to approximately 0.3bar. Gas was then delivered to the Test House through 40mm internal diameter pipe work via a bank of rotameters, which could be used to visually monitor the gas flow rate to an appliance during an experiment, and a further governor to reduce the supply pressure to the house to about 35mbar. The 40mm internal diameter supply pipe was connected to a 25mm internal diameter riser in the void beneath the Test House, which passed through the floor of the lower storey and then to the gas meter inlet via a short length of flexible pipe work. The meter governor was set to provide an outlet pressure of approximately 20mbar which is typical of a domestic system. The meter outlet was connected to a 15mm internal diameter copper pipe installed around the walls of the lower storey of the Test House approximately 10cm above floor level. The gas appliances were supplied from this copper carcassing by a flexible hose.
2.4 AIR EXTRACTION EQUIPMENT
A schematic diagram of the air extraction system is shown in Figure 4. The air extraction system consisted of 2 Xpelair Centrifugal Duct fans, type XID 150, a flow measurement section using a Trox VMR125 and a Furness Controls micromanometer, type FCS300, and 150mm diameter flexible ducting. The outlet from the system was positioned so that combustion products did not re-enter the house. The inlet from the room was via an adapter plate which could be fitted in place of the top section of one of the windows of the house. This was moved to the appropriate window for the test.
The Cooker Hood was a Stoves 029, connected to the normal inlet via 125mm ducting.
Flow was measured via the Trox VMR125, and could be adjusted by using a Variac to control the speed of the fans.

4
2.5 EXPERIMENTAL MEASUREMENTS
During each experiment, measurements were made to monitor the following parameters:-
a) Concentration of carbon monoxide, carbon dioxide and oxygen present within the test enclosure, in the combustion air supply to the appliance, and in the draught diverter, and in the flue;
b) Temperatures within the test enclosure, the draught diverter, and the flue; c) Pressures in the test enclosure and the flue;
d) Prevailing weather conditions outside the Test House.
Details of these measurements are outlined below.
2.5.1 Infrared analysers
The concentration of carbon monoxide, carbon dioxide and oxygen within the rooms of the test enclosure was monitored by means of sample probes attached to a sample stand. The position of these stands is shown on Figure 3. The stand in the centre of the room containing the gas appliance supported seven probes installed to provide measurements of gas concentration on a vertical axis over essentially the full height of the room between floor and ceiling level. The remaining stands supported six sample probes. In addition sample probes were located in the path of the combustion air supply to the appliance, the draught diverter and the flue, and in the ductwork from the extract fan. The heights of the sample probes above the ground floor are given in Table 1.
The probes were sampled in the required sequence using a stream selection unit controlled by the data logging/analysis system. Three analysers were used. The sample probe sequence is shown in Table 2. The build-up of carbon monoxide within each room was monitored by means of graphical displays of the concentration-height profiles measured at the sample stand location on a video display unit which formed part of the data logging/analysis system.
All samples withdrawn during the course of an experiment for analysis were analysed by instruments located inside an instrument kiosk situated to the rear of the Test House and dried prior to analysis using dedicated Perma Pure drying columns. These columns exchanged water vapour through capillary tubes with walls made from semi-permeable material with a dry stream of air circulating around them. Such a technique ensured there was no adsorption of combustion products onto the surface of any solid drying agents which would have rendered the resulting gas concentration measurements inaccurate.
Each of the probes used to measure the concentration of carbon monoxide , carbon dioxide and oxygen was sampled for a 45 second period to ensure the line had been purged completely and the analyser, a Siemens Ultramat 22 + O2 or Siemens Ultramat 23 + O2 provided an accurate measurement of concentration at the moment a data point was logged.

5
Table 1. Height of sample probes
On Sample Stands
Sample probe 1 2 3 4 5 6 7
Height above floor - metres
2.25 1.85 1.50 1.20 0.85 0.45 0.05
Height above floor - metres
2.25 1.80 1.40 0.95 0.50 0.05 -
In Combustion Air Supply
Appliance Combi Boiler Central Heating Boiler
Gas Fire
Height above floor – metres
1.7 1.3 0.1
In Draught Diverter
Appliance Combi Boiler Central Heating Boiler
Gas Fire
Height above floor – metres
2.3 1.7 0.6
In Flue
Appliance Combi Boiler Central Heating Boiler
Gas Fire
Height above floor – metres 4.0 4.0 4.0

6
Table 2. Sample probe sequences
Heater combustion air and combustion product streams Sequence Combustion air
supply Draught
diverter Flue
using a Siemens Ultramat 22 + O2 with ranges of: 0 – 500ppm CO,0 – 10% CO2, 0 – 25% O2 Time taken - 2¼ minutes
In centre of release room
Sequence 1
2
3
4
5
6
7
using a Siemens Ultramat 22 + O2 with ranges of: 0 – 10000ppm CO, 0 – 10% CO2, 0 - 25% O2
Time taken - 5¼ minutes
Other positions downstairs : Stands in remaining rooms downstairs
Room 2 1
2
3
4
5
6
Extract duct
Room 1 or 3 (not
release room)
Extract duct
6 5 4 3 2 1
Room 4 1
2
3
4
5
6 Extrac
t duct
Other positions downstairs : Additional stand at side of release room
Room 2 1
2 5 6
Room 1 or 3 (not release
room)
6
5
Extract duct
2
1
Room 4 1 2 5
6 Extract
duct
Room 3 or 1 (release room)
Extract duct 6 5
4 3
2
1
using a Siemens Ultramat 23 + O2 with ranges of: 0 – 5000ppm CO, 0 – 10% CO2, 0 - 25% O2 Time taken for either sequence - 15¾ minutes

7
2.5.2 Temperatures
Temperatures were measured at 3 heights (near the ceiling, mid height, and close to the floor) on either:-
• the central stand in Room 1 and the central stand in Room 3, or
• the central stand in Room 3 and the side stand in Room 3
(The second configuration was only used in tests in which the gas appliance was positioned in Room 3.)
The temperatures were measured using LM35 semiconductor sensors.
In addition, temperatures were measured in or close to the draught diverter, and in the flue. Because of the higher temperatures, type K thermocouples were used.
2.5.3 Pressures
Furness Controls micromanometers, type FCS300, were used to measure the differential pressures between:-
a) Outside and the room
b) The room and the flue c) The pressure due to flow through the flue. d) The pressure due to flow through the extraction system
2.5.4 Ambient weather conditions
The prevailing weather conditions were monitored during each experiment using instrumentation local to the test enclosure. Air temperature and relative humidity were measured using a Vaisala HMD70Y, and the atmospheric pressure using a PTB100A barometer. The wind speed was monitored together with the wind direction using a Gill Instruments Ultrasonic Anemometer. The sensing elements for this instrument were positioned at a height of 9 metres and attached to a supporting mast mounted centrally on the north wall of the Test House.
2.5.5 Recording of data
The logging system was controlled by a PC in the control room, and used InstruNet modules (manufactured by GW Instruments inc.) located much closer to the instruments to record the data. In this way the noise on the signa ls was kept as low as possible.
The InstruNet modules were also used to control the stream selection boxes for the gas sample probes with data points recorded every 45 seconds. The data was transferred straight into an Excel spreadsheet so that real time displays could be obtained of, for example, gas concentration profiles, temperatures, weather conditions, etc. during the test. In addition the spreadsheet itself could be examined while the test was still in progress.
8
3 EXPERIMENTAL PROGRAMME
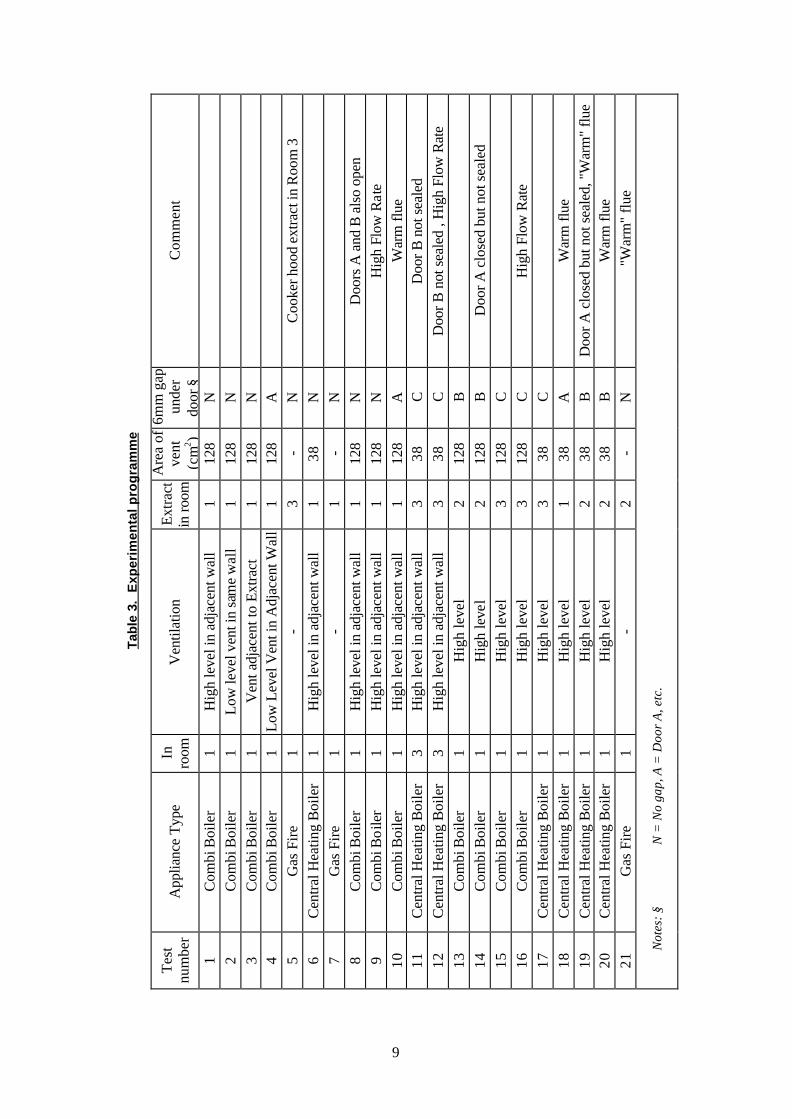
The experimental programme consisted of 21 tests. Details are shown in Table 3.
Three different types of gas appliance, as described in Section 2.2, and two types of air extraction, as described in Section 2.4, were used. These were located as shown in Figure 3 and Table 3. A ventilator was provided to comply with the minimum ventilation requirements of BS5440#1. The positions of the ventilators are shown in Figure 3, and further details are given in Table 3. Additional ventilation was provided by leaving a 6mm gap underneath one of the doors to the volume containing the gas appliance and extract fan in most tests, as shown in Table 3.
Some tests were performed with the gas appliance and the extract fan in the same room, whilst in others the gas appliance and extract fan were in different rooms. In two of the tests the door between the room containing the gas appliance and the room containing the extract fan was closed, although gas flow between the two rooms was possible through gaps between the door and the frame.
Figure 5 shows the sequence followed in performing a test. The majority of tests had the extract fan turned on before the gas appliance was lit (a “cold” flue). In a few tests the gas appliance was lit and the flue allowed to reach steady state conditions before the extract fan was turned on (a “warm” flue). The “warm” flue condition is indicated in Table 3
9
Com
men
t
C
ooke
r hoo
d ex
tract
in R
oom
3
D
oors
A a
nd B
als
o op
en
Hig
h Fl
ow R
ate
War
m fl
ue
Doo
r B n
ot s
eale
d D
oor B
not
sea
led
, Hig
h Fl
ow R
ate
D
oor A
clo
sed
but n
ot s
eale
d
Hig
h Fl
ow R
ate
W
arm
flue
D
oor A
clo
sed
but n
ot s
eale
d, "
War
m"
flue
War
m fl
ue
"W
arm
" flu
e
6mm
gap
un
der
door
§
N
N
N
A
N
N
N
N
N
A
C
C
B
B
C
C
C
A
B
B
N
Are
a of
ve
nt
(cm
2 ) 12
8 12
8 12
8 12
8 - 38
- 128
128
128
38
38
128
128
128
128
38
38
38
38
-
Extra
ct
in ro
om
1 1 1 1 3 1 1 1 1 1 3 3 2 2 3 3 3 1 2 2 2
Ven
tilat
ion
Hig
h le
vel i
n ad
jace
nt w
all
Low
leve
l ven
t in
sam
e w
all
Ven
t adj
acen
t to
Extra
ct
Low
Lev
el V
ent i
n A
djac
ent W
all
- H
igh
leve
l in
adja
cent
wal
l -
Hig
h le
vel i
n ad
jace
nt w
all
Hig
h le
vel i
n ad
jace
nt w
all
Hig
h le
vel i
n ad
jace
nt w
all
Hig
h le
vel i
n ad
jace
nt w
all
Hig
h le
vel i
n ad
jace
nt w
all
Hig
h le
vel
Hig
h le
vel
Hig
h le
vel
Hig
h le
vel
Hig
h le
vel
Hig
h le
vel
Hig
h le
vel
Hig
h le
vel
-
In
room
1 1 1 1 1 1 1 1 1 1 3 3 1 1 1 1 1 1 1 1 1
App
lianc
e Ty
pe
Com
bi B
oile
r C
ombi
Boi
ler
Com
bi B
oile
r C
ombi
Boi
ler
Gas
Fire
C
entra
l Hea
ting
Boi
ler
Gas
Fire
C
ombi
Boi
ler
Com
bi B
oile
r C
ombi
Boi
ler
Cen
tral H
eatin
g B
oile
r C
entra
l Hea
ting
Boi
ler
Com
bi B
oile
r C
ombi
Boi
ler
Com
bi B
oile
r C
ombi
Boi
ler
Cen
tral H
eatin
g B
oile
r C
entra
l Hea
ting
Boi
ler
Cen
tral H
eatin
g B
oile
r C
entra
l Hea
ting
Boi
ler
Gas
Fire
Tab
le 3
. E
xper
imen
tal p
rog
ram
me
Tes
t nu
mbe
r
1 2 3 4 5 6 7 8 9 10
11
12
13
14
15
16
17
18
19
20
21 N
otes
: §
N
= N
o ga
p, A
= D
oor
A, e
tc.

10
4 EXPERIMENTAL PROCEDURE
When the experiment involved a cold flue, the extract fan was run at a high rate and the gas appliance lit. The flow in the flue was monitored by the differential pressure due to flow and also by the temperatures in the flue and the draught diverter. The level of extract was reduced until the flue started to pull in order that the flow rate required to just reverse the flue could be determined. The appliance was then extinguished and the extract rate increased. The flue was allowed to cool before the gas appliance was re-lit. This time the flow rate in the extract was only reduced to a level where flow reversal in the flue could be maintained in spite of variations in ambient conditions, such as gusts of wind. (This demanded care - too low a flow rate resulted in the flue spontaneously pulling normally, and too high a rate would distort the experimental results. In practice, the flow rate used was increased from a low level until spontaneous flue pulling was not observed.)
When the experiment involved the use of a “warm” flue, the extract fan was started at a high rate and the gas appliance lit. The extract rate was reduced until the flue started to pull so that the flow rate required to just reverse the flue could be determined The extract fan was then turned off, and the flow of combustion products through the flue caused it to heat up. When both the temperature and the flow in the flue had stabilised, the extract fan was re-started and the flow increased until normal flow in the flue was replaced by air from outside flowing down the flue. This flow rate was maintained for the rest of the test.
The phase of the test where reversed flow was maintained was continued until one of the following was reached:-
a) a steady-state concentration of carbon monoxide had been measured within the room containing the appliance; or
b) ½ hour had elapsed (using the Combi boiler); or
c) 1 hour had elapsed (using the Central Heating boiler); or d) 3 hours had elapsed (using the Gas Fire).
The final phase of the experiment determined the extra ventilator area required to cause the flow in the flue to revert to normal. The extraction rate was maintained while the ventilator(s) were gradually opened. “Normal” flow in the flue was deemed to have been produced when the temperatures and differential pressures in the flue were similar to those observed when the appliance was operating normally.

11
5 RESULTS
The Appendix to this report contains details of the measurements made during each of the 21 tests conducted. Each test has associated data which includes:
a) Details of the room configuration, average wind speed/direction and general test conditions in Table 4.
b) The prevailing weather conditions (wind speed/direction, temperature, humidity, pressure).
c) The variation in carbon monoxide, carbon dioxide and oxygen concentrations with time in the combustion air supply, at the draught diverter, and in flue to the appliance.
d) The variation in carbon monoxide, carbon dioxide and oxygen concentrations with time in the rooms of the house. This information is presented as concentration-height profiles.
e) The variation in carbon monoxide, carbon dioxide and oxygen concentrations with time in the extraction system.
f) Flow through the extraction system. g) Extra ventilator area needed to make the flue revert to normal operation. h) Temperatures inside the house.
The results obtained are discussed in detail below.
5.1 COMBI BOILER
The Combi boiler was located in Room 1, the largest on the ground floor of the house, because of its relatively high power rating. It was found that an extract rate of 60 – 180m3/hr was sufficient to maintain flue reversal for a short period. The large spread of values was probably due to the different configurations used in the tests. Thus when Door A was closed an extract rate of 60 - 120m3/hr was needed, but when the ventilator and extract fan were in different rooms an extract rate of 140 - 180m3/hr was needed. The extra, or excess, extraction was probably required because of greater adventitious ventilation openings (e.g. cracks around windows, in walls and floors) present in the larger volumes. The rate of extraction determined above was not sufficient to maintain flue reversal during the steady state phase of the test. This may have been due to small pressure perturbations in the flue caused by to external wind conditions, or variations in the “drive” of combustion products at the base of the flue. Thus for the steady state phase, rates of 160 - 190m3/hr were required in tests involving Room 1 only, rising to 250m3/hr where the extract fan was operating in a different room.
This “excess” flow rate in the extraction system is defined as:
flow rate used – flow rate required to just reverse the cold flue
The extraction rates measured in each test are shown in Table 4.
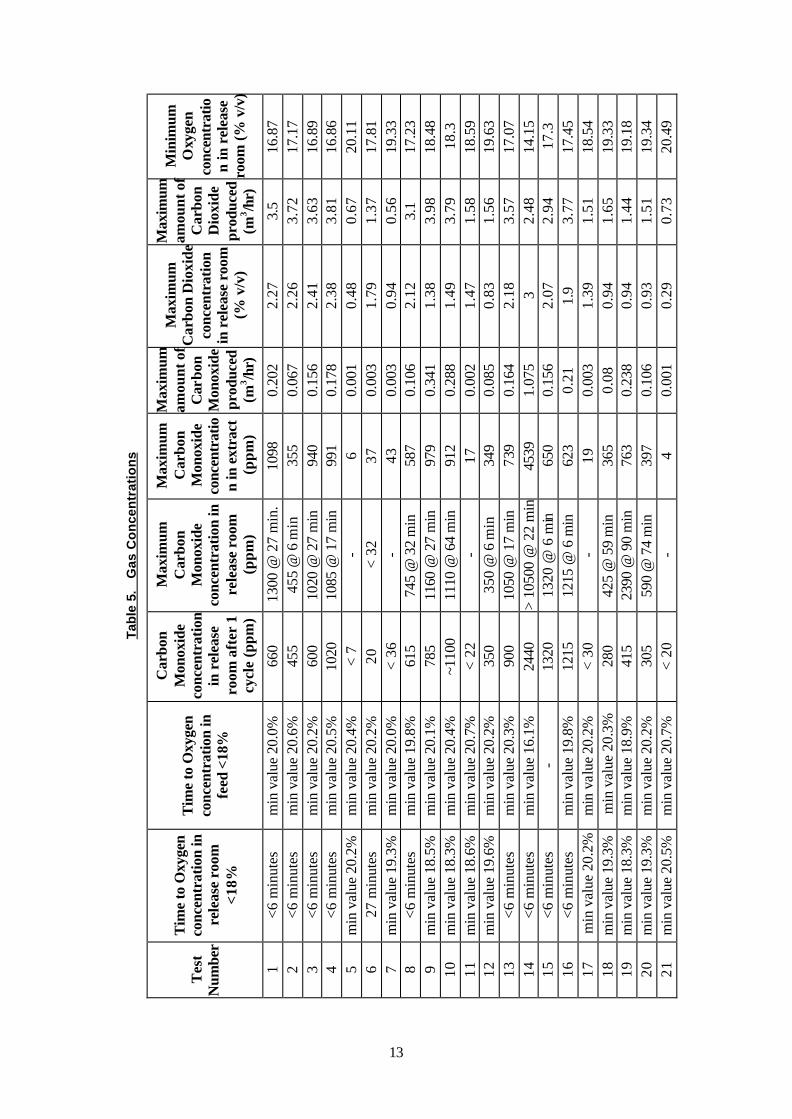
Carbon monoxide and carbon dioxide spilled into the room as soon as the flue was reversed. The concentration of each increased rapidly, and steady state conditions were obtained in the release room after only a few minutes. An example of the concentration profiles (for carbon monoxide, carbon dioxide and oxygen respectively) in the release room (for Test 1) is shown in Figures 6, 7 and 8. The build up of combustion products in the other rooms was slower, and was affected by the configuration of the boiler, extract fan, and open doors in the house. A summary of the concentrations of carbon monoxide, carbon dioxide and oxygen measured is shown in Table 5.

12
19
41
10
11
53
84
37
39
24
17
44
41
59
53
21
15
17
69
72
40
44
± ± ± ± ± ± ± ± ± ± ± ± ± ± ± ± ± ± ± ± ±
Win
d di
rect
ion
(deg
rees
rela
tive
to
mag
netic
Nor
th)
215
265
46
81
267
214
219
213
147
52
212
196
159
94
63
56
72
190
173
231
300
1.6 1 0.9
1.2
1.4
1.1
1.4
1.6
1.5
0.9
1.2
1.2
0.8
0.7
0.9 1 1.6
0.8
0.9
1.7
0.8
± ± ± ± ± ± ± ± ± ± ± ± ± ± ± ± ± ± ± ± ±
Win
d sp
eed
(m/s
)
4.3
2.2
5.2
4.8
2.6
2.1
3.1
3.2
3.5
3.2
2.5
2.4
1.1
1.2
3.4
3.3
6.4
1.3
1.3 3 1.7
Rel
ativ
e hu
mid
ity
(%)
59
76
93
97
50
58
987
982
976
101
64
60
62
52
66
68
70
81
85
63
60
Out
side
te
mpe
rat
ure
(Cel
sius
)
13.3
6.
9 10
.9
14.1
15
.9
19
15.1
13
.9
9
13.2
15.9
17
.7
19.3
20
.7
18.5
17.8
14
.2
15.9
15
.5
15.3
16
.5
Atm
osph
eric
pr
essu
re
(mba
r)
980
979
998
985
1005
98
6 98
7 98
2 97
6
983
987
987
1001
99
9
992
992
997
984
982
982
1007
Extra
ven
tilat
or
area
nee
ded
to g
et
flue
to p
ull (
cm2 )
121
<140
17
0 12
0 10
0 85
64
12
1 >1
20
460
+ 50
m3/
hr
flow
redu
ctio
n 74
33
0 22
5 70
U
nabl
e to
mai
ntai
n re
vers
al
270
80
240
310
310
370
‡ † ‡ ‡ † † † †
Ave
rage
ex
tract
ion
rate
use
d in
te
st (m
3 /hr)
184
190
166
180
159
79
63
180
349
316
118
245
223
237
240
336
170
219
312
267
314
Extra
ctio
n ra
te
requ
ired
to ju
st
reve
rse
flue
(m3 /h
r)
120
110
90
60
100
60
40
120 - 60
85
85
140
170
180
180
95
40
60
70
60
App
lianc
e
Com
bi B
oile
r C
ombi
Boi
ler
Com
bi B
oile
r C
ombi
Boi
ler
Gas
Fire
C
entra
l Hea
ting
Boi
ler
Gas
Fire
C
ombi
Boi
ler
Com
bi B
oile
r
Com
bi B
oile
r
Cen
tral H
eatin
g B
oile
r C
entra
l Hea
ting
Boi
ler
Com
bi B
oile
r C
ombi
Boi
ler
Com
bi B
oile
r
Com
bi B
oile
r C
entra
l Hea
ting
Boi
ler
Cen
tral H
eatin
g B
oile
r C
entra
l Hea
ting
Boi
ler
Cen
tral H
eatin
g B
oile
r G
as F
ire
Tab
le 4
.
Tes
t C
on
dit
ion
s
Tes
t N
umbe
r
1 2 3 4 5 6 7 8 9 10
11
12
13
14
15
16
17
18
19
20
21 N
otes
: ‡
Hig
h ex
trac
tion
rate
†“W
arm
” flu
e
13
Min
imum
O
xyge
n co
ncen
trat
ion
in r
elea
se
room
(% v
/v)
16.8
7 17
.17
16.8
9 16
.86
20.1
1 17
.81
19.3
3 17
.23
18.4
8 18
.3
18.5
9 19
.63
17.0
7 14
.15
17.3
17
.45
18.5
4 19
.33
19.1
8 19
.34
20.4
9
Max
imum
am
ount
of
Car
bon
Dio
xide
pr
oduc
ed
(m3 /h
r)
3.5
3.72
3.
63
3.81
0.
67
1.37
0.
56
3.1
3.98
3.
79
1.58
1.
56
3.57
2.
48
2.94
3.
77
1.51
1.
65
1.44
1.
51
0.73
Max
imum
C
arbo
n D
ioxi
de
conc
entr
atio
n in
rel
ease
roo
m
(%
v/v
)
2.27
2.
26
2.41
2.
38
0.48
1.
79
0.94
2.
12
1.38
1.
49
1.47
0.
83
2.18
3
2.07
1.
9 1.
39
0.94
0.
94
0.93
0.
29
Max
imum
am
ount
of
Car
bon
Mon
oxid
e pr
oduc
ed
(m3 /h
r)
0.20
2 0.
067
0.15
6 0.
178
0.00
1 0.
003
0.00
3 0.
106
0.34
1 0.
288
0.00
2 0.
085
0.16
4 1.
075
0.15
6 0.
21
0.00
3 0.
08
0.23
8 0.
106
0.00
1
Max
imum
C
arbo
n M
onox
ide
conc
entr
atio
n in
ext
ract
(p
pm)
1098
35
5 94
0 99
1 6 37
43
587
979
912
17
349
739
4539
65
0 62
3 19
36
5 76
3 39
7 4
Max
imum
C
arbo
n M
onox
ide
conc
entr
atio
n in
re
leas
e ro
om
(ppm
)
1300
@ 2
7 m
in.
455
@ 6
min
10
20 @
27
min
10
85 @
17
min
-
< 32
-
745
@ 3
2 m
in
1160
@ 2
7 m
in
1110
@ 6
4 m
in
- 35
0 @
6 m
in
1050
@ 1
7 m
in
> 10
500
@ 2
2 m
in
1320
@ 6
min
12
15 @
6 m
in
- 42
5 @
59
min
23
90 @
90
min
59
0 @
74
min
-
Car
bon
Mon
oxid
e co
ncen
trat
ion
in r
elea
se
room
aft
er 1
cy
cle
(ppm
)
660
455
600
1020
<
7 20
<
36
615
785
~110
0 <
22
350
900
2440
13
20
1215
<
30
280
415
305
< 20
Tim
e to
Oxy
gen
conc
entr
atio
n in
fe
ed <
18%
min
val
ue 2
0.0%
m
in v
alue
20.
6%
min
val
ue 2
0.2%
m
in v
alue
20.
5%
min
val
ue 2
0.4%
m
in v
alue
20.
2%
min
val
ue 2
0.0%
m
in v
alue
19.
8%
min
val
ue 2
0.1%
m
in v
alue
20.
4%
min
val
ue 2
0.7%
m
in v
alue
20.
2%
min
val
ue 2
0.3%
m
in v
alue
16.
1%
- m
in v
alue
19.
8%
min
val
ue 2
0.2%
m
in v
alue
20.
3%
min
val
ue 1
8.9%
m
in v
alue
20.
2%
min
val
ue 2
0.7%
Tim
e to
Oxy
gen
conc
entr
atio
n in
re
leas
e ro
om
<18%
<6 m
inut
es
<6 m
inut
es
<6 m
inut
es
<6 m
inut
es
min
val
ue 2
0.2%
27
min
utes
m
in v
alue
19.
3%
<6 m
inut
es
min
val
ue 1
8.5%
m
in v
alue
18.
3%
min
val
ue 1
8.6%
m
in v
alue
19.
6%
<6 m
inut
es
<6 m
inut
es
<6 m
inut
es
<6 m
inut
es
min
val
ue 2
0.2%
m
in v
alue
19.
3%
min
val
ue 1
8.3%
m
in v
alue
19.
3%
min
val
ue 2
0.5%
Tab
le 5
. G
as C
on
cen
trat
ion
s
Tes
t N
umbe
r
1 2 3 4 5 6 7 8 9 10
11
12
13
14
15
16
17
18
19
20
21

14
The spillage of the combustion products also raised the temperature in the room. The rise in temperature measured during each test is shown in Table 6.
It is defined as:-
temperature at end of steady state period - temperature at start of test
Table 6. Temperatures.
Temperature rise during test (Celsius) Room 1 (centre) Room 3 (centre) Test
number top middle bottom top middle bottom
1 21.2 10.3 2.1 0.8 0.3 0.1 2 23.0 6.2 2.0 -0.1 0.2 0.2 3 24.9 10.2 2.0 0.7 0.0 0.6 4 22.3 7.9 1.9 -0.4 0.1 0.1 5 23.4 20.5 10.7 13.3 12.9 8.6 6 15.2 7.0 1.7 0.6 0.5 0.3 7 32.9 30.7 18.0 1.2 2.7 2.2 8 21.0 4.6 2.1 3.9 2.3 0.7 9 17.3 10.2 1.1 0.9 -0.3 -0.3 10 18.3 9.1 2.1 -0.2 0.3 -0.3
11†‡ 20.2† 6.7† 1.9† 18.5‡ 3.5‡ 2.3‡ 12†‡ 11.7† 6.3† 1.1† 9.8‡ 2.0‡ 1.0‡ 13 22.2 10.6 1.9 0.3 0.7 -0.6 14 20.6 12.9 3.4 -0.3 -0.3 0.8 15 14.1 5.0 1.0 2.9 1.4 0.1 16 20.0 10.0 2.2 6.6 4.8 1.5 17 11.1 4.2 2.2 3.7 3.2 1.3 18 11.4 6.3 1.2 0.3 0.1 0.5 19 11.5 8.5 2.9 0.7 0.0 -0.1 20 12.3 7.1 2.9 2.1 1.2 -0.1 21 23.4 20.6 9.1 3.2 3.6 3.0
Notes: † Temperatures measured at Room 3 (centre) ‡ Temperatures measured at Room 3 (side)
In the final part of the test the external ventilator area was increased until the flue started to pull normally. The results obtained are given in Table 4.
5.2 CENTRAL HEATING BOILER
The power rating of the Central Heating boiler was considerably less than the Combi boiler (15.4kW c.f. 35.4kW). Consequently this boiler was used in Room 3 as well as Room 1 to compare the effect of operating the appliance in different room volumes as well as different appliances operating in the same volume. The tests on different ventilator location were not repeated.

15
It proved to be much easier to reverse the flue using this appliance, compared with the Combi boiler, as demonstrated shown by the values of extraction rate shown in Table 4.
Carbon monoxide and carbon dioxide spilled into the room as soon as the flue was reversed. The time to reach steady state concentrations of combustion products was quickest in the smallest room volume when using the highest extract rate. Steady state conditions were normally reached within 30 minutes of starting to reverse the flue. A summary of the concentrations of carbon monoxide, carbon dioxide and oxygen measured during each test is shown in Table 5. The amount of carbon monoxide produced by this boiler was significantly less than that produced by the Combi Boiler. However, higher extraction rates did produce more than tests using low extraction rates.
The spilling of the combustion products also raised the temperature in the room. The rise in temperature measured during each test (see Section 5.1) is given in Table 6.
The Central Heating boiler required less “excess” extraction (see Section 5.1) to maintain a reversed flue than the Combi boiler. Consequently less extra ventilator area was required to cause the flue to revert to normal flow than was found with the Combi boiler. (This result does not apply to tests using extraction rates which were larger than those required to just maintain a reversed flue, such as tests where the boiler was started before the extraction system, or a higher extraction rate was set as part of the experimental conditions.)
5.3 GAS FIRE
In all three tests the Gas Fire was located in Room 1. The extraction rate needed to reverse the flue tended to be similar to that required by the Central Heating boiler, as shown by the values of extraction rate shown in Table 4.
Carbon monoxide and carbon dioxide spilled into the room as soon as the flue was reversed. The low power rating of the appliance (6.45 kW) resulted in a slow build up of combustion products. However, the initial period where the concentrations of carbon monoxide and carbon dioxide altered significantly was less than 1½ hours in all tests. A summary of the concentrations of carbon monoxide, carbon dioxide and oxygen measured is shown in Table 5. The amount of carbon monoxide produced by the Gas Fire was significantly less than produced by the Combi Boiler.
The spilling of the combustion products also raised the temperature in the room. The rise in temperature measured during each test (see Section 5.1) is given in Table 6.
The three tests carried out using the gas fire used very different configurations. Thus no reliable figure for the extra ventilator area required to cause the flue to revert to normal flow could be determined.
16
6 DISCUSSION
6.1 COMBUSTION PRODUCTS
When the flow in the flue was reversed, all the combustion products entered the room containing the appliance. Thus the concentrations of carbon monoxide and carbon dioxide in the volume around the boiler will increase until the rate at which they are being produced is equal to the rate at which they are being removed. This is known as “steady state” conditions. The net effect of convection, ventilation and extraction in the room produces the profile recorded during each test.
Figures 9, 10, and 11 show the maximum concentration of carbon monoxide and carbon dioxide in the release room plotted against extraction rate for the three gas appliances used. The concentration of carbon dioxide generally falls as the extraction rate is increased, while the concentration of carbon monoxide appears to rise at higher flow rates. In most cases the volume containing the appliance and the extraction fan (release room only, or with gas appliance and extract fan in different rooms) does not appear to affect the maximum concentration of carbon dioxide in the release room. (The exceptions are those tests with the gas appliance in Room 1, the extraction fan in Room 2 and the intervening door closed, which will be discussed later.) The effect of extract flow rate on the production of combustion products cannot be seen clearly in these plots. However, by assuming that all the combustion products are taken into the extraction system, a value for the quantities produced by the gas appliance can be calculated by the equation:
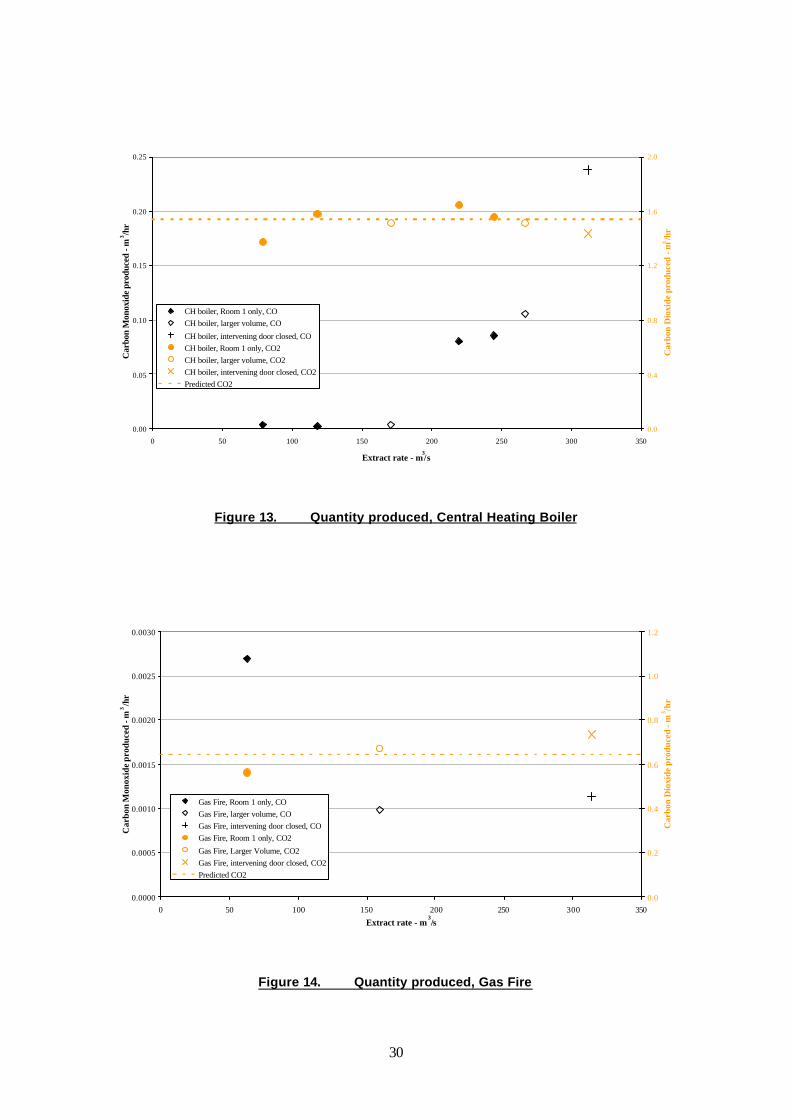
Figures 12, 13, and 14 show the rate of carbon monoxide and carbon dioxide production plotted against extraction rate. The effect of the flow rate can now be seen much more clearly. The rate of carbon dioxide production by the appliance, based on its power rating, is also shown on the graph. The experimental measurements are close to this line. The amount of carbon monoxide produced does appear to increase as the flow rate is increased in both the Combi and Central Heating boilers. The concentration of carbon monoxide produced by the gas fire (<40 ppm) was too low to be accurately resolved by the analyser (range 0 – 10000 ppm).
6.1.1 Low extract rates
A Low Extract Rate is enough to maintain flow reversal in the flue. As shown in Table 4, these were found to be 160 - 190m3/hr for the Combi boiler, 80 - 170m3/hr for the Central Heating boiler, and 60 - 160m3/hr for the Gas Fire.
Previous work#2 showed that the Combi Boiler spilled significant amounts of carbon monoxide when the flue was partially blocked, even if the air supply to the boiler was not vitiated. This was attributed to the design of the draught diverter allowing combustion products to re-circulate within the boiler case when the flue was restricted or blocked. A schematic diagram of this flow is shown in Figure 15. Thus when the flow in the flue is reversed by an extraction fan, the air supplied to the burner is a combination of air from the room and combustion products from the draught diverter.
Rate of combustion product production
Concentration of combustion product in extract system %
Flow rate in extraction system =

17
Hence, a higher concentration of carbon monoxide will be produced than expected from the vitiation of the room air and, because the flow in the flue is reversed, this will enter the room. The Central Heating boiler and the gas fire produced only small quantities of carbon monoxide at the low extract rates. These concentrations were too low to be accurately resolved by the analyser (range 0 – 10000 ppm).
The values measured are presented on Figures 9 – 14 and in Table 5.
6.1.2 High extract rates
A high extract rate was used either to represent extraction equipment operated near to typical domestic extraction maximum rates, or to reverse a warm flue. (A warm flue required a much higher extract rate to cause flow reversal initially than a cold flue.) Again the concentrations of carbon monoxide and carbon dioxide measured are shown on Figures 9 – 14 and in Table 5. The quantity of carbon monoxide produced increased slightly for the Combi boiler, but much more dramatically for the Central Heating boiler. The higher levels measured may have been due to the higher extraction rate causing flame distortion. The difference in response between the two boilers may have been due, for example, to the design of the draught diverters and burners.
6.1.3 Closed door between Gas Appliance and Extract
In three tests the door between the room containing the gas appliance and the room containing the extraction apparatus was kept closed. The carbon monoxide concentrations measured in the release room and the quantities of carbon monoxide produced were very considerably elevated with the Combi boiler, significantly elevated with the Central Heating boiler, and not noticeably changed with the gas fire, compared with similar tests where the door was kept open. The values measured are shown on Figures 9 – 14 and in Table 5.
Figure 16 shows the maximum values of carbon dioxide and minimum values of oxygen concentration measured in the air supply to the burner of the appliance. For most tests the oxygen concentration was greater than 19¾%. The two exceptions are Tests 14 (with the Combi boiler) and Test 19 (with the Central Heating boiler) which both had the door between the gas appliance and extract closed. The concentration of carbon dioxide in the release room was also significantly different in these two tests. Thus the closure of the door appears to have a significant effect. Tests 13 and 18 were similar tests to 14 and 19, but with the intervening door open. Figures 17 and 18 show the distribution of the carbon dioxide as a function of height in the release room, just before the end of the steady state period of the test. In the tests where the door was open, the concentration of carbon dioxide was almost uniform below the height of the boiler, but increased rapidly above. A much more uniform increase was observed between floor level and ceiling when the door was closed. At all positions the concentration of carbon dioxide measured was at least ½% greater in the tests where the door was closed, with the greatest difference being seen at the height of the air inlet to the gas appliance.
The general increase in concentration indicated that less air was being extracted from the release room when the door was closed (and preferentially more from the other room). The difference in profile showed that the flow pattern in the room was different. Consequently the air supply to the burner had less oxygen and more carbon dioxide when the door was closed than when it was open. Thus the boilers produced more carbon monoxide than would be expected with the extraction rates used.
The gas fire had a much lower power rating than either boiler. The position of the gas fire (near the floor) produced a much more uniform profile of gas concentration within the room (as shown on Figure 19), diluting the combustion products in a significantly larger volume. This combination of factors may explain the observation that there was no significant difference between the tests where the door was closed and open.

18
6.2 TEMPERATURES
6.2.1 Temperature Rise
Temperatures were measured at 3 heights on either:-
a) the central stand in Room 1 and the central stand in Room 3, or b) the central stand in Room 3 and the side stand in Room 3,
as described in section 2.5.2. The heat given off by the appliances in normal operation raised the temperature in the room. Values for this rise were obtained during tests utilising a “warm” flue, and are shown in Table 7. The temperature rise recorded during the flue reversal phase of the test in the centre of the release room is shown on Figures 20 - 22. Although significant temperature rises were seen close to the ceiling, a person sitting in the room would only experience changes in temperature at the two lower measurement heights. The rise in temperature at these positions would probably not be enough to cause alarm to an occupant with either boiler. The largest temperature rise was seen with the gas fire. Although the occupant might turn the fire down, they are unlikely to be aware of the flue products entering the room.
Table 7. Temperature rise when appliance operated normally
Temperature rise - Celsius Test Ceiling Mid Floor 10, Combi Boiler 8 3 1
18, Central Heating Boiler 6 2 0
19, Central Heating Boiler 5 2 1
20, Central Heating Boiler 6 2 2
21, Gas Fire § >8 >7 >5
Notes: § Steady state conditions were not reached
6.2.2 Temperatures in the draught diverter and flue
These measurements were used to check for the direction of flow in the flue. During normal flow in the flue, the hot flue gases rapidly heated the flue. Flue reversal produced a rapid drop towards atmospheric ambient temperature. The temperature in the draught diverter was affected by the proximity of the hot gas appliance, and also dilution of the flue gases by fresh air during flue reversal. However an indication of the direction of flow in the flue could be inferred from these two measurements.
The measurements from Test 10 are shown in Figure 23.
6.3 DIFFERENTIAL PRESSURES
Differential pressures were measured as described in Section 2.5.3. and those measured in the extract system were used to determine the flow rates. The differential pressures in the flue were used to measure qualitatively the flow in the flue. The flow measurements were found to be in good agreement with the measurements described in Section 6.2.1, as shown on Figure 23.
The measurements of differential pressure between the room and the flue, and between the room and the outside are also presented in Figure 23.

19
6.4 EXTRA VENTILATOR AREA REQUIRED
The final stage of each test involved increasing the ventilator area into the volume containing the gas appliance and the extract until the flue started to flow normally. As the extract system pulled from the flue, the ventilators, and any other opening, increasing the ventilator area reduced the tendency for the flow in the flue to remain reversed. The reduction of flow down the flue resulted in a lower dilution of the hot combustion products by cool air, and this resulted in an increase in the temperature recorded at the draught diverter. This can be seen in Figure 23, between 74 and 93 minutes. However once the change to the normal direction of flow in the flue occurred, the differential pressure due to flow in the flue indicated that almost normal flow rates were produced almost immediately. Again this can be seen on Figure 23, at 93 minutes. The change was thus observed as a gradual reduction in flow down the flue as the ventilator area was increased, and then a sudden reversal and rapid increase in flow up the flue without any further increase in ventilator area being needed.
The first stage of a test usually involved determining the extract flow to reverse a cold flue. To maintain reversal in the flue during the experiment a higher extraction rate was needed (see Section 4). In some tests the extraction rate was deliberately set to a greater value than needed just to maintain reversal. Finally in some tests a warm flue was reversed, which required a greater extraction rate than reversing a cold flue, and this higher extraction rate was used during the test. Thus a range of extraction flow rates were used in these tests. The extra ventilator area needed depended on such things as the characteristics of the particular gas appliance, the characteristics of the flue in the prevailing weather conditions, the ventilation available (both adventitious and specifically provided) and the suction from the extraction system. The extra ventilator area found necessary to make the flue flow normally is shown in Figure 24.
If, however, the “excess” flow rate in the extraction system is plotted against extra ventilator area, as in Figure 25, the results appear to be much clearer, with the extra ventilator area needed appearing to increase linearly with excess extract rate. If the line for “All appliances” is extended to the axes, it appears that an extra ventilator area of about 40cm2 would be needed for a zero excess flow rate. This extra ventilator area probably represented the effort necessary to overcome an established reversed flue flow. The excess extract rate may be impossible to estimate in most realistic situations. However, in all the tests in this programme the extra ventilator area required was more the 50cm2 quoted in BS5440#1, and, as can be seen in Figure 25, much larger excess ventilator area were needed in some tests.

20
7 CONCLUSIONS
a) Flue reversal can be obtained with Cannon Gas Fire and Central Heating Boiler using low (<90m3/hr) extraction rates. Higher extraction rates were required with the Combi boiler to produce flue reversal.
b) The rate of production of carbon monoxide was dependent on the appliance. c) The Central Heating Boiler at low extraction rates produced very little carbon
monoxide. Larger quantities were produced at higher (>200m3/hr) extraction rates. The Combi Boiler, even at the lowest extraction rates used produced much more carbon monoxide. Increasing the extraction rate resulted in an increased production of carbon monoxide, but the effect was not as pronounced as with the Central Heating boiler. The quantity produced by the gas fire was small during each test.
d) Closure of an intervening door between the appliance and the extract system caused dramatic / significant increases in the quantity of carbon monoxide produced by the Combi and Central Heating Boilers respectively This was probably due to a change in flow patterns and reduction in the rate of extract from the room containing the gas appliance.
e) The temperature rise alone, compared to normal operation of the appliances, would be unlikely to warn an occupant of a developing toxic atmosphere.
f) The flow in the flue exhibited considerable hysteresis between two stable flow regimes. Initially the flue removed products from the appliance. The flow was normal. The extraction rate was increased gradually and the flow up the flue was reduced until it was zero. Suddenly flow in the flue was reversed, and rapidly increased without any further increase in the extract rate. Similarly, at the end of the test when the ventilator area was gradually increased, the reverse flow in the flue was slowly reduced to zero, until the flow reverted to a normal direction and increased rapidly without further increase in the ventilator area.
g) A linear relationship (with some scatter) was seen between the extra ventilator area required to make the flue revert to normal flow and the excess extraction rate.
h) In all the tests the extra ventilator require to make a reversed flue flow normally was greater than 50cm2

21
8 RECOMMENDATIONS
The experimental program in phase 2 will use the new Test House at GRTC. Consequently some tests should repeat the configurations used in Phase 1, but in a different house. The repeatability of the results in different properties can thus be examined.
Additionally, tests should examine:-
• Low level extractors (e.g. tumble driers)
• Different types of appliances (e.g. decorative flame effect gas fires)

22
9 BIBLIOGRAPHY
1. BS5440,Part 2 : 1989 (Specification for the installation of ventilation for gas appliances)
2. R.W. Hill and G. Pool; “Full Scale Experiments to Study the Effect of Oxygen Depletion and Ventilator Location on the Production of Carbon Monoxide from Open Flued and Flueless Gas Appliances Operating under Vitiating Conditions” – GRTC R2532 (1998)
23
Figure 1. Elevation of house
5.9m7.4m
25 o
A
B
C
D
Underfloor void
Elevation A Elevation BSide elevation
PLAN VIEW
Elevations as viewed from outside the house
1
2
3
4
5
67
8
1617
1819
2021
222324
N
270
180
90
o
o
o
Ridge of roof runsbetween B and D
Elevation C
910
1112
13
25262728
Elevation D
1415
2930
5.7m

24
Figure 2. Room configuration in the two-storey, multi-room enclosure showing the approximate location of the room partitions, doors and windows
N
90°
180°
270°
LOWER FLOOR
Doorway A Doorway C
ROOM 1ROOM 4
Doorway D
2.1m
3.51m
3.14m 2.45m
ExternalDoor
ROOM 3
2.92m 2.71m
Doorway B
12
6
10
4
ROOM 2
8 14
UPPER FLOOR
Doorway F
ROOM 6
ROOM 5
1.38m
ROOM 42.5m
Doorway E 0.92m
3.11m
5.66m
2.3m

25
Figure 3. Layout of appliances, ventilators, and extraction units
Figure 4. Schematic diagram of extraction system
Doorway A
Doorway C
ROOM 1ROOM 4
Doorway D
ROOM 3Doorway B
12
6
10
4
Mys
on
ExtractFan
ExtractFan
CookerHood
Combi-Boiler
Gas Fire
Myson
ROOM 2 Ventilator
ExtractFan
Ventilator
ExtractFan
Ventilator
ExtractFan
Ventilator
ExtractFan8 14
Location of sample stand
Cooker Hood
Connection through window
(When using just extract fan, cooker hood is disconnected)
Wall
WindowAir fan
Trox section
Outlet

26
Figure 5. Sequence diagram for conducting a test
Start extract system on a high setting, and light the appliance
Reduce extract until flue pulls (This gives the flowrate required
to just reverse the flue)
Extinguish the appliance and increase extraction rate
Allow flue to cool
Turn off extraction system, but keep appliance running.
Let flue reach a steady state with respect to flow and temperature
Reduce extraction rate to required level. Re- light appliance
Increase extraction rate until flow in flue is reversed
Run the test for the required time
Determine extra ventilator area needed to make flue pull normally
“Cold” flue
“Warm”flue

27
Figure 6. Test 1, Carbon Monoxide concentration in the centre of Room 1
Figure 7. Test 1, Carbon Dioxide concentration in the centre of Room 1
0
0 . 5
1
1 . 5
2
2 . 5
1 6 . 0 1 7 . 0 1 8 . 0 1 9 . 0 2 0 . 0 2 1 . 0
O x y g e n c o n c e n t r a t i o n , %
Hei
ght -
met
res
0 . 4 05 . 6 51 0 . 9 01 6 . 1 52 1 . 4 02 6 . 6 5
t i m e - m i n u t e s
Figure 8. Test 1, Oxygen concentration in the centre of Room 1
0
0.5
1
1.5
2
2.5
0 200 400 6 0 0 8 0 0 1000 1200 1 4 0 0
Carbon Monox ide concentra t ion , ppm
Hei
ght
- m
etre
s
0.405.6510 .9016 .1521 .4026 .65
t ime - minu tes
0
0.5
1
1.5
2
2.5
0 . 0 0.5 1.0 1 . 5 2.0 2.5
Carbon Diox ide concentra t ion , %
Hei
ght
- m
etre
s
0.405.6510 .9016 .1521 .4026 .65
t ime - minutes

28
0
2000
4000
6000
8000
10000
12000
14000
0 50 100 150 200 250 300 350
Extract rate - m3/s
Car
bon
Mon
oxid
e co
ncen
trat
ion
- ppm
0.0
0.5
1.0
1.5
2.0
2.5
3.0
3.5
Car
bon
Dio
xide
con
cent
rati
on -
%
Combi, Room 1 only, COCombi, larger volume, COCombi, intervening door closed, COCombi, Room 1 only, CO2Combi, larger volume, CO2Combi, intervening door closed, CO2
Figure 9. Maximum concentration in release room v. flowrate, Combi Boiler
0
500
1000
1500
2000
2500
3000
3500
0 50 100 150 200 250 300 350Extract rate - m
3/s
Car
bon
Mon
oxid
e co
ncen
trat
ion
- ppm
0.0
0.5
1.0
1.5
2.0
2.5
3.0
3.5
Car
bon
Dio
xide
con
cent
ratio
n - %
C/H boiler, Room 1 only, CO
C/H boiler, larger volume, COC/H boiler, intervening door closed, CO
C/H boiler, Room 1 only, CO2
C/H boiler, larger volume, CO2C/H boiler, intervening door closed, CO2
Figure 10. Maximum concentration in release room v. flowrate, Central Heating Boiler

29
0
5
10
15
20
25
30
35
40
0 50 100 150 200 250 300 350
Extract rate - m3/s
Car
bon
Mon
oxid
e co
ncen
trat
ion
- ppm
0.0
0.5
1.0
1.5
2.0
2.5
3.0
3.5
4.0
Car
bon
Dio
xide
con
cent
rati
on -
%
Gas Fire, Room 1 only, COGas Fire, larger volume, COGas Fire, intervening door closed, CO
Gas Fire, Room 1 only, CO2
Gas Fire, Larger Volume, CO2Gas Fire, intervening door closed, CO2
Figure 11. Maximum concentration in release room v. flowrate, Gas Fire
0.00
0.25
0.50
0.75
1.00
1.25
0 50 100 150 200 250 300 350
Extract rate - m3/s
Car
bon
Mon
oxid
e pr
oduc
ed -
m3 /h
r
0.0
1.0
2.0
3.0
4.0
5.0
Car
bon
Dio
xide
pro
duce
d - m
3 /hr
Combi, Room 1 only, CO
Combi, larger volume, CO
Combi, intervening door closed, CO
Combi, Room 1 only, CO2
Combi, larger volume, CO2
Combi, intervening door closed, CO2
Predicted CO2
Figure 12. Quantity produced, Combi boiler
30
0.00
0.05
0.10
0.15
0.20
0.25
0 50 100 150 200 250 300 350
Extract rate - m3/s
Car
bon
Mon
oxid
e pr
oduc
ed -
m3 /h
r
0.0
0.4
0.8
1.2
1.6
2.0
Car
bon
Dio
xide
pro
duce
d - m
3/h
r
CH boiler, Room 1 only, COCH boiler, larger volume, CO
CH boiler, intervening door closed, COCH boiler, Room 1 only, CO2CH boiler, larger volume, CO2CH boiler, intervening door closed, CO2Predicted CO2
Figure 13. Quantity produced, Central Heating Boiler
0.0000
0.0005
0.0010
0.0015
0.0020
0.0025
0.0030
0 50 100 150 200 250 300 350
Extract rate - m3/s
Car
bon
Mon
oxid
e pr
oduc
ed -
m3/h
r
0.0
0.2
0.4
0.6
0.8
1.0
1.2
Car
bon
Dio
xide
pro
duce
d - m
3 /hr
Gas Fire, Room 1 only, COGas Fire, larger volume, COGas Fire, intervening door closed, COGas Fire, Room 1 only, CO2
Gas Fire, Larger Volume, CO2Gas Fire, intervening door closed, CO2Predicted CO2
Figure 14. Quantity produced, Gas Fire

31
Figure 15. Possible flow in and around Combi boiler
Key:
Natural Gas In
Air into Feed
Combustion Products
Diverter Combustion Products
Feed Sample Line
Injector
Burner Assembly
Large aperture in plate

32
Fig
ure
16.
C
on
cen
trat
ion
s o
f O
xyg
en a
nd
Car
bo
n D
ioxi
de
in A
ir s
up
ply
to
Bu
rner
Test 1, Combi Boiler in Room 1
Test 2, Combi Boiler in Room 1, Low Level Vent
Test 3, Combi Boiler in Room 1, Vent adjacent to Extract
Test 4, Combi Boiler in Room 1, Low Level Vent in Adjacent Wall
Test 8, Combi Boiler in Room 1, Effect of open door to Rooms 2 and 3
Test 9, Combi Boiler in Room 1, Maximum Flow Rate
Test 10, Combi Boiler in Room 1, Boiler Started Before Fan
Test 13, Combi Boiler in Room 1, Extract in Room 2
Test 15, Combi Boiler in Room 1, Extract in Room 3
Test 16, Combi Boiler in Room 1, Extract in Room 3, Maximum Rate
Test 14, Combi Boiler in Room 1, Extract in Room 2, Intervening Door
Closed
Test 11, Myson Boiler in Room 3
Test 6, Myson Boiler in Room 1
Test 12, Myson Boiler in Room 3, High Extract Rate
Test 18, Myson Boiler in Room 1, Boiler started before fan
Test 20, Myson Boiler in Room 1, Extract in Room 2, Boiler started
before fan
Test 17, Myson Boiler in Room 1, Extract in Room 3
Test 19, Myson Boiler in Room 1, Extract in Room 2, Intervening Door
Closed, Boiler started before fan
Test 7, Gas Fire in Room 1
Test 21, Gas Fire in Room 1, Extract in Room 2, Fire started before fan
Test 5, Gas Fire in Room 1, Cooker extract in Room 3
Oxygen concentration - %
161718192021
0.0
0.5
1.0
1.5
2.0
2.5
Carbon dioxide concentration - %
Min
imum
co
ncen
tratio
n of
O2
in fe
ed
Max
imum
co
ncen
tratio
n of
CO
2 in
feed

33
Figure 17. Concentration of carbon dioxide in release room in Tests 13 and 14
0.0
0.5
1.0
1.5
2.0
2.5
0.0 0.5 1.0 1.5 2.0 2.5CO2 Concentration - %
Hei
ght -
met
res
Test 18, Myson Boilerin Room 1, Boilerstarted before fan
Test 19, Myson Boilerin Room 1, Extract inRoom 2, InterveningDoor Closed
Figure 18. Concentration of carbon dioxide in release room in Tests 18 and 19
0.0
0.5
1.0
1.5
2.0
2.5
0.0 0.5 1.0 1.5 2.0 2.5 3.0 3.5CO2 Concentration - %
Hei
ght
- m
etre
s
Test 13, Combi Boilerin Room 1, Extract inRoom 2
Test 14, Combi Boilerin Room 1, Extract inRoom 2, InterveningDoor Closed

34
0.5
1.0
1.5
2.0
2.5
0.0 0.5 1.0 1.5 2.0 2.5CO2 Concentration - %
Hei
ght -
met
res
Test 7, Gas Firein Room 1
Test 21, Gas Firein Room 1,Extract in Room2, Fire startedbefore fan
Figure 19. Concentration of carbon dioxide in release room in Tests 7 and 21
0
5
10
15
20
25
30
35
0 50 100 150 200 250 300 350
Extract rate - m3/s
Tem
pera
ture
ris
e - C
elsi
us
Combi
Myson
Gas Fire
Gas fire
Combi
Myson
Figure 20. Temperature rise measured in release room close to the ceiling

35
0
5
10
15
20
25
30
35
0 50 100 150 200 250 300 350
Extract rate - m3/s
Tem
pera
ture
ris
e - C
elsi
us
Combi
Myson
Gas Fire
Gas fire
Combi
Myson
Figure 21. Temperature rise measured in release room at mid height
0
2
4
6
8
10
12
14
16
18
20
0 50 100 150 200 250 300 350
Extract rate - m3/s
Tem
pera
ture
ris
e - C
elsi
us
Combi
Myson
Gas FireGas fire
Combi
Myson
Figure 22. Temperature rise measured in release room close to the floor

36
-15
-10-50510152025
020
4060
8010
0
Tim
e - m
inut
es
Pascals
-160
-120
-80
-40
04080120
160
Celsius
dP ro
om /
outs
ide
dP ro
om /
flue
dP f
lue
flow
Tem
pera
ture
in d
raug
ht d
iver
ter
Tem
pera
ture
in fl
ue
T
ime
Act
ion
1 m
inut
e
Ext
ract
sys
tem
sta
rted
Ext
ract
flow
redu
ced
until
7 m
inut
es
Flu
e pu
lling
31 m
inut
es
Ext
ract
sys
tem
re-s
tart
ed
E
xtra
ct fl
ow in
crea
sed
until
38 m
inut
es
Flue
reve
rsed
74 m
inut
es
Ven
tilat
ors
area
incr
ease
d
u
ntil
93 m
inut
es
Flue
pul
ling
101
min
utes
Boi
ler t
urne
d of
f
Fig
ure
23.
D
iffe
ren
tial
Pre
ssu
res
and
Flu
e T
emp
erat
ure
s fo
r T
est
10

37
0
50
100
150
200
250
300
350
400
0 50 100 150 200 250 300 350 400
Extract rate - m3/hr
Ext
ra V
enti
lato
r A
rea
- cm
2
Combiboiler
CentralheatingboilerGas Fire
Gas fire
Combi boiler
Central heating boiler
Figure 24. Extra ventilator area required to cause normal flow in the flue v. flow rate in extraction system
0
50
100
150
200
250
300
350
400
450
0 50 100 150 200 250 300
Excess Extract rate - m3/hr
Ext
ra V
enti
lato
r A
rea
- cm
2
Combiboiler
Centralheatingboiler
Gas Fire
Gas fire
Combi bolier
Central heating boiler
All appliances
Figure 25. Extra ventilator area required to cause normal flow in the flue v. excess flow rate in extraction system

38

39
APPENDIX A COLLECTED FIGURES FOR TESTS 1 TO 21
Similar figures are presented for each test, with the following nomenclature for the figures
Note: (# is the test number)
• Triplet (CO, CO2 and O2) of Room 1 concentration profile time series, captioned as:
Figure A#(a) Test #, Concentration profiles in Room 1
• Triplet (CO, CO2 and O2) of extract concentration plots vs. time, captioned as:
Figure A#(b) Test #, Concentration in the extract system
• Triplet (CO, CO2 and O2) of flue and air supply concentrations vs. time, captioned as:
Figure A#(c) Test #, Concentration in the flue, and in the combustion air supply
• Wind speed vs. time and polar plot of speed and direction, captioned as:
Figure A#(d) Test #, Wind speed and direction

40
0
0.5
1
1.5
2
2.5
0 200 400 600 800 1000 1200 1400
Concentration - ppm CO
Hei
ght -
met
res
0.40
5.65
10.90
16.15
21.40
26.65
time - minutes
0
0.5
1
1.5
2
2.5
0.0 0.5 1.0 1.5 2.0 2.5 3.0
Concentration - % CO2
Hei
ght -
met
res
0.40
5.65
10.90
16.15
21.40
26.65
time - minutes
0
0.5
1
1.5
2
2.5
16.0 17.0 18.0 19.0 20.0 21.0
Concentration - % O2
Hei
ght -
met
res
0.40
5.65
10.90
16.15
21.40
26.65
time - minutes
Figure A1(a) Test 1, Concentration profiles in Room 1
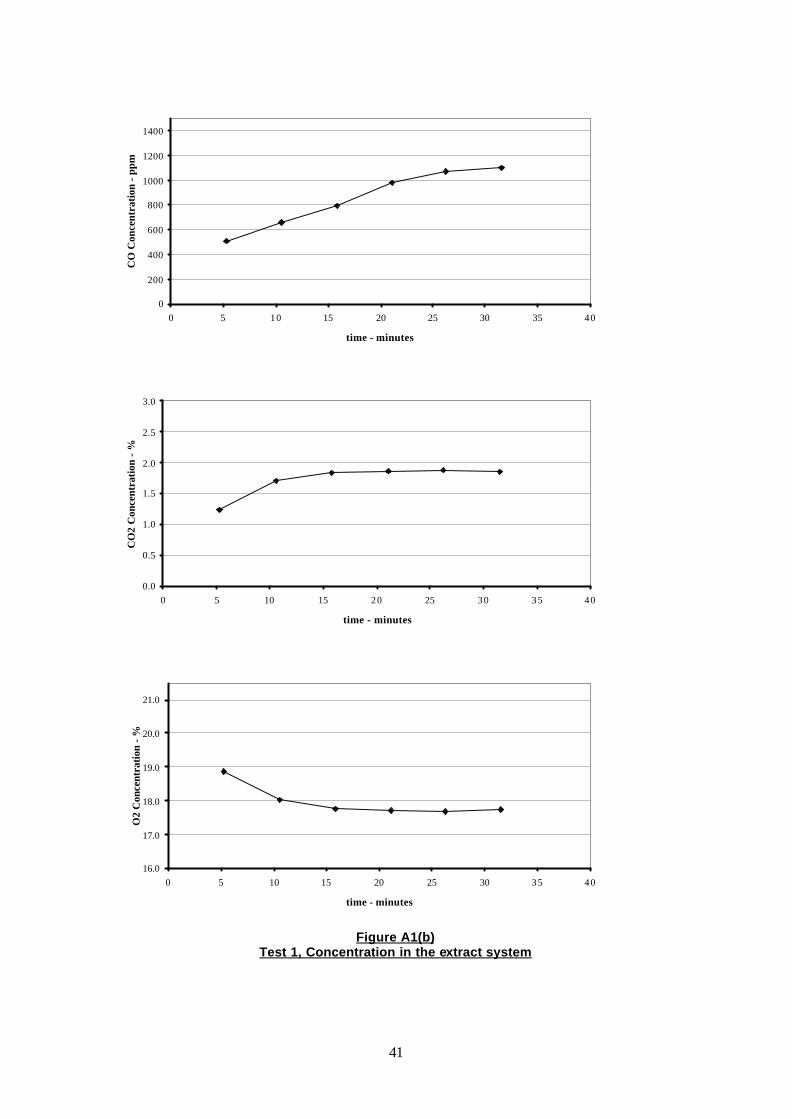
41
0
200
400
600
800
1000
1200
1400
0 5 10 15 20 25 30 35 40
time - minutes
CO
Con
cent
rati
on -
ppm
0.0
0.5
1.0
1.5
2.0
2.5
3.0
0 5 10 15 20 25 30 35 40
time - minutes
CO
2 C
once
ntra
tion
- %
16.0
17.0
18.0
19.0
20.0
21.0
0 5 10 15 20 25 30 35 40
time - minutes
O2
Con
cent
ratio
n - %
Figure A1(b) Test 1, Concentration in the extract system

42
0.0
0.5
1.0
1.5
2.0
2.5
0 5 10 15 20 25 30 35 40
Time - minutes
CO
2 co
ncen
trat
ion
- % Flue
Feed
0
100
200
300
400
500
600
0 5 10 15 20 25 30 35 40
Time - minutes
CO
con
cent
ratio
n - p
pm Flue
Feed
16
17
18
19
20
21
0 5 10 15 20 25 30 35 40
Time - minutes
O2
conc
entr
atio
n - %
Flue
Feed
Figure A1(c) Test 1, Concentration in the flue, and in the combustion air supply

43
0
1
2
3
4
5
6
7
8
9
10
0 5 10 15 20 25 30 35 40
time - minutes
met
res
/ sec
ond
0
2
4
6
8
10
12
14
160
15
30
45
60
75
90
105
120
135
150
165180
195
210
225
240
255
270
285
300
315
330
345
degrees relative to North
number of times
Figure A1(d) Test 1, Wind speed and direction
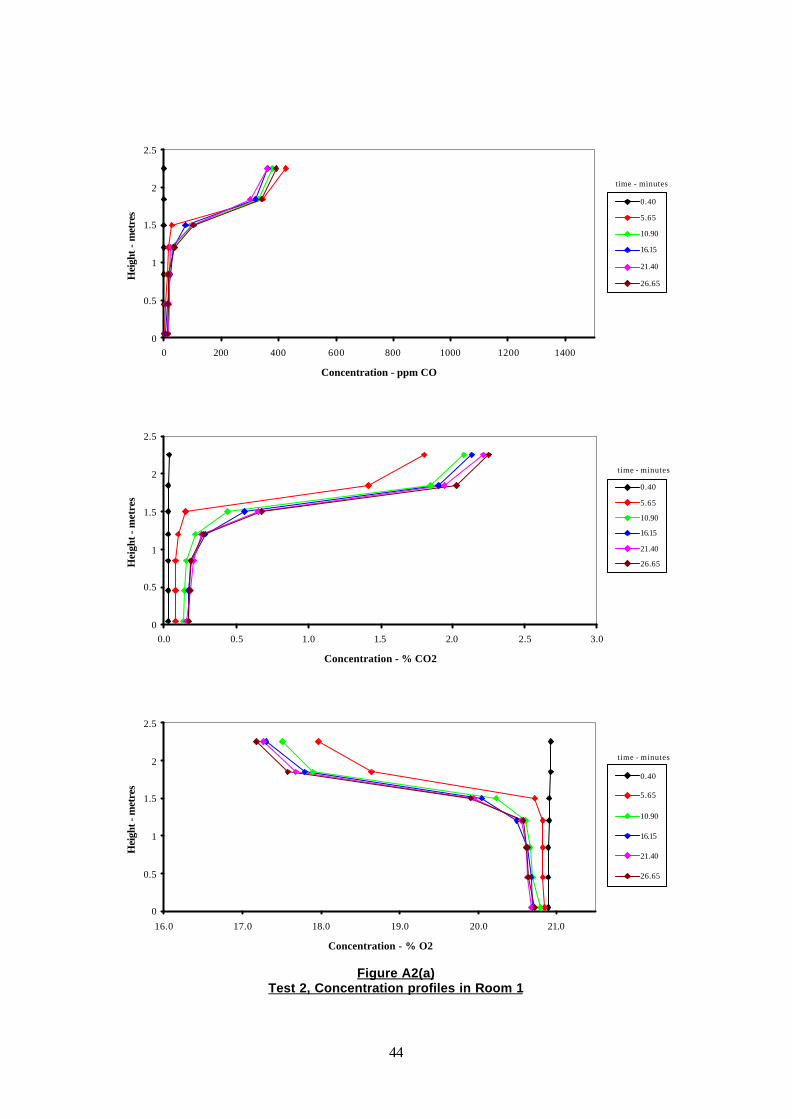
44
Figure A2(a) Test 2, Concentration profiles in Room 1
0
0.5
1
1.5
2
2.5
0 200 400 600 800 1000 1200 1400
Concentration - ppm CO
Hei
ght -
met
res
0.40
5.65
10.90
16.15
21.40
26.65
time - minutes
0
0.5
1
1.5
2
2.5
0.0 0.5 1.0 1.5 2.0 2.5 3.0
Concentration - % CO2
Hei
ght -
met
res
0.40
5.65
10.90
16.15
21.40
26.65
time - minutes
0
0.5
1
1.5
2
2.5
16.0 17.0 18.0 19.0 20.0 21.0
Concentration - % O2
Hei
ght -
met
res
0.40
5.65
10.90
16.15
21.40
26.65
time - minutes

45
Figure A2(b) Test 2, Concentration in the extract system
0
200
400
600
800
1000
1200
1400
0 5 10 15 20 25 30 35 40
time - minutes
CO
Con
cent
rati
on -
ppm
0.0
0.5
1.0
1.5
2.0
2.5
3.0
0 5 10 15 20 25 30 35 40
time - minutes
CO
2 C
once
ntra
tion
- %
16.0
17.0
18.0
19.0
20.0
21.0
0 5 10 15 20 25 30 35 40
time - minutes
O2
Con
cent
rati
on -
%

46
Figure A2(c) Test 2, Concentration in the flue, and in the combustion air supply
0.0
0.5
1.0
1.5
2.0
2.5
0 5 10 15 20 25 30 35 40
Time - minutes
CO
2 co
ncen
trat
ion
- % Flue
F e e d
0
100
200
300
400
500
600
0 5 10 15 20 25 30 35 40
Time - minutes
CO
con
cent
rati
on -
ppm
Flue
F e e d
16
17
18
19
20
21
0 5 10 15 20 25 30 35 40
Time - minutes
O2
conc
entr
atio
n - %
Flue
F e e d

47
Figure A2(d) Test 2, Wind speed and direction
0
1
2
3
4
5
6
7
8
9
10
0 5 10 15 20 25 30 35 40
time - minutes
met
res
/ sec
ond
0
1
2
3
4
5
6
0
15
30
45
60
75
90
105
120
135
150
165180
195
210
225
240
255
270
285
300
315
330
345
degrees relative to North
number of times

48
Figure A3(a) Test 3, Concentration profiles in Room 1
0
0.5
1
1.5
2
2.5
0 200 400 600 800 1000 1200 1400
Concentration - ppm CO
Hei
ght -
met
res
0.40
5.65
10.90
16.15
21.40
26.65
time - minutes
0
0.5
1
1.5
2
2.5
0.0 0.5 1.0 1.5 2.0 2.5 3.0
Concentration - % CO2
Hei
ght -
met
res
0.40
5.65
10.90
16.15
21.40
26.65
time - minutes
0
0.5
1
1.5
2
2.5
16.0 17.0 18.0 19.0 20.0 21.0
Concentration - % O2
Hei
ght -
met
res
0.40
5.65
10.90
16.15
21.40
26.65
time - minutes

49
Figure A3(b) Test 3, Concentration in the extract system
0
200
400
600
800
1000
1200
1400
0 5 10 15 20 25 30 35 40
time - minutes
CO
Con
cent
rati
on -
ppm
0.0
0.5
1.0
1.5
2.0
2.5
3.0
0 5 10 15 20 25 30 35 40
time - minutes
CO
2 C
once
ntra
tion
- %
16.0
17.0
18.0
19.0
20.0
21.0
0 5 10 15 20 25 30 35 40
time - minutes
O2
Con
cent
rati
on -
%

50
Figure A3(c) Test 3, Concentration in the flue, and in the combustion air supply
0.0
0.5
1.0
1.5
2.0
2.5
0 5 10 15 20 25 30 35 40
Time - minutes
CO
2 co
ncen
trat
ion
- % Flue
F e e d
0
100
200
300
400
500
600
0 5 10 15 20 25 30 35 40
Time - minutes
CO
con
cent
rati
on -
ppm
Flue
F e e d
16
17
18
19
20
21
0 5 10 15 20 25 30 35 40
Time - minutes
O2
conc
entr
atio
n - %
Flue
F e e d
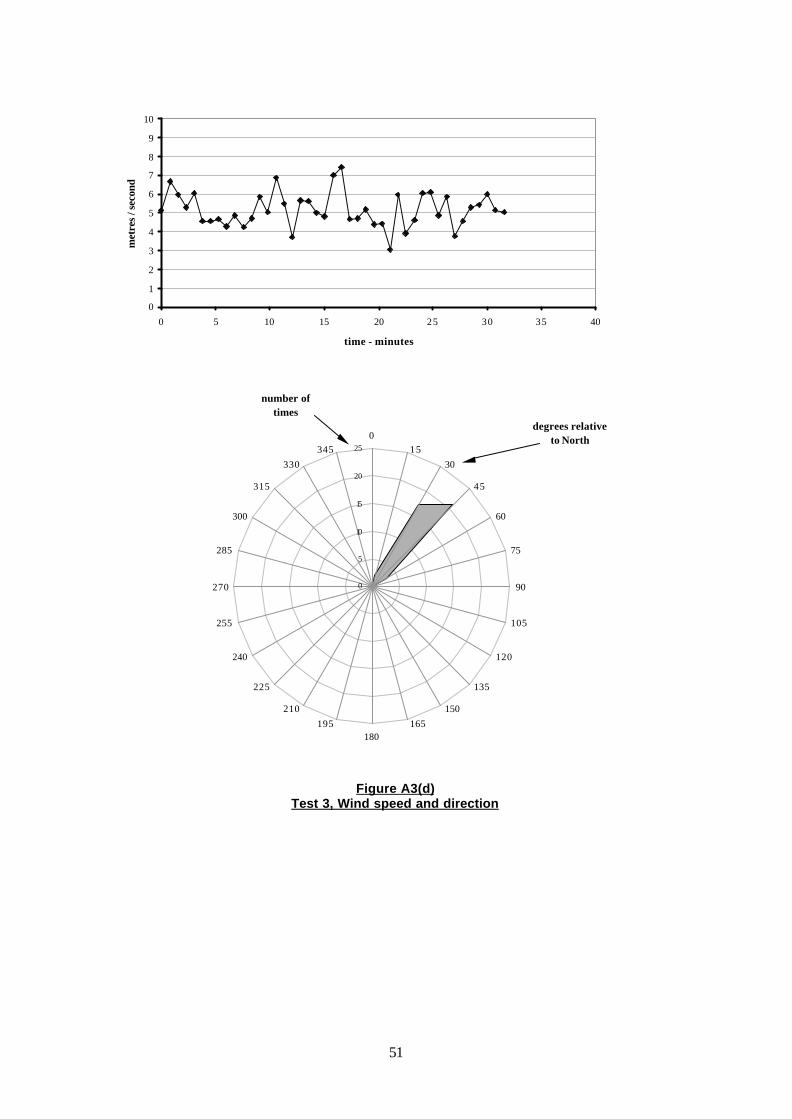
51
Figure A3(d) Test 3, Wind speed and direction
0
1
2
3
4
5
6
7
8
9
10
0 5 10 15 20 25 30 35 40
time - minutes
met
res
/ sec
ond
0
5
10
15
20
250
1530
45
60
75
90
105
120
135
150165
180195
210
225
240
255
270
285
300
315
330345
degrees relative to North
number of times

52
Figure A4(a) Test 4, Concentration profiles in Room 1
0
0.5
1
1.5
2
2.5
0 200 400 600 800 1000 1200 1400
Concentration - ppm CO
Hei
ght -
met
res
0.42
5.67
10.92
16.17
21.42
26.67
31.92
37.17
time - minutes
0
0.5
1
1.5
2
2.5
0.0 0.5 1.0 1.5 2.0 2.5 3.0
Concentration - % CO2
Hei
ght -
met
res
0.42
5.67
10.92
16.17
21.42
26.67
31.92
37.17
time - minutes
0
0.5
1
1.5
2
2.5
16.0 17.0 18.0 19.0 20.0 21.0
Concentration - % O2
Hei
ght -
met
res
0.42
5.67
10.92
16.17
21.42
26.67
31.92
37.17
time - minutes

53
Figure A4(b) Test 4, Concentration in the extract system
0
200
400
600
800
1000
1200
1400
0 5 10 15 20 25 30 35 40 45 50
time - minutes
CO
Con
cent
rati
on -
ppm
0.0
0.5
1.0
1.5
2.0
2.5
3.0
0 5 10 15 20 25 30 35 40 45 50
time - minutes
CO
2 C
once
ntra
tion
- %
16.0
17.0
18.0
19.0
20.0
21.0
0 5 10 15 20 25 30 35 40 45 50
time - minutes
O2
Con
cent
ratio
n -
%
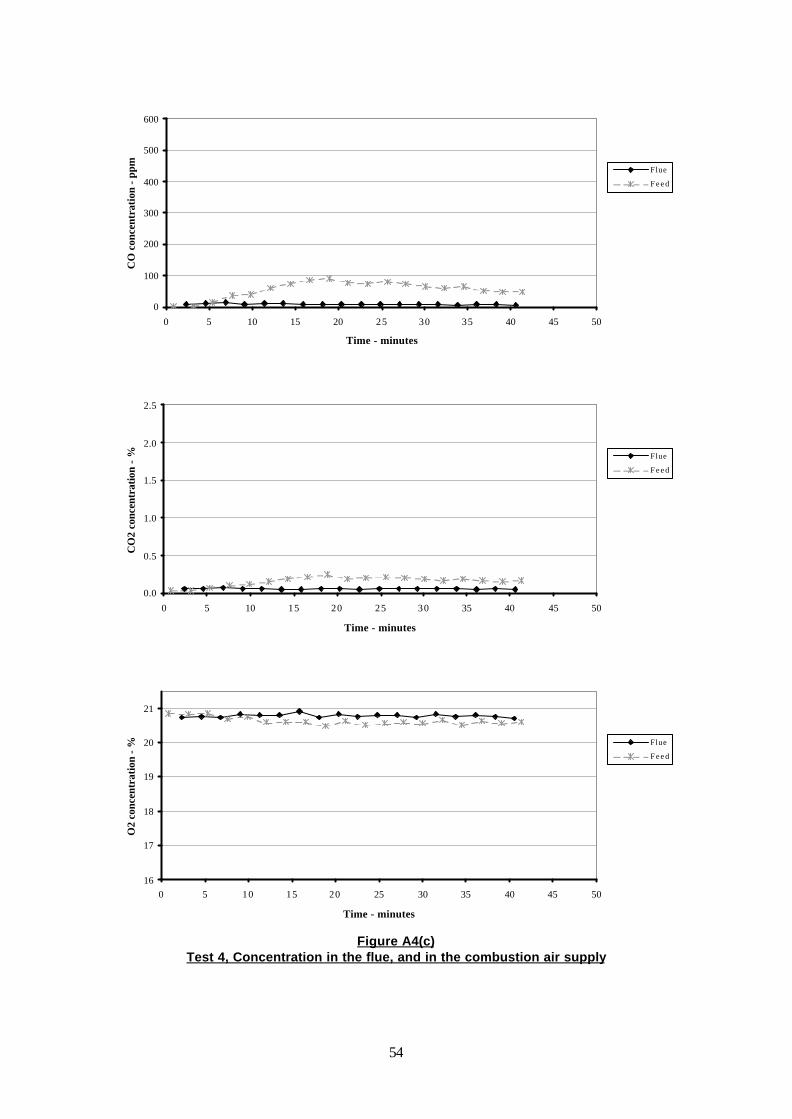
54
Figure A4(c) Test 4, Concentration in the flue, and in the combustion air supply
0.0
0.5
1.0
1.5
2.0
2.5
0 5 10 15 20 25 30 35 40 45 50
Time - minutes
CO
2 co
ncen
trat
ion
- % Flue
F e e d
0
100
200
300
400
500
600
0 5 10 15 20 25 30 35 40 45 50
Time - minutes
CO
con
cent
rati
on -
ppm
Flue
F e e d
16
17
18
19
20
21
0 5 10 15 20 25 30 35 40 45 50
Time - minutes
O2
conc
entr
atio
n - %
Flue
F e e d

55
Figure A4(d) Test 4, Wind speed and direction
0
1
2
3
4
5
6
7
8
9
10
0 5 10 15 20 25 30 35 40 45 50
time - minutes
met
res
/ sec
ond
0
5
10
15
20
250
15
30
45
60
75
90
105
120
135
150
165180
195
210
225
240
255
270
285
300
315
330
345
degrees relative to North
number of times
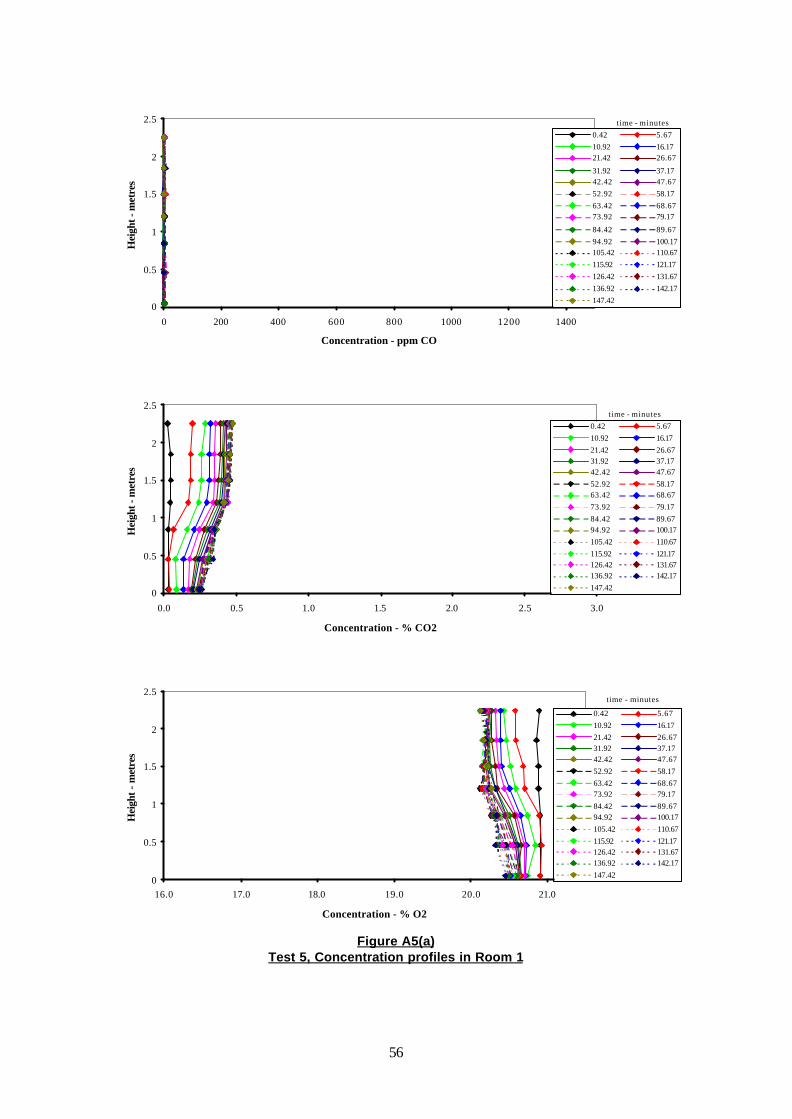
56
Figure A5(a) Test 5, Concentration profiles in Room 1
0
0.5
1
1.5
2
2.5
0 200 400 600 800 1000 1200 1400
Concentration - ppm CO
Hei
ght -
met
res
0.42 5.67 10.92 16.17 21.42 26.67
31.92 37.17 42.42 47.67 52.92 58.17 63.42 68.67 73.92 79.17
84.42 89.67 94.92 100.17 105.42 110.67 115.92 121.17 126.42 131.67 136.92 142.17 147.42
time - minutes
0
0.5
1
1.5
2
2.5
0.0 0.5 1.0 1.5 2.0 2.5 3.0
Concentration - % CO2
Hei
ght -
met
res
0.42 5.67 10.92 16.17 21.42 26.67 31.92 37.17 42.42 47.67 52.92 58.17 63.42 68.67 73.92 79.17 84.42 89.67 94.92 100.17 105.42 110.67 115.92 121.17 126.42 131.67 136.92 142.17 147.42
time - minutes
0
0.5
1
1.5
2
2.5
16.0 17.0 18.0 19.0 20.0 21.0
Concentration - % O2
Hei
ght -
met
res
0.42 5.67 10.92 16.17 21.42 26.67 31.92 37.17 42.42 47.67 52.92 58.17 63.42 68.67 73.92 79.17 84.42 89.67 94.92 100.17 105.42 110.67 115.92 121.17 126.42 131.67 136.92 142.17 147.42
time - minutes

57
Figure A5(b) Test 5, Concentration in the extract system
0
5
10
15
20
25
30
35
40
45
50
0 20 40 60 80 100 120 140 160
time - minutes
CO
Con
cent
rati
on -
ppm
0.0
0.1
0.1
0.2
0.2
0.3
0.3
0.4
0.4
0.5
0.5
0 20 40 60 80 100 120 140 160
time - minutes
CO
2 C
once
ntra
tion
- %
16.0
17.0
18.0
19.0
20.0
21.0
0 20 40 60 80 100 120 140 160
time - minutes
O2
Con
cent
ratio
n -
%

58
Figure A5(c) Test 5, Concentration in the flue, and in the combustion air supply
0.0
0.5
1.0
1.5
2.0
2.5
0 20 40 60 80 100 120 140 160
Time - minutes
CO
2 co
ncen
trat
ion
- % Flue
Feed
0
5
10
15
20
25
30
35
40
45
50
0 20 40 60 80 100 120 140 160
Time - minutes
CO
con
cent
rati
on -
ppm
Flue
Feed
16
17
18
19
20
21
0 20 40 60 80 100 120 140 160
Time - minutes
O2
conc
entr
atio
n - %
Flue
Feed

59
Figure A5(d) Test 5, Wind speed and direction
0
1
2
3
4
5
6
7
8
9
10
0 20 40 60 80 100 120 140 160
time - minutes
met
res
/ sec
ond
0
5
10
15
20
25
30
350
15
30
45
60
75
90
105
120
135
150165
180195
210
225
240
255
270
285
300
315
330
345
degrees relative to North
number of times
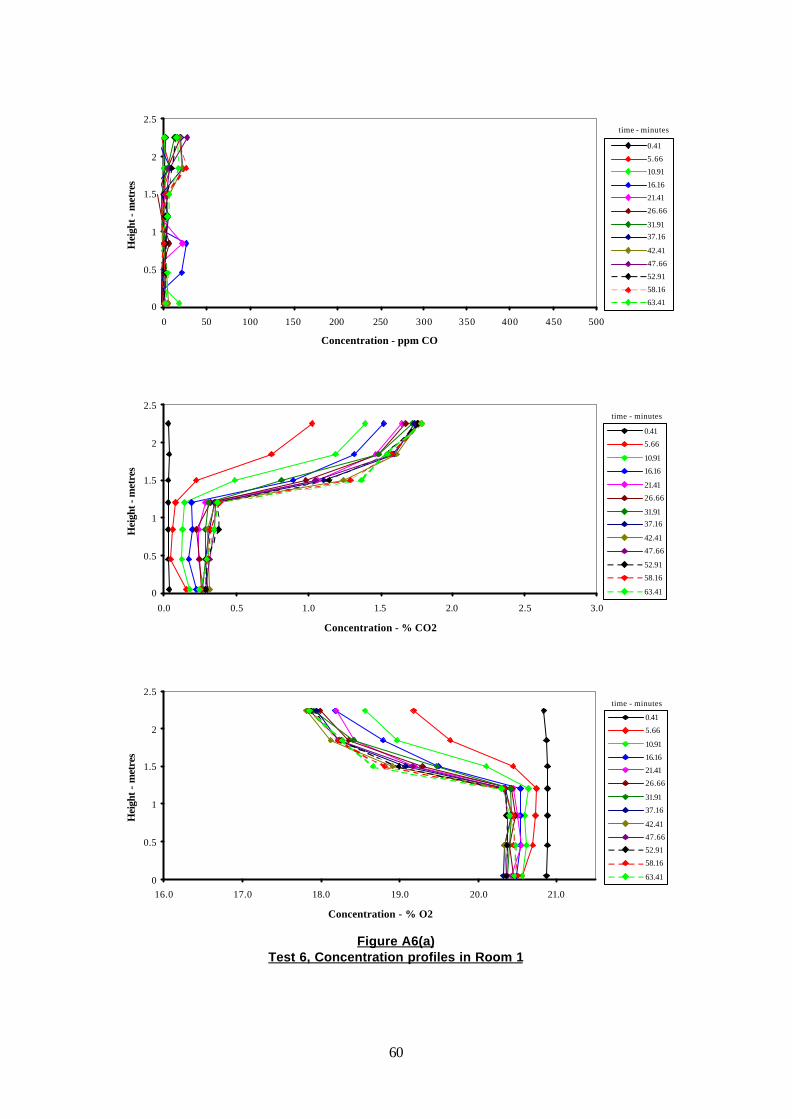
60
Figure A6(a) Test 6, Concentration profiles in Room 1
0
0.5
1
1.5
2
2.5
0 50 100 150 200 250 300 350 400 450 500
Concentration - ppm CO
Hei
ght -
met
res
0.41
5.66
10.91
16.16
21.41
26.66
31.91 37.16
42.41
47.66
52.91
58.16
63.41
time - minutes
0
0.5
1
1.5
2
2.5
0.0 0.5 1.0 1.5 2.0 2.5 3.0
Concentration - % CO2
Hei
ght -
met
res
0.41
5.66
10.91
16.16
21.41
26.66
31.91 37.16
42.41
47.66
52.91
58.16
63.41
time - minutes
0
0.5
1
1.5
2
2.5
16.0 17.0 18.0 19.0 20.0 21.0
Concentration - % O2
Hei
ght -
met
res
0.41
5.66
10.91
16.16
21.41
26.66
31.91
37.16
42.41
47.66
52.91
58.16
63.41
time - minutes

61
Figure A6(b) Test 6, Concentration in the extract system
0
50
100
150
200
250
300
350
400
450
500
0 10 20 30 40 50 60 70 80
time - minutes
CO
Con
cent
rati
on -
ppm
0.0
0.5
1.0
1.5
2.0
2.5
3.0
0 10 20 30 40 50 60 70 80
time - minutes
CO
2 C
once
ntra
tion
- %
16.0
17.0
18.0
19.0
20.0
21.0
0 10 20 30 40 50 60 70 80
time - minutes
O2
Con
cent
ratio
n -
%

62
Figure A6(c) Test 6, Concentration in the flue, and in the combustion air supply
0.0
0.5
1.0
1.5
2.0
2.5
0 10 20 30 40 50 60 70 80
Time - minutes
CO
2 co
ncen
trat
ion
- % F e e d
0
100
200
300
400
500
600
0 10 20 30 40 50 60 70 80
Time - minutes
CO
con
cent
rati
on -
ppm
F e e d
16
17
18
19
20
21
0 10 20 30 40 50 60 70 80
Time - minutes
O2
conc
entr
atio
n - % F e e d
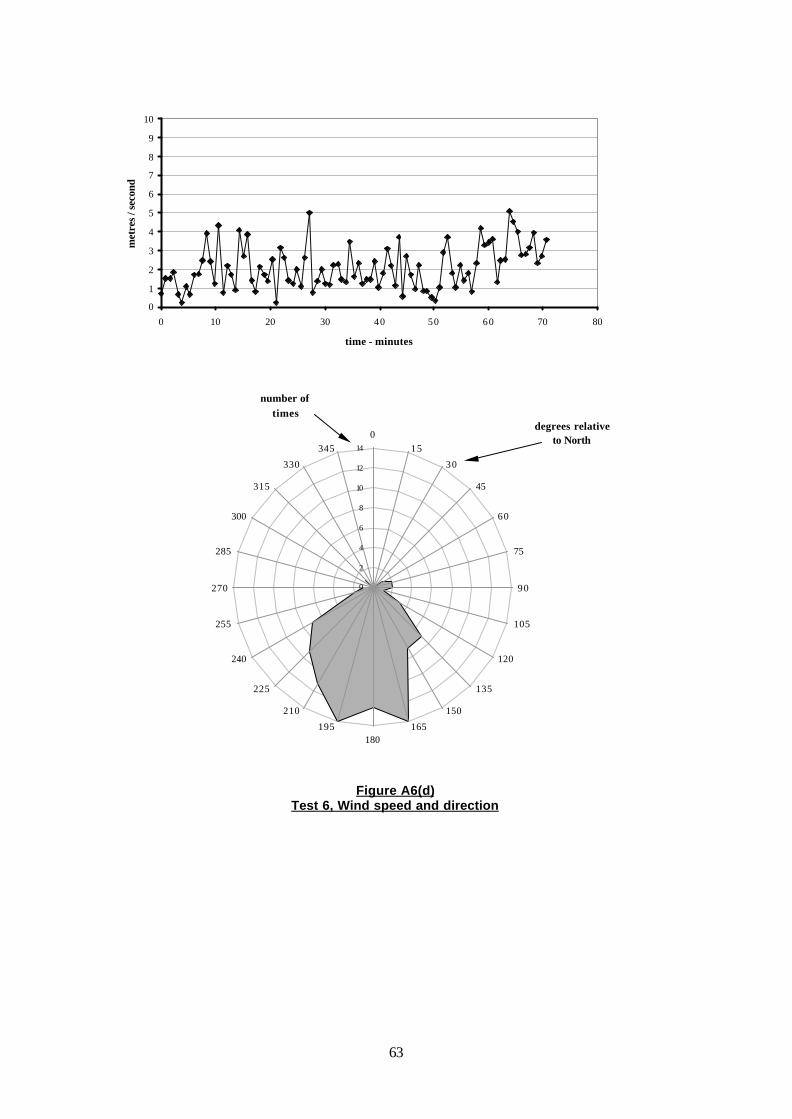
63
Figure A6(d) Test 6, Wind speed and direction
0
1
2
3
4
5
6
7
8
9
10
0 10 20 30 40 50 60 70 80
time - minutes
met
res
/ sec
ond
0
2
4
6
8
10
12
14
015
30
45
60
75
90
105
120
135
150
165180
195
210
225
240
255
270
285
300
315
330
345
degrees relative to North
number of times
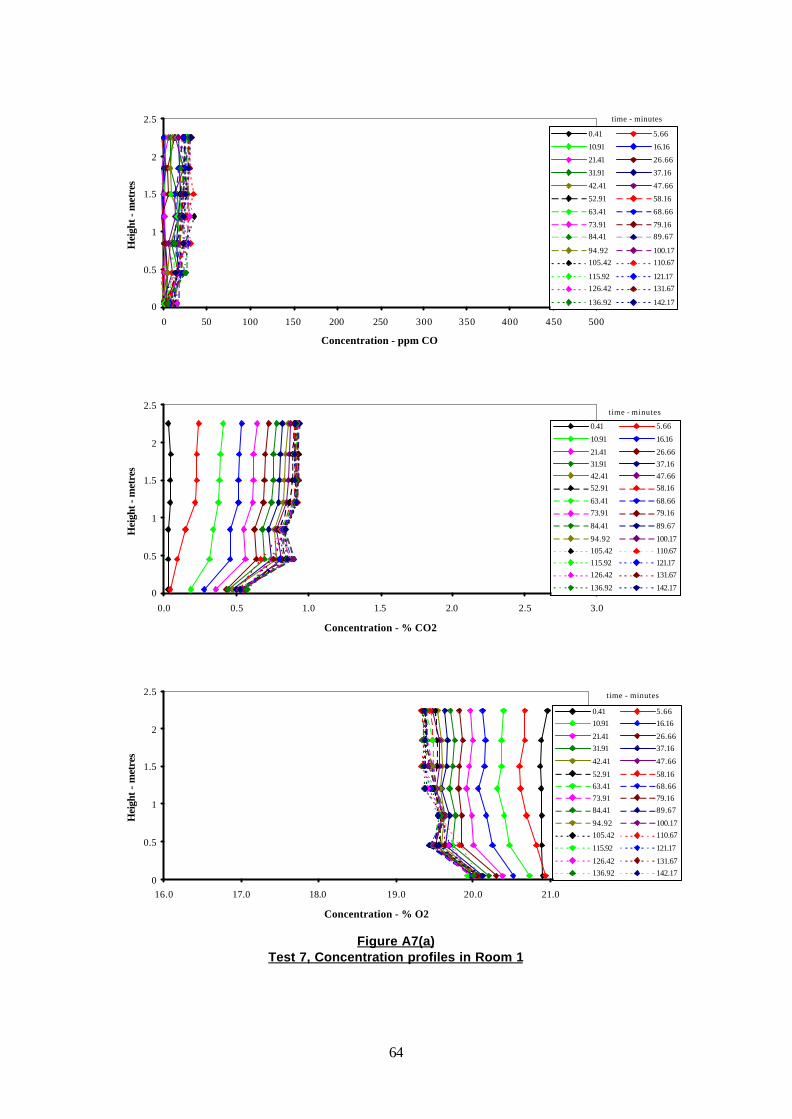
64
Figure A7(a) Test 7, Concentration profiles in Room 1
0
0.5
1
1.5
2
2.5
0 50 100 150 200 250 300 350 400 450 500
Concentration - ppm CO
Hei
ght -
met
res
0.41 5.66
10.91 16.16
21.41 26.66
31.91 37.16
42.41 47.66
52.91 58.16
63.41 68.66
73.91 79.16 84.41 89.67
94.92 100.17 105.42 110.67
115.92 121.17 126.42 131.67
136.92 142.17
time - minutes
0
0.5
1
1.5
2
2.5
0.0 0.5 1.0 1.5 2.0 2.5 3.0
Concentration - % CO2
Hei
ght -
met
res
0.41 5.66
10.91 16.16
21.41 26.66 31.91 37.16 42.41 47.66 52.91 58.16
63.41 68.66 73.91 79.16
84.41 89.67
94.92 100.17 105.42 110.67 115.92 121.17 126.42 131.67
136.92 142.17
time - minutes
0
0.5
1
1.5
2
2.5
16.0 17.0 18.0 19.0 20.0 21.0
Concentration - % O2
Hei
ght -
met
res
0.41 5.66 10.91 16.16
21.41 26.66 31.91 37.16
42.41 47.66
52.91 58.16 63.41 68.66 73.91 79.16 84.41 89.67
94.92 100.17 105.42 110.67
115.92 121.17
126.42 131.67 136.92 142.17
time - minutes
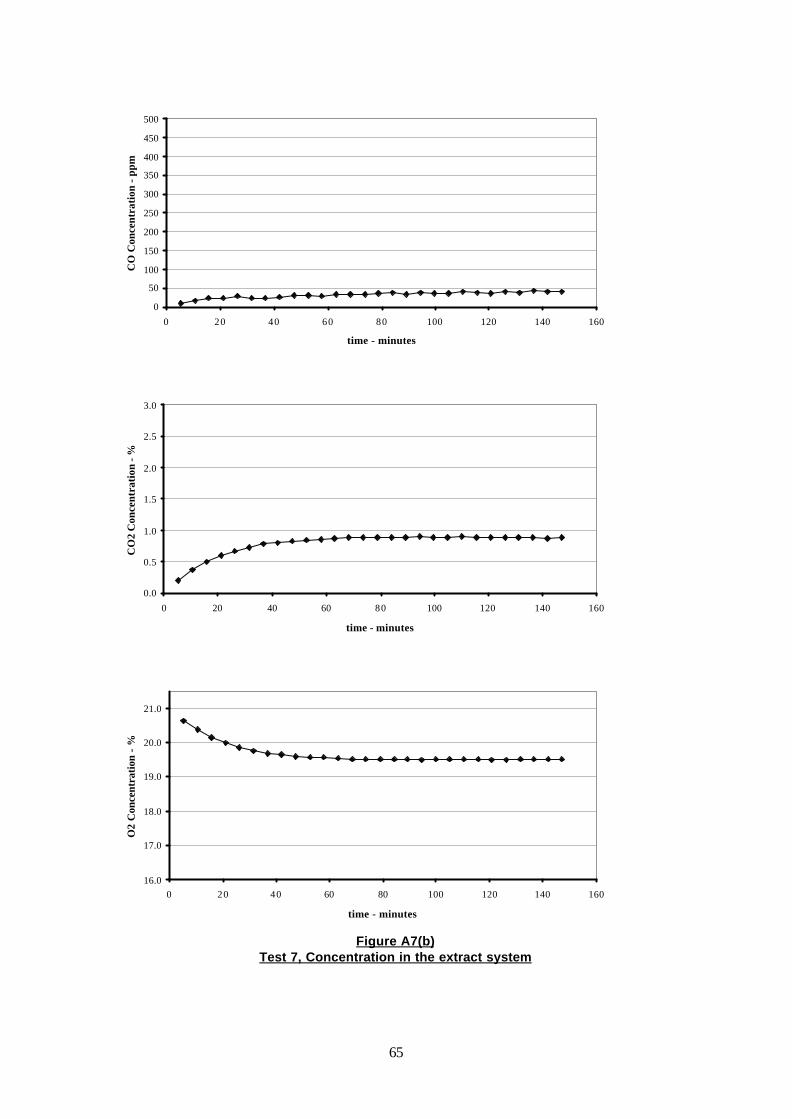
65
Figure A7(b) Test 7, Concentration in the extract system
0
50
100
150
200
250
300
350
400
450
500
0 20 40 60 80 100 120 140 160
time - minutes
CO
Con
cent
rati
on -
ppm
0.0
0.5
1.0
1.5
2.0
2.5
3.0
0 20 40 60 80 100 120 140 160
time - minutes
CO
2 C
once
ntra
tion
- %
16.0
17.0
18.0
19.0
20.0
21.0
0 20 40 60 80 100 120 140 160
time - minutes
O2
Con
cent
ratio
n -
%

66
Figure A7(c) Test 7, Concentration in the flue, and in the combustion air supply
0.0
0.5
1.0
1.5
2.0
2.5
0 20 40 60 80 100 120 140 160
Time - minutes
CO
2 co
ncen
trat
ion
- % Flue
F e e d
0
100
200
300
400
500
600
0 20 40 60 80 100 120 140 160
Time - minutes
CO
con
cent
rati
on -
ppm
Flue
F e e d
16
17
18
19
20
21
0 20 40 60 80 100 120 140 160
Time - minutes
O2
conc
entr
atio
n - %
Flue
F e e d
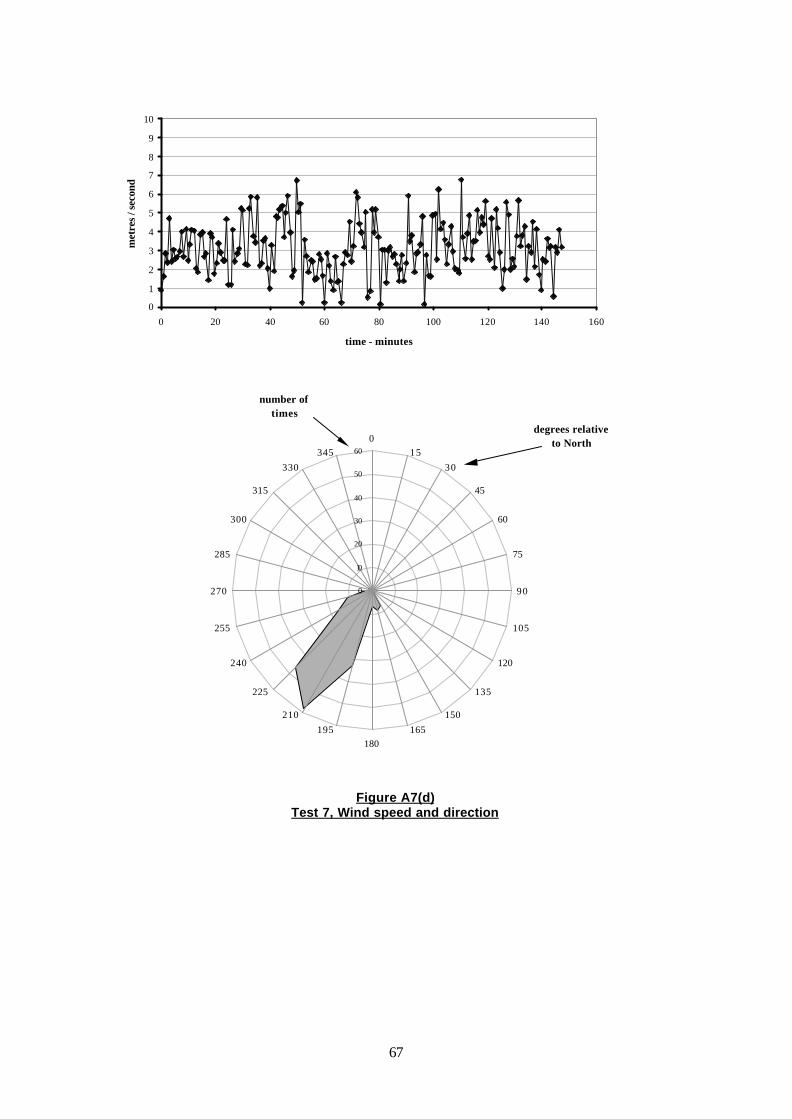
67
Figure A7(d) Test 7, Wind speed and direction
0
1
2
3
4
5
6
7
8
9
10
0 20 40 60 80 100 120 140 160
time - minutes
met
res
/ sec
ond
0
10
20
30
40
50
600
1530
45
60
75
90
105
120
135
150165
180195
210
225
240
255
270
285
300
315
330345
degrees relative to North
number of times
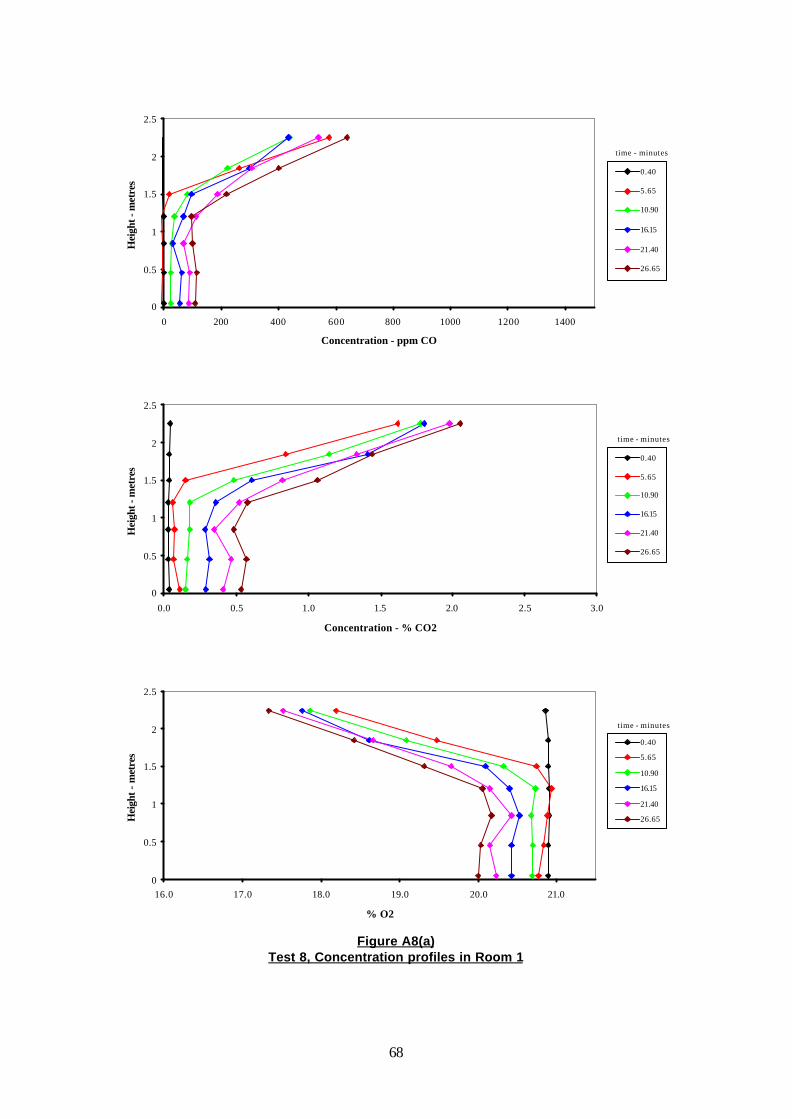
68
Figure A8(a) Test 8, Concentration profiles in Room 1
0
0.5
1
1.5
2
2.5
0 200 400 600 800 1000 1200 1400
Concentration - ppm CO
Hei
ght -
met
res
0.40
5.65
10.90
16.15
21.40
26.65
time - minutes
0
0.5
1
1.5
2
2.5
0.0 0.5 1.0 1.5 2.0 2.5 3.0
Concentration - % CO2
Hei
ght -
met
res
0.40
5.65
10.90
16.15
21.40
26.65
time - minutes
0
0.5
1
1.5
2
2.5
16.0 17.0 18.0 19.0 20.0 21.0
% O2
Hei
ght -
met
res
0.40
5.65
10.90
16.15
21.40
26.65
time - minutes

69
Figure A8(b) Test 8, Concentration in the extract system
0
200
400
600
800
1000
1200
1400
0 5 10 15 20 25 30 35 40
time - minutes
CO
Con
cent
rati
on -
ppm
0.0
0.5
1.0
1.5
2.0
2.5
3.0
0 5 10 15 20 25 30 35 40
time - minutes
CO
2 C
once
ntra
tion
- %
16.0
17.0
18.0
19.0
20.0
21.0
0 5 10 15 20 25 30 35 40
time - minutes
O2
Con
cent
rati
on -
%

70
Figure A8(c) Test 8, Concentration in the flue, and in the combustion air supply
0.0
0.5
1.0
1.5
2.0
2.5
0 5 10 15 20 25 30 35 40
Time - minutes
CO
2 co
ncen
trat
ion
- % Flue
F e e d
0
100
200
300
400
500
600
0 5 10 15 20 25 30 35 40
Time - minutes
CO
con
cent
rati
on -
ppm
Flue
F e e d
16
17
18
19
20
21
0 5 10 15 20 25 30 35 40
Time - minutes
O2
conc
entr
atio
n - %
Flue
F e e d

71
Figure A8(d) Test 8, Wind speed and direction
0
1
2
3
4
5
6
7
8
9
10
0 5 10 15 20 25 30 35 40
time - minutes
met
res
/ sec
ond
0
2
4
6
8
10
12
14
160
15
30
45
60
75
90
105
120
135
150
165180
195
210
225
240
255
270
285
300
315
330
345
degrees relative to North
number of times

72
Figure A9(a) Test 9, Concentration profiles in Room 1
0
0.5
1
1.5
2
2.5
0 200 400 600 800 1000 1200 1400
Concentration - ppm CO
Hei
ght -
met
res
0.40
5.65
10.90
16.15
21.40
26.65
time - minutes
0
0.5
1
1.5
2
2.5
0.0 0.5 1.0 1.5 2.0 2.5 3.0
Concentration - % CO2
Hei
ght -
met
res
0.40
5.65
10.90
16.15
21.40
26.65
time - minutes
0
0.5
1
1.5
2
2.5
16.0 17.0 18.0 19.0 20.0 21.0 22.0
Concentration - % O2
Hei
ght -
met
res
0.40
5.65
10.90
16.15
21.40
26.65
time - minutes

73
Figure A9(b) Test 9, Concentration in the extract system
0
200
400
600
800
1000
1200
1400
0 5 10 15 20 25 30 35 40
time - minutes
CO
Con
cent
rati
on -
ppm
0.0
0.5
1.0
1.5
2.0
2.5
3.0
0 5 10 15 20 25 30 35 40
time - minutes
CO
2 C
once
ntra
tion
- %
16.0
17.0
18.0
19.0
20.0
21.0
0 5 10 15 20 25 30 35 40
time - minutes
O2
Con
cent
rati
on -
%
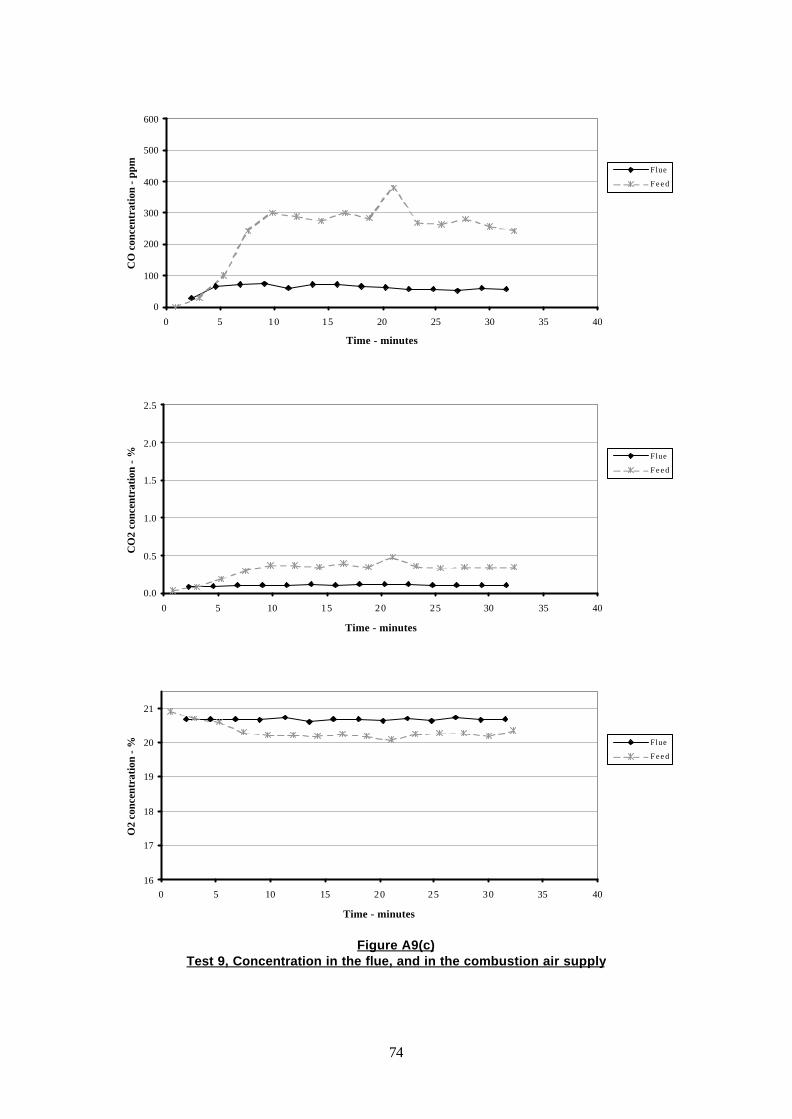
74
Figure A9(c) Test 9, Concentration in the flue, and in the combustion air supply
0.0
0.5
1.0
1.5
2.0
2.5
0 5 10 15 20 25 30 35 40
Time - minutes
CO
2 co
ncen
trat
ion
- % Flue
F e e d
0
100
200
300
400
500
600
0 5 10 15 20 25 30 35 40
Time - minutes
CO
con
cent
rati
on -
ppm
Flue
F e e d
16
17
18
19
20
21
0 5 10 15 20 25 30 35 40
Time - minutes
O2
conc
entr
atio
n - %
Flue
F e e d

75
Figure A9(d) Test 9, Wind speed and direction
0
1
2
3
4
5
6
7
8
9
10
0 5 10 15 20 25 30 35 40
time - minutes
met
res
/ sec
ond
0
2
4
6
8
10
12
14
160
1530
45
60
75
90
105
120
135
150165
180195
210
225
240
255
270
285
300
315
330345
degrees relative to North
number of times
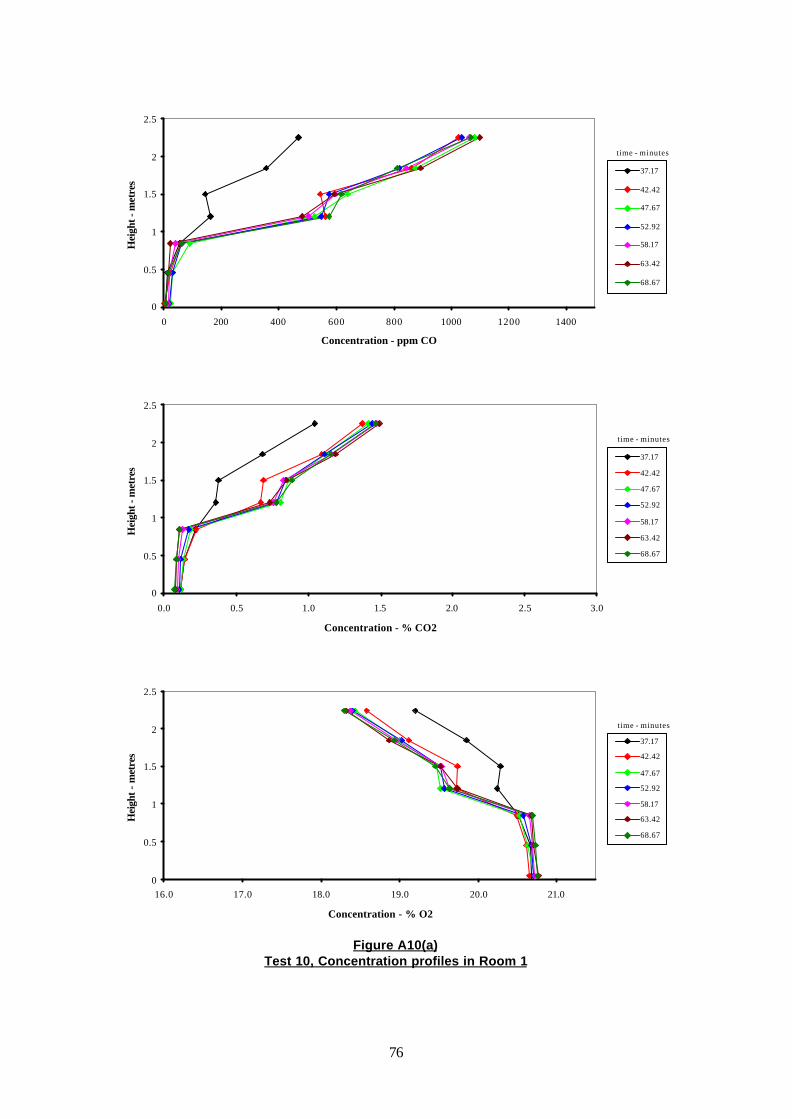
76
Figure A10(a) Test 10, Concentration profiles in Room 1
0
0.5
1
1.5
2
2.5
0 200 400 600 800 1000 1200 1400
Concentration - ppm CO
Hei
ght -
met
res
37.17
42.42
47.67
52.92
58.17
63.42
68.67
time - minutes
0
0.5
1
1.5
2
2.5
0.0 0.5 1.0 1.5 2.0 2.5 3.0
Concentration - % CO2
Hei
ght -
met
res
37.17
42.42
47.67
52.92
58.17
63.42
68.67
time - minutes
0
0.5
1
1.5
2
2.5
16.0 17.0 18.0 19.0 20.0 21.0
Concentration - % O2
Hei
ght -
met
res
37.17
42.42
47.67
52.92
58.17
63.42
68.67
time - minutes

77
Figure A10(b) Test 10, Concentration in the extract system
0
200
400
600
800
1000
1200
1400
30 35 40 45 50 55 60 65 70 75 80
time - minutes
CO
Con
cent
rati
on -
ppm
0.0
0.5
1.0
1.5
2.0
2.5
3.0
30 35 40 45 50 55 60 65 70 75 80
time - minutes
CO
2 C
once
ntra
tion
- %
16.0
17.0
18.0
19.0
20.0
21.0
30 35 40 45 50 55 60 65 70 75 80
time - minutes
O2
Con
cent
ratio
n -
%

78
Figure A10(c) Test 10, Concentration in the flue, and in the combustion air supply
0.0
0.5
1.0
1.5
2.0
2.5
30 35 40 45 50 55 60 65 70 75 80
Time - minutes
CO
2 co
ncen
trat
ion
- % Flue
F e e d
0
100
200
300
400
500
600
30 35 40 45 50 55 60 65 70 75 80
Time - minutes
CO
con
cent
rati
on -
ppm
Flue
F e e d
16
17
18
19
20
21
30 35 40 45 50 55 60 65 70 75 80
Time - minutes
O2
conc
entr
atio
n - %
Flue
F e e d

79
Figure A10(d) Test 10, Wind speed and direction
0
1
2
3
4
5
6
7
8
9
10
30 35 40 45 50 55 60 65 70 75 80
time - minutes
met
res
/ sec
ond
0
2
4
6
8
10
12
14
16
180
1530
45
60
75
90
105
120
135
150165
180195
210
225
240
255
270
285
300
315
330345
degrees relative to North
number of times

80
Figure A11(a) Test 11, Concentration profiles in Room 1
0
0.5
1
1.5
2
2.5
0 5 10 15 20 25 30 35 40 45 50
Concentration - ppm CO
Hei
ght -
met
res
0.42
5.67
10.92 16.17
21.42 26.67
31.92
37.17
42.42 47.67
52.92 58.17
time - minutes
0
0.5
1
1.5
2
2.5
0.0 0.5 1.0 1.5 2.0 2.5 3.0
Concentration - % CO2
Hei
ght -
met
res
0.42 5.67
10.92 16.17 21.42
26.67 31.92 37.17
42.42 47.67
52.92 58.17
time - minutes
0
0.5
1
1.5
2
2.5
16.0 17.0 18.0 19.0 20.0 21.0
Concentration - % O2
Hei
ght -
met
res
0.42 5.67
10.92 16.17
21.42 26.67
31.92 37.17 42.42
47.67 52.92 58.17
time - minutes

81
Figure A11(b) Test 11, Concentration in the extract system
0
5
10
15
20
25
30
35
40
45
50
0 10 20 30 40 50 60 70
time - minutes
CO
Con
cent
rati
on -
ppm
0.0
0.5
1.0
1.5
2.0
2.5
3.0
0 10 20 30 40 50 60 70
time - minutes
CO
2 C
once
ntra
tion
- %
16.0
17.0
18.0
19.0
20.0
21.0
0 10 20 30 40 50 60 70
time - minutes
O2
Con
cent
rati
on -
%

82
Figure A11(c) Test 11, Concentration in the flue, and in the combustion air supply
0.0
0.5
1.0
1.5
2.0
2.5
0 10 20 30 40 50 60 70
Time - minutes
CO
2 co
ncen
trat
ion
- % Flue
F e e d
0
100
200
300
400
500
600
0 10 20 30 40 50 60 70
Time - minutes
CO
con
cent
rati
on -
ppm
Flue
F e e d
16
17
18
19
20
21
0 10 20 30 40 50 60 70
Time - minutes
O2
conc
entr
atio
n - %
Flue
F e e d

83
Figure A11(d) Test 11, Wind speed and direction
0
1
2
3
4
5
6
7
8
9
10
0 10 20 30 40 50 60 70
time - minutes
met
res
/ sec
ond
0
1
2
3
4
5
6
7
015
30
45
60
75
90
105
120
135
150
165180
195
210
225
240
255
270
285
300
315
330
345
degrees relative to North
number of times

84
Figure A12(a) Test 12, Concentration profiles in Room 1
0
0.5
1
1.5
2
2.5
0 50 100 150 200 250 300 350 400 450 500
Concentration - ppm CO
Hei
ght -
met
res
0.43
5.68 10.93
16.18
21.43
26.68
31.93 37.18
42.43 47.68
52.93 58.18
time - minutes
0
0.5
1
1.5
2
2.5
0.0 0.1 0.1 0.2 0.2 0.3 0.3 0.4 0.4 0.5 0.5
Concentration - % CO2
Hei
ght -
met
res
0.43
5.68
10.93 16.18
21.43 26.68
31.93 37.18 42.43
47.68 52.93 58.18
time - minutes
0
0.5
1
1.5
2
2.5
16.0 17.0 18.0 19.0 20.0 21.0
Concentration - % O2
Hei
ght -
met
res
0.43 5.68
10.93 16.18
21.43
26.68 31.93
37.18 42.43
47.68 52.93
58.18
time - minutes

85
Figure A12(b) Test 12, Concentration in the extract system
0
200
400
600
800
1000
1200
1400
0 10 20 30 40 50 60 70
time - minutes
CO
Con
cent
rati
on -
ppm
0.0
0.5
1.0
1.5
2.0
2.5
3.0
0 10 20 30 40 50 60 70
time - minutes
CO
2 C
once
ntra
tion
- %
16.0
17.0
18.0
19.0
20.0
21.0
0 10 20 30 40 50 60 70
time - minutes
O2
Con
cent
rati
on -
%

86
Figure A12(c) Test 12, Concentration in the flue, and in the combustion air supply
0.0
0.5
1.0
1.5
2.0
2.5
0 10 20 30 40 50 60 70
Time - minutes
CO
2 co
ncen
trat
ion
- % Flue
F e e d
0
100
200
300
400
500
600
0 10 20 30 40 50 60 70
Time - minutes
CO
con
cent
rati
on -
ppm
Flue
F e e d
16
17
18
19
20
21
0 10 20 30 40 50 60 70
Time - minutes
O2
conc
entr
atio
n - %
Flue
F e e d

87
Figure A12(d) Test 12, Wind speed and direction
0
1
2
3
4
5
6
7
8
9
10
0 10 20 30 40 50 60 70
time - minutes
met
res
/ sec
ond
0
2
4
6
8
10
12
14
16
0
15
30
45
60
75
90
105
120
135
150
165180
195
210
225
240
255
270
285
300
315
330
345
degrees relative to North
number of times
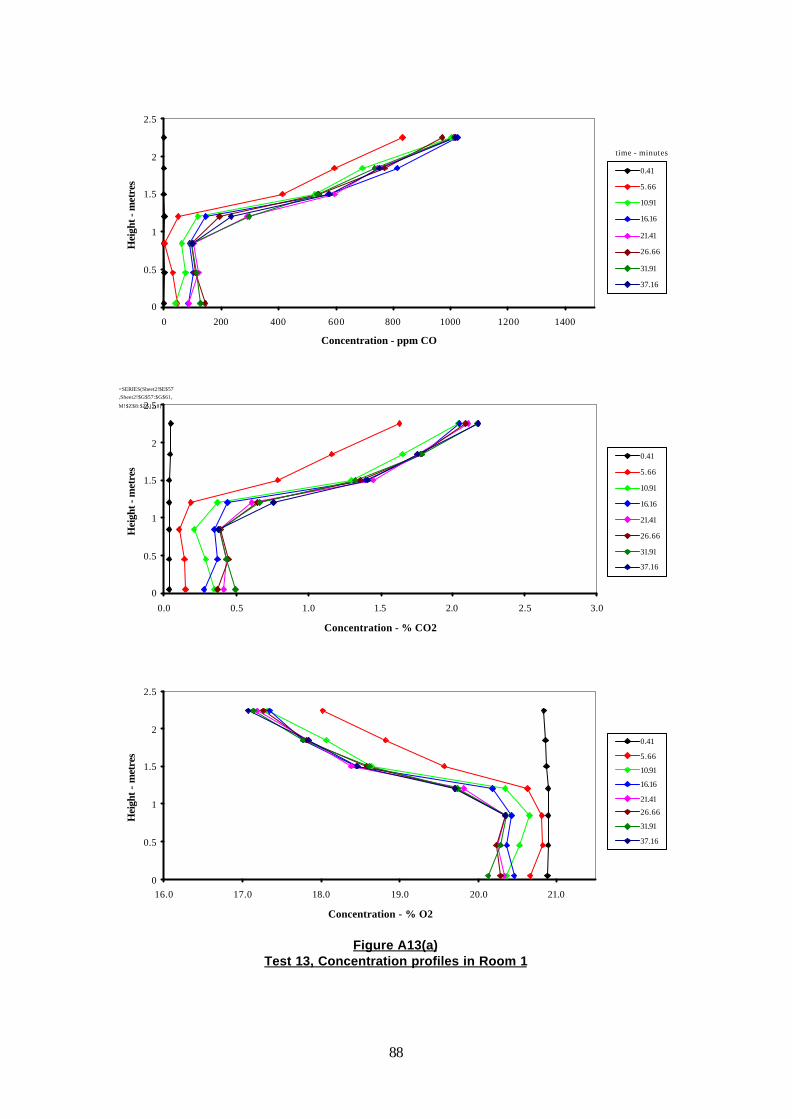
88
Figure A13(a) Test 13, Concentration profiles in Room 1
0
0.5
1
1.5
2
2.5
0 200 400 600 800 1000 1200 1400
Concentration - ppm CO
Hei
ght -
met
res
0.41
5.66
10.91
16.16
21.41
26.66
31.91
37.16
time - minutes
0
0.5
1
1.5
2
2.5
0.0 0.5 1.0 1.5 2.0 2.5 3.0
Concentration - % CO2
Hei
ght -
met
res
0.41
5.66
10.91
16.16
21.41
26.66
31.91
37.16
=SERIES(Sheet2!$E$57,Sheet2!$G$57:$G$61,
M!$Z$8:$Z$12,8)
0
0.5
1
1.5
2
2.5
16.0 17.0 18.0 19.0 20.0 21.0
Concentration - % O2
Hei
ght -
met
res
0.41
5.66
10.91
16.16
21.41
26.66
31.91
37.16

89
Figure A13(b) Test 13, Concentration in the extract system
0
200
400
600
800
1000
1200
1400
0 5 10 15 20 25 30 35 40 45 50
time - minutes
CO
Con
cent
rati
on -
ppm
0.0
0.5
1.0
1.5
2.0
2.5
3.0
0 5 10 15 20 25 30 35 40 45 50
time - minutes
CO
2 C
once
ntra
tion
- %
16.0
17.0
18.0
19.0
20.0
21.0
0 5 10 15 20 25 30 35 40 45 50
time - minutes
O2
Con
cent
rati
on -
%

90
Figure A13(c) Test 13, Concentration in the flue, and in the combustion air su pply
0.0
0.5
1.0
1.5
2.0
2.5
0 5 10 15 20 25 30 35 40 45 50
Time - minutes
CO
2 co
ncen
trat
ion
- % Flue
F e e d
0
100
200
300
400
500
600
0 5 10 15 20 25 30 35 40 45 50
Time - minutes
CO
con
cent
rati
on -
ppm
Flue
F e e d
16
17
18
19
20
21
0 5 10 15 20 25 30 35 40 45 50
Time - minutes
O2
conc
entr
atio
n - %
Flue
F e e d

91
Figure A13(d) Test 13, Wind speed and direction
0
1
2
3
4
5
6
7
8
9
10
0 5 10 15 20 25 30 35 40 45 50
time - minutes
met
res
/ sec
ond
0
1
2
3
4
5
6
7
80
15
30
45
60
75
90
105
120
135
150
165180
195
210
225
240
255
270
285
300
315
330
345
degrees relative to North
number of times

92
Figure A14(a) Test 14, Concentration profiles in Room 1
0
0.5
1
1.5
2
2.5
0 2000 4000 6000 8000 10000
Concentration - ppm CO
Hei
ght -
met
res
0.41
5.66
10.91
16.16 21.41
26.66
31.91
37.16
time - minutes
0
0.5
1
1.5
2
2.5
0.0 0.5 1.0 1.5 2.0 2.5 3.0 3.5
Concentration - % CO2
Hei
ght -
met
res
0.41
5.66
10.91
16.16
21.41
26.66
31.91
37.16
0
0.5
1
1.5
2
2.5
14.0 15.0 16.0 17.0 18.0 19.0 20.0 21.0
Concentration - % O2
Hei
ght -
met
res
0.41
5.66
10.91
16.16
21.41
26.66
31.91
37.16

93
Figure A14(b) Test 14, Concentration in the extract system
0
500
1000
1500
2000
2500
3000
3500
4000
4500
5000
0 5 10 15 20 25 30 35 40
time - minutes
CO
Con
cent
rati
on -
ppm
0.0
0.5
1.0
1.5
2.0
2.5
3.0
0 5 10 15 20 25 30 35 40
time - minutes
CO
2 C
once
ntra
tion
- %
16.0
17.0
18.0
19.0
20.0
21.0
0 5 10 15 20 25 30 35 40
time - minutes
O2
Con
cent
rati
on -
%

94
Figure A14(c) Test 14, Concentration in the flue, and in the combustion air supply
0.0
0.5
1.0
1.5
2.0
2.5
0 5 10 15 20 25 30 35 40
Time - minutes
CO
2 co
ncen
trat
ion
- % Flue
F e e d
0
100
200
300
400
500
600
0 5 10 15 20 25 30 35 40
Time - minutes
CO
con
cent
rati
on -
ppm
Flue
F e e d
16
17
18
19
20
21
0 5 10 15 20 25 30 35 40
Time - minutes
O2
conc
entr
atio
n - %
Flue
F e e d
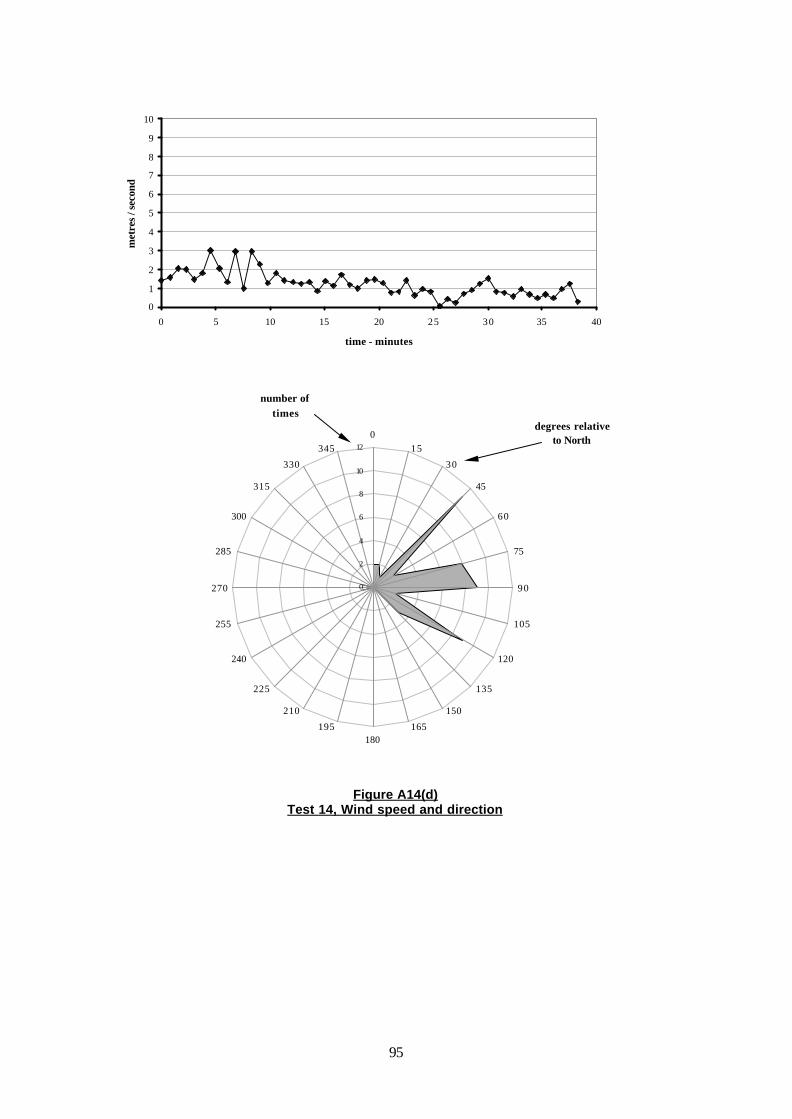
95
Figure A14(d) Test 14, Wind speed and direction
0
1
2
3
4
5
6
7
8
9
10
0 5 10 15 20 25 30 35 40
time - minutes
met
res
/ sec
ond
0
2
4
6
8
10
120
15
30
45
60
75
90
105
120
135
150
165180
195
210
225
240
255
270
285
300
315
330
345
degrees relative to North
number of times

96
Figure A15(a) Test 15, Concentration profiles in Room 1
0
0.5
1
1.5
2
2.5
0 200 400 600 800 1000 1200 1400
Concentration - ppm CO
Hei
ght -
met
res
0.42
5.67
10.92
time - minutes
0
0.5
1
1.5
2
2.5
0.0 0.5 1.0 1.5 2.0 2.5 3.0
Concentration - % CO2
Hei
ght -
met
res
0.42
5.67
10.92
0
0.5
1
1.5
2
2.5
16.0 17.0 18.0 19.0 20.0 21.0
Concentration - % O2
Hei
ght -
met
res
0.42
5.67
10.92

97
Figure A15(b) Test 15, Concentration in the extract system
0
200
400
600
800
1000
1200
1400
0 5 10 15 20 25 30 35 40
time - minutes
CO
Con
cent
rati
on -
ppm
0.0
0.5
1.0
1.5
2.0
2.5
3.0
0 5 10 15 20 25 30 35 40
time - minutes
CO
2 C
once
ntra
tion
- %
16.0
17.0
18.0
19.0
20.0
21.0
0 5 10 15 20 25 30 35 40
time - minutes
O2
Con
cent
rati
on -
%

98
Figure A15(c) Test 15, Concentration in the flue, and in the combustion air supply
0.0
0.5
1.0
1.5
2.0
2.5
0 5 10 15 20 25 30 35 40
Time - minutes
CO
2 co
ncen
trat
ion
- % Flue
F e e d
0
100
200
300
400
500
600
0 5 10 15 20 25 30 35 40
Time - minutes
CO
con
cent
rati
on -
ppm
Flue
F e e d
16
17
18
19
20
21
0 5 10 15 20 25 30 35 40
Time - minutes
O2
conc
entr
atio
n - %
Flue
Feed

99
Figure A15(d) Test 15, Wind speed and direction
0
1
2
3
4
5
6
7
8
9
10
0 5 10 15 20 25 30 35 40
time - minutes
met
res
/ sec
ond
0
1
2
3
4
50
15
30
45
60
75
90
105
120
135
150
165180
195
210
225
240
255
270
285
300
315
330
345
degrees relative to North
number of times

100
Figure A16(a) Test 16, Concentration profiles in Room 1
0
0.5
1
1.5
2
2.5
0 200 400 600 800 1000 1200 1400
Concentration - ppm CO
Hei
ght -
met
res
0.42
5.67
10.92
16.17
21.42
26.67
31.92
37.17
42.42
47.67
time - minutes
0
0.5
1
1.5
2
2.5
0.0 0.5 1.0 1.5 2.0 2.5 3.0
Concentration - % CO2
Hei
ght -
met
res
0.42
5.67
10.92
16.17
21.42
26.67
31.92
37.17
42.42
0
0.5
1
1.5
2
2.5
16.0 17.0 18.0 19.0 20.0 21.0
Concentration - % O2
Hei
ght -
met
res
0.42
5.67
10.92
16.17
21.42
26.67
31.92
37.17
42.42

101
Figure A16(b) Test 16, Concentration in the extract system
0
200
400
600
800
1000
1200
1400
0 5 10 15 20 25 30 35 40 45 50
time - minutes
CO
Con
cent
rati
on -
ppm
0.0
0.5
1.0
1.5
2.0
2.5
3.0
0 5 10 15 20 25 30 35 40 45 50
time - minutes
CO
2 C
once
ntra
tion
- %
16.0
17.0
18.0
19.0
20.0
21.0
0 5 10 15 20 25 30 35 40 45 50
time - minutes
O2
Con
cent
ratio
n -
%

102
Figure A16(c) Test 16, Concentration in the flue, and in the combustion air supply
0.0
0.5
1.0
1.5
2.0
2.5
0 5 10 15 20 25 30 35 40 45 50
Time - minutes
CO
2 co
ncen
trat
ion
- % Flue
F e e d
0
100
200
300
400
500
600
0 5 10 15 20 25 30 35 40 45 50
Time - minutes
CO
con
cent
rati
on -
ppm
Flue
F e e d
16
17
18
19
20
21
0 5 10 15 20 25 30 35 40 45 50
Time - minutes
O2
conc
entr
atio
n - %
Flue
F e e d

103
Figure A16(d) Test 16, Wind speed and direction
0
1
2
3
4
5
6
7
8
9
10
0 5 10 15 20 25 30 35 40 45 50
time - minutes
met
res
/ sec
ond
0
5
10
15
20
250
15
30
45
60
75
90
105
120
135
150
165180
195
210
225
240
255
270
285
300
315
330
345
degrees relative to North
number of times

104
Figure A17(a) Test 17, Concentration profiles in Room 1
0
0.5
1
1.5
2
2.5
0 50 100 150 200 250 300 350 400 450 500
Concentration - ppm CO
Hei
ght -
met
res
0.42 5.67 10.92
16.17 21.42
26.67 31.92 37.17
42.42 47.67 52.92 58.17 63.42
0
0.5
1
1.5
2
2.5
0.0 0.5 1.0 1.5 2.0 2.5 3.0
Concentration - % CO2
Hei
ght -
met
res
0.42 5.67
10.92 16.17 21.42
26.67 31.92 37.17 42.42 47.67 52.92 58.17 63.42
0
0.5
1
1.5
2
2.5
16.0 17.0 18.0 19.0 20.0 21.0
Concentration - % O2
Hei
ght -
met
res
0.42 5.67 10.92 16.17 21.42 26.67 31.92 37.17 42.42
47.67 52.92 58.17
63.42

105
Figure A17(b) Test 17, Concentration in the extract system
0
50
100
150
200
250
300
350
400
450
500
0 10 20 30 40 50 60 70
time - minutes
CO
Con
cent
rati
on -
ppm
0.0
0.5
1.0
1.5
2.0
2.5
3.0
0 10 20 30 40 50 60 70
time - minutes
CO
2 C
once
ntra
tion
- %
16.0
17.0
18.0
19.0
20.0
21.0
0 10 20 30 40 50 60 70
time - minutes
O2
Con
cent
ratio
n -
%
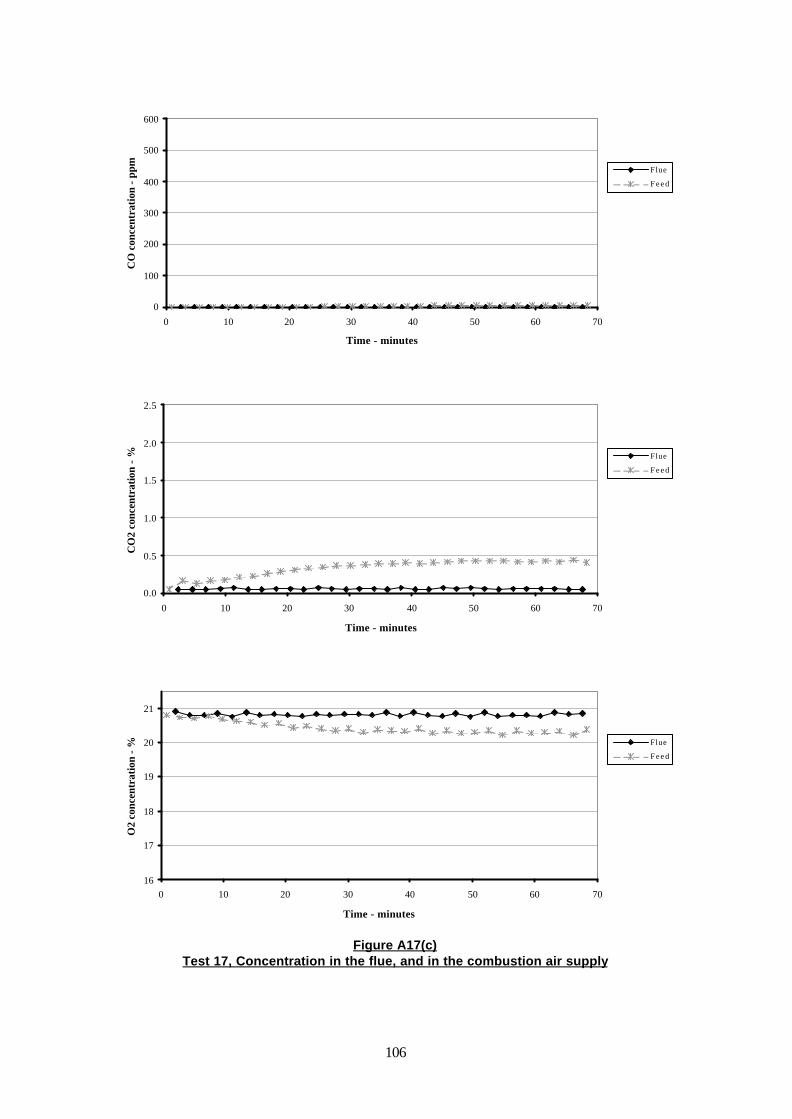
106
Figure A17(c) Test 17, Concentration in the flue, and in the combustion air supply
0.0
0.5
1.0
1.5
2.0
2.5
0 10 20 30 40 50 60 70
Time - minutes
CO
2 co
ncen
trat
ion
- % Flue
F e e d
0
100
200
300
400
500
600
0 10 20 30 40 50 60 70
Time - minutes
CO
con
cent
rati
on -
ppm
Flue
F e e d
16
17
18
19
20
21
0 10 20 30 40 50 60 70
Time - minutes
O2
conc
entr
atio
n - %
Flue
F e e d
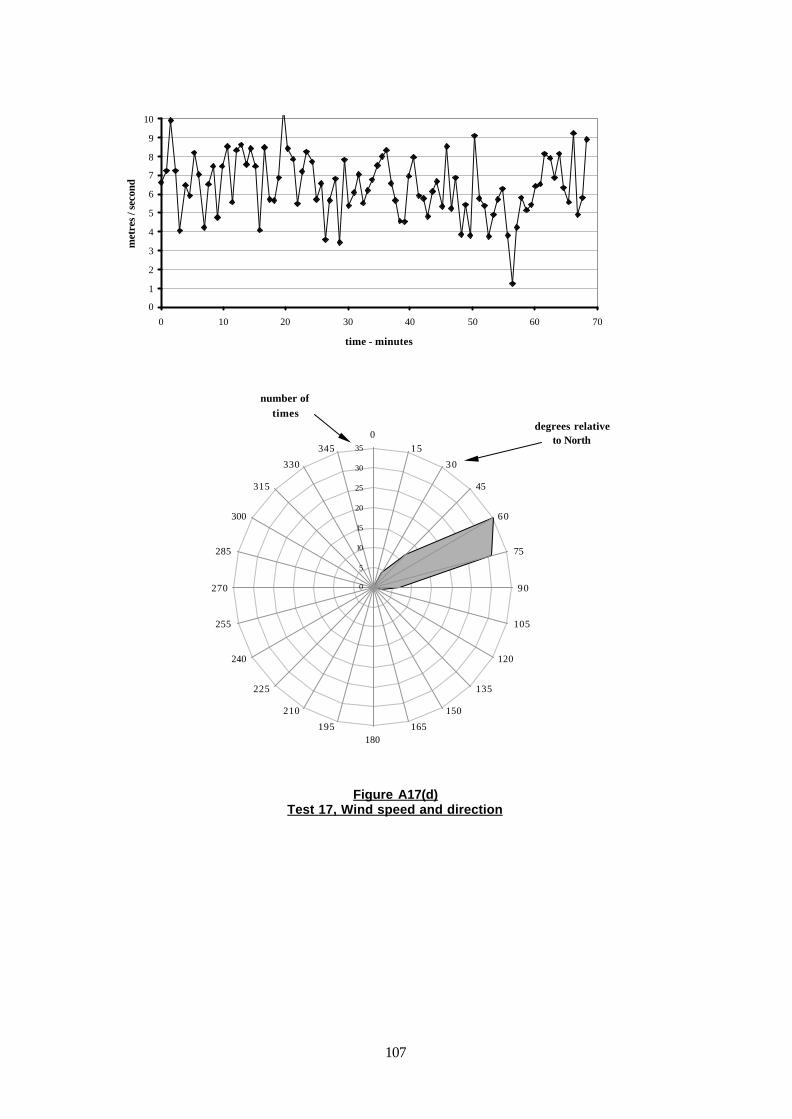
107
Figure A17(d) Test 17, Wind speed and direction
0
1
2
3
4
5
6
7
8
9
10
0 10 20 30 40 50 60 70
time - minutes
met
res
/ sec
ond
0
5
10
15
20
25
30
35
015
30
45
60
75
90
105
120
135
150
165180
195
210
225
240
255
270
285
300
315
330
345
degrees relative to North
number of times

108
Figure A18(a) Test 18, Concentration profiles in Room 1
0
0.5
1
1.5
2
2.5
0 50 100 150 200 250 300 350 400 450 500
Concentration - ppm CO
Hei
ght -
met
res
37.17
42.42 47.67
52.92
58.17
63.42
68.67
73.92
79.17
84.42 89.67
0
0.5
1
1.5
2
2.5
0.0 0.5 1.0 1.5 2.0 2.5 3.0
Concentration - % CO2
Hei
ght -
met
res
37.17
42.42
47.67
52.92
58.17
63.42
68.67
73.92
79.17
84.42
89.67
0
0.5
1
1.5
2
2.5
14.0 15.0 16.0 17.0 18.0 19.0 20.0 21.0
Concentration - % O2
Hei
ght -
met
res
37.17
42.42 47.67
52.92
58.17
63.42 68.67
73.92
79.17
84.42 89.67

109
Figure A18(b) Test 18, Concentration in the extract system
0
50
100
150
200
250
300
350
400
450
500
40 50 60 70 80 90 100
time - minutes
CO
Con
cent
rati
on -
ppm
0.0
0.5
1.0
1.5
2.0
2.5
3.0
40 50 60 70 80 90 100
Time - minutes
CO
2 C
once
ntra
tion
- %
16.0
17.0
18.0
19.0
20.0
21.0
40 50 60 70 80 90 100
Time - minutes
O2
Con
cent
ratio
n -
%
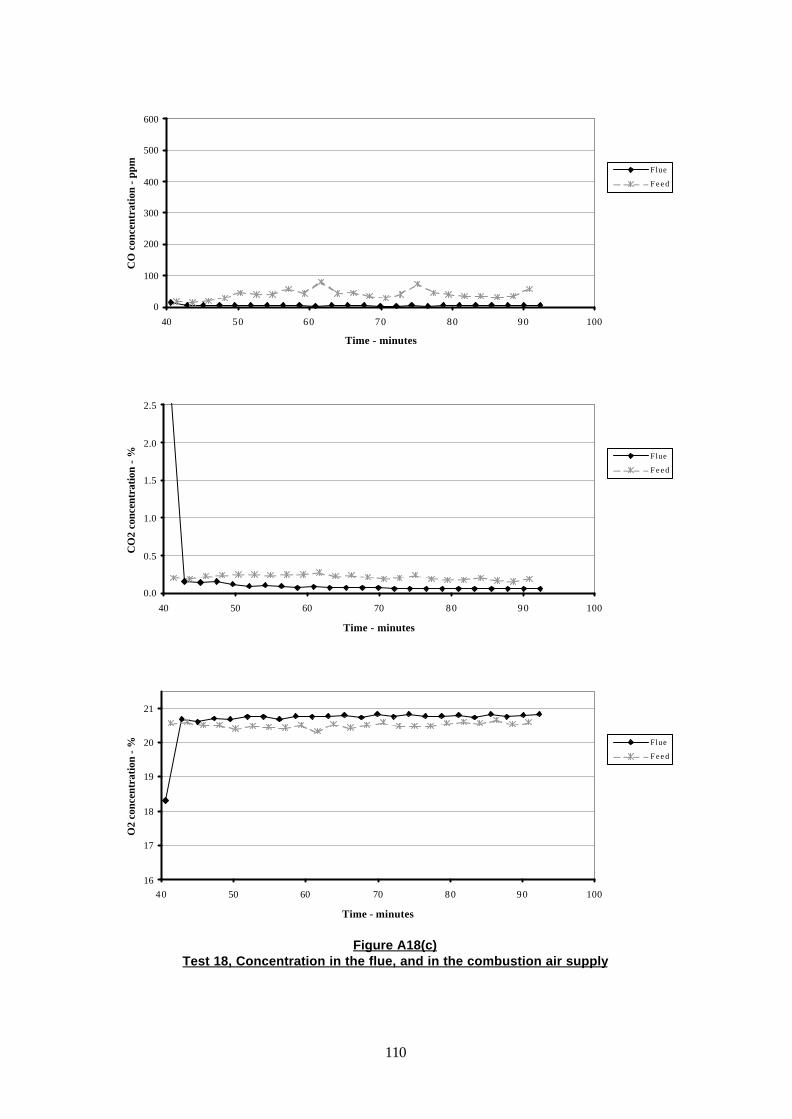
110
Figure A18(c) Test 18, Concentration in the flue, and in the combustion air supply
0.0
0.5
1.0
1.5
2.0
2.5
40 50 60 70 80 90 100
Time - minutes
CO
2 co
ncen
trat
ion
- % Flue
F e e d
0
100
200
300
400
500
600
40 50 60 70 80 90 100
Time - minutes
CO
con
cent
rati
on -
ppm
Flue
F e e d
16
17
18
19
20
21
40 50 60 70 80 90 100
Time - minutes
O2
conc
entr
atio
n - %
Flue
F e e d

111
Figure A18(d) Test 18, Wind speed and direction
0
1
2
3
4
5
6
7
8
9
10
40 50 60 70 80 90 100
time - minutes
met
res
/ sec
ond
0
1
2
3
4
5
6
7
8
9
10
015
30
45
60
75
90
105
120
135
150
165180
195
210
225
240
255
270
285
300
315
330
345
degrees relative to North
number of times

112
Figure A19(a) Test 19, Concentration profiles in Room 1
0
0.5
1
1.5
2
2.5
0 500 1000 1500 2000 2500
Concentration - ppm CO
Hei
ght -
met
res
37.16 42.41
47.66
52.91
58.16 63.41
68.66
73.91
79.16 84.41
89.66
94.91
100.16
0
0.5
1
1.5
2
2.5
0.0 0.5 1.0 1.5 2.0 2.5 3.0
Concentration - % CO2
Hei
ght -
met
res
37.16
42.41
47.66
52.91
58.16
63.41
68.66
73.91
79.16
84.41
89.66
94.91
100.16
0
0.5
1
1.5
2
2.5
14.0 15.0 16.0 17.0 18.0 19.0 20.0 21.0
Concentration - % O2
Hei
ght -
met
res
37.16 42.41
47.66 52.91
58.16
63.41 68.66
73.91 79.16
84.41 89.66
94.91 100.16

113
Figure A19(b) Test 19, Concentration in the extract system
0
500
1000
1500
2000
2500
40 50 60 70 80 90 100 110
time - minutes
CO
Con
cent
rati
on -
ppm
0.0
0.5
1.0
1.5
2.0
2.5
3.0
40 50 60 70 80 90 100 110
time - minutes
CO
2 C
once
ntra
tion
- %
16.0
17.0
18.0
19.0
20.0
21.0
40 50 60 70 80 90 100 110
time - minutes
O2
Con
cent
ratio
n -
%

114
Figure A19(c) Test 19, Concentration in the flue, and in the combustion air supply
0.0
0.5
1.0
1.5
2.0
2.5
40 50 60 70 80 90 100 110
Time - minutes
CO
2 co
ncen
trat
ion
- % Flue
F e e d
0
100
200
300
400
500
600
40 50 60 70 80 90 100 110
Time - minutes
CO
con
cent
rati
on -
ppm
Flue
F e e d
16
17
18
19
20
21
40 50 60 70 80 90 100 110
Time - minutes
O2
conc
entr
atio
n - %
Flue
F e e d

115
Figure A19(d) Test 19, Wind speed and direction
0
1
2
3
4
5
6
7
8
9
10
40 50 60 70 80 90 100 110
time - minutes
met
res
/ sec
ond
0
2
4
6
8
10
12
14
015
30
45
60
75
90
105
120
135
150
165180
195
210
225
240
255
270
285
300
315
330
345
degrees relative to North
number of times

116
Figure A20(a) Test 20, Concentration profiles in Room 1
0
0.5
1
1.5
2
2.5
0 200 400 600 800 1000 1200 1400
Concentration - ppm CO
Hei
ght -
met
res
47.66
52.91
58.16
63.41
68.66
73.91
79.16
84.41
89.66
94.91
100.16
105.41
time - minutes
0
0.5
1
1.5
2
2.5
0.0 0.5 1.0 1.5 2.0 2.5 3.0
Concentration - % CO2
Hei
ght -
met
res
47.66
52.91
58.16
63.41
68.66
73.91
79.16
84.41
89.66
94.91
100.16
105.41
0
0.5
1
1.5
2
2.5
14.0 15.0 16.0 17.0 18.0 19.0 20.0 21.0
Concentration - % O2
Hei
ght -
met
res
47.66
52.91
58.16
63.41
68.66
73.91
79.16
84.41
89.66
94.91
100.16
105.41

117
Figure A20(b) Test 20, Concentration in the extract system
0
200
400
600
800
1000
1200
1400
40 50 60 70 80 90 100 110 120
time - minutes
CO
Con
cent
rati
on -
ppm
0.0
0.5
1.0
1.5
2.0
2.5
3.0
40 50 60 70 80 90 100 110 120
time - minutes
CO
2 C
once
ntra
tion
- %
16.0
17.0
18.0
19.0
20.0
21.0
40 50 60 70 80 90 100 110 120
time - minutes
O2
Con
cent
ratio
n -
%
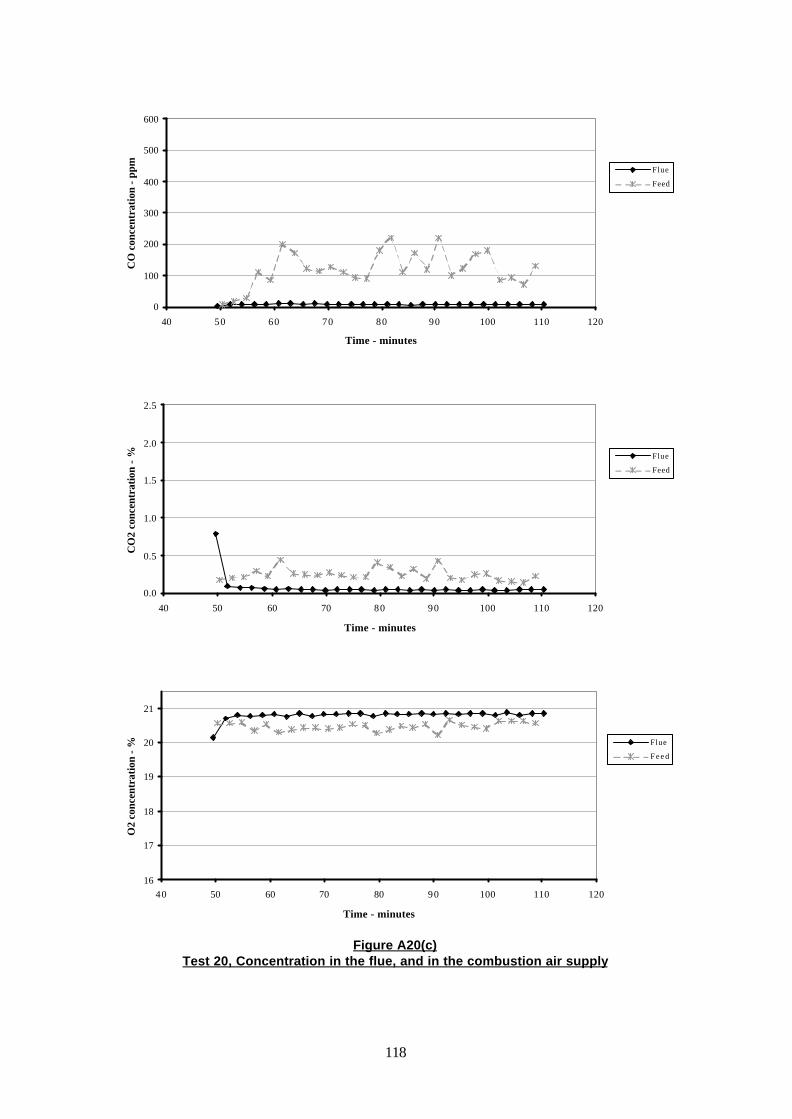
118
Figure A20(c) Test 20, Concentration in the flue, and in the combustion air supply
0.0
0.5
1.0
1.5
2.0
2.5
40 50 60 70 80 90 100 110 120
Time - minutes
CO
2 co
ncen
trat
ion
- % Flue
Feed
0
100
200
300
400
500
600
40 50 60 70 80 90 100 110 120
Time - minutes
CO
con
cent
rati
on -
ppm
Flue
Feed
16
17
18
19
20
21
40 50 60 70 80 90 100 110 120
Time - minutes
O2
conc
entr
atio
n - %
Flue
F e e d

119
Figure A20(d) Test 20, Wind speed and direction
0
1
2
3
4
5
6
7
8
9
10
40 50 60 70 80 90 100 110 120
time - minutes
met
res
/ sec
ond
0
2
4
6
8
10
12
14
16
180
15
30
45
60
75
90
105
120
135
150
165180
195
210
225
240
255
270
285
300
315
330
345
degrees relative to North
number of times

120
Figure A21(a) Test 21, Concentration profiles in Room 1
0
0.5
1
1.5
2
2.5
0 5 10 15 20 25 30 35 40 45 50
Concentration - ppm CO
Hei
ght -
met
res
42.41 47.66
52.91 58.16
63.41 68.66
73.91 79.16
84.41 89.66
94.91 100.16
105.41 110.66
115.91 121.16
126.41 131.66
136.91 142.16
147.41 152.66
157.91
time - minutes
0
0.5
1
1.5
2
2.5
0.0 0.1 0.2 0.3 0.4 0.5
Concentration - % CO2
Hei
ght -
met
res
42.41 47.66
52.91 58.16
63.41 68.66
73.91 79.16
84.41 89.66
94.91 100.16
105.41 110.66
115.91 121.16
126.41 131.66
136.91 142.16
147.41 152.66
157.91
time - minutes
0
0.5
1
1.5
2
2.5
19.0 19.5 20.0 20.5 21.0 21.5
Concentration - % O2
Hei
ght -
met
res
42.41 47.66
52.91 58.16
63.41 68.66
73.91 79.16
84.41 89.66
94.91 100.16
105.41 110.66
115.91 121.16
126.41 131.66
136.91 142.16
147.41 152.66
157.91

121
Figure A21(b) Test 21, Concentration in the extract system
0
5
10
15
20
25
30
35
40
45
50
40 60 80 100 120 140 160 180
time - minutes
CO
Con
cent
rati
on -
ppm
0.0
0.1
0.1
0.2
0.2
0.3
0.3
0.4
0.4
0.5
0.5
40 60 80 100 120 140 160 180
time - minutes
CO
2 C
once
ntra
tion
- %
19.0
19.5
20.0
20.5
21.0
21.5
40 60 80 100 120 140 160 180
time - minutes
O2
Con
cent
ratio
n -
%
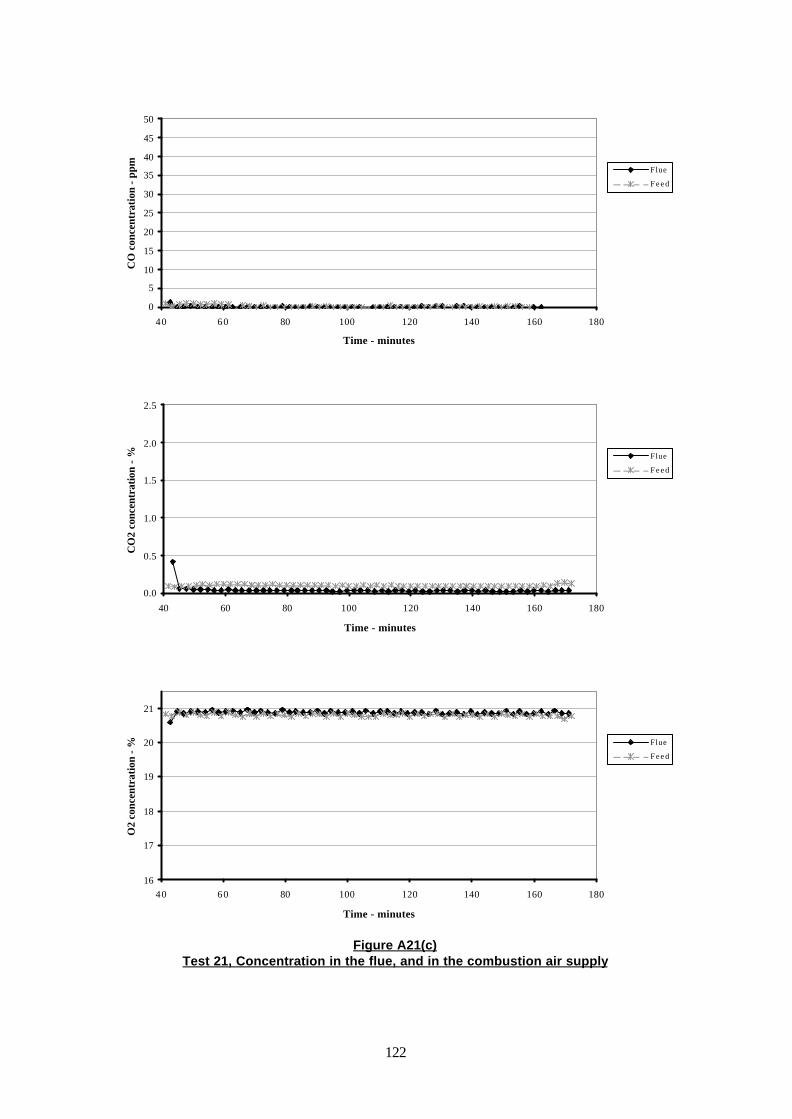
122
Figure A21(c) Test 21, Concentration in the flue, and in the combustion air supply
0.0
0.5
1.0
1.5
2.0
2.5
40 60 80 100 120 140 160 180
Time - minutes
CO
2 co
ncen
trat
ion
- % Flue
F e e d
0
5
10
15
20
25
30
35
40
45
50
40 60 80 100 120 140 160 180
Time - minutes
CO
con
cent
rati
on -
ppm
Flue
F e e d
16
17
18
19
20
21
40 60 80 100 120 140 160 180
Time - minutes
O2
conc
entr
atio
n - %
Flue
F e e d

123
Figure A21(d) Test 21, Wind speed and direction
0
1
2
3
4
5
6
7
8
9
10
40 60 80 100 120 140 160 180
time - minutes
met
res
/ sec
ond
0
5
10
15
20
25
300
15
30
45
60
75
90
105
120
135
150
165180
195
210
225
240
255
270
285
300
315
330
345
degrees relative to North
number of times

Printed and published by the Health and Safety ExecutiveC30 1/98
Printed and published by the Health and Safety ExecutiveC1 12/01

CRR 380
£30.00 9 780717 621217
ISBN 0-7176-2121-9