contract no - srs
TRANSCRIPT

Contract No:
This document was prepared in conjunction with work accomplished under Contract No. DE-AC09-08SR22470 with the U.S. Department of Energy (DOE) Office of Environmental Management (EM).
Disclaimer:
This work was prepared under an agreement with and funded by the U.S. Government. Neither the U. S. Government or its employees, nor any of its contractors, subcontractors or their employees, makes any express or implied:
1 ) warranty or assumes any legal liability for the accuracy, completeness, or for the use or results of such use of any information, product, or process disclosed; or
2 ) representation that such use or results of such use would not infringe privately owned rights; or
3) endorsement or recommendation of any specifically identified commercial product, process, or service.
Any views and opinions of authors expressed in this work do not necessarily state or reflect those of the United States Government, or its contractors, or subcontractors.

CBP CBP CBP CBP CBP CBP CBP
CBP CBP CBP CBP CBP CBP CBP
CBP CBP CBP CBP CBP CBP CBP
CBP CBP CBP CBPCBP CBP CBP
CBP CBP CBP CBPCBP CBP CBP
CBP CBP CBP CBP
CONCRETE MIXTURE CHARACTERIZATION
Cementitious Barriers Partnership
December 2014
CBP-TR-2015-008, Rev. 0 C
BP-Tr
-2010-007-C3, r
evision 0
Task 7 D
emo
nsTr
aTion
of sTaD
ium
® for
The
Perfo
rm
anC
e assessmen
T of C
on
Cr
eTe lo
w aC
TiviTy w
asTe sTor
age sTr
uC
Tur
esC
ementitious B
arriers Partnership
ENERGYU.S. DEPARTMENT OF
National Institute ofStandards and Technology
National Institute ofStandards and Technology

CBP-TR-2015-008, Rev. 0
CEMENTITIOUS BARRIERS PARTNERSHIP CONCRETE MIXTURE CHARACTERIZATION
Yannick Protière, Eng. M.Sc.
Eric Samson, Eng. Ph. D.
SIMCO Technologies, Inc.
Québec, Canada
December 2014

CBP – Concrete mixture characterization
ii CBP-TR-2015-008, Rev. 0
ACKNOWLEDGEMENTS This report was prepared for the United States Department of Energy in part under Contract No. DE-AC09-08SR22470 and is an account of work performed in part under that contract. Reference herein to any specific commercial product, process, or service by trademark, name, manufacturer, or otherwise does not necessarily constitute or imply endorsement, recommendation, or favoring of same by Savannah River Nuclear Solutions or by the United States Government or any agency thereof. The views and opinions of the authors expressed herein do not necessarily state or reflect those of the United States Government or any agency thereof. The authors would like to acknowledge the contributions of Elmer Wilhite of Savannah River National Laboratory, David Kosson of Vanderbilt University and CRESP, Jake Philip of the U.S. Nuclear Regulatory Commission, and Ed Garboczi of the National Institute of Standards and Technology for contributions to the document. They would also like to acknowledge the contributions of Media Services of Savannah River Nuclear Solutions and Savannah River National Laboratory personnel for editing and assistance with production of the document.
and
This report is based on work supported by the U. S. Department of Energy, under Cooperative Agreement Number DE-FC01-06EW07053 entitled ‘The Consortium for Risk Evaluation with Stakeholder Participation III’ awarded to Vanderbilt University. The opinions, findings, conclusions, or recommendations expressed herein are those of the author(s) and do not necessarily represent the views of the U.S. Department of Energy or Vanderbilt University.
DISCLAIMER This work was prepared under an agreement with and funded by the U. S. Government. Neither the U.S. Government or its employees, nor any of its contractors, subcontractors or their employees, makes any express or implied: 1. warranty or assumes any legal liability for the accuracy, completeness, or for the use or results of such use of any information, product, or process disclosed; or 2. representation that such use or results of such use would not infringe privately owned rights; or 3. endorsement or recommendation of any specifically identified commercial product, process, or service. Any views and opinions of authors expressed in this work do not necessarily state or reflect those of the United States Government, or its contractors, or subcontractors, or subcontractors.
Printed in the United States of America
United States Department of Energy
Office of Environmental Management Washington, DC
This document is available on the U.S. DOE Information Bridge and on the
CBP website: http://cementbarriers.org/ An electronic copy of this document is also available through links on the following websites:
http://srnl.doe.gov/ and http://cementbarriers.org/

CBP – Concrete mixture characterization
CBP-TR-2015-008, Rev. 0 iii
FOREWORD The Cementitious Barriers Partnership (CBP) Project is a multi-disciplinary, multi-institutional collaboration supported by the United States Department of Energy (US DOE) Office of Waste Processing. The objective of the CBP project is to develop a set of tools to improve understanding and prediction of the long-term structural, hydraulic, and chemical performance of cementitious barriers used in nuclear applications.
A multi-disciplinary partnership of federal, academic, private sector, and international expertise has been formed to accomplish the project objective. In addition to the US DOE, the CBP partners are the Savannah River National Laboratory (SRNL), Vanderbilt University (VU) / Consortium for Risk Evaluation with Stakeholder Participation (CRESP), Energy Research Center of the Netherlands (ECN), and SIMCO Technologies, Inc (SIMCO). The Nuclear Regulatory Commission (NRC) is providing support under a Memorandum of Understanding. The National Institute of Standards and Technology (NIST) is providing research under an Interagency Agreement. Neither the NRC nor NIST are signatories to the CRADA.
The periods of cementitious performance being evaluated are >100 years for operating facilities and > 1000 years for waste management. The set of simulation tools and data developed under this project will be used to evaluate and predict the behavior of cementitious barriers used in near-surface engineered waste disposal systems, e.g., waste forms, containment structures, entombments, and environmental remediation, including decontamination and decommissioning analysis of structural concrete components of nuclear facilities (spent-fuel pools, dry spent-fuel storage units, and recycling facilities such as fuel fabrication, separations processes). Simulation parameters will be obtained from prior literature and will be experimentally measured under this project, as necessary, to demonstrate application of the simulation tools for three prototype applications (waste form in concrete vault, high-level waste tank grouting, and spent-fuel pool). Test methods and data needs to support use of the simulation tools for future applications will be defined.
The CBP project is a five-year effort focused on reducing the uncertainties of current methodologies for assessing cementitious barrier performance and increasing the consistency and transparency of the assessment process. The results of this project will enable improved risk-informed, performance-based decision-making and support several of the strategic initiatives in the DOE Office of Environmental Management Engineering & Technology Roadmap. Those strategic initiatives include 1) enhanced tank closure processes; 2) enhanced stabilization technologies; 3) advanced predictive capabilities; 4) enhanced remediation methods; 5) adapted technologies for site-specific and complex-wide D&D applications; 6) improved SNF storage, stabilization and disposal preparation; 7) enhanced storage, monitoring and stabilization systems; and 8) enhanced long-term performance evaluation and monitoring.
Christine A. Langton, PhD Savannah River National Laboratory
David S. Kosson, PhD Vanderbilt University / CRESP

CBP – Concrete mixture characterization
iv CBP-TR-2015-008, Rev. 0
EXECUTIVE SUMMARY This report summarizes the characterization study performed on two concrete mixtures used for radioactive waste storage. The mixtures were designed at the Savanah River National Laboratory and are identified as follow:
• Vault 1/4 concrete: w/b ratio of 0.38, prepared with ASTM Type I/II cement and slag; • Vault 2 concrete: w/b ratio of 0.38, prepared with ASTM Type V cement, slag, fly ash, and silica
fume.
Both mixtures were prepared with approximately 425 kg of binder. All raw materials were shipped to SIMCO Technologies’ laboratory, where the batches were prepared and the samples tested. The testing protocol mostly focused on determining the transport properties of the mixtures. It was based on test methods developed by SIMCO. The same tests are incorporated in the protocol developed by the US Department of Defense and described in the Unified Facilities Guide Specifications (UFGS – 03 31 29) for new marine concrete construction, issued in August 2012. The tests yield parameters that can directly be incorporated in STADIUM®, a reactive transport model dedicated to the prediction of chemical alteration sustained by cement-based materials in aggressive environments. STADIUM® is a proprietary code developed by SIMCO and is part of the CBP Toolbox. The following transport properties were evaluated:
• Volume of permeable voids (porosity), in accordance with the ASTM C642 standard procedure: Standard Test Method for Density, Absorption and Voids in Hardened Concrete,
• Diffusion coefficients, on the basis of migration test results, which is a modified version of the ASTM C1202 procedure: Standard Test Method for Electrical Indication of Concrete’s Ability to Resist Chloride Ion Penetration,
• Water permeability, on the basis of drying test results, in accordance with ASTM WK37029: Measurement of Mass Loss Versus Time for One-Dimensional Drying of Saturated Concretes.
Tests were performed after different curing durations. In order to obtain data on the statistical distribution of transport properties, the measurements after 2 years of curing were performed on 10+ samples. Overall, both mixtures exhibited very low tortuosities and permeabilities, a direct consequence of their low water-to-binder ratio and the use of supplementary cementitious materials. The data generated on 2-year old samples showed that porosity, tortuosity and permeability follow a normal distribution. Chloride ponding tests were also performed on test samples. They showed limited chloride ingress, in line with measured transport properties. These test results also showed that both materials react differently with chloride, a consequence of the differences in the binder chemical compositions.

CBP – Concrete mixture characterization
CBP-TR-2015-008, Rev. 0 v
CONTENTS ACKNOWLEDGEMENTS ............................................................................................................................... ii DISCLAIMER .................................................................................................................................................... ii FOREWORD ..................................................................................................................................................... iii EXECUTIVE SUMMARY ............................................................................................................................... iv LIST OF FIGURES ........................................................................................................................................... vi LIST OF TABLES ............................................................................................................................................ vii 1.0 OBJECTIVE ............................................................................................. Error! Bookmark not defined.
2.0 RAW MATERIALS ............................................................................................................................... 1 3.0 CONCRETE MIXTURES ..................................................................................................................... 3
3.1. Vault 1/4 concrete ............................................................................................................................... 3 3.2. Vault 2 concrete .................................................................................................................................. 5
4.0 CONCRETE PROPERTIES MEASUREMENTS .............................................................................. 7 4.1. Compressive strength ......................................................................................................................... 7 4.2. Chemical composition of expressed pore fluids ............................................................................... 8 4.3. Porosity measurements ...................................................................................................................... 8 4.4. Migration tests – Diffusion coefficients .......................................................................................... 10 4.5. Drying tests – Permeability ............................................................................................................. 14
5.0 IMMERSION (PONDING) TEST ...................................................................................................... 18 5.1. Immersion in NaCl reference solution............................................................................................ 18
6.0 CONCLUSION ..................................................................................................................................... 20 7.0 REFERENCES ..................................................................................................................................... 21 APPENDIX A – MIGRATION TEST PROCEDURE .................................................................................. 22
STADIUM® IDC analysis reports .............................................................................................................. 25 Migration test detailed experimental procedure ....................................................................................... 26
APPENDIX B – DRYING TEST PROCEDURE ........................................................................................... 31 STADIUM® MTC analysis reports ............................................................................................................ 34 Drying test detailed experimental procedure ............................................................................................. 35
APPENDIX C – DESCRIPTION OF STADIUM® ....................................................................................... 40

CBP – Concrete mixture characterization
vi CBP-TR-2015-008, Rev. 0
LIST OF FIGURES Figure 1 - SIMCO Technologies' concrete laboratory .......................................................................................... 3
Figure 2 - First trial batch for mix Vault 1/4 ......................................................................................................... 4
Figure 3 - Porosity data distribution at two years ................................................................................................. 9
Figure 4 – Migration test set up .......................................................................................................................... 10
Figure 5 – Currents measured for each samples (dotted lines), and average values (solid lines) during the
migration tests at 28, 97 days, 1 year and 2 years for vault concrete mixtures ................................................... 11
Figure 6 – DOH coefficient data distribution at two years ................................................................................... 13
Figure 7 - Illustration of drying test results......................................................................................................... 14
Figure 8 - Chloride profiles after 3 months and 1 year of immersion in 0.5 N NaCl solution for Vault 1/4
concrete ............................................................................................................................................................... 19
Figure 9 - Chloride profiles after 3 months and 1 year of immersion in 0.5 N NaCl solution for Vault 2
concrete ............................................................................................................................................................... 19
Figure 10 - Simulation of migration test measurements 0.45 w/c OPC mixture, ............................................... 24
Figure 11 - Test specimen sealed and mounted onto the two rings and coated with silicon............................... 28
Figure 12 - Migration test setup .......................................................................................................................... 29
Figure 13 - Connecting ring for 4-in. specimen (96–103 mm) ........................................................................... 30
Figure 14 - Typical moisture isotherms .............................................................................................................. 32
Figure 15 - STADIUM® MTC simulation of OPC mixture ............................................................................... 33
Figure 16 - STADIUM® MTC simulation of mixture with silica fume ............................................................. 33
Figure 17 - Balance and device for weighing specimen in air and water ........................................................... 36
Figure 18 - Preparation of test specimens from the middle portion of laboratory cast concrete cylinders of 4 in
(100mm) in diameter .......................................................................................................................................... 37
Figure 19 - Case 1: the specimen is placed on a shelf in the drying chamber .................................................... 38
Figure 20 - Case 2: the specimen is placed on a support in the drying chamber ................................................ 38
Figure 21 - Mass loss in specimens during drying test ....................................................................................... 39
Figure 22 - General structure of STADIUM® .................................................................................................... 40

CBP – Concrete mixture characterization
CBP-TR-2015-008, Rev. 0 vii
LIST OF TABLES Table 1 – Characteristics of fine and coarse aggregates ....................................................................................... 1
Table 2 – Relative density of binders.................................................................................................................... 2
Table 3 – Chemical composition of binders (%) .................................................................................................. 2
Table 4 – Dosage range of admixture for uses defined in ASTM C494/C494M .................................................. 2
Table 5 – Properties of fresh and early age Vault 1/4 concrete ............................................................................ 4
Table 6 – Vault 1/4 concrete formulation ............................................................................................................. 5
Table 7 – Properties of fresh and early age Vault 2 concrete ............................................................................... 5
Table 8 – Vault 2 concrete formulation ................................................................................................................ 6
Table 9 – Compressive strength for Vault concretes ............................................................................................ 7
Table 10 - Chemical analyses of pore fluids extracted after 28 days of curing .................................................... 8
Table 11 – Porosity (%) of Vault concretes .......................................................................................................... 9
Table 12 - Diffusion properties estimated from migration test analyses ............................................................ 12
Table 13 – Saturation degrees estimated from drying test analyses on 10-mm thin disks .................................. 15
Table 14 - Van Genuchten’s parameters deduced from moisture isotherm function .......................................... 16
Table 15 – Permeability calculated from STADIUM® MTC simulations, expressed in [e-22 m2] ................... 16
Table 16 - Chemical composition of 1-liter (1000 ml) solutions ........................................................................ 30


1 CBP-TR-2015-008, Rev. 0
1.0 INTRODUCTION This report summarizes the characterization study performed on two concrete mixtures used for radioactive waste storage. The selected mixtures are:
• Vault 1/4 concrete with a w/b ratio of 0.38 prepared with ASTM Type I/II cement and slag; • Vault 2 concrete with a w/b ratio of 0.38 prepared with ASTM Type V cement, slag, fly ash, and silica
fume.
The testing protocol mostly focused on determining the transport properties of the mixtures. It was based on test methods developed by SIMCO. The same tests are incorporated in the protocol developed by the US Department of Defense and described in the Unified Facilities Guide Specifications (UFGS – 03 31 29) for new marine concrete construction, issued in August 2012. The tests yield parameters that can directly be incorporated in STADIUM®, a reactive transport model dedicated to the prediction of chemical alteration sustained by cement-based materials in aggressive environments. STADIUM® is a proprietary code developed by SIMCO and is part of the CBP Toolbox. The report is divided as follows: Section 2 presents the characteristics of raw materials. Section 3 details the formulations and the fresh properties of the mixtures. Section 4 presents transport properties measurements performed on the mixtures. Section 5 is concerned with the ponding tests using NaCl contact solutions.
2.0 RAW MATERIALS This section presents the characteristics of the cements, supplementary cementing materials, aggregates, and admixtures used in the preparation of both concrete mixtures. All materials were provided to SIMCO by SRNL. Relative density and absorption of Foster sand and Rinker N°67 stone were determined based on CSA A23.2-6A Relative density and absorption of fine aggregate and CSA A23.2-12A Relative density and absorption of coarse aggregate, respectively. Terminologies in previous CSA Standards have similar significances such as ASTM C127 Standard Test Method for density, relative density (specific gravity), and absorption of coarse aggregates and ASTM C128 Standard Test Method for density, relative density (specific gravity), and absorption of fine aggregates. The characteristics of aggregates are presented in Table 1.
Table 1 – Characteristics of fine and coarse aggregates
Raw materials Absorption (%)
Relative density (SSD)
Apparent relative density
Sand Foster 0.60 2.64 2.66 N° 67 Stone Rinker 0.61 2.64 2.67 The relative density (specific gravity) of binders is useful to calculate mixture compositions. The data are given in Table 2.

CBP – Concrete mixture characterization
CBP-TR-2015-008, Rev. 0 2
Table 2 – Relative density of binders
Type I/II cement Type V cement GGBFS Force 10000
SF Class F Fly
Ash Lafarge Lehigh Holcim Grace SEFA
Relative Density 3.182 3.224 2.924 2.259 2.432
The chemical composition of binders is an input of the chemical equilibrium code in STADIUM® to estimate the composition of the hydrated cement paste. Data are given in Table 3. They were evaluated using the X-ray fluorescence technique.
Table 3 – Chemical composition of binders (%)
Oxides Type I/II cement Type V cement GGBFS Force 10000
SF Class F Fly
Ash Lafarge Lehigh Holcim Grace SEFA
CaO 64.8 63.8 37.8 0.60 1.32 SiO2 20.9 21.0 39.6 95.0 54.5 Al2O3 4.80 3.82 7.61 0.18 28.1 Fe2O3 3.43 4.75 0.47 0.07 8.65 SO3 1.75 1.15 1.05 0.18 <0.1 MgO 1.05 2.60 12.2 0.22 1.19 K2O 0.54 0.61 0.47 0.48 2.82 Na2O 0.22 0.15 0.28 0.18 0.41 LOI 1.13 0.84 -0.45 3.32 1.41 According to ASTM C494/C494M Standard specification for chemical admixtures for concrete, water reducing admixtures can have a retarding effect. Type A water reducer requires that initial and final setting times are not extended by more than 1h30, compared to the same mixture prepared without the admixture. The use and the dosage range of admixtures are presented in Table 4.
Table 4 – Dosage range of admixture for uses defined in ASTM C494/C494M
Admixture use Dosage range1
for Type A use
MicroAir (BASF) AEA2 -
Polyheed N (BASF) MRWR3 3 to 5 (195 to 325)
Glenium 3030 (BASF) HRWR4 up to 3 (up to 195)
(1) in fl oz / 100 lb of binder (in ml/100 kg of binder); (2) AEA = Air Entraining Agent (3) MRWR = mid-range water reducing admixture; (4) HRWR = high-range water reducing admixture

CBP – Concrete mixture characterization
3 CBP-TR-2015-008, Rev. 0
3.0 CONCRETE MIXTURES The mix designs of the two vault concretes were provided by SNRL. Vault 1/4 concrete was used to build Vault 1 in the late 1980’s, while Vault 2 concrete was designed to construct a pre-cast, reinforced, post tensioned water tank structure. Samples of Vault concretes were prepared in accordance with ASTM C192/192M – 07 Standard Practice for Making and Curing Concrete Test Specimens in the Laboratory in SIMCO Technologies concrete laboratory (Figure 1). Mixtures were cast in plastic cylinders (10 cm diameter, 20 cm length). A single sixty-liter batch was prepared for each mixture, which gave roughly thirty cylinders. The concrete cylinders were consolidated by rodding and were demolded after 24 hours under wet burlap, and then cured in a saturated lime solution. After approximately one year, they were transferred in a moist room (100% relative humidity, RH).
Figure 1 - SIMCO Technologies' concrete laboratory
3.1. Vault 1/4 concrete Polyheed N and Glenium 3030 admixtures have been used as reducing admixtures. The air entraining admixture was BASF’s MicroAir. Table 5 presents the properties of fresh and early age concrete for the batch. A trial batch was realized without the Glenium 3030 admixture. As illustrated on Figure 2, the Polyheed N was not effective enough to provide required workability and reach the targeted slump value of at least 75 mm (3 inches). A second mixture with Glenium 3030 was then prepared. In this case, the slump was 150 mm after 15 minutes. This second batch was kept for testing. Table 6 gives the final Vault 1/4 concrete formulation prepared for this project.

CBP – Concrete mixture characterization
CBP-TR-2015-008, Rev. 0 4
Figure 2 - First trial batch for mix Vault 1/4
Concrete cylinders were demolded after 24 hours under wet burlap, and then cured in saturated lime solution. The compressive strength at 28 days was particularly high, exceeding the required strength (i.e. 4000 psi).
Table 5 – Properties of fresh and early age Vault 1/4 concrete
Properties Batch V1/4
Slump (mm, after 15 min.) 1 150 Unit weigth (kg/m3, after 15 min.) 1 2283 Air content (%, after 15 min.) 1 6.6
fc 28d (MPa) 2 62.6 Density at 28d (kg/m3) 2 2354
(1) based on ASTM C192/C192M (2) based on ASTM C39/C39M Standard Test Method for Compressive Strength of Cylindrical Concrete Specimens

CBP – Concrete mixture characterization
5 CBP-TR-2015-008, Rev. 0
Table 6 – Vault 1/4 concrete formulation
Raw materials Source Formulation
(kg/m3)
Type I/II cement Lafarge 255 GGBFS Holcim 169 Sand Foster 692 N° 67 Stone Rinker 1,095 Water 161 w/b 0.38 Air content 6 % Unit weight 2289 kg/m3 (ml / 100 kg of binder) MicroAir BASF 1.2 Polyheed N BASF 390 Glenium 3030 BASF 936
3.2. Vault 2 concrete In the case of Vault 2 mixture, it was decided from the start to use the same admixtures as for the V1/4 batch. As the effect of the Glenium HRWR diminished with time for the previous batch, we targeted a higher slump value after fifteen minutes than required (7 ± 1 in.). After 15 minutes, the slump value was within desired range. Table 7 presents the properties of fresh and early age concrete for the Vault 2 batch used to make cylindrical samples.
Table 7 – Properties of fresh and early age Vault 2 concrete
Properties Batch V2
Slump (mm, after 15 min.) 155
Unit weigth (kg/m3, after 15 min.) 2240
Air content (%, after 15 min.) 6.6
fc 28d (MPa) 2 49.9
Density at 28d (kg/m3) 2 2302
(1) based on ASTM C192/C192M (2) based on ASTM C39/C39M Standard Test Method for Compressive Strength of Cylindrical Concrete Specimens Table 8 gives the Vault 2 concrete formulation. Dosage of WR was in the range for type A use. HRWR dosage was higher than type A use but in the mid-range use (3-6 fl oz / 100 lb of binder) defined by the producer.

CBP – Concrete mixture characterization
CBP-TR-2015-008, Rev. 0 6
Table 8 – Vault 2 concrete formulation
Raw materials Source Formulation
(kg/m3)
Type V cement Lehigh 121 GGBFS Holcim 162 Force 10000 SF Grace 27 Class F Fly Ash SEFA 95 Sand Foster 548 N° 67 Stone Rinker 1,111 Water 154 w/b 0.38 Air content 6 % Unit weight 2219 kg/m3 (ml / 100 kg of binder) MicroAir BASF 3.1 Polyheed N BASF 205 Glenium 3030 BASF 232

CBP – Concrete mixture characterization
7 CBP-TR-2015-008, Rev. 0
4.0 CONCRETE PROPERTIES MEASUREMENTS Properties of Vault concretes were determined at 28 days, 97 days, 1 year and 2 years of curing in saturated lime solution for the first year and in a moist room (100% RH) after that. The mechanical properties of the mixtures were evaluated on the basis of compressive strength measurements at 28 days only. The following transport properties were evaluated:
• Volume of permeable voids (porosity1), in accordance with the ASTM C642 standard procedure: Standard Test Method for Density, Absorption and Voids in Hardened Concrete,
• Diffusion coefficients, on the basis of migration test results, which is a modified version of the ASTM C1202 procedure: Standard Test Method for Electrical Indication of Concrete’s Ability to Resist Chloride Ion Penetration,
• Water permeability, on the basis of drying test results, in accordance with ASTM WK37029: Measurement of Mass Loss Versus Time for One-Dimensional Drying of Saturated Concretes. Some of the results are not available as of February 2014 and will be presented later in an updated report.
In order to obtain data on the statistical distribution of transport properties, the measurements after 2 years of curing were performed on 10+ samples. The test procedures to evaluate the diffusion coefficients and permeability are described in appendices at the end of the report. The following sections present the results obtained for these different tests.
4.1. Compressive strength Compressive strengths and densities were tested based on ASTM C39/C39M Standard Test Method for Compressive Strength of Cylindrical Concrete Specimens. Three cylinders were taken from each batch. Table 9 presents compressive strength results measured after 28 days of hydration on vault concretes. The coefficients of variation presented in the table were calculated on the basis of the three individual measurements.
Table 9 – Compressive strength for Vault concretes
Properties Vault 1/4 Vault 2 Average CV(%) Average CV(%)
fc 28d (MPa) 62.6 0.8 49.9 10.5 Density at 28d (kg/m3) 2354 7.0 2302 1.4 The average compressive strengths at 28 days for Vault 1/4 and Vault 2 concretes were respectively 62.6 and 49.9 MPa, largely above the minimum strength specified by design2. The dispersion of results was more important for Vault 2 concrete than Vault 1/4.
1 The use of porosity in the report refers to the volume of permeable voids, as measured in ASTM C642. 2 Phifer, M. A., Millings, M. R., and Flach, G. P. 2006. Hydraulic Property Data Package for the E-Area and Z-Area Vadose Zone Soils, Cementitious Materials, and Waste Zones, WSRC-STI-2006-00198, Revision 0. Washington Savannah River Company, Aiken, SC. September 2006.

CBP – Concrete mixture characterization
CBP-TR-2015-008, Rev. 0 8
4.2. Chemical composition of expressed pore fluids Pore solution extractions were made on the vault concretes after 28 days of curing. Similar to the other tests, the specimens for pore solution extraction were sawn from cylinders. Samples were broken in small pieces, placed in a cell, and crushed at a high pressure. Pore solution analyses were carried out shortly after extraction by Atomic Absorption Analyzer and Ion Chromatography as well as pH titrator to obtain the main species concentration in the pore solution: OH-, Na+, K+, SO4
2-, Ca2+, Cl-. The results are listed in Table 10. The measured concentrations did not balance to a neutral solution, a consequence of the experimental errors associated with the procedure. The concentrations presented in the table were balanced by a correction factor proportional to the charge contribution of each species in the solution. In all cases, the correction factor never exceeded 5%.
Table 10 - Chemical analyses of pore fluids extracted after 28 days of curing
4.3. Porosity measurements The porosity measurements were performed on the basis of the ASTM C642 standard procedure: Standard Test Method for Density, Absorption and Voids in Hardened Concrete. The porosity results are given in Table 11. The ASTM procedure recommends stopping the test when mass changes on consecutive days for both the absorption and drying phases are under 0.5% variation. Using this criterion tends to underestimate porosity values for high quality mixtures. In the present case, a criterion of 0.1% was used instead. Measurements were performed after 28 days, 91 days, 1 year and 2 years of wet curing. In all cases, two samples were used, except for 2-year concrete, for which data were generated over 10 samples. This allowed estimating the statistical distribution of the parameter. Results are presented in Table 11. The Vault 1/4 mixture porosity is globally lower than that of Vault 2. The measurements for Vault 1/4 show very little variation over time. This is consistent with data obtained by SIMCO in its own material database. Taking all 16 measurements together gives an average porosity of 11.2% with a standard deviation of 0.20. The corresponding coefficient of variation is 1.8%, indicating weak data spread. In the case of Vault 2 results, data show higher variability. This is especially the case for the 28-day measurements, which are clearly lower than porosities measured later. Analyzing data on the basis of ASTM E178-08 – Standard Practice for Dealing With Outlying Observations does not indicate any outliers in the data set. Taking all 16 measurements together gives an average porosity of 14.3% with a standard deviation of 0.61. The corresponding coefficient of variation is 4.3%, higher than Vault 1/4 but still in line with similar data found in (Conciatori 2014).
Species Vault 1/4 (mmol/L)
Vault 2 (mmol/L)
OH- 218.1 96.3 Na+ 84.1 36.4 K+ 135.4 59.6
SO42- 0.1 <0.1
Ca2+ 1.6 2.2 Cl- 4.5 4.1

CBP – Concrete mixture characterization
9 CBP-TR-2015-008, Rev. 0
Finally, the measurements made on 10 samples after 2 years of curing were used to estimate the statistical distribution of porosity. The data were compared to a normal distribution, as illustrated in the Q-Q plots shown on Figure 3. As shown on both graphs, porosity can be correctly represented by a normal distribution.
Table 11 – Porosity (%) of vault concretes Age of
material Sample ID. Vault 1/4 Vault 2
28 days 1 11.6 13.4 2 11.3 12.8
Average 11.4 13.1
97 days 1 11.5 14.6 2 11.2 14.0
Average 11.3 14.3
1 year 1 11.4 13.9 2 11.3 14.4
Average 11.4 14.2
2 years
1 10.9 15.0 2 11.1 14.5 3 11.2 14.7 4 11.1 14.0 5 11.0 13.8 6 11.2 13.8 7 11.3 14.6 8 11.2 15.0 9 10.9 14.7 10 11.4 14.8
Average (Standard deviation) 11.1 (0.2) 14.5 (0.5)
a) Vault 1/4 b) Vault 2
Figure 3 – Q-Q plots of porosity data represented by a normal distribution

CBP – Concrete mixture characterization
CBP-TR-2015-008, Rev. 0 10
4.4. Migration tests – Diffusion coefficients The objective of the migration test is to determine the tortuosity and diffusion coefficients of concrete. The test is a modified version of the ASTM C1202 procedure: Standard test method for electrical indication of concrete’s ability to resist chloride ion penetration. The method developed by SIMCO consists in accelerating the ions under an external potential and measuring the electrical current across the sample over a 10 to 15-day period. The setup is illustrated on Figure 4. The test wass performed on samples with size of 100-mm in diameter and 50-mm in thickness. Prior to testing, samples were vacuum saturated in 0.3M NaOH solution. Once conditioned, discs were mounted between cells filled with 2.7 L of 0.3M NaOH solution. The upstream cell solution also contained 0.5M NaCl salt. The applied voltage was set to 20-V and measured regularly to make sure it is constant over the testing duration. During testing, the electrical current was measured regularly. Solution in the downstream cell was also sampled to monitor chloride moving across the material. This data was not used in the analysis but was rather used as an indicator of abnormal behavior such as cracks in the samples. After the testing period, the measured currents were analyzed with the STADIUM®-IDC laboratory module to evaluate the diffusion coefficients. The module iteratively tries to find the set of diffusion coefficients that allow reproducing the measured current curves. The analysis uses the porosity, pore solution concentrations and mixture composition parameters as input data. Details on the analysis are provided in (Samson 2008) and Appendix A. The analysis provides the diffusion coefficient of all species in the material. The analysis provides the tortuosity of the mixture, as well as the diffusion coefficients, calculated as:
𝐷𝑖 = 𝜏𝑠𝐷𝑖𝑜 where 𝐷𝑖 is the diffusion coefficient of species i, 𝜏𝑠 is the intrinsic tortuosity of the material and 𝐷𝑖𝑜 is the self-diffusion coefficient of species I, which can be found in electrochemistry textbooks.
Figure 4 – Migration test set up
Migration tests were performed after 28, 97 days, 1 year and 2 years of hydration. The measured currents are presented on Figure 5 for both mixtures. The measured current amplitude gradually decreased as a function of the curing duration, which indicates a reduction of the transport properties as the hydration process continues

CBP – Concrete mixture characterization
11 CBP-TR-2015-008, Rev. 0
in the materials. A smaller contribution of current reduction with curing age can be attributed to the decrease of pore solution concentration. The diffusion coefficient analysis takes both factors into account. The experimental currents also show that the current values are lower for the Vault 2 concrete despite a higher porosity, which generally indicates lower diffusion coefficients.
a) Vault 1/4 concrete
b) Vault 2 concrete
Figure 5 – Currents measured for each samples (dotted lines), and average values (solid lines) during the migration tests at 28, 97 days, 1 year and 2 years for vault concrete mixtures
The diffusion coefficients and tortuosities estimated from migration tests analyses are presented in Table 12. A complete report for each test is provided in Appendix A. The diffusion coefficients are presented for hydroxide and chloride. Results for both mixtures are low, indicating a very good resistance to species transport. It should be noted that Vault 2 coefficients are much lower and should translate in much better durability performance over the long term.

CBP – Concrete mixture characterization
CBP-TR-2015-008, Rev. 0 12
As indicated by the current curves, the diffusion coefficients of Vault 1/4 and Vault 2 concretes tend to decrease as the hydration progressed. The evolution is less significant for the Vault 1/4 concrete. Based on tests performed on similar materials by SIMCO, the reduction of diffusion coefficient with time is usually more important for mixtures with fly ash than it is with slag. The differences are mainly due to the various hydration kinetics of SCM: the slag hydration is similar to cement (Vault 1/4) while the fly ash hydration is slower (Vault 2) but usually translates to lower diffusive properties. Figure 5b shows that Vault 2 mix cured one year exhibited unusual current curves. This resulted in higher diffusion coefficients at one year compared to 97-day results. Given the statistical analysis performed after 2 years, these results do not seem to represent a particular trend of the material and are not considered significant.
Table 12 - Diffusion properties estimated from migration test analyses
Age of material
Sample ID.
Vault 1/4 Vault 2 DOH
[e-11 m2/s] DCl
[e-11 m2/s] Tortuosity
[-] DOH
[e-11 m2/s] DCl
[e-11 m2/s] Tortuosity
[-]
28 days 1 5.23 2.02 0.0099 2.75 1.06 0.0052 2 5.15 1.98 0.0098 3.58 1.38 0.0068
Average 5.18 2.00 0.0098 3.28 1.26 0.0062
97 days 1 4.76 1.83 0.0090 0.60 0.23 0.0011 2 4.27 1.65 0.0081 2.25 0.87 0.0043
Average 4.51 1.74 0.0086 1.56 0.60 0.0030
1 year 1 3.82 1.47 0.0072 1.35 0.52 0.0026 2 3.59 1.38 0.0068 2.51 0.97 0.0048
Average 3.70 1.43 0.0070 2.00 0.77 0.0038
2 years
1 3.31 1.28 0.0063 0.26 0.10 0.0005 2 3.30 1.27 0.0063 0.33 0.13 0.0006 3 3.44 1.33 0.0065 - - - 4 3.31 1.28 0.0063 0.483 0.18 0.0009 5 2.94 1.13 0.0056 0.25 0.10 0.0005 6 3.12 1.20 0.0059 0.20 0.08 0.0004 7 3.05 1.18 0.0058 0.25 0.10 0.0005 8 3.32 1.28 0.0063 0.21 0.08 0.0004 9 3.40 1.31 0.0064 0.27 0.10 0.0005 10 2.80 1.08 0.0053 0.27 0.10 0.0005 11 3.30 1.27 0.0063 0.34 0.13 0.0006 12 3.17 1.22 0.0060 0.34 0.13 0.0006
Average (SD*)
3.21 (0.19) 1.24 0.0061 0.27
(0.05) 0.11 0.0005
* Standard deviation Table 12 hydroxide diffusion coefficient data are plotted on Figure 6 to illustrate the progressive reduction of diffusive properties. The thick line corresponds to function:
𝐷 = 𝐷ref𝐻(𝑡) = 𝐷ref ×𝑎
1 + (𝑎 − 1)𝑒−𝛼�𝑡−𝑡ref�
3 Identified as an outlier value

CBP – Concrete mixture characterization
13 CBP-TR-2015-008, Rev. 0
where Dref is a reference value, taken here as the average of measured DOH at tref = 28 days, and H(t) is the hydration function that models the reduction of diffusion coefficient with time. The function is characterized by parameters a and α, which are estimated from experimental data. The parameters associated to Vault 1/4 and Vault 2 mixes are indicated on Figure 6. They can be used in the reactive transport model STADIUM® when dealing with long-term simulations involving concrete mixtures with supplementary cementitious admixtures.
Figure 6 – Time-evolution of hydroxide diffusion coefficients
Similar to porosity testing, multiple samples were tested after 2 years of curing to assess the statistical distribution of diffusion coefficients. This time, 12 samples of Vault 1/4 and 11 samples of Vault 2 mixes were tested. One data from the Vault 2 set was identified as an outlier and removed from the analysis (see Table 12). The Q-Q plots shown in Figure 7 show that diffusion properties values estimated from migration test analyses measured at two years also follow a normal distribution. Coefficients of variation of 5.9% for Vault 1/4 and 18.5% for Vault 2 are obtained. Although the coefficient of variation for the Vault 2 is high, it is in line with some data obtained using the same protocol, as reported in (Conciatori 2014).
a) Vault 1/4 b) Vault 2
Figure 7 – DOH coefficient data distribution at two years

CBP – Concrete mixture characterization
CBP-TR-2015-008, Rev. 0 14
4.5. Drying tests – Permeability The objective of the drying test is to estimate the intrinsic permeability of concrete samples. The test procedure was performed in accordance with ASTM WK37029 – Measurement of Mass Loss Versus Time for One-Dimensional Drying of Saturated Concretes. The test consists in exposing initially two series of saturated samples to constant 50% RH environment and measuring the mass loss through time. The mass loss results are analyzed following a procedure developed by SIMCO to yield the intrinsic permeability of the tested material. Drying tests can last for several weeks, especially for good quality materials. Unlike porosity and migration tests, drying tests were limited to materials cured 90 days and 2 years. Drying tests on multiple samples cured 2 years was also performed, in order to provide information on the statistical distribution of permeability. Details on the analysis are provided in Appendix B. The first test series consisted in 10-mm thin disks. It was used to determine the equilibrium water content at the tested relative humidity and the water retention function. To achieve this, SIMCO developed a model that relates mix characteristics, porosity (Table 11) and the water content at 50% RH to provide the water retention curve at a given temperature. In addition to drying at 50% RH, another series of 10-mm samples was placed in a 75%-chamber to provide a better estimation of the water retention function. This parameter is needed to estimate permeability. The other series consisted in 50-mm disks. This series provided the rate of drying and was directly used to estimate the intrinsic permeability. The 50-mm disks were coated with epoxy on the side to enforce 1D moisture transport, which simplifies the analysis. After conditioning, all samples were placed in a 50% relative humidity chamber, which started the drying process. The mass of all samples was monitored for the duration of the test. When equilibrium was reached for the 10-mm series, the test was terminated. The equilibrium water content value was calculated from the 10-mm series data and used to estimate the moisture retention function of the material. The experimental data for both mixtures after two years of curing are presented in the next figure to illustrate typical measurements. A complete report for each test is provided in Appendix B.
a) Vault 1/4 b) Vault 2
Figure 8 - Illustration of drying test results at 2 years, for a relative humidity of 50% Results from 10-mm samples are presented in Table 13. Note that at the time of writing this report, the drying duration for 2-years old samples was approximately 70 days. Figure 8 shows that 10-mm disks were not stable

CBP – Concrete mixture characterization
15 CBP-TR-2015-008, Rev. 0
yet. Accordingly, saturation degree at 50% relative humidity may be slightly overestimated. Those 10-mm disks will be kept in 50%-RH chamber for a future update of data presented in Table 13. Note however that disks in the 75%-RH chamber were stable after 70 days of drying.
Table 13 – Saturation degrees estimated from drying test analyses
Age of material Sample ID Vault 1/4 Vault 2 S(75%RH) S(50%RH) S(75%RH) S(50%RH)
3 months
1 0.83 0.62 0.87 0.65 2 0.85 0.63 0.88 0.66 3 0.84 0.63 0.88 0.65
Average 0.842 0.627 0.873 0.653
2 years
1 0.87 0.69 0.88 - 2 0.87 0.68 0.89 0.72 3 0.89 0.70 0.89 0.72 4 0.88 0.71 0.91 0.72 5 0.87 0.68 0.89 0.72 6 0.85 0.69 0.90 0.71 7 0.88 0.65 0.89 0.71 8 0.89 0.68 0.89 0.72 9 0.88 0.70 0.87 0.72
Average (SD)
0.874 (0.010)
0.687 (0.017)
0.889 (0.010)
0.718 (0.005)
Using saturation degree values presented in Table 13, it is possible to determine the moisture isotherm function (see Appendixes B). Using the Kelvin relationship presented below, it is also possible to substitute the relative humidity by the capillary pressure:
𝑝𝑐 = −𝜌𝑙𝑅𝑅𝑀𝑤
ln (𝑅𝐻)
where Mw is the molar mass of water, ρl is the density of liquid water, taken as 1000.0 kg/m3, R is the ideal gas constant and T is the temperature. Moisture retention functions expressed as relative humidity and capillary pressure are plotted in Figure 9.
Figure 9 - Moisture isotherm function at 3 months and 2 years, expressed as S(RH) and S(pc)

CBP – Concrete mixture characterization
CBP-TR-2015-008, Rev. 0 16
Equilibrium data at 50% and 75% RH were also used to evaluate the parameters of the Van Genuchten relationship, expressed as:
𝑆 = ��𝑝𝑐𝑎 �
11−𝑚 + 1�
−𝑚
where pc is the capillary pressure (MPa) and a (MPa) and m are the fitting parameters. Results are listed in Table 14.
Table 14 - Van Genuchten’s parameters4 deduced from moisture isotherm function
Mixture Age of material m (-) a (MPa)
Vault 1/4 3 months 0.386 56.03 2 years 0.369 66.14
Vault 2 3 months 0.423 68.98 2 years 0.357 72.00
The mass loss of the 50-mm series was analyzed with the moisture transport model STADIUM®-MTC developed by SIMCO Technologies to yield the intrinsic permeability. The module iteratively tries to find the permeability value that allows reproducing the measured mass loss curves. The analysis uses the porosity, moisture retention function and diffusion coefficient of the material as input data. Details on the analysis are provided in Appendix B. Results at 3 months and 2 years are presented in Table 15 for each sample.
Table 15 – Permeability estimated from drying test results
Age of material Sample ID Vault 1/4 [E-22 m2]
Vault 2 [E-22 m2]
3 months
1 1.45 1.02 2 1.22 0.86 3 1.13 1.24
Average 1.27 1.04
2 years
1 0.63 0.64 2 0.72 0.66 3 0.66 0.67 4 0.64 0.72 5 0.69 0.65 6 0.66 0.57 7 0.70 0.55 8 0.70 0.73
Average 0.68 0.65 (SD) (0.032) (0.064)
Similar to tortuosity results (Table 12), the intrinsic permeabilities for both mixtures are low and correspond to high-performance materials. It is observed that whereas Vault 2 mix showed much lower diffusive properties than Vault 1/4, drying test analyses indicated that both mixtures exhibit similar permeabilities. It can also be noted that the permeabilities tend to decrease with time, a consequence of the ongoing hydration process. 4 Van Genuchten’s parameters were evaluated using the Solver module in Microsoft Excel.

CBP – Concrete mixture characterization
17 CBP-TR-2015-008, Rev. 0
Finally, tests were performed on eight samples after 2 years of curing to provide information on the statistical distribution of permeability. The Q-Q plots shown in Figure 10 show that permeability values estimated from drying test analyses performed at two years follow a normal distribution. Coefficients of variation of 4.8% for Vault 1/4 and 9.8% for Vault 2 are obtained.
Vault 1/4
Vault 2
Figure 10 – Permeability data distribution after two years of curing

CBP – Concrete mixture characterization
CBP-TR-2015-008, Rev. 0 18
5.0 IMMERSION (PONDING) TEST The immersion test consists in placing concrete specimens in contact with a salt solution to measure the ingress rate of selected species after a certain exposure time. The ponding test provides information to validate the transport properties measured on concrete and can also provide insight on the chemical behavior of mixtures.
5.1. Immersion in NaCl reference solution After 28 days of wet curing, specimens for ponding tests were prepared. Full cylinders were cut in half. Both halves were coated with wax except for the cut surfaces. This geometry enforces 1D transport of species. The samples were then immersed in 20 liters of 0.5 M (3%) NaCl solution. The solution was renewed on a regular basis to maintain constant boundary conditions. Chloride profiles were measured after 3 months and 1 year of exposure. After each exposure duration, two samples per mix were pulled out of the testing solution and analyzed for chloride content. Samples were dry-milled from the exposed surface over 2-mm depth increments. The powder collected for each depth increment was dissolved in acid and analyzed for chloride content, in accordance with the ASTM 1152 test method. The profiles are expressed in %-mass chloride per mass of dry material. Results are shown in Figure 11 and Figure 12. The chloride penetration was limited for both materials, a consequence of the low diffusion coefficients. The Vault 2 concrete shows a slightly lower chloride ingress rate, which follows the diffusion coefficient results. But the most striking difference between mixes lies in the amount of chloride bound to the hydrated paste. In the profiles shown on Figure 11 and Figure 12, about 0.1% chloride per dry mass can be attributed to chloride in the pore solution near the exposed surface (depth = 0 mm). The remainder corresponds to bound chloride. After 3 months of exposure, the total amount of chloride near the exposed surface reached 0.6% for the Vault 1/4 concrete, while it is around 0.3% for the Vault 2 material. Since both mixtures were prepared with roughly the same amount of binder, the difference in chemical behavior is directly related to the chemistry of cements and supplementary cementitious admixtures used for mix preparation.

CBP – Concrete mixture characterization
19 CBP-TR-2015-008, Rev. 0
Figure 11 - Chloride profiles after 3 months and 1 year of immersion in 0.5 N NaCl solution for Vault 1/4 concrete
Figure 12 - Chloride profiles after 3 months and 1 year of immersion in 0.5 N NaCl solution for Vault 2
concrete

CBP – Concrete mixture characterization
CBP-TR-2015-008, Rev. 0 20
6.0 CONCLUSION The report summarizes the results of laboratory tests performed on two concrete mixtures to characterize their transport properties. Both materials were designed by SRNL and intended to be used as concrete barriers for low-level nuclear waste storage. Since long-term durability is a key aspect of their intended use, they incorporated supplementary cementitious materials and were prepared at a low water-to-binder ratio. The testing protocol consisted mainly in the following test procedures:
• Volume of permeable voids (porosity), in accordance with the ASTM C642 standard procedure: Standard Test Method for Density, Absorption and Voids in Hardened Concrete,
• Diffusion coefficients (tortuosity), on the basis of migration test results, which is a modified version of the ASTM C1202 procedure: Standard Test Method for Electrical Indication of Concrete’s Ability to Resist Chloride Ion Penetration,
• Water permeability, on the basis of drying test results, in accordance with ASTM WK37029: Measurement of Mass Loss Versus Time for One-Dimensional Drying of Saturated Concretes. Some of the results are not available as of February 2014 and will be presented later in an updated report.
The test protocol was applied after different curing period. Overall, both mixtures exhibited very low tortuosities and permeabilities, which reflected their low water-to-binder ratio and the use of supplementary cementitious materials. The test procedures were performed on approximately 10 samples on 2-year old materials. The data generated showed that porosity, tortuosity and permeability follow a normal distribution. Finally, chloride ponding tests were performed to confirm the difference in measured tortuosities. Chloride profiles emphasized significant differences in the ability to react with chloride, even though the mixtures were prepared at the same water-to-binder ratio and with approximately the same amount of binder.

CBP – Concrete mixture characterization
21 CBP-TR-2015-008, Rev. 0
7.0 REFERENCES Bolton D. (1980) The computation of equivalent potential temperature, Monthly Weather Review 108, 1046-1053.
Conciatori D., Grégoire E., Samson E. Marchand J., Chouinard L. (2014) Statistical analysis of concrete transport properties, Materials and Structures 47, 89-103.
Galbraith G.H., McLean R.C., Kelly D. (1997) Moisture permeability measurements under varying barometric pressure, Building Research and Information 25, 348-353.
Glasser F.P., Marchand J., Samson E. (2008) Durability of concrete – Degradation phenomena involving detrimental chemical reactions, Cement and Concrete Research 38, 226-246.
Marchand J., Samson E. (2009) Predicting the service-life of concrete structures – Limitations of simplified models, Cement and Concrete Composites 31, 515-521.
Millington R.J., Quirk J.P. (1961) Permeability of porous solids, Transactions of the Faraday Society 57, 1200-1207.
Papadakis V.G. (1999) Experimental investigation and theoretical modeling of silica fume activity in concrete, Cement and Concrete Research 29, 76-86.
Robinson R.A., Stokes R.H. (2002) Electrolyte solutions, 2nd ed., Dover Publications (New-York, USA).
Samson E., Marchand J. (2007a) Modeling the transport of ions in unsaturated cement-based materials, Computers and Structures 85, 1740-1756.
Samson E., Marchand J. (2007b) Modeling the effect of temperature on ionic transport in cementitious materials, Cement and Concrete Research 37, 455-468.
Samson E., Henocq P., Marchand J., Beauséjour P., “Recent advances in the determination of ionic diffusion coefficients using migration test results”, RILEM Proccedings 58-CONMOD 2008, E. Schlangen and G. de Schutter eds. (Delft, The Netherlands) (2008) pp. 65-78.
Samson E., Maleki K., Marchand J. and Zhang T, “Determination of the Water Diffusivity of Concrete using Drying/Absorption Test Results”, Journal of ASTM International, Vol. 5, No. 7 (2008b) (Available onling at www.astm.org)
Sercombe J., Vidal R., Gallé C., Adenot F. (2007) Experimental study of gas diffusion in cement paste, Cement and Concrete Research 37, 579-588.
Unified Facilities Guide Specifications (UFGS-03 31 29), February 2010.

CBP – Concrete mixture characterization
CBP-TR-2015-008, Rev. 0 22
APPENDIX A – MIGRATION TEST PROCEDURE Theoretical background The STADIUM® IDC laboratory module is used to analyze migration test results and estimate the diffusion coefficients of cementitious materials. It is based on the same mass transport model that powers the full version of STADIUM®. The mathematical model has been described in several publications (see for instance Samson 2007a, Samson 2007b). Development specific to the migration test analysis has been presented in (Samson 2008). This chapter summarizes the model and its application to migration test analysis. The model is based on a Sequential Non Iterative Algorithm (SNIA) that separately solves the transport equations and the chemical equilibrium relationships. The transport equations are discretized using the finite element (FE) method and solved simultaneously using a coupled algorithm. The calculation core begins a time step by solving the transport conservation equations without considering chemical reactions. When this step has converged, the chemical function analyzes each node of the FE mesh and makes sure that the pore solution concentrations and the mineral phases are in equilibrium. When this is completed, another time step starts. There are four main components to the transport conservation equations: ionic transport, electrodiffusion potential, moisture transport and temperature (energy) conservation. Since migration tests are performed in constant temperature and saturated conditions, terms associated moisture transport and temperature gradients are neglected from the test analysis. The species mass conservation equation is written as:
𝜌𝜕𝑐𝑖𝑏
𝜕𝑡+𝜕(𝜙𝑐𝑖)𝜕𝑡
− div�𝐷𝑖𝜙grad(𝑐𝑖) +𝐷𝑖𝑧𝑖𝐹𝜙𝑅𝑅
𝑐𝑖grad(𝜓) + 𝐷𝑖𝜙𝑐𝑖grad(ln𝛾𝑖)� = 0
where ci is the concentration of species i [mmol/L], ci
b is the amount bound as a result of physical interaction [mol/kg], φ is the porosity [m3/m3], ρ is the density of the material [kg/m3], Di is the diffusion coefficient [m2/s], zi is the valence number of the ionic species i, F is the Faraday constant [96488.46 C/mol], ψ is the electrodiffusion potential [V], R is the ideal gas constant [8.3145 J/mol/°K], T is the temperature [°K], and γi is the activity coefficient. One such equation must be solved for each ionic species considered. The activity coefficients in the model are evaluated on the basis of the Harvie, Moller and Weare (HMW) implementation of Pitzer’s ion interaction model. As mentioned previously, chemical reaction terms are absent from the transport equations because they are solved separately by the chemical module. However, terms are included in the previous equation to take into account the physical interaction between the paste and chloride due to double layer effects. The physical binding term was estimated from binding experiments performed on hydrated C3S pastes exposed to different chloride concentrations. This term is zero for all ionic species except chloride, for which ci
b is given by:
𝑐Cl𝑏 = 𝜉𝑝𝑐Cl
𝑢 where 𝜉 is a conversion factor involving the amount of C-S-H in the material that converts the isotherm estimated in units of [molCl/kgdry C3S] into [mol/kgmaterial], and p and u are fitting parameters. The binding experiments were performed at two different pH conditions: [OH–] = 40 mmol/L and 435 mmol/L. A linear interpolation between these two hydroxide concentrations allows estimating the physical binding at any pH. To balance the charges, a similar term but opposite in sign is applied to OH–.

CBP – Concrete mixture characterization
23 CBP-TR-2015-008, Rev. 0
The electrodiffusion term in the species conservation equation is primarily responsible for maintaining the electroneutrality in the pore solution. Its role is to balance individual ionic mobility so that there is no net accumulation of charge at any location in the pore solution. This term also accounts for the driving force induced by the external potential applied during the migration test. To solve the diffusion potential, the ionic transport equations are coupled to Poisson’s equation, which relates the potential in the material to the ionic profile distributions:
div�𝜏𝑠grad(𝜓)�+𝐹𝜀��𝑧𝑖𝑐𝑖
𝑁
𝑖=1
� = 0
where ε [6.9×10⁻¹⁰ C/V/m] is the permittivity of water, τs is the intrinsic tortuosity of the material and N is the number of ionic species in the pore solution. Chemical equilibrium calculations follow transport calculations to enforce the equilibrium between the pore solution and the solid matrix at each node of the FE mesh. This is achieved mainly by precipitating and/or dissolving minerals. It is assumed that the chemical reaction rates are faster than the transport rate, even under an externally applied potential. The validity of this assumption was emphasized in (Samson 2008)). The equilibrium of each phase is modeled according to:
𝐾𝑚 = �𝑐𝑖𝜈𝑚𝑚
𝑁
𝑖=1
𝛾𝑖𝜈𝑚𝑚 with 𝑚 = 1, … ,𝑀
where M is the number of solid phases, N is the number of ions, Km is the equilibrium constant (or solubility constant) of the solid m, ci is the concentration of the ionic species i [mmol/L], γi is its chemical activity coefficient, and νmi is the stoichiometric coefficient of the ith ionic species in the mth mineral. Similar to the transport equations, the chemical activity coefficients are calculated using Pitzer’s interaction model. If the solution is not in equilibrium with the paste, solid phases are either dissolved or precipitated to restore equilibrium. The pore solution is thus adjusted to enforce the equilibrium relationships of the mineral phases. After the pore solution concentrations are modified, the solid phases are also corrected according to:
𝑆𝑚𝑡 = 𝑆𝑚𝑡−1 −𝜙𝑋𝑚Γ𝑚
𝜌
where Sm is the amount of a given solid phase [g/kg of material], t indicates the time step, m is the molar mass of the solid m [g/mol], and Xm represent the amount of a given solid phase that has to dissolve to reach equilibrium [mol/m3]. The penetration of chlorides in concrete structures leads to the formation of a chloride-AFm solid compound called the Friedel’s salt (Glasser 2008), 3CaO.Al2O3.CaCl2.10H2O. During migration tests, chloride interacts with the paste even though the externally applied potential significantly increases the ionic velocity in the pore solution. In STADIUM®, Friedel’s salt is not considered a pure phase but rather forms solid solutions with AFm phases: monosulfate and iron-based C4FH13. The equilibrium relationship for the solid solution is given by:
𝐾𝑠𝑠 =(Cl)2
(𝐶𝑠𝑠)2/|𝑧|𝜒𝑠𝑠
𝜒Friedel𝑓𝑠𝑠

CBP – Concrete mixture characterization
CBP-TR-2015-008, Rev. 0 24
where Kss is the equilibrium constant of the solid solution, (Cl) is the activity of chloride in the pore solution [mmol/L], (Css) is the activity of the exchanging species in the AFm end-member [mmol/L], z is the valence number of this species, 𝜒 represents the mole fraction of the solids [mol/kg of material], and fss is a correction factor that accounts for the nonideality of the solid solution. The diffusion coefficients in the mass conservation equation are expressed as:
𝐷𝑖 = 𝜏𝑠𝐷𝑖𝑜 where 𝜏𝑠 is the intrinsic tortuosity of the material and 𝐷𝑖𝑜is the self-diffusion coefficient of species i [m2/s]. The self-diffusion coefficients are found in many textbooks and are constant. STADIUM® IDC performs iterations until it finds the tortuosity that allows reproducing the measured currents. The current I [A] are calculated in the model as the sum of the ionic fluxes:
𝐼 = 𝑆𝐹�𝑧𝑖𝑗𝑖
𝑁
𝑖=1
where 𝑗𝑖 [mol/m2/s] is the ionic flux of species i, and S [m2] is the surface of the sample. The expression for the flux is:
𝑗𝑖 = −𝐷𝑖𝜙grad(𝑐𝑖)−𝐷𝑖𝑧𝑖𝐹𝜙𝑅𝑅
𝑐𝑖grad(𝜓)−𝐷𝑖𝜙𝑐𝑖grad(ln𝛾𝑖) The next figure shows a typical result of IDC simulations:
Figure 13 - Simulation of migration test measurements 0.45 w/c OPC mixture,
ASTM Type I/II cement
0
10
20
30
40
50
60
0 100 200 300 400 500 600
Curr
ent (
mA)
Time (hours)
Minimum current value

CBP – Concrete mixture characterization
25 CBP-TR-2015-008, Rev. 0
STADIUM® IDC analysis reports TO BE ADDED IN THE FINAL VERSION OF THE REPORT.

CBP – Concrete mixture characterization
CBP-TR-2015-008, Rev. 0 26
Migration test detailed experimental procedure Scope This test evaluates the diffusion coefficient of ion species in cementitious materials. It is a modified version of the AASHTO T259 and ASTM C1202 Standard Test procedures. Summary of Test Method The test method consists in monitoring the intensity of electrical current passed through a cylindrical test specimen over a 10 to 15-day testing period. An appropriate DC potential is maintained constant across the specimen by an electrical power supply. The upstream cell is filled with a chloride-containing electrolytic solution and connected to the negative electrode, while the downstream cell is filled with a base solution and connected to the positive electrode. If desired, chloride ion penetration through the specimen can be monitored by periodically analyzing the chloride content in the downstream cell. Significance and use
• The ion diffusion coefficients are the main transport parameters. These coefficients must be evaluated and input into STADIUM® in order to perform a numerical simulation to estimate the service life of a concrete structure.
• The output data are the recorded current intensities during testing. This information is required to evaluate the ion diffusion coefficients.
Apparatus and test cells
• Migration cell assembly [See Section 1.10] • Constant voltage power supply – output: 0-30V DC; capacity: 0–2 A • Digital voltmeter: measures DC potential in the 12–24 V range and current intensity to 0.1 mA
accuracy in the 0–200 mA range and to 0.01 A accuracy in the 0.2–1 A range. • Electrically conductive wires to connect the power supply output to the electrodes through jacks
attached to the test cells. The electrical resistance of each wire should be less than 0.01 ohm. • Measuring probes inserted through small holes in the cells to measure potential difference across the
specimen. One end of the probe connects to the jack on the voltmeter. • Vacuum saturation apparatus (vacuum pump, container, pressure gauge, etc.) • Specimen sizing apparatus (rulers) • Balance (repeatability: 0.01g) • Funnel and containers (made of chemical-resistant material).
Reagents and materials
• Aqueous solution of 0.5M sodium chloride (NaCl) mixed with 0.3M sodium hydroxide (NaOH) [See Section 1.10]
• Aqueous solution of 0.3 M sodium hydroxide (NaOH) [See Section 1.10] • Sealant: waterproof silicon sealant is recommended. • Distilled or deionized water for solution preparation.
Test specimens Cylindrical specimens are required for the test. It is recommended to test at least two samples per concrete mixture. Specimens should be 96–102 mm (i.e., approximately 4 in.) in diameter. Concrete specimens should be 50 ± 2 mm (2 in.) thick. Mortar specimens should be 35–50 mm thick. Sample preparation and selection depend on the purpose of the test. Test specimens may be obtained from laboratory-cast cylinders or cores extracted from existing structures. All specimens should be properly identified prior to testing. A companion
CBP – Concrete mixture characterization
27 CBP-TR-2015-008, Rev. 0
sample is needed for porosity measurement according to ASTM C642 Standard Test Method. This supplementary test provides data for migration test analysis. For relevant results, these additional samples should have identical histories (curing, exposure conditions, and storage conditions) to the testing samples. Specimen Conditioning Test specimens should be vacuum saturated with 0.3M NaOH for approximately 18 hours following the procedure described in ASTM C1202. The saturation procedure is summarized as follows: immerse the specimens in the 0.3M NaOH solution contained in the vacuum container. Turn on the vacuum pump. When the pressure gauge shows maximum vacuum pressure (less than 1 mm Hg, or 133 Pa), keep the pump running for about 2 hours. With all valves closed, turn off the pump and maintain vacuum conditions for 18 hours. Open the air valve to release the pressure. Test Procedure
• Dry the surfaces of the vacuum-saturated specimens with a clean cotton cloth or soft tissue. • Measure the dimensions of each specimen. Diameter and thickness should be measured to a precision
of at least 0.1 mm or better. Each parameter is determined by the average of 2 measurements (minimum) at different positions. Weigh the surface-dried specimen to a precision of 0.1g.
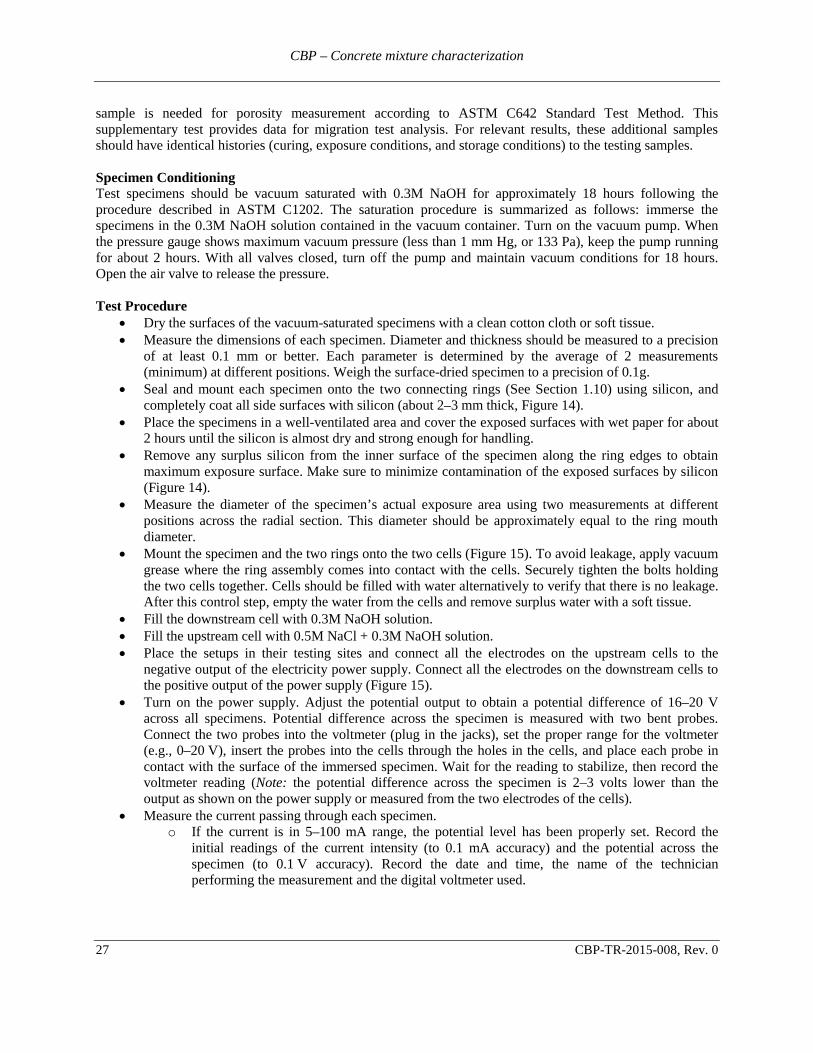
• Seal and mount each specimen onto the two connecting rings (See Section 1.10) using silicon, and completely coat all side surfaces with silicon (about 2–3 mm thick, Figure 14).
• Place the specimens in a well-ventilated area and cover the exposed surfaces with wet paper for about 2 hours until the silicon is almost dry and strong enough for handling.
• Remove any surplus silicon from the inner surface of the specimen along the ring edges to obtain maximum exposure surface. Make sure to minimize contamination of the exposed surfaces by silicon (Figure 14).
• Measure the diameter of the specimen’s actual exposure area using two measurements at different positions across the radial section. This diameter should be approximately equal to the ring mouth diameter.
• Mount the specimen and the two rings onto the two cells (Figure 15). To avoid leakage, apply vacuum grease where the ring assembly comes into contact with the cells. Securely tighten the bolts holding the two cells together. Cells should be filled with water alternatively to verify that there is no leakage. After this control step, empty the water from the cells and remove surplus water with a soft tissue.
• Fill the downstream cell with 0.3M NaOH solution. • Fill the upstream cell with 0.5M NaCl + 0.3M NaOH solution. • Place the setups in their testing sites and connect all the electrodes on the upstream cells to the
negative output of the electricity power supply. Connect all the electrodes on the downstream cells to the positive output of the power supply (Figure 15).
• Turn on the power supply. Adjust the potential output to obtain a potential difference of 16–20 V across all specimens. Potential difference across the specimen is measured with two bent probes. Connect the two probes into the voltmeter (plug in the jacks), set the proper range for the voltmeter (e.g., 0–20 V), insert the probes into the cells through the holes in the cells, and place each probe in contact with the surface of the immersed specimen. Wait for the reading to stabilize, then record the voltmeter reading (Note: the potential difference across the specimen is 2–3 volts lower than the output as shown on the power supply or measured from the two electrodes of the cells).
• Measure the current passing through each specimen. o If the current is in 5–100 mA range, the potential level has been properly set. Record the
initial readings of the current intensity (to 0.1 mA accuracy) and the potential across the specimen (to 0.1 V accuracy). Record the date and time, the name of the technician performing the measurement and the digital voltmeter used.

CBP – Concrete mixture characterization
CBP-TR-2015-008, Rev. 0 28
o If the current passing through the specimen is below 5 mA, increase the output potential up to a maximum of 30 V to obtain a current in the proper range.
o If the current is above 100 mA, decrease the potential output to bring the current down to the proper level (i.e., lower than 70 mA).
o If the initial current under a low potential (e.g., 6 V) is higher than 100 mA, the test should be performed for 7-day period only.
o A single power supply can run a set of tests if they share the same potential output. The maximum number of tests depends on the supply output power and total current intensity. When tests share the same power supply, set the supply current control to maximum range to ensure a sufficient power output under the desired constant potential. During testing, both current intensity passing through the specimen and the potential difference across the specimen might vary within a certain range, even though the electrical output remains stable and constant.
• During the first day of testing, take measurements of the current intensity passing through each specimen and the potential difference across each specimen at 0, and 4 hours of duration respectively. Record the time of each measurement.
• After the first day, take measurements of the current passing through each specimen and the potential difference across each specimen at 24-hour time intervals for 14 days. Record the time of each of these measurements.
Figure 14 - Test specimen sealed and mounted onto the two rings and coated with silicon

CBP – Concrete mixture characterization
29 CBP-TR-2015-008, Rev. 0
Figure 15 - Migration test setup
Report Report the following, if known:
• Information on the specimens: origin (e.g., mixture ID and curing age of the concrete), dimensions, mass before and after vacuum saturation, and effective test exposure area (diameter) for both upstream and downstream sides.
• Porosity test results for companion samples. • Experimental record sheet, including test specimen IDs, test conditions, date and time of each
measurement, all potential readings across specimens, and currents passed through specimens for the entire testing period.
• Any abnormal phenomena observed during testing, such as changes in solution color, solution precipitation, excessive gas evolution from the electrodes, unusual odors, accidents or problems concerning the electricity supply, etc.
Additional information Migration Cell Assembly
Cells The migration test cells consist of two symmetrical chambers made of polymer materials (e.g., methyl methacrylate). Each cell is equipped with an electrode (see below) and an external connector (jack). The volume of each cell should be approximately 3 liters. The mouth of the cell should fit the connecting ring (Figure 16). Connecting Rings Two connecting rings are required for the test setup. The ring should be made of polymer materials and designed to hold the specimen from one side and connected to the cell from the other side. The exposure area should be as large as possible. A typical design for a 4-in. cylindrical specimen is shown in Figure 16.

CBP – Concrete mixture characterization
CBP-TR-2015-008, Rev. 0 30
Figure 16 - Connecting ring for 4-in. specimen (96–103 mm)
Electrodes
A rod electrode is installed on each cell. Carbon electrodes should be avoided because they tend to decompose in the electrolytic solution under the application of a DC potential. Electrodes made of titanium or ruthenium oxide with titanium coating are recommended. Each electrode should be securely connected to the external connector by the jack (Figure 15).
Solution preparation The following procedure describes the preparation of the aqueous solutions:
• Accurately weigh the salt or base (e.g., NaCl or NaOH) of high purity (>99%) to at least 0.001 g accuracy (refer to Table 16).
• Completely dissolve the salt or base into a certain amount of distilled or deionized water. • Dilute with more distilled or deionized water to a final volume of desired range. • Thoroughly stir the solutions to obtain homogeneity.
Table 16 - Chemical composition of 1-liter (1000 ml) solutions
Salt /Base (purity: 99%) Upstream solution (salt): 0.5M NaCl + 0.3M NaOH
Downstream solution (base): 0.3M NaOH
NaOH (g/liter) 12.121 12.121 NaCl (g/liter) 29.515 0
∅ = 93 mm
∅ = 103 mm
∅ = 132.8 mm
12 mm 8 mm
Test specimen ∅ = diameter

CBP – Concrete mixture characterization
31 CBP-TR-2015-008, Rev. 0
APPENDIX B – DRYING TEST PROCEDURE Theoretical background The STADIUM® MTC laboratory module uses the moisture transport model in STADIUM® to analyze drying test results and evaluate the intrinsic permeability of the material as well as the moisture retention (desorption isotherm) function. The moisture transport equation combines the mass conservation of liquid and vapor phases in a single expression based on the relative humidity state variable. Since the drying test is performed in isothermal conditions, terms associated with temperature variations are not considered. The mass conservation equation is given by:
𝜕𝜕𝜕𝐻
𝜕𝐻𝜕𝑡
− div�𝐷𝑚𝑚grad(𝐻)� = 0 where H is the relative humidity [Pa/Pa], w is the water content [m3/m3] and the parameter DmH [m2/s] is the nonlinear transport coefficients. The nonlinear transport parameter DmH considers the contribution of liquid and vapor phases:
𝐷𝑚𝑚 =𝑘𝑠𝑘𝑟𝑙 𝜌𝑙𝑅𝜇𝑀𝑤
𝑅𝐻
+𝐷𝑣𝑜𝜏𝑠𝜏𝑟
𝑔𝑀𝑤𝑝𝑣𝑠
𝜌𝑙𝑅(𝜙 −𝜕)
𝑅
where φ is the porosity [m3/m3], ks is the intrinsic permeability [m2], kr
l is the relative liquid permeability [-], 𝜌𝑙 is the liquid water density [kg/m3], R is the ideal gas constant [J/mol/°K], 𝜇 is the dynamic viscosity of the liquid phase [Pa.s], Mw is the molar mass of water [kg/mol], Dv
o is the self-diffusion coefficient of water vapor [m2/s], 𝜏𝑠 is the intrinsic tortuosity [–], 𝜏𝑟
𝑔 is the relative tortuosity of the gas phase [–], and pvs is the saturation
vapor pressure [Pa]. Most of the parameters in the previous expression can be found in the literature:
• 𝑅: corresponds to the testing temperature. The drying tests are usually performed at 23 °C. • 𝑅: the ideal gas constant has a value of 8.3145 J/mol/°K. • 𝜌𝑙: data on density of water between 0 °C and 100 °C found in reference (Robinson 2002) were fitted
to a fourth-order polynomial and implemented in STADIUM®. • 𝜇: similar to density, data on viscosity of water between 0 °C and 100 °C (Robinson 2002) were fitted
to a nonlinear function and implemented in STADIUM®. • 𝑀𝑤: the molar mass of water is 0.018 kg/mol. • 𝐷𝑣𝑜: the self-diffusion coefficient is given by an empirical function depending on temperature and
ambient atmospheric pressure (Galbraith 1997). • 𝑝𝑣𝑠: the calculation of saturation vapor pressure is based on a relationship found in Bolton (1980).
The calculation of DmH also involves expressions for relative liquid permeability and relative gas tortuosity. The relationship for relative liquid permeability implemented in STADIUM® is based on a power function similar to the Millington and Quirk relationship (1961) used for ionic diffusivity. The relative gas tortuosity expression was derived on the basis of data found in the literature (Sercombe 2007). Some parameters are obtained from other testing procedures. This is true of porosity and tortuosity. Porosity is measured from the ASTM C642 test procedure. Tortuosity is measured on the basis of a migration test. This testing procedure is part of the STADIUM® Lab package. The final parameter needed for the analysis is the moisture isotherm function w=f(H), which characterizes the moisture equilibrium of the material. In STADIUM®, this relationship is expressed as:

CBP – Concrete mixture characterization
CBP-TR-2015-008, Rev. 0 32
𝜕 = 𝜙
𝛽𝜙(𝐻𝛿 − 1) + 1
where 𝛽 [–] and 𝛿 [–] are parameters that can be determined experimentally. Typical isotherm curves are shown in the next figure. In STADIUM® MTC, the parameter is estimated from the concrete mixture composition. The parameter is calculated directly from the mass loss data measured from the 10-mm series during the drying test.
a) Ordinary concrete, 0.5 w/c b) Ordinary concrete, 0.75 w/c
Figure 17 - Typical moisture isotherms The only unknown parameter in the moisture transport model is the permeability. STADIUM® MTC finds the permeability iteratively by solving the moisture transport equation until the model reproduces the measured mass loss of the 5-cm drying test series. The equation is discretized using the finite element method and an Euler implicit scheme for the transient term. The nonlinear system of equation resulting from the discretization is solved using Newton’s method. The calculations begin assuming initial saturation of the material (H=1.0). The boundary conditions are expressed as an exchange term:
𝑞 = ℎ𝑤(𝐻 −𝐻∞) where hw is the exchange coefficient [m/s] and H∞ is the relative humidity of the environment. The default value of hw is 5.0e-9 m/s and the relative humidity is 0.5 (50%), according to the drying test laboratory procedure. The value of hw corresponds to the exchange coefficient in a properly ventilated chamber. The mass loss curves are calculated from the relative humidity profiles. At selected time steps, the model first calculates the water content from the relative humidity using the water desorption isotherm. The water content profile is then integrated to obtain the mass loss:
∆𝑀|𝑡 = �� (𝜙 − 𝜕)𝑑𝑑𝐿
0� 𝑆
where Δ𝑀|t is the mass loss evaluated at time t [grams], L is the average thickness of the samples [cm], and S is the average exposed surface [cm2]. The next figures show examples of STADIUM® MTC simulations.
0
0.02
0.04
0.06
0.08
0.1
0.12
0.14
0.0 0.2 0.4 0.6 0.8 1.0
Relative Humidity (1)
Wat
er c
onte
nt (m
3/m
3)
Desorption data
Model
Fitting parameters:β : -55.015δ : 0.2877
0
0.02
0.04
0.06
0.08
0.1
0.12
0.14
0.0 0.2 0.4 0.6 0.8 1.0
Relative Humidity (1)W
ater
con
tent
(m3/
m3)
Desorption data
Model
Fitting parameters:β : -25.174δ : 1.9047

CBP – Concrete mixture characterization
33 CBP-TR-2015-008, Rev. 0
Figure 18 - STADIUM® MTC simulation of OPC mixture (Type V cement, 0.45 w/c)
Figure 19 - STADIUM® MTC simulation of mixture with silica fume
0
2
4
6
8
10
12
14
16
18
0 20 40 60 80
Mas
s los
s (g)
Time (days)
5cm-15cm-25cm-3Simulation
0
2
4
6
8
10
12
14
16
0 50 100 150 200
Mas
s los
s (g)
Time (days)
5cm-1
5cm-2
5cm-3
Simulation

CBP – Concrete mixture characterization
CBP-TR-2015-008, Rev. 0 34
STADIUM® MTC analysis reports
TO BE ADDED IN THE FINAL VERSION OF THE REPORT.

CBP – Concrete mixture characterization
35 CBP-TR-2015-008, Rev. 0
Drying test detailed experimental procedure Scope This test determines the drying rate of Portland cement concrete by measuring the mass loss due to evaporation and moisture transport in specimens exposed to constant temperature and relative humidity. Significance and Use Drying behavior reflects the mass transport properties of concrete (e.g., permeability) to a certain extent, and depends on a number of factors such as concrete mixture proportions, presence of chemical admixtures and supplementary cementitious materials, composition and physical characteristics of the aggregates and cementitious materials, curing conditions, degree of hydration, presence of microcracking, and surface treatments such as sealers and membranes. Drying behavior is also strongly affected by the moisture condition of the concrete as well as environmental conditions such as temperature, relative humidity, and air flow rate. Apparatus Drying chamber: The test must be performed in a temperature and humidity controlled chamber with
temperature maintained constant at 23±2°C and relative humidity at 50±4%. The chamber should have proper support (e.g., a shelf) inside to allow airflow around each specimen. The chamber should be sufficiently spacious to hold all the test specimens. The chamber should be well ventilated, with airflow rate according to ASTM C157: 5.4 (Standard specifications for drying chamber).5
Hygrometer: During testing, 2–3 hygrometers should be placed near the specimens to monitor local relative humidity. Digital hygrometers are recommended.
Absorbent tissues: at least two. Tissues should be at least 35cm × 35cm in size. Balance: The balance for weighing the specimens should have a capacity of ≥ 1500g and a
repeatability of ≤ 0.01g. It should be mounted on a proper support (Figure 20) in the laboratory. Device for weighing specimens in water: The device should allow the operator to conveniently weigh
the specimens in water using the same balance (Figure 20). Sealing and Coating Materials Epoxy: Various brands of commercial epoxy may be used provided it has excellent coherence with
concrete and is completely impermeable. In some cases, wax may also be used as sealing material.
5 A walk-in chamber is always preferable, so that the balance can be installed inside and maintained in uniform conditions.

CBP – Concrete mixture characterization
CBP-TR-2015-008, Rev. 0 36
Figure 20 - Balance and device for weighing specimen in air and water
Test Specimens Three cylindrical specimens 10 ± 1 mm in length and three specimens 50 ± 2 mm in length should be
prepared for each tested material. Test specimens may be cut from either laboratory-made cylinders or cores extracted from field structures.
When testing laboratory-made concrete, the concrete should be cured in saturated conditions (e.g., in limewater or a 100% R.H. moist chamber) for at least 28 days, and the diameter of the cast cylindrical specimens should be at least 100 mm (4 inches). Prepare test specimens according to the following procedure: o One week prior to testing, cut test specimens as described in 1.5 from the middle portion of the
cylinders (Figure 21).Take the dimension of each test specimen to the nearest 0.1 mm (three length measurements and three diameter measurements).Weigh each specimen in air (Note: when weighing a wet specimen, dry the surface with cloth or tissue before putting it on the balance) and in water, respectively using the balance and the device, as described in 1.4 and 1.5 and shown in Figure 20. Coat and seal the side (round) surface of each specimen with impermeable material, as described in Section 1.4, leaving the two end-surfaces uncoated to act as exposed surfaces (Figure 22) (Note: before applying coating material, thoroughly dry the surface of the specimen by rapid blowing with compressed air).Once the coating and sealing layer has dried and hardened, place the specimens in limewater until testing.
When testing field concrete, cores with a diameter of at least 100 mm (4 inches) should be extracted from the structure. Once the cores are received at the laboratory, do the following: o Photograph the cores. Cut test specimens from the cores, as described in 1.5 (Note: the test
specimen may or may not contain the exposed surface of the structure, depending on the requirement).Take the dimensions of each test specimen to the nearest 0.1 mm (two measurements of thickness and two measurements of diameter).Immerse the specimens in limewater for one week, then weigh each specimen in air (see Note for 1.5) and in waterCoat and seal the side (round) surface of each specimen with impermeable material, as described in Section 4 (see Figure 22).Once the coating and sealing layer has dried and hardened, weigh the specimens, then immerse them in limewater for 7 days and weigh them again. If the weight determined after immersion for the same specimen shows >0.5% variation from the previous mass of the specimen, re-immerse it in limewater for another 7 days and weigh it again. Once the weight determined after the additional 7 days’ immersion shows <0.5% variation from the previous mass of the specimen, the specimen is ready for testing. For the drying test, it is very

CBP – Concrete mixture characterization
37 CBP-TR-2015-008, Rev. 0
important that the test be started when the samples are fully saturated. All mass should be taken in a SSD state.
In both cases, the test specimens should be kept in limewater before beginning the drying test. Porosity and ion diffusion coefficient must be determined in order to analyze the drying test results.
Figure 21 - Preparation of test specimens from the middle portion of laboratory cast concrete cylinders
of 4 in (100mm) in diameter Procedure Remove the surface water from the saturated test specimens (with sealed side surfaces) using moist
tissue. Place the specimens near the balance. Protect the surfaces of specimens with moist tissue to prevent them from drying.
Take the initial masses by weighing them on the balance one at a time (Figure 20). Each weighing should last no longer than 30 seconds. After each weighing, protect the specimen with the moist tissue to prevent it from drying.
When the initial masses of all the specimens have been taken, transfer all the specimens at the same time to the drying chamber. Place them on the appropriate supports (Figure 22 or Figure 23). Record the time and date on the work sheet, and the drying test begins.

CBP – Concrete mixture characterization
CBP-TR-2015-008, Rev. 0 38
Figure 22 - Case 1: the specimen is placed on a shelf in the drying chamber
Figure 23 - Case 2: the specimen is placed on a support in the drying chamber
Monitor the weight change of the specimens by periodically weighing them in the same place in the
laboratory and using the same balance, according to the following schedule (Note: each weighing of all six specimens should be completed within five (5) minutes): o Week 1: one (1) measurement (including initial weighing) per day, with a time interval of 24±2
hoursWeek 2: three (3) measurements per week, with a time interval of 48±2 hours.After week 2: one (1) measurement per week, with a time interval of 7±1 days.
Stop the drying test when constant mass is observed for the 10-mm thick specimens. The constant mass is defined as four successive mass measurements that show less than ±0.5% variation from the previous measurement:
( ) 5.0100 1 <
−× −
i
ii
mmm
where mi is the current measurement and mi-1 is the previous one. Report Data on the specimens: (1) age of hydration; (2) date when the specimens were extracted; (3) dimensions
of each specimen; (4) weights of each specimen before coating, taken in air and water Concrete mixture or material reference number and all other relevant information (cement type, cure
duration, w/c ratio, etc.). Porosity tested according to ASTM C642 whenever possible. Ion Migration Coefficient (modified ASTM C1202). Completed experimental records: mass determinations over the entire test period. Cumulative mass losses plotted against testing time (Figure 24).

CBP – Concrete mixture characterization
39 CBP-TR-2015-008, Rev. 0
Figure 24 - Mass loss in specimens during drying test
0.00
2.00
4.00
6.00
8.00
10.00
12.00
14.00
0 20 40 60 80 100 120 140
Duration (days)
Cum
ulat
ive
mas
s lo
ss (g
)
1cm-11cm-21cm-35cm-15cm-25cm-3

CBP – Concrete mixture characterization
CBP-TR-2015-008, Rev. 0 40
APPENDIX C – DESCRIPTION OF STADIUM® STADIUM® is a numerical model dedicated to the prediction of chloride and other contaminants in cementitious materials. Contrary, to the first generation of chloride penetration models, such as Life-365TM and DuramodelTM, STADIUM® is based on the most recent developments in ionic transport modeling and numerical solutions. Its finite-element calculation core can model the ingress of chloride and other species under different types of environmental conditions. The model also considers the complex interactions between the contaminants penetrating the porous network of concrete and the hydrated phases of the cement paste. As such, STADIUM® offers the possibility to take into account the chemical composition of local cements and supplementing admixtures such as silica fume and fly ash. The model also considers the impact of temperature and moisture content variations in materials on the rate of chloride ingress. It is thus possible to provide STADIUM® with time-dependent environmental conditions and to simulate the effect of wetting and drying cycles on the chloride penetration rate. Pre-defined scenarios also allow engineers to simulate various marine environments such as submerged zone, tidal zone, splash zone and airborne exposure. This precise description of the environmental conditions provides a better estimation of the extent of chloride ingress in a structure during its service-life. In order to feed STADIUM® with adequate material parameters, a series of experimental methods were developed based on already existing standard procedures. These methods allow evaluating the quality of concretes and can assess the influence of various types of cements and admixtures and also consider the mixture proportions of materials. The model is based on a sequential split operator approach that separates ionic movement and chemical reactions. The global structure of STADIUM® is illustrated on Figure 25.
Figure 25 - General structure of STADIUM®
Ionic transport is described by the extended Nernst-Planck equation applied to unsaturated media. This equation accounts for the electrical coupling between ionic species, chemical activity, transport due to water content gradient, and temperature effects:

CBP – Concrete mixture characterization
41 CBP-TR-2015-008, Rev. 0
𝜌𝜕𝑐𝑖𝑏
𝜕𝑡+𝜕(𝜕𝑐𝑖)𝜕𝑡
− 𝑑𝑑𝑑 �𝐷𝑖𝜕grad(𝑐𝑖) +𝐷𝑖𝑧𝑖𝐹𝑅𝑅
𝜕𝑐𝑖grad(𝜓) + 𝐷𝑖𝜕𝑐𝑖grad(ln𝛾𝑖) +
𝐷𝑖𝑐𝑖 ln(𝛾𝑖𝑐𝑖)𝑅
𝜕grad(𝑅) + 𝑐𝑖𝐷𝑤grad(𝜕)� = 0
where ci is the concentration, w is the water content, Di is the diffusion coefficient, zi is the valence number of the ionic species i, F is the Faraday constant, ψ is the electrodiffusion potential, R is the ideal gas constant, T is the temperature, γi is the activity coefficient, and Dw is the water diffusivity. The main ionic species considered are: OH-, Na+, K+, SO4
2-, Ca2+, Al(OH)4-, Mg2+, and Cl-. Other species can be added depending on the
modeling cases considered. The chemical activity coefficients are calculated on the basis of the Pitzer ion interaction model. The diffusion coefficient depends on the temperature and the saturation level in the pores. It also depends on the chemical reactions that can locally modify the porosity following dissolution or precipitation of minerals. It is also affected by hydration. The ionic transport equation is coupled to Poisson’s equation, which enforces the electroneutrality in the pore solution of the material by creating a weak electric potential that affects the flux of ionic species:
div�𝜏𝑠𝜕grad(𝜓)�+𝐹𝜀𝜕 ��𝑧𝑖𝑐𝑖
𝑁
𝑖=1
� = 0
where s is the material’s tortuosity, ε is the medium permittivity and N is the number of ions in the pore solution. To account for water flow in the presence of water content gradients in unsaturated materials, the previous equations are coupled to a moisture transport model based on the relative humidity state variable:
𝜕𝜕𝜕𝐻
𝜕𝐻𝜕𝑡
+𝜕𝜕𝜕𝑅
𝜕𝑅𝜕𝑡
− div�𝐷𝑚𝑚grad(𝐻) + 𝐷𝑚𝑚grad(𝑅)� = 0 where H is the relative humidity, and DmH and DmT are the nonlinear moisture transport parameters. They depend on the permeability and relative permeability of the material, the density and viscosity of the fluid, the saturated vapor pressure, and the temperature. This diffusion-type equation gives the distribution of humidity within the material. The effect of water flow on ionic movement is modeled by adding an advection term to the extended Nernst-Planck equation. It is thus possible to model structures exposed to wetting and drying cycles using the time-dependent boundary condition capabilities of the model. Finally, the temperature distribution in the material is calculated from the classical heat condition equation:
𝜌𝐶𝑝𝜕𝑅𝜕𝑡
− div�𝑘grad(𝑅)� = 0 where ρ is the density of the material, Cp is the specific heat of the material, and k is the heat conductivity. This system of nonlinear equations is solved using a numerical algorithm with all equations solved simultaneously. The spatial discretization of this coupled system of equations is based on the finite element method. An Euler implicit scheme is used to discretize the time-dependent part of the model. The nonlinear set of equations is solved with the Newton-Raphson algorithm. This second-order algorithm gives a good convergence rate and is robust enough to handle the electrical coupling between the ionic species as well as the non-linearity coupling between the ionic flux and water movement. Chemical equilibrium calculations follow transport calculations to enforce the equilibrium between the pore solution and the solid matrix at each node of the FE mesh. This is achieved mainly by precipitating and/or

CBP – Concrete mixture characterization
CBP-TR-2015-008, Rev. 0 42
dissolving minerals. It is assumed that the chemical reaction rates are faster than the transport rate, even under an externally applied potential. The validity of this assumption was emphasized in (Samson 2008)). The equilibrium of each phase is modeled according to:
𝐾𝑚 = �𝑐𝑖𝜈𝑚𝑚
𝑁
𝑖=1
𝛾𝑖𝜈𝑚𝑚 with 𝑚 = 1, … ,𝑀
where M is the number of solid phases, N is the number of ions, Km is the equilibrium constant (or solubility constant) of the solid m, ci is the concentration of the ionic species i, γi is its chemical activity coefficient, and νmi is the stoichiometric coefficient of the ith ionic species in the mth mineral. Similar to the transport equations, the chemical activity coefficients are calculated using Pitzer’s interaction model. If the solution is not in equilibrium with the paste, solid phases are either dissolved or precipitated to restore equilibrium. The pore solution is thus adjusted to enforce the equilibrium relationships of the mineral phases. After the pore solution concentrations are modified, the solid phases are also corrected according to:
𝑆𝑚𝑡 = 𝑆𝑚𝑡−1 −𝜙𝑋𝑚Γ𝑚
𝜌
where Sm is the amount of a given solid phase, t indicates the time step, m is the molar mass of the solid m, and Xm represent the amount of a given solid phase that has to dissolve to reach equilibrium. The penetration of chlorides in concrete structures leads to the formation of a chloride-AFm solid compound called the Friedel’s salt (Glasser 2008), 3CaO.Al2O3.CaCl2.10H2O. During migration tests, chloride interacts with the paste even though the externally applied potential significantly increases the ionic velocity in the pore solution. In STADIUM®, Friedel’s salt is not considered a pure phase but rather forms solid solutions with AFm phases: monosulfate and iron-based C4FH13. The equilibrium relationship for the solid solution is given by:
𝐾𝑠𝑠 =(Cl)2
(𝐶𝑠𝑠)2/|𝑧|𝜒𝑠𝑠
𝜒Friedel𝑓𝑠𝑠
where Kss is the equilibrium constant of the solid solution, (Cl) is the activity of chloride in the pore solution, (Css) is the activity of the exchanging species in the AFm end-member, z is the valence number of this species, 𝜒 represents the mole fraction of the solids, and fss is a correction factor that accounts for the nonideality of the solid solution. As shown on Figure 25, the transport and chemical equations are solved sequentially over a time duration specified by the user. At the end of a calculation, the model provides the spatial distribution of the ionic species and the mineral phases in the hydrated cement paste at different time intervals. The model also provides the total chloride content in the material, also at different time intervals. This information can be used to estimate the time to initiate corrosion depending on the cover thickness and the type of steel in the structure.

ENERGYU.S. DEPARTMENT OF
National Institute ofStandards and Technology
National Institute ofStandards and Technology