continuous membrane emulsi cation with pulsed (oscillatory) …emulsi cation with pulsed...
TRANSCRIPT

Loughborough UniversityInstitutional Repository
Continuous membraneemulsi�cation with pulsed
(oscillatory) �ow
This item was submitted to Loughborough University's Institutional Repositoryby the/an author.
Citation: HOLDICH, R.G. ... et al., 2013. Continuous membrane emulsi-�cation with pulsed (oscillatory) �ow. Industrial and Engineering ChemistryResearch, 52 (1), pp. 507 - 515.
Additional Information:
• This document is the Accepted Manuscript version of a Published Workthat appeared in �nal form in Industrial and Engineering Chemistry Re-search, copyright c© American Chemical Society after peer review andtechnical editing by the publisher. To access the �nal edited and pub-lished work see: http://dx.doi.org/10.1021/ie3020457
Metadata Record: https://dspace.lboro.ac.uk/2134/14664
Version: Accepted for publication
Publisher: c© American Chemical Society
Please cite the published version.

This item was submitted to Loughborough’s Institutional Repository (https://dspace.lboro.ac.uk/) by the author and is made available under the
following Creative Commons Licence conditions.
For the full text of this licence, please go to: http://creativecommons.org/licenses/by-nc-nd/2.5/

1
Continuous membrane emulsification with pulsed (oscillatory) flow
Richard G. Holdich1*, Marijana Dragosavac1, Goran T. Vladisavljević1, and
Emma Piacentini2 1Department of Chemical Engineering, Loughborough University,
Leicestershire, LE11 3TU, U.K. 2Institute on Membrane Technology, Via P. Bucci 17/C, 87036 Rende (CS), Italy.
Abstract
Tubular micron pore sized sieve type membranes with internal diameter of 14 mm and length
of 60 mm containing uniform pores of diameter 10 and 20 µm were used to generate
emulsions of sunflower oil dispersed in water and stabilised by Tween 20 using oscillatory
flow of the continuous phase. Drop diameters between 30 and 300 µm could be produced, in
a controllable way and with span values of down to 0.4. By using pulsed flow it was possible
to provide dispersed phase concentrations of up to 45% v/v in a single pass over the
membrane, i.e. without the need to recirculate the continuous phase through the membrane
tube. It was possible to correlate the drop size produced with the shear conditions at the
membrane surface using the wave shear stress equation. The oscillatory Reynolds number
indicated flow varying from laminar to substantially turbulent, but the change in flow
conditions did not show a notable influence on the drop diameters produced, over what is
predicted by the varying wall shear stress applied to the wave equation. However, the 20 µm
pore sized sieve type membrane appeared to allow the passage of the pressure pulse through
the membrane pores, under certain operating conditions, which did lead to finer drop sizes
produced than would be predicted. These through-membrane pulsations could be suppressed
by changes in operating conditions: a higher dispersed phase injection rate or more viscous
continuous phase, and they did not occur under similar operating conditions used with the 10

2
µm pore sized sieve type of membrane. Generating emulsions of this size using pulsed
continuous phase flow provides opportunities for combining drop generation at high
dispersed phase concentration, by membrane emulsification, with downstream processing
such as reaction in plug flow reactors.
keywords
emulsification, sieve-membrane, force balance, oscillation, Reynolds number
*corresponding author’s address:
Professor Richard Holdich, Department of Chemical Engineering, Loughborough University,
Loughborough, Leicestershire, LE11 3TU, UK. Tel: +44 1509 222519, Fax: +44 1509
223923, e-mail: [email protected]

3
Introduction
Membrane emulsification (ME) is a process of forming an emulsion by injecting a liquid
(dispersed phase), or preliminary emulsified mixture of two immiscible liquids, through a
microporous membrane into the continuous phase1. In direct (“bottom-up”) ME processes,
fine droplets of dispersed phase are produced by injecting a single phase through the
membrane whereas in a pre-mix (“top-down”) ME process, fine droplets are produced by
passing a pre-mix through the membrane. At low production rates, droplets can be formed in
the absence of any shear force on the membrane surface, solely by the action of interfacial
tension2. At small inter-pore distances, relative to the droplet diameter, the “push-off” force
results from droplet deformation on the membrane surface, assisting in droplet detachment3.
In order to obtain reasonably uniform droplets at commercially significant throughputs, shear
stress is maintained at the membrane/continuous phase interface, usually by providing cross-
flow4 or stirring5. To further increase droplet throughput in cross-flow ME, the continuous
phase may be introduced into the membrane tube radially, thereby forming spiral streamlines
in the axial direction (“swirl flow”), and these may exert a strong centrifugal force on the
inner surface of the membrane6. Using swirl-flow ME with a Shirasu Porous Glass (SPG)
membrane, it was possible to achieve a high transmembrane flux of 3 m3 m-2 h-1 resulting in a
dispersed phase volume of 40% in a single pass, but at the expense of high shear stress at the
membrane surface.
ME is often used for production of multiple emulsions7 and fragile particles, such as
core/shell capsules8,9. In order to prevent breakage of shear sensitive materials, it is highly
desirable to maintain low shear conditions in the bulk of the product stream, although shear
4
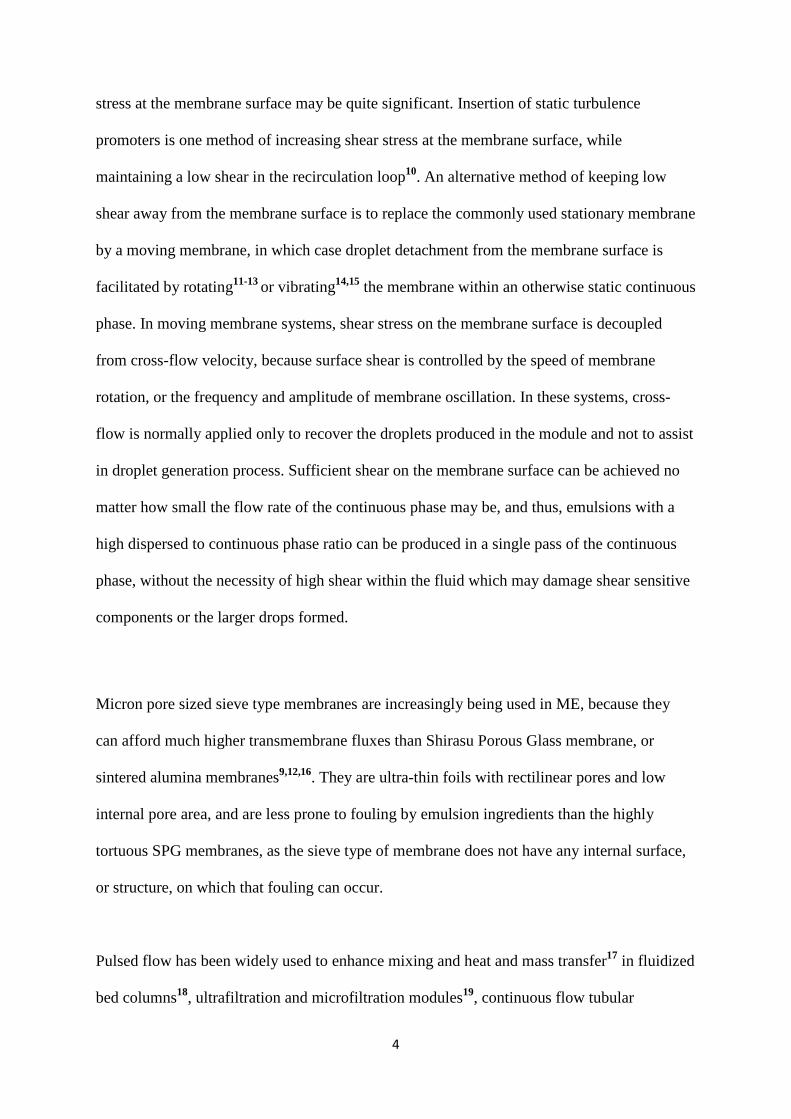
stress at the membrane surface may be quite significant. Insertion of static turbulence
promoters is one method of increasing shear stress at the membrane surface, while
maintaining a low shear in the recirculation loop10. An alternative method of keeping low
shear away from the membrane surface is to replace the commonly used stationary membrane
by a moving membrane, in which case droplet detachment from the membrane surface is
facilitated by rotating11-13 or vibrating14,15 the membrane within an otherwise static continuous
phase. In moving membrane systems, shear stress on the membrane surface is decoupled
from cross-flow velocity, because surface shear is controlled by the speed of membrane
rotation, or the frequency and amplitude of membrane oscillation. In these systems, cross-
flow is normally applied only to recover the droplets produced in the module and not to assist
in droplet generation process. Sufficient shear on the membrane surface can be achieved no
matter how small the flow rate of the continuous phase may be, and thus, emulsions with a
high dispersed to continuous phase ratio can be produced in a single pass of the continuous
phase, without the necessity of high shear within the fluid which may damage shear sensitive
components or the larger drops formed.
Micron pore sized sieve type membranes are increasingly being used in ME, because they
can afford much higher transmembrane fluxes than Shirasu Porous Glass membrane, or
sintered alumina membranes9,12,16. They are ultra-thin foils with rectilinear pores and low
internal pore area, and are less prone to fouling by emulsion ingredients than the highly
tortuous SPG membranes, as the sieve type of membrane does not have any internal surface,
or structure, on which that fouling can occur.
Pulsed flow has been widely used to enhance mixing and heat and mass transfer17 in fluidized
bed columns18, ultrafiltration and microfiltration modules19, continuous flow tubular

5
reactors20, solvent extraction columns21, adsorption columns22, etc. However, there has been
no work published on using pulsed (oscillatory) flow in membrane emulsification. Pulsed
flow ME is an alternative method of producing emulsions with a high dispersed to continuous
phase ratio continuously in a single-pass operation of the continuous phase. The potential
benefits of pulsed flow over vibrating ME are: (i) pulsed flow ME requires less energy than
vibrating ME; (ii) pulsed flow ME does not require a special module design, i.e. conventional
tubular cross flow membranes can be used in pulsed flow mode; (iii) the consumption of
energy to maintain pulsed flow is virtually independent of the membrane area, whereas in a
vibrating ME system the energy consumption is higher for larger membrane surface area, and
(iv) pulsed flow in the continuous phase can be extended to a baffled reactor, connected in
series to the membrane module, to achieve simultaneous drop generation and
chemical/physicochemical reaction in the produced emulsion. Pulsed flow is being used to
convert batch processes, e.g. reactions, to continuous ones and there has been work published
previously on the desire to produce polymer particles continuously based on membrane
emulsification23, but based on cross-flow emulsification rather than generation using
oscillation of the liquid flow field.
However, obtaining an accurate description of the fluid mechanics of the oscillatory flow
next to the surface of the membrane is not as simple as in the shear flow that results from
cross-flow operation. Such a description is warranted for the purposes of modelling and
understanding the droplet generation process, and previous work15,16,24 successfully modelled
the drop generation process when the flow field next to the membrane surface could be
defined. Under such circumstances a simple shear – capillary force balance model can be
deduced, relating the drop diameter (x) to the prevailing shear stress (τ):

6
τ
γτττ
3
481218 2224422ppp rrr
x++
= (1)
where rp is the pore radius and γ is the interfacial tension. Under conditions when the shear is
consistent the shear to use in equation (1) is that value of consistent shear stress. However
under conditions of variable shear, such as during oscillation of the membrane, it has been
found that the most appropriate shear to use is the maximum value; provided that there is at
least one maximum peak shear “event” per drop that is generated15. A peak shear event
occurs twice per oscillation: once in each direction that the wave is moving, for a regular
wave form such as a sine wave. Equation (1) suggests that the drop size is independent of the
dispersed phase injection rate, which is true only for a limited range of what is called the
“dripping” regime: this exists where the drops are sheared off the membrane surface rapidly
and there is negligible inertial contribution from the dispersed phase to the drop size, only
viscous drag and capillary forces are relevant. On increasing the dispersed phase injection
rate single drops may still be detached from the membrane surface; i.e. the dripping regime,
but the drop size may increase slightly. On increasing the dispersed phase flow rate further it
is possible to change from the dripping regime into the jetting regime: when a jet of liquid
discharges from a pore and the droplets are formed by jet breakup in the prevailing conditions
of the continuous phase as well as the dispersed phase.
Another factor that may increase the drop size with increasing dispersed phase injection rate
is the ‘dynamic’ interfacial tension effect. Techniques to measure interfacial tension provide
the equilibrium value, but a newly formed drop emerging from a membrane pore has a
growing surface and finite time is required for the stabilising surfactant to transfer and attach
to the newly formed surface. Hence, this dynamic interfacial tension will be greater than the
measured equilibrium value as the surfactant concentration at the two liquid phase boundary

7
will be less than that found when measuring under equilibrium conditions. A greater
interfacial tension will provide larger drops, as indicated by equation (1). When using small
molecular surfactants to stabilise larger drops, in the order of over 20 microns, the influence
of dynamic interfacial tension is not normally considered significant25.
In pulsed, or oscillatory, flow the continuous phase velocity will vary up to a maximum, slow
and then reverse in direction. This will give rise to varying shear and varying ratio of inertial
to viscous forces within the fluid. The oscillatory Reynolds number based on the peak
velocity is given by:
µρπ dfa2Re0 = (2)
where f is the frequency of oscillation, a is the amplitude, ρ is the liquid density, d is the
internal tube diameter and µ is the liquid viscosity. Hence as the velocity is varying, during
oscillatory flow it is possible for the flow to vary from turbulent to laminar, and back again,
within one cycle of the pulsation. The commonly used boundaries to distinguish the different
flows are provided in Table 126. In the case of oscillatory baffled systems, it is generally
desirable to operate in a region of oscillatory Reynolds number up to 30017, in the laminar
and disturbed laminar regime, to ensure consistency of operation. However, operating
conditions in the more turbulent regions are readily obtained in aqueous systems when
aiming to produce smaller drops, significantly less than 100 µm. Hence, this study
investigated the ability to control the drop size being produced under varying flow conditions
from laminar to significantly turbulent oscillatory Reynolds numbers.
There have been numerous investigations of the Stokes boundary layer in oscillatory flow26,
applicable when in the turbulent regime. It is within this boundary layer that the drops will be

8
generated during membrane emulsification, when operating at relatively high oscillatory
Reynolds number. The Stokes boundary layer thickness (δ) is given by:
ρπµπδf
2= (3)
So, in water systems using a frequency of 10 and 50 Hz the Stokes boundary layer
thicknesses would be expected to be 1100 to 500 microns. Superficially, if generating drops
significantly with diameters below these values may lead to the conclusion that the drops will
be produced in a quiescent boundary layer and the bulk turbulence is not important, provided
it is not sufficient to damage the drops after they have been formed. However, the occurrence
of increasing amounts of “turbulent bursts” with increasing Reynolds number is also
recorded26; these are turbulent eddies that originate at the wall of the pipe, i.e. the membrane
surface, that are then ejected into the bulk flow of the continuous phase. Clearly, these
turbulent eddies are likely to have an influence on the drop size of the emerging dispersed
phase from the membrane pore and the presence of a growing surface at the tube wall would
be expected to encourage this type of eddy formation in the continuous phase.
If the occurrence of turbulence and bursts near the membrane surface can be neglected, then
it may be possible to correlate drop size with the shear stress at the membrane surface based
on the wave equation for shear stress:
[ ])cos()sin(2
2/1
ttv fff
o ωωµρω
τ −
= (4)
where ωf is the angular frequency, determined by:
ff πω 2= (5)
where f is the frequency of the oscillation and vo, is the peak velocity related to both the
angular frequency and the amplitude (a) of oscillation by the equation:

9
av fo ω= (6)
A peak shear event occurs when the value of wall shear provided by equation (4) is at a
maximum:
2/12/32/12/3max )()(2)2/( µρπµρωτ faaf == (7)
The maximum shear occurs twice per cycle, and it is the maximum shear that is used in
equation (1) for drop size.
The aim of the work reported here was to investigate drop generation in a novel ME system
with pulsed (oscillatory) flow of the continuous phase in a tubular micron pore sized sieve
type of membrane. The main emphasis was to investigate the effect of amplitude and
frequency of flow oscillation (or pulsation), superimposed on a low mean cross-flow velocity,
on the size and uniformity of generated droplets with some consideration of the prevailing
fluid condition as determined by the oscillatory Reynolds number. The effects of pore size,
continuous phase viscosity and dispersed and continuous phase flow rates were investigated.
Materials
The oil in water emulsions (O/W) were prepared using commercially available food grade
sunflower oil as the dispersed phase and 2% w/w Tween 20 (polysorbate 20 or
polyoxyethylene sorbitan monolaurate, Sigma Aldrich, UK) as the continuous phase. In a
series of experiments in which the influence of the dispersed phase viscosity on the droplet
size was investigated, 0.4% w/w methyl hydroxypropyl cellulose (MHC) (Methofas, PL,
Imperial Chemical Industries, UK) was used in combination with 2% w/w Tween 20 as the
continuous phase.
The interfacial tension at the sunflower and surfactant solution interface was measured by
processing the images of pendant drops acquired by a video camera using a drop shape

10
analysis system (DSA 10, Krüss, Hamburg, Germany). The viscosity of the continuous phase
using 2% w/w Tween 20 and 0.4% w/w methyl hydroxypropyl cellulose was measured using
a rotational viscometer with a temperature-controlled concentric cylinder measurement cell
(ViscoTester 550, Thermo Haake, Germany). The values of the interfacial tension and
viscosity are listed in Table 2.
Membranes and Membrane Module
The oil-in-water emulsions were produced using a pulsed flow system with tubular
hydrophilic micron pore sized sieve type nickel membranes. Both the membrane and the
pulsed flow system were supplied by Micropore Technologies Ltd. (Hatton, Derbyshire, UK).
The pulsed system is illustrated in Figure 1. The dispersed and continuous phases were
injected using peristaltic pumps (Watson-Marlow Sci-Q 400 Pump, Cornwall, UK). An
accelerometer (PCB Piezotronics model M352C65) was connected to a National Instruments
Analogue to Digital converter (NI eDAQ-9172) which was interfaced to a LabView
executable program running on a PC. The information provided by the program from the
accelerometer was the frequency and amplitude of the oscillation: the frequency being
determined by the direction of travel, and the amplitude was deduced from the acceleration
measurement. The oscillation signal was provided by a National Instrument frequency
generator, which fed a power amplifier driving the electro-mechanical oscillator which was
connected to a bellows designed for use in a diaphragm pump, which was submerged in the
continuous phase and its oscillation provided pulsation of the liquid. This electro-mechanic
means to generate pulsed flow provided separate control of frequency and amplitude to
enable a systematic investigation of the influence of these parameters, within a range of 0 to
50 Hz and 0 to 1.6 mm amplitude within the membrane tube. A single membrane tube was

11
used with an internal diameter of 14 mm and working length of 60 mm; the effective
membrane area was 26 cm2. Two pore diameter membranes were investigated: 10 and 20 μm
and the spacing between the pores was 200 μm in both systems; the surface porosity was,
therefore, 0.2 and 0.9%, respectively.
Experimental set-up and procedure
Before each experiment, the membrane was cleaned with commercially available soap in an
ultrasonic bath for 5 min followed by treatment in 4 M NaOH solution for 5 min and finally
pre-soaked in a wetting agent (Micropore Technologies Ltd) for at least 30 minutes to
increase the hydrophilicity of the surface. To prevent pulse-damping, due to the presence of
air within the system, both the outer and inner sides of the membrane were filled with
continuous phase prior to the experiment and all the air was purged through the purge valves.
The sunflower oil was injected through the membrane at a constant flow rate of between 0.5–
15 mL min−1, corresponding to dispersed phase fluxes of between 10 to 340 L m−2 h−1. The
continuous phase was pulsed along the membrane module at various frequencies and the flow
rate of the continuous phase was in the range between 0–72 mL min-1, without any
recirculation of the continuous phase. The emulsion droplets were collected in a stirred tank
that was agitated slowly and were analyzed as specified below.
Determination of mean droplet size and droplet size distribution
Droplet size distribution for all samples was measured by laser light diffraction using a
Malvern Mastersizer (model S). For each emulsion, three separate samples and measurements
were performed and the mean average of these is reported. The average droplet diameter is
expressed as the volume median diameter D(V, 0.5), which is the diameter corresponding to

12
50% on the cumulative volume distribution curve. Droplet size uniformity is expressed as the
span of a distribution:
where D(V, 0.x) is the diameter corresponding to x0% on a cumulative volume droplet size
curve. A Leitz Ergolux optical microscope was used to confirm the droplet size reported by
the Malvern Mastersizer S and to take photomicrographs of the prepared emulsions.
Results & Discussion
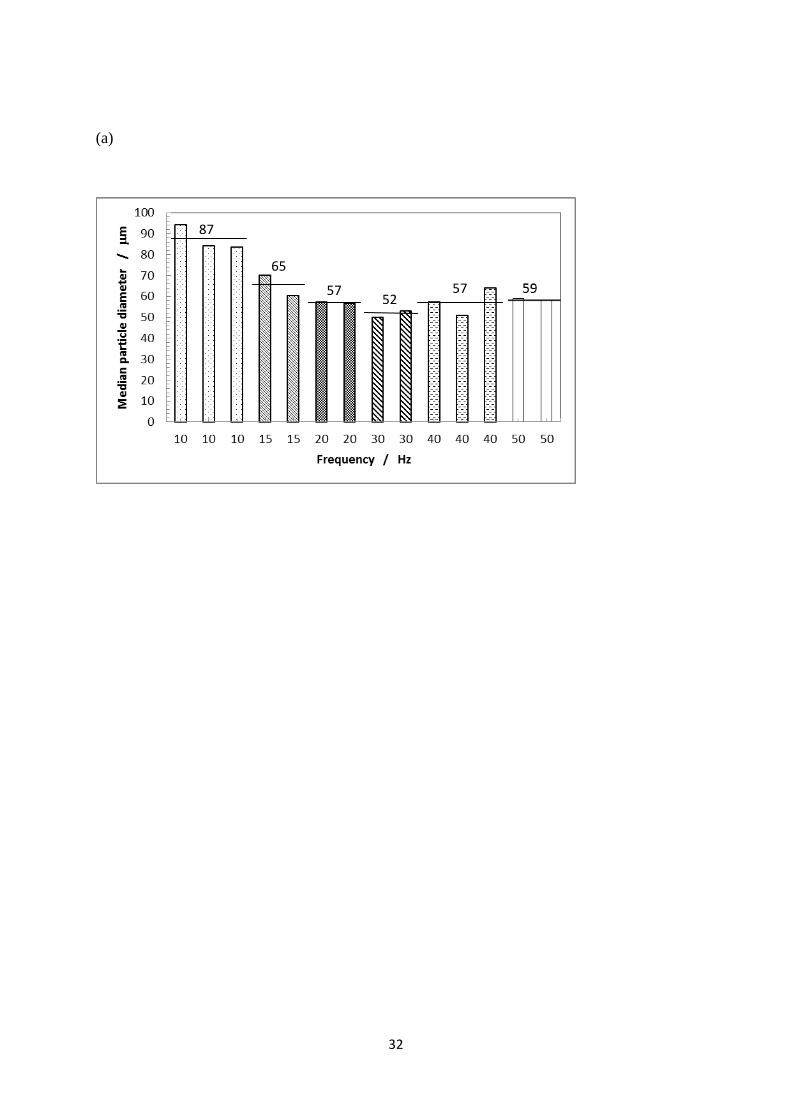
Figure 2 illustrates duplicate and triplicate tests for the emulsion droplet diameter as a
function of frequency of pulse oscillation when using the 20 micron membrane with an
amplitude of 1.6 mm (i.e. peak to peak displacement value of 3.2 mm) and 5 mL min-1
injected with a crossflow rate of 72 mL min-1. Hence, this provided an emulsion with a
volume concentration of oil in water of 7% v/v in a single pass of the continuous phase; i.e.
there was no recirculation of the continuous phase other than that provided by the oscillation.
At the lowest frequency, 10 Hz, the mean droplet diameter was 87 µm, with spans ranging
from 0.7 to 0.8. As expected from Eq. (1), the largest droplets were produced at the lowest
frequency due to the lowest shear force acting on the droplets. In general, the reproducibility
of the data is reasonable, but it is also noticeable that there is limited control over the drop
size by changing the frequency of the liquid oscillation: from 20 Hz upwards the drop size
remains in the range between 50 and 60 µm. It is notable that this is approximately three
times the membrane pore diameter, which is often deemed to be the relation between the drop
and pore size during crossflow membrane emulsification27.

13
Better control of drop size under various operating conditions was obtained when using a 10
µm pore size membrane. Figure 3 illustrates the performance of this membrane at various
dispersed phase injection rates between 0.5 and 13.4 mL min-1. This generated emulsions
with a dispersed phase volume concentration of between 1.7 and 45% v/v, in a single pass in
terms of continuous phase cross-flow over the membrane surface. The injection rate vs. drop
diameter plot also provides information on the performance of the membrane in the context
of dripping and possible jetting of the dispersed phase into the continuous phase. In Figure
3(a) it is notable that the drop size remains just below 50 µm for injection rates up to 4 mL
min-1, but increases between 4 and 10 mL min-1. Hence, it is likely that the 10 µm membrane
was operating within the dripping regime at an injection rate of 4 mL min-1 or below. When
operating within the jetting regime it is normal to expect the uniformity of the drops to suffer,
however the span when using 9.7 mL min-1 is very similar to the span when operating at the
very low flow rate of 0.5 mL min-1, at a little over 0.4. For these tests the continuous phase
crossflow rate was only 30 mL min-1, hence an injection rate of 9.7 mL min-1 results in a
dispersed phase concentration of over 32% v/v, in a single pass in terms of continuous phase
cross-flow.
Figure 4 provides two images, at the same magnification (see the 100 µm scale bar), to
illustrate the emulsions formed at 0.5 and 9.7 mL min-1 injection rates. They both have a span
value of just over 0.4, but the visual appearance of the two emulsions is noticeably different
due to significantly different median droplet sizes of 46 and 88 µm. All emulsification
conditions were kept constant, except the injection rate. It is notable that in Figure 4(b) the
drop size is much larger than in Figure 4(a) and that it appears to be bimodal: with uniform
drops of a larger and smaller size, rather than a range of sizes around a single modal value.
The uniformity of these drops is good, as reported by the instrumental technique based on
laser light diffraction because the volume distribution is biased towards the larger sizes, see

14
Figure 5. It is noticeable that there is a complete lack of fine particles smaller than 20 µm, or
excessively large drops, above 140 µm in diameter. From the evidence illustrated in Figures 3
to 5 it appears that the system is operating in the jetting mode at an injection rate of 9.7 mL
min-1, but despite this the span value of the emulsion produced is reasonable at 0.4 and a
concentrated emulsion (32% v/v) can be produced.
In previous studies using an oscillating membrane within an otherwise stationary liquid15 it
was possible to correlate the drop size formed with the shear stress at the membrane surface,
using equation (1). A similar correlation was performed for the drops arising from the 10 µm
pore size membrane, as illustrated in Figure 6. The figure also contains data illustrating the
lack of any influence of the cross-flow rate on the drop size obtained: cross-flow rates of 30
and 72 mL min-1 provide very similar data for drop size as a function of frequency which
means that under these operating conditions the drop detachment was controlled by the flow
pulsations rather than steady flow of the continuous phase. The data illustrates that the drop
size is controllable in the size range between 270 and 30 µm, depending on the frequency
used for the oscillation. Again the lower limit, 30 µm, is close to the expected 3 times the
pore diameter27. For the purpose of modelling using Eqs. (1) and (7), two different interfacial
tensions have been used; the values reported in Table 2 which are 2.5 mN m-1 and 4 mN m-1.
The latter is the value found for the previously reported work on oscillating membranes. The
sunflower oil was obtained from the same source, hence the newly measured value was
unexpectedly low, but it may be due to between-batch variation of the components within the
sunflower oil. The two curves, resulting from the two different interfacial tensions, are
presented for comparison purposes. In either case, the measured drop size is slightly larger
than the predicted ones, at the intermediate frequencies. This is usual as the drop size
prediction model, equation (1), is only valid at a very low injection rates. At higher injection

15
rates the drop has time to grow in size before it experiences a peak shear event16; which is the
cause of the drop to be sheared off the membrane surface. The drop size found at zero
frequency, i.e. just a very low shear due to cross-flow, is about 270 µm. This is lower than the
predicted drop size at low shear, but the inter-pore spacing is only 200 µm and when the
drops are larger than this they interfere with each other and an additional force has been
reported previously to cause them to detach3. Hence, the data illustrated in Figure 6 suggests
that the pulsed flow membrane emulsification when using the 10 µm pore size membrane is
fairly predictable and logical, with good control over the drop size obtained by varying the
frequency of oscillation. There is no influence of bulk (continuous) phase cross-flow velocity,
within the range tested, which is due to the very limited contribution of the bulk velocity
when compared to the velocity due to oscillation. The peak wall shear rate obtained from
oscillation is 797 s-1, when oscillating at just 10 Hz and 1.6 mm amplitude, whereas the wall
shear rate from the cross-flow is 4.5 s-1 when pumping the continuous phase at the maximum
flow rate used: 72 mL min-1. Hence, the contribution towards wall shear due to the cross-flow
pumping is negligible, and the drop size is only dependent on oscillation conditions and not
cross-flow rate. Another aspect to the consistency found in Figure 6 is the apparent lack of
any influence due to the variable nature of the flow regimes found at oscillatory Reynolds
number varying from 1400 to 7300 corresponding to the 10 to 50 Hz tests.
Predictable and consistent behaviour was not observed when using a 20 µm pore size
membrane. Figure 7 illustrates the variation of drop diameter with oscillatory Reynolds
number. Similar inconsistent trends are observed when plotting drop size against either
frequency, or wall shear stress. A general trend of reducing drop size with Reynolds number
is shown, but with notable outliers: drop sizes of 66 and 90 µm at Reynolds numbers less
than 2000. These are values that provide significant turbulence, see Table 1, so it is possible

16
that detachment could be due to this, but it is notable that such behaviour did not exist when
using the 10 µm pore size membrane. Hence, it has to be concluded that the inconsistent
behaviour is due to the nature of the 20 µm membrane in the system, rather than an
explanation due to transitions in the flow field from laminar to turbulent. At oscillatory
Reynolds numbers greater than 5000 the drop size remained constant at a value of close to 50
µm, with a generally decreasing trend in span value with increasing Reynolds number. This
implies that it is unlikely that the drops are breaking up in the shear field due to turbulence:
this increases as drop uniformity increases, whereas turbulence would be expected to give
rise to decreasing uniformity. Furthermore, the reproducibility of the tests at oscillatory
Reynolds numbers close to 6000, 2200 and 1500 were checked by replicate experiments and
found to be good: the error bars on Figure 7 represent the range of the results provided from
the different tests.
On further investigation of the experimental apparatus when using the 20 µm pore size
membrane, it was notable that pulsing could be observed within the oil reservoir side of the
membrane system. The pulsation was, therefore, capable of passing through the membrane
pores due to the very low resistance offered by the micron pore sized sieve type of membrane
structure, see Figure 1. This pulsation was absent from tests performed using the 10 µm pore
size membrane. It was also less noticeable with the 20 µm pore size membrane at higher
frequencies. Both erroneous data points in Figure 7 were obtained at a frequency of 10 Hz.
Further information illustrating this aspect is shown in Table 3, where experiments were
conducted to specifically test the ability of the pulse to pass through the membrane pore
structure.

17
In Table 3 two data points are shown with zero oscillation, just a crossflow of 72 mL min-1.
The shear stress at the membrane surface is negligible and drop sizes of 270 and 340 µm
result (depending on the injection rate used). The inter-pore spacing is again 200 µm, so
drops of this size are consistent with drop detachment from the membrane being influenced
by this spacing. When pulsing and using a relatively high injection rate, 15 mL min-1, the
drop size is larger than the lower injection rate, 5 mL min-1. For frequencies 15 and 20 Hz
this is 85 and 65 µm; and 74 and 57 µm, respectively. This is consistent with drop size
increasing with injection rate, as observed previously16. However, when oscillating at 10 Hz
this difference is very much more prevalent: 217, 87 and 47 µm as the dispersed phase
injection rate is reduced from 15, to 5 to 0.5 mL min-1, respectively. It is postulated that the
pulsing through the membrane is dampened when operating at the higher injection rate, 15
mL min-1, hence the drop size produced, 217 µm, is closer to what would be expected given
the prevailing conditions of shear at the membrane surface. This was investigated further by
thickening the continuous phase using the thickening agent. The continuous phase viscosity
was 30 times that used previously and operating under these conditions it was possible to
produce a drop diameter of 140 µm at a dispersed phase concentration of 15% v/v in a single
pass of the continuous phase, without noticeable pulse action passing through the membrane
pores of the micron sized sieve type membrane. Again the resulting larger drop size is
deemed to be provided by successful suppression of the pulse from passing through the 20
µm membrane pores, due this time to the higher viscosity of the continuous phase.
Conclusions
There are many different methods for generating shear at the surface of a membrane for the
purpose of membrane emulsification; e.g. by pumping (cross-flow), stirring, rotating a
membrane (or a surface close-by), oscillating the membrane and in the case discussed here:
by pulsing the flow over the membrane surface formed from a tube. This method has a

18
particular advantage of being capable of being interfaced with a reactor downstream of the
droplet generation stage, e.g. in the case of the formation of polymer particles, coacervates,
etc. where the oscillatory nature of the flow can be used to provide good mixing and
conditions approaching plug flow within the reactor. This provides attractive possibilities for
integrated Chemical Engineering systems where dispersed phases are used, and would be
ideal for many potentially continuous processes; where drop formation, reaction and even
functionalization could be achieved continuously. Another extremely attractive aspect is the
ability to produce very high disperse phase concentrations, approaching 50% v/v, in a single
pass of the continuous phase over the membrane surface: i.e. without the need for
recirculation of the continuous phase. This is particularly advantageous when producing
dispersions of larger drop size, where the otherwise required circulation would lead to drop
damage within the pump and other fittings present. However, in order to realise these
substantial potential advantages it is important to understand the factors and conditions that
influence the process of droplet generation in pulsed flow.
Oscillatory flow has complex fluid mechanics, and there are a number of papers published on
the Stokes boundary layer, which is the region in which the droplet generation will take place
for oscillatory Reynolds numbers higher than 550. The very process of oscillation leads to a
flow field that cannot be described as ‘developed’, as may be assumed to be the case during
cross-flow emulsification. In fact, the velocity will vary during the pulse; in many cases it
will change from conditions that may be described as laminar through to turbulent and back
to laminar again. This occurs in flows with oscillatory Reynolds numbers between 100 and
3600. Above this value the flow is turbulent for all of the cycle. The occurrence of turbulence
promotes turbulent bursts at the wall, and it would be logical to expect the presence of a
growing obstruction, i.e. a droplet, encouraging such a burst. However, at the sizes of drops
investigated in this paper the existence of this complex set of fluid conditions appeared to

19
have no influence on the process: it was possible to correlate the drop size formed during
membrane emulsification with a simple shear based model, for the 10 µm pore sized
membrane. However, this simple situation is unlikely to be the case with smaller drop sizes,
produced using oscillating flow at much higher oscillating Reynolds numbers, where
turbulence is more likely to influence the results.
The micron pore sized sieve type membrane has many advantages for the process of
membrane emulsification, primarily the very low pressure drop needed to inject the dispersed
phase into the continuous phase, due to the lack of an internal tortuous pore channel; unlike
the glass, ceramic and sintered metal membranes. The sieve type is also much less prone to
fouling for the same reasons, but the lack of tortuous pore channel means that it is easier for a
pressure pulse to pass through the membrane from the receiving side where the continuous
phase is present and into the side of the membrane where the dispersed phase is present. This
may cause mixing around the pore on the dispersed phase side of the membrane leading to
drop sizes that are much smaller than would be expected from the prevailing conditions of
wall shear, a situation similar to what occurs during pre-mix emulsification. This was
apparent when using a 20 µm membrane pore sized sieve type membrane. However, this
effect was not evident when using a 10 µm pore sized membrane. It was possible to suppress
the mixing described by increasing the flow rate of the injected phase and by increasing the
viscosity of the continuous phase. It is unlikely that the other types of membranes mentioned:
glass, ceramic and sintered would be as influenced by pulsation passing through the
membrane, due to their greater hydraulic resistance caused by their tortuous pore channel
structure.
Using a 10 µm pore sized sieve type membrane it was possible to generate drops with a
controllable median drop size of between 30 and 270 µm, with span values of significantly
less than unity, and a value of ~0.4 at best. The wall shear model used to correlate the
20
experimental drop size with shear stress appeared to provide a reasonable fit for the data, with
the usual deviation from the model: increasing drop size with increasing disperse phase
injection rate. The maximum dispersed phase concentration achieved was 45% v/v without
any recycling of the continuous phase; i.e. in a single pass of the pumped continuous phase. It
is likely that pulsed generation of emulsions, followed where appropriate by reaction and
other unit operations, will become a significant technology in the conversion of existing batch
process to continuous ones.
Acknowledgements
This work was partially supported by “POR Calabria FSE 2007/2013- Asse IV - Obiettivo
operativo M2” (postdoctoral fellowship).

21
References
(1) Vladisavljević, G.T.; Williams, R.A. Recent developments in manufacturing emulsions
and particulate products using membranes. Adv. Colloid Interface Sci. 2005, 113, 1.
(2) Kukizaki, M. Shirasu porous glass (SPG) membrane emulsification in the absence of
shear flow at the membrane surface: Influence of surfactant type and concentration,
viscosities of dispersed and continuous phases, and transmembrane pressure. J. Membr. Sci.
2009, 327, 234.
(3) Kosvintsev, S.R.; Gasparini, G.; Holdich, R.G. Membrane emulsification: Droplet size
and uniformity in the absence of surface shear. J. Membr. Sci. 2008, 313, 182.
(4) Vladisavljević, G.T.; Lambrich, U.; Nakajima M.; Schubert H. Production of O/W
emulsions using SPG membranes, ceramic α-Al2O3 membranes, microfluidizer and a
microchannel plate: a comparative study. Colloid. Surf. A. 2004, 232, 199.
(5) Dragosavac, M.M.; Sovilj, M.N.; Kosvintsev, S.R.; Holdich, R.G.; Vladisavljević, G.T.
Controlled production of oil-in-water emulsions containing unrefined pumpkin seed oil using
stirred cell membrane emulsification. J. Membr. Sci. 2008, 322, 178.
(6) Shimoda, M.; Miyamae, H.; Nishiyama, K.; Yuasa, T.; Noma, S.; Igura, N. Swirl-Flow
Membrane Emulsification for High Throughput of Dispersed Phase Flux through Shirasu
Porous Glass (SPG) Membrane. Journal of Chemical Engineering of Japan 2011, 44, 1.
(7) Dragosavac, M.M.; Holdich, R.G.; Vladisavljević, G.T.; Sovilj, M. Stirred cell membrane
emulsification for multiple emulsions containing unrefined pumpkin seed oil with uniform
droplet size. J. Membr. Sci. 2012, 392, 122.

22
(8) Pan, X.; York, D.; Preece, J.A.; Zhang, Z. Size and strength distributions of melamine-
formaldehyde microcapsules prepared by membrane emulsification. Powder Technol. 2012,
227, 43.
(9) Wagdare, N.A.; Marcelis, A.T.M.; Boom, R.M.; van Rijn, C.J.M. Porous microcapsule
formation with micron pore sized sieve emulsification. J. Colloid Interface Sci. 2012, 355,
453.
(10) Koris, A.; Piacentini, E.; Vatai, G.; Bekassy-Molnar, E.; Drioli, E.; Giorno, L.
Investigation on the effects of a mechanical shear-stress modification method during cross-
flow membrane emulsification. J. Membr. Sci. 2011, 371, 28.
(11) Vladisavljević, G.T.; Williams, R.A. Manufacture of large uniform droplets using
rotating membrane emulsification. J. Colloid Interface Sci. 2006, 299, 396.
(12) Schadler, V.; Windhab, E.J. Continuous membrane emulsification by using a membrane
system with controlled pore distance. Desalination 2006, 189, 130.
(13) Manga, M.S.; Cayre, O.J.; Williams, R.A.; Biggs, S.; York, D.W. Production of solid-
stabilised emulsions through rotational membrane emulsification: influence of particle
adsorption kinetics. Soft Matter 2012, 8, 1532.
(14) Zhu, J.; Barrow, D. Analysis of droplet size during crossflow membrane emulsification
using stationary and vibrating micromachined silicon nitride membranes. J. Membr. Sci.
2005, 261, 136.
(15) Holdich, R.G.; Dragosavac, M.M.; Vladisavljević, G.T.; Kosvintsev, S.R. Membrane
emulsification with oscillating and stationary membranes. Ind. Eng. Chem. Res. 2010, 49,
3810.

23
(16) Egidi, E.; Gasparini, G.; Holdich, R.G.; Vladisavljević, G.T.; Kosvintsev, S.R.
Membrane emulsification using membranes of regular pore spacing: Droplet size and
uniformity in the presence of surface shear. J. Membr. Sci. 2008, 323, 414.
(17) Mackley, M.R.; Stonestreet, P. Heat transfer and associated energy dissipation for
oscillatory flow in baffled tubes. Chem. Eng. Sci. 1995, 50, 2211.
(18) Wong, H.W.; Baird, M.H.I. Fluidisation in a pulsed gas flow. Chem. Eng. J. 1971, 2,
104.
(19) Finnigan, S.M.; Howell, J.A. The effect of pulsed flow on ultrafiltration fluxes in a
baffled tubular membrane system. Desalination 1990, 79, 181.
(20) Paquet, D.A.; Ray, W.H. Tubular reactors for emulsion polymerization: I. Experimental
investigation. AIChE J. 1994, 40, 73.
(21) Angelov, G.; Gourdon, C. Turbulent flow in pulsed extraction columns with internals of
discs and rings: Turbulent kinetic energy and its dissipation rate during the pulsation. Chem.
Eng. Process. 2009, 48, 592.
(22) Lau, A.; Crittenden, B.D.; Field, R.W. Enhancement of liquid phase adsorption column
performance by means of oscillatory flow: an experimental study. Sep. Purif. Technol. 2004,
35, 113.
(23) Dowding, P.J.; Goodwin, J.W.; Vincent, B. Production of porous suspension polymer
beads with a narrow size distribution using a cross-flow membrane and a continuous tubular
reactor. Colloids and Surfaces A. 2001, 180, 301.

24
(24) Williams, R.A.; Peng, S.J.; Wheeler, D.A.; Morley, N.C.; Taylor, D.; Whalley, M.;
Houldsworth, D.W. Controlled production of emulsions using a crossflow membrane. Chem.
Eng. Des. A. 1998, 76, 902.
(25) Schröder, V.; Behrend, O.; Schubert, H. Effect of Dynamic Interfacial Tension on the
Emulsification Process Using Microporous Ceramic Membranes. J. Colloid Interface Sci.
1998, 202, 334.
(26) Salon, S.; Armenio, V.; Crise, A. A numerical invetsigation of the Stokes boundary layer
in the turbulent regime. J. Fluid Mech. 2007, 570, 253.
(27) Nakashima, T.; Shimizu, M.; Kukizaki, M. Particle control of emulsion by membrane
emulsification and its applications. Adv. Drug Del. Rev. 2000, 45, 47.

25
List of Tables
Table 1 Types of flow found during oscillation
Table 2 Viscosity of the continuous phase and interfacial tension at the aqueous/oil
phase interface used for drop size modelling
Table 3 Oscillating flow conditions and dispersed phase injection rate when using 20
micron pore size membrane to investigate pulsing through membrane pores

26
List of Figures
Figure 1 Illustration of experimental equipment for the generation of liquid drops using
pulsed continuous phase flow
Figure 2 (a) Median drop size and (b) span of distributions vs. frequency for duplicate
and triplicate tests conducted using a 20 µm pore size membrane with 1.6 mm
amplitude pulse at 72 mL min-1 flow rate of continuous phase and 5 mL min-1
flow rate of dispersed phase (7% O/W emulsion)
Figure 3 (a) Median drop size and (b) span of distributions vs. dispersed phase injection
rate using a 10 µm pore size membrane with 1.6 mm amplitude pulse and 30
Hz frequency at 30 mL min-1 flow rate of continuous phase. The dispersed
phase concentration obtained in a single pass operation is marked on figures
and ranges from 1.6 to 44.8%
Figure 4 Microscope images of drops produced from: (a) 0.5 mL min-1 dispersed phase
flow rate and (b) 9.7 mL min-1 flow rate using the same conditions described
in Figure 3
Figure 5 Malvern Mastersizer particle size distribution of image shown in Figure 4(b)
using the Multiple Narrow Modes analysis model
Figure 6 The variation of median drop size with frequency using a 10 µm pore size
membrane with 1.6 mm amplitude pulse at 30 and 72 mL min-1 flow rate of
continuous phase and 4 mL min-1 flow of dispersed phase (5.3 to 12% O/W
emulsion in a single pass). The predictions made by the shear-capillary model

27
using interfacial tensions of 2.5 and 4 mN m-1 are shown by solid and dashed
line, respectively.
Figure 7 (a) The variations of median drop size and (b) span of distributions with
oscillatory Reynolds number using a 20 µm pore size membrane with various
frequencies and amplitudes at 72 mL min-1 flow rate of continuous phase and
5 mL min-1 flow of dispersed phase (5.3% O/W emulsion in a single pass); the
error bars indicate the range of results from repeated experiments as illustrated
in Figure 2

28
Table 1 Types of flow found during oscillation
Type of flow Oscillatory Reynolds number
<100 Laminar
100 to 550 Disturbed laminar
550 to 800 Intermittent regime
800 to 1800 Some turbulence
1800 to 3640 Turbulent for most of the cycle
>3460 Turbulent all of the cycle

29
Table 2 Viscosity of the continuous phase and interfacial tension at the aqueous/oil
phase interface used for drop size modelling
Continuous phase Viscosity
(mPa s)
Interfacial tension
(mN m-1)
2% w/w Tween 20 1 2.5
2% w/w Tween 20 with 0.4 wt. % MHC 30 2.5
In previous work15
2% w/w Tween 20 1 4*
*Measured using the Du Nouy ring method.

30
Table 3 Oscillating flow conditions and dispersed phase injection rate when using 20
micron pore size membrane to investigate pulsing through membrane pores
Frequency
(Hz)
Amplitude
(mm)
Shear
stress
(Pa)
Dispersed
flow
(mL/min)
Median
diameter
(µm)
Span
(-)
Continuous
phase
viscosity
(Pa s)
Emulsion
concentration
(% v/v)
0 0 ~0 0.5 274 0.75 0.001 1.7
0 0 ~0 5 337 1.1 0.001 15
10 1.6 0.79 0.5 47 0.57 0.001 1.7
10 1.6 0.79 5 87 0.71 0.001 7.0
10 1.6 0.79 15 217 0.77 0.001 21
15 1.6 1.5 5 65 0.59 0.001 7.0
15 1.6 1.5 15 85 0.51 0.001 21
20 1.6 2.2 5 57 0.76 0.001 7.0
20 1.6 2.2 15 74 0.52 0.001 21
30 0.6 10 5 140 0.80 0.030 15
30 1.3 18 5 51 0.55 0.030 15
30 3.8 54 5 54 0.45 0.030 15

31
Figure 1 Illustration of experimental equipment for the generation of liquid drops using pulsed continuous phase flow
32
(a)
57 52 57
65
87

33
(b)
Figure 2 (a) Median drop size and (b) span of distributions vs. frequency for duplicate and triplicate tests conducted using a 20 µm pore size membrane with 1.6 mm amplitude pulse at 72 mL min-1 flow rate of continuous phase and 5 mL min-1 flow rate of dispersed phase (7% O/W emulsion)

34
(a)
%O/W= 13.2 %O/W= 1.6

35
(b)
Figure 3 (a) Median drop size and (b) span of distributions vs. dispersed phase injection rate using a 10 µm pore size membrane with 1.6 mm amplitude pulse and 30 Hz frequency at 30 mL min-1 flow rate of continuous phase. The dispersed phase concentration obtained in a single pass operation is marked on figures and ranges from 1.6 to 44.8%

36
(a)

37
(b)
Figure 4 Microscope images of drops produced from: (a) 0.5 mL min-1 dispersed phase flow rate and (b) 9.7 mL min-1 flow rate using the same conditions described in Figure 3

38
Figure 5 Malvern Mastersizer particle size distribution of image shown in Figure 4(b) using the Multiple Narrow Modes analysis model

39
Figure 6 The variation of median drop size with frequency using a 10 µm pore size membrane with 1.6 mm amplitude pulse at 30 and 72 mL min-1 flow rate of continuous phase and 4 mL min-1 flow of dispersed phase (5.3 to 12% O/W emulsion in a single pass). The predictions made by the shear-capillary model using interfacial tensions of 2.5 and 4 mN m-1 are shown by solid and dashed line, respectively

40
(a)

41
(b)
Figure 7 (a) The variations of median drop size and (b) span of distributions with oscillatory Reynolds number using a 20 µm pore size membrane with various frequencies and amplitudes at 72 mL min-1 flow rate of continuous phase and 5 mL min-1 flow of dispersed phase (5.3% O/W emulsion in a single pass); the error bars indicate the range of results from repeated experiments as illustrated in Figure 2