continuous infusion indicator dilution measurement limbblood...
TRANSCRIPT
Continuous Infusion Indicator Dilution Measurement of
Limb Blood Flow and Vascular Response to MagnesiumSulfate in Normotensive and Hypertensive Men
HENRYW. OVERBECK,ROBERTM. DAUGHERTY,JR., and FRANCIS J. HADDY
From the Veterans Administration Hospitals, Oklahoma City, Oklahoma andSaginaw, Michigan, and the D3partments of Medicine and Physiology,University of Oklahoma Medical Center, Oklahoma City, Oklahoma 73104,and Michigan State University, East Lansing, Michigan 48823
A B S T R A C T A constant infusion, indicator dilutiontechnique for blood flow measurements in the forearmand hand of man was tested and validated in vitro andin vivo. This technique employs jet injection to im-prove mixing of indicator with arterial blood. The mix-ing characteristics of the jet injection system were stud-ied in vitro in tubing simulating the brachial artery ofman. In addition, actual blood flows in the isolated pump-perfused forelimbs of five dogs were compared withconstant infusion, indicator dilution calculated flows.Measurements were also made of mixing and of bloodflow in the forearm and hand of man. The techniquewas used to compare forearm and hand vascular re-sponses with constant intrabrachial arterial infusionsof magnesium sulfate in 13 normotensive and 13 es-sential hypertensive men.
In vitro and in vivo the jet injection system signifi-cantly improved mixing of indicator with blood, as com-pared with mixing produced by standard infusion tech-niques, without causing hemolysis. In 30 measurementsin isolated, perfused dog forelimbs the correlation coeffi-cient between actual and calculated blood flow was0.992. Resting limb vascular resistance in the hyper-tensive group was significantly higher than in the nor-motensive group. Limb vascular resistance in all 26men decreased in response to intrabrachial-arterial in-fusion of 0.25% magnesium sulfate (8 ml/min). Rateof infusion of Mg`+ was 0.162 mEq/min. There was asignificant positive linear correlation between level of
This work appeared in part as abstracts in Clin. Res. 13:95, 1965, and Physiologist. 8: 247, 1965, and 9: 258, 1966.
Dr. Overbeck's present address is Department of Physi-ology, Michigan State University, East Lansing, Mich. 48823.
Received for publication 13 November 1968 and in revisedform 24 March 1969.
initial limb vascular resistance and magnitude of re-sponse to magnesium sulfate. Vascular response dataadjusted for this source of variation were similar in hy-pertensives and normotensives.
The data suggest that this constant infusion, indicatordilution technique allows accurate calculation of totallimb blood flow in man, provided that anomalous bi-furcation of the brachial artery is not present. The dataalso suggest that the jet injection system improves mix-ing of substances with arterial blood. Thus, use of thissystem should especially aid reliability of studies of limbvascular responses to vasoactive agents infused into thebrachial artery.
INTRODUCTIONFor study of normal and abnormal vascular physiologyin the limbs of man, measurement of blood flow by an in-dicator dilution technique such as described by Andres,Zierler, Anderson, Stainsby, Cader, Ghrayyib, and Lili-enthal (1) is attractive for several reasons. If there isevidence of good mixing of indicator with limb blood,it may be inferred that an additional substance adminis-tered along with the indicator is equally well mixed (2).Such evidence of mixing is important in vascular re-sponse and metabolic studies, especially in cases of highbifurcation of the brachial artery, an anomaly occurringin about 20% of humans. In the presence of this anomaly,active substances would be infused into the radial orulnar artery rather than into the brachial, resulting ininadequate mixing with limb arterial blood and inac-curate response studies.
Second, in contrast to plethysmography, the indi-cator dilution technique does not interrupt venous out-flow from the limb and therefore does not alter the
1944 The Journal of Clinical Investigation Volume 48 1969

pressure gradient nor cause abnormal accumulation ofvasoactive metabolites, both of which might change ar-terial inflow (3). Furthermore, decreases in venouscompliance evoked by vasoactive agents do not affect theindicator dilution technique but might decrease arterialinflow during measurements by plethysmography bycausing a more rapid rise in venous pressure and, hence,a more rapid decrease in driving pressure gradient.Finally, in the absence of practical techniques for directmeasurement of limb blood flow in man, it is desirableto have several independent indirect techniques, eachserving as a check on the others.
The major problem associated with accurate indicatordilution measurement of limb blood flow is adequatemixing of indicator with blood. Approaches which havebeen used to improve mixing include jet injection ofindicator to produce turbulence (1) and intrabrachialarterial infusions of extremely large (34 ml/min) vol-umes of fluid (4). Unfortunately, jet injections whichproduce turbulence also produce hemolysis and, hence,vasodilation (1). Very large-volume infusions seemundesirable, although reportedly they do not disturbnormal limb blood flow, being merely additive (4).
One purpose of the present study was the validation invivo of the constant infusion indicator dilution mea-surement of limb blood flow by use of a new type of jetinjection system improving mixing by both volume andjet effects. The present study compared actual bloodflow with flow calculated by this constant infusion, in-dicator dilution technique in the isolated, pump-perfusedlimb of the dog. The technique was also used in man tostudy anomalous brachial arterial bifurcation and thevenous distribution of radial and ulnar arterial blood.Furthermore, the technique was used to measure restinglimb blood flow and to study limb vascular responses tointrabrachial arterial infusions of a vasoactive agent,the magnesium ion (5). As there is evidence that re-sponses to vasoactive agents (6) and vascular mag-nesium metabolism (7) may be abnormal in essentialhypertension, vascular responses to the magnesium ionwere compared in normotensive and essential hyperten-sive men. Particular attention was given to the problemof interpretation of such response data in groups withdiffering levels of initial vascular resistance.
METHODS
Jet injection system
Intrabrachial arterial infusions were made through a 26gauge stainless steel hypodermic needle modified by Kimray,Inc., Oklahoma City, Okla. Two side holes each of 0.006 inchdiameter were drilled into the shank of the needle about2 mmbehind the tip and 1800 apart. The needle tip openingwas sealed and cut so that the tip was blunt. A Clay-Adamsplastic tubing to male Luer lock adapter was soldered to thehub of the needle. A Becton-Dickinson Swinney filter adapter
was connected in series with the needle to eliminate anyparticulate matter in the infusate which might occlude theholes of the needle; plugging of holes was rare. The jetneedle was introduced into the brachial artery through a20 gauge Riley arterial needle (Becton-Dickinson & Co.,Rutherford, N. J.), and the adapter on the jet needle hublocked into the hub of the Riley needle.
Because the jet needle required a moderately high volumerate of infusion (8 ml/min) at high infusion pressures (upto 1500 mmHg), standard infusion pumps proved inadequate.Therefore a new infusion pump, pressure independent to 45psi and driving two 125 ml stainless steel syringes, wasconstructed (Kimray, Inc., Oklahoma City, Okla.). Varia-tion of delivery rate of this pump was less than ±-1%.
Pressure between the syringe and the jet needle was moni-tored and provided a check on the patency of the orifices inthe jet needle. Kinetic energy of infusate with both holesopen was approximately 4500 g cm2 sec2, a kinetic energyless than that found by Andres et al. (1) to producehemolysis in man. The calculated Reynolds number of theinfusate from this system is approximately 71, considerablyless than that considered necessary to produce turbulent flowin the brachial artery of man (1).
In order to study the mixing characteristics of the jetinjection system, IHSA ('I-labeled human serum albumin inisotonic sodium chloride solution, Albumotope, E. R. Squibb& Sons, New York) was infused into citrated human bankblood flowing through a model simulating the humanbrachial artery and its bifurcation. The model was madeof rubber tubing and a polyethylene "Y" tube, each 5 mmI.D., approximately the internal diameter of the brachialartery of man. Adjustable resistances were placed on thetwo outflow branches so that flow was distributed equally infive experiments and at a ratio of approximately 60:40 infour experiments. Pulsatile blood flows of 25-200 ml/minwere provided by a blood pump (Sigmamotor, Inc., Middle-port, N. Y.). Pump frequencies were 28-216/min, respectively.These flows are in the range to be found in the brachialartery of man. Standard 20 gauge hypodermic needles andthe jet needle were inserted in turn through the wall of therubber tubing so that the needle tip lay 3 cm upstream tothe bifurcation of the tubing. An attempt was made to centereach needle in the stream of blood. Infusion rate through thejet needle was 8 ml/min and through the standard needle,3 or 8 ml/min. Blood outflowing from the two branches wassimultaneously collected for measurement of indicator con-centrations during the infusions. The difference betweenindicator concentrations in the two sampled branches wasconsidered an indication of mixing and was expressed, as byAndres et al. (1), as per cent relative difference (rd), theper cent by which a concentration of indicator in either branch
differs from their mean concentration: rd = C- + Cl 100,Cw+ C2
where C1 represents a concentration of indicator in the onebranch, and C2 represents a concentration of indicator in theother branch occurring simultaneously with C1. Mean relative
difference (mrd) represents -, the mean of the rd's atn
a single flow setting.The mechanism of the mixing produced by the jet needle
was also studied by infusing Evan's blue dye through thejet and standard needles into a stream of water flowingthrough glass tubing (I.D. 5 mm) simulating the humanbrachial artery. Infusion rate through the jet needle was8 ml/min, and through the standard needle, 3 or 8 ml/min.The water was pumped by a Sigmamotor pump at pulsatile
Indicator Dilution Measurement of Limb Blood Flow 1945
flows of between 25 and 200 ml/min. Mixing of dye andwater was recorded by high-speed flash photography.
Experiments in dogsHemolysis. In order to determine if the jet needle infusate
produced hemolysis and vasodilation, a pressure-independentSigmamotor blood pump was interposed between the femoralartery and brachial artery of mongrel dogs anesthetized withsodium pentobarbital, 30 mg/kg, and given heparin, 10,000USP units. Blood flow in the brachial artery was therebyheld constant, and monitored perfusion pressure measuredlimb vascular resistance. A standard 20 gauge hypodermicneedle and the jet needle were separately introduced intothe tubing downstream from the pump. Isotonic sodiumchloride solution was infused constantly through each needleat 8 ml/min, and resulting changes in perfusion pressurewere recorded on a Sanborn oscillographic recording ma-chine. Perfusion pressure responses were also observed toinjections of isotonic sodium chloride or autologous bloodthrough a 27 gauge hypodermic needle at velocities whichhemolyzed the injected blood.
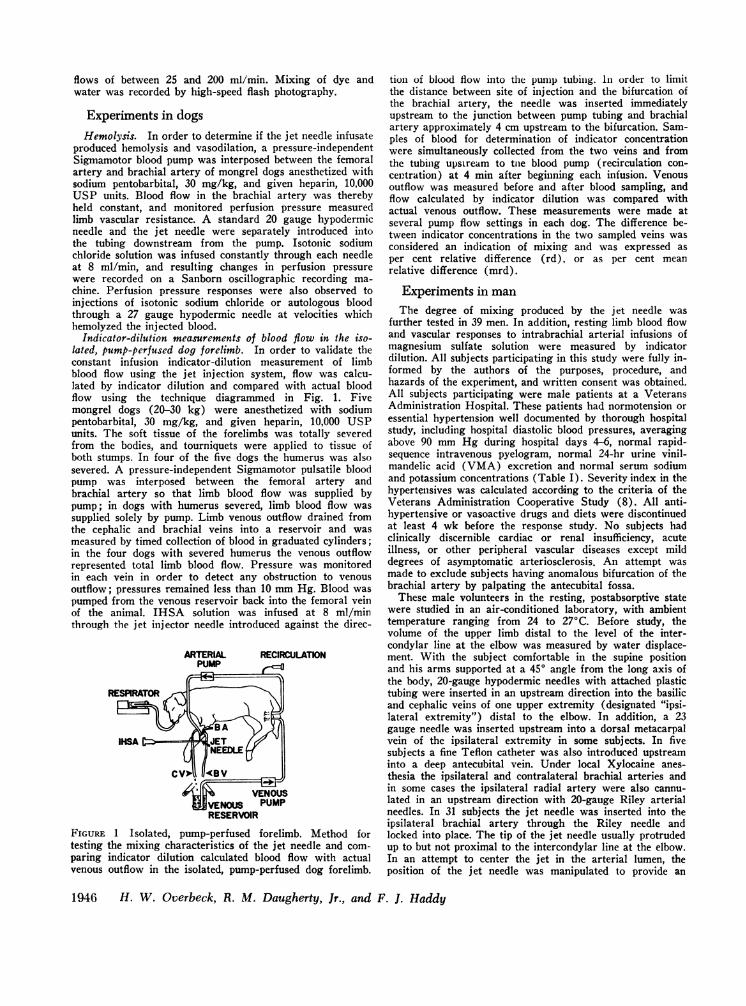
Indicator-dilution measurements of blood flow in the iso-lated, pump-perfused dog forelimb. In order to validate theconstant infusion indicator-dilution measurement of limbblood flow using the jet injection system, flow was calcu-lated by indicator dilution and compared with actual bloodflow using the technique diagrammed in Fig. 1. Fivemongrel dogs (20-30 kg) were anesthetized with sodiumpentobarbital, 30 mg/kg, and given heparin, 10,000 USPunits. The soft tissue of the forelimbs was totally severedfrom the bodies, and tourniquets were applied to tissue ofboth stumps. In four of the five dogs the humerus was alsosevered. A pressure-independent Sigmamotor pulsatile bloodpump was interposed between the femoral artery andbrachial artery so that limb blood flow was supplied bypump; in dogs with humerus severed, limb blood flow wassupplied solely by pump. Limb venous outflow drained fromthe cephalic and brachial veins into a reservoir and wasmeasured by timed collection of blood in graduated cylinders;in the four dogs with severed humerus the venous outflowrepresented total limb blood flow. Pressure was monitoredin each vein in order to detect any obstruction to venousoutflow; pressures remained less than 10 mmHg. Blood waspumped from the venous reservoir back into the femoral veinof the animal. IHSA solution was infused at 8 ml/minthrough the jet injector needle introduced against the direc-
ARTERIAL RECIRCULATIONPUMP H
RESPIRATOR
VENOosUMPENOUS PUMPRESERVOIR
FIGURE 1 Isolated, pump-perfused forelimb. Method fortesting the mixing characteristics of the jet needle and com-paring indicator dilution calculated blood flow with actualvenous outflow in the isolated, pump-perfused dog forelimb.
tion of blood flow into the pump tubing. In order to limitthe distance between site of injection and the bifurcation ofthe brachial artery, the needle was inserted immediatelyupstream to the junction between pump tubing and brachialartery approximately 4 cm upstream to the bifurcation. Sam-ples of blood for determination of indicator concentrationwere simultaneously collected from the two veins and fromthe tubing upstream to tne blood pump (recirculation con-centration) at 4 min after beginning each infusion. Venousoutflow was measured before and after blood sampling, andflow calculated by indicator dilution was compared withactual venous outflow. These measurements were made atseveral pump flow settings in each dog. The difference be-tween indicator concentrations in the two sampled veins wasconsidered an indication of mixing and was expressed asper cent relative difference (rd), or as per cent meanrelative difference (mrd).
Experiments in man
The degree of mixing produced by the jet needle wasfurther tested in 39 men. In addition, resting limb blood flowand vascular responses to intrabrachial arterial infusions ofmagnesium sulfate solution were measured by indicatordilution. All subjects participating in this study were fully in-formed by the authors of the purposes, procedure, andhazards of the experiment, and written consent was obtained.All subjects participating were male patients at a VeteransAdministration Hospital. These patients had normotension oressential hypertension well documented by thorough hospitalstudy, including hospital diastolic blood pressures, averagingabove 90 mmHg during hospital days 4-6, normal rapid-sequence intravenous pyelogram, normal 24-hr urine vinil-mandelic acid (VMA) excretion and normal serum sodiumand potassium concentrations (Table I). Severity index in thehypertensives was calculated according to the criteria of theVeterans Administration Cooperative Study (8). All anti-hypertensive or vasoactive drugs and diets were discontinuedat least 4 wk before the response study. No subjects hadclinically discernible cardiac or renal insufficiency, acuteillness, or other peripheral vascular diseases except milddegrees of asymptomatic arteriosclerosis. An attempt wasmade to exclude subjects having anomalous bifurcation of thebrachial artery by palpating the antecubital fossa.
These male volunteers in the resting, postabsorptive statewere studied in an air-conditioned laboratory, with ambienttemperature ranging from 24 to 270C. Before study, thevolume of the upper limb distal to the level of the inter-condylar line at the elbow was measured by water displace-ment. With the subject comfortable in the supine positionand his arms supported at a 450 angle from the long axis ofthe body, 20-gauge hypodermic needles with attached plastictubing were inserted in an upstream direction into the basilicand cephalic veins of one upper extremity (designated "ipsi-lateral extremity") distal to the elbow. In addition, a 23gauge needle was inserted upstream into a dorsal metacarpalvein of the ipsilateral extremity in some subjects. In fivesubjects a fine Teflon catheter was also introduced upstreaminto a deep antecubital vein. Under local Xylocaine anes-thesia the ipsilateral and contralateral brachial arteries andin some cases the ipsilateral radial artery were also cannu-lated in an upstream direction with 20-gauge Riley arterialneedles. In 31 subjects the jet needle was inserted into theipsilateral brachial artery through the Riley needle andlocked into place. The tip of the jet needle usually protrudedup to but not proximal to the intercondylar line at the elbow.In an attempt to center the jet in the arterial lumen, theposition of the jet needle was manipulated to provide an
1946 H. W. Overbeck, R. M. Daugherty, Jr., and F. J. Haddy

TABLE ISubject List
MeanBody Limb arterial
Subject Race Age weight volume pressure* Hct. Diagnosis$
yr lb. ml mmHg %Normotensines
J. L. G. NegroW. H. CaucasianC. G. R. CaucasianH. W. M. CaucasianL. L. D. CaucasianL. T. H. CaucasianL. R. CaucasianH. C. B. CaucasianR. J. N. CaucasianC. L. P. Caucasian
J. J. C. CaucasianC. L. C. CaucasianA. T. NegroW. D. CaucasianF. L. Z. CaucasianR. H. T. Caucasian
Mean§
38 12448 17144 14150 19145 14347 16249 15544 17735 14239 156
1400185014251900130013501700175013501475
53 140 110044 144 140049 175 162549 150 150061 138 150047 171 1300
45 156 1510
8882
10498
109837793
10094
9010090
100102100
93
424247
Postviral gastroenteritisDuodenal ulcerCervical spondylosis
44 Depression37 Chronic pancreatitis42 Diabetes mellitus45 Diabetes mellitus47 Duodenal ulcer49 Chronic pancreatitis49 Chronic alcoholism;
diabetes mellitus46 Laennec's cirrhosis39 Laennec's cirrhosis43 Alcoholic gastritis44 Silicosis42 Lymphoma44 Diabetes mellitus
44
71 172 1600 105 42 Essential hypertension,mild
Caucasian 49 187 1575 140 45 Essential hypertension,moderate; diabetesmellitus
Caucasian 46 190 1600 126 46 Essential hypertension,moderate
Negro 45 148 1500 108 47 Essential hypertension,mild
Caucasian 54 162 1425 136 44 Essential hypertension,mild
W. E. D. Negro
R. E. B.
J. H.
R. L. S.
A. L.
C. D.
R. S.
J. J. F.
Negro
43 154 1550 130 45 Essential hypertension,moderate
60 128 1300 132 49 Essential hypertension,moderate
Caucasian 63 204 1850 140 44 Essential hypertension,moderate
Negro
Negro
44 160 1875 146 47 Essential hypertension,moderate
42 194 1650 147 53 Essential hypertension,moderate
Caucasian 46 223 2150 110 50 Essential hypertension,mild
Negro 52 228 2250 110 44 Essential hypertension,moderate
Caucasian 46 136 1400 138 46 Essential hypertension,moderate
Indicator Dilution Measurement of Limb Blood Flow 1947
HypertensivesC. P. J. Negro
A. D. R.
D. C. 0.
W. F. C.
K. C. V.
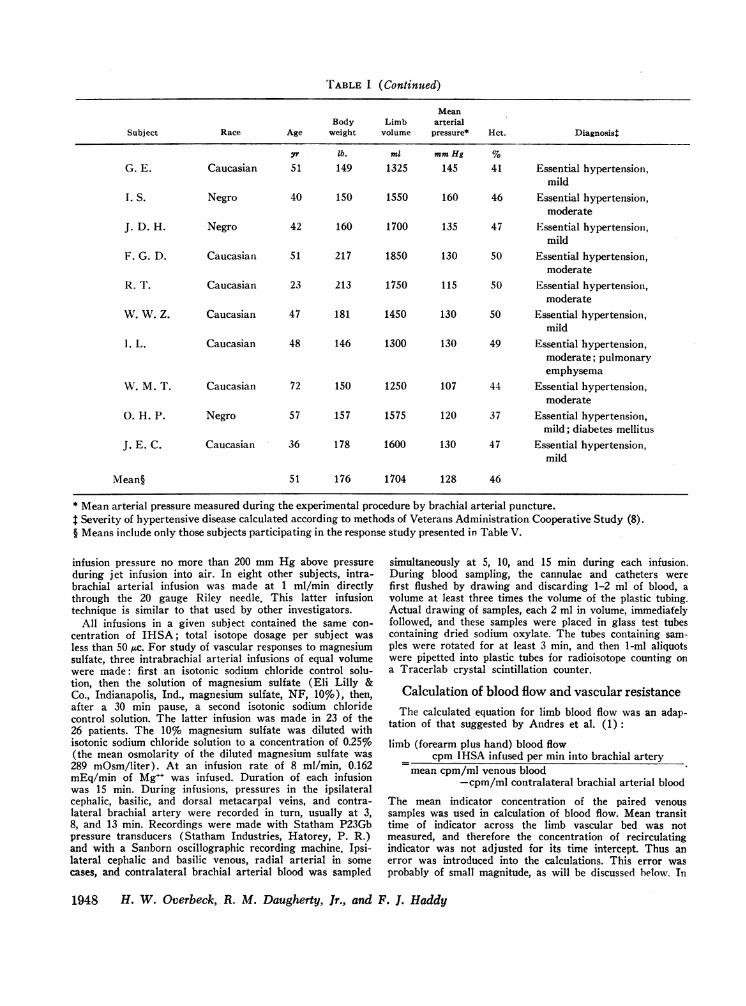
TABLE I (Continued)
MeanBody Limb arterial
Subject Race Age weight volume pressure* Hct. Diagnosist
yr lb. ml mmHg %
G. E. Caucasian 51 149 1325 145 41 Essential hypertension,mild
I. S. Negro 40 150 1550 160 46 Essential hypertension,moderate
J. D. H. Negro 42 160 1700 135 47 Essential hypertension,mild
F. G. D. Caucasian 51 217 1850 130 50 Essential hypertension,moderate
R. T. Caucasian 23 213 1750 115 50 Essential hypertension,moderate
W. W. Z. Caucasian 47 181 1450 130 50 Essential hypertension,mild
1. L. Caucasian 48 146 1300 130 49 Essential hypertension,moderate; pulmonaryemphysema
W. M. T. Caucasian 72 150 1250 107 44 Essential hypertension,moderate
0. H. P. Negro 57 157 1575 120 37 Essential hypertension,mild; diabetes mellitus
J. E. C. Caucasian 36 178 1600 130 47 Essential hypertension,mild
Mean§ 51 176 1704 128 46
* Mean arterial pressure measured during the experimental procedure by brachial arterial puncture.Severity of hypertensive disease calculated according to methods of Veterans Administration Cooperative Study (8).
§ Means include only those subjects participating in the response study presented in Table V.
infusion pressure no more than 200 mmHg above pressureduring jet infusion into air. In eight other subjects, intra-brachial arterial infusion was made at 1 ml/min directlythrough the 20 gauge Riley needle. This latter infusiontechnique is similar to that used by other investigators.
All infusions in a given subject contained the same con-centration of IHSA; total isotope dosage per subject wasless than 50 ttc. For study of vascular responses to magnesiumsulfate, three intrabrachial arterial infusions of equal volumewere made: first an isotonic sodium chloride control solu-tion, then the solution of magnesium sulfate (Eli Lilly &Co., Indianapolis, Ind., magnesium sulfate, NF, 10%), then,after a 30 min pause, a second isotonic sodium chloridecontrol solution. The latter infusion was made in 23 of the26 patients. The 10% magnesium sulfate was diluted withisotonic sodium chloride solution to a concentration of 0.25%(the mean osmolarity of the diluted magnesium sulfate was289 mOsm/liter). At an infusion rate of 8 ml/min, 0.162mEq/min of Mg"+ was infused. Duration of each infusionwas 15 min. During infusions, pressures in the ipsilateralcephalic, basilic, and dorsal metacarpal veins, and contra-lateral brachial artery were recorded in turn, usually at 3,8, and 13 min. Recordings were made with Statham P23Gbpressure transducers (Statham Industries, Hatorey, P. R.)and with a Sanborn oscillographic recording machine. Ipsi-lateral cephalic and basilic venous, radial arterial in somecases, and contralateral brachial arterial blood was sampled
simultaneously at 5, 10, and 15 min during each infusion.During blood sampling, the cannulae and catheters werefirst flushed by drawing and discarding 1-2 ml of blood, avolume at least three times the volume of the plastic tubing.Actual drawing of samples, each 2 ml in volume, immediatelyfollowed, and these samples were placed in glass test tubescontaining dried sodium oxylate. The tubes containing sam-ples were rotated for at least 3 min, and then 1-ml aliquotswere pipetted into plastic tubes for radioisotope counting ona Tracerlab crystal scintillation counter.
Calculation of blood flow and vascular resistanceThe calculated equation for limb blood flow was an adap-
tation of that suggested by Andres et al. (1):
limb (forearm plus hand) blood flowcpm IHSA infused per min into brachial artery
mean cpm/ml venous blood-cpm/ml contralateral brachial arterial blood
The mean indicator concentration of the paired venoussamples was used in calculation of blood flow. Mean transittime of indicator across the limb vascular bed was notmeasured, and therefore the concentration of recirculatingindicator was not adjusted for its time intercept. Thus anerror was introduced into the calculations. This error wasprobably of small magnitude, as will be discussed below. In
1948 H. W. Overbeck, R. M. Daugherty, Jr., and F. J. Haddy
man, calculated forearm and hand blood flow was expressedas ml/100 cc of forearm and hand volume per minute.
Forearm and hand vascular resistances were calculated asfollows: total limb (forearm plus hand) vascular resistance
=PBA - PL limb venous resistance - Pv - PL where- F IF ~ hrPBA, PLVY, P5V, and F represent mean contralateral brachialarterial pressure, mean cephalic or basilic venous pressure,mean dorsal metacarpal venous pressure, and total forearmand hand blood flow per 100 cc of forearm and hand volumeper minute, respectively. Resistances were expressed as milli-meters of mercury per milliliter of blood flow per 100 cc offorearm and hand volume per minute.
In some subjects contralateral arterial and ipsilateral ce-phalic venous serum [Na+], [K+], [Ca++], [Mg+ ], andosmolarity, sampled at the 10th min of the infusions, weremeasured on a Beckman Flame Photometer (model 105), anAdvanced Osmometer (model 67-31LAS), and a Perkin-Elmer Atomic Absorption Spectrometer (model 290). Con-tralateral arterial and ispilateral venous blood hematocrit wasalso measured.
The Student's t test, simple linear correlation and regres-sion, and the nonparametric median test (9) were used forstatistical analyses.
RESULTS
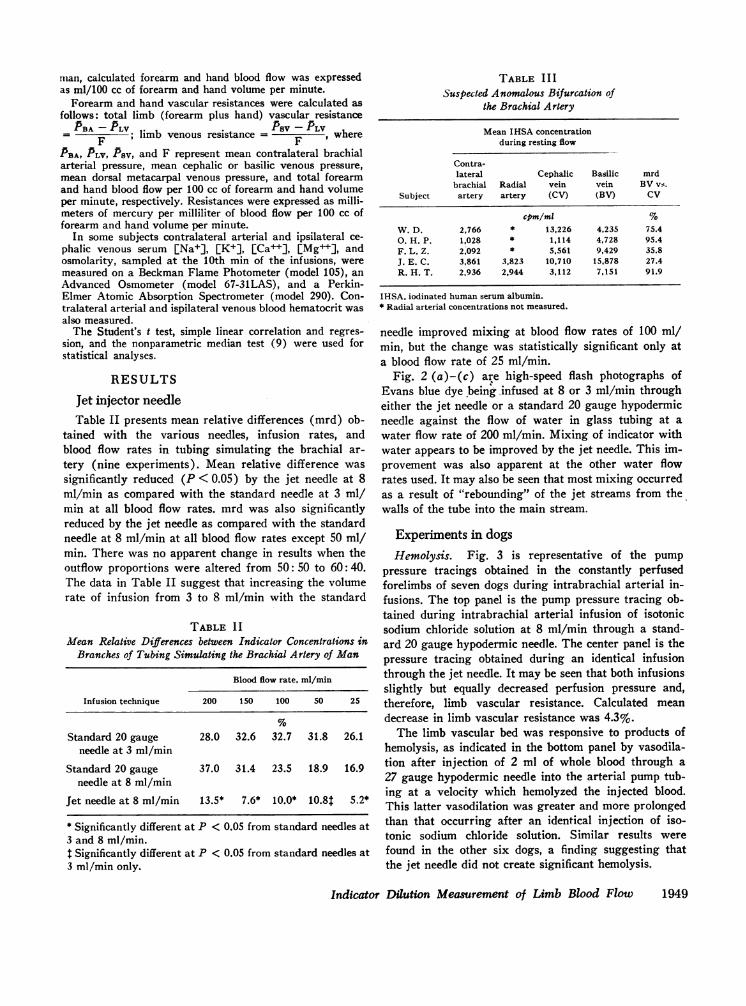
Jet injector needleTable II presents mean relative differences (mrd) ob-
tained with the various needles, infusion rates, andblood flow rates in tubing simulating the brachial ar-tery (nine experiments). Mean relative difference wassignificantly reduced (P < 0.05) by the jet needle at 8ml/min as compared with the standard needle at 3 ml/min at all blood flow rates. mrd was also significantlyreduced by the jet needle as compared with the standardneedle at 8 ml/min at all blood flow rates except 50 ml/min. There was no apparent change in results when theoutflow proportions were altered from 50: 50 to 60: 40.The data in Table II suggest that increasing the volumerate of infusion from 3 to 8 ml/min with the standard
TABLE I IMlean Relative Differences between Indicator Concentrations in
Branches of Tubing Simulating the Brachial Artery of Man
Blood flow rate, ml/min
Infusion technique 200 150 100 50 25
Standard 20 gauge 28.0 32.6 32.7 31.8 26.1needle at 3 ml/min
Standard 20 gauge 37.0 31.4 23.5 18.9 16.9needle at 8 ml/min
Jet needle at 8 ml/min 13.5* 7.6* 10.0* 10.8t 5.2*
* Significantly different at P < 0.05 from standard needles at3 and 8 ml/min.I Significantly different at P < 0.05 from standard needles at3 ml/min only.
TABLE IIISuspected Anomalous Bifurcation of
the Brachial Artery
Mean IHSA concentrationduring resting flow
Contra-lateral Cephalic Basilic mrd
brachial Radial vein vein BV vs.Subject artery artery (CV) (BV) CV
cpm/ml %W. D. 2,766 * 13,226 4,235 75.40. H. P. 1,028 * 1,114 4,728 95.4F. L. Z. 2,092 * 5,561 9,429 35.8J. E. C. 3,861 3,823 10,710 15,878 27.4R. H. T. 2,936 2,944 3,112 7,151 91.9
IHSA, iodinated human serum albumin.* Radial arterial concentrations not measured.
needle improved mixing at blood flow rates of 100 ml/min, but the change was statistically significant only ata blood flow rate of 25 ml/min.
Fig. 2 (a)-(c) are high-speed flash photographs ofEvans blue dye being infused at 8 or 3 ml/min througheither the jet needle or a standard 20 gauge hypodermicneedle against the flow of water in glass tubing at awater flow rate of 200 ml/min. Mixing of indicator withwater appears to be improved by the jet needle. This im-provement was also apparent at the other water flowrates used. It may also be seen that most mixing occurredas a result of "rebounding" of the jet streams from thewalls of the tube into the main stream.
Experiments in dogsHemolysis. Fig. 3 is representative of the pump
pressure tracings obtained in the constantly perfusedforelimbs of seven dogs during intrabrachial arterial in-fusions. The top panel is the pump pressure tracing ob-tained during intrabrachial arterial infusion of isotonicsodium chloride solution at 8 ml/min through a stand-ard 20 gauge hypodermic needle. The center panel is thepressure tracing obtained during an identical infusionthrough the jet needle. It may be seen that both infusionsslightly but equally decreased perfusion pressure and,therefore, limb vascular resistance. Calculated meandecrease in limb vascular resistance was 4.3%.
The limb vascular bed was responsive to products ofhemolysis, as indicated in the bottom panel by vasodila-tion after injection of 2 ml of whole blood through a27 gauge hypodermic needle into the arterial pump tub-ing at a velocity which hemolyzed the injected blood.This latter vasodilation was greater and more prolongedthan that occurring after an identical injection of iso-tonic sodium chloride solution. Similar results werefound in the other six dogs, a finding suggesting thatthe jet needle did not create significant hemolysis.
Indicator Dilution Measurement of Limb Blood Flow 1949

Indicator dilution measurement of blood flow in theisolated, pump-perfused dog forelimb. In five dogs therd's during intrabrachial arterial jet infusion of indi-cator solution were (mean +SD) 3.6 ±2.2%. Fig 4 rep-resents a comparison of actual and calculated flow in thefive dogs. Calculated flows were equally accurate at bothlow and high actual flows; thus, it is unlikely that fail-
a
ure to correct recirculation concentration for meantransit time introduced an error of significant magni-tude. In these five dogs calculated blood flows averaged0.8% above the actual venous outflows. It will be seenthat 77% of these observations lay within ±5% of theactual flow, and all observations lay with ±15% of theactual flow. The correlation coefficient was 0.992.
I:2"1-111112111111F111 2 ll 1 1 21 110II
4. 5 16 7i 18 9Is 10b..-
4 15 16 117 181 91 1011
C
I4 15 16 118 I 1FIGURE 2 Mixing characteristics. (a) Infusion of Evans blue dye at 8 ml/minthrough a jet needle into water flowing from left to right through glass tubingat 200 ml/min. (b) Infusion of Evans blue dye at 8 ml/min through a standard20 gauge needle into water flowing from left to right through glass tubing at 200ml/min. (c) Infusion of Evans blue dye at 3 ml/min through a standard 20 gauge
needle into water flowing from left to right through glass tubing at 200 ml/min.
1950 H. W. Overbeck, R. M. Daugherty, Jr., and F. J. Haddy
I,
......

Experiments in man
Data from five subjects were excluded from some ofthe tables and calculations presented in this section,because there was good evidence of anomalous bifurca-tion of the brachial artery. In these cases there was aconsiderable difference between the concentrations ofindicator in the paired venous samples. Table III pre-sents data for the five subjects. Findings in subjectsO.H.P., F.L.Z., J.E.C., and R.H.T. suggest that indi-cator may have been infused into the ulnar arteryrather than into the brachial artery. In subject R.H.T.,isotope concentrations in radial artery and cephalic veinwere almost identical with isotope concentrations incontralateral brachial artery, representing recirculatingindicator; thus, none of the locally infused isotope passedinto the radial artery and cephalic vein. The origin ofthis subject's radial artery was upstream to the point ofindicator infusion, and the radial artery was the solesource of blood to the cephalic vein. The case of J.E.C.
200150
10050
0
aIEE
a
0.
E0.
INFUSION THROUGHRE
A .44I4-j4 4-4444i44-1.
t i
Start Infusion 1Min
INFUSION THROUGH'JE
200 rTA1501 12-E ~~50 _4+',
is particularly interesting, for here no indicator was in-fused into the radial arterial blood, and yet mrd was notexceptionally high, a finding indicating that in somesubjects a large amount of mixing occurs in the capil-lary-venous bed of the limb. Findings in subject W.D.,in whom most indicator passed into the cephalic vein,suggest that in this case indicator was infused into theradial artery rather than the brachial artery, and thatan anomalous ulnar artery supplied the basilic vein.
In 34 other subjects technically satisfactory measure-ments were made of mixing (mrd) and resting bloodflow, and data are presented in Tables IV and V. Com-parison of these tables indicates that the mrd was sig-nificantly decreased (P < 0.05) by the jet injectionsystem, as compared with the standard needle technique,a finding suggesting that the jet injection system im-proves mixing in vivo as well as in vitro. Note es-pecially subject A.L. in whom both needles were usedand in whom mrd decreased from 21.6 to 2.1%. Com-
:GULAR NEEDLE 8ml /min
I I~~~~~~~~WN
Stop Infusion 1 Min
ET' NEEDLE 8ml /min
4 +-' A. iii*,,i-~w!_____... . NNW_==_Ft , ''-4 '';'' ' ' *t tAx -- ---
I Ion 1 Min Stop Infusion
i1 Min
INJECTION WHOLEBLOOD. 2ml
200150
50
Inject
FIGURE 3 Hemolysis. Representative pump pressure tracings during infusion ofisotonic saline through standard 20-gauge and jet needles into the constantly per-fused dog forelimb. Upper panel: pump pressure tracing obtained during intra-brachial arterial infusion through standard needle. Times of starting infusion, 1min after starting, stopping infusion, and 1 min after stopping are identifiedon abscissa. Center panel: pump pressure tracing obtained during identical intra-brachial arterial infusion through jet needle. Lower panel: pump pressure tracingduring forceful intrabrachial arterial injection of 2 ml of whole blood through a27 gauge hypodermic needle.
Indicator Dilution Measurement of Limb Blood Flow 19.<51
I
IStart Infusic

parison of Tables IV and V also indicates that in allpatients calculated mean resting upper extremity bloodflows using the two injection systems were not signifi-cantly different. This similarity of flows using standardor jet needle further suggests that the jet injectionsdid not produce significant hemolysis and vasodilation.Adjusting flows in these tables by subtracting the infu-sion rate does not change the conclusions about simi-larity of blood flows and jet improvement of mixing(mrd).
Infusion directly into the radial artery in four sub-jects (Table VI) always increased mrd. In addition,radial arterial infusions always increased the concen-tration of indicator in the cephalic vein and decreasedthe concentration in the basilic vein. This is furtherevidence that the source of cephalic venous blood isprimarily the radial artery, that the source of basilicvenous blood is primarily the ulnar artery, and that thedifference in concentration of indicator in the cephalicand basilic veins may be an indication of mixing witharterial blood upstream to the bifurcation. Additionalevidence that the choice of veins in the present studyprovided a sensitive measure of mixing is suggested bydata from the five men in whomdeep venous blood froman antecubital vein was also sampled. In all five casesthe concentration of indicator in the deep vein lay be-tween the concentration values in the superficial veins.Thus, it is probable that the range of concentration val-ues established by the paired samples from the cephalicand basilic veins would include concentration valuesin most or all other forearm veins.
MEANCALCULATEDFLOWVS. ACTUALFLOW
mI/mm / ./ 7
w 3:
0
a l0
*0
040
N
77/ Actual Flow40 a U IN 120 140 1i 1i
FIGURE 4 Indicator dilution calculated blood flow vs. actualflow (venous outflow) in five isolated, pump-perfused dogforelimbs. Solid regression line represents the line of identity.Broken regression line represents ±15% deviation from theidentity line.
TABLE IVMean Relative Difference between Indicator Concentrations in
Basilic and Cephalic Veins and Calculated RestingBlood Flow Using Standard Needle*
Subject Blood flow mrd
mi/100 cc/min %I. S. 5.3 6.5J. D. H. 3.3 28.9F. G. D. 3.0 7.6R. T. 6.0 14.3W. W. Z. 4.5 25.2I. L. 6.6 17.6W. M. T. 3.9 3.4A. L.-1 7.2 21.6
Mean dSD 5.0 1.6 15.6 49.3
* Subjects with proved or highly suspected anomalous bifurca-tion of brachial artery excluded.
Table V presents "resting" blood flow and vascularresistance values obtained in the normotensive and es-sential hypertensive patients during infusion of iso-tonic sodium chloride solution. Mean ages and fore-arm and hand volumes were slightly higher in the hy-pertensive group (Table I). "Resting" blood flows inthe two groups were not significantly different (P >0.5). In contrast, even though there was considerableoverlap with normotensives, mean vascular resistancein the hypertensives was significantly elevated (P <0.05).
Ipsilateral limb venous serum magnesium concentra-tion, measured in nine subjects, had increased by amean of 3.39 mEq/liter (range 1.20-5.90 mEq/liter) atthe 10th min of the intrabrachial arterial magnesiumsulfate infusion. Table V presents vascular responseselicited by the intrabrachial arterial magnesium sulfateinfusions. No significant changes occurred in contra-lateral brachial arterial and ipsilateral cephalic or basilicvenous pressures during the infusions, and the meanarterial pressures are presented in Table I. Increase inforearm and hand blood flow and decrease in forearmand hand total vascular resistance occurred in all 26subjects during the infusion of magnesium sulfate.These changes had occurred by the 5th min of the in-fusions, and increased slightly further by the 10th minof the infusions. As reported by Baltzan, Andres, Cader,and Zierler (2), a fairly steady state of response had beenachieved by the 10th min of the vasoactive infusion, andtherefore Table V presents the means of the 10- and15-min measurements. Mean vascular resistance changeselicited were - 12.14 mmHg/ml per 100cc per min and- 5.46 mmHg/ml per 100cc per min in the hyper-tensives and normotensives, respectively. These changesin blood' flow and resistance returned toward or to "rest-
1952 H. W. Ovetbeck, R. M. Daugherty, Jr.,. and F. 1. Haddy
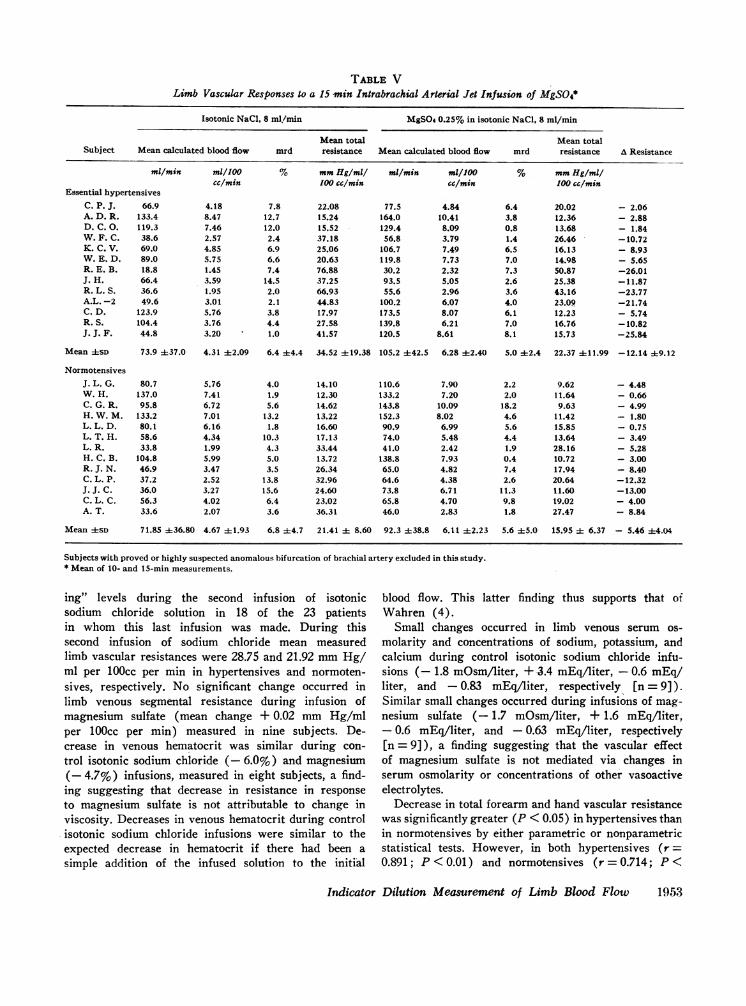
TABLE VLimb Vascular Responses to a 15 min Intrabrachial Arterial Jet Infusion of MgSO4*
Isotonic NaCl, 8 ml/min MgSO 0.25% in isotonic NaCi, 8 mI/mi
Mean total Mean totalSubject Mean calculated blood flow mrd resistance Mean calculated blood flow mrd resistance A Resistance
ml/min ml/100 S mmHg/ml mi/min ml/100 % mmHg/mlicc/min 100 cc/min cc/min 100 cc/min
Essential hypertensivesC. P. J. 66.9 4.18 7.8 22.08 77.5 4.84 6.4 20.02 - 2.06A. D. R. 133.4 8.47 12.7 15.24 164.0 10.41 3.8 12.36 - 2.88D. C. 0. 119.3 7.46 12.0 15.52 129.4 8.09 0.8 13.68 - 1.84W. F. C. 38.6 2.57 2.4 37.18 56.8 3.79 1.4 26.46 -10.72K. C. V. 69.0 4.85 6.9 25.06 106.7 7.49 6.5 16.13 - 8.93W. E. D. 89.0 5.75 6.6 20.63 119.8 7.73 7.0 14.98 - 5.65R. E. B. 18.8 1.45 7.4 76.88 30.2 2.32 7.3 50.87 -26.01J. H. 66.4 3.59 14.5 37.25 93.5 5.05 2.6 25.38 -11.87R. L. S. 36.6 1.95 2.0 66.93 55.6 2.96 3.6 43.16 -23.77A.L. -2 49.6 3.01 2.1 44.83 100.2 6.07 4.0 23.09 -21.74C. D. 123.9 5.76 3.8 17.97 173.5 8.07 6.1 12.23 - 5.74R. S. 104.4 3.76 4.4 27.58 139.8 6.21 7.0 16.76 -10.82J. J. F. 44.8 3.20 1.0 41.57 120.5 8.61 8.1 15.73 -25.84
Mean 4SD 73.9 437.0 4.31 42.09 6.4 ±4.4 34.52 ±19.38 105.2 442.5 6.28 42.40 5.0 42.4 22.37 ±11.99 -12.14 49.12
NormotensivesJ. L. G. 80.7 5.76 4.0 14.10 110.6 7.90 2.2 9.62 - 4.48W. H. 137.0 7.41 1.9 12.30 133.2 7.20 2.0 11.64 - 0.66C. G. R. 95.8 6.72 5.6 14.62 143.8 10.09 18.2 9.63 - 4.99H. W. M. 133.2 7.01 13.2 13.22 152.3 8.02 4.6 11.42 - 1.80L. L. D. 80.1 6.16 1.8 16.60 90.9 6.99 5.6 15.85 - 0.75L. T. H. 58.6 4.34 10.3 17.13 74.0 5.48 4.4 13.64 - 3.49L. R. 33.8 1.99 4.3 33.44 41.0 2.42 1.9 28.16 - 5.28H. C. B. 104.8 5.99 5.0 13.72 138.8 7.93 0.4 10.72 - 3.00R. J. N. 46.9 3.47 3.5 26.34 65.0 4.82 7.4 17.94 - 8.40C. L. P. 37.2 2.52 13.8 32.96 64.6 4.38 2.6 20.64 -12.32J. J. C. 36.0 3.27 15.6 24.60 73.8 6.71 11.3 11.60 -13.00C. L. C. 56.3 4.02 6.4 23.02 65.8 4.70 9.8 19.02 - 4.00A. T. 33.6 2.07 3.6 36.31 46.0 2.83 1.8 27.47 - 8.84
Mean ±SD 71.85 ±36.80 4.67 +1.93 6.8 ±4.7 21.41 ± 8.60 92.3 ±38.8 6.11 42.23 5.6 45.0 15.95 ± 6.37 - 5.46 ±4.04
Subjects with proved or highly suspected anomalous bifurcation of brachial artery excluded in this study.* Mean of 10- and 15-min measurements.
ing" levels during the second infusion of isotonicsodium chloride solution in 18 of the 23 patientsin whom this last infusion was made. During thissecond infusion of sodium chloride mean measuredlimb vascular resistances were 28.75 and 21.92 mmHg/ml per 100cc per min in hypertensives and normoten-sives, respectively. No significant change occurred inlimb venous segmental resistance during infusion ofmagnesium sulfate (mean change + 0.02 mm Hg/mlper 100cc per min) measured in nine subjects. De-crease in venous hematocrit was similar during con-trol isotonic sodium chloride (- 6.0%) and magnesium(- 4.7%) infusions, measured in eight subjects, a find-ing suggesting that decrease in resistance in responseto magnesium sulfate is not attributable to change inviscosity. Decreases in venous hematocrit during controlisotonic sodium chloride infusions were similar to theexpected decrease in hematocrit if there had been asimple addition of the infused solution to the initial
blood flow. This latter finding thus supports that ofWahren (4).
Small changes occurred in limb venous serum os-molarity and concentrations of sodium, potassium, andcalcium during control isotonic sodium chloride infu-sions (- 1.8 mOsmAiter, +±3.4 mEq/liter, - 0.6 mEq/liter, and - 0.83 mEq/liter, respectively [n = 9]).Similar small changes occurred during infusions of mag-nesium sulfate (- 1.7 mOsm/liter, + 1.6 mEq/liter,- 0.6 mEq/liter, and - 0.63 mEq/liter, respectively[n = 9]), a finding suggesting that the vascular effectof magnesium sulfate is not mediated via changes inserum osmolarity or concentrations of other vasoactiveelectrolytes.
Decrease in total forearm and hand vascular resistancewas significantly greater (P < 0.05) in hypertensives thanin normotensives by either parametric or nonparametricstatistical tests. However, in both hypertensives (r =0.891; P< 0.01) and normotensives (r = 0.714; P<
Indicator Dilution Measurement of Limb Blood Flow 1953
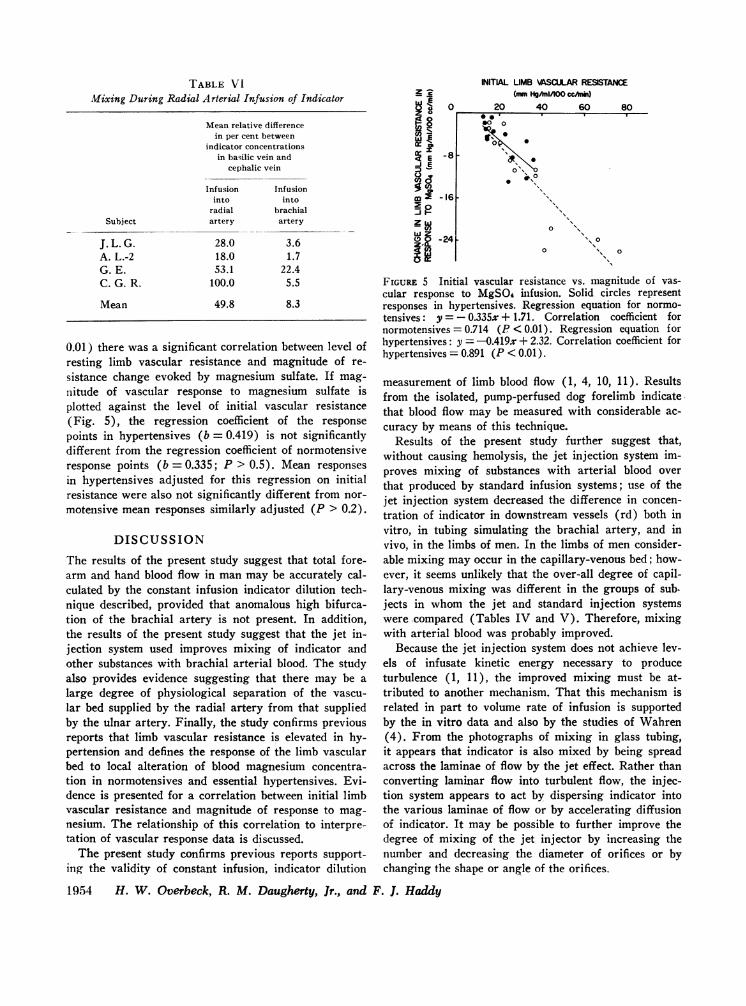
TABLE VIMixing During Radial Arterial Infusion of Indicator
Mean relative differencein per cent between
indicator concentrationsin basilic vein and
cephalic vein
Subject
J. L. G.A. L.-2G. E.C. G. R.
Mean
Infusioninto
radialartery
28.018.053.1
100.0
49.8
Infusioninto
brachialartery
3.61.7
22.45.5
8.3
0.01) there was a significant correlation between level ofresting limb vascular resistance and magnitude of re-
sistance change evoked by magnesium sulfate. If mag-
nitude of vascular response to magnesium sulfate isplotted against the level of initial vascular resistance(Fig. 5), the regression coefficient of the response
points in hypertensives (b = 0.419) is not significantlydifferent from the regression coefficient of normotensiveresponse points (b = 0.335; P > 0.5). Mean responses
in hypertensives adjusted for this regression on initialresistance were also not significantly different from nor-
motensive mean responses similarly adjusted (P > 0.2).
DISCUSSION
The results of the present study suggest that total fore-arm and hand blood flow in man may be accurately cal-culated by the constant infusion indicator dilution tech-nique described, provided that anomalous high bifurca-tion of the brachial artery is not present. In addition,the results of the present study suggest that the jet in-jection system used improves mixing of indicator andother substances with brachial arterial blood. The studyalso provides evidence suggesting that there may be a
large degree of physiological separation of the vascu-
lar bed supplied by the radial artery from that suppliedby the ulnar artery. Finally, the study confirms previousreports that limb vascular resistance is elevated in hy-pertension and defines the response of the limb vascularbed to local alteration of blood magnesium concentra-tion in normotensives and essential hypertensives. Evi-dence is presented for a correlation between initial limbvascular resistance and magnitude of response to mag-
nesium. The relationship of this correlation to interpre-tation of vascular response data is discussed.
The present study confirms previous reports support-ing the validity of constant infusion, indicator dilution
1954 H. W. Overbeck, R. M. Daugherty, Jr., and
zlE
_I_
8en '
c E
m-
IoiM
l.,
INITIAL LIMB \ASCULAR RESISTANCE(m Hg1n/100 ccAnin)
0 20 40 60 80
-8
0 000 0
00 0
0
0
-161
-241o
0 0o s
FIGURE 5 Initial vascular resistance vs. magnitude of vas-cular response to MgSO4 infusion. Solid circles representresponses in hypertensives. Regression equation for normo-tensives: y = - 0.335x + 1.71. Correlation coefficient fornormotensives = 0.714 (P < 0.01). Regression equation forhypertensives: y = -0.419x + 2.32. Correlation coefficient forhypertensives = 0.891 (P < 0.01).
measurement of limb blood flow (1, 4, 10, 11). Resultsfrom the isolated, pump-perfused dog forelimb indicatethat blood flow may be measured with considerable ac-curacy by means of this technique.
Results of the present study further suggest that,without causing hemolysis, the jet injection system im-proves mixing of substances with arterial blood overthat produced by standard infusion systems; use of thejet injection system decreased the difference in concen-tration of indicator in downstream vessels (rd) both invitro, in tubing simulating the brachial artery, and invivo, in the limbs of men. In the limbs of men consider-able mixing may occur in the capillary-venous bed; how-ever, it seems unlikely that the over-all degree of capil-lary-venous mixing was different in the groups of sub.jects in whom the jet and standard injection systemswere compared (Tables IV and V). Therefore, mixingwith arterial blood was probably improved.
Because the jet injection system does not achieve lev-els of infusate kinetic energy necessary to produceturbulence (1, 11), the improved mixing must be at-tributed to another mechanism. That this mechanism isrelated in part to volume rate of infusion is supportedby the in vitro data and also by the studies of Wahren(4). From the photographs of mixing in glass tubing,it appears that indicator is also mixed by being spreadacross the laminae of flow by the jet effect. Rather thanconverting laminar flow into turbulent flow, the injec-tion system appears to act by dispersing indicator intothe various laminae of flow or by accelerating diffusionof indicator. It may be possible to further improve thedegree of mixing of the jet injector by increasing thenumber and decreasing the diameter of orifices or bychanging the shape or angle of the orifices.
F. 1. Haddy
The data also indicate a large degree of physiologicalseparation of the vascular bed supplied by the radialartery from that supplied by the ulnar artery. Infu-sion into the radial artery resulted in appearance ofincreased indicator concentrations in the cephalic veinand decreased concentrations in the basilic vein. Thus,adequate mixing of vasoactive substances with arterialblood upstream to the bifurcation of the brachial arteryis necessary for the reliability of vascular responsestudies. Any system which improves arterial mixingshould improve this reliability. It is also essential to de-tect satisfactory mixing in such response studies, es-pecially in order to exclude anomalous high bifurcationof the brachial artery (2). The indicator dilution systemdescribed in the present paper offers both advantages.
The blood flows presented in Tables IV and V areunadjusted for intrabrachial arterial infusion rate. Theinfusion rate of 8 ml/min probably reduces limb vascu-lar resistance slightly (about - 4% in the pump-per-fused dog forelimb) and increases limb blood flow.These changes are produced by reduction in blood vis-cosity and perhaps also by increases in intrabrachialarterial pressure and decreases in concentrations ofvasoconstrictor chemicals. However, the absolute incre-ment in flow is uncertain, although data from the pres-ent study tend to support the findings of Wahren (4).suggesting a simple addition of the infused solution tothe initial blood flow.
Use of this constant infusion, indicator dilution tech-nique to measure resting vascular resistance in manconfirms plethysmographic observations that there isconsiderable overlap in limb vascular resistances be-tween normotensives and hypertensives, but that meanresistance in the hypertensive group is significantlygreater than that in the normotensive group (12, 13).Thus, the limb vascular bed appears to participate in theincrease in total peripheral vascular resistance in hy-pertension, suggesting that the limb vascular bed shouldparticipate in any abnormalities in vascular responsesexisting in hypertension.
In man limb vascular responses to local infusions ofmagnesium sulfate are similar to those in the pump-perfused forelimb of the dog (5). Previous data suggestthat the sulfate ion does not produce significant vasoac-
tivity (5). Thus in man the effect of local increases inserum magnesium ion concentration is a decrease invascular resistance, probably due to active vasodilation.It follows that the magnesium ion may be considered anendogenous vasodilator similar to bradykinin, histamine,and acetylcholine.
Limb vascular response to the magnesium ion, unad-justed for the different levels of initial vascular resistancein the two groups, is significantly greater in essential
hypertensives than in normotensives.' This exaggeratedresponse to exogenous magnesium ion suggests hyper-responsiveness to endogenous magnesium (and possiblyto other endogenous vasodilators) in hypertension.These exaggerated vasodilator effects should tend to op-pose the exaggerated responses to endogenous vasocon-strictors reported to exist in hypertensives (6). Thusinterpreted, the present data might suggest an abnor-mality in vascular wall magnesium metabolism in hy-pertension; it has been similarly suggested that hyper-responsiveness to catecholamines in hypertension may beattributed to an underlying defect in vascular wall so-dium metabolism (6).
On the other hand, in man a significant positive linearcorrelation between level of initial limb vascular re-sistance and magnitude of limb vascular response tovasoconstrictor agents has been reported (13). In thepresent study the data from both normotensive and hy-pertensive groups indicate that there is a similar sig-nificant positive linear correlation between initial re-sistance and magnitude of dilator response to the mag-nesium ion. The correlation is similar to that found inthe response of the dog forelimb, pump perfused at con-stant flow, to local magnesium infusions (14). Thissimilarity suggests that the correlation found in thelimb of man is not solely an effect of dosage (e.g. withinthe normotensive group a low resistance limb tends tohave a high blood flow, and thus a constantly infusedvasoactive agent would be more diluted than in the caseof a high resistance limb with a low blood flow). Ifthe correlation between initial resistance and magnitudeof response is considered in interpretation, the presentdata fail to provide evidence of an abnormality in thehypertensives' vascular response to the magnesium ion.This interpretation assumes that the normal linear re-lationship between initial resistance and magnitude ofresponse does not become curvilinear at high levels ofresistance. There is data from the pump-perfused fore-limb of the normotensive dog (with limb resistance arti-ficially elevated by local nerve stimulation, local angio-tensin II infusion, or hemorrhage) suggesting that theassumption of linearity at high resistance levels is cor-rect for the case of a vasodilator agent (15).
From the above discussion it is clear that conclusionsabout vascular wall magnesium metabolism in hyper-tension drawn from these data depend on the method ofinterpretation. If the relationship between initial re-sistance and magnitude of response is considered, theconclusions are opposite those if the relationship is ig-nored. Evidence has been presented indicating that ini-
1It is unlikely that this response difference could be ex-plained by a difference in Mg+ binding, because plasmaproteins and pH are reported similar in normotensives andessential hypertensives.
Indicator Dilution Measurement of Limb Blood Flow 1955

tial resistance is a significant source of variation in thepresent data. Therefore we favor considering initialresistance in interpretation and thus conclude that thelimb vascular response to the magnesium ion appearsto be similar in essential hypertensives and normoten-sives. Thus interpreted the present data would fail tosuggest an abnormality in vascular wall magnesiummetabolism in hypertension. However, these results donot preclude the possibility that there may be an abnor-mal vascular response to the magnesium ion at otherdosage levels or in other forms of hypertension, steroidor renal for example.
ACKNOWLEDGMENTSThe authors are grateful to Dr. Edward D. Freis for hishelpful suggestions and encouragement and to Dr. R. S.Derifield for his support of this project at the VeteransAdministration Hospital, Saginaw, Mich. The technical as-sistance of Irvin B. Kirkpatrick, Michael C. Fleck, Booker T.Swindall, Josephine Johnston, and Linda Risner is appre-ciated.
These studies were supported by Veterans Administrationfunds and by National Institutes of Health Grants HE 10922and HE 10778. These studies were performed in part duringthe tenure of a Veterans Administration Clinical Investigator-ship (Dr. Overbeck), a Public Health Service Career Devel-opment Award 7-K3-HE-31,793 (Dr. Overbeck), and PublicHealth Service Fellowship 25,783 (Dr. Daugherty).
REFERENCES1. Andres, R., K. L. Zierler, H. M. Anderson, W. N.
Stainsby, G. Cader, A. S. Ghrayyib, and J. L. Lilienthal,Jr. 1954. Measurement of blood flow and volume in theforearm of man; with notes on the theory of indicator-dilution and on production of turbulence, hemolysis, andvasdilation by intravascular injection. J. Clin. Invest.33: 482.
2. Baltzan, M. A., R. Andres, G. Cader, and K. L. Zierler.1965. Effects of epinephrine on forearm blood flow andmetabolism in man. J. Clin. Invest. 44: 80.
3. Walker, R. L., I. F. S. Mackay, and P. Van Loon. 1967.Vascular responses to venous congestion. J. Appl. Phvs-iol. 22: 889.
4. Wahren, J. 1965. A dye dilution method for the deter-mination of brachial artery blood flow during forearmexercise in man. Acta Physiol. Scand. 64: 477.
5. Overbeck, H. W., J. I. Molnar, and F. J. Haddy. 1961.Resistance to blood flow through the vascular bed ofthe dog forelimb. Local effects of sodium, potassium,calcium, magnesium, acetate, hypertonicity, and hypo-tonicity. Amer. J. Cardiol. 8: 533.
6. Mendlowitz, M., N. E. Naftchi, S. E. Gitlow, and R. L.Wolf. 1965. Vascular responsiveness in hypertensive andhypotensive states. Geriatrics. 20: 797.
7. Seller, R. H., A. N. Brest, and J. H. Moyer. 1965. Mag-nesium metabolism in hypertension. J. Amer. Med. Ass.191: 654.
8. Veterans administration cooperative study on antihyper-tensive agents. 1967. Effects of treatment on morbidity inhypertension. Results in patients with diastolic bloodpressures averaging 115 through 129 mmHg. J. Amer.Med. Ass. 202: 1028.
9. Mood, A. M. 1950. Introduction to the Theory ofStatistics. McGraw-Hill Book Company, Inc., NewYork. 1st edition.
10. Wuerflein, R. D., R. H. Smiley, and G. S. Campbell.1967. Comparison of femoral artery, femoral vein, andtotal hind limb blood flow in dogs. Amer. J. Surg. 114:653.
11. Cropp, G. J. A., and A. C. Burton. 1966. Theoreticalconsiderations and model experiments on the validity ofindicator dilution methods for measurements of variableflow. Circ. Res. 18: 26.
12. Conway, J. 1963. A vascular abnormality in hyperten-sion. Circulation. 27: 520.
13. Doyle, A. E., and J. R. E. Fraser. 1961. Vascular reac-tivity in hypertension. Circ. Res. 9: 755.
14. Overbeck, H. W., and F. J. Haddy. 1967. Forelimb vas-cular responses in renal hypertensive dogs. Physiologist.10: 270.
15. Drucker, A. J., and H. W. Overbeck. 1969. Influence ofinitial level of dog forelimb vascular resistance uponmagnitude of forelimb vascular response to methacholineand norepinephrine. Clin. Res. 17: 238.
1956 H. W. Overbeck, R. M. Daugherty, Ir., and F. 1. Haddy