contents · tthe reputation and equity built into he reputation and equity built into tthe zespri...
TRANSCRIPT


ContentsAbout Zespri . . . . . . . . . . . . . . . . . . . . . . . . . . . . . . . . . . . . . . . . . . . . . . . . . . . . . . . . . . . . . 2
Financial highlights . . . . . . . . . . . . . . . . . . . . . . . . . . . . . . . . . . . . . . . . . . . . . . . . 3
Zespri Chairman and Chief Executive Officer’s Report . . . . . . . . . . . . . . . . . . . . . . . 4-16
New cultivar breeding programme . . . . . . . . . . . . . . . . . . . . 17
Psa R&D update . . . . . . . . . . . . . . . . . . . . . . . . . . . . . . . . . . . . . . . . . . . . . . . . . . . . 18
Supply chain costs and improvements . . . . . . . . . . . . . . . 19
Industry performance . . . . . . . . . . . . . . . . . . . . . . . . . . . . . . . . . . . . . 20-25
Zespri offices and contact details . . . . . . . . . . . back cover
Zespri International Europe General Manager Bert Barmans with trade-customer Ruud Ackermans, responsible for fruit and vegetables at Jumbo Foodmarket in Breda, Netherlands.
Zesp
ri A
nnual R
evi
ew
2012/13

Zesp
ri A
nnual R
evi
ew
2012/13
1
Working together, the New Zealand kiwifruit industry has developed its own unique solutions to the challenges common to almost all primary producers in New Zealand – namely, distance-to-market, land and labour cost, exchange rates, scale constraints and a small domestic market. Our structure enables delivery and recognition of consistent quality through the Zespri brand and the scale to be truly competitive and successful in the global market.
These strengths have allowed an industry based on a seasonal crop to take a long-term, strategic view of its future development. The results of this long-term planning are clear from the outstanding growth the New Zealand kiwifruit industry has experienced since the Zespri brand was introduced in 1997.
While the impact of Psa has slowed the industry’s growth story, the fact remains that this year’s record average return per hectare of $51,153 delivered to New Zealand’s 2,700 kiwifruit growers is favourable compared with any other New Zealand primary industry.
With Zespri as its marketer, and the determination and innovation of growers at its core, the New Zealand kiwifruit industry has become the biggest horticultural industry in the country and one of the top-performing horticultural industries in the world.
2
Zesp
ri A
nnual R
evi
ew
2012/13
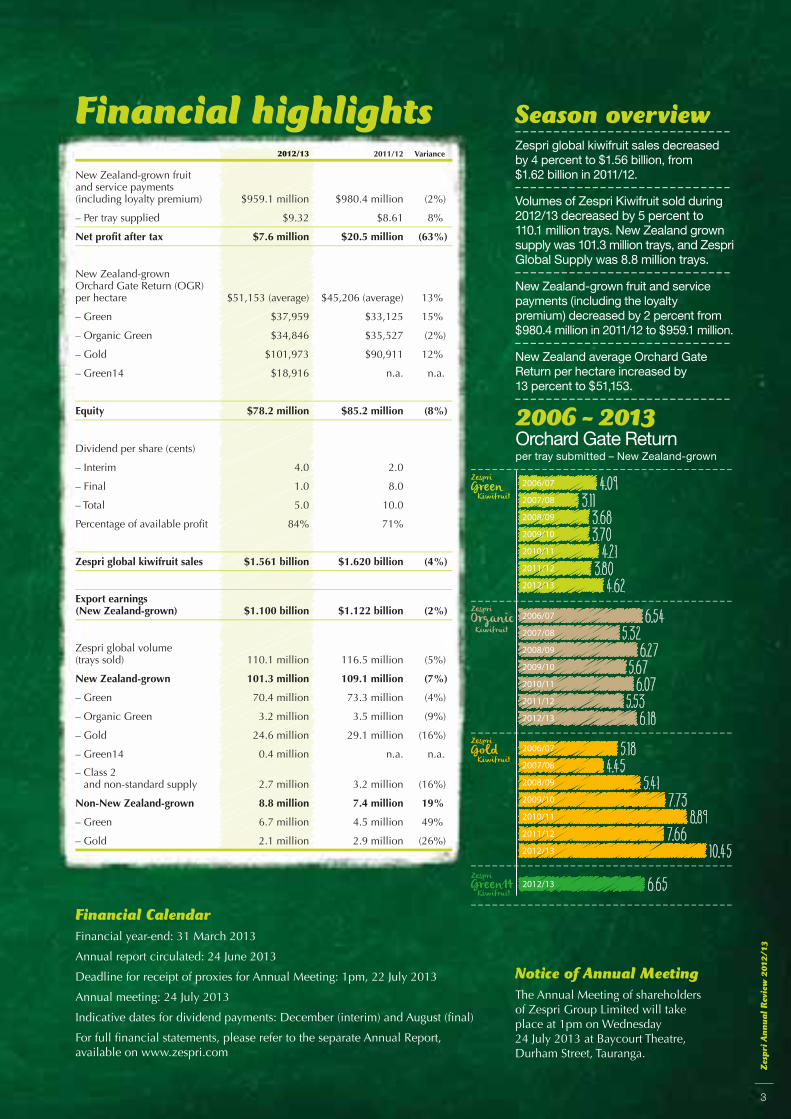
Orchard Gate Returnper tray submitted – New Zealand-grown
2006 - 2013
10.45
6.65
7.668.89
7.735.41
4.455.18
6.185.53
6.075.67
6.275.32
6.54
– – – – – – – – – – – – – – – – – – – – – – – – – – – – – – – – – – – – –ZespriGreen Kiwifruit
– – – – – – – – – – – – – – – – – – – – – – – – – – – – – – – – – – – – –ZespriOrganic Kiwifruit
– – – – – – – – – – – – – – – – – – – – – – – – – – – – – – – – – – – – –ZespriGold Kiwifruit
– – – – – – – – – – – – – – – – – – – – – – – – – – – – – – – – – – – – –ZespriGreen14 Kiwifruit– – – – – – – – – – – – – – – – – – – – – – – – – – – – – – – – – – – – –
2006/07
2007/08
2008/09
2009/10
2010/11
2011/12
2012/13
2006/07
2007/08
2008/09
2009/10
2010/11
2011/12
2012/13
2006/07
2007/08
2008/09
2009/10
2010/11
2011/12
2012/13
2012/13
4.623.804.21
3.703.68
3.114.09
–––––––––––––––––––––––––––––––––––––––––––––––––––––––––––––––––––––––––––––––––––––––––––––––––––––––––––––––––––––––––––––––––––––––––––––––––––––––––––––
Financial highlights
Financial Calendar
Financial year-end: 31 March 2013
Annual report circulated: 24 June 2013
Deadline for receipt of proxies for Annual Meeting: 1pm, 22 July 2013
Annual meeting: 24 July 2013
Indicative dates for dividend payments: December (interim) and August (final)
For full financial statements, please refer to the separate Annual Report, available on www.zespri.com
2012/13 2011/12 Variance
New Zealand-grown fruit and service payments (including loyalty premium) $959.1 million $980.4 million (2%)
– Per tray supplied $9.32 $8.61 8%
Net profit after tax $7.6 million $20.5 million (63%)
New Zealand-grownOrchard Gate Return (OGR) per hectare $51,153 (average) $45,206 (average) 13%
– Green $37,959 $33,125 15%
– Organic Green $34,846 $35,527 (2%)
– Gold $101,973 $90,911 12%
– Green14 $18,916 n.a. n.a.
Equity $78.2 million $85.2 million (8%)
Dividend per share (cents)
– Interim 4.0 2.0
– Final 1.0 8.0
– Total 5.0 10.0
Percentage of available profit 84% 71%
Zespri global kiwifruit sales $1.561 billion $1.620 billion (4%)
Export earnings (New Zealand-grown) $1.100 billion $1.122 billion (2%)
Zespri global volume (trays sold) 110.1 million 116.5 million (5%)
New Zealand-grown 101.3 million 109.1 million (7%)
– Green 70.4 million 73.3 million (4%)
– Organic Green 3.2 million 3.5 million (9%)
– Gold 24.6 million 29.1 million (16%)
– Green14 0.4 million n.a. n.a.
– Class 2 and non-standard supply 2.7 million 3.2 million (16%)
Non-New Zealand-grown 8.8 million 7.4 million 19%
– Green 6.7 million 4.5 million 49%
– Gold 2.1 million 2.9 million (26%)
Season overview– – – – – – – – – – – – – – – – – – – – – – – – – – – –Zespri global kiwifruit sales decreased by 4 percent to $1.56 billion, from $1.62 billion in 2011/12.– – – – – – – – – – – – – – – – – – – – – – – – – – – –Volumes of Zespri Kiwifruit sold during 2012/13 decreased by 5 percent to 110.1 million trays. New Zealand grown supply was 101.3 million trays, and Zespri Global Supply was 8.8 million trays. – – – – – – – – – – – – – – – – – – – – – – – – – – – –New Zealand-grown fruit and service payments (including the loyalty premium) decreased by 2 percent from $980.4 million in 2011/12 to $959.1 million.– – – – – – – – – – – – – – – – – – – – – – – – – – – –New Zealand average Orchard Gate Return per hectare increased by 13 percent to $51,153.– – – – – – – – – – – – – – – – – – – – – – – – – – – –
Notice of Annual Meeting
The Annual Meeting of shareholders of Zespri Group Limited will take place at 1pm on Wednesday 24 July 2013 at Baycourt Theatre, Durham Street, Tauranga.
3
Zesp
ri A
nnual R
evi
ew
2012/13

The reputation and equity built into The reputation and equity built into THE ZESPRI BRAND HAS DELIVERED THE ZESPRI BRAND HAS DELIVERED a substantial competitive advantage and a substantial competitive advantage and PREMIUM TO NEW ZEALAND GROWERS PREMIUM TO NEW ZEALAND GROWERS in terms of orchard returns and orchard values.in terms of orchard returns and orchard values.
This past year was characterised by outstanding sales and marketing performance in the face of continued economic pressure on global consumers and the destruction and uncertainty caused by Psa.
Zespri Chairman and Chief Executive Officer’s Report John Loughlin and Lain Jager
The highest Green returns since 2003 and 1,860 hectares of Hort16A grafted to Gold3 underline the determination of the New Zealand kiwifruit industry to recover momentum in the face of the strong New Zealand dollar and the impact of Psa.
There is no greater example of this than the fact that increased returns, particularly for Green growers, were the result of actions taken right across the industry supply chain. These include an on-orchard focus to deliver fruit that meets market preference, a greater attention to costs, significantly improved inventory management, foreign exchange hedging, stronger pricing and a responsive marketing strategy.
4
Zesp
ri A
nnual R
evi
ew
2012/13
STRONG UNDERLYING DEMANDIN THE GLOBAL ENVIRONMENT SAW
GREEN OGRs AT THEIRAT THEIR
HIGHEST LEVELSSINCE 2003/04.SINCE 2003/04.
Zespri Chairman and Chief Executive Officer’s Report – continued
On the demand side of our business, 2012/13 was characterised by:
Strong underlying demand for Zespri Kiwifruit in the context of the global economic environment
Robust pricing across all our markets, with Zespri Kiwifruit continuing to sell at a significant premium above competitor brands
Focusing on developing organic sales opportunities in our key markets of Japan, Europe and North America, where the concept of organics is well understood by customers
Outstanding performances in individual markets including France, Taiwan, China and Southeast Asia:
• France: total volumes sold up by 16 percent and total market contribution up by 17 percent on last year
• Taiwan: total volumes sold up by 14 percent and total market contribution up by 39 percent on last year
• China: total volumes sold up by 9 percent and total market contribution up by 22 percent on last year
• Southeast Asia: total volumes flat when compared to last year but total market contribution up by 15 percent on last year
• North America: total volumes dropped significantly but, on an overall total market contribution at a per-tray basis, were up by 18 percent.
On the supply side of our business, 2012/13 was characterised by:
Continued uncertainty in the Psa environment as evidenced by very uneven impacts across the industry, particularly at orchard level
The move from a Gold category based on Hort16A to one based on Gold3, with the grafting of around 1,860 hectares of Hort16A canopy to Gold3 in 2012; including this, 2,320 hectares of Gold3 were licenced in 2012/13
A high-dry-matter, good-tasting crop which drove very strong repeat purchasing by consumers – and consequently robust weekly sales rates
Strong supply chain collaboration, that supported significant gains in supply chain efficiencies with inventory costs – including condition check and repack, onshore and offshore fruit loss, and customer claims – down by 37 cents a tray.
Every season is typified by both challenges and successes and this past year has been no different. What sets this industry apart from its competitors, and most other primary producers in New Zealand and offshore, is the determination of New Zealand kiwifruit growers to work cooperatively to market their fruit with Zespri as their global brand.
The Single Point of Entry is a foundation stone of our industry’s success. It creates an extraordinary opportunity for our industry, but this alone does not create success. Success comes from the way we have taken opportunities – and the way we continue to act together to take opportunities – as the world changes. Past industry leaders saw the benefit in unity in marketing and in innovation, and they created the Zespri brand, which has been the industry’s beacon and the consumers’ indicator of kiwifruit quality since 1997.
During that time, the reputation and equity built into the Zespri brand has delivered a substantial competitive advantage and premium to New Zealand growers in terms of orchard returns and orchard values.
The advent of Psa has forced a break in the industry’s growth story and this has brought with it the chance to focus on value growth and supply chain efficiency. While there is no doubt that we remain in an environment of challenge and uncertainty, we are confident the entrepreneurial, innovative and cooperative spirit that has defined the New Zealand kiwifruit industry will support the strong recovery of growth and value.
On the dee2012/13 ww
StronggZesprithe gloo
Robusmarkecontinpremiu
Focusisales omarkeNorthof orgaaby cus
OutstaindividFranceSouthe
• Frabycoon
• Tabycoon
• Chbycoon
• Soflabuup
5
Zesp
ri A
nnual R
evi
ew
2012/13
2012/13
2011/12
2010/11
2009/10
2008/09
2007/08
2006/07
2005/06
2004/05
2003/04
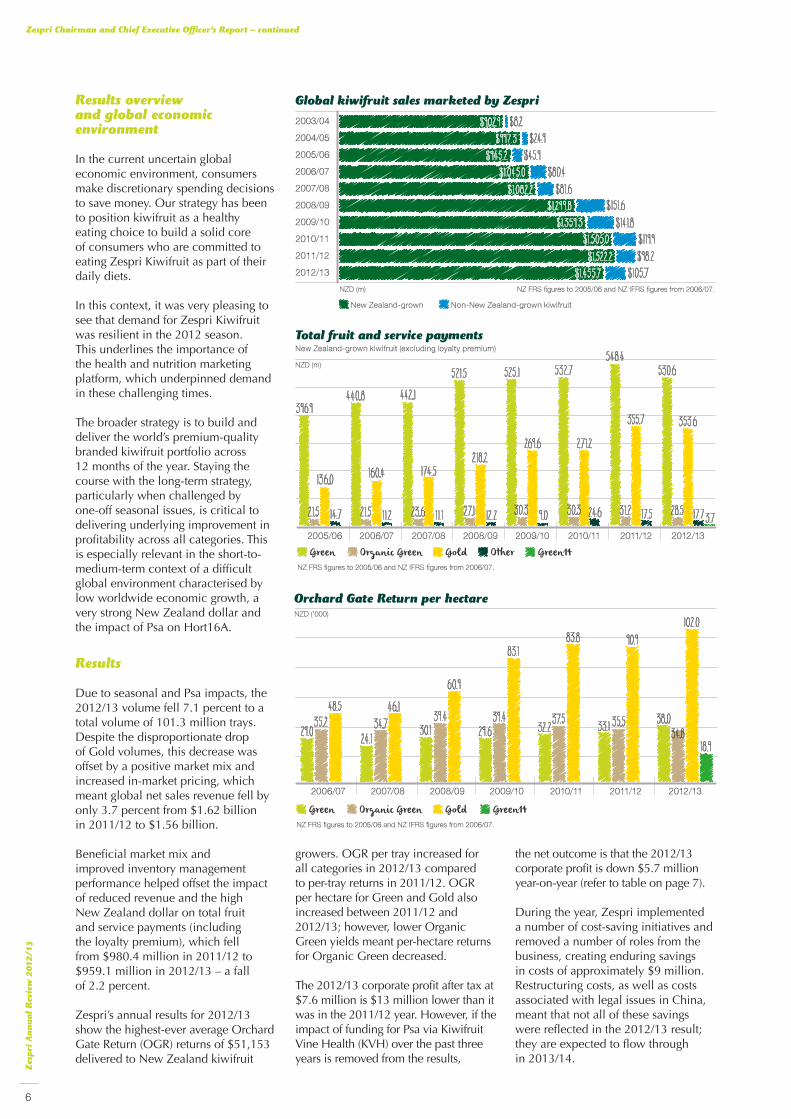
Global kiwifruit sales marketed by Zespri
$105.7$1,455.7$98.2$1,522.2$119.9$1,505.0
$141.8$1,359 .3$151.6$1,299 .8
$81.6$1,082.2$80.4$1,045.0
$45.9$945. 2$24.9$997.3
$8.2$902.9
NZD (m) NZ FRS figures to 2005/06 and NZ IFRS figures from 2006/07.
New Zealand-grown Non-New Zealand-grown kiwifruit
Total fruit and service paymentsNew Zealand-grown kiwifruit (excluding loyalty premium)
Green GoldOrganic Green Other Green142012/132011/122010/112009/102008/092007/082006/072005/06
396.9440.8 442 .1
521.5 525. 1 532.7548.4
530.6
136.0 160.4 174.5218.2
269.6 271.2
355.7 353.6
21.5 21.5 23.6 27.1 30.3 30.3 31.2 28.514.7 11 .2 11 .1 12 .2 9 .0 24.6 17.5 17.7 3.7
NZD (m)
NZ FRS figures to 2005/06 and NZ IFRS figures from 2006/07.
Orchard Gate Return per hectare
Green GoldOrganic Green Green14NZ FRS figures to 2005/06 and NZ IFRS figures from 2006/07.
NZD ('000)
2012/132011/122010/112009/102008/092007/082006/07
29 .0 24. 1 30. 1 29 .6 32 .2 33. 1 38.0
18.9
35. 2 34.7 39 .4 39 .4 37.5 35.534.8
48.5 46. 160.9
83. 183.8 90.9
102.0
Results overview and global economic environment
In the current uncertain global economic environment, consumers make discretionary spending decisions to save money. Our strategy has been to position kiwifruit as a healthy eating choice to build a solid core of consumers who are committed to eating Zespri Kiwifruit as part of their daily diets.
In this context, it was very pleasing to see that demand for Zespri Kiwifruit was resilient in the 2012 season. This underlines the importance of the health and nutrition marketing platform, which underpinned demand in these challenging times.
The broader strategy is to build and deliver the world’s premium-quality branded kiwifruit portfolio across 12 months of the year. Staying the course with the long-term strategy, particularly when challenged by one-off seasonal issues, is critical to delivering underlying improvement in profitability across all categories. This is especially relevant in the short-to-medium-term context of a difficult global environment characterised by low worldwide economic growth, a very strong New Zealand dollar and the impact of Psa on Hort16A.
Results
Due to seasonal and Psa impacts, the 2012/13 volume fell 7.1 percent to a total volume of 101.3 million trays. Despite the disproportionate drop of Gold volumes, this decrease was offset by a positive market mix and increased in-market pricing, which meant global net sales revenue fell by only 3.7 percent from $1.62 billion in 2011/12 to $1.56 billion.
Beneficial market mix and improved inventory management performance helped offset the impact of reduced revenue and the high New Zealand dollar on total fruit and service payments (including the loyalty premium), which fell from $980.4 million in 2011/12 to $959.1 million in 2012/13 – a fall of 2.2 percent.
Zespri’s annual results for 2012/13 show the highest-ever average Orchard Gate Return (OGR) returns of $51,153 delivered to New Zealand kiwifruit
growers. OGR per tray increased for all categories in 2012/13 compared to per-tray returns in 2011/12. OGR per hectare for Green and Gold also increased between 2011/12 and 2012/13; however, lower Organic Green yields meant per-hectare returns for Organic Green decreased.
The 2012/13 corporate profit after tax at $7.6 million is $13 million lower than it was in the 2011/12 year. However, if the impact of funding for Psa via Kiwifruit Vine Health (KVH) over the past three years is removed from the results,
the net outcome is that the 2012/13 corporate profit is down $5.7 million year-on-year (refer to table on page 7).
During the year, Zespri implemented a number of cost-saving initiatives and removed a number of roles from the business, creating enduring savings in costs of approximately $9 million. Restructuring costs, as well as costs associated with legal issues in China, meant that not all of these savings were reflected in the 2012/13 result; they are expected to flow through in 2013/14.
Zespri Chairman and Chief Executive Officer’s Report – continued
6
Zesp
ri A
nnual R
evi
ew
2012/13

The key factors impacting profitability in 2012/13 included:
Full provision of $12.6 million for penalties ordered by the court in the China Customs case (note: this decision was under appeal at the time of writing)
Many growers opted to take the deferred payment option for part of the 2012 new variety licence release. Payments due for those licences under the staggered payment scheme are subject to a number of conditions, accordingly future amounts due have not yet been recognised as income
12-month supply profit was impacted by reduced Gold volumes, particularly from Italy, but Green volumes sold in Europe were stronger than the previous year resulting in the net contribution from Zespri Global Supply (ZGS) increasing from $4.6 million to $5.3 million.
Foreign exchange
We are operating in an environment of a historically high New Zealand dollar relative to the US dollar and the Euro. These currencies have now been weak for some time and this means Zespri’s hedging positions are unavoidably deteriorating over time. We can partially shield growers from some of the impact in the short term but,
ultimately, cannot fully protect them against an extended adverse trend in foreign exchange (FX) rates.
Unfortunately, we are now seeing significant weakening in the Yen. However, the impact of this will be somewhat mitigated over the coming three seasons by the beneficial hedging we have put in place.
The value of Zespri’s hedging positions to the grower pools was $73.2 million for the 2012 season. To put this into perspective for Green growers, with no hedging in place for the 2012 season, the return would have been down 67 cents per tray.
We take this opportunity to remind growers that the outcome of Zespri’s hedging policy will not always be positive for the grower pools, as the strategy will take both the top and bottom off FX impacts. Current hedging positions are being taken within policy with one eye on the inevitable fall of the New Zealand dollar. We will continue to hedge within policy but are wary of being locked into high levels of cover at unfavourable rates so we will likely hedge at the lower end of our policy ranges for some currencies.
Looking forward, despite the relatively robust hedging we have in place for the Yen, we expect FX will remain a strong headwind for the next few
seasons. Any chance of immediate improvement is made less probable by the central banks in the United States, Japan and the European Union continuing to loosen monetary policy in an effort to kick-start growth. This strategic approach by these large economies means there is little obvious short-term FX relief in sight for New Zealand, or for other smaller economies around the world.
Global economy
The factors that shaped the global economy following the historic volatility of the 2008 Global Financial Crisis remain largely the same and will present ongoing challenges to our business. The combined structural long-term issues of high public and private debt, high unemployment and low business and consumer confidence continue to be a significant drag on the recovery of developed economies.
As a result of these factors, the forecast for the global economy is for more of the same. In its April 2013 World Economic Outlook, the International Monetary Fund summarised prospects for the global economy as “improving but the road to recovery in advanced economies remains bumpy”.
It appears likely that developing and emerging markets will be the global economic engine for the foreseeable future; this underlines the importance of our investment and focus in markets such as China, Southeast Asia, Latin America, the Middle East and India.
Psa funding2010/11
$m2011/12
$m2012/13
$mFuture years
$mTotal
$m
Psa NZ industry co-funding (income to Zespri) - 14.20 - - 14.20Psa funding to KVH (expense to Zespri) (12.20) (8.50) (4.30) - (25.00)Net income/(expense) before tax to Zespri (12.20) 5.70 (4.30) - (10.80)
2010/11 $m
2011/12 $m
2012/13 $m
Actual reported net profi t after tax 7.30 20.50 7.57After-tax impact of Psa-related expense/(income) 8.50 (4.10) 3.10Profi t after tax excluding Psa expense/(income) 15.80 16.40 10.66
Tax rate 30% 28% 28%
Equity and dividend returned
Equity NZD (m) Dividend NZD *(adjusted for 5 for 1 share split in 2010)
NZ FRS figures to 2005/06 and NZ IFRS figures from 2006/07.
Equi
ty N
ZD (m
) Dividend N
ZD
$0
$15
$30
$45
$60
$75
$90
2012
/13
2011
/12
2010
/11
2009
/10
2008
/09
2007
/08
2006/
07
2005
/06
2004
/05
2003
/04
$0.00
$0.05
$0.10
$0.15
$0.20
$0.25
$0.30
$0.35
$0.40
$0.10*$0.10*
$0.16* $0.16*$0. 20*
$0.14*$0.08 $0.10
$0.05
$0.31*$54
$77 $73 $68 $68 $74 $78 $72$85 $78
Zespri Group Limited
Zespri Chairman and Chief Executive Officer’s Report – continued
tal $m
00)0)
7
Zesp
ri A
nnual R
evi
ew
2012/13

Psa overview
It has been two-and-a-half years since the presence of Psa-V was first confirmed in New Zealand. Overcoming the disease is proving to be every bit as difficult as was first feared, with bacterial diseases in horticultural crops being among the most problematic to manage.
Regrettably, there is little chance of a ‘cure’ and, consequently, the focus of the New Zealand kiwifruit industry is on successfully growing kiwifruit in a Psa environment. Researchers, technical staff and growers are learning rapidly, understanding the disease and its impact on the various varieties, and learning how to manage orchards in a Psa environment and what tools are needed to manage in this situation.
Perhaps the most significant step in this process was taken last year with the grafting of 1,860 hectares of Hort16A to Gold3 – the start of a recovery pathway that must continue to be supported by continued research and development (R&D) and proactive on-orchard management.
There remains considerable uncertainty around how the various varieties will perform in the Psa environment. We need to experience another autumn and spring to see how the 2012 grafts come through this high-risk infection period and how more-mature Gold3 vines fare with the benefit of our increasing understanding of how best to manage this variety in this environment.
THE MOST S IGN IF ICANT STEPTHE MOST S IGN IF ICANT STEPGRAFTING OF 1GRAFTING OF 1 ,860 HECTARES860 HECTARESIN THIS PROCESS WAS LAST TAKEN LAST YEAR WITH THEIN THIS PROCESS WAS LAST TAKEN LAST YEAR WITH THE
OF HORT16A TO GOLD3 -OF HORT16A TO GOLD3 - THE START OF A RECOVERY THE START OF A RECOVERY PATHWAY THAT MUST CONTINUE TO BE SUPPORTED PATHWAY THAT MUST CONTINUE TO BE SUPPORTED BY CONTINUED R&D AND PROACTIVE BY CONTINUED R&D AND PROACTIVE ON-ORCHARD MANAGEMENT.ON-ORCHARD MANAGEMENT.
8
Zesp
ri A
nnual R
evi
ew
2012/13

However, while spring 2013 is likely to provide a much better understanding of how these varieties perform in the Psa environment, the recovery pathway will not be confirmed until we see production levels recover.
In the meantime, the Psa R&D programme and on-orchard innovation will continue to deliver greater insights into knowledge of the bacteria, and better systems and tools to manage it, to ensure this pathway is a success.
Among the key issues the industry needs to resolve are productivity and commercial viability in a Psa environment, male susceptibility, pollination challenges, increased operating costs and regional variability. On page 17 the progress of the breeding programme is outlined, although a long-term solution from this initiative remains some time away.
What is becoming increasingly obvious – and 2013/14 will highlight this further as cash flow diminishes for some growers – is the uneven impact of Psa across the industry. This is most severe at individual orchard level, particularly where part or entire canopies have been removed, and will cause personal hardship for many growers.
At post-harvest level, falling volumes have already seen operators resize their businesses. It is likely there will be further post-harvest consolidation in this competitive sector, as operators seek to optimise their businesses.
Because of the severe impact of Psa on some individuals, it is almost inevitable that the recovery pathway will be too difficult or too long for some orchardists and other stakeholders and we will lose good people from our industry.
In this context, we take this opportunity to commend the tremendous work of New Zealand Kiwifruit Growers Inc. (NZKGI), Kiwifruit Vine Health (KVH), post-harvest operators and many individuals in our community in supporting affected orchardists and staff through this difficult time.
Zespri in a Psa environment
Like all other stakeholders in the New Zealand kiwifruit industry, Zespri continues to adapt its business to the reality of a fall in Gold volumes due to Psa.
During the year, Zespri implemented a number of cost-saving initiatives and removed a number of roles from the business, creating enduring savings in costs of approximately $9 million. Overall, total overhead and innovation costs in 2012/13 were $7.7 million lower than the prior year. Further savings are expected to flow through in 2013/14.
The company will continue to adjust to the current climate. However, it is a complex balancing act to ensure we adjust financially to fit the circumstances, maintain the capacity to manage the business to a very high standard and continue to invest in the future through R&D and new market development. We have a responsibility to growers to ensure we can capitalise on their successful recovery from Psa.
In line with this, we have invested in the key areas of market development and innovation with the appointment of market managers in Brazil and the Middle East, and an ongoing strong commitment to innovation – particularly the Psa R&D programme. The appointment of Simon Chisholm as the General Manager of Supply Chain Development continues to drive supply chain efficiencies in this vital area of expenditure. None of these initiatives save corporate costs but all are in the best interests of New Zealand kiwifruit growers.
Beyond 2013, much will depend on the impact of Psa and the rate of Gold recovery. Our expectation is that we will then begin to see a rebuild of Gold volumes in 2014 and recovery to pre-Psa levels by 2016.
China Customs investigation
In March 2013, Zespri’s China-based subsidiary Zespri Jia Pei Fruit (Shanghai) Co.,Ltd (formerly Zespri Management Consulting (Shanghai) Co.,Ltd (ZMCC)) and a mid-level employee were found guilty of being accessories to the alleged under-declaration of customs duties by an independent importer Zespri formerly distributed to in Shanghai.
Zespri Chairman and Chief Executive Officer’s Report – continued
The subsidiary was fined around NZ$960,000 and its employee was sentenced to five years’ imprisonment. The court also ruled that “illegal gains” from the crime should be repaid, which related to the amount of money paid by the former importer to the subsidiary for marketing services, which were offset against the importer’s fruit account. Under this ruling, the illegal gains could amount to around NZ$11.6 million. As already indicated, Zespri has provisioned for the full amount of the fine and illegal gains.
At the time of writing, the subsidiary and its employee were waiting for their appeals to be heard by a Shanghai court.
While Zespri has been constrained by the legal process in China in what it can say publicly, the Board and Executive are committed to learning from both our experience in China and sharing these lessons with growers and shareholders in due course. In the meantime, our immediate focus has been on managing the legal process while ensuring the business continues to develop in China.
Simon Limmer has been appointed as Acting General Manager of China to allow us to make an immediate and clean break from the past. We will now take time through the 2013 season to review our import and distribution arrangements in the context of our longer-term growth strategy.
To date, several actions have been taken, including: changing import partners; renewing strong relationships with China Customs; and working with China-based advisors with long-standing experience and networks in China to develop a sustainable strategy based on relationships with trustworthy business partners.
Based on the China market performance in 2012/13 and the significant interest from leading private and state-owned companies in China in forming long-term relationships with Zespri, we believe the China Customs investigation will not have a lasting impact on the Zespri brand or our reputation in China.
We remain committed to developing this exciting market and to keeping shareholders and growers up-to-date as we refresh and implement our China strategy.
9
Zesp
ri A
nnual R
evi
ew
2012/13
Zesp
ri A
nnual R
evi
ew
2012/13
10
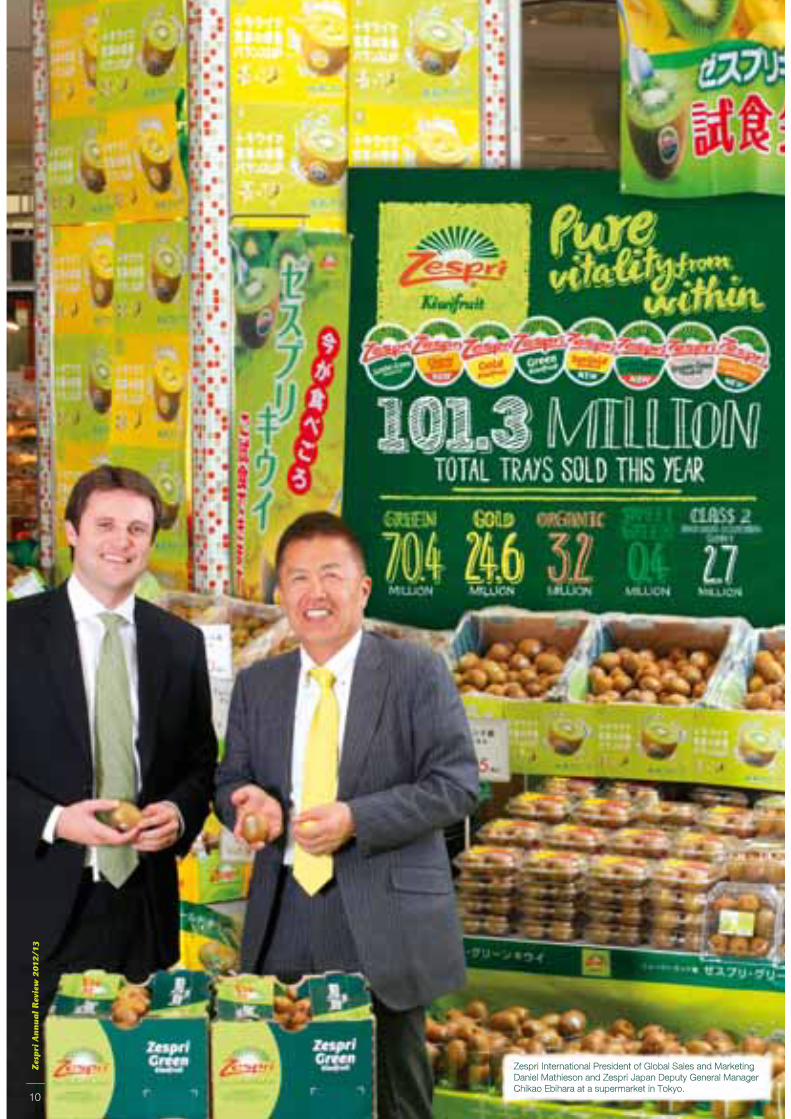
Zespri International President of Global Sales and Marketing Daniel Mathieson and Zespri Japan Deputy General Manager Chikao Ebihara at a supermarket in Tokyo.
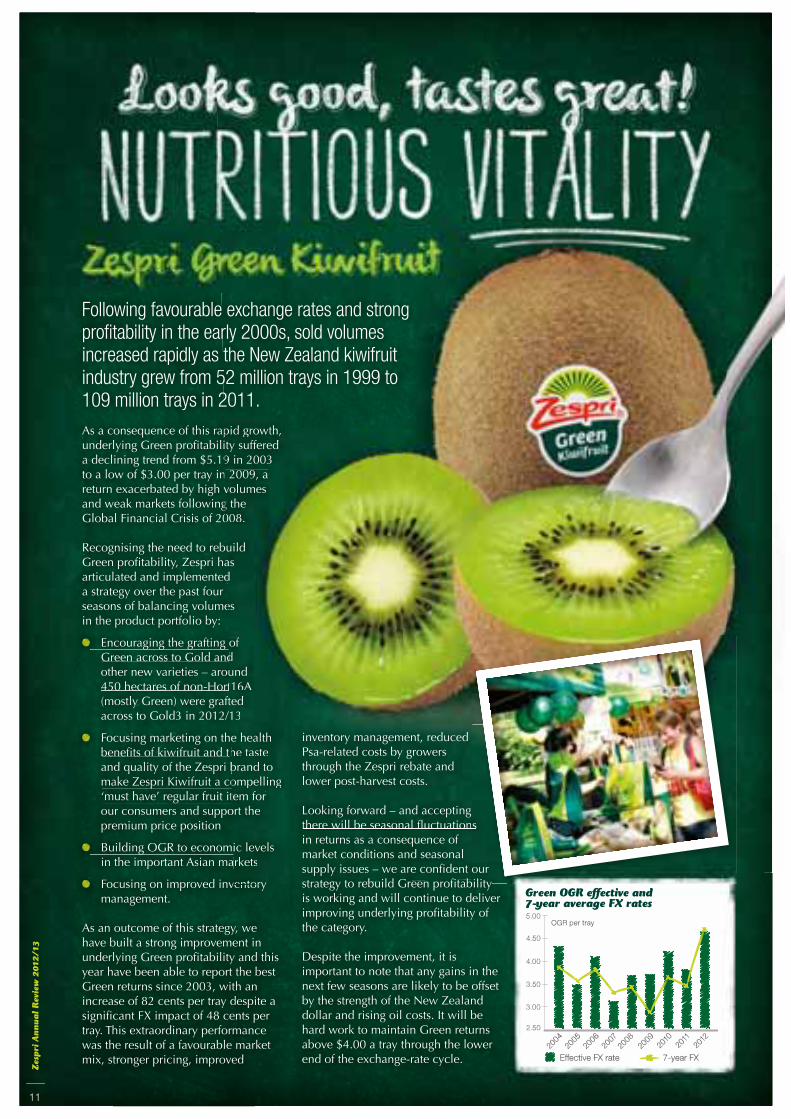
Green OGR effective and 7-year average FX rates
Effective FX rate 7-year FX
2.50
3.00
3.50
4.00
4.50
5.00
2012
2011
2010
2009
2008
2007
2006
2005
2004
OGR per tray
As a consequence of this rapid growth, underlying Green profitability suffered a declining trend from $5.19 in 2003 to a low of $3.00 per tray in 2009, a return exacerbated by high volumes and weak markets following the Global Financial Crisis of 2008.
Recognising the need to rebuild Green profitability, Zespri has articulated and implemented a strategy over the past four seasons of balancing volumes in the product portfolio by:
Encouraging the grafting of Green across to Gold and other new varieties – around 450 hectares of non-Hort16A (mostly Green) were grafted across to Gold3 in 2012/13
Focusing marketing on the health benefits of kiwifruit and the taste and quality of the Zespri brand to make Zespri Kiwifruit a compelling ‘must have’ regular fruit item for our consumers and support the premium price position
Building OGR to economic levels in the important Asian markets
Focusing on improved inventory management.
As an outcome of this strategy, we have built a strong improvement in underlying Green profitability and this year have been able to report the best Green returns since 2003, with an increase of 82 cents per tray despite a significant FX impact of 48 cents per tray. This extraordinary performance was the result of a favourable market mix, stronger pricing, improved
pid growth, ity suffered 9 in 2003 2009, a volumes g the 008.
uild d as s d
ess
of d und t16A ted 13
e health he taste brand to ompelling tem for ort the
ic levels arkets
ventory
Following favourable exchange rates and strong profitability in the early 2000s, sold volumes increased rapidly as the New Zealand kiwifruit industry grew from 52 million trays in 1999 to 109 million trays in 2011.
inventory management, reduced Psa-related costs by growers through the Zespri rebate and lower post-harvest costs.
Looking forward – and accepting there will be seasonal fluctuations in returns as a consequence of market conditions and seasonal supply issues – we are confident our strategy to rebuild Green profitability is working and will continue to deliver improving underlying profitability of the category.
Despite the improvement, it is important to note that any gains in the next few seasons are likely to be offset by the strength of the New Zealand dollar and rising oil costs. It will be hard work to maintain Green returns above $4.00 a tray through the lower end of the exchange-rate cycle.
s
our bilitybili
Zesp
ri A
nnual R
evi
ew
2012/13
11

Zespri Gold varieties are expected to contract to a combined varietal volume of between 12 to 13 million trays in 2013, as significant Hort16A volume is lost in heavily-infected Psa areas; 2012 class 1 volume was down 16 percent on the previous year, at 24.6 million trays, compared to 29.1 million in 2011/12. In response, our focus will be on continuing to deliver high-dry-matter, great-tasting fruit to our markets to maintain our premium position and build a platform for future growth.
Zespri will deliver promotions to develop the portfolio of Gold varieties in-market, particularly aimed at transitioning our regular and loyal customers to Zespri Gold3 Kiwifruit.
The 2012 Zespri Gold season was characterised by a shift in volume from Europe to Asia, as part of the strategy to manage the volume decrease against market demand over the next few years.
Gold kiwifruit is an underdeveloped segment of the global category and there are significant opportunities to grow sales, especially in the developing world. Zespri Gold3 supply will be directed to this sector of the market, while maintaining our established markets in Japan and Europe.
Supporting our trade-customer relationships is increasingly important in executing this strategy. Our past investment in building consumer demand for superior-tasting gold varieties will be critical for the future of this category, as the volume increases from 2014 onwards.
Around half of the total of one million Gold3 trays was sold in Europe this financial year; this fruit was very well received by consumers who have a
strong taste preference for this variety of gold kiwifruit. The remainder was sold throughout Asia, with a focus on building consumer and retailer confidence in the product, as part of the transition away from Zespri Gold (Hort16A). There was a higher degree of acceptability in all markets in 2012, due to the improved taste profile of this variety against the previous season.
In 2012, the majority of Gold9 variety was sold in Taiwan, Japan and China. Due to the permeance of the skin, as well as variable flesh colour, there was difficulty managing trade relationships, as well as consumer acceptance, particularly in Japan. However, Taiwan was able to run education campaigns at both trade and consumer levels, which enabled a higher acceptance of the product, with minimal fruit loss.
China received the product slightly later in the season and experienced higher fruit-loss levels, particularly for fruit in the smaller sizes.
High Gold9 fruit loss was incurred in 2012/13, as we continue to learn to improve the product quality, the delivery of taste, the colour and the skin appearance of this variety. Zespri is confident fruit loss will be lower in future, as we apply this learning.
In the 2012 year, Gold3 and Gold9 varieties were both marketed under the name SunGold. In 2013, Gold9 will be sold under the name Zespri Charm and will be sold predominantly in China, Hong Kong and Taiwan.
OGR per tray increased from $7.66 last financial year to $10.45 in 2012/13. This was largely due to strong demand, significant price increases and improved market mix. Cost savings were also achieved from reduced post-harvest expenses, lower average promotion costs and other direct expenditure in Japan and East Asian markets.
Zespri Gold varieties acontract to a combineof between 12 to 13 m2013, as significant Holost in heavily-infectedclass 1 volume was doon the previous year, atrays, compared to 29.2011/12. In response, be on continuing to dematter, great-tasting fruto maintain our premiubuild a platform for fut
Gold kiwifruit is an undsegment of the global cthere are significant oppgrow sales, especially inworld. Zespri Gold3 supdirected to this sector ofwhile maintaining our emarkets in Japan and Eu
OGR per tray increased
Zesp
ri A
nnual R
evi
ew
2012/13
12
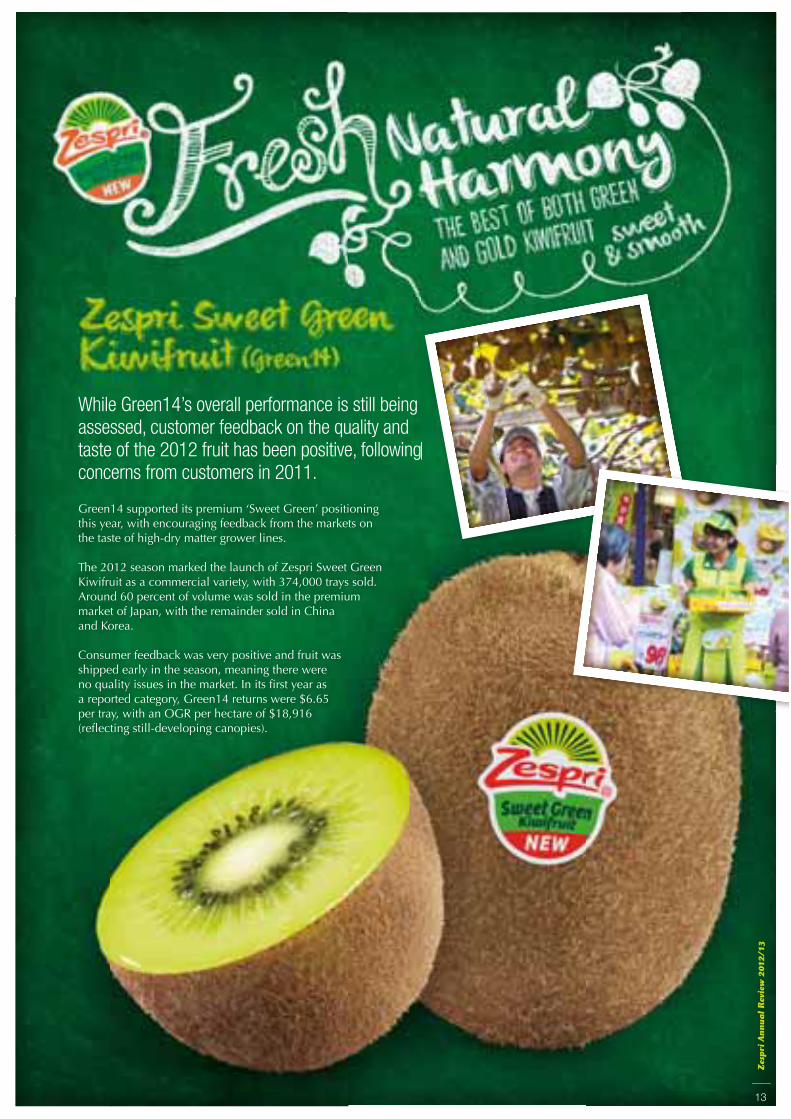
Green14 supported its premium ‘Sweet Green’ positioning this year, with encouraging feedback from the markets on the taste of high-dry matter grower lines.
The 2012 season marked the launch of Zespri Sweet Green Kiwifruit as a commercial variety, with 374,000 trays sold. Around 60 percent of volume was sold in the premium market of Japan, with the remainder sold in China and Korea.
Consumer feedback was very positive and fruit was shipped early in the season, meaning there were no quality issues in the market. In its first year as a reported category, Green14 returns were $6.65 per tray, with an OGR per hectare of $18,916 (reflecting still-developing canopies).
While Green14’s overall performance is still being assessed, customer feedback on the quality and taste of the 2012 fruit has been positive, following concerns from customers in 2011.
Zesp
ri A
nnual R
evi
ew
2012/13
13
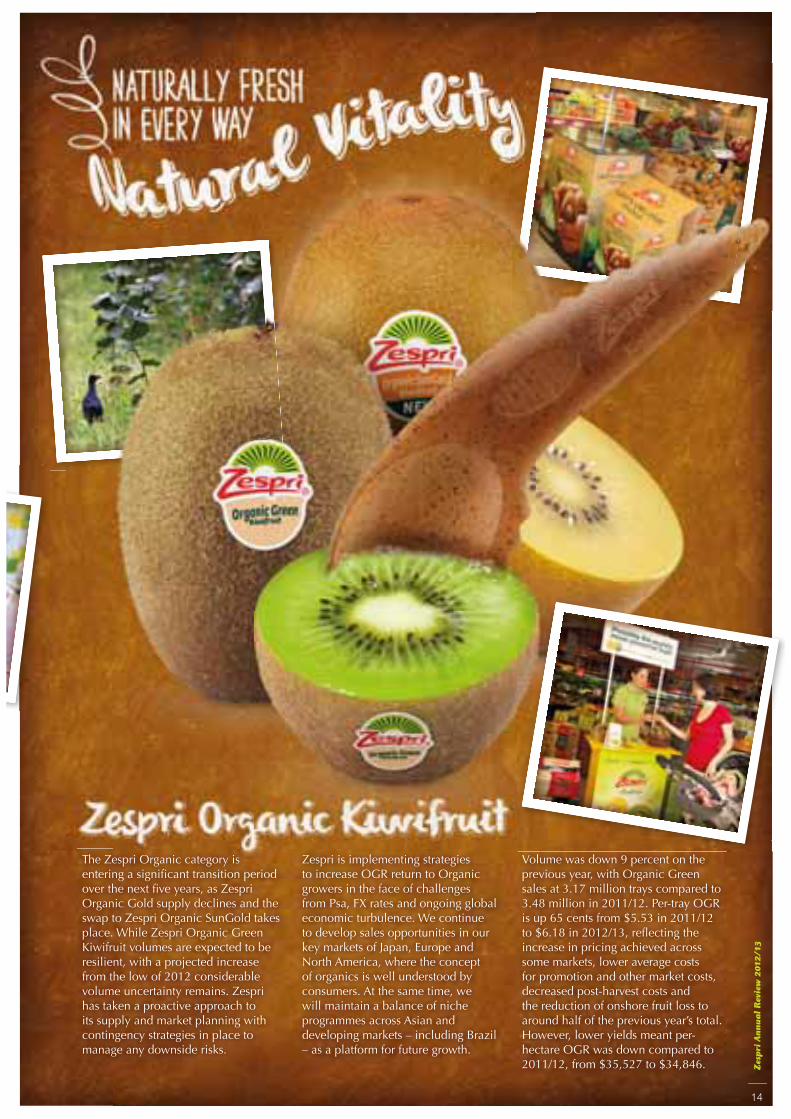
The Zespri Organic category is entering a significant transition period over the next five years, as Zespri Organic Gold supply declines and the swap to Zespri Organic SunGold takes place. While Zespri Organic Green Kiwifruit volumes are expected to be resilient, with a projected increase from the low of 2012 considerable volume uncertainty remains. Zespri has taken a proactive approach to its supply and market planning with contingency strategies in place to manage any downside risks.
Zespri is implementing strategies to increase OGR return to Organic growers in the face of challenges from Psa, FX rates and ongoing global economic turbulence. We continue to develop sales opportunities in our key markets of Japan, Europe and North America, where the concept of organics is well understood by consumers. At the same time, we will maintain a balance of niche programmes across Asian and developing markets – including Brazil – as a platform for future growth.
Volume was down 9 percent on the previous year, with Organic Green sales at 3.17 million trays compared to 3.48 million in 2011/12. Per-tray OGR is up 65 cents from $5.53 in 2011/12 to $6.18 in 2012/13, reflecting the increase in pricing achieved across some markets, lower average costs for promotion and other market costs, decreased post-harvest costs and the reduction of onshore fruit loss to around half of the previous year’s total. However, lower yields meant per-hectare OGR was down compared to 2011/12, from $35,527 to $34,846. Z
esp
ri A
nnual R
evi
ew
2012/13
14
Sales and Marketing structure
Through the decade from 2000, the New Zealand kiwifruit industry doubled in size from around 50 million trays to more than 100 million trays in 2011. This growth was built on our cooperative foundation in New Zealand, coupled with a very successful decentralised approach in the market which enabled a strong market-led strategy.
Not only has the business grown significantly over time but it will continue to become more complex as we bring new kiwifruit products to market, develop some very challenging new markets, extend into 12-month supply, increase the sophistication of our marketing programme and contend with ever-more complex and demanding global compliance requirements.
In order to position the business for future growth, Zespri embarked on a considerable change to its organisational design and culture on the market side of the business in 2009. The objectives of this sophisticated change programme are to:
Strengthen strategic capability and focus on the sales and marketing side of the business
Empower country managers while ensuring they are supported by clear strategy, objectives and compliance systems, including checks and balances and transparent monitoring
Reinforce the global marketing function.
We have been implementing this multi-year change programme progressively with the aim to empower and upskill country-level managers while ensuring they are adequately supported with systems and strategy. This structure requires a considerable adjustment of style for our regional General Managers, as they move from hands-on operators to leaders focusing on empowering and enabling their teams to achieve clear objectives within a global strategic framework.
A fundamental decision has been to create a President of Global Sales and Marketing position to lead the global sales and marketing team.
This decision recognises that Zespri’s CEO simply cannot sufficiently be in the market enough to lead the market-side strategy effectively, particularly when our industry structure requires the CEO to be based at the company’s headquarters in New Zealand.
A second major change has been to base our General Manager of Marketing in the markets and strengthen the reporting lines with country Marketing Managers to enable local execution of a cohesive global marketing strategy. This has been an important step to leverage our worldwide marketing spend as the strategy becomes more sophisticated.
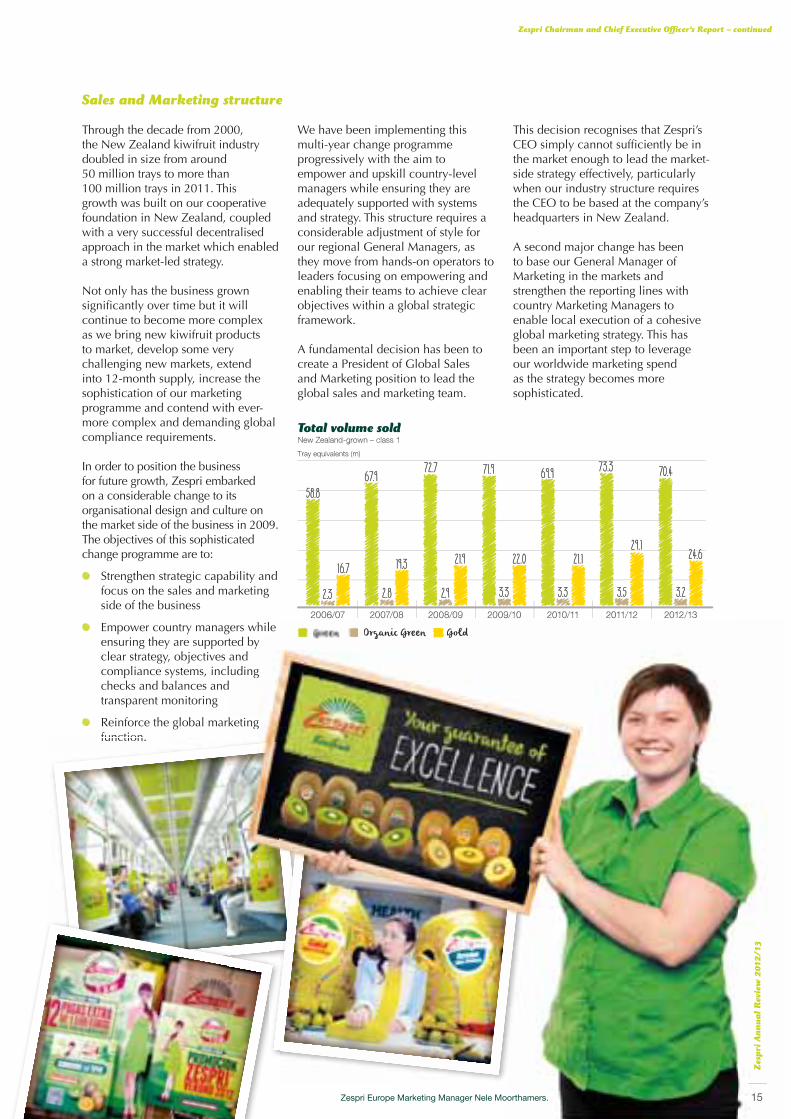
Total volume soldNew Zealand-grown – class 1
GoldOrganic Green
Tray equivalents (m)
2012/132011/122010/112009/102008/092007/082006/07
58.867.9 72 .7 71 .9 69 .9 73.3 70.4
2 .3 2 .8 2.9 3.3 3.3 3.5 3. 216.7 19 .3 21 .9 22 .0 21. 1
29 . 124.6
function.
gers whilerted by and luding
d
rketing
GoldOrganic Green
Zespri Europe Marketing Manager Nele Moorthamers.
Zespri Chairman and Chief Executive Officer’s Report – continued
15
Zesp
ri A
nnual R
evi
ew
2012/13
John LoughlinCHAIRMAN
Lain JagerCHIEF EXECUTIVE OFFICER
John Loughlin, chairman of the Zespri Board since 2008, stepped down on 30 April 2013.At this time, Peter McBride became the new chairman of the Zespri Board. The Zespri Chairman and Chief Executive Officer’s report is signed by John since he was chairman during the 2012/13 season. The Annual Report was not finalised until late May and for this reason has been signed by Peter, current chairman of the Board.
Global supply
The profit from 12-month supply was $5.3 million in 2012/13, up from $4.6 million in 2011/12.
As for New Zealand-grown Zespri Green Kiwifruit, demand for Green in the 12-month business in 2012/13 was strong and matched by an increase in Green supply of more than 2 million trays above that delivered in 2011/12.
Gold volumes fell from 2.9 million trays in 2011/12 to 2.1 million trays in 2012/13, due to the ongoing impact of Psa in Europe and damage caused by Typhoon Bolaven which affected Korea in August 2012.
However, the Gold recovery pathway is under way in France and Italy, with the grafting of around 200 hectares (predominantly Hort16A) to Gold3 last season. To date, grafting has been successful with two hot summers in Europe. Winter in 2012/13 was mild in Italy and very wet in France, resulting in some expressions of Psa as we enter into the critical spring period. Significant Psa-related work has been undertaken in our Zespri offshore locations and this has helped fast-track our learning back in New Zealand.
Strong grower appetite for Zespri varieties in the 12-month programme and established supply relationships provide a solid platform to regenerate Gold volumes in coming years.
Supply chain efficiencies
Making gains for growers through supply chain efficiencies continues to be a focus for Zespri and the wider industry. This work is long term and incremental with initiatives right along the supply chain – from on-orchard to post-harvest and Zespri and then to the customer – progressively cutting out cost and waste. This industry effort is beginning to deliver results, with savings of 35 cents per tray equivalent (TE) since 2010 achieved through improved inventory management. Further information on this work can be found on page 19 of this report.
Outlook
To operate successfully in the current global economic environment, our
approach is to focus on controlling what we can influence – innovation, taste, quality, costs, productivity, promotion and price – in order to weather the impact of the strong New Zealand dollar and the troubled global financial environment.
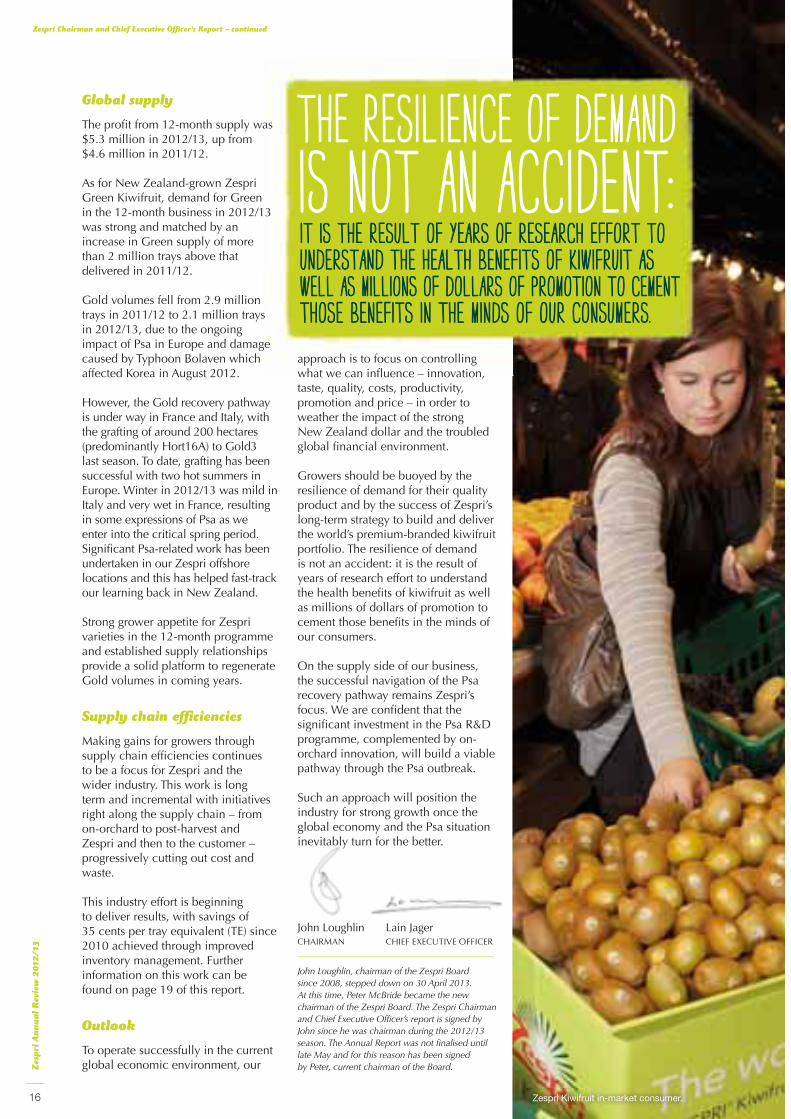
Growers should be buoyed by the resilience of demand for their quality product and by the success of Zespri’s long-term strategy to build and deliver the world’s premium-branded kiwifruit portfolio. The resilience of demand is not an accident: it is the result of years of research effort to understand the health benefits of kiwifruit as well as millions of dollars of promotion to cement those benefits in the minds of our consumers.
On the supply side of our business, the successful navigation of the Psa recovery pathway remains Zespri’s focus. We are confident that the significant investment in the Psa R&D programme, complemented by on-orchard innovation, will build a viable pathway through the Psa outbreak.
Such an approach will position the industry for strong growth once the global economy and the Psa situation inevitably turn for the better.
Zespri Chairman and Chief Executive Officer’s Report – continued
THE RESILIENCE OF DEMANDTHE RESILIENCE OF DEMANDIS NOT AN ACCIDENTIS NOT AN ACCIDENT:IT IS THE RESULT OF YEARS OF RESEARCH EFFORT TO IT IS THE RESULT OF YEARS OF RESEARCH EFFORT TO UNDERSTAND THE HEALTH BENEFITS OF KIWIFRUIT AS UNDERSTAND THE HEALTH BENEFITS OF KIWIFRUIT AS WELL AS MILLIONS OF DOLLARS OF PROMOTION TO CEMENT WELL AS MILLIONS OF DOLLARS OF PROMOTION TO CEMENT THOSE BENEFITS IN THE MINDS OF OUR CONSUMERS.THOSE BENEFITS IN THE MINDS OF OUR CONSUMERS.
16
Zesp
ri A
nnual R
evi
ew
2012/13
Zespri Kiwifruit in-market consumer.
New cultivar breeding programmeZespri’s breeding programme has historically been focused on developing new cultivars with superior productivity, taste and storage, and novel varieties to attract new consumers to the category and acquire new shelf space.
With the arrival of Psa in New Zealand, the programme has also been re-tasked to provide a long-term solution to the Psa outbreak in New Zealand by developing Psa-tolerant and resistant kiwifruit cultivars. Researchers still need to deliver cultivars with superior productivity, taste, storage and novelty – but now they are breeding for tolerance to Psa as well.
We are confident that a more-Psa-tolerant cultivar will be found, as researchers confirm strong parental influence on the Psa susceptibility of seedlings, which means our ability to breed more Psa-tolerant cultivars from existing elite parents in New Zealand is high. However, this work takes time – about 10 years from a seed to having budwood ready to graft on the orchard.
Fortunately, there are tens of thousands of different seedlings in the ‘development pipeline’. This means there is hope that existing seedlings or clonal selections can be identified to meet the new requirements of growing in a Psa environment. (See the diagram below for more information.)
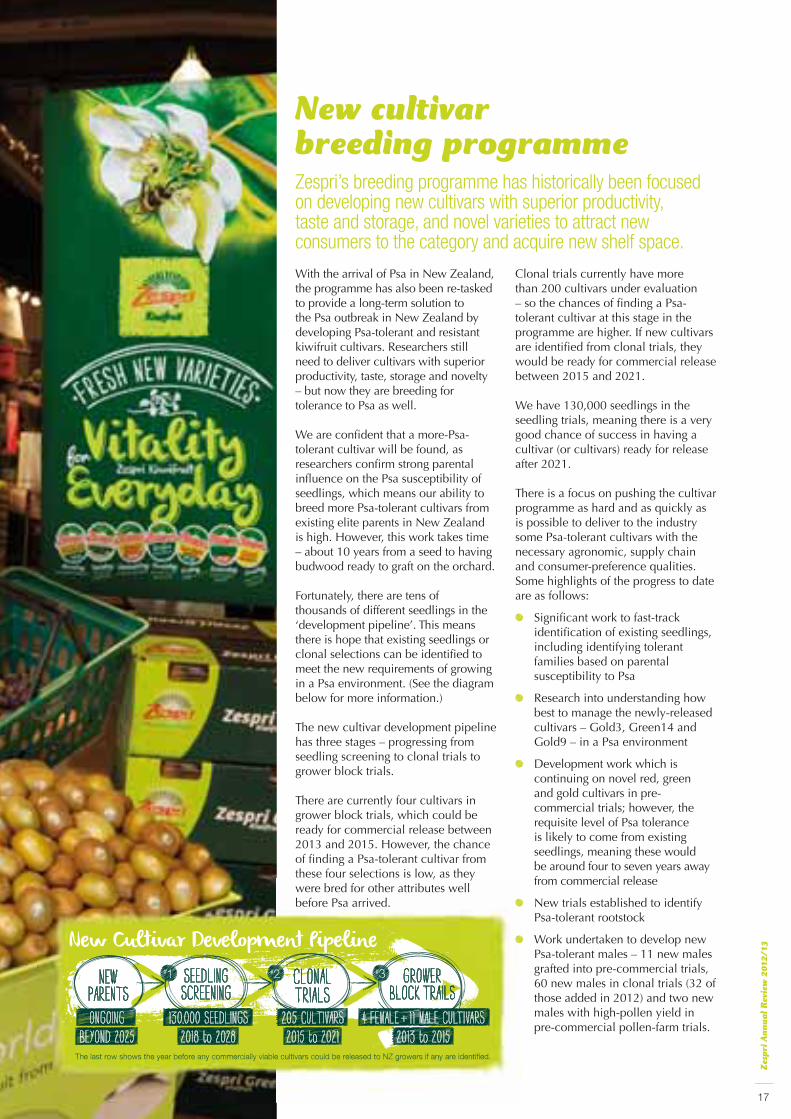
The new cultivar development pipeline has three stages – progressing from seedling screening to clonal trials to grower block trials.
There are currently four cultivars in grower block trials, which could be ready for commercial release between 2013 and 2015. However, the chance of finding a Psa-tolerant cultivar from these four selections is low, as they were bred for other attributes well before Psa arrived.
Clonal trials currently have more than 200 cultivars under evaluation – so the chances of finding a Psa-tolerant cultivar at this stage in the programme are higher. If new cultivars are identified from clonal trials, they would be ready for commercial release between 2015 and 2021.
We have 130,000 seedlings in the seedling trials, meaning there is a very good chance of success in having a cultivar (or cultivars) ready for release after 2021.
There is a focus on pushing the cultivar programme as hard and as quickly as is possible to deliver to the industry some Psa-tolerant cultivars with the necessary agronomic, supply chain and consumer-preference qualities. Some highlights of the progress to date are as follows:
Significant work to fast-track identification of existing seedlings, including identifying tolerant families based on parental susceptibility to Psa
Research into understanding how best to manage the newly-released cultivars – Gold3, Green14 and Gold9 – in a Psa environment
Development work which is continuing on novel red, green and gold cultivars in pre-commercial trials; however, the requisite level of Psa tolerance is likely to come from existing seedlings, meaning these would be around four to seven years away from commercial release
New trials established to identify Psa-tolerant rootstock
Work undertaken to develop new Psa-tolerant males – 11 new males grafted into pre-commercial trials, 60 new males in clonal trials (32 of those added in 2012) and two new males with high-pollen yield in pre-commercial pollen-farm trials.
NEWPARENTS
CLONALTRIALS
GROWERBLOCK TRAILS
ONGOINGBEYOND 2025
130,000 SEEDLINGS2018 to 2028
205 CULTIVARS2015 to 2021
4 FEMALE + 11 MALE CULTIVARS2013 to 2015
The last row shows the year before any commercially viable cultivars could be released to NZ growers if any are identified.
#1 #2 #3SEEDLINGSCREENING
New Cultivar Development Pipeline
17
Zesp
ri A
nnual R
evi
ew
2012/13
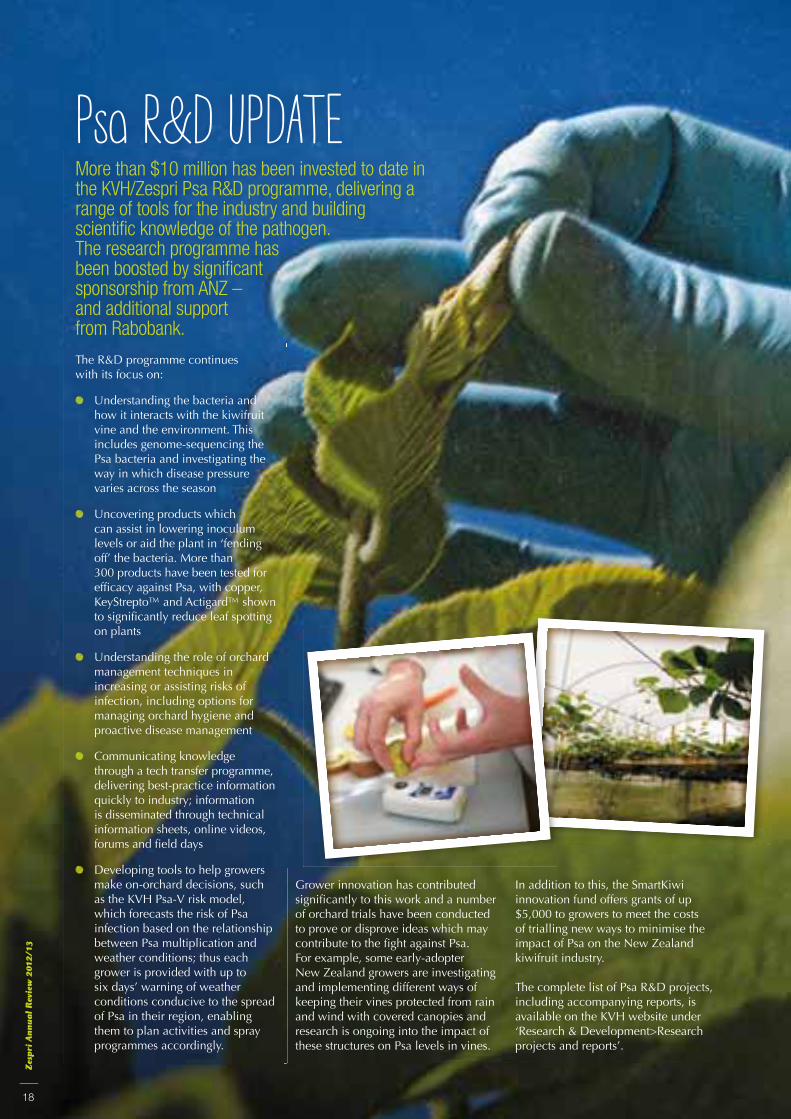
Psa R&D UPDATEMore than $10 million has been invested to date in the KVH/Zespri Psa R&D programme, delivering a range of tools for the industry and building scientific knowledge of the pathogen. The research programme has been boosted by significant sponsorship from ANZ –and additional support from Rabobank.
The R&D programme continues with its focus on:
Understanding the bacteria and how it interacts with the kiwifruit vine and the environment. This includes genome-sequencing the Psa bacteria and investigating the way in which disease pressure varies across the season
Uncovering products which can assist in lowering inoculum levels or aid the plant in ‘fending off’ the bacteria. More than 300 products have been tested for efficacy against Psa, with copper, KeyStrepto™ and Actigard™ shown to significantly reduce leaf spotting on plants
Understanding the role of orchard management techniques in increasing or assisting risks of infection, including options for managing orchard hygiene and proactive disease management
Communicating knowledge through a tech transfer programme, delivering best-practice information quickly to industry; information is disseminated through technical information sheets, online videos, forums and field days
Developing tools to help growers make on-orchard decisions, such as the KVH Psa-V risk model, which forecasts the risk of Psa infection based on the relationship between Psa multiplication and weather conditions; thus each grower is provided with up to six days’ warning of weather conditions conducive to the spread of Psa in their region, enabling them to plan activities and spray programmes accordingly.
Grower innovation has contributed significantly to this work and a number of orchard trials have been conducted to prove or disprove ideas which may contribute to the fight against Psa. For example, some early-adopter New Zealand growers are investigating and implementing different ways of keeping their vines protected from rain and wind with covered canopies and research is ongoing into the impact of these structures on Psa levels in vines.
In addition to this, the SmartKiwi innovation fund offers grants of up $5,000 to growers to meet the costs of trialling new ways to minimise the impact of Psa on the New Zealand kiwifruit industry.
The complete list of Psa R&D projects, including accompanying reports, is available on the KVH website under ‘Research & Development>Research projects and reports’.
Zesp
ri A
nnual R
evi
ew
2012/13
18

Zespri, along with the broader kiwifruit supply chain, has focused on supply chain efficiency and is progressively making improvements. This focus on efficiency follows the period of enormous growth the industry has experienced over the past 10 years.
It is important to understand where the major costs lie in the supply chain. Figure 1 below shows that, typically, from a Zespri Green sales price of $12.00 per tray, the grower receives about a third. The significant costs are New Zealand packing and coolstorage, promotion, duty and customs, quality control and freight.
Figure 2 shows how these major cost items have changed since the 2010 season. New Zealand packing costs have reduced by 19 cents per tray as a result of post-harvest efficiency and the competitive environment. Onshore direct costs have remained stable despite the increased level of residue testing for multiple products, including antibiotics. The freight increase is due to the rising cost of oil.
It is very encouraging to see how quality-related costs have significantly reduced. Another way of looking at
the cost of quality control is shown in Figure 3. This shows an improvement of 41 cents per tray of Zespri Green Kiwifruit in quality costs over a two-year period.
There have been many initiatives along the supply chain as growers focus on picking quality, harvest fruit at optimal maturity and learn more about the effect of growing practices on fruit storage. The post-harvest sector has complemented this with attention to harvest management, gentle handling, cool chain integrity and inventory management.
The coordination between post-harvest and Zespri from coolstore to customer has further enhanced the way fruit is managed. Improvements have been made in planning, inventory levels and inventory-management systems; the focus is on optimising the season-end, using RFID tags to
measure the coolchain and changing commercial drivers to encourage post-harvest operators to focus on fruit quality in-market rather than just at the wharf. Metaphorically, the supply chain has become shorter, with end-to-end information integration and cooperation.
The next challenge is to cement this improvement framework into the supply chain. Benchmarking and transparency are fundamental to establishing priorities. However, more importantly, the key is the seamless integration of the supply chain from coolstore to customer and aligned objectives which work towards continuous improvement. The industry has Zespri’s commitment to this approach and this is demonstrated by the establishment of a Zespri Board subcommittee to support the organisation’s focus on supply chain efficiency and improvement.
SUPPLY CHAIN COSTS AND IMPROVEMENTS
$0.00
$0.20
$0.40
$0.60
$0.80
$1.00
$1.20
2012 2011 2010
Per
Sub
mit
Tray
$0
$2.00
$4.00
$6.00
$8.00
$10.00
$12.00
$14.00
2012
at 20
10 F
X20
11
at 20
10 F
X20
10
Figure 3Green quality costs (10yr FX)
Figure 2Green changes 2010 to 2012 (at 2010 FX rates)
Figure 1Green cost benchmark
Discounts
Quality claims
Condition checking
Repacking
Offshore fruit loss
Repacking/condition checking
Onshore fruit loss
-$0.3
5
-$0.3
0
-$0.2
5
-$0.2
0-$
0.15-$
0.10
-$0.0
5 $0 $0
.05 $0
.10
Zespri margin Freight Insurance Vessel discharge Duty and customs Offshore direct costs Offshore fruit loss Claims & discounts Onshore direct costs Promotion KNZ/NZKGI costs Interest income/(expense) NZ packing NZ coolstorage NZ logistics NZ fruit loss NZ CC/RK costs Grower payments
per tray submit NZ CC/RK costs NZ fruit loss NZ logistics NZ coolstorage NZ packing Interest income/(expense) KNZ/NZKGI costs Promotion Onshore direct costs Claims & discounts Offshore fruit loss Offshore direct costs Duty and customs Vessel discharge Insurance Freight Zespri margin
19
Zesp
ri A
nnual R
evi
ew
2012/13

Zespri alternative revenue statement2012/13 2011/12 2010/11
$’000 $’000 $’000
Gross sales of New Zealand-grown kiwifruit 1,519,707 1,596,943 1,458,853 Promotional rebates, claims and discounts (78,417) (96,586) (84,097) Net sales of New Zealand-grown kiwifruit 1,441,290 1,500,357 1,374,756 Net fruit return through collaborative marketers 14,437 21,886 16,721 Other pool income 2,120 1,793 363 Revenue attributable to New Zealand pools 1 1,457,847 1,524,036 1,391,840
Less pool costs:Freight 134,555 148,429 145,582 Insurance (onshore and offshore excluding hail) 2,551 2,512 2,279 Hail self-insurance 378 188 584 Duty and customs 76,143 87,167 78,463 Other direct pool costs – onshore 5 30,302 31,331 26,021 Other direct pool costs – offshore 55,019 70,794 66,217 Gold Psa Levy - 849 - Promotion 89,288 92,949 85,664 Interest (income)/charge 2 (373) (899) (606) KNZ fees 3 285 244 234 NZKGI funding 3 902 751 899
Total pool costs 389,050 434,315 405,337
Return from fruit sales 1,068,797 1,089,721 986,503
New Zealand fruit and service payments 934,157 952,762 858,870 Zespri margin 4 134,640 136,959 127,633
Other non-pool revenue 1,536 1,444 2,695 Psa funding 6 - 14,200 - Royalty income from new cultivars 5 461 - -Research grant co-funding 4,311 5,523 2,485 Zespri income attributable to New Zealand-grown kiwifruit 140,948 158,126 132,813 Onshore costs:
Innovation 13,198 18,018 12,420 Class 2 Mainpack Subsidy 382 506 -Psa funding 6 4,205 8,498 12,875 Amortisation of new cultivars 304 - -Onshore overheads 32,205 36,305 32,750
50,294 63,327 58,045 Offshore costs 57,454 46,865 50,436
33,200 47,934 24,332 Add operating surplus/(deficit) from other business units:
Processed fruit product (before taxation) 7 - - 103 Non-New Zealand-grown supply (before taxation) 7 5,266 4,591 5,710 Income from sale of Zespri licences (before taxation) 3,537 3,554 4,979
EBIT before loyalty premium 42,003 56,079 35,124
Net interest income 4,355 3,276 3,501 Zespri profit before tax and loyalty premium 46,358 59,355 38,625
Loyalty premium 24,991 27,658 24,415
Zespri Group profit before taxation 21,367 31,697 14,210 Tax expense 13,798 11,170 6,953 Zespri Group profit after taxation 7,569 20,527 7,257
Total fruit and service payments 934,157 952,762 858,870 Loyalty premium 24,991 27,658 24,415 Total fruit and service payments (including loyalty premium) 959,148 980,420 883,285
The Alternative Revenue Statement is used for management information and is the basis for the calculation of the supplier return. Foreign exchange gains and losses are allocated differently from the way that they are allocated in the Financial Statements, in that they are apportioned to the relevant line items above. The Alternative Revenue Statement is consistent with the business segment analysis in Note 30 of the Financial Statements.Notes 1 to 7: Refer to page 21.
INDUSTRY PERFORMANCEZespri Group Limited and SubsidiariesAnnual Report for the year ended 31 March 2013
20
Zesp
ri A
nnual R
evi
ew
2012/13

Cause of Change – 2012/13 vs 2011/12
New Zealand Industry Performance – continued
Zespri Group Limited and Subsidiaries
$’000
Total fruit and service payments 2011/12 (including loyalty premium) 980,420
Add Zespri net profit after tax 2011/12 20,527
Return to industry 2011/12 1,000,947
Movements due to change in:
Sales price/size profile 209,782
Volume (159,350)
Foreign exchange (49,577)
Other income/costs (22,551)
New Zealand Psa funding (9,906)
Taxation (2,628)
Return to industry 2012/13 966,717
Total fruit and service payments 2012/13 934,157
Add Zespri loyalty premium 2012/13 24,991
Total including loyalty premium 2012/13 959,148
Add Zespri net profit after tax 2012/13 7,569
Return to industry 2012/13 966,717
New Zealand pool costs as a percentage of pool revenue 2012/13 2011/12 2010/11
Zespri margin (net of loyalty premium) 4 7.5% 7.2% 7.4%
Freight 9.2% 9.7% 10.4%
Insurance 0.2% 0.2% 0.2%
Duty and customs 5.2% 5.7% 5.6%
Other onshore direct costs 2.1% 2.1% 1.9%
Other offshore direct costs 3.8% 4.6% 4.8%
Gold Psa Levy 0.0% 0.1% 0.0%
Promotion 6.1% 6.1% 6.2%
Interest 2 0.0% (0.1%) -
KNZ/NZKGI 3 0.1% 0.1% 0.1%
Total fruit and service payments (including loyalty premium) 65.8% 64.3% 63.4%
100% 100% 100%
Revenue attributable to New Zealand pools ($’000) 1 1,457,847 1,524,036 1,391,840
(34. 2)
209 .8
Total
Other income/costs
Taxation
Foreign exchange
Volume
Sales price/size profile/offshore fruit loss
$m
New Zealand Psa funding
(2 .6)
(9 .9)
(22 .6)
(49 .6)
(159 .3)
1 Net revenue attributable to the pools includes sales of New Zealand-grown kiwifruit, income from collaborative marketing programmes and other pool income as noted in the Alternative Revenue Statement.
2 The interest income is made up of the following: interest income of $1.6 million, interest paid of $1.0 million and an interest charge from Zespri of $0.2 million. This results in an overall interest income to the pools of $0.4 million.
3 Kiwifruit New Zealand (KNZ) is the statutory board funded under regulation 39 of the Kiwifruit Export Regulations 1999. New Zealand Kiwifruit Growers Incorporated (NZKGI) is the kiwifruit grower representation body and Zespri Group Limited is required by The Commodity Levies (Kiwifruit) Order 2012 to pay a levy to NZKGI on behalf of New Zealand growers. The rate for the 2012/13 year was $0.009 per tray of kiwifruit exported to markets other than Australia. In 2011/12 and 2010/11 NZKGI was funded direct from the National Pool rather than through a levy as in 2012/13.
4 Zespri margin is calculated in accordance with the New Zealand Supply Agreement, being 6 percent of net sales (excluding collaborative marketing programmes) and 6 percent of fruit payments to suppliers for all three years.
5 Within other direct pool costs – onshore is the 3 percent royalty on net sales for Gold3, Gold9 and Green14 pools. This royalty is made up of three components: 1.35 percent of this royalty is paid to Plant & Food Research Limited, 0.65 percent transferred to a defence fund reserve in Zespri Group, and 1.0 percent royalty income in Zespri Group. For 2012/13 the 1.0 percent is included as royalty income from new cultivars in the Zespri Group profit.
6 Costs to contain Psa in New Zealand (refer Note 20 of the Financial Statements).
7 Further analyses of non-New Zealand-grown supply is available within the segment reporting in Note 30 of the Financial Statements. Zespri Group has wound down its direct involvement in the processed fruit business.
The ‘Cause of Change’ chart above outlines the decrease in the return to the industry this season to $967 million from $1,001 million in 2011/12.
21
Zesp
ri A
nnual R
evi
ew
2012/13

2012/13 2011/12 2010/11 2009/10
Trays supplied to Zespri (FOBS) Producing hectares
TE supplied per ha
Producing hectares
TE supplied per ha
Producing hectares
TE supplied per ha
Producing hectares
TE supplied per ha
Zespri Green KiwifruitNorthland 206 6,176 235 6,948 256 6,411 283 6,576
Auckland 383 7,835 419 8,920 443 6,921 456 7,415
Bay of Plenty
– Katikati 1,166 7,820 1,214 8,133 1,288 7,445 1,254 7,618
– Opotiki 552 9,002 565 8,882 594 8,259 585 7,384
– Tauranga 1,209 8,372 1,205 8,254 1,270 7,502 1,310 8,178
– Te Puke 3,811 8,287 3,892 8,937 4,142 8,002 4,026 8,133
– Waihi 144 7,245 167 6,212 168 6,420 168 6,691
– Whakatane 538 7,536 620 7,149 650 5,953 620 5,628
Waikato 238 7,293 250 6,905 262 5,600 255 6,351
Poverty Bay 96 7,123 129 6,285 151 7,445 166 6,299
Hawke’s Bay 97 6,679 116 6,013 134 5,008 117 5,989
Lower North Island 72 7,158 73 7,325 78 5,094 88 6,617
South Island 435 6,126 452 6,678 501 4,712 543 5,245
Total producing hectares 8,947 9,336 9,937 9,871
Average TE supplied per hectare 7,982 8,273 7,330 7,495
Zespri Organic Green KiwifruitNorthland 3 2,781 5 3,633 5 1,800 5 1,887
Auckland 1 4,449 1 5,601 2 3,046 - - Bay of Plenty
– Katikati 33 4,591 32 6,914 30 6,665 27 6,769
– Opotiki 22 6,701 24 4,676 20 5,367 20 4,705
– Tauranga 258 5,425 255 6,548 240 6,195 210 7,106
– Te Puke 81 5,884 86 7,107 89 6,898 85 6,884
– Waihi 15 3,692 7 5,091 7 7,942 3 7,043
– Whakatane 5 4,150 5 5,610 6 2,661 6 4,355
Waikato 143 5,902 134 5,223 132 5,708 122 6,732
Poverty Bay 6 6,609 6 6,276 6 6,408 6 7,081
Hawke’s Bay 1 2,299 1 2,794 1 2,900 1 4,582
Lower North Island 4 3,848 4 6,929 4 2,950 4 4,576
South Island 16 4,496 16 4,411 16 2,515 16 4,158
Total producing hectares 587 576 558 505
Average TE supplied per hectare 5,508 6,147 5,993 6,661
Zespri Gold and Organic Gold Kiwifruit (Hort16A)
Northland 220 12,094 216 11,133 208 8,149 195 8,788
Auckland 83 13,069 80 12,079 73 8,411 68 10,413
Bay of Plenty
– Katikati 185 9,618 183 9,304 170 7,930 155 8,609
– Opotiki 314 12,008 267 11,756 208 11,351 192 11,907
– Tauranga 281 10,437 280 11,862 273 9,155 272 10,737
– Te Puke 708 8,450 1,141 12,694 1,062 9,904 975 10,776
– Waihi 20 11,505 20 10,142 19 9,475 17 8,178
– Whakatane 78 11,956 81 12,813 65 8,402 58 9,676
Waikato 85 9,742 85 8,784 75 5,882 67 9,916
Poverty Bay 130 9,193 120 6,740 94 6,790 79 7,949
Hawke’s Bay 74 11,600 74 8,938 46 6,723 40 8,958
Lower North Island - - - - - - - -South Island 52 10,020 43 9,498 37 7,916 31 9,179
Total producing hectares 2,230 2,590 2,330 2,149
Average TE supplied per hectare 10,213 11,538 9,203 10,287
Regional production analysis – New Zealand-grown kiwifruit
New Zealand Industry Performance – continued
Zespri Group Limited and Subsidiaries
22
Zesp
ri A
nnual R
evi
ew
2012/13
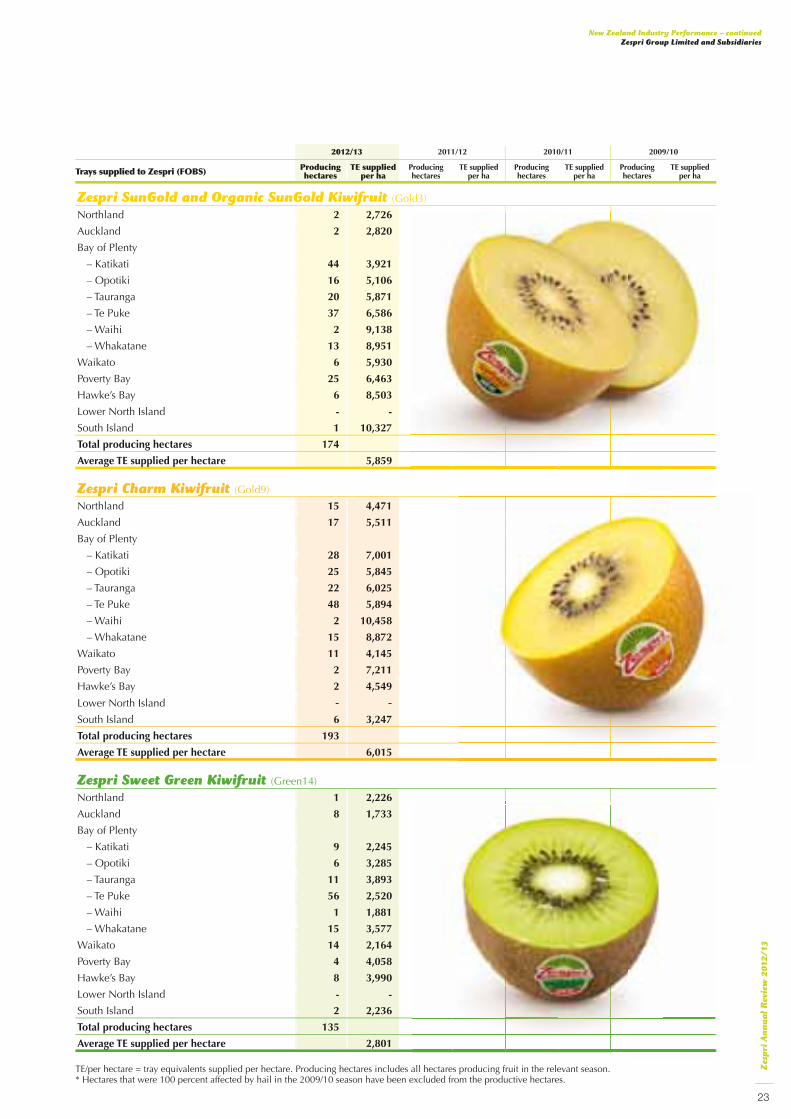
2012/13 2011/12 2010/11 2009/10
Trays supplied to Zespri (FOBS) Producing hectares
TE supplied per ha
Producing hectares
TE supplied per ha
Producing hectares
TE supplied per ha
Producing hectares
TE supplied per ha
Zespri SunGold and Organic SunGold Kiwifruit (Gold3)
Northland 2 2,726
Auckland 2 2,820
Bay of Plenty
– Katikati 44 3,921
– Opotiki 16 5,106
– Tauranga 20 5,871
– Te Puke 37 6,586
– Waihi 2 9,138
– Whakatane 13 8,951
Waikato 6 5,930
Poverty Bay 25 6,463
Hawke’s Bay 6 8,503
Lower North Island - -
South Island 1 10,327
Total producing hectares 174
Average TE supplied per hectare 5,859
Zespri Charm Kiwifruit (Gold9)
Northland 15 4,471
Auckland 17 5,511
Bay of Plenty
– Katikati 28 7,001
– Opotiki 25 5,845
– Tauranga 22 6,025
– Te Puke 48 5,894
– Waihi 2 10,458
– Whakatane 15 8,872
Waikato 11 4,145
Poverty Bay 2 7,211
Hawke’s Bay 2 4,549
Lower North Island - - South Island 6 3,247
Total producing hectares 193
Average TE supplied per hectare 6,015
Zespri Sweet Green Kiwifruit (Green14)
Northland 1 2,226
Auckland 8 1,733
Bay of Plenty
– Katikati 9 2,245
– Opotiki 6 3,285
– Tauranga 11 3,893
– Te Puke 56 2,520
– Waihi 1 1,881
– Whakatane 15 3,577
Waikato 14 2,164
Poverty Bay 4 4,058
Hawke’s Bay 8 3,990
Lower North Island - -
South Island 2 2,236
Total producing hectares 135
Average TE supplied per hectare 2,801
TE/per hectare = tray equivalents supplied per hectare. Producing hectares includes all hectares producing fruit in the relevant season. * Hectares that were 100 percent affected by hail in the 2009/10 season have been excluded from the productive hectares.
New Zealand Industry Performance – continued
Zespri Group Limited and Subsidiaries
23
Zesp
ri A
nnual R
evi
ew
2012/13

New Zealand Industry Performance – continued
Zespri Group Limited and Subsidiaries
New Zealand total fruit and service payments (including loyalty premium)
Return $m2012/13NZ IFRS
$ per TE2012/13NZ IFRS
$ per TE2011/12NZ IFRS
$ per TE2010/11NZ IFRS
$ per TE2009/10NZ IFRS
Total tray equivalents supplied (m) - 71.4 77.2 72.9 75.0 Fruit payments 322.8 4.52 4.33 4.27 4.26 Fruit incentives 110.2 1.54 1.15 1.79 1.47 Service payments 97.6 1.37 1.62 1.25 1.27 Loyalty premium 17.9 0.25 0.25 0.25 0.15 Total fruit and service payments (including loyalty premium) 548.5 7.68 7.35 7.56 7.15 Total tray equivalents supplied (m) - 3.2 3.5 3.3 3.4 Fruit payments 18.1 5.61 5.79 5.30 5.55 Fruit incentives 7.3 2.26 1.97 2.87 2.33 Service payments 3.1 0.95 1.06 0.91 1.08 Loyalty premium 0.8 0.25 0.25 0.25 0.15 Total fruit and service payments (including loyalty premium) 29.3 9.07 9.07 9.33 9.11 Total tray equivalents supplied (m) - 25.0 29.9 21.4 22.2 Fruit payments 173.3 6.95 6.56 6.17 5.90 Fruit incentives 117.4 4.70 2.70 4.76 3.94 Service payments 62.9 2.52 2.65 1.72 2.29 Loyalty premium 6.2 0.25 0.25 0.25 0.15 Total fruit and service payments (including loyalty premium) 359.8 14.42 12.16 12.90 12.28 Total tray equivalents supplied (m) - 0.4 - - - Fruit payments 2.1 5.66 - - - Fruit incentives 1.2 3.15 - - - Service payments 0.4 1.05 - - - Loyalty premium 0.1 0.25 - - - Total fruit and service payments (including loyalty premium) 3.8 10.11 - - -
Total tray equivalents supplied (m) - 1.1 1.9 1.8 0.7 Fruit payments 4.3 3.85 4.00 4.11 4.54 Service payments 0.1 0.12 0.11 0.33 0.48 Total fruit and service payments 4.4 3.97 4.11 4.44 5.02 Total tray equivalents supplied (m) - - - - - Fruit payments 0.2 4.58 4.15 - - Service payments 0.0 0.23 0.22 - - Total fruit and service payments 0.2 4.81 4.37 - - Total tray equivalents supplied (m) - 0.8 0.6 0.5 0.2 Fruit payments 5.5 6.66 5.25 6.18 6.06 Service payments 0.6 0.67 0.66 0.59 0.66 Total fruit and service payments 6.1 7.33 5.91 6.77 6.72
(Green14)
Total tray equivalents supplied (m) - - - - - Fruit payments - 4.75 - - - Service payments - - - - - Total fruit and service payments - 4.75 - - -
Non-standard supplyTotal tray equivalents supplied (m) - 0.9 0.8 1.8 0.5 Fruit payments 5.8 6.28 6.36 3.74 6.62 Fruit incentives - - - 2.33 -Service payments 1.3 1.36 1.46 1.39 1.59 Total fruit and service payments 7.1 7.64 7.82 7.46 8.21
Total all poolsTotal tray equivalents supplied (m) - 102.9 113.9 101.7 102.0 Fruit payments 532.1 5.17 4.97 4.70 4.67 Fruit incentives 236.1 2.30 1.55 2.42 2.02 Service payments 165.9 1.61 1.84 1.32 1.48 Loyalty premium 25.0 0.24 0.24 0.24 0.15 Total fruit and service payments (including loyalty premium) 959.1 9.32 8.61 8.68 8.32 Total fruit and service payments 2011/12 (NZ IFRS) 980.4 Total fruit and service payments 2010/11 (NZ IFRS) 883.3 Total fruit and service payments 2009/10 (NZ IFRS) 849.0
24
Zesp
ri A
nnual R
evi
ew
2012/13

New Zealand kiwifruit industry statistics2012/13 2011/12 2010/11 2009/10 2008/09 2007/08 2006/07
Distribution to growers/suppliersFruit and service payments (excluding loyalty premium) 9.08 8.36 8.44 8.17 7.60 6.83 7.82Loyalty premium 0.24 0.24 0.24 0.15 0.16 0.10 0.25Total payments per tray 9.32 8.61 8.68 8.32 7.76 6.93 8.07
Crop volumes (‘000)Trays submitted (gross) 105,718 119,452 105,869 107,034 109,386 102,012 89,919Trays supplied 102,860 113,932 101,712 102,010 102,644 95,364 81,099Trays sold 101,313 109,129 98,117 98,550 99,969 92,436 80,060Trays sold as a percentage of trays supplied 98% 96% 96% 97% 97% 97% 99%
General statisticsProduction per hectare (trays submitted) 8,621 9,556 8,255 8,546 8,866 8,371 7,514Producing hectares 12,263 12,500 12,825 12,525 12,337 12,186 11,967Orchard Gate Return per hectare (average) – Class 1 only 51,153 45,206 41,830 39,142 35,655 28,169 32,566Number of producers 2,636 2,662 2,706 2,711 2,710 2,727 2,754Average number of trays supplied per producer 39,021 42,799 37,588 37,628 37,876 34,970 29,448
Number of orchards registered0 – 2 hectares 855 913 867 871 912 926 9462 – 5 hectares 1,483 1,521 1,512 1,479 1,490 1,472 1,4505 – 10 hectares 573 577 602 582 561 566 543Over 10 hectares 146 138 153 148 147 142 138Total (KPINs) 3,057 3,149 3,134 3,080 3,110 3,106 3,077
Average orchard size (hectares)Green 3.7 3.7 3.8 3.8 3.7 3.7 3.7Gold 2.1 3.2 3.0 2.8 2.7 2.7 2.6
Number of packhouses used0 – 500,000 trays 23 20 24 25 25 26 39500,000 – 1,000,000 trays 6 10 11 12 12 17 131,000,000 – 2,000,000 trays 12 12 15 16 15 14 17Over 2,000,000 trays 18 21 17 18 19 18 11Total 59 63 67 71 71 75 80Average trays packed per packhouse (‘000) 1,792 1,896 1,580 1,507 1,541 1,360 1,124
Number of coolstores used0 – 500,000 trays 35 34 40 32 44 34 48500,000 – 1,000,000 trays 10 14 13 14 16 17 111,000,000 – 2,000,000 trays 12 9 12 13 13 15 17Over 2,000,000 trays 19 22 18 18 19 17 11Total 76 79 83 77 92 83 87Average trays stored per coolstore (‘000) 1,391 1,512 1,276 1,390 1,189 1,229 1,034
Number of employeesNew Zealand-based (includes seasonal employees) 164 173 175 165 161 156 141Non-New Zealand-based 118 115 118 110 100 100 88Total 282 288 293 275 261 256 229
Global revenue per employee ($’000) – including seasonal employees 5,596 5,728 5,210 5,515 5,620 4,994 5,306 Global revenue (adjusted to 31 March 2012 10-year average) foreign exchange rates per employee ($’000) – including seasonal employees 5,639 5,517 4,848 5,020 5,399 5,240 5,103
The ‘number of employees’ data above has been adjusted from prior years to reflect Full Time Equivalent staff, rather than head count. This is considered to be a more recognised and consistent treatment of actual numbers of employees within the business, including seasonal and casual staff.
New Zealand Industry Performance – continued
Zespri Group Limited and Subsidiaries
25
Zesp
ri A
nnual R
evi
ew
2012/13
New ZealandZespri Group LimitedZespri International LimitedPO Box 4043, Mount Maunganui South400 Maunganui Road, Mount Maunganui 3116New ZealandTel: +64 7 572 7600, Fax: +64 7 572 7646www.zespri.com
AustraliaZespri International (Australia) Pty Limited3 Palermo StreetSouth Yarra, VIC 3141Australia
BelgiumZespri International (Europe) N.V.Posthofbrug 10 bus 3B 2600 BerchemBelgiumTel: +32 3 201 0801, Fax: +32 3 201 0888www.zespri.eu
Zespri Service Centre N.V.Posthofbrug 10 bus 7B 2600 BerchemBelgium Tel: +32 3 201 0877, Fax: +32 3 201 0890www.zespri.eu
ChinaZespri Jia Pei Fruit (Shanghai) Co.,LtdSuite 1703 No. 1065, Zhao-Jia-Bang Road Shanghai PRC 200030Tel: +86 21 3368 7528, Fax: +86 21 3368 7533www.zespri.com.cn
FranceZespri International France S.A.R.L.14, Boulevard Ganteaume13400 AubagneFranceTel: +33 4 4262 4190, Fax: +33 4 4270 0542
Zespri Fresh Produce France S.A.R.L.42 Rue de Tauzia33800 BordeauxFrance
GermanyZespri International Germany GmbHPostweg 26DE-46499 HamminkelnGermanyTel: +49 289 296 0440, Fax: +49 285 296 0439www.zespri.eu
ItalyZespri International Italy S.r.l.Via Cesare Lombroso 5420137 MilanItalyTel: +39 02 5410 7492, Fax: +39 02 5410 4627www.zespri.eu
Zespri Fresh Produce Italy S.r.l.Via Ercolani 2840026 Imola (BO)ItalyTel: +39 05 4223 523, Fax: +39 05 4261 2909
JapanZespri International (Japan) K.K.3rd Floor, Sanbancho Yayoikan6-2 Chiyoda-kuTokyo 102-0075JapanTel: +81 3 3288 9341, Fax: +81 3 3288 9353www.zespri-jp.com
KoreaZespri International (Korea) Co., Ltd8th Floor, Maru Building942-20, Daechi-DongGangnam-GuSeoul 135-280 KoreaTel: +82 2 547 5935, Fax: +82 2 547 5938www.zespri.co.kr
SingaporeZespri International (Singapore) Pte Limited7 Temasek Boulevard14-02A Suntec Tower OneSingapore 038987Tel: +65 6 884 8745, Fax: +65 6 884 8746
SpainZespri International Iberica SLMercamadridZona Comercial Local D14-A28053 MadridSpainTel: +34 91 507 9368, Fax: +34 91 507 9259www.zespri.eu
TaiwanZespri International (Asia) LimitedSuite 1701, 17th FloorInternational Trade Building333 Keelung Road, Section 1Taipei 110TaiwanTel: +886 2 2757 7266, Fax: +886 2 2345 9633www.zespri.com.tw
United KingdomZespri International (United Kingdom) LimitedPendragon House, 65 London Road, St AlbansHertfordshire AL1 1LJUnited KingdomTel: +44 1 727 750 000, Fax: +44 1 727 750 000www.zespri.eu
United States of AmericaNew Zealand Kiwi Holdings Inc.1420 5th Avenue, Suite 4100SeattleWA 98101-2338United States of AmericaTel: +1 206 223 7000. Fax: +1 206 223 7107www.zesprikiwi.com