zespri in north-east asia: analysis of new zealand ... · 58 zespri in north-east asia solve its...
TRANSCRIPT
Volume 13 2015 Otago Management Graduate Review
This assignment was for MANT439 Management in Asia Supervised by Prof André Everett 53-75
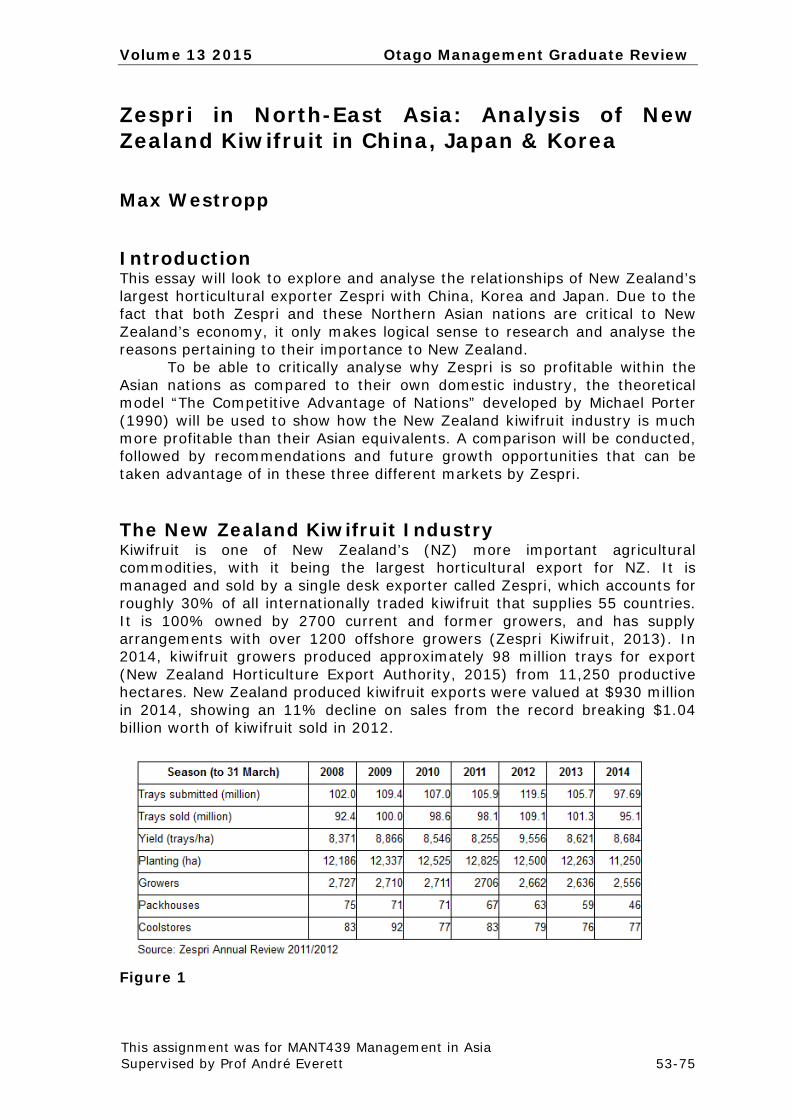
Zespri in North-East Asia: Analysis of New Zealand Kiwifruit in China, Japan & Korea Max Westropp Introduction This essay will look to explore and analyse the relationships of New Zealand’s largest horticultural exporter Zespri with China, Korea and Japan. Due to the fact that both Zespri and these Northern Asian nations are critical to New Zealand’s economy, it only makes logical sense to research and analyse the reasons pertaining to their importance to New Zealand. To be able to critically analyse why Zespri is so profitable within the Asian nations as compared to their own domestic industry, the theoretical model “The Competitive Advantage of Nations” developed by Michael Porter (1990) will be used to show how the New Zealand kiwifruit industry is much more profitable than their Asian equivalents. A comparison will be conducted, followed by recommendations and future growth opportunities that can be taken advantage of in these three different markets by Zespri. The New Zealand Kiwifruit Industry Kiwifruit is one of New Zealand’s (NZ) more important agricultural commodities, with it being the largest horticultural export for NZ. It is managed and sold by a single desk exporter called Zespri, which accounts for roughly 30% of all internationally traded kiwifruit that supplies 55 countries. It is 100% owned by 2700 current and former growers, and has supply arrangements with over 1200 offshore growers (Zespri Kiwifruit, 2013). In 2014, kiwifruit growers produced approximately 98 million trays for export (New Zealand Horticulture Export Authority, 2015) from 11,250 productive hectares. New Zealand produced kiwifruit exports were valued at $930 million in 2014, showing an 11% decline on sales from the record breaking $1.04 billion worth of kiwifruit sold in 2012.
Figure 1
Otago Management Graduate Review Volume 13 2015
54 Zespri in North-East Asia
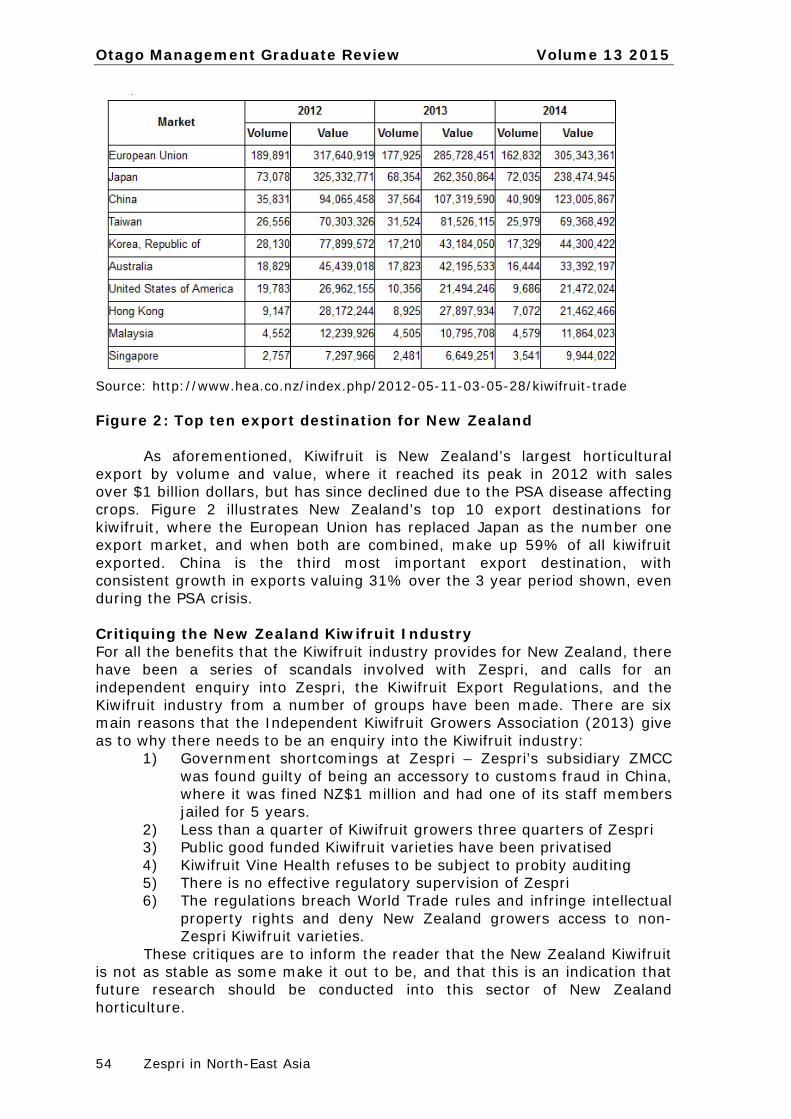
Source: http://www.hea.co.nz/index.php/2012-05-11-03-05-28/kiwifruit-trade Figure 2: Top ten export destination for New Zealand As aforementioned, Kiwifruit is New Zealand’s largest horticultural export by volume and value, where it reached its peak in 2012 with sales over $1 billion dollars, but has since declined due to the PSA disease affecting crops. Figure 2 illustrates New Zealand’s top 10 export destinations for kiwifruit, where the European Union has replaced Japan as the number one export market, and when both are combined, make up 59% of all kiwifruit exported. China is the third most important export destination, with consistent growth in exports valuing 31% over the 3 year period shown, even during the PSA crisis. Critiquing the New Zealand Kiwifruit Industry For all the benefits that the Kiwifruit industry provides for New Zealand, there have been a series of scandals involved with Zespri, and calls for an independent enquiry into Zespri, the Kiwifruit Export Regulations, and the Kiwifruit industry from a number of groups have been made. There are six main reasons that the Independent Kiwifruit Growers Association (2013) give as to why there needs to be an enquiry into the Kiwifruit industry:
1) Government shortcomings at Zespri – Zespri’s subsidiary ZMCC was found guilty of being an accessory to customs fraud in China, where it was fined NZ$1 million and had one of its staff members jailed for 5 years.
2) Less than a quarter of Kiwifruit growers three quarters of Zespri 3) Public good funded Kiwifruit varieties have been privatised 4) Kiwifruit Vine Health refuses to be subject to probity auditing 5) There is no effective regulatory supervision of Zespri 6) The regulations breach World Trade rules and infringe intellectual
property rights and deny New Zealand growers access to non-Zespri Kiwifruit varieties.
These critiques are to inform the reader that the New Zealand Kiwifruit is not as stable as some make it out to be, and that this is an indication that future research should be conducted into this sector of New Zealand horticulture.
Volume 13 2015 Otago Management Graduate Review
Westropp 55
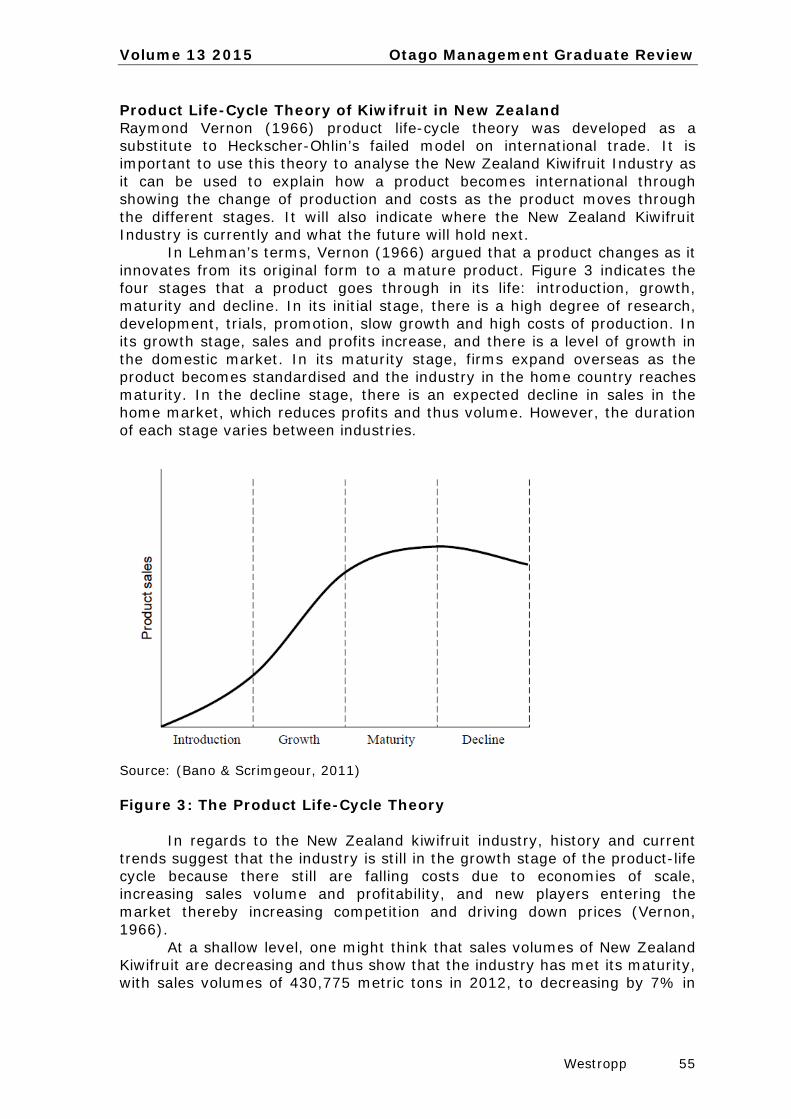
Product Life-Cycle Theory of Kiwifruit in New Zealand Raymond Vernon (1966) product life-cycle theory was developed as a substitute to Heckscher-Ohlin’s failed model on international trade. It is important to use this theory to analyse the New Zealand Kiwifruit Industry as it can be used to explain how a product becomes international through showing the change of production and costs as the product moves through the different stages. It will also indicate where the New Zealand Kiwifruit Industry is currently and what the future will hold next. In Lehman’s terms, Vernon (1966) argued that a product changes as it innovates from its original form to a mature product. Figure 3 indicates the four stages that a product goes through in its life: introduction, growth, maturity and decline. In its initial stage, there is a high degree of research, development, trials, promotion, slow growth and high costs of production. In its growth stage, sales and profits increase, and there is a level of growth in the domestic market. In its maturity stage, firms expand overseas as the product becomes standardised and the industry in the home country reaches maturity. In the decline stage, there is an expected decline in sales in the home market, which reduces profits and thus volume. However, the duration of each stage varies between industries.
Source: (Bano & Scrimgeour, 2011) Figure 3: The Product Life-Cycle Theory In regards to the New Zealand kiwifruit industry, history and current trends suggest that the industry is still in the growth stage of the product-life cycle because there still are falling costs due to economies of scale, increasing sales volume and profitability, and new players entering the market thereby increasing competition and driving down prices (Vernon, 1966). At a shallow level, one might think that sales volumes of New Zealand Kiwifruit are decreasing and thus show that the industry has met its maturity, with sales volumes of 430,775 metric tons in 2012, to decreasing by 7% in
Otago Management Graduate Review Volume 13 2015
56 Zespri in North-East Asia
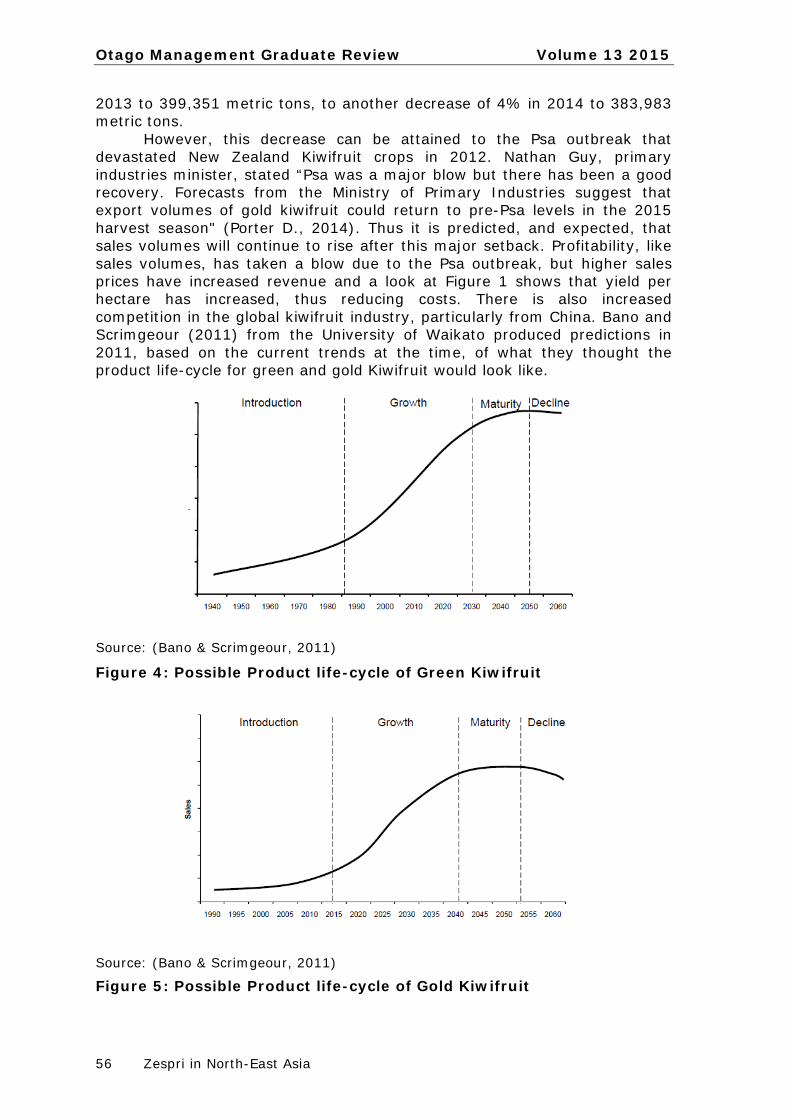
2013 to 399,351 metric tons, to another decrease of 4% in 2014 to 383,983 metric tons. However, this decrease can be attained to the Psa outbreak that devastated New Zealand Kiwifruit crops in 2012. Nathan Guy, primary industries minister, stated “Psa was a major blow but there has been a good recovery. Forecasts from the Ministry of Primary Industries suggest that export volumes of gold kiwifruit could return to pre-Psa levels in the 2015 harvest season" (Porter D., 2014). Thus it is predicted, and expected, that sales volumes will continue to rise after this major setback. Profitability, like sales volumes, has taken a blow due to the Psa outbreak, but higher sales prices have increased revenue and a look at Figure 1 shows that yield per hectare has increased, thus reducing costs. There is also increased competition in the global kiwifruit industry, particularly from China. Bano and Scrimgeour (2011) from the University of Waikato produced predictions in 2011, based on the current trends at the time, of what they thought the product life-cycle for green and gold Kiwifruit would look like.
Source: (Bano & Scrimgeour, 2011)
Figure 4: Possible Product life-cycle of Green Kiwifruit
Source: (Bano & Scrimgeour, 2011)
Figure 5: Possible Product life-cycle of Gold Kiwifruit

Volume 13 2015 Otago Management Graduate Review
Westropp 57
What these two predictions tell us, is that New Zealand Kiwifruit still have the potential to grow further in the international Kiwifruit trade, for at least another 15 years before its begins to level out for both green and gold Kiwifruit. The Chinese Kiwifruit Industry The kiwifruit industry in China is a relative mystery, with the only reliable data coming from the early 2000s. This has limited the amount of information that can be used, but that does not mean assumptions can be made from what information is available.
Figure 6: Top ten kiwifruit producing countries 2003-2005 In 1999, the total production of kiwifruit from China amounted to 165,000 metric tonnes and it was estimated to have reached 400,000 by 2006. If this productivity has continued, than Chinese annual production could reach 700,000 metric tonnes per year (Huang & Ferguson, Review: Kiwifruit in China, 2001). As can be seen from Figure 6, China was the world’s second biggest kiwifruit producing nation. However, this only includes the harvested amount that have been taken from orchards. When taking into account that 170,000 tonnes was harvested from wild kiwifruit (this data is from 1980), it can be easily seen that China easily produces a significant amount of kiwifruit, potentially more than any of the top producers in 2015. From what is known, almost all Chinese produced kiwifruit is sold domestically with one-fifth to one-third being processed (Huang & Ferguson, Review: Kiwifruit in China, 2001). Chinese exports account for at most 1-2% of total production, but this may change as existing plantings mature (Huang & Ferguson, Review: Kiwifruit in China, 2001). What is most surprising about the Chinese kiwifruit industry though, is the lack of a national organization regulating the industry or coordinating marketing (Huang & Ferguson, Review: Kiwifruit in China, 2001), especially in a communist nation. The Chinese industry faces a few issues that need to be solved in order for its kiwifruit industry to compete at exporting at an international level. Firstly, the commercially planted varieties are not very popular, and secondly, that the production is scattered among many small sections, managed by individual farmers (Anker-Kofoed, 2015). However, if China does

Otago Management Graduate Review Volume 13 2015
58 Zespri in North-East Asia
solve its problems, than the effects of increased economic standards and the rapid expansion of supermarkets are more than likely going to create a strong Chinese demand for kiwifruit due to the rise of the middle class, which would benefit New Zealand tremendously as it already exports kiwifruit to China (Anker-Kofoed, 2015). These benefits are being felt, whereas of 2014, New Zealand currently exports 40,909 tonnes to China, which is valued at NZ$123 million and has a 0% tariff due to the FTA New Zealand enjoys with China. Zespri chief executive Lain Jager is now looking at doubling export earnings to NZ$3 billion by2025, where “China is a large and increasingly important market for us and is set to be our number one market by 2018” (Gray, 2014). The Korean Kiwifruit Industry The kiwifruit industry in South Korea is a highly competitive, very mature market that is quite familiar with kiwifruit and is seen with huge market potential for New Zealand kiwifruit. It is a large kiwifruit importer, but also a significant producer as it is counter-seasonal with New Zealand. Zespri made sales revenues of NZ$100 million in 2012-2013 in South Korea, down from the NZ$125 million it made in the previous year (Arrowsmith, 2014). A major reason for this was firstly, SunGold kiwifruit had a reduction in supply (it accounts for 35% of all horticulture exports to South Korea), as well as the significant tariffs New Zealand kiwifruit have to pay to enter the Korean market, which is 45% (Arrowsmith, 2014). New Zealand growers paid NZ$20 million in tariffs to this market in 2014 (Zespri, 2014). What makes this so significant however, is that Zespri’s major competitors already have FTAs in place, such as Chile, that will have 0% tariff by 2014, or the European Union, which will see a 0% tariff over the next 10 years. Compared with New Zealand’s 45% tariff on kiwifruit exports, it does not make much of an even playing field. However, New Zealand recently signed a FTA with South Korea, which will allow New Zealand growers to compete at a level playing field with its competitors like Chile and Italy. The Japanese Kiwifruit Industry Japan is a major importer of New Zealand Kiwifruit, which comes as no surprise due to the fact that the Japanese started importing New Zealand kiwifruit in the 1970s and have continued to do so well in to the 21st century without any indication of slowing down. Recent figures show that in 2013, even after the outbreak of Psa, Japan imported 59,426 metric tons of kiwifruit, a slight decrease on the previous year of 60, 297 (Lee-Jones, 2014). Even though the Japanese enforce a tariff rate of 6.4% on New Zealand kiwifruit, it is still New Zealand’s number one export destination, with an estimated value in 2012 of kiwifruit at NZ$325,332,771 million. The average Japanese household consumed 239g of New Zealand kiwifruit, spending ¥202 on the product in 2013, which is well higher than the average of 208g consumed and spending ¥165 respectively (Hey, 2015). These consumption rates come off the back of a record high purchasing price of ¥847 per kg. This indicates that Japanese consumers are extremely satisfied with New Zealand kiwifruit and want to pay more, due to the fact that they paid more despite the higher prices. This is in stark comparison to the local

Volume 13 2015 Otago Management Graduate Review
Westropp 59
kiwifruit industry, where Figure 7 shows that less than 30,000 hectares of kiwifruit was planted in 2012. Even though this is an increase from the previous two years, the graph shows a continuous decline from 1990, suggesting that growing kiwifruit for the local market is not a viable option in Japan. Coupled with the huge amounts of imports from New Zealand as well as from other nations, it can be reasonably fathomed that the Japanese kiwifruit industry is not performing very well and is not a significant competitor to Zespri, but rather seen as a growing market opportunity.
Source: http://www.helgilibrary.com/indicators/index/kiwi-fruit-production/japan Figure 7 Relationship between China & New Zealand The relationship between China and New Zealand has developed very rapidly since the two countries established diplomatic ties in December 1972, especially in recent years. Within that time, the relationship between New Zealand and China has become one of New Zealand’s most important, with the Asian powerhouse New Zealand’s largest trading partner for goods and a major source of migrants, students and tourists (New Zealand Foreign Affairs and Trade, 2015). The New Zealand-China relationship is often characterised by the frequent high level contact between the two governments, whether formal or informal, for dialogue on diversifying trade and economic flows for both nations, while strengthening person to person contacts. The contact between the two nations is regularly marked by official visits from the President, such as President Jiang Zemin visiting in 1999, President Hu Jintao in 2003, and President Xi Jinping in 2014. The current New Zealand Prime Minister John Key has visited China on 5 separate occasions during his tenure, where his latest trip saw Prime Minister Key and President Xi revise New Zealand and China’s bilateral trade target to NZ$30 billion by 2020, which replaces the previous target of NZ$20 billion by 2015 (New Zealand Foreign Affairs and Trade, 2015). As can be seen, trade with China has been greatly beneficial to the New Zealand economy, especially the export sector. This is a result of the establishment of the New Zealand-China Free Trade Agreement (FTA), which would eliminate 96% if tariffs on New Zealand exports to China. The FTA
Otago Management Graduate Review Volume 13 2015
60 Zespri in North-East Asia
though far exceeded liberal expectations. It was projected that the FTA would increase New Zealand export revenue by NZ$225-NZ$350 million per year, but it in fact increased export revenue by NZ$1 billion in the first year (New Zealand Foreign Affairs and Trade, 2015). Due to the success of the FTA with China, the New Zealand government launched its NZ Inc China Strategy in 2012, where Prime Minister John Key set out an ambitious 5 year plan that would strengthen political ties, double trade in goods, grow tourism by at least 60% and education by 20% (New Zealand Foreign Affairs and Trade, 2015). Relationship between Korea & New Zealand Bilateral ties between South Korea and New Zealand are founded on strong links that dates back to New Zealand’s participation in the Korean War. New Zealand’s contribution of soldiers was the second highest per capita, with New Zealand supporting the growth and development of the Republic of Korea heavily following the armistice which ended the conflict in 1953 (New Zealand Ministry of Foreign Affairs & Trade, 2014). One of New Zealand’s support strategies was to assist South Korea entry into the United Nations, which has resulted in an excellent relationship with the Republic of Korea politically and economically. Similar to China, high level visits in both directions are frequent. In 2010, New Zealand Prime Minister John Key and President Lee Myung-bak titled 2012 as a year or friendship between the two nations, to celebrate the 50th anniversary of diplomatic relations (New Zealand Ministry of Foreign Affairs & Trade, 2014). In 2013, John Key visited the Republic of Korea to meet the new Korean President Park Geun-hye and attend services marking the 60th anniversary of the armistice. The importance of South Korea as a trading partner is undeniable, as South Korea’s economy is the 13th largest in the world and New Zealand’s 5th largest market for exported goods (New Zealand Trade and Enterprise, 2015). Two-way trade totalled NZ$3.485 billion in the 12 months prior to June 2013, with New Zealand exports (NZ$1.585 billion) made up of Primary goods such as logs, kiwifruit, dairy and seafood, and imports from South Korea (NZ$1.9 billion) made up of manufacturing, capital and consumer goods such as cars, electronic equipment and machinery (New Zealand Ministry of Foreign Affairs & Trade, 2014). In 2009, Prime Minister John Key and President Lee Myung-bak officially announced the decision to negotiate a FTA, which was concluded and signed in November of 2014 at the G20 summit in Brisbane. This deal is being lauded just as important as New Zealand signing an FTA with China in 2008, due to the fact that New Zealand exporters were paying upwards of NZ$229 million per year in duties. Under the FTA, New Zealand exporters will save roughly NZ$65 million in duties in its first year, which will be eliminated completely within 15 years of entry into force (New Zealand Trade and Enterprise, 2015). This will put New Zealand exporters on a level playing field with other exporters who already enjoy FTAs with Korea, such as the European Union, the U.S. and Chile.

Volume 13 2015 Otago Management Graduate Review
Westropp 61
Relationship between Japan & New Zealand Relations between New Zealand and Japan are strong to say the least, with a common view to see stability, growth and development in the potentially highly volatile Asia-Pacific region. New Zealand contributes to extensive Japanese interests through participation in regional security dialogues, as well as involvement in a group of nations who are committed to encouraging and promoting democracy, human rights and sustainable development (New Zealand International Business Forum, 2013). New Zealand and Japan both welcomed the proposed signing of a Memorandum of intent on Defence Cooperation as an example of increased security cooperation in the region. Both countries also concur that there is significant importance to the successful conclusion of the Trans-Pacific Partnership (TPP) and the Regional Comprehensive Economic Partnership (RCEP), so that closer, more integrated ties can be achieved between the two nations (McCully, 2013). New Zealand has for a number of years sought an FTA with Japan, but was unable to secure an agreement between both governments prior to Japan joining the TPPA. However, Japan joining the TPPA is beneficial to New Zealand as it enhances the possibility of a FTA between the two nations more considerably, as well as cementing the TPPA’s credentials (New Zealand International Business Forum, 2013). In the year ending December 2013, New Zealand exports to Japan were valued at NZ$2.94 billion dollars, which accounted for 5.94% of total New Zealand exports, making Japan New Zealand’s 4th largest export market (New Zealand Ministry of Foreign Affairs & Trade, 2014). For Japan, engagement with New Zealand businesses is strategically imperative, as New Zealand supplies high quality goods such as aluminium, coal, wood, dairy products fruit and meat. New Zealand imports from Japan were valued at NZ$2.99 billion, which made up 6.38% of New Zealand imports, resulting in Japan being New Zealand’s 4th largest import market (New Zealand Ministry of Foreign Affairs & Trade, 2014). For New Zealand, Japan is a major supplier of high quality vehicles, petroleum and other machinery. According to Japanese figures, the cumulative value of Japanese investment in New Zealand as of 31 March 2012 totalled NZ$6.8 billion (New Zealand International Business Forum, 2013), indicating the value and investment opportunity the Japanese see in New Zealand. Analysis and Discussion Porter’s Competitive Advantage of Nation’s (CAN) Michael Porter’s (1990) Competitive Advantage of Nations is a framework that resulted from a study of comparative advantage between industrialized nations. It is also the basis of this analysis that will look to compare the New Zealand, China, Korean and Japanese Kiwifruit industries. Porter (1990) seeks to explain national competitive advantage through his theory after growing disillusioned by economic theories of trade in the late 1980s. The overall question that he is trying to answer is why some countries are more successful in a particular industry than others. He breaks down country attributes into four classes that make up that National Diamond, which provide the underlying conditions or platforms for the determination of national competitive advantage of a nation. These four classes are: factor conditions, demand conditions, related and supporting industries, and firm
Otago Management Graduate Review Volume 13 2015
62 Zespri in North-East Asia
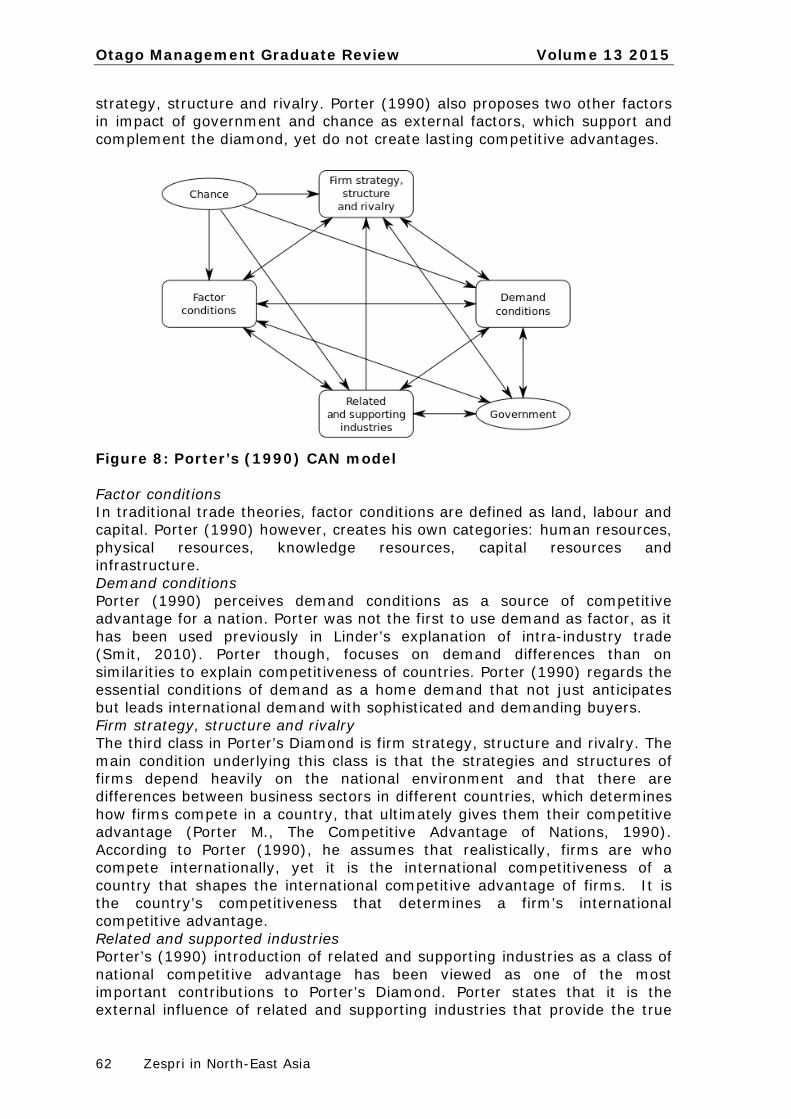
strategy, structure and rivalry. Porter (1990) also proposes two other factors in impact of government and chance as external factors, which support and complement the diamond, yet do not create lasting competitive advantages.
Figure 8: Porter’s (1990) CAN model Factor conditions In traditional trade theories, factor conditions are defined as land, labour and capital. Porter (1990) however, creates his own categories: human resources, physical resources, knowledge resources, capital resources and infrastructure. Demand conditions Porter (1990) perceives demand conditions as a source of competitive advantage for a nation. Porter was not the first to use demand as factor, as it has been used previously in Linder’s explanation of intra-industry trade (Smit, 2010). Porter though, focuses on demand differences than on similarities to explain competitiveness of countries. Porter (1990) regards the essential conditions of demand as a home demand that not just anticipates but leads international demand with sophisticated and demanding buyers. Firm strategy, structure and rivalry The third class in Porter’s Diamond is firm strategy, structure and rivalry. The main condition underlying this class is that the strategies and structures of firms depend heavily on the national environment and that there are differences between business sectors in different countries, which determines how firms compete in a country, that ultimately gives them their competitive advantage (Porter M., The Competitive Advantage of Nations, 1990). According to Porter (1990), he assumes that realistically, firms are who compete internationally, yet it is the international competitiveness of a country that shapes the international competitive advantage of firms. It is the country’s competitiveness that determines a firm’s international competitive advantage. Related and supported industries Porter’s (1990) introduction of related and supporting industries as a class of national competitive advantage has been viewed as one of the most important contributions to Porter’s Diamond. Porter states that it is the external influence of related and supporting industries that provide the true
Volume 13 2015 Otago Management Graduate Review
Westropp 63
source of competitive advantage. It is these localised clusters that are a recurring them among developed economics, but are lacking in a developing countries. Porter’s CAN model applied to the New Zealand Kiwifruit Industry Factor Conditions Physical Resources. New Zealand has always been a country that has focused heavily on agriculture, with 42.8% of the country used as agricultural or horticultural land (The World Bank, 2015). The climate is quite temperate, especially in the North Island, making it ideal to grow various types of agriculture and horticulture. With the landscape in the North Island also being quite flat, it allows for more space to farm different types agriculture, hence why 79% of all Kiwifruit is grown in the Bay of Plenty (New Zealand Horticulture Export Authority, 2015). Water is also readily available to Kiwifruit growers, another advantage of this two island nation. Human Resources. The workforce in the New Zealand Kiwifruit Industry are world pioneers, where each of the nearly 3000 growers for Zespri are using innovative, orchard management systems to produce higher quality Kiwifruit. These growers are well skilled and highly educated in the techniques and practices to produce world-class Kiwifruit (Zespri, 2015). Knowledge Resources. In New Zealand, the Kiwifruit industry funds an entity called ‘Kiwifruit Vine Health Incorporated’ which engages in research and development programmes to combat Psa, using researchers from both New Zealand and around the world (New Zealand Horticulture Export Authority, 2015). Zespri is also highly committed to researching best practice growing techniques in the industry, to hand down to their growers to improve growth and yield whilst keeping the world-class taste (Zespri, 2015). For example, Zespri has the Agriculture Research Group on Sustainability to examine the environmental, social and economic sustainability practices of their farms to understand the impact these farms have on the local biodiversity. Growers have also set up the Focus Orchard Network programme to share best practice methods amongst other growers. Capital Resources. The Global Competitive Index (World Economic Forum, 2013) reported that New Zealand placed 11th out of 144 countries on ease of access to loans, 14th on availability of financial services, and 9th on affordability of financial services. This indicates that New Zealanders, especially horticultural farmers, are well placed for access to extra capital if need be. Infrastructure. The infrastructure quality in New Zealand is already up to a significant standard, with roads and highways allowing easy access for trucks to pick up trays of Kiwifruit and deliver them to the nearest Port, mainly the Port of Tauranga which is the closest in the Bay of Plenty region. The close proximity of these ports gives the Kiwifruit Industry a significant advantage in its ability to compete with others around the world, as growers can get their product quickly and efficiently to their export markets. Zespri also charters 55 refrigerated ships and 8000 refrigerated containers to carry the kiwifruits to 54 countries around the world (Zespri, 2015). Demand Conditions Such is the case with Fonterra and milk, the national demand for kiwifruit is largely underwhelmed by the available supply, thus meaning that in order for the industry to survive, it must export overseas. For example, New
Otago Management Graduate Review Volume 13 2015
64 Zespri in North-East Asia
Zealanders spend approximately NZ$26 million a year on kiwifruit, which averages at NZ$16 a household (Statistics New Zealand, 2014), but pales in comparison to the NZ$930 million made from exports in 2014. However, national demand still influences the industry as it illustrates to Zespri and its grower’s consumer needs in the Kiwifruit industry far quicker than in overseas markets. Related and Supporting Industries Even though there is a large number of Kiwifruit growers present in New Zealand providing world-class quality Kiwifruit, Zespri has also employed 1200 offshore growers that aid in supply arrangements around the world, when the southern hemisphere season for growing kiwifruit comes to an end. Currently, 80% of Zespri’s offshore supply originates from Italy and France (Zespri, 2014). However, due to the fact that Zespri operates as a single desk exporter for all growers in New Zealand, there is little competition between growers except when exporting to Australia. But, the government, which will be discussed in depth later, and Zespri play an important role in ensuring that the quality of New Zealand kiwifruit is suitable to fit its title as a premium product. This is done through a strong emphasis by both entities on research and development, and innovation. Firm Strategy, Structure and Rivalry As mentioned earlier, the kiwifruit industry in New Zealand has a single desk exporter that markets and sells the kiwifruit produced to foreign markets beyond Australia. This structure is widely seen as very popular, with a recent referendum proposed by the Kiwifruit Industry Strategy Project (KISP) asking growers to vote relating to the long-term grower ownership, funding and structure of the kiwifruit industry. Initial results show 90% of growers support the current industry model, with 60% of growers representing 80% of kiwifruit production turning up to vote (The New Zealand Herald, 2015). This in effect means that there is no rival company or firm to Zespri at an international level. But this is where the importance of local rivalry and home demand play a critical role. Firms are forced to innovate and improve in the New Zealand market, even if it is rather small in comparison to the international export earnings, with the most successful growers passing on these methods to other growers and Zespri, who in turn continue to innovate or take the suggestions on board. Impact of Government and Chance Zespri is unique in the sense that it has its own legislation in New Zealand that in effect makes it monopoly, protected from any competition by statute (beyond Australia). This interference by the government would be seen by Porter (1990) as anti-capitalist, with his interpretation when he created the Competitive advantage of Nations model that the role of government should be limited to encouraging companies to raise their performance, stimulating early demand for advanced products, focusing on specialized factor creation and stimulating local rivalry by limiting direct cooperation. The role that the New Zealand government plays in the Kiwifruit industry does not always meet Porter’s criteria, but that can be attained to the crisis that engulfed the Kiwifruit industry in the late 1980s. The rapid expansion of orchards that produced large crop volumes went well beyond global demand, as well as a stronger New Zealand dollar and high interest rates at the time, coupled with multiple exporters competing with each other drove kiwifruit prices into the ground. To stop this nose-dive before the collapse of the industry, the New Zealand government and growers colluded to establish a single desk
Volume 13 2015 Otago Management Graduate Review
Westropp 65
exporter, Zespri. This has provided a united grower-owned platform, like Fonterra’s, to deliver world-class New Zealand grown kiwifruit to the world. The New Zealand government’s role in Zespri and the kiwifruit industry currently, is to stimulate innovation (due to the lack of any competition). This can be seen through investments such as the 2009 NZ$35.7 million initiative by the New Zealand government into a seven year Plant & Food research programme to develop new kiwifruit varieties (Zespri, 2009). Zespri (2015) also states that government invests in total with Zespri, approximately NZ$20 million per year in research to develop a sustainable, premium product. Zespri has also thanked the government for its help in supporting the industry through the Psa outbreak, outlining how important the government is to Zespri and the kiwifruit industry (Collen, 2015). Chance also plays a significant role in the New Zealand kiwifruit industry. Many areas in the country are exposed to extreme wind and rain events, where strong winds can damage property and cold fronts can lead to heavy rain, resulting in flooding (United Nations Food and Agriculture Organization, 2007). Droughts also occur, usually, east of the main dividing ranges. All of these factors that are out of human hands can severely affect the kiwifruit industry. Diseases such as the Psa that has devastated New Zealand crops also have a relative degree of chance that it will occur on these shores, that needs to be taken into consideration. Porter’s CAN model applied to the Chinese Kiwifruit Industry Factor Conditions Physical Resources. China is a country with vast terrain territory, which includes five different climate zones from the south to the north of the country. It is home to rich plant and animal resources. According to the World Bank (2015), China in 2012 had 54.8% of its land area dedicated to agricultural and horticultural use. China also has easy access to property, plant and equipment that would be required for the kiwifruit industry due to the nature of its industrial economy. It is also the native home to the kiwifruit, where it was estimated that there was 170,000 tonnes of harvested wild kiwifruit alone, in 1980 (Huang & Ferguson, Review: Kiwifruit in China, 2001). It is a fair assumption to make then, that the climate, soil and temperature are perfect growing conditions for kiwifruit. Human Resources. Within China’s total labour force, 35% or 300 million people are dedicated specifically to agriculture (National Bureau of Statistics, 2008). However, the number of workers who are skilled to work on a kiwifruit orchard is unknown. Huang and Ferguson (2001) state that one of the issues facing the Chinese kiwifruit industry though is that there are difficulties in managing production and control of kiwifruit and chemical use respectively, because there is no overarching government organisation maintaining and regulating the industry. Knowledge Resources. In the Global Competitiveness Report (2013), it ranked China’s tertiary education enrolment as 83rd in the world, as well as its availability of research and training services, critical to kiwifruit growing, as 62nd in the world. The report also ranked China’s university-industry collaboration in R&D as 33rd in the world, indicating that there is room for improvement for the kiwifruit industry to take advantage of China’s brightest minds. China’s quality of scientific research institutions were ranked at an above average 41st as well. However, funding for rural compulsory education

Otago Management Graduate Review Volume 13 2015
66 Zespri in North-East Asia
is fully provided by the government, which exempt students from compulsory fees and provides allowances for poor families (Asia Trade Hub, 2015). This allows for a greater number of people to get some form of education in agricultural training, so that they have the skills to make money for themselves and their families. Capital Resources. The World Economic Forum ranked China’s ease of access to loans as 32nd in the world, which is quite impressive for such a large country. It also ranked venture capital availability as 16th in the world, indicating that the Chinese government supports entrepreneurs and venture capitalists to pursue ideas. This bodes well for people who wish to start a kiwifruit orchard. Infrastructure. China’s total road network is ranked second in the world, where the predominance of rural roads makes up 90% of the total road length in China (Asia Trade Hub, 2015). It also boasts 65,000 kilometres of expressways, key for kiwifruit growers who grow their orchards outside of the main areas to get their product as quickly as possible to their respective markets. The World Economic Forum (2013) also found that the quality of roads in China were ranked at 54th in the world, which is impressive for a country as large as China in terms of size and population. But it also ranked China’s overall infrastructure as 74th in the world, which can be improved on to better aid this industry. Demand Conditions As mentioned earlier, nearly all of China’s production of Kiwifruit is sold domestically, before it is exported, which is why Chinese export for kiwifruit account to around 1-2% every year (Huang & Ferguson, Review: Kiwifruit in China, 2001). This indicates there is a strong home demand. However, China struggles to match even its home demand because one of the major issues facing the kiwifruit industry is the fact that the majority of commercial plantings are of unpopular varieties (generally meaning not Hayward). Also, the lack of competition from other countries means that the home market is not as sophisticated, a critical factor seen by Porter. Related and Supporting Industries As China currently enjoys FTAs with kiwifruit rivals Chile and New Zealand, it will also allow the presence of multinationals such as Zespri to drive the Chinese industry to innovate and compete at both an international and domestic level. Other industries such as the apple and pear industry are also competing with the kiwifruit industry for the finite amount of land available to cultivate horticulture (Asia Trade Hub, 2015). Firm Strategy, Structure and Rivalry China’s kiwifruit industry in not internationally driven, but heavily domestically driven. Its main kiwifruit area is located in Shaanxi, which houses one-third of all kiwifruit orchards by the main kiwifruit cultivar Qinmei (Huang & Ferguson, 2002). Impact of Government and Chance. As China is a communist state, government will always play a significant role in any industry within its borders. As mentioned previously, it is surprising how little government influences the kiwifruit industry though. There is the most important body, known as the Chinese Kiwifruit Development Association, where its primary role is to regulate production, establish quality control standards, produce guidelines for orchard management and establish marketing strategies (Huang & Ferguson, 2001). However, all these roles that are supposed to be implemented by this body have been the recommendations put forward by
Volume 13 2015 Otago Management Graduate Review
Westropp 67
academic authors Huang and Ferguson (2001), as they see the infrastructure required to support the industry needing improvement. China also faces severe flooding, drought and other natural disasters which can be considered as chance. Porter’s CAN model applied to the Korean Kiwifruit Industry Factor Conditions Physical Resources. South Korea’s total land area accumulates to 98,190 square kilometres, with 17,560 sq km dedicated to agricultural land (Trading economics, 2011). It is a mountainous country with only 18.6% arable land. Its climate is temperate, but with minimal rainfall, not making it ideal conditions for kiwifruit growing when it’s in-season. However, Korea is highly dependent on imports of raw materials and capital goods as natural resources are limited (Asia Trade Hub, 2015). South Koreans also have easy access to water, where it was measured that 97.8% of the population had access to water (Trading Economics, 2012). Human Resources. Out of South Korea’s total workforce population, only 6.9% are dedicated to agriculture, with over half of those farmers only involved with the cultivation of rice (The CIA World Fact Book, 2013). That leaves just 3% of the total agricultural workforce available for other agriculture or horticulture projects, like kiwifruit cultivating. Knowledge Resources. When assessing Korea’s educational resources, the Global Competitiveness Index (2013) found that it was the world leader at number one for tertiary education enrolment, meaning that the whole population has been educated in some form or another, thus creating a very knowledgeable society. Nevertheless, its availability of research and training services was ranked at a modest 31st, indicating that it is not a simple task to be retrained into another profession, such as farmers who want to move from rice cultivation into kiwifruit production. However, Korea was ranked 22nd for its capacity for innovation and 24th for its quality of scientific research institutions, illustrating that research into kiwifruit cultivation in Korea can give industry leading advice on crop techniques, ideal growing temperatures, etc. Capital Resources. The Global Competitiveness Index (2013) also assessed the financial market development in Korea, ranking ease of access to loans at a staggering 118th, with venture capital availability close behind at 115th. This exemplifies that it is extremely difficult to start one’s own business or procure funds to move into a new industry. Infrastructure. As Korea is highly urbanized, the quality of its infrastructure is second-to-none. The World Economic Forum (2013) ranks its overall infrastructure at 23rd in the world, thus making it easier for businesses that are involved in agriculture that need to get their product to their markets as soon as possible. Demand Conditions Home demand for kiwifruit is very sophisticated, which in Porter’s (1990) opinion is very beneficial to the local industry. This is due to the fact that Korea has signed multiple FTAs with high kiwifruit producing countries like Italy and Chile. This allows the home market to be flooded with various types of kiwifruit and giving the home consumer multiple options, thus making the consumer more sophisticated and driving the industry forward.
Otago Management Graduate Review Volume 13 2015
68 Zespri in North-East Asia
Related and Supporting Industries The fruit industry in Korea is highly competitive, with kiwifruit only making up a small market share. There are also well established networks, as the majority of kiwifruit production takes place on Jeju Island, indicating a mini kiwifruit cluster on the island (NelsonMail, 2010). Firm Strategy, Structure and Rivalry The kiwifruit industry is already an established, mature market in Korea, The structure of the horticultural crops is different to other countries, as Korea grows its crops inside a sturdy tunnel house that is constructed with heave galvanised piping. Taking into consideration the minimal amount of available land to grow kiwifruit on, it can be seen that growers have small sized crops, with all these farmers in direct competition of each other. Impact of Government and Chance The Korean government’s move towards total market liberalisation has been hailed by many industries and countries, as it allows for greater flow of capital and technology; imperative for many industries. The government is seen as getting rid of its protectionist policies through heavy tariffs and quantitative restriction, as well as interventions in the exchange rate (Oh-Seok, 2012). As aforementioned, kiwifruit orchards are grown inside tunnel houses, primarily to protect it from typhoons that occur regularly in the region, minimising the chance of the orchards getting destroyed (NelsonMail, 2010). Porter’s CAN model applied to the Japanese Kiwifruit Industry Factor Conditions Physical Resources. Japan as a whole has very few natural resources, with the country heavily dependent on imports for raw materials. Japan experiences changing seasons, with the average temperature and climate ranging greatly from the north to the south. Currently, 12.5% of the total land area of Japan is used for agricultural purposes (The World Bank, 2015), and access to water is predominant around the country. Human Resources. As of 2010, the total Japanese population engaged in agricultural activities amounted to 2.05 million people (Godo, 2013). Japan is also a big producer of kiwifruit when it is in season, and Figure 7 indicates that the Japanese are planting and harvesting their own kiwifruit, meaning that there are a sufficient amount of skilled workers in this particular industry. Knowledge Resources. The World Economic Forum (2013) found that Japan ranked modestly in regards to its higher education and training, ranked 50th for its quality of education, and 37th for its tertiary education enrolment. What is most interesting though, is that in innovation, key for the kiwifruit industry, Japan ranks in the top ten countries in the world for nearly all factors. It is ranked 6th for its capacity for innovation and 9th in scientific research institutions, more than illustrating that Japan is an extremely knowledgeable nation. Capital Resources. The ease of which a Japanese citizen can obtain access to a loan is relatively straightforward, with the Global Competitiveness Index (2013) ranking it 33rd in the world. The access to venture capital is similar, at 39th ranked in the world.
Volume 13 2015 Otago Management Graduate Review
Westropp 69
Infrastructure. Japan is one of the most highly developed nations in the world, with a well-developed network of roads and railways, with expressways that stretch from the north to the south of the country (Asia Trade Hub, 2015). Within the main cities, public transportation is easily accessible and reliable. The Global Competitiveness Index (2013) also rates Japan’s infrastructure at 14th overall. Demand Conditions Similar to Korea, Japan produces a fair number of its own Kiwifruit (Figure 7), yet it differs as it imports the majority of its Kiwifruit from New Zealand (Japan-Guide, 2010). It is clear that the Japanese have a clear liking for the product, as mentioned earlier, by paying relatively high prices for kiwifruit. This creates sophisticated buyers as the Japanese market demand high quality kiwifruit, which has always been known as a premium market. Even as the overall fresh fruit consumption was stagnating in 2014, kiwifruit recorded its strongest June sales in kiwifruit history (Hey, 2015). This indicates that the home demand is continuing to grow, despite faltering’s in fruit as a whole. Related and Supporting Industries The fruit industry is a competitive market in Japan, yet kiwifruit seems to be the only fruit that can continue to grow. Other fruits such as bananas have to compete with kiwifruit in order to keep its market share, yet high import prices and a weak Yen have driven up prices (Hey, 2015). The Global Competitiveness Report (2013) also ranks Japan’s business sophistication extremely highly, with local supplier quantity and quality coming in 1st and 2nd respectively and its production process sophistication also ranked 2st in the world. Firm Strategy, Structure and Rivalry The kiwifruit industry is well known and liked in Japan, yet Japan is known as an importing nation and it’s no different when it comes to kiwifruit. There is little to no information on the Japanese kiwifruit industry that does produce the kiwifruit for domestic consumption. It can be assumed that these crops are located in the Ehime and Sage prefectures, which is 800km south of Tokyo, because Zespri’s 730 Japanese kiwifruit growers are based there (Zespri , 2011), and because Japan ranks 7th in the world for clusters (World Economic Forum, 2013), yet what firms are located there and how many are yet to be determined. Impact of Government and Chance The government plays a small but significant role in the kiwifruit industry, as it upholds a tariff of 6.4% (Arrowsmith, 2014) for New Zealand kiwifruit, but has FTAs with Chile and the European Union. This allows for greater movement for these kiwifruit producing nations than New Zealand. Chance plays a significant role in Japan for the kiwifruit industry as it is prone to natural disasters such as tsunamis and monsoons, but also human error as well, like the nuclear meltdown that occurred in 2011. However, based on the information above, the kiwifruit growing regions are far enough away that they do not feel the full force of any natural or manmade disasters.
Otago Management Graduate Review Volume 13 2015
70 Zespri in North-East Asia
Comparison of New Zealand with China, Japan, Korea Having applied the Determinants of Competitive National Advantage to the four countries, a comparison can now be conducted to examine the strengths and weaknesses of each individual country in comparison to New Zealand. New Zealand and China face very different challenges for their respective industries. While the climate for New Zealand and China both suit kiwifruit, the limited home demand in New Zealand has left the country relying on exports for competitiveness while China solely relies on domestic consumption with no plans to begin exporting anytime soon. New Zealand’s workforce is highly educated, that is constantly innovating its production, which is similar to Korea’s and Japan’s industry, but not of China’s. However, China, Japan and Korea have greater access to human resources, all because of their larger population size, which will always be a hindrance for New Zealand. The company structure in New Zealand, with every grower working under Zespri, almost sound like the perfect communist organisation which should be already happening in China, yet the overarching organisation is in disarray. Access to capital was surprisingly very difficult for Koreans, while New Zealanders had the greatest access to loans compared to China and Japan, but China had the greatest access for its people in venture capital. As the three North Asian nations are highly developed (China is not, but its infrastructure is very strong) with roads, express highways and access to efficient railroads. New Zealand however, does not have quality of infrastructure like these three nations. The highest level of sophistication came from Korea, due to the large number of competing countries and firms in its kiwifruit industry. New Zealand, China and Japan also have strong home demand, where in New Zealand growers can compete against one another with their own brand in New Zealand and Australia, yet there is not enough demand to fill supply. In China and Japan, there is room for the home market to become more sophisticated, which would in turn boost their own kiwifruit industry. All four nations have strong related and supporting industries, helping to give their industry an advantage. In New Zealand, the level of education and innovation boosts New Zealand’s competitive advantage. In China, FTAs with Chile and New Zealand are driving the industry to fix its problems. In Korea and Japan, highly developed infrastructure, networks and clusters enable some form of competitive advantage for their industries. New Zealand’s structure of a single desk exporter is extremely beneficial to its kiwifruit industry, as there is a regulated quality on kiwifruit by Zespri, always ensuring only the best kiwifruit is exported. Yet there is absolutely no competition nationally against Zespri. However, to compensate for that, Zespri and the government invest heavily in innovation, so as to always have an advantage over its competitors. China would be the only other nation seen as a competitor internationally to New Zealand, but its focus on domestic consumption rules it out. Korea and Japan are seen as major importers of the fruit, with minimal production from their own industries. The government in New Zealand is extremely supportive and protective of the kiwifruit industry, taking steps to ensure that the industry is performing to the best of its abilities. The New Zealand government provides yearly grants and investments in innovation for kiwifruit. This all makes
Volume 13 2015 Otago Management Graduate Review
Westropp 71
sense as Zespri is New Zealand’s biggest horticultural earner and the government wants to keep it like that, with the industry looking to double from NZ$1.6 billion to NZ$3 billion by 2018. The government in China as always is involved with their kiwifruit industry, but it’s been neglecting it for some time, with changes needed to be made. The Korean government recently dropped its protectionist status on major country producers for kiwifruit, allowing unrestricted access to their kiwifruit market for the major producers of New Zealand, Chile and Italy. In Japan meanwhile, the government still upholds a 6.4% tariff on New Zealand but not for Chile or the European Union, similar to the situation in Korea. Chance will always play a significant part in terms of natural disasters, where the damage and costs would be similar across these countries. Human disasters must also be taken into account after the nuclear meltdown in Japan. Future Growth Opportunities There are several growth opportunities available to Zespri that have been identified through the analysis. Firstly, now that a FTA has been agreed between New Zealand and South Korea, Zespri now has the opportunity to compete against its rival competitors in Chile and Italy in this premium paying market. Currently, Zespri owns 100 hectares in South Korea for growing Zespri SunGold kiwifruit, but this can significantly expand if need be, due to the FTA (Arrowsmith, 2014). South Korea also only makes up 6% of Zespri’s total market sales, but it can now aim to be at a similar level to that of China’s (10%) and Japan’s (18%) (Arrowsmith, 2014). The FTA also frees up approximately NZ$20 million that would be paid as tariffs to the South Korean government, where Zespri can now distribute that money towards making a decisive push into this market. Another growth opportunity that is presenting itself to Zespri is the potential signing of the TPPA, which will allow certain free trade agreements with Japan. As mentioned in the Japanese-New Zealand relationship section, New Zealand has been pressing for an FTA with Japan, to always be rebuffed. However, assuming the TPPA is signed, New Zealand will then have opportunities to navigate the Japanese market with greater access than previously allowed. However, this is all dependent on whether the TPPA is signed. Within the Chinese market, Zespri is already taking advantage of the huge demand and the rising middle class by exporting close to 13 million trays in 2014 and 20 million in 2015 (Gray, 2014). However, Gold kiwifruit has been undersupplied in the Chinese market, as it fetches around NZ$9.30 a tray and NZ$5.30 a tray for green kiwifruit. Considering China only imports around 10% of Gold kiwifruit, it is definitely a variety of kiwifruit that can be exploited in the Chinese market (Gray, 2014). Conclusion This paper has analyzed and discussed Zespri and its relationship with its North Asian trading partners, China, Korea and Japan. It has been identified that these three markets are critical to New Zealand in terms of general trade and for New Zealand’s kiwifruit industry. Using Porter’s CAN model, a greater
Otago Management Graduate Review Volume 13 2015
72 Zespri in North-East Asia
understanding of how these markets operate and the advantage that New Zealand kiwifruit have over these nations have been identified and discussed. Future growth recommendations have also been discussed, as the research identified gaps in the market that Zespri can take advantage of. Limitations to this research paper predominantly revolve around the lack of information available on the kiwifruit industries of Japan, Korea and China. Research was either not published or heavily outdated. Assumptions had to be made in some cases. References Anker-Kofoed, E. (2015). A quantitative analysis of global kiwifruit trade.
Uppsala: Swedish University of Agricultural Sciences. Arrowsmith, G. (2014). Zespri Marketing in South Korea. Seoul : Zespri. Asia Trade Hub. (2015). China Infrastructure - Agriculture. Retrieved from
Asia Trade Hub: http://www.asiatradehub.com/china/agriculture3.asp Asia Trade Hub. (2015). Japan. Retrieved from Asia Trade Hub:
http://www.asiatradehub.com/japan/intro.asp Asia Trade Hub. (2015). South Korea. Retrieved from Asia Trade Hub:
http://www.asiatradehub.com/s.korea/trade.asp Bano, S., & Scrimgeour, F. (2011). New Zealand Kiwifruit Export
Performance: Market Analysis and Revealed Comparative Advantage. Hamilton: University of Waikato.
Carlson, S. (1975). How foreign is foreign trade? A problem in international business research. Upsalla: Uppsala: Acta Universitatis Upsaliensis.
Collen, C. (2015, May 13). NZ kiwi industry thanks government. Retrieved from Asia Fruit: http://www.fruitnet.com/asiafruit/article/165215/nz-kiwi-industry-thanks-government
Godo, Y. (2013). The Agricultural Labor Force in Japan. Tokyo: Meiji Gakuin University.
Gray, J. (2014, September 20). Kiwifruit exports set to surge. Retrieved from The New Zealand Herald: http://www.nzherald.co.nz/business/news/article.cfm?c_id=3&objectid=11328031
Hey, J. (2015, August 5). Kiwifruit shines in Japan. Retrieved from Asia Fruit: http://www.fruitnet.com/asiafruit/article/162317/kiwifruit-shines-in-japan
Hood, N., & Young, S. (1979). Economics of multinational enterprise. London: Longman.
Huang, H., & Ferguson, R. (2001). Review: Kiwifruit in China. New Zealand Journal of Crop and Horticultural Science, 1-14.
Huang, H., & Ferguson, R. (2002). Kiwifruit (Actinidia chinesis and A. deliciosa) plantings and production in China, 2002. New Zealand Journal of Crop and Horticultural Science, 197-202.
Independent Kiwifruit Growers Association . (2013, October 28). There Must Be an Independent Enquiry into Kiwifruit Industry. Retrieved from Scoop Business: http://www.scoop.co.nz/stories/BU1310/S00983/there-must-be-an-independent-enquiry-into-kiwifruit-industry.htm
Japan-Guide. (2010, February 28). Japanese Fruits. Retrieved from Japan-Guide: http://www.japan-guide.com/e/e2347.html

Volume 13 2015 Otago Management Graduate Review
Westropp 73
Johanson, J., & Mattsson, L. (1988). Internationalization in industrial systems: a network approach. In N. Hood, & J.-E. Vahlne, Strategies in global competition (pp. 194-213). London: Croom Helm.
Johanson, J., & Vahlne, J.-E. (2009). The Uppsala internationalization process model revisited: From liability of foreignness to liability of outsidership. Journal of International Business Studies, 1411-1431.
Johanson, J., & Wiedersheim-Paul, F. (1975). The internationalization of the firm: Four Swedish cases. Journal of Management Studies, 305-322.
Lee-Jones, D. (2010). 2010 Report on State of Kiwifruit Sector in New Zealand. Wellington: USDA Foreign Agricultural Service.
Lee-Jones, D. (2014). New Zealand Kiwifruit Sector Report - 2014. Wellington: USDA Foreign Agricultural Service.
Masum, M., & Fernandez, A. (2008). Internationalization Process of SMEs: Strategies and Methods. Vasteras: Malardalen University SChool of Sustainable Development and Technology.
McCully, M. (2013, June 9). Joint statement on a strategic cooperative partnership between Japan and New Zealand - shared values and vision. Retrieved from beehive.govt.nz: http://www.beehive.govt.nz/release/joint-statement-strategic-cooperative-partnership-between-japan-and-new-zealand-shared-value
National Bureau of Statistics. (2008, February 21). Communiqué on Major Data of the Second National Agricultural Census of China (No.1). Retrieved from National Bureau of Statistics: http://wayback.archive.org/web/20131213092519/http://www.stats.gov.cn/was40/reldetail.jsp?docid=402464541
NelsonMail. (2010, February 9). Cultivating a vine romance with Korea. Retrieved from Stuff.co.nz: http://www.stuff.co.nz/nelson-mail/lifestyle-entertainment/primary-focus/3307029/Cultivating-a-vine-romance-with-Korea
New Zealand Foreign Affairs and Trade. (2015). New Zealand and China. Retrieved from New Zealand Foreign Affairs and Trade: http://www.nzembassy.com/china/relationship-between-new-zealand-and-china/new-zealand-and-china
New Zealand Horticulture Export Authority. (2015). Kiwifruit. Retrieved from New Zealand Horticulture Export Authority : http://www.hea.co.nz/index.php/2012-05-11-03-05-28/kiwifruit-trade
New Zealand International Business Forum. (2013). New Zealand and Japan. Retrieved from New Zealand International Business Forum: http://www.nzibf.co.nz/index.asp?pageID=2145856139
New Zealand Ministry of Foreign Affairs & Trade. (2014, October 8). Japan. Retrieved from New Zealand Ministry of Foreign Affairs & Trade: http://www.mfat.govt.nz/Countries/Asia-North/Japan.php#invest
New Zealand Ministry of Foreign Affairs & Trade. (2014, July 30). Republic of Korea. Retrieved from New Zealand Ministry of Foreign Affairs & Trade: http://www.mfat.govt.nz/Countries/Asia-North/South-Korea.php#Overview2
New Zealand Trade and Enterprise. (2015, May 21). New Zealand and Korea: new opportunities. Retrieved from New Zealand Trade and Enterprise: https://www.nzte.govt.nz/en/news-and-media/blogs-and-commentary/2015/5/21/new-zealand-and-korea-new-opportunities/
Otago Management Graduate Review Volume 13 2015
74 Zespri in North-East Asia
Oh-Seok, H. (2012, October 29). Liberalisation a strong foundation to South Korean economy. Retrieved from http://www.thenational.ae/business/industry-insights/economics/liberalisation-a-strong-foundation-to-south-korean-economy: http://www.thenational.ae/business/industry-insights/economics/liberalisation-a-strong-foundation-to-south-korean-economy
Porter, D. (2014, February 15). Kiwifruit industry set for growth. Retrieved from Bay of Plenty Times: http://m.nzherald.co.nz/bay-of-plenty-times/news/article.cfm?c_id=1503343&objectid=11203065
Porter, M. (1979). How Competitive Forces Shape Strategy. Harvard Business Review, 137-145.
Porter, M. (1990). The Competitive Advantage of Nations. Harvard Business Review, 73-93.
Smit, A. (2010). The competitive advantage of nations: is Porter's Diamond Framework a new theory that explains the international competitiveness of countries? Southern African Business Review, 105-130.
Statistics New Zealand. (2014, January). Fresh Fruit and Vegetable Prices - Our Global Connection. Retrieved from Statistics New Zealand: http://www.stats.govt.nz/tools_and_services/newsletters/price-index-news/jan-14-fruit-and-vege.aspx
The CIA World Fact Book. (2013). Labor Force - By Occupation. Retrieved from The CIA World Fact Book: https://www.cia.gov/Library/publications/the-world-factbook/fields/2048.html
The New Zealand Herald. (2015, March 24). Majority of kiwifruit growers support industry reform. Retrieved from The New Zealand Herald: http://www.nzherald.co.nz/business/news/article.cfm?c_id=3&objectid=11422303
The World Bank. (2015). Agricultural land (% of land area). Retrieved from The World Bank: http://data.worldbank.org/indicator/AG.LND.AGRI.ZS
Trading economics. (2011). Agricultural land (sq. km) in South Korea. Retrieved from Trading economics: http://www.tradingeconomics.com/south-korea/agricultural-land-sq-km-wb-data.html
Trading Economics. (2012). Improved water source (% of population with access) in South Korea. Retrieved from Trading Economics: http://www.tradingeconomics.com/south-korea/improved-water-source-percent-of-population-with-access-wb-data.html
United Nations Food and Agriculture Organization. (2007). New Zealand: Country Report on the State of Plant Genetic Resources for Food and Agriculture. Wellington: United Nations Food and Agriculture Organization.
Vernon, R. (1966). International Investment and International Trade in the Product Cycle. The Quarterly Journal of Economics, 190-207.
World Economic Forum. (2013). The Global Competitiveness Index. World Economic Forum.
Zespri . (2011, March 31). Zespri sends NZ water to Japan with kiwifruit. Retrieved from NZ Herald: http://m.nzherald.co.nz/zespri-group-limited/news/article.cfm?o_id=252&objectid=10716233

Volume 13 2015 Otago Management Graduate Review
Westropp 75
Zespri. (2009, November 9). Government and ZESPRI Announce $35.7 Million Investment. Retrieved from Zespri: https://www.zespri.com/companyinformation/newsroom/government-and-zespri-announce-investment
Zespri. (2014, July 10). Zespri new graduate recruitment scheme to attract top young talent. Retrieved from Zespri: http://www.zespri.com/companyinformation/newsroom/zespri-graduate-recruitment-scheme
Zespri. (2014, November 15). Zespri welcomes Free Trade Agreement with South Korea. Retrieved from Zespri: http://www.zespri.com/companyinformation/newsroom/zespri-welcomes-free-trade-agreement-with-south-korea
Zespri. (2015). About Zespri. Retrieved from Zespri: http://www.zespri.com/companyinformation
Zespri. (2015). Growing Zespri - On Orchard. Retrieved from Zespri Kiwifruit: http://www.zesprikiwi.com/about/sustainability/growing
Zespri. (2015, March 28). Kiwifruit industry set for strong growth in 2015 season. Retrieved from Zespri: http://www.zespri.com/companyinformation/newsroom/first-ship-2015
Zespri Kiwifruit. (2013). Annual Report 2012/2013. Tauranga: Zespri.