contents table of - sedf.gos.pksedf.gos.pk/pdf/gem-ar-2011.pdf · executive summary 1. in 2011, the...
TRANSCRIPT
CONTENTS
01
TABLE
03040506
1012
13162729384041
42
43
56
OF
575860
LIST OF FIGURES
Figure 1: The Entrepreneurship Process and GEM Operational DefinitionsFigure 2: Characteristics of Economic Groups and Key Development FocusFigure 3: The GEM ModelFigure 4: Entrepreneurial Profile of Pakistan compared with other nationsFigure 5: Entrepreneurship Institution Profile of Pakistan with other nationsFigure 6: Sector Structure Total early-stage Entrepreneurial Activity (TEA) and Established Business ActivityFigure 7: TEA rates of GEM 2011 participating countriesFigure 8: Total Early-Stage Entrepreneurial Activity Rates and Per Capita GDP 2011Figure 9: GEM Economies Ranked by Level of Female Participation in Total Early-Stage Entrepreneurship Activity (TEA) by Economic Group, 2011Figure 10A&B: Composite indicators on entrepreneurship institutionsFigure 11: Mean Scores Awarded by National Experts to Entrepreneurial Framework Conditions in Pakistan as compared to factor driven economiesFigure 12: Mean Scores Awarded by National Experts to Entrepreneurial Framework Conditions in Pakistan as compared to efficiency driven economiesFigure 13: Mean Scores Awarded by National Experts to Entrepreneurial Framework Conditions in Pakistan as compared to innovation driven economiesFigure 14 : Entrepreneurial attitudes in Pakistan (%age ALL respondents aged 18 -64 expressing an opinion and agreeing with the statement)Figure: 15 Entrepreneurial attitudes in Pakistan (%age MALE respondents aged 18 -64 expressing an opinion and agreeing with the statement)Figure 16: Entrepreneurial attitudes in Pakistan (%age FEMALE respondents aged 18 -64 expressing an opinion and agreeing with the statement)Figure 17: Perceptions of entrepreneurship among non-entrepreneurially active working age population towards entrepreneurship in various provinces
of Pakistan (Know someone personally who started a business in the past 2 years.)Figure 18: Perceptions of entrepreneurship among non-entrepreneurially active working age population towards entrepreneurship in various provinces
of Pakistan (Good start up opportunities in the next six months)Figure 19: Perceptions of entrepreneurship among non-entrepreneurially active working age population towards entrepreneurship in various provinces
of Pakistan (Have the knowledge, skill and experience required to start a new business)Figure 20: Perceptions of entrepreneurship among non-entrepreneurially active working age population towards entrepreneurship in various provinces
of Pakistan (Fear of failure Preventing from starting a business)Figure 21: Perceptions of entrepreneurship in various cities of Pakistan (Know someone personally who started a business in the past 2 years.)Figure 22: Perceptions of entrepreneurship in various cities of Pakistan (Good start up opportunities in the next six months)Figure 23: Perceptions of entrepreneurship in various cities of Pakistan (Have the knowledge, skill and experience required to start a new business)Figure 24 : Perceptions of entrepreneurship among non-entrepreneurially active working age population towards entrepreneurship in various provinces
of Pakistan (Fear of failure preventing from starting a business)Figure 25: Proportion of respondents by stage of entrepreneurial activity in PakistanFigure 26: Different measures of entrepreneurial activity in various regions of Pakistan (Expects to start a business in the next 3 years (future))Figure 27: Different measures of entrepreneurial activity in various regions of Pakistan (Nascent Entrepreneurial Activity Rate (Actively involved in start-
up effort, owner, no wages yet))Figure 28: Different measures of entrepreneurial activity in various regions of Pakistan (New Business Owner-Manager Rate (Manages a business that is
up to 42 months old))Figure 29: Different measures of entrepreneurial activity in various regions of Pakistan (Nascent + New Business Owner Manager Rate)Figure 30: Different measures of entrepreneurial activity in various regions of Pakistan (Established Business Owners (>42 months))Figure 31: Different measures of entrepreneurial activity in various regions of Pakistan (Business Closure rate (Discontinued a business in
the past 12 months))Figure 32: Total early stage entrepreneurial activity in PakistanFigure 33: Early stage entrepreneurial activity in Pakistan, MaleFigure 34 : Early stage entrepreneurial activity in Pakistan, FemaleFigure 35: Total early stage Entrepreneurial Activity in Pakistan Regions based on opportunity entrepreneurship, MaleFigure 36: Total early stage Entrepreneurial Activity in Pakistan Regions based on opportunity entrepreneurship, FemaleFigure 37: Total early stage Entrepreneurial Activity in Pakistan Regions based on necessity entrepreneurship, MaleFigure 38: Total early stage Entrepreneurial Activity in Pakistan Regions based on necessity entrepreneurship, Female
LIST OF TABLES
Table 1: GEM 2011 Participating Countries Classified by Economy and GeographyTable 2A: Some general characteristics and entrepreneurship indicators of PakistanTable 2B: Comparison of various entrepreneurial characteristics and framework conditions of Pakistan with peer nationsTable 3: Attitudes towards Entrepreneurship in participating GEM Countries in 2011Table 4: Entrepreneurial Attitude in Pakistan: Respondents expressing the opinion and agreeing with the statementTable 5A: Perceptions of entrepreneurship among non-entrepreneurially active working age population towards entrepreneurship in various
provinces of PakistanTable 5B: Perceptions of entrepreneurship among non-entrepreneurially active working age population towards entrepreneurship in various
provinces of PakistanTable 6A: Perceptions of entrepreneurship in various cities of PakistanTable 6B: Perceptions of entrepreneurship in various cities of PakistanTable 7: Total early stage Entrepreneurial Activity in GEM participating countries in 2011Table 8: Measurement of entrepreneurial activity in GEM participating countries.Table 9: Proportion of respondents by stage of entrepreneurial activity in PakistanTable 10: Opportunity and Necessity Entrepreneurship in GEM Participating countriesTable 11: Total Early stage entrepreneurial activity by gender in Participating GEM CountriesTable 12: Established business ownership by genderTable 13: Different measures of entrepreneurial activity in various regions of PakistanTable 14: Total Early Stage Entrepreneurial Activity in Pakistani Regions in 2011Table 15A: Male and Female Total early stage Entrepreneurial Activity in Pakistani Regions, 2011Table 15B: Opportunity and Necessity Entrepreneurial Activity in Pakistani Regions, 2011Table 16: Male and Female Total early stage Entrepreneurial Activity in Pakistani Regions, 2011 based on opportunity entrepreneurshipTable 17: Male and Female Total early stage Entrepreneurial Activity in Pakistani Regions, 2011 based on necessity entrepreneurshipTable 18: Measures of entrepreneurial aspiration in GEM participating countries, 2011
02
We are living in a continuously changing and a dynamic world. The demographic, social, economical and technological changesare dramatically impacting the way we live, behave and act. The IT revolution and the internet are playing a pivotal role in thistransformation. We are witnessing the dawn of an entrepreneurial revolution in the entire world as more and more people getaccess to education and the internet.
With a shift towards creating the entrepreneurial economy, and increased calls for public-private partnerships to achieve this goal,the role of the government along with the private sector and the academic institutions is to create an environment and an ecosystem which favours and creates incentives for entrepreneurial activity. The role of the government has to go beyond the traditionaleconomic rational of relying on the existence of market failures and distortions, but rather, intervening so that these market failuresand distortions do not negatively impact on the entrepreneurial society. The academic institutions have to play an important roleof educating the youth of the country and to develop an entrepreneurial mindset.
Pakistan's estimated population in 2011 is over 187 million making it the world's sixth most-populous country, behind Brazil andahead of Bangladesh. During 1950-2011, Pakistan's urban population expanded over sevenfold, while the total population increasedby over fourfold. The structure of the population pyramid has changed a lot in the past decade as the base of the pyramid hasbecome very heavy. 140 million of the population is between the age 0 to 40 and there are about 80 million people in the agebracket of 15 to 40 years.
Although this seems to be a great challenge but it can be converted in to a great opportunity. The Pakistani nation has the Godgifted ability to be entrepreneurial. SMEs constitute nearly 90% of all the enterprises in Pakistan; employ 80% of the non-agricultural labor force; and their share in the annual GDP is 40%, approximately. The industrial belt of Gujranwala, Sialkot isfamous for its entrepreneurial spirit and the contribution to the Pakistani economy. The textile based SMEs are the back bone ofthe economy. I consider entrepreneurship a panacea for a developing country like Pakistan, which has one of the highest populationgrowth rates with the highest number of youth population. It is high time that the government, politicians, the business community,academic institutions and other stake holders join hands in promoting entrepreneurship.
I congratulate the GEM Pakistan Team on the completion of this second GEM research cycle. I am confident that the researchfindings will help our policy makers, researchers and educators in Pakistan to create awareness and enhance learning about theentrepreneurial process with the aim of creating new opportunities for our aspiring entrepreneurs by improving support for newand innovative business ventures.
Dr. Ishrat HusainDean and DirectorIBA, Karachi
FOREWORD
03
On behalf of our GEM Pakistan team, I am pleased to launch the second national Global Entrepreneurship Monitor researchreport based on the 2011 data collection cycle. While, we are celebrating the completion of this second cycle of our researchproject, we are mindful of IBA's strong commitment to entrepreneurship and sponsorship of the GEM Project. For this, I amespecially indebted to Dr. Ishrat Husain, Dean and Director IBA for his leadership and faith in Pakistan's entrepreneurial developmentthat made it possible despite numerous challenges. We are equally grateful to those institutions which provided financial supportover the last two consecutive research cycles: besides IBA, the USAID contributed in the form of paying the project fee and sometravel for which I would like to thank them for the assistance. On behalf of the GEM Pakistan 2011 team, I also wish to thankall those national experts and adult survey respondents who spared their valuable time for interviews and answered our questions(Appendix 3 provides a list of our NES experts).
OASIS Insights played a key role as our APS vendor by collecting data from more than two thousand adult respondents from allover Pakistan - their professionalism and timely completion of the survey is appreciated.
I would like to take this opportunity to recognize my GEM Pakistan 2011 Team colleagues Dr. Shahid Qureshi, and Mr. ZafarSiddiqui of the Center for Entrepreneurial Development at IBA. Dr Qureshi who is the Co-Principal Investigator of this projectsupervised the Adult Population Survey, was responsible for data analysis and co-authored this report with me. Mr. Siddiqui helpedin fund raising and assisted in managing the report launch function. I am thankful to both for this crucial support. Mr. Moid Sultanand Mr. Jehanzeb of IBA's Accounts and Finance Department were always available for help that made our work easier and wethank them for the assistance.
The research associates at CED, Mr. Waleed Wasti and Shaheer Kazmi contributed a lot in the NES and report preparation.
I would also like to thank the members of the IBA led consortium of universities who have contributed financially for the nextGEM 2012 cycle. Special thanks are for Syed Ali Akbar Rizvi, Director Centre for Entrepreneurship, IBA Sukkur, Akhtar AliQureshi, General Manager "Centre for Innovation & Entrepreneurship (CIE)" Centre for Innovation & Entrepreneurship (CIE),NUST Islamabad, Mr. Asif Shah, Director Incubator UET Peshawar and Nadeem Mustafa, Head of GIFT Business School,GIFT University Gujranwala.
Finally, I would like to express my appreciation to Dr. Mike Herrington, Dr. Niels Bosma, Ms. Marcia Cole, Mr. Chris Aylett, Ms.Yana Litovsky, Dr. Alicia Coduras, Dr. Jeff Seaman and Ms. Ingrid Blake, all of the Global GEM Project Management Team fortheir continued encouragement and support of our GEM Pakistan project.
Sincerely,
Sarfraz A. Mian, PhDHead and PI,GEM Pakistan Team
ACKNOWLEDGEMENTS
04
EXECUTIVE SUMMARY1. In 2011, the Global entrepreneurship monitor (GEM) research consortium measured entrepreneurial activity of individuals
in 54 member economies, making it the world's most authoritative comparative study of entrepreneurial activity in the generaladult population. Two thousand adults aged 18-64 participated in the GEM Pakistan Survey in 2011.
2. This national monitoring report compares global entrepreneurship monitor (GEM) measures of various entrepreneurialcharacteristics (attitudes, aspirations, and activities) in Pakistan and other participating countries. It also summarizes theseentrepreneurial characteristics within various regions and cities of Pakistan. It examines the views of entrepreneurs on theimpact of recent global recession on their own businesses. It also reports expert views on the environment for entrepreneurshipin Pakistan and compares these with other GEM nations.
3. The number of people in Pakistan who have a positive attitude towards entrepreneurship is less than the average of its factor- driven peer countries. However it is higher than the average figures of innovation driven economies. Moreover the malepopulation has a more positive attitude towards entrepreneurship in Pakistan as compared to the female population.
4. Within Pakistan, the residents of Sindh and Baluchistan have a higher favorable attitude towards entrepreneurship andperceive more opportunities in the near future. Among the major cities, the residents of Islamabad, Hyderabad and Faisalabadhave a more positive perception of entrepreneurial opportunities in the future and perceive to have the highest level of skillset, knowledge and experience to start an entrepreneurial venture as compared to other major cities of Pakistan.
5. Total early stage Entrepreneurial Activity or TEA rate (the sum of the nascent entrepreneurship rate and the new businessmanager rate) in Pakistan was 9.07 %. This is lower than the average TEA rates for the factor driven economies (1 4.22 %)and efficiency driven economies (13.8 %). However this is greater than the average TEA rate of Innovation driven economies(6.92 %).
6. The TEA is classified into two types i.e. opportunity based TEA and necessity based TEA. About 4% of Pakistanis wereinvolved in opportunity based early stage entrepreneurial activity. This rate is considerably less than the average of factordriven (8.5%) and efficiency driven countries (9.05%).
7. The male TEA rate in Pakistan is more than eight times that of the female TEA rate. The gender gap is pretty high ascompared to other factor and efficiency driven countries.
8. The Established Business Ownership (EBO) rate in Pakistan was 4.08 %. This is lower than the average EBO rates forPakistan's peer factor driven economies (6.20 %), as well as efficiency driven (7.5 4 %) and innovation driven (7.22 %)economies
9. The male Established Business Ownership (EBO) rate in Pakistan is almost 8 times that of female EBO rate. This shows thatthe gender gap in EBO is also very high as compared to other factor, efficiency and innovation driven countries.
10. When surveyed, 9.07 % of the adult population in Pakistan was trying to start a business (nascent entrepreneurs) was lowerthan the average of factor-driven economy nations (1 4.2%), compared to 14.5% in Iran, 11.87% in Turkey and 23% inChile.
11. According to the survey, Pakistani population's new business ownership rate (owner managers of a business that was between3 to 42 months old) was 1.7%. This rate is considerably less than the average of factor driven (4.88 %), efficiency driven(6.09%) and innovation driven economies rate (2.7 %)
12. Entrepreneurial activity in various Pakistani regions is found to be as follows. Baluchistan has the highest rate of activeinvolvement in startup effort and at the same time has the highest business closure rate. Punjab has the highest rate ofestablished business owners (4.3) and Baluchistan and KPK has the highest rate of expectations to start a business in the nextthree years.
13. In Pakistan early stage entrepreneurs and business managers have low aspirations to grow as compared to most other GEMparticipating countries. The proportion of early stage Pakistani entrepreneurs reporting new product/market combinationsand with at least 25% foreign customers is (12.29) above the average of factor driven countries.
14. In Pakistan 31.19% of the total working age population (including those entrepreneurially active) expressed opinion that fearof failure would prevent them from starting a business. The fear of failure in the Pakistani population is less than the averageof the factor driven economies.
15. Experts on entrepreneurship in Pakistan gave government programs significantly lower ratings than the factor and efficiencydriven countries. Cultural and social norms were also more negative for entrepreneurship in Pakistan than the other factorand efficiency driven countries
05
CHAPTER 1: INTRODUCTIONAND BACKGROUND
06
1.1 Study Introduction
After our first GEM Pakistan 2010 study, a year ago, this report provides the results of Pakistan's second national survey of variousentrepreneurial characteristics studied under the Global Entrepreneurship Monitor (GEM) program. This grass-roots researchprogram is aimed at better comprehending the dynamics of national/local entrepreneurship context by measuring attitudes,activities and aspirations of adult individuals participating in different phases of entrepreneurship. There is an ever increasingevidence of the use of GEM data and its research findings in policy making at all levels of government and academia in orderto promote entrepreneurship in member nations.
The GEM project is implemented through the collaborative efforts of participating national teams and is coordinated by the GlobalGEM consortium. According to the research design, each GEM national team conducts its adult population survey (APS) alongwith a national expert survey (NES) and the data are harmonized allowing national comparisons of the key entrepreneurialdimensions. The last GEM 2011 Global Report summarizing this world-wide data gathering and research activity of 54 nationalteams including Pakistan was released earlier in January 2011 (see www.gemconsortium.org).
Pakistan joined GEM in 2010 under the sponsorship of IBA Karachi and undertook its first GEM study in the summer of 2010.The second study was conducted in the late summer of 2011. Every effort was made to ensure data quality and reliability ofresults, for which necessary weights were calculated (see Appendix 2) to address representativeness of the sample along genderand urban-rural lines. This report focuses on Pakistan specific findings providing necessary analyses and benchmarking with thepeer and other advanced nations. The work is intended to create public awareness, promote research and aid policymakers ofPakistan in identifying and helping to address the underlying issues impeding entrepreneurial growth by formulating enablingpolicies and support programs to enhance entrepreneurship in the nation.
1.2 Overview of the GEM Program and Research Model1
Founded in late 1990s2 , GEM program is administered by the Global Entrepreneurship Research Association (GERA), a not-for-profit body of academic researchers from prominent business schools across the globe. Over the last 12 years of its inceptionthe program has experienced phenomenal growth to include over 80 countries most of whom conduct their national GEM surveysevery year.
GEM focuses on three main objectives:
● To measure differences in entrepreneurial attitudes, activity and aspirations among nations.● To uncover factors determining the nature and level of national entrepreneurial activity.● To identify policy implications for enhancing entrepreneurship in an economy.
GEM is based on the following premises. First, an economy's prosperity is highly dependent on a dynamic entrepreneurship sector.This is true across all stages of development. Yet the nature of this activity can vary in character and impact. Necessity-drivenentrepreneurship, particularly in less developed regions or those experiencing job losses, can help an economy benefit from self-employment initiatives when there are fewer work options available. More developed economies, on the other hand, can leveragetheir wealth and innovation capacity, yet they also offer more employment options to attract those that might otherwise becomeentrepreneurs. In order to maintain their entrepreneurial dynamism they need to instill more opportunity-based motives.
Second, an economy's entrepreneurial capacity requires individuals with the ability and motivation to start businesses, and positivesocietal perceptions about entrepreneurship. Entrepreneurship should include participation from all groups in society, includingwomen, a range of age groups and education levels and disadvantaged populations. Finally, high-growth entrepreneurship is akey contributor to new employment in an economy, and national competitiveness depends on innovative and cross-borderentrepreneurial ventures.
GEM MeasuresAt the time of GEM's founding, traditional analyses of economic growth and competitiveness had, for the most part, neglectedthe role played by new and small firms in national economies, due, in some measure, to the lack of good data on this sector. Thisinformation, when available, tended to be present in only those countries at the most advanced stages of economic development.Existing measures, such as self-employment rates, did not reflect the dynamic scope of entrepreneurship. And while most governments
have long maintained records of formal business registrations, it wasn't until GEM emerged that an accurate picture could bedrawn of the entrepreneurially conscious people, and how many of them are actually involved in businesses in different cornersof the world started.
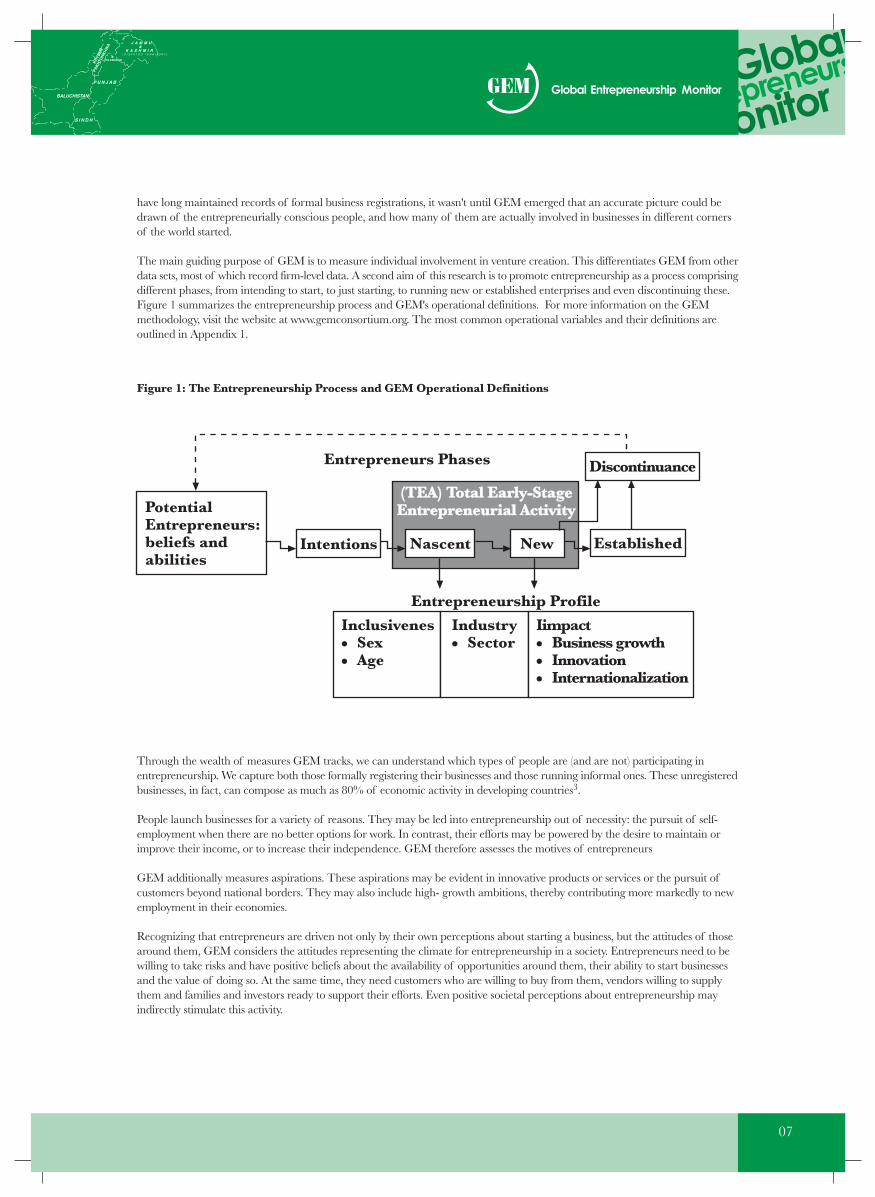
The main guiding purpose of GEM is to measure individual involvement in venture creation. This differentiates GEM from otherdata sets, most of which record firm-level data. A second aim of this research is to promote entrepreneurship as a process comprisingdifferent phases, from intending to start, to just starting, to running new or established enterprises and even discontinuing these.Figure 1 summarizes the entrepreneurship process and GEM's operational definitions. For more information on the GEMmethodology, visit the website at www.gemconsortium.org. The most common operational variables and their definitions areoutlined in Appendix 1.
Through the wealth of measures GEM tracks, we can understand which types of people are (and are not) participating inentrepreneurship. We capture both those formally registering their businesses and those running informal ones. These unregisteredbusinesses, in fact, can compose as much as 80% of economic activity in developing countries3.
People launch businesses for a variety of reasons. They may be led into entrepreneurship out of necessity: the pursuit of self-employment when there are no better options for work. In contrast, their efforts may be powered by the desire to maintain orimprove their income, or to increase their independence. GEM therefore assesses the motives of entrepreneurs
GEM additionally measures aspirations. These aspirations may be evident in innovative products or services or the pursuit ofcustomers beyond national borders. They may also include high- growth ambitions, thereby contributing more markedly to newemployment in their economies.
Recognizing that entrepreneurs are driven not only by their own perceptions about starting a business, but the attitudes of thosearound them, GEM considers the attitudes representing the climate for entrepreneurship in a society. Entrepreneurs need to bewilling to take risks and have positive beliefs about the availability of opportunities around them, their ability to start businessesand the value of doing so. At the same time, they need customers who are willing to buy from them, vendors willing to supplythem and families and investors ready to support their efforts. Even positive societal perceptions about entrepreneurship mayindirectly stimulate this activity.
07
Figure 1: The Entrepreneurship Process and GEM Operational Definitions
PotentialEntrepreneurs:beliefs andabilities
Entrepreneurs Phases Discontinuance
Established
(TEA) Total Early-StageEntrepreneurial Activity
Intentions
Entrepreneurship Profile
Inclusivenes● Sex● Age
Industry● Sector
Iimpact● Business growth● Innovation● Internationalization
Nascent New
Economic Development Level and Entrepreneurship
GEM's harmonized dataset enables comparisons of entrepreneurship activity around the globe, and within and across geographicregions. This report additionally examines groups of economies at similar development levels. Following a typology used by theWorld Economic Forum, GEM classifies the 54 GEM participants as “factor-driven,” “efficiency-driven” or “innovation-driven”economies4.
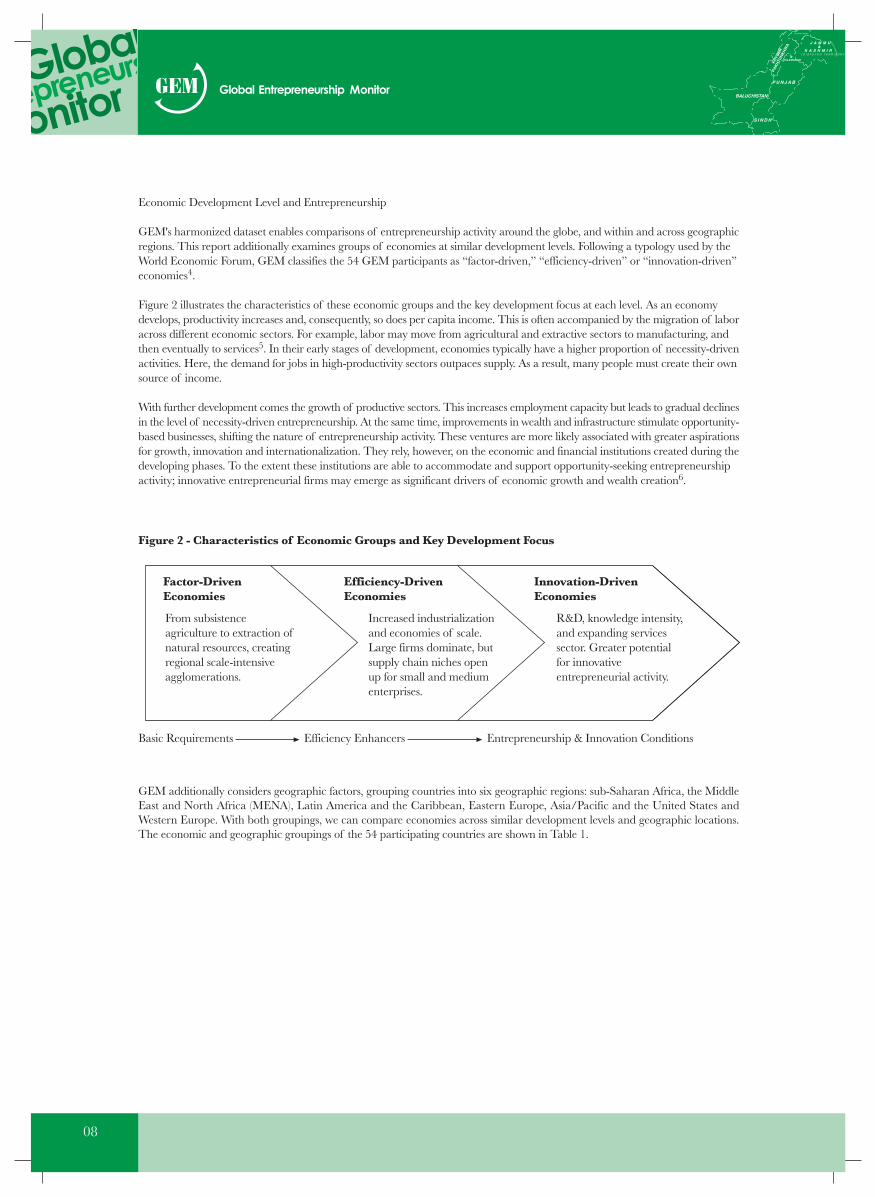
Figure 2 illustrates the characteristics of these economic groups and the key development focus at each level. As an economydevelops, productivity increases and, consequently, so does per capita income. This is often accompanied by the migration of laboracross different economic sectors. For example, labor may move from agricultural and extractive sectors to manufacturing, andthen eventually to services5. In their early stages of development, economies typically have a higher proportion of necessity-drivenactivities. Here, the demand for jobs in high-productivity sectors outpaces supply. As a result, many people must create their ownsource of income.
With further development comes the growth of productive sectors. This increases employment capacity but leads to gradual declinesin the level of necessity-driven entrepreneurship. At the same time, improvements in wealth and infrastructure stimulate opportunity-based businesses, shifting the nature of entrepreneurship activity. These ventures are more likely associated with greater aspirationsfor growth, innovation and internationalization. They rely, however, on the economic and financial institutions created during thedeveloping phases. To the extent these institutions are able to accommodate and support opportunity-seeking entrepreneurshipactivity; innovative entrepreneurial firms may emerge as significant drivers of economic growth and wealth creation6.
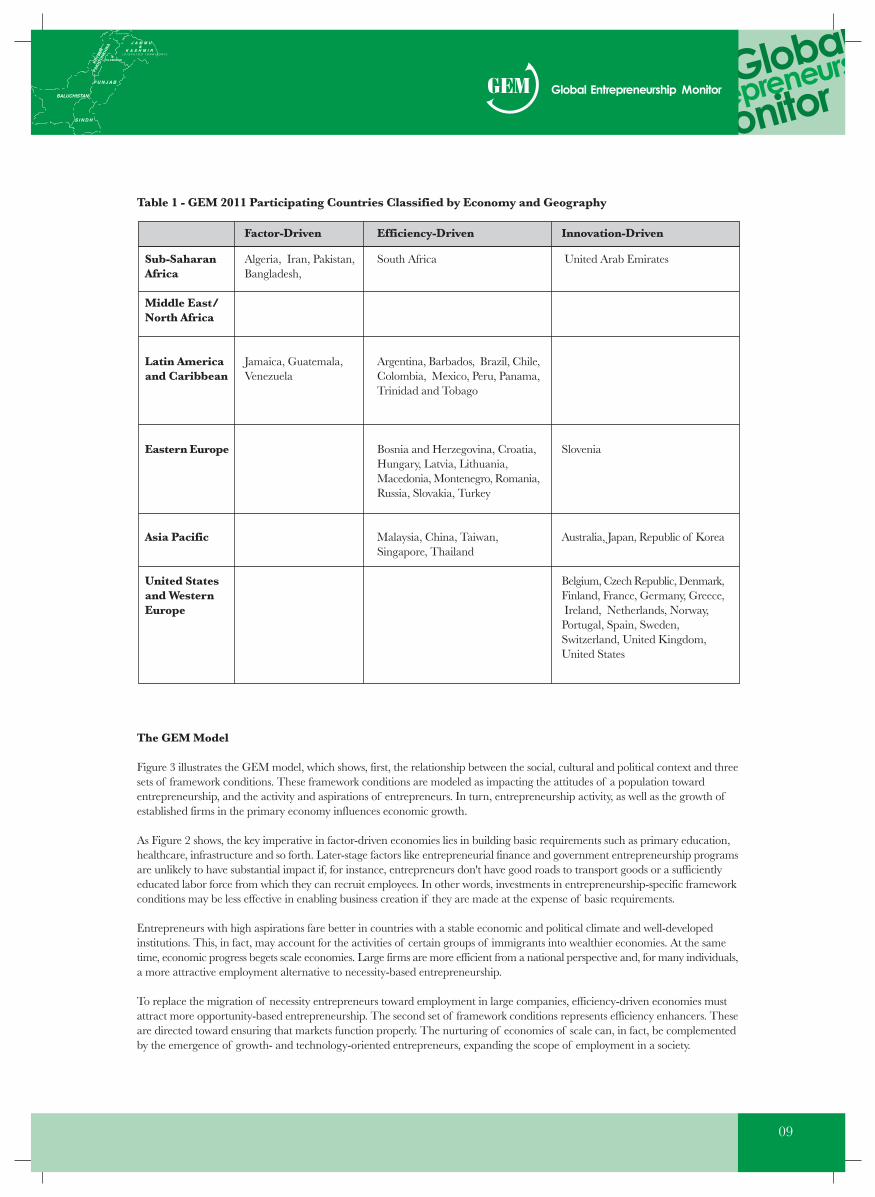
GEM additionally considers geographic factors, grouping countries into six geographic regions: sub-Saharan Africa, the MiddleEast and North Africa (MENA), Latin America and the Caribbean, Eastern Europe, Asia/Pacific and the United States andWestern Europe. With both groupings, we can compare economies across similar development levels and geographic locations.The economic and geographic groupings of the 54 participating countries are shown in Table 1.
Factor-DrivenEconomies
Efficiency-DrivenEconomies
Innovation-DrivenEconomies
From subsistenceagriculture to extraction ofnatural resources, creatingregional scale-intensiveagglomerations.
Increased industrializationand economies of scale.Large firms dominate, butsupply chain niches openup for small and mediumenterprises.
R&D, knowledge intensity,and expanding servicessector. Greater potentialfor innovativeentrepreneurial activity.
Basic Requirements Efficiency Enhancers Entrepreneurship & Innovation Conditions
Figure 2 - Characteristics of Economic Groups and Key Development Focus
08
Sub-SaharanAfrica
Middle East/North Africa
Latin Americaand Caribbean
Eastern Europe
Asia Pacific
United Statesand WesternEurope
09
Table 1 - GEM 2011 Participating Countries Classified by Economy and Geography
The GEM Model
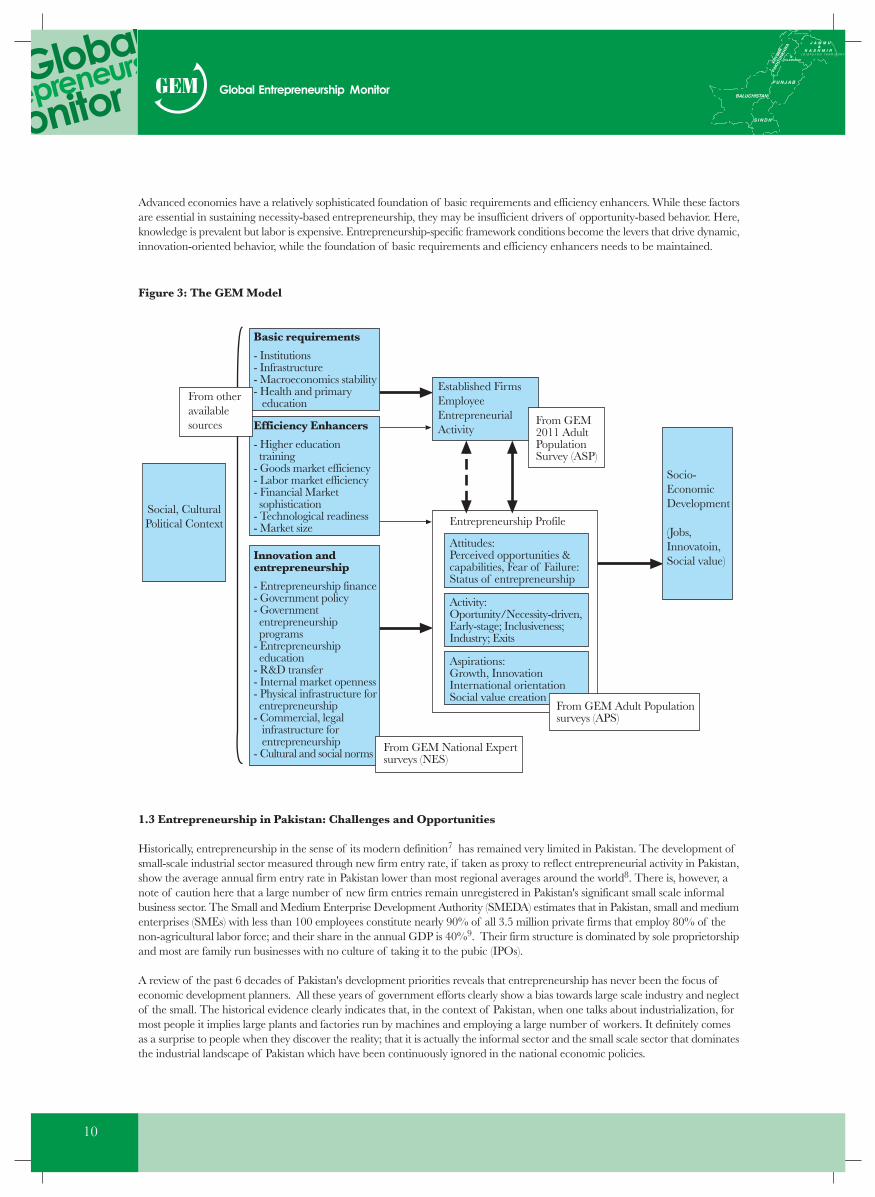
Figure 3 illustrates the GEM model, which shows, first, the relationship between the social, cultural and political context and threesets of framework conditions. These framework conditions are modeled as impacting the attitudes of a population towardentrepreneurship, and the activity and aspirations of entrepreneurs. In turn, entrepreneurship activity, as well as the growth ofestablished firms in the primary economy influences economic growth.
As Figure 2 shows, the key imperative in factor-driven economies lies in building basic requirements such as primary education,healthcare, infrastructure and so forth. Later-stage factors like entrepreneurial finance and government entrepreneurship programsare unlikely to have substantial impact if, for instance, entrepreneurs don't have good roads to transport goods or a sufficientlyeducated labor force from which they can recruit employees. In other words, investments in entrepreneurship-specific frameworkconditions may be less effective in enabling business creation if they are made at the expense of basic requirements.
Entrepreneurs with high aspirations fare better in countries with a stable economic and political climate and well-developedinstitutions. This, in fact, may account for the activities of certain groups of immigrants into wealthier economies. At the sametime, economic progress begets scale economies. Large firms are more efficient from a national perspective and, for many individuals,a more attractive employment alternative to necessity-based entrepreneurship.
To replace the migration of necessity entrepreneurs toward employment in large companies, efficiency-driven economies mustattract more opportunity-based entrepreneurship. The second set of framework conditions represents efficiency enhancers. Theseare directed toward ensuring that markets function properly. The nurturing of economies of scale can, in fact, be complementedby the emergence of growth- and technology-oriented entrepreneurs, expanding the scope of employment in a society.
Algeria, Iran, Pakistan,Bangladesh,
Jamaica, Guatemala,Venezuela
South Africa
Argentina, Barbados, Brazil, Chile,Colombia, Mexico, Peru, Panama,Trinidad and Tobago
Bosnia and Herzegovina, Croatia,Hungary, Latvia, Lithuania,Macedonia, Montenegro, Romania,Russia, Slovakia, Turkey
Malaysia, China, Taiwan,Singapore, Thailand
United Arab Emirates
Slovenia
Australia, Japan, Republic of Korea
Belgium, Czech Republic, Denmark,Finland, France, Germany, Greece, Ireland, Netherlands, Norway,Portugal, Spain, Sweden,Switzerland, United Kingdom,United States
Factor-Driven Efficiency-Driven Innovation-Driven
Advanced economies have a relatively sophisticated foundation of basic requirements and efficiency enhancers. While these factorsare essential in sustaining necessity-based entrepreneurship, they may be insufficient drivers of opportunity-based behavior. Here,knowledge is prevalent but labor is expensive. Entrepreneurship-specific framework conditions become the levers that drive dynamic,innovation-oriented behavior, while the foundation of basic requirements and efficiency enhancers needs to be maintained.
1.3 Entrepreneurship in Pakistan: Challenges and Opportunities
Historically, entrepreneurship in the sense of its modern definition7 has remained very limited in Pakistan. The development ofsmall-scale industrial sector measured through new firm entry rate, if taken as proxy to reflect entrepreneurial activity in Pakistan,show the average annual firm entry rate in Pakistan lower than most regional averages around the world8. There is, however, anote of caution here that a large number of new firm entries remain unregistered in Pakistan's significant small scale informalbusiness sector. The Small and Medium Enterprise Development Authority (SMEDA) estimates that in Pakistan, small and mediumenterprises (SMEs) with less than 100 employees constitute nearly 90% of all 3.5 million private firms that employ 80% of thenon-agricultural labor force; and their share in the annual GDP is 40%9. Their firm structure is dominated by sole proprietorshipand most are family run businesses with no culture of taking it to the pubic (IPOs).
A review of the past 6 decades of Pakistan's development priorities reveals that entrepreneurship has never been the focus ofeconomic development planners. All these years of government efforts clearly show a bias towards large scale industry and neglectof the small. The historical evidence clearly indicates that, in the context of Pakistan, when one talks about industrialization, formost people it implies large plants and factories run by machines and employing a large number of workers. It definitely comesas a surprise to people when they discover the reality; that it is actually the informal sector and the small scale sector that dominatesthe industrial landscape of Pakistan which have been continuously ignored in the national economic policies.
Figure 3: The GEM Model
From otheravailablesources
Social, CulturalPolitical Context
Basic requirements
- Institutions- Infrastructure- Macroeconomics stability- Health and primary education
Efficiency Enhancers
- Higher education training- Goods market efficiency- Labor market efficiency- Financial Market sophistication- Technological readiness- Market size
Innovation andentrepreneurship
- Entrepreneurship finance- Government policy- Government entrepreneurship programs- Entrepreneurship education- R&D transfer- Internal market openness- Physical infrastructure for entrepreneurship- Commercial, legal infrastructure for entrepreneurship- Cultural and social norms
Attitudes:Perceived opportunities &capabilities, Fear of Failure:Status of entrepreneurship
Activity:Oportunity/Necessity-driven,Early-stage; Inclusiveness;Industry; Exits
Aspirations:Growth, InnovationInternational orientationSocial value creation
Entrepreneurship Profile
From GEM Adult Populationsurveys (APS)
Established FirmsEmployeeEntrepreneurialActivity
Socio-EconomicDevelopment
(Jobs,Innovatoin,Social value)
From GEM National Expertsurveys (NES)
10
From GEM2011 AdultPopulationSurvey (ASP)
11
As stated above, generally, the development of small-scale sector reflected the characteristics of entrepreneurship however thissector had largely grown up as an informal sector. The informal small scale sector has dominated employment in the construction,wholesale, retail trading, hotels, transport, communications and storage industries in urban areas. Some of the issues faced by thesmall and medium size firms located in different SME clusters in Pakistan are reported as follows10.
● Small businesses face a complex legal, tax and administrative environment in Pakistan therefore most firms avoided theeconomic obligations associated with the registered status.
● Entrepreneurs generally are not tuned to conducting R&D as they believed that the high cost of production and narrowmargins did not give them the leverage to go for R&D. Major rationale behind the high cost included high utility prices andminimum wage fixed by government. Another reason of lack of focus on R&D was the nature of industry, which was skillbased (imitation) rather than the knowledge based. Nevertheless, research was being undertaken to explore new markets basedon personal visits of entrepreneurs either privately or in some cases in groups sent out by the government organizations topromote trade.
● The small businessman, by and large, expected from the government to provide incentives and subsidies, given the rent-seeking culture that has now been established, businessmen, instead of focusing on their own innovation, expected help fromthe government most of the times.
● Businesses remained largely owner-operated and resistant to developing professionalmanagement, as the business growth was traditionally dependent on policy favors rather than on professional managementand strategy. Moreover, in clusters, there was no expertise for providing practical advice on key areas such as project feasibility,business operations, brand establishment and marketing. Given the lack of market depth, input from research institutions,universities and other forms of specialized knowledge, knowledge spillovers remained narrow and imitative.
● Scarcity of skilled labor was considered a major constraint for the development of entrepreneurship. Like all less resourcefulfirms, the SMEs typically had skill deficiencies and were unable to compete with larger firms' better-qualified manpower.Inter-firm transfer of skilled labor was a usual phenomenon directly influenced by relative wage levels. In this game, the largerfirms had advantage over SMEs. Unfortunately, the technical skills were not adequately rewarded by the employers. Eventhe society never respected people having blue-collared jobs.
● Over and above, lack of trust among the business community was a serious hindrance to growth, impeded cooperation amongentrepreneurs to develop the existing or explore the new markets. The entrepreneurs in their attempts to hide businessinformation used to maintain mailing address and banks in other cities. Another serious complaint was that the labor trainedby one employer, either moved to another employer or opened up his own firm. Businesses remained owner-operated owingto lack of trust on professional employees within the business community as an employee who gained knowledge easilyreplicated with stolen business information.
● Small businessmen had little recourse to bank financing. They believed that the banks lent only to the big borrowers for non-commercial and political reasons. The biggest stumbling block was the State Bank of Pakistan's Prudential Regulations anddocumentation requirements, which most SMEs were unable to meet. Cut-throat competition, willing to go for the solo flight,lack of attitude towards delegation, lack of corporate culture, lack of knowledge/proper homework and lack of relevantbusiness development systems provision in the industry had knocked down the SMEs in Pakistan.
However, in recent years, with the increasing realization of entrepreneurship and innovation as engines of economic growth, therehad been a rise in interest in Pakistan to review the country's economic policies by placing emphasis on entrepreneurial growth11.Given the nation's socio-economic challenges and perceived untapped potential, a more heightened realization has resulted in theadoption of a New Growth Framework by the National Economic Council in May 201112. Barring the forces of status-quo andvested interests of the elite groups which make up the distributional coalition and is content on their rent seeking behavior in theform of subsidies, protectionism and tax evasion, entrepreneurship offers an attractive opportunity driven merit-based option whichis known to serve as equalizer in socio-economic development13. More recently, to operationalize this New Growth Framework,some studies have proposed the use of Expeditionary Economics14 to focus on the nuts-and-bolts implementation of these newentrepreneurially-led economic growth principles in Pakistan's post-conflict settings. It has been noted that while poor infrastructureand weak governance are significant barriers, the nation has the making of a large and dynamic entrepreneurial class with thepotential of facilitating country's rise into the next levels of national economic groups15 .
Despite the challenges, the two key potential areas of opportunity where entrepreneurship can make significant contributions are:First, more than 2/3rd of Pakistan's population is concentrated below the age of 30, which will change the age structure of workingage population over the next few years. Majority of the youth entering the labor force over the next two decades will have littleeducation and skills catering to market demand. Moreover, incessant shocks to the economy such as energy crisis, internationalcommodity price shocks, security issues, and flash floods of 2010/11 have left little resilience in the economy and absorptioncapacity for growing youth labor force. This required a rethinking about the sources of growth in Pakistan's context andentrepreneurship has the greatest potential to fill this gap.
Second, in the area of indigenous technology transfer, various researchers have underscored the need for establishing industry-university linkages. According to some estimates16 in eight years, between 1999 and 2007, Pakistan had increased R&D investmentby 600% which stood at 0.7% of GDP or USD 1.176 billion. At the same time number of researchers in Pakistan has grown from187 per million in 2005 to 310 in 2007. Though Pakistan suffered significant economic challenges in the following years17, thereis still considerable R&D capacity in the nation's universities and institutions, particularly in the science and technology focusedprograms18. This new capacity can be converted into new innovative entrepreneurship opportunities, economic growth and wealthcreation by linking it with better trained young entrepreneurial minds.
The above scenario leads us to believe that the country's underdeveloped small business and entrepreneurial sector which is facingnumerous economic challenges, can benefit from the available manpower resource opportunity if mobilized through anentrepreneurially oriented innovative development approach envisaged in the new entrepreneurially-led economic growth approach19,which is also the ultimate aim envisaged by the GEM project.

12
2.1 Overview of the Research Results
In this cycle Pakistan shows a mix increase and decrease in many entrepreneurship activity indicators. The people of Pakistanperceive more opportunities in the surrounding environment and perceive to have more capabilities than many of its peer countries.The fear of failure is 31% which is a bit higher than the last year but still lower than average of the factor driven countries. TheTEA rate is 9.1, the same as that of last year. Nascent entrepreneurship rate has gone up from 6.6 to 7.5. Necessity driven TEArate has gone up from 3.69 to 4.3 indicating that people are being forced into necessity entrepreneurship. There is a decline innew business manager rate from 2.70 to 1.7 and established business owner rate from 4.72 to 4.1.
Chapter 2: Findings of GEM Pakistan 2011
Some general characteristics and entrepreneurship indicators of Pakistan are presented in Table 2a, Fig 4 and Fig 5
Table 2a: Some general characteristics and entrepreneurship indicators of Pakistan
Fig 4: Entrepreneurial Profile of Pakistan compared with other nations
EntrepreneurialEmployee Acitivity (EEA)
TEA: Solo & Low JobExpection (SLEA)
TEA: Medium-High JobExpection (MHEA)
Percieved Capabilites
Eerly-StageEntrepreneurial Activity
(TEA)
TEA: Necessity-Driven
Percieved Opportunities
Pakistan
Factor-Driven Economies
Group: High non-ambitiousentrepreneurship (SLEA) only
1.51
0.50
-0.5-1
-1.5
13
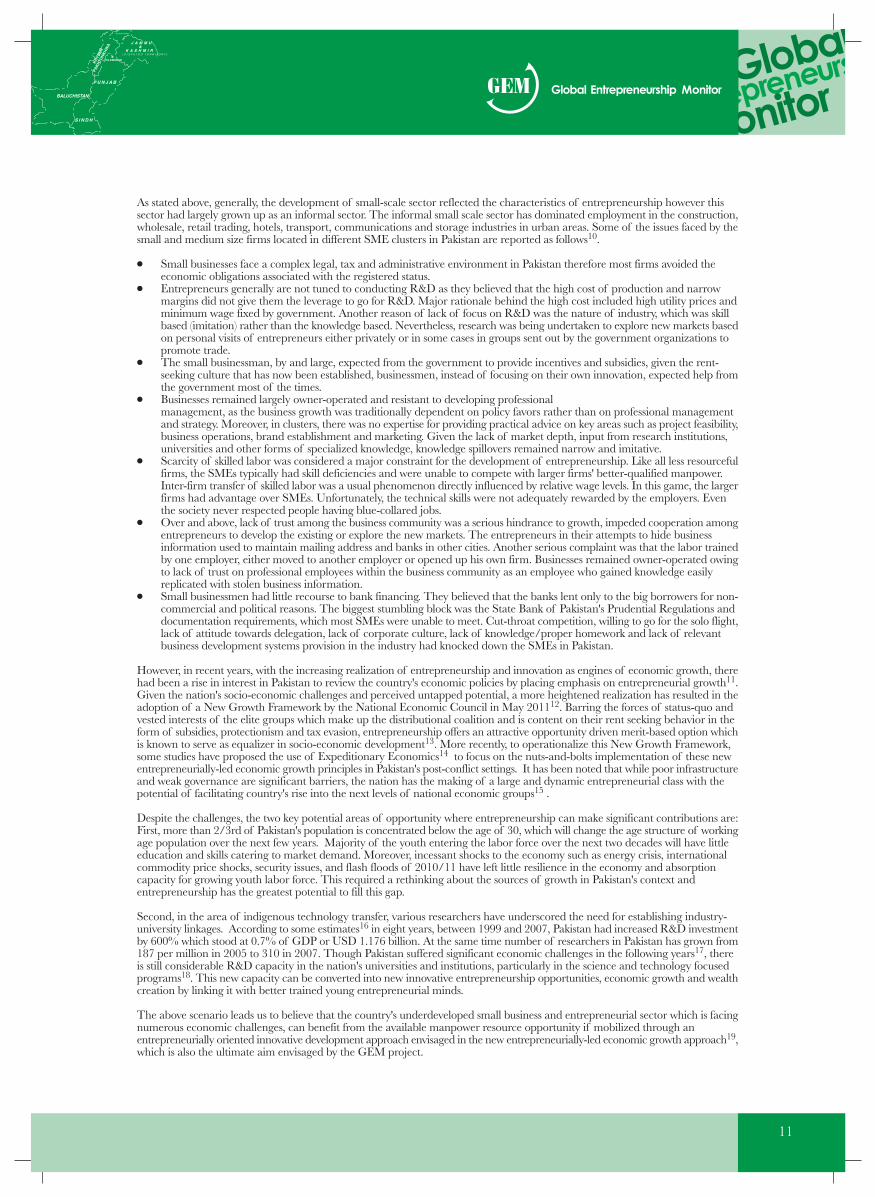
Note: Medium-High Job Expectation TEA and Solow & Low Job Expectation TEA are based on GEM 2009-2011 APS data,all other indicators based on GEM 2011 APS data. Values of group level indicators are based on averaging the country-level Z-scores (standardized values obtained from the entire GEM 2011 sample).
Note: Based on GEM 2011 NES data. Values of group level indicators are based on averaging the country-level Z-scores(standardized values obtained from the entire GEM 2011 sample).
Pakistan has been improving its entrepreneurship ecosystem in the last few years with several policies and programs that are helpingnew business creation activities. At the same time the country lags in terms of government programs and national policy regulationin comparison to other similar economies. Cultural and social support to entrepreneurship activities have enhanced in the pastfew years. Pakistan stands pretty good in terms of internal market openness and professional and commercial support systems.
Fig 6: Sector Structure Total early-stage Entrepreneurial Activity (TEA) and Established Business Activity
Most of the early stage TEA in Pakistan is in the consumer oriented services followed by transforming and extractive sector. Theearly stage established business activity is the highest in the extractive sector followed by consumer and the transforming sector.
Table 2b: Comparison of various entrepreneurial characteristics and framework conditions of Pakistan with its Peer Nations, 2011
9.17.51.746.9%1 to 4.543 %35%23%74%
9.35.34.036.5%n.a.60%43%42%80%
12.87.17.127.3%1 to 3.724%72%25%73%
14.510.83.953%n.a.46%33%30%61%
Iran
11.96.36.031.6%1 to 2.242%22%9%NA
4.92.52.510.2%n.a.31%30%9%52%
Entrepreneurial Characteristic
PAKISTAN Algeria Bangladesh Turkey Malaysia
TEA RateNascent Entrepreneurship rateNew Business Ownership rateNecessity driven EntrepreneurshipFemale to male TEA ratioPerceived capability to carry out EntrepreneurshipFear of failureEntrepreneurial IntentionsEntrepreneurship as a good career choice
44
21
31
4
Extractive Sector
Transforming Sector
Business OrientedServices
Consumer OrientedServices
26
53
20
1
Extractive Sector
Transforming Sector
Business OrientedServices
Consumer OrientedServices
Fig 5: Entrepreneurship Institution Profile of Pakistan with other nations
Finance &Entrepreneurship
PakistanFactor-Driven Economies
EntrepreneurshipEducation: Post
School
EntrepreneurshipEducation:
Primary/Secondary
GovernmentPrograms
National Policy-Regulation
EntrepreneurshipPolicies-General
High non-amitious entrepreneurship (SLEA) only
1.501.000.500.00
-0.50-1.00-1.50
R&D Transfer
PakistanFactor-Driven EconomiesHigh non-amitious entrepreneurship (SLEA) only
1.501.000.500.00
-0.50-1.00-1.50
Cultural Support forEntrepreneurship
PhysicalInfrastructure
Internet Market-Openness
Internal Market-Dynamics
Prefessional &Commercial
14
The predominant motive for pursuing entrepreneurial activity (TEA) in the country is to increase income (38.0 percent) and to amuch lesser degree (2.8 percent) acquire independence. The growth expectations are a modest 3.5 percent.
Of the entrepreneurs (TEA), 75 percent find it more difficult to start a business and 80 percent report more difficult (or about thesame) to grow it, with 56 percent pointing towards less business opportunities, compared to a year ago. Similarly, of the establishedbusinesses 64 percent find it more difficult to start and 83 percent report that it is more difficult (or about the same) to growbusinesses, with 49 percent saying there are less business opportunities, than a year ago.
In terms of entrepreneurial environment manifested in the framework conditions prevailing in Pakistan, the commercial andphysical infrastructure and the internal market dynamics were described as adequate, while the national policy towards entrepreneurshipand related support programs including education were considered weak by the national experts. Overall, new firm start-up aswell as established business growth activity and related opportunities have been severely curtailed during the past several years dueto the on-going 'war on terrorism' in the north western region of Pakistan bordering Afghanistan and the resulting precarioussecurity situation in the rest of the country. The economic situation worsened further due to natural calamities including a majorearth quake and recent widespread floods. In this scenario a precise impact of global financial crisis in light of these nationalcatastrophic events is hard to discern. A comparative review of Pakistan Entrepreneurial Characteristics with its several peernations is table above.
2.1 Entrepreneurial attitudes According to GEM, entrepreneurial attitudes convey the feelings of a population grouptowards entrepreneurship in general. People who recognize the importance of entrepreneurship as it relates to the ability ofindividuals to deploy their competencies in order to exploit opportunities given a favorable or not so favorable environmenttend to formulate certain views about entrepreneurship which are manifested in their attitudes towards this phenomenon. Forthis purpose GEM employs specific questions in the Adult Population Survey (APS) that measure these attitudes through variousindicators.
More importantly, the difference in entrepreneurial activity rates between countries can be explained by differences in attitudesof the population towards entrepreneurship. Table 3 provides the attitudinal estimates for all participating countries in the adultworking age (18-64) population who are not entrepreneurially active . The percentage of the responding adults in eachparticipating country including Pakistan, who expressed an opinion and agreed with the four key indicators, is listed in theTable. The countries are divided into three groups i.e., innovation driven, efficiency driven and factor driven economies withthe following salient findings.
● In the innovation driven countries, the proportion of the non entrepreneurial working age population who are aware of newentrepreneurial startups is the highest in Finland and France. The highest perception of good startup opportunities in thenext six months is in Sweden and Norway. The skill, knowledge and experience perception is highest in the UAE followedby US. The people of Switzerland and Finland have the lowest fear of failure.
● In the efficiency driven countries, the proportion of the non entrepreneurial working age population who are aware of newentrepreneurial startups is the highest in China, who perceive good startup opportunities in the next six months are in Colombiaand Peru and the skill, knowledge and experience perception is the highest in Peru. The South African people have the lowestfear of failure.
● In the factor driven countries, the proportion of the non entrepreneurial working age population who are aware of newentrepreneurial startups and the skill, knowledge and experience perception is the highest in south American countries ofGuatemala and Venezuela. Surprisingly Bangladesh scored highest on the perception of good startup opportunities in thenext six months. The Venezuelan people have the lowest fear of failure.
Overall, respondents from factor-driven economies generally rated their entrepreneurial attitudes more positively followed byefficiency driven economies and innovation-driven economies respectively.
There was a less participation of the factor driven countries in the GEM 2011 cycle. Comparisons within the 5 factor driveneconomies show that Pakistan's adult population attitude measures are less positive than the group averages in the first twoindicators. However Pakistan scores higher than the average in the last two indicators.
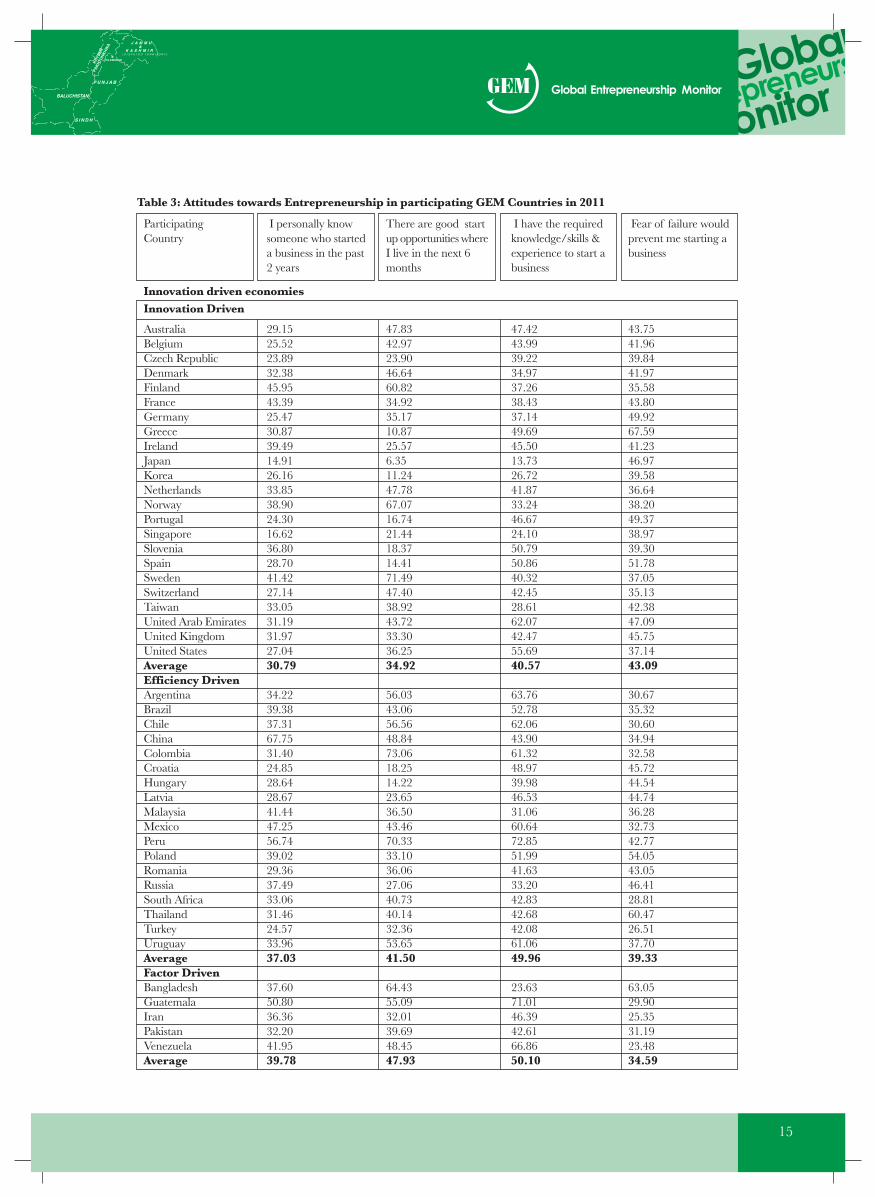
Table 3: Attitudes towards Entrepreneurship in participating GEM Countries in 2011
15
Innovation driven economies
AustraliaBelgiumCzech RepublicDenmarkFinlandFranceGermanyGreeceIrelandJapanKoreaNetherlandsNorwayPortugalSingaporeSloveniaSpainSwedenSwitzerlandTaiwanUnited Arab EmiratesUnited KingdomUnited StatesAverageEfficiency DrivenArgentinaBrazilChileChinaColombiaCroatiaHungaryLatviaMalaysiaMexicoPeruPolandRomaniaRussiaSouth AfricaThailandTurkeyUruguayAverageFactor DrivenBangladeshGuatemalaIranPakistanVenezuelaAverage
29.1525.5223.8932.3845.9543.3925.4730.8739.4914.9126.1633.8538.9024.3016.6236.8028.7041.4227.1433.0531.1931.9727.0430.79
34.2239.3837.3167.7531.4024.8528.6428.6741.4447.2556.7439.0229.3637.4933.0631.4624.5733.9637.03
37.6050.8036.3632.2041.9539.78
47.8342.9723.9046.6460.8234.9235.1710.8725.576.3511.2447.7867.0716.7421.4418.3714.4171.4947.4038.9243.7233.3036.2534.92
56.0343.0656.5648.8473.0618.2514.2223.6536.5043.4670.3333.1036.0627.0640.7340.1432.3653.6541.50
64.4355.0932.0139.6948.4547.93
47.4243.9939.2234.9737.2638.4337.1449.6945.5013.7326.7241.8733.2446.6724.1050.7950.8640.3242.4528.6162.0742.4755.6940.57
63.7652.7862.0643.9061.3248.9739.9846.5331.0660.6472.8551.9941.6333.2042.8342.6842.0861.0649.96
23.6371.0146.3942.6166.8650.10
43.7541.9639.8441.9735.5843.8049.9267.5941.2346.9739.5836.6438.2049.3738.9739.3051.7837.0535.1342.3847.0945.7537.1443.09
30.6735.3230.6034.9432.5845.7244.5444.7436.2832.7342.7754.0543.0546.4128.8160.4726.5137.7039.33
63.0529.9025.3531.1923.4834.59
Innovation Driven
ParticipatingCountry
I personally knowsomeone who starteda business in the past2 years
There are good startup opportunities whereI live in the next 6months
I have the requiredknowledge/skills &experience to start abusiness
Fear of failure wouldprevent me starting abusiness

16
Entrepreneurial Attitudes in Pakistan
Table 4 shows estimates of the prevalence of attitudes towards entrepreneurship in Pakistan among the non-entrepreneuriallyactive working age population by gender. Those successful at starting a new business have a high level of status and respect insociety and most people consider starting a new business a good career choice. The Table shows that males tend to have morepositive entrepreneurial attitude than females. The gap is particularly marked between the variables as follows.
● The male respondents are about three times more aware of someone who has started a business in the last two years, a proxymeasure of networking with entrepreneurial individuals
● The male respondents perceive a higher number of startup opportunities and feel better equipped with the knowledge, skilland experience to start a new business.
● The female respondents have less fear of failure to start a business and moreover they are more aware of stories about peoplestarting successful new businesses in the media.
Table 4: Entrepreneurial Attitude in Pakistan: Respondents expressing the opinion and agreeing with thestatement
Statement
I personally knowsomeone personallywho started a businessin the past 2 years.
There will be goodstartup opportunitieswhere I live in the nextsix months.
I have the knowledge,skill and experience tostart a new business.
Fear of failure wouldprevent me fromstarting a business.
Most people in mycountry would preferthat everyone had asimilar standard ofliving
Most people considerstarting a new businessa good career choice.
Those successful atstarting a new businesshave a high level ofstatus and respect insociety.
You will often seestories about peoplestarting successful newbusinesses in themedia.
All
30.9%
39.4%
42.8%
34.6%
68.6%
73.0%
71.9%
48.4%
Male
45.9%
49.4%
55.5%
42.7%
70.0%
76.0%
75.2%
48.3%
Female
16.0%
29.0%
29.8%
25.7%
67.2%
69.7%
68.4%
48.5%

Entrepreneurial attitudes of the non-entrepreneurially active working age population in various provinces of Pakistan are presentedin table 5.
The key findings are as follows.
● The people of Sindh and Baluchistan were more likely to agree with the statement “I personally know someone who hasstarted a business in the last two years” which is a proxy for networking with entrepreneurs.
● Moreover the people of Sindh and Baluchistan had the highest proportion of the non-entrepreneurially active populationreporting that there were good start-up opportunities in their local area in the next six months.
● The people of Sindh and Punjab were the most likely to agree with statement that “I have the knowledge, skill and experiencerequired to start a new business”.
● The people of Khyber Pakhtoon Khowa had the lowest fear of failure to start a business.
Table 5 A: Perceptions of entrepreneurship among non-entrepreneurially active working age population towards entrepreneurshipin various provinces of Pakistan
17
Sindh
Punjab
Baluchistan
Khyber PakhtoonKhowa
Province
38.9%
27.1%
42.2%
27.4%
I personally knowsomeone who hasstarted a business inthe last two years
42.2%
38.0%
56.6%
33.8%
There will be goodstartup opportunitieswhere I live in the next6 months
44.0%
44.1%
41.6%
35.5%
I have the knowledge,skill and experiencerequired to start a newbusiness
43.6%
32.9%
29.6%
24.4%
Fear of failure wouldprevent me fromstarting a business
Table 5 B: Perceptions of entrepreneurship among non-entrepreneurially active working age population towards entrepreneurshipin various provinces of Pakistan
Sindh
Punjab
Baluchistan
Khyber PakhtoonKhowa
Province
81.1%
62.0%
67.4%
71.4%
I personally knowsomeone who hasstarted a business inthe last two years
68.6%
69.2%
86.4%
92.8%
There will be goodstartup opportunitieswhere I live in the next6 months
71.8%
67.3%
85.1%
86.2%
I have the knowledge,skill and experiencerequired to start a newbusiness
53.0%
46.1%
47.4%
49.4%
Fear of failure wouldprevent me fromstarting a business
18
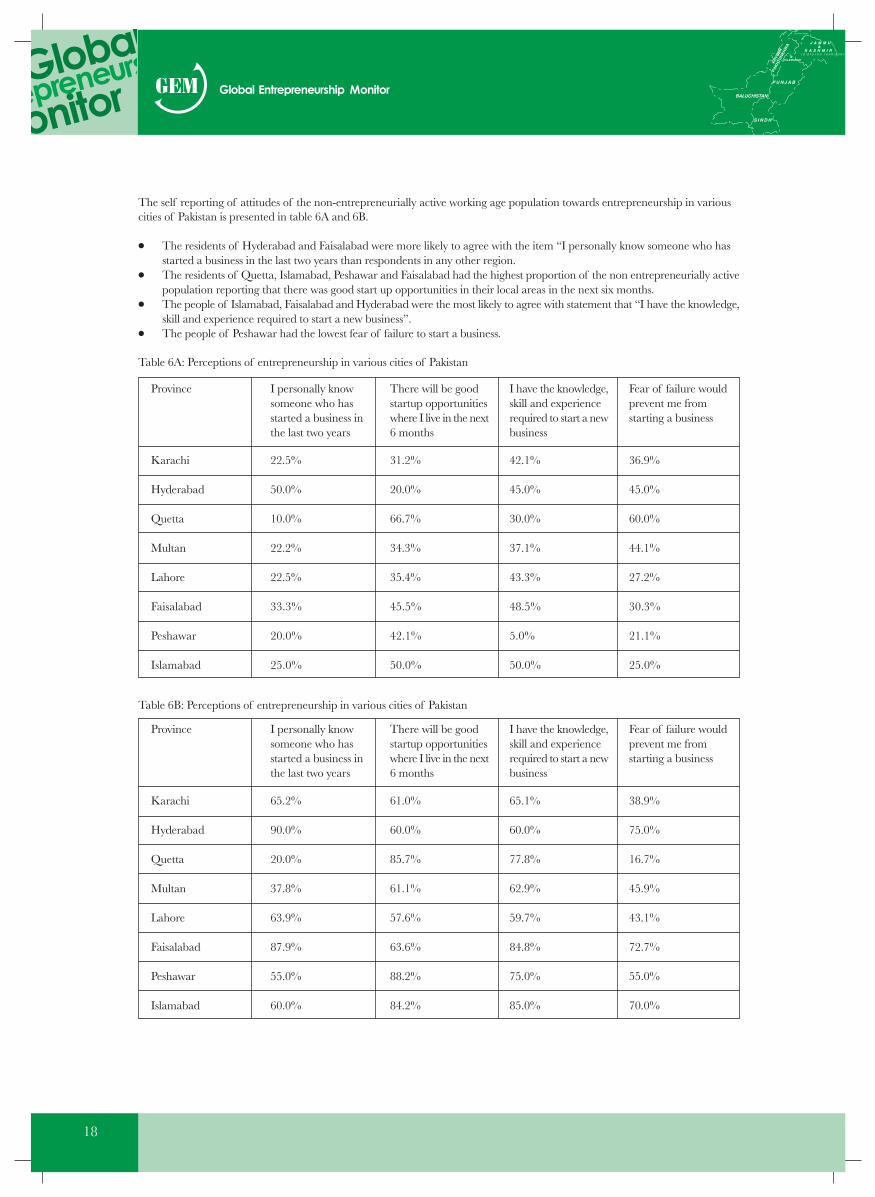
The self reporting of attitudes of the non-entrepreneurially active working age population towards entrepreneurship in variouscities of Pakistan is presented in table 6A and 6B.
● The residents of Hyderabad and Faisalabad were more likely to agree with the item “I personally know someone who hasstarted a business in the last two years than respondents in any other region.
● The residents of Quetta, Islamabad, Peshawar and Faisalabad had the highest proportion of the non entrepreneurially activepopulation reporting that there was good start up opportunities in their local areas in the next six months.
● The people of Islamabad, Faisalabad and Hyderabad were the most likely to agree with statement that “I have the knowledge,skill and experience required to start a new business”.
● The people of Peshawar had the lowest fear of failure to start a business.
Table 6A: Perceptions of entrepreneurship in various cities of Pakistan
Karachi
Hyderabad
Quetta
Multan
Lahore
Faisalabad
Peshawar
Islamabad
Province
22.5%
50.0%
10.0%
22.2%
22.5%
33.3%
20.0%
25.0%
I personally knowsomeone who hasstarted a business inthe last two years
31.2%
20.0%
66.7%
34.3%
35.4%
45.5%
42.1%
50.0%
There will be goodstartup opportunitieswhere I live in the next6 months
42.1%
45.0%
30.0%
37.1%
43.3%
48.5%
5.0%
50.0%
I have the knowledge,skill and experiencerequired to start a newbusiness
36.9%
45.0%
60.0%
44.1%
27.2%
30.3%
21.1%
25.0%
Fear of failure wouldprevent me fromstarting a business
Table 6B: Perceptions of entrepreneurship in various cities of Pakistan
Karachi
Hyderabad
Quetta
Multan
Lahore
Faisalabad
Peshawar
Islamabad
Province
65.2%
90.0%
20.0%
37.8%
63.9%
87.9%
55.0%
60.0%
I personally knowsomeone who hasstarted a business inthe last two years
61.0%
60.0%
85.7%
61.1%
57.6%
63.6%
88.2%
84.2%
There will be goodstartup opportunitieswhere I live in the next6 months
65.1%
60.0%
77.8%
62.9%
59.7%
84.8%
75.0%
85.0%
I have the knowledge,skill and experiencerequired to start a newbusiness
38.9%
75.0%
16.7%
45.9%
43.1%
72.7%
55.0%
70.0%
Fear of failure wouldprevent me fromstarting a business
19
Table 6B reports that the people living in Hyderabad and Faisalabad prefer an egalitarian standard of living for all followed byKarachi and Islamabad. The residents of Peshawar, Islamabad and Quetta gave the highest ratings to starting a new business adesirable career choice. The people of Islamabad, Faisalabad and Quetta have the highest perception that those successful atstarting a new business have a high level of status and respect in society. Moreover Hyderabad, Faisalabad and Islamabad havethe highest number of people reporting that they have seen stories about people starting successful businesses in the media.
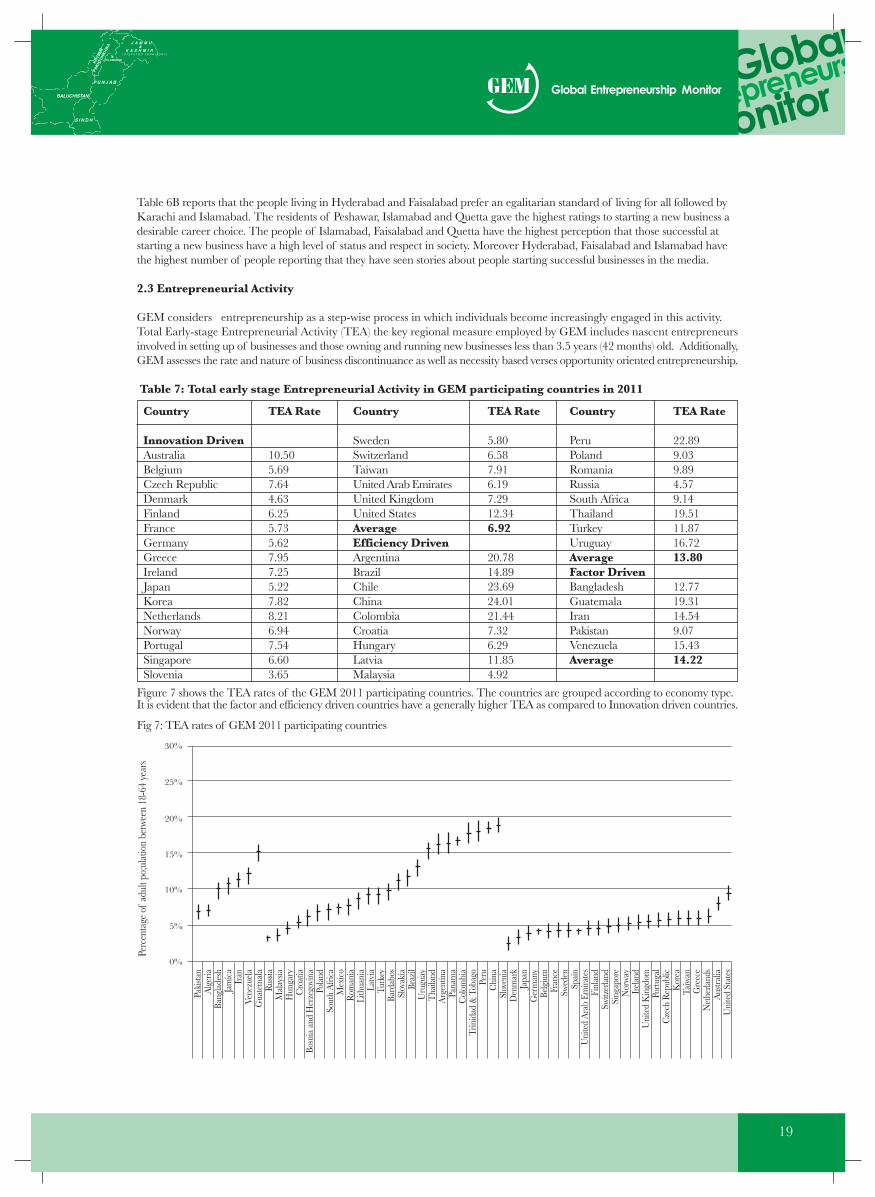
2.3 Entrepreneurial Activity
GEM considers entrepreneurship as a step-wise process in which individuals become increasingly engaged in this activity.Total Early-stage Entrepreneurial Activity (TEA) the key regional measure employed by GEM includes nascent entrepreneursinvolved in setting up of businesses and those owning and running new businesses less than 3.5 years (42 months) old. Additionally,GEM assesses the rate and nature of business discontinuance as well as necessity based verses opportunity oriented entrepreneurship.
Table 7: Total early stage Entrepreneurial Activity in GEM participating countries in 2011
Country
Innovation DrivenAustraliaBelgiumCzech RepublicDenmarkFinlandFranceGermanyGreeceIrelandJapanKoreaNetherlandsNorwayPortugalSingaporeSlovenia
TEA Rate
10.505.697.644.636.255.735.627.957.255.227.828.216.947.546.603.65
Country
SwedenSwitzerlandTaiwanUnited Arab EmiratesUnited KingdomUnited StatesAverageEfficiency DrivenArgentinaBrazilChileChinaColombiaCroatiaHungaryLatviaMalaysia
TEA Rate
5.806.587.916.197.2912.346.92
20.7814.8923.6924.0121.447.326.2911.854.92
Country
PeruPolandRomaniaRussiaSouth AfricaThailandTurkeyUruguayAverageFactor DrivenBangladeshGuatemalaIranPakistanVenezuelaAverage
TEA Rate
22.899.039.894.579.1419.5111.8716.7213.80
12.7719.3114.549.0715.4314.22
Figure 7 shows the TEA rates of the GEM 2011 participating countries. The countries are grouped according to economy type.It is evident that the factor and efficiency driven countries have a generally higher TEA as compared to Innovation driven countries.
Fig 7: TEA rates of GEM 2011 participating countries
Paki
stan
Alg
eria
Bang
lade
shJa
mic
aIr
anVe
nezu
ela
Gua
tem
ala
Rus
siaM
alay
siaH
unga
ryC
roat
iaBo
snia
and
Her
zego
vina
Pola
ndSo
uth
Afri
caM
exic
oR
oman
iaLi
thua
nia
Latv
iaTu
rkey
Bard
abos
Slov
akia
Braz
ilU
rugu
ayT
haila
ndA
rgen
tina
Pana
ma
Col
ombi
a
Peru
Chi
naSl
oven
ia
Japa
nG
erm
any
Belg
ium
Fran
ceSw
eden
Spai
nU
nite
d A
rab
Emira
tes
Finl
and
Switz
erla
ndSi
ngap
ore
Nor
way
Irel
and
Cze
ch R
epub
licK
orea
Taiw
anG
reec
eN
ethe
rland
sAu
stral
iaU
nite
d St
ates
Trin
idad
& T
obag
o
Den
mar
k
Uni
ted
Kin
gdom
Portu
gal
30%
25%
20%
15%
10%
5%
0%
Perc
enta
ge o
f adu
lt po
;ula
tion
betw
een
18-6
4 ye
ars
20
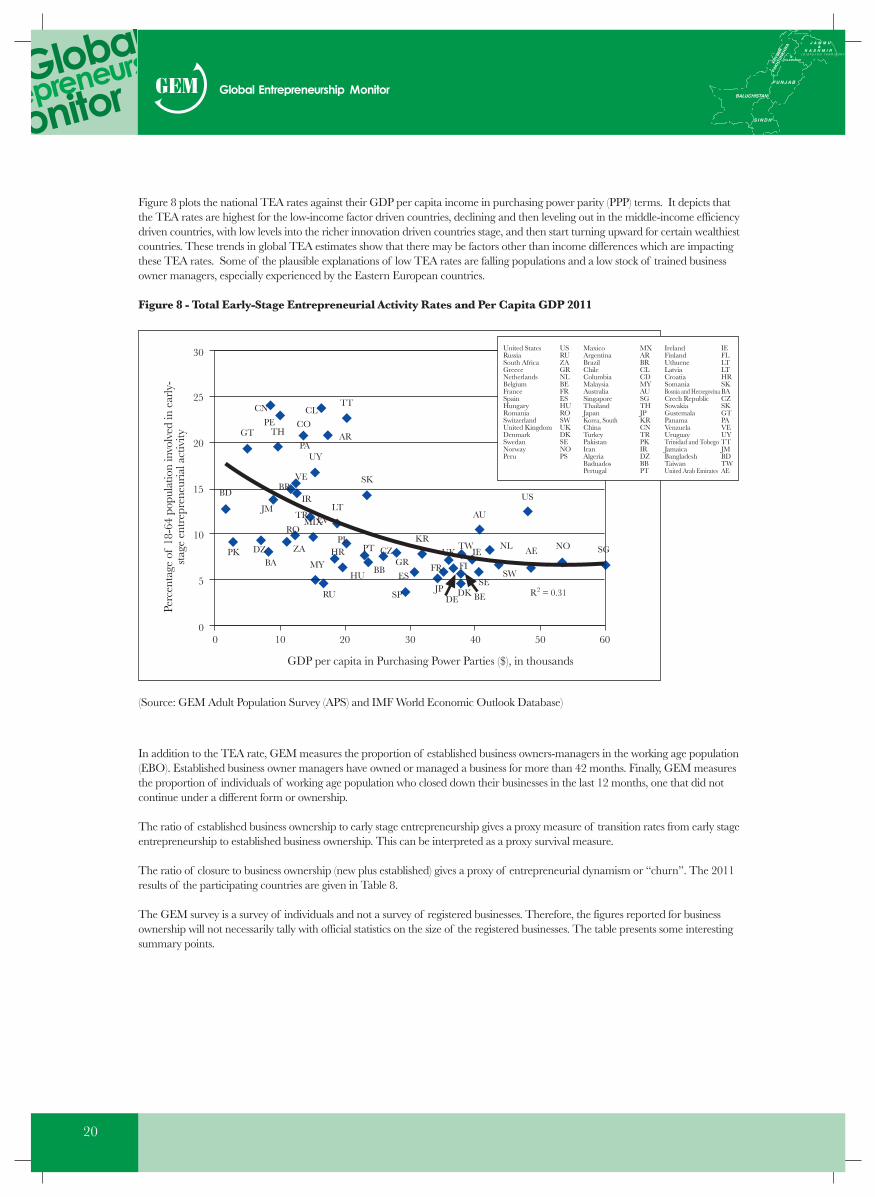
Figure 8 plots the national TEA rates against their GDP per capita income in purchasing power parity (PPP) terms. It depicts thatthe TEA rates are highest for the low-income factor driven countries, declining and then leveling out in the middle-income efficiencydriven countries, with low levels into the richer innovation driven countries stage, and then start turning upward for certain wealthiestcountries. These trends in global TEA estimates show that there may be factors other than income differences which are impactingthese TEA rates. Some of the plausible explanations of low TEA rates are falling populations and a low stock of trained businessowner managers, especially experienced by the Eastern European countries.
Figure 8 - Total Early-Stage Entrepreneurial Activity Rates and Per Capita GDP 2011
(Source: GEM Adult Population Survey (APS) and IMF World Economic Outlook Database)
CN CLTT
PEGT TH
COAR
PAUY
VEBR
IRLT
SKBD
JMMIX
TR LVRO
DZPKBA
ZAPL
HRMY
RU
HU
PT CZ
BBGR
KR
ES
SP
FR
UKTW
AU
US
IE
FI
JPDE
DK BE
SESW
NL AE NO SG
R2 = 0.31
GDP per capita in Purchasing Power Parties ($), in thousands
Perc
enta
ge o
f 18
-64
popu
latio
n in
volv
ed in
ear
ly-
stag
e en
trep
rene
uria
l act
ivity
30
25
20
15
10
5
00 10 20 30 40 50 60
United States USRussia RUSouth Africa ZAGreece GRNetherlands NLBelgium BEFrance FRSpain ESHungary HURomania ROSwitzerland SWUnited Kingdom UKDenmark DKSwedan SENorway NOPeru PS
Maxico MXArgentina ARBrazil BRChile CLColumbia CDMalaysia MYAustralia AUSingapore SGThailand THJapan JPKorea, South KRChina CNTurkey TRPakistan PKIran IRAlgeria DZBaduados BBPertugal PT
Ireland IEFinland FLUthuene LTLatvia LTCroatia HRSomania SKBosnia and Herzegovina BACrech Republic CZSowakia SKGustemala GTPanama PAVenzuela VEUruguay UYTrinidad and Tobego TTJamaica JMBangladesh BDTaiwan TWUnited Arab Emirates AE
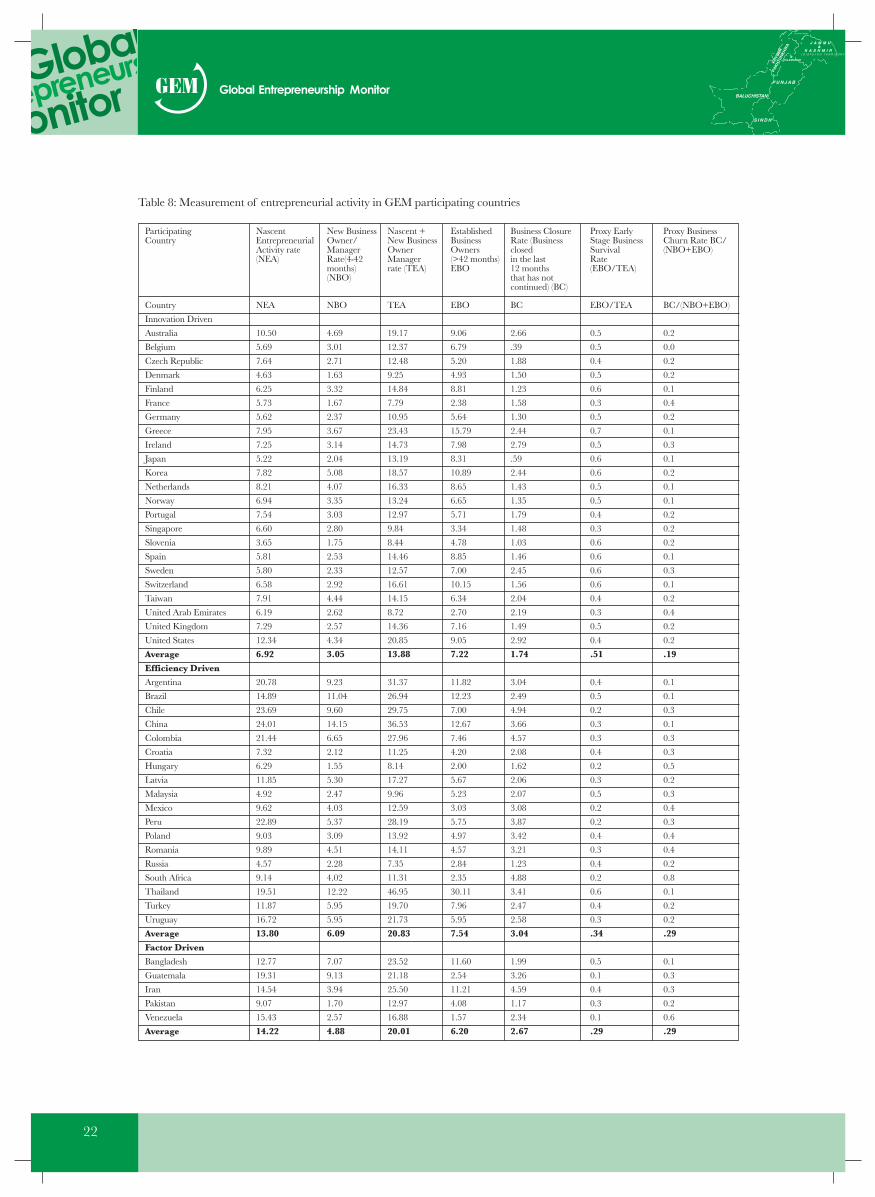
In addition to the TEA rate, GEM measures the proportion of established business owners-managers in the working age population(EBO). Established business owner managers have owned or managed a business for more than 42 months. Finally, GEM measuresthe proportion of individuals of working age population who closed down their businesses in the last 12 months, one that did notcontinue under a different form or ownership.
The ratio of established business ownership to early stage entrepreneurship gives a proxy measure of transition rates from early stageentrepreneurship to established business ownership. This can be interpreted as a proxy survival measure.
The ratio of closure to business ownership (new plus established) gives a proxy of entrepreneurial dynamism or “churn”. The 2011results of the participating countries are given in Table 8.
The GEM survey is a survey of individuals and not a survey of registered businesses. Therefore, the figures reported for businessownership will not necessarily tally with official statistics on the size of the registered businesses. The table presents some interestingsummary points.
21
● Among the innovation driven countries, the nascent entrepreneurial activity (NEA) is the highest in US followed by Australia,Netherland, Taiwan, Greece, Czech and Norway. . Italy, Japan and Portugal have the lowest rate of NEA. The highest totalentrepreneurial activity (TEA) i.e. the sum of nascent entrepreneurship and the new business owner manager rate is reportedto be the highest in Australia followed by Norway, US, Netherland, Ireland and Korea. Slovenia and Denmark reports thelowest level of total entrepreneurial activity. The highest number of established business units (for more than 42 months) isobserved in Greece, Korea and Switzerland. US, Ireland and Australia report the highest number of business closures in thepast 12 months.
● Among the efficiency driven countries, the nascent entrepreneurial activity (NEA) is the highest in the South Americancountries of Peru, Chile, Colombia and Argentina followed by China and Thailand. On the other hand lowest level of NEAis reported in Malaysia and Russia. The highest total entrepreneurial activity (TEA) i.e. the sum of nascent entrepreneurshipand the new business owner manager rate is reported to be the highest in Thailand followed by the South American countriesand in China as well. The highest number of established business units (for more than 42 months) is observed in Thailandand China. Chile, Columbia and South Africa report the highest number of business closures in the past 12 months.
● In the Factor driven countries, the nascent entrepreneurial activity (NEA) is the highest in Guatemala, Venezuela and Iran.The lowest level of NEA is reported in Pakistan. The highest total entrepreneurial activity (TEA) i.e. the sum of nascententrepreneurship and the new business owner manager rate is reported to be the highest in Iran and Bangladesh. The lowestlevel of TEA is observed in Pakistan. The highest number of established business units (for more than 42 months) is observedin Iran and Bangladesh. Guatemala reports the lowest number of established business units.
22
Table 8: Measurement of entrepreneurial activity in GEM participating countries
Country
Innovation Driven
Australia
Belgium
Czech Republic
Denmark
Finland
France
Germany
Greece
Ireland
Japan
Korea
Netherlands
Norway
Portugal
Singapore
Slovenia
Spain
Sweden
Switzerland
Taiwan
United Arab Emirates
United Kingdom
United States
Average
Efficiency Driven
Argentina
Brazil
Chile
China
Colombia
Croatia
Hungary
Latvia
Malaysia
Mexico
Peru
Poland
Romania
Russia
South Africa
Thailand
Turkey
Uruguay
Average
Factor Driven
Bangladesh
Guatemala
Iran
Pakistan
Venezuela
Average
NEA
10.50
5.69
7.64
4.63
6.25
5.73
5.62
7.95
7.25
5.22
7.82
8.21
6.94
7.54
6.60
3.65
5.81
5.80
6.58
7.91
6.19
7.29
12.34
6.92
20.78
14.89
23.69
24.01
21.44
7.32
6.29
11.85
4.92
9.62
22.89
9.03
9.89
4.57
9.14
19.51
11.87
16.72
13.80
12.77
19.31
14.54
9.07
15.43
14.22
NBO
4.69
3.01
2.71
1.63
3.32
1.67
2.37
3.67
3.14
2.04
5.08
4.07
3.35
3.03
2.80
1.75
2.53
2.33
2.92
4.44
2.62
2.57
4.34
3.05
9.23
11.04
9.60
14.15
6.65
2.12
1.55
5.30
2.47
4.03
5.37
3.09
4.51
2.28
4.02
12.22
5.95
5.95
6.09
7.07
9.13
3.94
1.70
2.57
4.88
TEA
19.17
12.37
12.48
9.25
14.84
7.79
10.95
23.43
14.73
13.19
18.57
16.33
13.24
12.97
9.84
8.44
14.46
12.57
16.61
14.15
8.72
14.36
20.85
13.88
31.37
26.94
29.75
36.53
27.96
11.25
8.14
17.27
9.96
12.59
28.19
13.92
14.11
7.35
11.31
46.95
19.70
21.73
20.83
23.52
21.18
25.50
12.97
16.88
20.01
EBO
9.06
6.79
5.20
4.93
8.81
2.38
5.64
15.79
7.98
8.31
10.89
8.65
6.65
5.71
3.34
4.78
8.85
7.00
10.15
6.34
2.70
7.16
9.05
7.22
11.82
12.23
7.00
12.67
7.46
4.20
2.00
5.67
5.23
3.03
5.75
4.97
4.57
2.84
2.35
30.11
7.96
5.95
7.54
11.60
2.54
11.21
4.08
1.57
6.20
ParticipatingCountry
NascentEntrepreneurialActivity rate(NEA)
New BusinessOwner/ManagerRate(4-42months)(NBO)
Nascent +New BusinessOwnerManagerrate (TEA)
EstablishedBusinessOwners(>42 months)EBO
BC
2.66
.39
1.88
1.50
1.23
1.58
1.30
2.44
2.79
.59
2.44
1.43
1.35
1.79
1.48
1.03
1.46
2.45
1.56
2.04
2.19
1.49
2.92
1.74
3.04
2.49
4.94
3.66
4.57
2.08
1.62
2.06
2.07
3.08
3.87
3.42
3.21
1.23
4.88
3.41
2.47
2.58
3.04
1.99
3.26
4.59
1.17
2.34
2.67
Business ClosureRate (Businessclosedin the last12 monthsthat has notcontinued) (BC)
EBO/TEA
0.5
0.5
0.4
0.5
0.6
0.3
0.5
0.7
0.5
0.6
0.6
0.5
0.5
0.4
0.3
0.6
0.6
0.6
0.6
0.4
0.3
0.5
0.4
.51
0.4
0.5
0.2
0.3
0.3
0.4
0.2
0.3
0.5
0.2
0.2
0.4
0.3
0.4
0.2
0.6
0.4
0.3
.34
0.5
0.1
0.4
0.3
0.1
.29
Proxy EarlyStage BusinessSurvivalRate(EBO/TEA)
BC/(NBO+EBO)
0.2
0.0
0.2
0.2
0.1
0.4
0.2
0.1
0.3
0.1
0.2
0.1
0.1
0.2
0.2
0.2
0.1
0.3
0.1
0.2
0.4
0.2
0.2
.19
0.1
0.1
0.3
0.1
0.3
0.3
0.5
0.2
0.3
0.4
0.3
0.4
0.4
0.2
0.8
0.1
0.2
0.2
.29
0.1
0.3
0.3
0.2
0.6
.29
Proxy BusinessChurn Rate BC/(NBO+EBO)

23
Entrepreneurial Activity by Stages in Pakistan
Table 9 illustrates the proportion of respondents by stage of entrepreneurial activity in Pakistan.
In Pakistan 43.4% of working age individuals were not engaged in entrepreneurial activity and had no intention of starting abusiness within the next three years. A further 25.8% expected to start a business in the next three years, but were not activelytrying to start a business or running an existing business. A further 14.1% were nascent entrepreneurs and an additional 16.7%were new business owner/ managers.
Table 9: Proportion of respondents by stage of entrepreneurial activity in Pakistan
Are you, alone or with others, currently the owner of a business you help manage, self-employed, or selling anygoods or services to others?
Are you, alone or with others, currently trying to start a new business, including any self-employment or sellingany goods or services to others?
Are you, alone or with others, expecting to start a new business, including any type of self-employment, withinthe next three years?
No Activity or intention
16.7%
14.1%
25.8%
43.4%
Opportunity and Necessity Based Entrepreneurship Activity
One way of distinguishing between different types of entrepreneurial activity is the extent to which the activity is based on necessity(i.e. there are no better alternatives for work) or opportunity (where entrepreneurs may be exploiting the potential for new marketcreation).
From the GEM 2011 survey both opportunity motivated entrepreneurship rates (Opportunity TEA) and Necessity drivenentrepreneurship rates (Necessity TEA) are presented side by side in Table 10. The Table shows that the levels of necessityentrepreneurship in 2011 are lower than levels of opportunity entrepreneurship in all participating countries except Iran andPakistan.

24
Innovation Driven Economies
AustraliaBelgiumCzech RepublicDenmarkFinlandFranceGermanyGreeceIrelandJapanKoreaNetherlandsNorwayPortugalSingaporeSloveniaSpainSwedenSwitzerlandTaiwanUnited Arab EmiratesUnited KingdomUnited StatesAverageEfficiency Driven EconomiesArgentinaBrazilChileChinaColombiaCroatiaHungaryLatviaMalaysiaMexicoPeruPolandRomaniaRussiaSouth AfricaThailandTurkeyUruguayAverageFactor Driven EconomiesBangladeshGuatemalaIranPakistanVenezuelaAverage
Table 10: Opportunity and Necessity Entrepreneurship in GEM Participating countries
Opportunity TEA
8.784.765.424.254.314.834.155.874.863.854.446.985.995.975.392.964.165.135.526.485.145.809.075.40
13.7910.2316.6413.6415.994.614.058.434.247.5016.544.555.683.175.7914.857.575.579.05
9.2812.765.674.0610.788.51
Necessity TEA
1.58.592.09.331.14.851.042.022.141.303.24.75.301.341.07.441.50.35.751.38.891.252.621.26
6.884.566.499.745.382.591.953.07.501.875.124.304.091.233.183.693.751.853.90
3.496.477.704.264.405.26
25
In the innovation driven countries the highest level of opportunity TEA is observed in the US, Australia and Netherlands. In theefficiency driven economies, the highest level of opportunity TEA is in Peru, Chile, Colombia and Thailand. In the Factor driveneconomies, Guatemala, Venezuela and Bangladesh have the highest level of opportunity TEA. The data shows that generally,developing regions have higher numbers for necessity entrepreneurship than their developed region counterparts. This is obviousdue to the lack of good job opportunities in most of the factor driven economies.
Male Verses Female Entrepreneurial Activity
Women enter into entrepreneurship for many of the same reasons as men: to support themselves and families, to enrich their liveswith careers and financial independence etc. Yet there may be special reasons for female entrepreneurial activity. The findings suggestthat women's participation in entrepreneurship varies significantly across economies, but is nearly always less than that of men.
Table 11 presents a summary of Total early stage Entrepreneurial activity (TEA) rates by gender for all participating GEM countriesincluding Pakistan. Fig. 5 shows the level of female and male participation in early-stage entrepreneurship, ranked by the percentageof women involved in TEA within the three economic groups.
In some high income countries, men are around twice as likely to be entrepreneurially active as women, for example the gendergap is very high in countries like, Czech, France, Greece, Korea, Norway, and Ireland. On the other hand a narrower gendergap was reported in Switzerland and the US. In Singapore the Female TEA was higher than the male TEA.
In the efficiency driven countries, there is a high gender gap in Turkey followed by Argentina, Columbia, Peru and Uruguay. Alower gender gap is observed in Malaysia, Russia and Thailand. In the factor driven countries, the lowest level of women participationcan be found in Pakistan, Iran and Bangladesh. Across the three development levels, the factor-driven and efficiency-driven groupsare similar on average, but the innovation-driven group has a lower average proportion of women entrepreneurs.
Figure 9 - GEM Economies Ranked by Level of Female Participation in Total Early-Stage EntrepreneurshipActivity (TEA) by Economic Group, 2011
Male Female30%
25%
20%
15%
5%
0%
10%
Perc
enta
ge o
f m
ale
/ fe
mal
e po
pula
tion
18-6
4 ye
ars
Paki
stan
Ban
glad
esh
Factor-DrivenEconomies
Efficiency-Driven Economies Innovation-Driven Economies
Iran
Alg
enda
Jam
aica
Ven
ezue
laG
uate
mal
aM
alay
siaR
ussia
Hun
gary
Cre
atia
Pola
ndB
osan
ia a
nd H
erze
govi
naSo
uth
Afr
ica
Tur
key
Uth
uani
aR
oman
iaSl
ovak
iaL
atvi
aM
exic
oB
arba
dos
Uru
guay
Bra
zil
Col
ombi
aA
rgen
tina
Tri
nida
d &
Tob
ago
Peru
Pana
ma
Tha
iland
Chi
leC
hina
Slov
enia
Den
mar
kFr
ance
Japa
nK
orea
Irel
and
Nor
way
Cze
ch R
epub
licFi
nlan
dU
nite
d A
rab
Em
irat
esG
erm
any
Swed
anB
elgi
umSp
ain
Port
ugal
Uni
ted
Kin
gdom
Tai
wan
Gre
ece
Net
herla
nds
Switz
erla
ndSi
ngap
ore
Aus
tral
iaU
nite
d St
ates
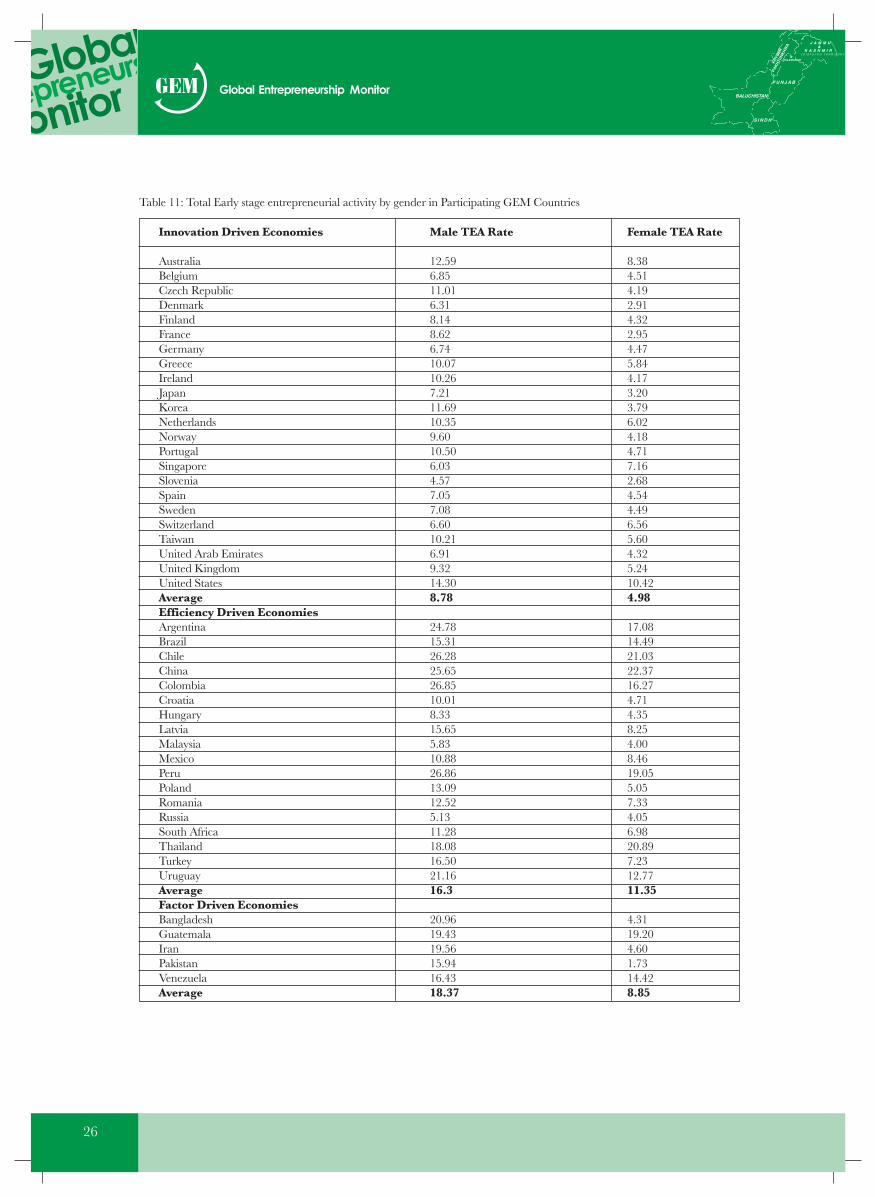
26
Innovation Driven Economies
AustraliaBelgiumCzech RepublicDenmarkFinlandFranceGermanyGreeceIrelandJapanKoreaNetherlandsNorwayPortugalSingaporeSloveniaSpainSwedenSwitzerlandTaiwanUnited Arab EmiratesUnited KingdomUnited StatesAverageEfficiency Driven EconomiesArgentinaBrazilChileChinaColombiaCroatiaHungaryLatviaMalaysiaMexicoPeruPolandRomaniaRussiaSouth AfricaThailandTurkeyUruguayAverageFactor Driven EconomiesBangladeshGuatemalaIranPakistanVenezuelaAverage
Table 11: Total Early stage entrepreneurial activity by gender in Participating GEM Countries
Male TEA Rate
12.596.8511.016.318.148.626.7410.0710.267.2111.6910.359.6010.506.034.577.057.086.6010.216.919.3214.308.78
24.7815.3126.2825.6526.8510.018.3315.655.8310.8826.8613.0912.525.1311.2818.0816.5021.1616.3
20.9619.4319.5615.9416.4318.37
Female TEA Rate
8.384.514.192.914.322.954.475.844.173.203.796.024.184.717.162.684.544.496.565.604.325.2410.424.98
17.0814.4921.0322.3716.274.714.358.254.008.4619.055.057.334.056.9820.897.2312.7711.35
4.3119.204.601.7314.428.85
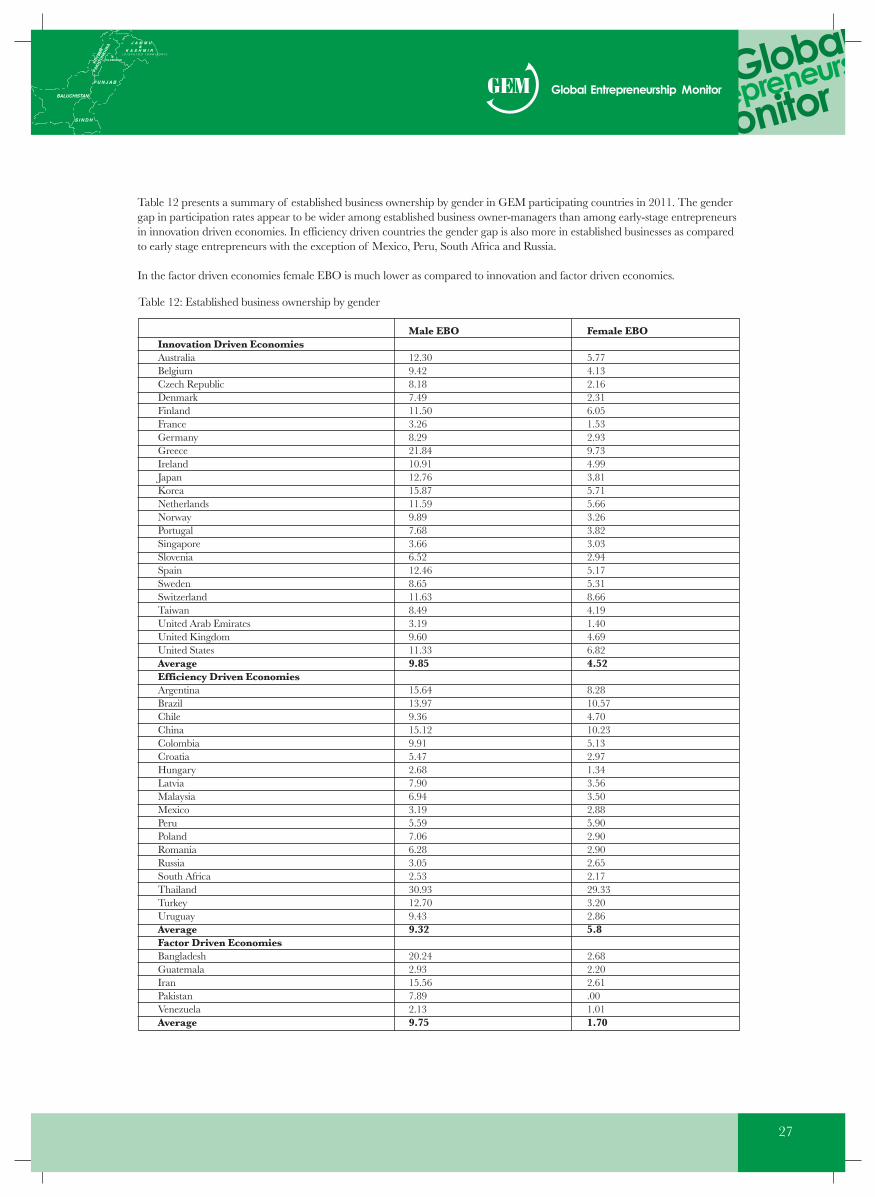
Table 12 presents a summary of established business ownership by gender in GEM participating countries in 2011. The gendergap in participation rates appear to be wider among established business owner-managers than among early-stage entrepreneursin innovation driven economies. In efficiency driven countries the gender gap is also more in established businesses as comparedto early stage entrepreneurs with the exception of Mexico, Peru, South Africa and Russia.
In the factor driven economies female EBO is much lower as compared to innovation and factor driven economies.
27
Innovation Driven EconomiesAustraliaBelgiumCzech RepublicDenmarkFinlandFranceGermanyGreeceIrelandJapanKoreaNetherlandsNorwayPortugalSingaporeSloveniaSpainSwedenSwitzerlandTaiwanUnited Arab EmiratesUnited KingdomUnited StatesAverageEfficiency Driven EconomiesArgentinaBrazilChileChinaColombiaCroatiaHungaryLatviaMalaysiaMexicoPeruPolandRomaniaRussiaSouth AfricaThailandTurkeyUruguayAverageFactor Driven EconomiesBangladeshGuatemalaIranPakistanVenezuelaAverage
Table 12: Established business ownership by gender
Male EBO
12.309.428.187.4911.503.268.2921.8410.9112.7615.8711.599.897.683.666.5212.468.6511.638.493.199.6011.339.85
15.6413.979.3615.129.915.472.687.906.943.195.597.066.283.052.5330.9312.709.439.32
20.242.9315.567.892.139.75
Female EBO
5.774.132.162.316.051.532.939.734.993.815.715.663.263.823.032.945.175.318.664.191.404.696.824.52
8.2810.574.7010.235.132.971.343.563.502.885.902.902.902.652.1729.333.202.865.8
2.682.202.61.001.011.70
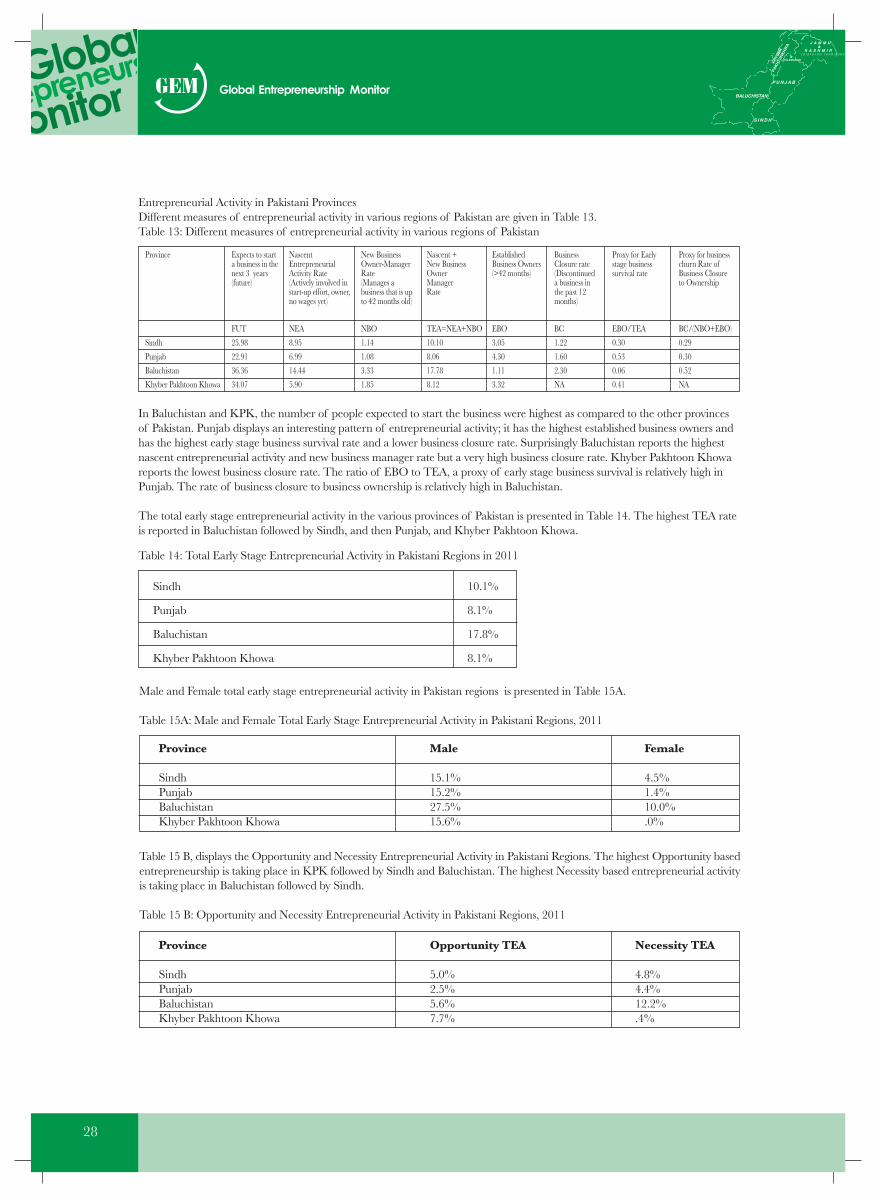
28
Entrepreneurial Activity in Pakistani ProvincesDifferent measures of entrepreneurial activity in various regions of Pakistan are given in Table 13.Table 13: Different measures of entrepreneurial activity in various regions of Pakistan
Sindh
Punjab
Baluchistan
Khyber Pakhtoon Khowa
FUT
25.98
22.91
36.36
34.07
NEA
8.95
6.99
14.44
5.90
NBO
1.14
1.08
3.33
1.85
TEA=NEA+NBO
10.10
8.06
17.78
8.12
Province Expects to starta business in thenext 3 years(future)
NascentEntrepreneurialActivity Rate(Actively involved instart-up effort, owner,no wages yet)
New BusinessOwner-ManagerRate(Manages abusiness that is upto 42 months old)
Nascent +New BusinessOwnerManagerRate
EBO
3.05
4.30
1.11
3.32
EstablishedBusiness Owners(>42 months)
BC
1.22
1.60
2.30
NA
BusinessClosure rate(Discontinueda business inthe past 12months)
EBO/TEA
0.30
0.53
0.06
0.41
Proxy for Earlystage businesssurvival rate
BC/(NBO+EBO)
0.29
0.30
0.52
NA
Proxy for businesschurn Rate ofBusiness Closureto Ownership
In Baluchistan and KPK, the number of people expected to start the business were highest as compared to the other provincesof Pakistan. Punjab displays an interesting pattern of entrepreneurial activity; it has the highest established business owners andhas the highest early stage business survival rate and a lower business closure rate. Surprisingly Baluchistan reports the highestnascent entrepreneurial activity and new business manager rate but a very high business closure rate. Khyber Pakhtoon Khowareports the lowest business closure rate. The ratio of EBO to TEA, a proxy of early stage business survival is relatively high inPunjab. The rate of business closure to business ownership is relatively high in Baluchistan.
The total early stage entrepreneurial activity in the various provinces of Pakistan is presented in Table 14. The highest TEA rateis reported in Baluchistan followed by Sindh, and then Punjab, and Khyber Pakhtoon Khowa.
Table 14: Total Early Stage Entrepreneurial Activity in Pakistani Regions in 2011
Sindh
Punjab
Baluchistan
Khyber Pakhtoon Khowa
10.1%
8.1%
17.8%
8.1%
Province
SindhPunjabBaluchistanKhyber Pakhtoon Khowa
Male and Female total early stage entrepreneurial activity in Pakistan regions is presented in Table 15A.
Male
15.1%15.2%27.5%15.6%
Female
4.5%1.4%10.0%.0%
Table 15 B, displays the Opportunity and Necessity Entrepreneurial Activity in Pakistani Regions. The highest Opportunity basedentrepreneurship is taking place in KPK followed by Sindh and Baluchistan. The highest Necessity based entrepreneurial activityis taking place in Baluchistan followed by Sindh.
Table 15 B: Opportunity and Necessity Entrepreneurial Activity in Pakistani Regions, 2011
Province
SindhPunjabBaluchistanKhyber Pakhtoon Khowa
Opportunity TEA
5.0%2.5%5.6%7.7%
Necessity TEA
4.8%4.4%12.2%.4%
Table 15A: Male and Female Total Early Stage Entrepreneurial Activity in Pakistani Regions, 2011
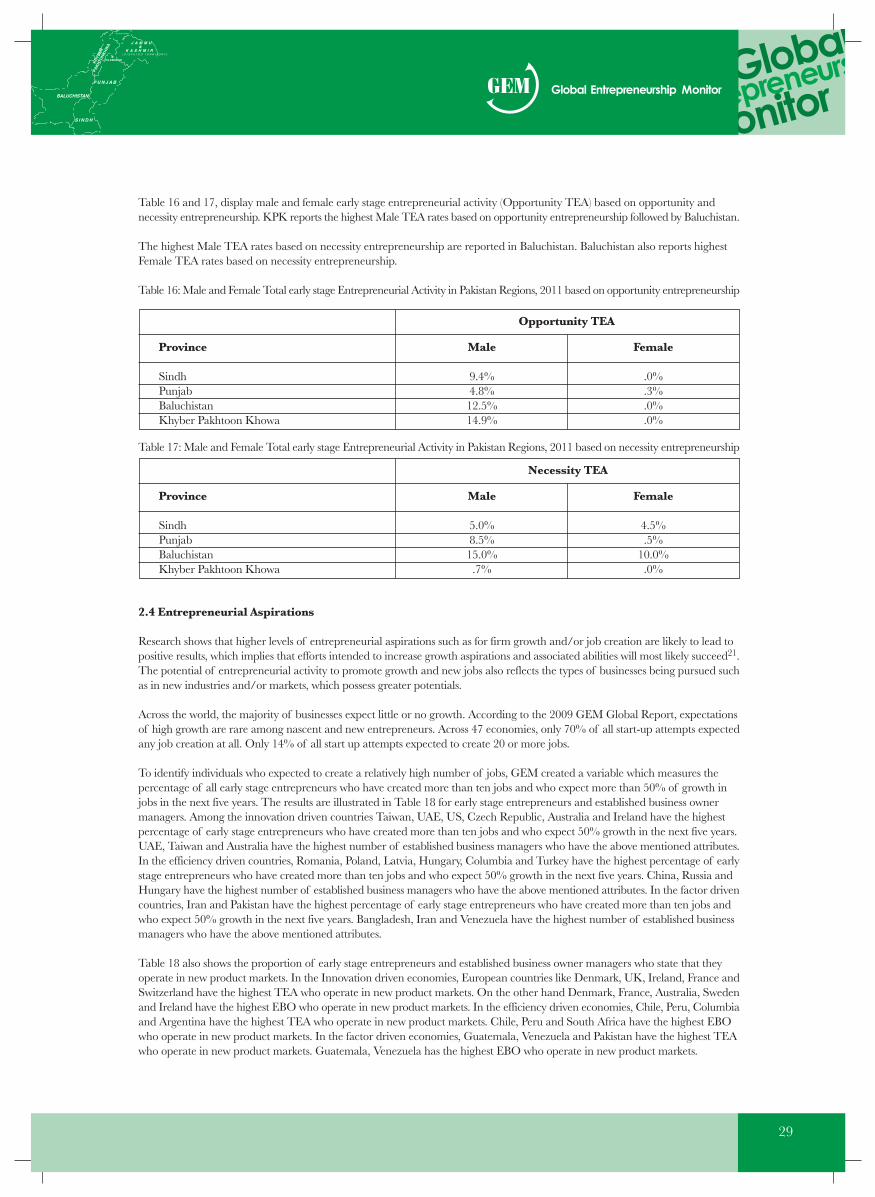
Table 16 and 17, display male and female early stage entrepreneurial activity (Opportunity TEA) based on opportunity andnecessity entrepreneurship. KPK reports the highest Male TEA rates based on opportunity entrepreneurship followed by Baluchistan.
The highest Male TEA rates based on necessity entrepreneurship are reported in Baluchistan. Baluchistan also reports highestFemale TEA rates based on necessity entrepreneurship.
Table 16: Male and Female Total early stage Entrepreneurial Activity in Pakistan Regions, 2011 based on opportunity entrepreneurship
29
Province
SindhPunjabBaluchistanKhyber Pakhtoon Khowa
Male
9.4%4.8%12.5%14.9%
Female
.0%
.3%
.0%
.0%
Opportunity TEA
Table 17: Male and Female Total early stage Entrepreneurial Activity in Pakistan Regions, 2011 based on necessity entrepreneurship
Province
SindhPunjabBaluchistanKhyber Pakhtoon Khowa
Male
5.0%8.5%15.0%.7%
Female
4.5%.5%
10.0%.0%
Necessity TEA
2.4 Entrepreneurial Aspirations
Research shows that higher levels of entrepreneurial aspirations such as for firm growth and/or job creation are likely to lead topositive results, which implies that efforts intended to increase growth aspirations and associated abilities will most likely succeed21.The potential of entrepreneurial activity to promote growth and new jobs also reflects the types of businesses being pursued suchas in new industries and/or markets, which possess greater potentials.
Across the world, the majority of businesses expect little or no growth. According to the 2009 GEM Global Report, expectationsof high growth are rare among nascent and new entrepreneurs. Across 47 economies, only 70% of all start-up attempts expectedany job creation at all. Only 14% of all start up attempts expected to create 20 or more jobs.
To identify individuals who expected to create a relatively high number of jobs, GEM created a variable which measures thepercentage of all early stage entrepreneurs who have created more than ten jobs and who expect more than 50% of growth injobs in the next five years. The results are illustrated in Table 18 for early stage entrepreneurs and established business ownermanagers. Among the innovation driven countries Taiwan, UAE, US, Czech Republic, Australia and Ireland have the highestpercentage of early stage entrepreneurs who have created more than ten jobs and who expect 50% growth in the next five years.UAE, Taiwan and Australia have the highest number of established business managers who have the above mentioned attributes.In the efficiency driven countries, Romania, Poland, Latvia, Hungary, Columbia and Turkey have the highest percentage of earlystage entrepreneurs who have created more than ten jobs and who expect 50% growth in the next five years. China, Russia andHungary have the highest number of established business managers who have the above mentioned attributes. In the factor drivencountries, Iran and Pakistan have the highest percentage of early stage entrepreneurs who have created more than ten jobs andwho expect 50% growth in the next five years. Bangladesh, Iran and Venezuela have the highest number of established businessmanagers who have the above mentioned attributes.
Table 18 also shows the proportion of early stage entrepreneurs and established business owner managers who state that theyoperate in new product markets. In the Innovation driven economies, European countries like Denmark, UK, Ireland, France andSwitzerland have the highest TEA who operate in new product markets. On the other hand Denmark, France, Australia, Swedenand Ireland have the highest EBO who operate in new product markets. In the efficiency driven economies, Chile, Peru, Columbiaand Argentina have the highest TEA who operate in new product markets. Chile, Peru and South Africa have the highest EBOwho operate in new product markets. In the factor driven economies, Guatemala, Venezuela and Pakistan have the highest TEAwho operate in new product markets. Guatemala, Venezuela has the highest EBO who operate in new product markets.
30
The third variable in Table 18 illustrates the percentage of early stage entrepreneurs and established business owner managerswho were active in high or medium tech sectors. France, Germany and Slovenia have the highest percentage of TEA who areactive in medium and high tech sectors. Norway, France, Japan and Germany have the highest percentage of EBO who are activein medium and high tech sectors. Croatia, Poland, Hungary and Chili have the highest %age of TEA and Hungary, Chili andPoland have the highest percent of EBO who are active in medium and high tech sectors among the efficiency driven economies.Iran and Venezuela have the highest %age of TEA and Iran has the highest percent EBO who are active in medium and hightech sector's among the factor driven economies.
The final variable shows the proportion of early stage entrepreneurs and established business owners who have more than 25%of their customers from outside the country. US, Czech Republic, Australia and Portugal have the highest %age of TEA and US,Australia, Belgium and Switzerland have the highest EBO who have more than 25% of their customers from outside the countryamong the innovation driven economies. Poland, Chili and Latvia have the highest %age of TEA and Poland, Romania andCroatia have the highest percentage of EBO who have more than 25% of their customers from outside the country among theefficiency driven economies.
Iran and Pakistan have the highest %age of TEA and EBO who have more than 25% of their customers from outside the countryamong the efficiency driven economies.
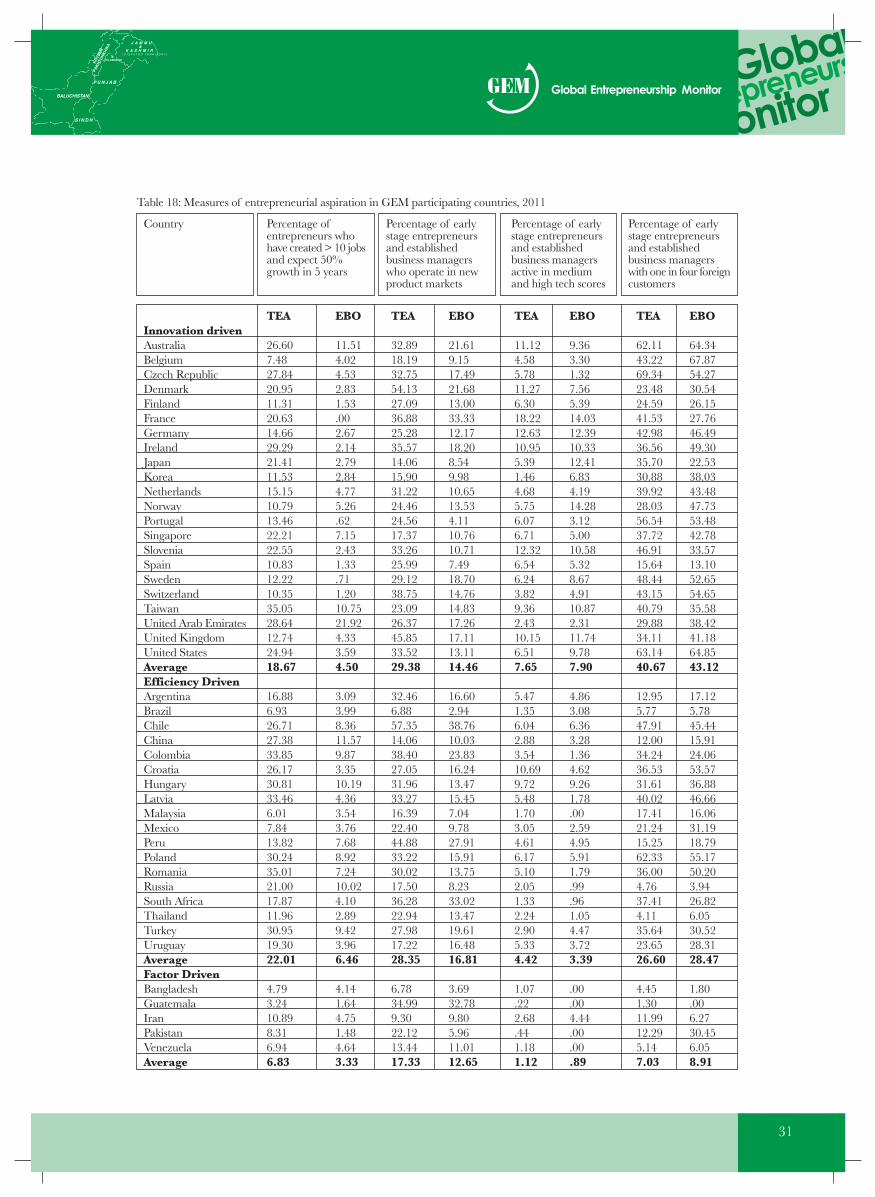
31
Table 18: Measures of entrepreneurial aspiration in GEM participating countries, 2011
Innovation drivenAustraliaBelgiumCzech RepublicDenmarkFinlandFranceGermanyIrelandJapanKoreaNetherlandsNorwayPortugalSingaporeSloveniaSpainSwedenSwitzerlandTaiwanUnited Arab EmiratesUnited KingdomUnited StatesAverageEfficiency DrivenArgentinaBrazilChileChinaColombiaCroatiaHungaryLatviaMalaysiaMexicoPeruPolandRomaniaRussiaSouth AfricaThailandTurkeyUruguayAverageFactor DrivenBangladeshGuatemalaIranPakistanVenezuelaAverage
TEA
26.607.4827.8420.9511.3120.6314.6629.2921.4111.5315.1510.7913.4622.2122.5510.8312.2210.3535.0528.6412.7424.9418.67
16.886.9326.7127.3833.8526.1730.8133.466.017.8413.8230.2435.0121.0017.8711.9630.9519.3022.01
4.793.2410.898.316.946.83
EBO
11.514.024.532.831.53.002.672.142.792.844.775.26.627.152.431.33.711.2010.7521.924.333.594.50
3.093.998.3611.579.873.3510.194.363.543.767.688.927.2410.024.102.899.423.966.46
4.141.644.751.484.643.33
Country Percentage ofentrepreneurs whohave created > 10 jobsand expect 50%growth in 5 years
Percentage of earlystage entrepreneursand establishedbusiness managerswho operate in newproduct markets
Percentage of earlystage entrepreneursand establishedbusiness managersactive in mediumand high tech scores
Percentage of earlystage entrepreneursand establishedbusiness managerswith one in four foreigncustomers
TEA
32.8918.1932.7554.1327.0936.8825.2835.5714.0615.9031.2224.4624.5617.3733.2625.9929.1238.7523.0926.3745.8533.5229.38
32.466.8857.3514.0638.4027.0531.9633.2716.3922.4044.8833.2230.0217.5036.2822.9427.9817.2228.35
6.7834.999.3022.1213.4417.33
EBO
21.619.1517.4921.6813.0033.3312.1718.208.549.9810.6513.534.1110.7610.717.4918.7014.7614.8317.2617.1113.1114.46
16.602.9438.7610.0323.8316.2413.4715.457.049.7827.9115.9113.758.2333.0213.4719.6116.4816.81
3.6932.789.805.9611.0112.65
TEA
11.124.585.7811.276.3018.2212.6310.955.391.464.685.756.076.7112.326.546.243.829.362.4310.156.517.65
5.471.356.042.883.5410.699.725.481.703.054.616.175.102.051.332.242.905.334.42
1.07.222.68.441.181.12
EBO
9.363.301.327.565.3914.0312.3910.3312.416.834.1914.283.125.0010.585.328.674.9110.872.3111.749.787.90
4.863.086.363.281.364.629.261.78.002.594.955.911.79.99.961.054.473.723.39
.00
.004.44.00.00.89
TEA
62.1143.2269.3423.4824.5941.5342.9836.5635.7030.8839.9228.0356.5437.7246.9115.6448.4443.1540.7929.8834.1163.1440.67
12.955.7747.9112.0034.2436.5331.6140.0217.4121.2415.2562.3336.004.7637.414.1135.6423.6526.60
4.451.3011.9912.295.147.03
EBO
64.3467.8754.2730.5426.1527.7646.4949.3022.5338.0343.4847.7353.4842.7833.5713.1052.6554.6535.5838.4241.1864.8543.12
17.125.7845.4415.9124.0653.5736.8846.6616.0631.1918.7955.1750.203.9426.826.0530.5228.3128.47
1.80.006.2730.456.058.91
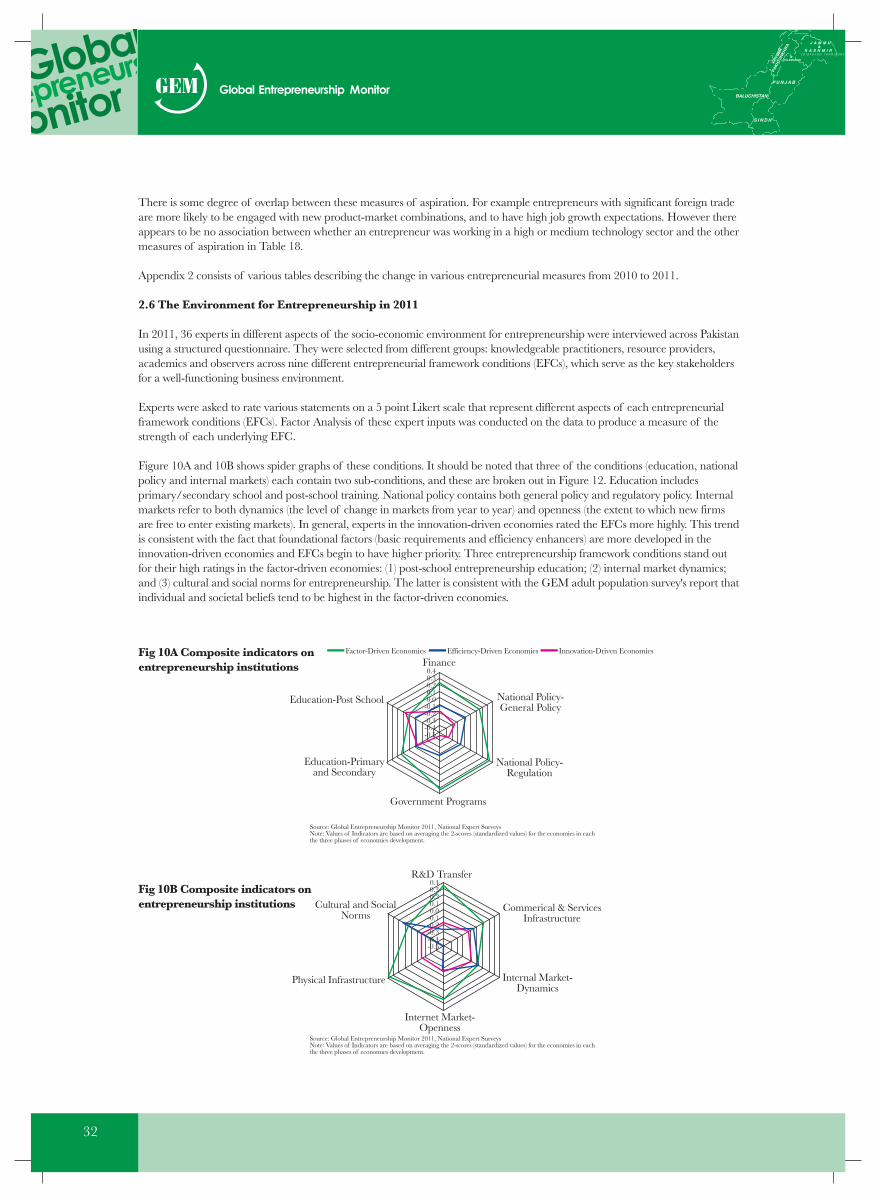
32
There is some degree of overlap between these measures of aspiration. For example entrepreneurs with significant foreign tradeare more likely to be engaged with new product-market combinations, and to have high job growth expectations. However thereappears to be no association between whether an entrepreneur was working in a high or medium technology sector and the othermeasures of aspiration in Table 18.
Appendix 2 consists of various tables describing the change in various entrepreneurial measures from 2010 to 2011.
2.6 The Environment for Entrepreneurship in 2011
In 2011, 36 experts in different aspects of the socio-economic environment for entrepreneurship were interviewed across Pakistanusing a structured questionnaire. They were selected from different groups: knowledgeable practitioners, resource providers,academics and observers across nine different entrepreneurial framework conditions (EFCs), which serve as the key stakeholdersfor a well-functioning business environment.
Experts were asked to rate various statements on a 5 point Likert scale that represent different aspects of each entrepreneurialframework conditions (EFCs). Factor Analysis of these expert inputs was conducted on the data to produce a measure of thestrength of each underlying EFC.
Figure 10A and 10B shows spider graphs of these conditions. It should be noted that three of the conditions (education, nationalpolicy and internal markets) each contain two sub-conditions, and these are broken out in Figure 12. Education includesprimary/secondary school and post-school training. National policy contains both general policy and regulatory policy. Internalmarkets refer to both dynamics (the level of change in markets from year to year) and openness (the extent to which new firmsare free to enter existing markets). In general, experts in the innovation-driven economies rated the EFCs more highly. This trendis consistent with the fact that foundational factors (basic requirements and efficiency enhancers) are more developed in theinnovation-driven economies and EFCs begin to have higher priority. Three entrepreneurship framework conditions stand outfor their high ratings in the factor-driven economies: (1) post-school entrepreneurship education; (2) internal market dynamics;and (3) cultural and social norms for entrepreneurship. The latter is consistent with the GEM adult population survey's report thatindividual and societal beliefs tend to be highest in the factor-driven economies.
0.40.30.20.10.0
-0.1-0.2-0.3-0.4-0.5
Finance
National Policy-General Policy
National Policy-Regulation
Education-Post School
Education-Primaryand Secondary
Government Programs
Factor-Driven Economies Efficiency-Driven Economies Innovation-Driven Economies
Source: Global Entrepreneurship Monitor 2011, National Expert SurveysNote: Values of Indicators are based on averaging the 2-scores (standardized values) for the economies in eachthe three phases of economies development.
Fig 10A Composite indicators onentrepreneurship institutions
Fig 10B Composite indicators onentrepreneurship institutions
0.40.30.20.10.0
-0.1-0.2-0.3-0.4-0.5
R&D Transfer
Cultural and SocialNorms
Physical Infrastructure
Internet Market-Openness
Internal Market-Dynamics
Commerical & ServicesInfrastructure
Source: Global Entrepreneurship Monitor 2011, National Expert SurveysNote: Values of Indicators are based on averaging the 2-scores (standardized values) for the economies in eachthe three phases of economies development.
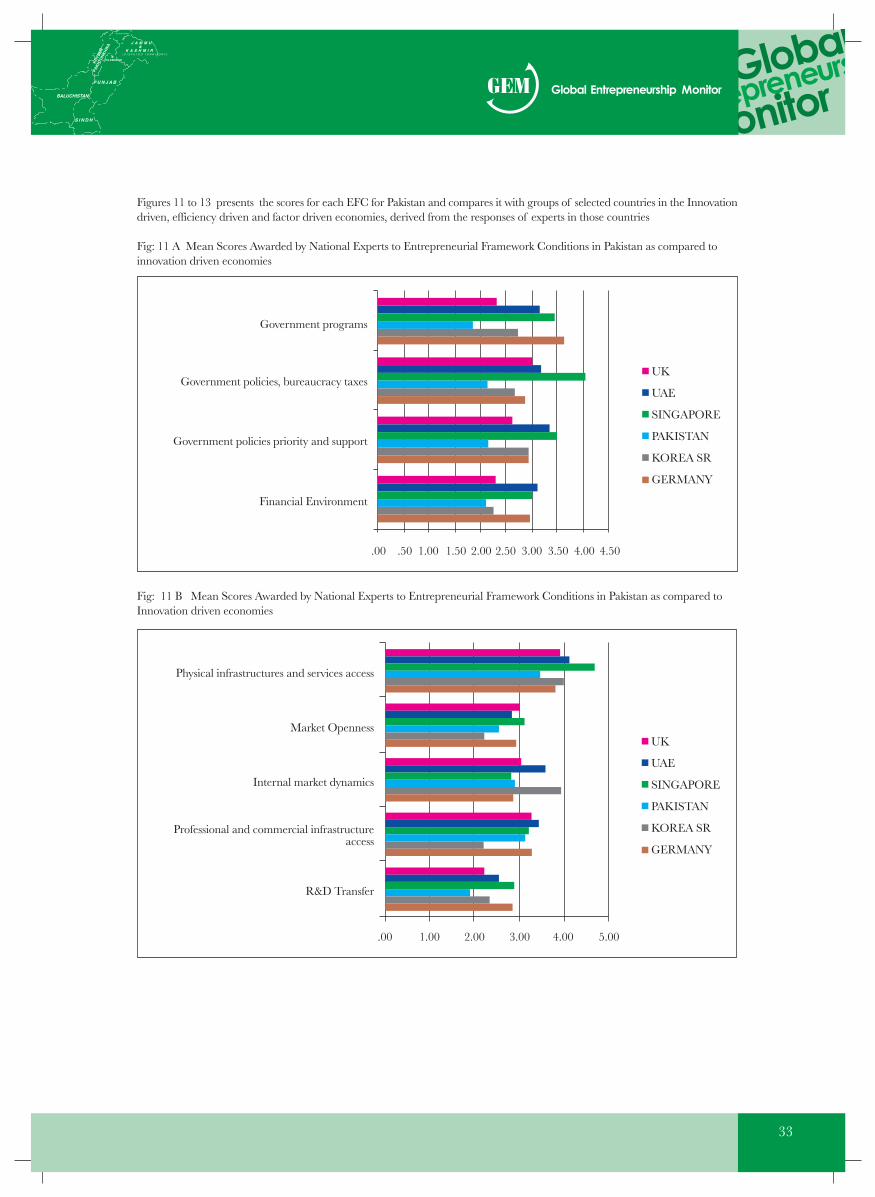
33
Figures 11 to 13 presents the scores for each EFC for Pakistan and compares it with groups of selected countries in the Innovationdriven, efficiency driven and factor driven economies, derived from the responses of experts in those countries
Fig: 11 A Mean Scores Awarded by National Experts to Entrepreneurial Framework Conditions in Pakistan as compared toinnovation driven economies
Fig: 11 B Mean Scores Awarded by National Experts to Entrepreneurial Framework Conditions in Pakistan as compared toInnovation driven economies
Government programs
Government policies, bureaucracy taxes
Government policies priority and support
Financial Environment
UK
UAE
SINGAPORE
PAKISTAN
KOREA SR
GERMANY
.00 .50 1.00 1.50 2.00 2.50 3.00 3.50 4.00 4.50
Physical infrastructures and services access
.00
Market Openness
Internal market dynamics
Professional and commercial infrastructureaccess
R&D Transfer
1.00 2.00 3.00 4.00 5.00
UK
UAE
SINGAPORE
PAKISTAN
KOREA SR
GERMANY
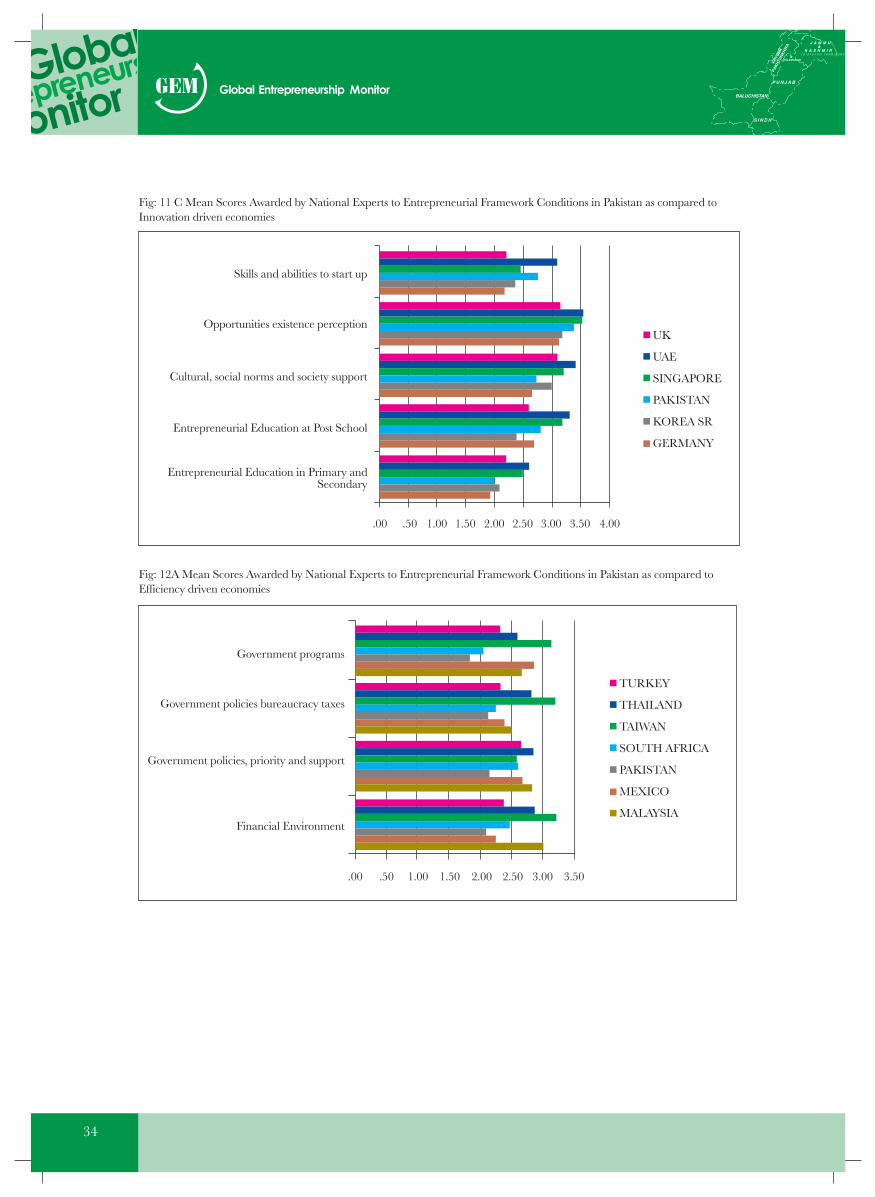
34
Fig: 11 C Mean Scores Awarded by National Experts to Entrepreneurial Framework Conditions in Pakistan as compared toInnovation driven economies
Fig: 12A Mean Scores Awarded by National Experts to Entrepreneurial Framework Conditions in Pakistan as compared toEfficiency driven economies
Skills and abilities to start up
.00 .50 1.00 1.50 2.00 2.50
UK
UAE
SINGAPORE
PAKISTAN
KOREA SR
GERMANY
Opportunities existence perception
Cultural, social norms and society support
Entrepreneurial Education at Post School
Entrepreneurial Education in Primary andSecondary
3.00 3.50 4.00
Government programs
.00 .50 1.00 1.50 2.00 2.50 3.00 3.50
TURKEY
THAILAND
TAIWAN
SOUTH AFRICA
PAKISTAN
MEXICO
MALAYSIA
Government policies bureaucracy taxes
Government policies, priority and support
Financial Environment
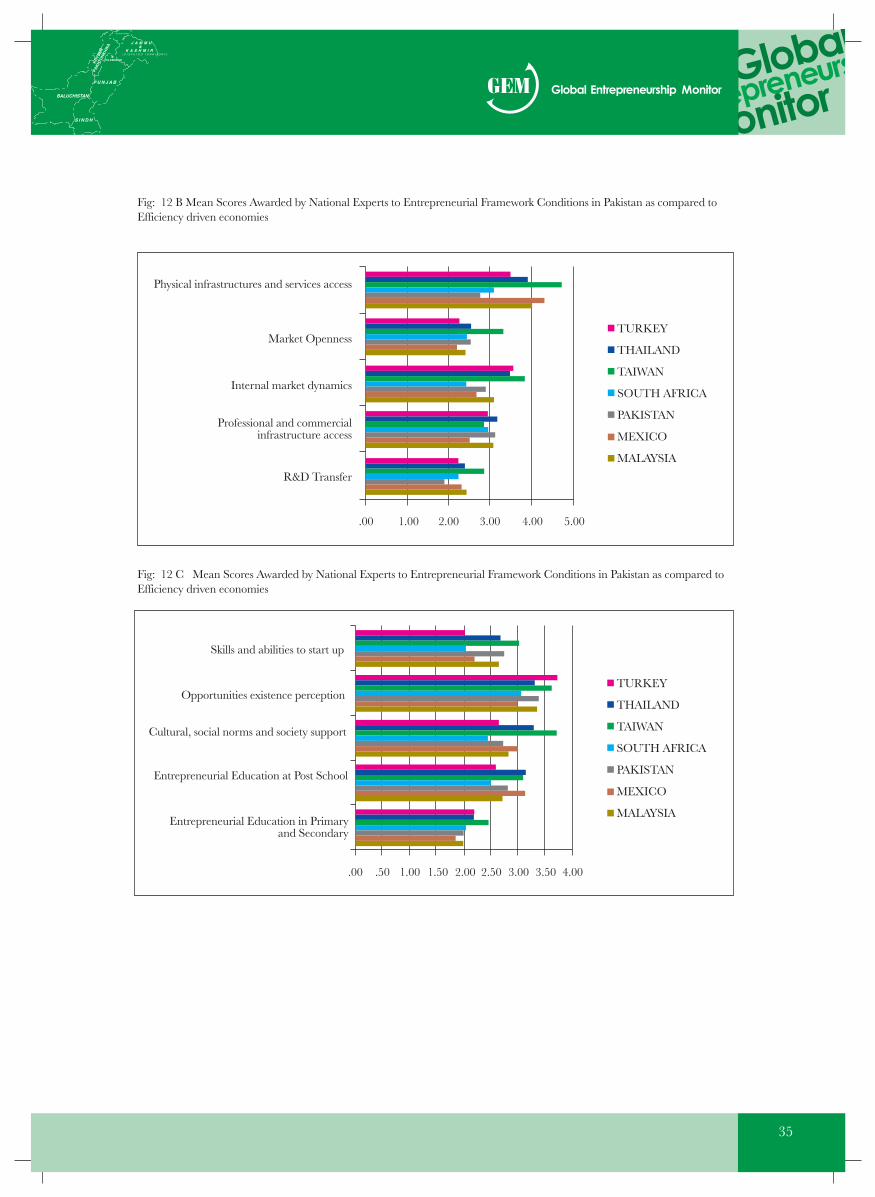
35
Fig: 12 B Mean Scores Awarded by National Experts to Entrepreneurial Framework Conditions in Pakistan as compared toEfficiency driven economies
Fig: 12 C Mean Scores Awarded by National Experts to Entrepreneurial Framework Conditions in Pakistan as compared toEfficiency driven economies
Physical infrastructures and services access
.00 1.00 2.00 3.00
TURKEY
THAILAND
TAIWAN
SOUTH AFRICA
PAKISTAN
MEXICO
MALAYSIA
Market Openness
Internal market dynamics
Professional and commercialinfrastructure access
R&D Transfer
4.00 5.00
Skills and abilities to start up
TURKEY
THAILAND
TAIWAN
SOUTH AFRICA
PAKISTAN
MEXICO
MALAYSIA
.00 .50 1.00 1.50
Opportunities existence perception
Cultural, social norms and society support
Entrepreneurial Education at Post School
Entrepreneurial Education in Primaryand Secondary
2.00 2.50 3.00 3.50 4.00
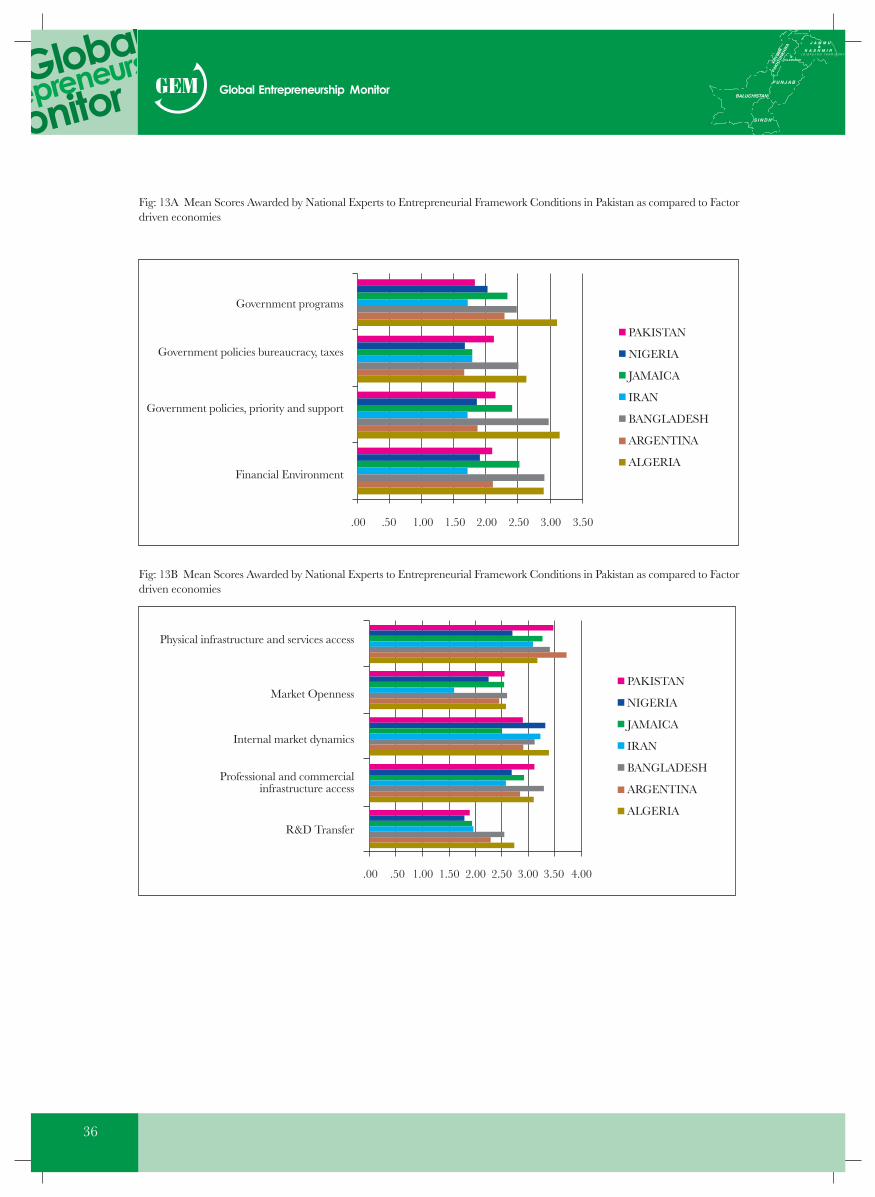
36
Fig: 13A Mean Scores Awarded by National Experts to Entrepreneurial Framework Conditions in Pakistan as compared to Factordriven economies
Fig: 13B Mean Scores Awarded by National Experts to Entrepreneurial Framework Conditions in Pakistan as compared to Factordriven economies
Government programs
PAKISTAN
NIGERIA
JAMAICA
IRAN
BANGLADESH
ARGENTINA
ALGERIA
.00 .50 1.00 1.50 2.00 2.50 3.00 3.50
Government policies bureaucracy, taxes
Government policies, priority and support
Financial Environment
Physical infrastructure and services access
PAKISTAN
NIGERIA
JAMAICA
IRAN
BANGLADESH
ARGENTINA
ALGERIA
.00 .50 1.00 1.50 2.00 2.50 3.00 3.50
Professional and commercialinfrastructure access
R&D Transfer
Market Openness
Internal market dynamics
4.00
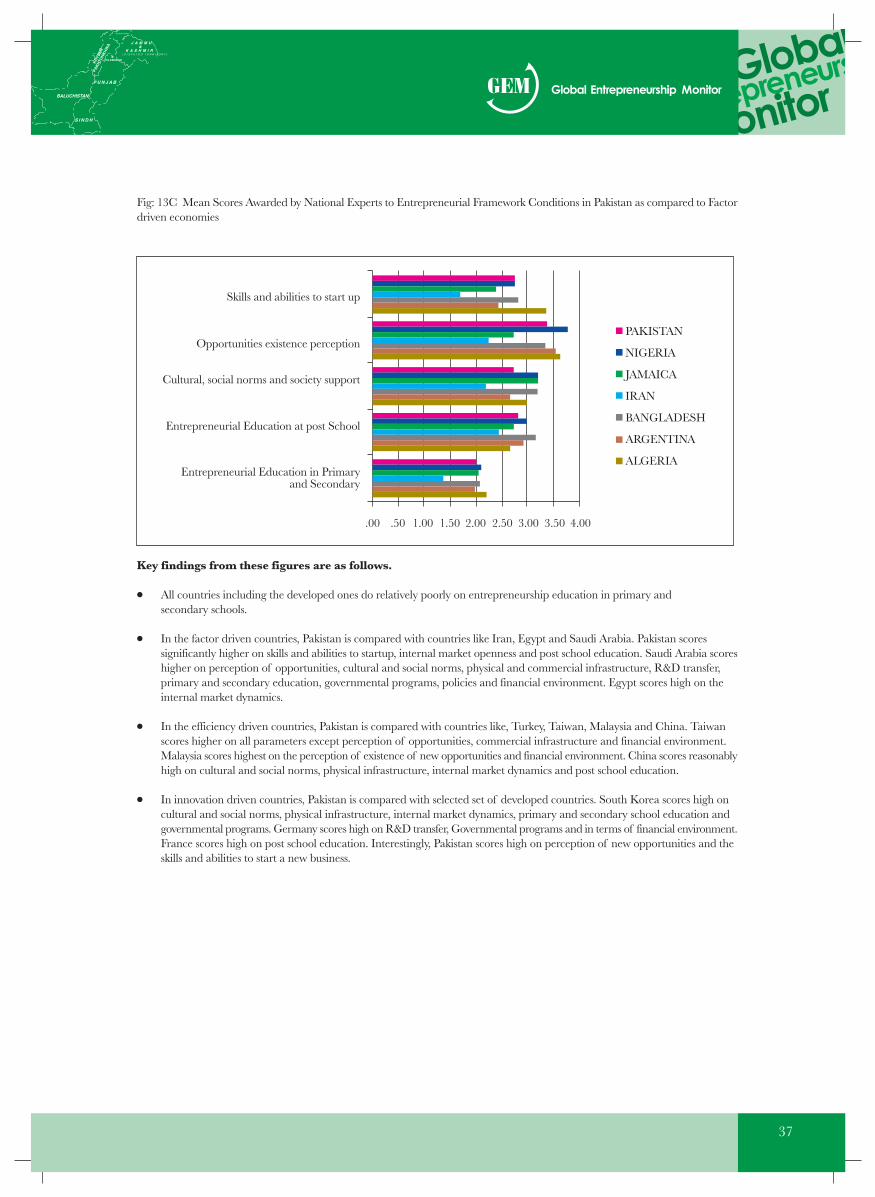
37
Fig: 13C Mean Scores Awarded by National Experts to Entrepreneurial Framework Conditions in Pakistan as compared to Factordriven economies
Key findings from these figures are as follows.
● All countries including the developed ones do relatively poorly on entrepreneurship education in primary andsecondary schools.
● In the factor driven countries, Pakistan is compared with countries like Iran, Egypt and Saudi Arabia. Pakistan scoressignificantly higher on skills and abilities to startup, internal market openness and post school education. Saudi Arabia scoreshigher on perception of opportunities, cultural and social norms, physical and commercial infrastructure, R&D transfer,primary and secondary education, governmental programs, policies and financial environment. Egypt scores high on theinternal market dynamics.
● In the efficiency driven countries, Pakistan is compared with countries like, Turkey, Taiwan, Malaysia and China. Taiwanscores higher on all parameters except perception of opportunities, commercial infrastructure and financial environment.Malaysia scores highest on the perception of existence of new opportunities and financial environment. China scores reasonablyhigh on cultural and social norms, physical infrastructure, internal market dynamics and post school education.
● In innovation driven countries, Pakistan is compared with selected set of developed countries. South Korea scores high oncultural and social norms, physical infrastructure, internal market dynamics, primary and secondary school education andgovernmental programs. Germany scores high on R&D transfer, Governmental programs and in terms of financial environment.France scores high on post school education. Interestingly, Pakistan scores high on perception of new opportunities and theskills and abilities to start a new business.
Skills and abilities to start up
PAKISTAN
NIGERIA
JAMAICA
IRAN
BANGLADESH
ARGENTINA
ALGERIA
.00 .50 1.00 1.50 2.00 2.50 3.00 3.50 4.00
Opportunities existence perception
Cultural, social norms and society support
Entrepreneurial Education at post School
Entrepreneurial Education in Primaryand Secondary

38
Chapter 3: Conclusions and ImplicationsWith Pakistan moving toward a more entrepreneurially-led economic growth model, it is an opportune time to take stock of thenational challenges highlighted earlier and draw lessons as to how the GEM Pakistan research program can better inform, educateand possibly guide the various stakeholders to help achieve their goals.
The GEM Pakistan 2011 results offer in-depth review of individual entrepreneurial characteristics of the adult (18-64) populationalong with the national environmental context in which entrepreneurship takes place. Assessments of Pakistan's needs to improvebusiness climate and entrepreneurial environment almost certainly emphasize (a) reinventing the role of government ensuringsecurity and the rule of law (b) removing the instruments of rent-seeking (c) moving away from the current focus on governmentplanning, production, and mercantilism to a more market- and commerce-based approach22. The new approach is said to be morealigned with globalization, creativity, and innovation23. However, a number of implications and lessons can be drawn from theGEM study results.
Entrepreneurship awareness and research:
It is hoped that the GEM research would not only create awareness of the importance of entrepreneurship among policy makers,academics and general public, but will also provide a solid basis to launch new academic and industrial research projects therebysignificantly enriching our understanding of the state-of-entrepreneurship in the country and related challenges that need to beovercome. More specifically areas of interest, the acquired GEM data sets will lead to exploring, include:
● Comparative conditions for entrepreneurship among countries● Investigating changing environmental conditions for entrepreneurship over time● Regional differences within Pakistan● Institutional structures, human and social capital facilitating or blocking entrepreneurship● Longitudinal studies following the same entrepreneurial respondents over time● Investigations linking GEM data to other data sources● Links between the individual level (the entrepreneur) and society (i.e. growth in GDP)● Arrangement for funding the entrepreneurial venture, business angles● Nascent entrepreneurship and business ownership● Corporate entrepreneurship and independent start-ups● Issues relating to disadvantaged groups including women, minorities and the poor.
Some of the potential users of GEM Pakistan results include: Government organizations such as Planning Commission of Pakistan,Ministry of Youth Affairs, Ministry of Economic Affairs, Ministry of Rural Development, SMEDA, National ProductivityOrganization, and the Export Promotion Bureau among others. Academic beneficiaries belonging to universities and researchorganizations include centers of excellence in entrepreneurship, academic researchers in business and economics and other socialscientists, doctoral and post graduate students. Additionally, business and civic organizations including local chambers of commerceand industry can equally benefit from this work.
Regional Entrepreneurial Policy Support:
According to the Census of Establishments, there are 72 geographic districts in Pakistan and more than 50 percent of entrepreneurialventures are located in 10 districts namely, Karachi, Lahore, Faisalabad, Multan, Hyderabad, Sialkot, Gujrat, Gujranwala, Quettaand Sheikhupura. GEM research can prove to be a pioneering effort in assessing entrepreneurial propensity in all districts ofPakistan by linking entrepreneurial framework conditions of each district to the country's overall economic growth. Ultimatelythis will help policymakers in identifying and addressing the underlying issues uncovered in the national environmental factors tostrengthen the relationship of entrepreneurship to economic dynamism by taking necessary policy measures in light of the findingof this research.
Youth Entrepreneurship and Employment:
With a bulge in youth population and an urgent social need for job creation when viewed in light of several positive entrepreneurialand pro-business attributes of the population identified in this research, a new cadre of young entrepreneurs needs to be developed. If successful this has the potential of creating jobs and economic development opportunities in the country. Therefore, there is astrong need for entrepreneurship education programs starting from pre-high school and particularly as part of engineering andscience programs in the polytechnic institutes and universities of the country. The training and education has to be designed in away to prepare individuals who can pursue entrepreneurship when needed or when the opportunity strikes.
39
Facilitate necessity and encourage opportunity entrepreneurship
Unleash domestic business sector energy by government programs and funds and learn from economic peers and geographicneighbors. Interestingly, Pakistan scores high on perception of new opportunities and the skills and abilities to start a new business. However, there is a need to promote entrepreneurship mindset across the population, education and awareness at all levels. As afactor driven economy there is a huge scope in the area of agro based entrepreneurship, dairy business, halal food business, valueaddition in the textile products and in the light and medium engineering sector. At the same time Pakistani universities are producingthousands of IT and engineering graduates and there is a great opportunity to follow the footsteps of India and China to promoteIT based entrepreneurship among the graduating students by providing an enabling environment.
Provision of Business Support Mechanisms
Overall, entrepreneurial activity in Pakistan has tacked the MENA region averages in 2011. However there is evidence of achallenge among established business owners as manifested in lower opportunity perception, lower perceived merit of starting abusiness as a career choice and lower perceived media coverage of successful entrepreneurs. There is also plenty of evidence thatit is more difficult for nascent entrepreneurs for finding funds and fewer people were investing in others new businesses. There isneed for entrepreneurship support systems, enabling entrepreneurial culture and provision of funding. Small business incubationfacilities, particularly for student and female entrepreneurs may be considered. In addition to the governmental resources, academicinstitutions, the corporate sector, formal and informal investors, established businesses and the media has to be mobilized to supportthe entrepreneurial initiatives for the Pakistani youth.
In the pursuit of unleashing domestic entrepreneurial energy there is a need to ensure both entrepreneurial dynamism and stability.By being a member of the GEM community, Pakistan can better learn from its economic peers and geographic neighbors keepingin view its current challenges and development levels when designing its entrepreneurship support programs.

40
REFERENCES AND FOOTNOTES1 This section is excerpted from the GEM 2011 Global Report by Kelley et al, available at www.gemconsortium.org2 GEM was founded by Babson College, USA and London Business School, UK in 1997 and the first study was conducted in1999 with 10 member nations.3 The World Bank.Doing Business 2011. Washington, D.C.: The International Bank for Reconstruction and Development/TheWorld Bank, 2011.
4 Porter, M.E., J.J. Sachs and J. McArthur. “Executive Summary: Competitiveness and Stages of Economic Development.” In TheGlobal Competitiveness Report 2001-2002, edited by M.E.Porter, J.J. Sachs, P.K. Cornelius, J.W. McArthur and K. Schwab, 16-25. New York, NY: Oxford University Press, 2002.5 Gries, T. and W. Naude. (2011). “Entrepreneurship and Structural Economic Transformation,” In Small Business Economics,34(1): 13-29.6 Ibid
7 Entrepreneurship is the process of creating something new with value by devoting the necessary time and effort, assuming theaccompanying financial, psychic, and social risks, and receiving the resulting rewards of monetary and personal satisfaction andindependence, see Hisrich et al (2011)Entrepreneurship” 8th Ed., McGraw-Hill /Irwin, NY.
8 A 2007 World Bank Group entrepreneurship survey that measured entrepreneurial activity in 84 developing and industrialcountries over the period 2003-2005 showed Pakistan's new registrations of companies as a percentage of total lagged(previousyear) registered businesses, was 7 % vs. 10.2 % over the same period in industrialized countries. The absolute entry rate per thousandworking age adults was a dismal 0.04, which is 1/4th of India (0.12) and Egypt (0.13) according to the 2008 data. See,http://www.ifc.org/ifcext/sme.nsf/Content/Resources
9 See SMEDAweb page at www.smeda.org.pk/main.php?id=3410 Fayyaz, A., Mian, S.A. and Khan, J.H. (2009) 'State of Entrepreneurship and Globalization in Pakistan', Int. J. Business andGlobalization, Vol. 3, No.3, 271-287
11 Framework for Economic Growth Pakistan, Planning Commission Government of Pakistan, May 201112 Haque, N. Ul (2011), 'Developing a New Growth Strategy for Pakistan: New Growth Framework Approved' in Najam, A., AllThings Pakistan, May 29
13 Hisrich et al (2011), op. cit.14 Schramm, C. (2010) 'Expeditionary Economics,' Foreign Affairs, May/June.15 Looney, R. (2012). 'Entrepreneurship and the Process of Development: A Framework for Applied Expeditionary Economics inPakistan'. Kauffman Foundation Research Series on Expeditionary Economics, Kauffman Foundation, USA
16 Roundtable Report on Youth Development and Economic Growth, Planning Division Government of Pakistan, 25th January,2011, comments by Salman Ahmed of 'Development Pool'.17 According to the WEF's Global Competitiveness Report 2009-2011 Pakistan failed to improve significantly on any of the basicdeterminants of its competitiveness over the past two years. To make things worse, the threat ofterrorism bears heavily on the business community, according to the report.
18 Hasan, S. Z. (2011). Pakistan: Facing the Challenge of Science and Technology Driven Entrepreneurship Take-off, in Scienceand Technology Based Regional Entrepreneurship: Global Experience in Policy and Program Development, S. A. Mian (ed),Edward Elgar, MA: Northampton.19 Looney, R. (2012). op. cit.20 The data includes only those respondents who are not entrepreneurially active; they are neither already nascent entrepreneursnor business owner / managers. It is intended to avoid pro-entrepreneurship biases of those who are already involved in sometype of entrepreneurial activity.21 Wicklund, J. and Shepherd, D (2003). “Aspiring for and achieving growth: The moderating role of resources andopportunities, Journal of Management Studies, 40 (8), 1919-1941.

41
Dr. Sarfraz A. Mian, GEM Pakistan Head and Principal Investigator, is Professor ofEntrepreneurship and Management Policy, and Chair Marketing & Management Areas in theSchool of Business, State University of New York- Oswego, USA. He obtained his MS inManagement Sciences from Northwestern University, an MBA and PhD from George WashingtonUniversity. He has taught at University of Maryland, Osnabruck University, Germany, LUMSLahore, and lectured at universities in Europe, South America, and South Asia. He has servedas Chair, Institute for Operations Research & Management Sciences Technology Managementarea (2002-04) and was Executive Officer of the Academy of Management TIM Division (2000-05). He is the co-founder and US Coordinator of North American Innovation Research Network(NAIRNet). He has published more than 50 scholarly articles and made 100 international conferencepresentations and invited speeches. His recent scholarly work includes: two books - 'BuildingKnowledge Regions in North America” and 'Science & Technology Based Regional Entrepreneurship(both Edward Elgar). Prof. Mian's Journal of Business Venturing and Research Policy articles on
university business incubation are among the most cited. His published work was ranked among top 13 worldwide in academicentrepreneurship by Rothaermel et al. Industrial & Corporate Change, 2007, 16:4, pp 691-791. He has 30 years of experience withinternational bodies, governments, industry and academia. He is currently advisor to the Center of Entrepreneurial Development(CED) at IBA (Email: [email protected], Web: www.oswego.edu/~mian)
Dr. Shahid Qureshi, a GEM Pakistan Team Member, is Assistant Professor of Entrepreneurshipand Associate Director for the Centre of Entrepreneurial Development (CED) at IBA. Dr Qureshiis one of the founding members of the GEM Pakistan initiative with Dr. Mian. He obtained hisPhD in Marketing from Technical University Berlin, Master's in IE &MS from AIT Bangkok,and an MBA from LUMS, Lahore. His research interests are in the areas of Entrepreneurship,Strategy and on the interface of Entrepreneurship and Marketing. He has recently published hisresearch on the Determinants of Marketing Capabilities in new technology based firms. He hastaught courses in the area of Entrepreneurship, Strategic Management, Entrepreneurial marketingand research methods. Dr. Qureshi is a visiting faculty at Technical University , Berlin, ToulouseBusiness School France, European School of Management (ESCP-EAP) Berlin, Frankfurt Schoolof Business, Germany, Lahore University of Management Sciences (LUMS) Pakistan and at S.P.Jain Institute of Management & Research (SPJIMR), in Dubai. He has presented papers andattended many national and international conferences in Sweden, Germany, UK, USA, Poland,
Pakistan and India. He has been a consultant to various small and medium businesses and conducted training for various companies.(Email: [email protected])
Mr. Zafar A. Siddiqui is a Member of GEM Pakistan Team. He is Director for the Centre ofEntrepreneurial Development (CED) at IBA. Mr. Siddiqui earned an MBA from IBA and anMS in Marketing Communications from USA. He has 27 years of experience with the F.M.C.G.sector both in the field of Sales, Marketing and General Management. He was associated withGillette for 15 years in Pakistan and Overseas. His last assignment with Gillette was as ChiefExecutive for Gillette Pakistan (Pvt.) Ltd., and Area Director for Afghanistan, Sri Lanka, Bangladesh,Nepal & Maldives. Mr. Siddiqui has seen the transformation of trade in Russia over the six yearswhile he was the Business Director with Gillette for the entire region of the Former Soviet Union. The key accounts that he dealt with in Russia were Metro (German), Auchan (French) and Migros(Turkish). He has observed and worked very closely with these giants and understands their thinkingprocess and working philosophies. Mr. Siddiqui is also on the Board of Pakistan Society for Training& Development, Engro Foods, Inbox Business Technologies, Zilfiqar Industries, and Faysal AssetManagement. Mr. Siddiqui has over 27 years of teaching experience at IBA, Baharia University,
and Moscow State University. He is also a member of Rotary Metropolitan, Management Association of Pakistan and MarketingAssociation of Pakistan. (Email: [email protected])
GEM Pakistan Team
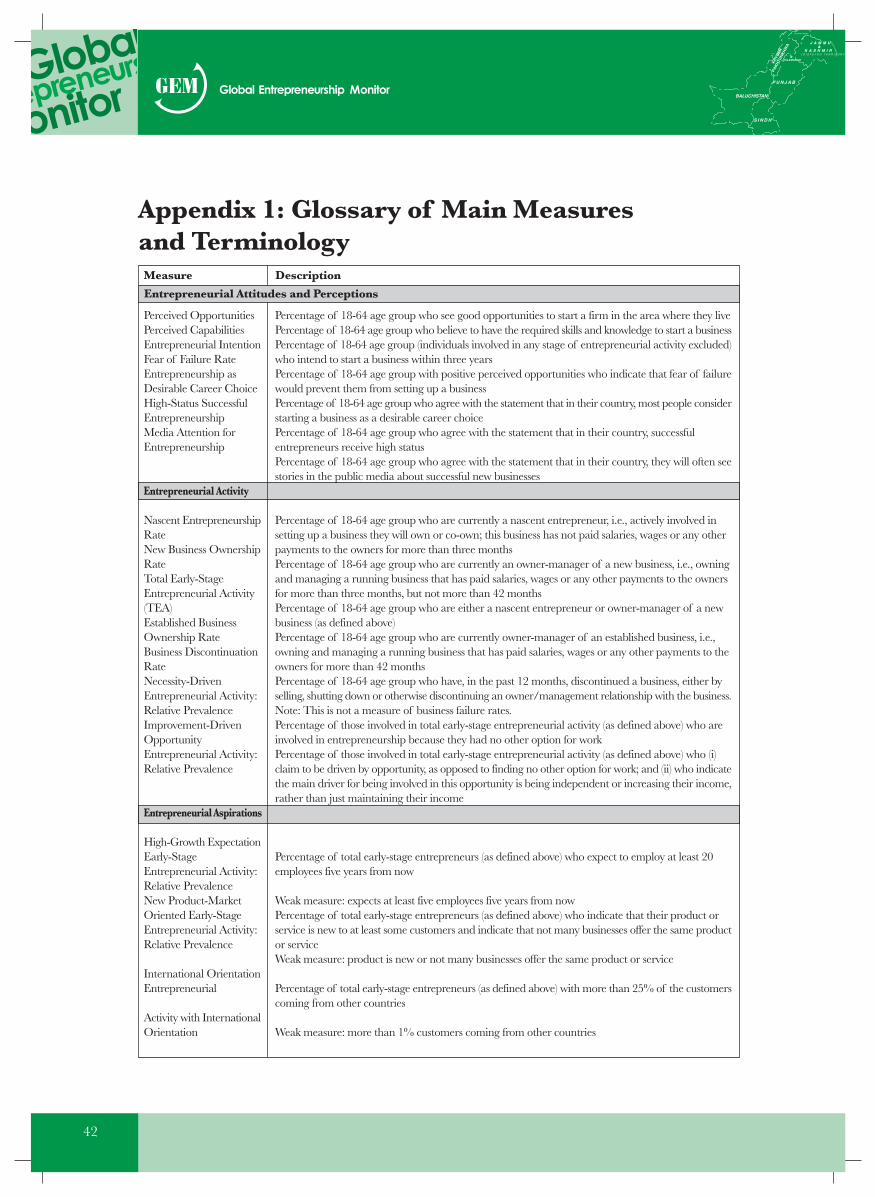
42
Appendix 1: Glossary of Main Measuresand TerminologyMeasure Description
Perceived OpportunitiesPerceived CapabilitiesEntrepreneurial IntentionFear of Failure RateEntrepreneurship asDesirable Career ChoiceHigh-Status SuccessfulEntrepreneurshipMedia Attention forEntrepreneurship
Entrepreneurial Activity
Nascent EntrepreneurshipRateNew Business OwnershipRateTotal Early-StageEntrepreneurial Activity(TEA)Established BusinessOwnership RateBusiness DiscontinuationRateNecessity-DrivenEntrepreneurial Activity:Relative PrevalenceImprovement-DrivenOpportunityEntrepreneurial Activity:Relative Prevalence
Entrepreneurial Aspirations
High-Growth ExpectationEarly-StageEntrepreneurial Activity:Relative PrevalenceNew Product-MarketOriented Early-StageEntrepreneurial Activity:Relative Prevalence
International OrientationEntrepreneurial
Activity with InternationalOrientation
Percentage of 18-64 age group who see good opportunities to start a firm in the area where they livePercentage of 18-64 age group who believe to have the required skills and knowledge to start a businessPercentage of 18-64 age group (individuals involved in any stage of entrepreneurial activity excluded)who intend to start a business within three yearsPercentage of 18-64 age group with positive perceived opportunities who indicate that fear of failurewould prevent them from setting up a businessPercentage of 18-64 age group who agree with the statement that in their country, most people considerstarting a business as a desirable career choicePercentage of 18-64 age group who agree with the statement that in their country, successfulentrepreneurs receive high statusPercentage of 18-64 age group who agree with the statement that in their country, they will often seestories in the public media about successful new businesses
Percentage of 18-64 age group who are currently a nascent entrepreneur, i.e., actively involved insetting up a business they will own or co-own; this business has not paid salaries, wages or any otherpayments to the owners for more than three monthsPercentage of 18-64 age group who are currently an owner-manager of a new business, i.e., owningand managing a running business that has paid salaries, wages or any other payments to the ownersfor more than three months, but not more than 42 monthsPercentage of 18-64 age group who are either a nascent entrepreneur or owner-manager of a newbusiness (as defined above)Percentage of 18-64 age group who are currently owner-manager of an established business, i.e.,owning and managing a running business that has paid salaries, wages or any other payments to theowners for more than 42 monthsPercentage of 18-64 age group who have, in the past 12 months, discontinued a business, either byselling, shutting down or otherwise discontinuing an owner/management relationship with the business.Note: This is not a measure of business failure rates.Percentage of those involved in total early-stage entrepreneurial activity (as defined above) who areinvolved in entrepreneurship because they had no other option for workPercentage of those involved in total early-stage entrepreneurial activity (as defined above) who (i)claim to be driven by opportunity, as opposed to finding no other option for work; and (ii) who indicatethe main driver for being involved in this opportunity is being independent or increasing their income,rather than just maintaining their income
Percentage of total early-stage entrepreneurs (as defined above) who expect to employ at least 20employees five years from now
Weak measure: expects at least five employees five years from nowPercentage of total early-stage entrepreneurs (as defined above) who indicate that their product orservice is new to at least some customers and indicate that not many businesses offer the same productor serviceWeak measure: product is new or not many businesses offer the same product or service
Percentage of total early-stage entrepreneurs (as defined above) with more than 25% of the customerscoming from other countries
Weak measure: more than 1% customers coming from other countries
Entrepreneurial Attitudes and Perceptions

Figure: 15 Entrepreneurial attitudes in Pakistan (%age MALE respondents aged 18 - 64 expressing an opinion and agreeing withthe statement)
90 .0%80 .0%70.0%60 .0%50 .0%40 .0%30.0%20 .0%10 ..0%
0 .0% 2010
2011
Kno
w s
omeo
ne p
erso
nally
who
star
ted
a bu
sine
ss in
the
past
2 ye
ars.
Goo
d st
art u
p op
port
uniti
es in
the
next
six
mon
ths
Hav
ethe
kno
wle
dge,
ski
ll an
dex
peri
ence
req
uire
d to
sta
rt a
new
bus
ines
s
Fear
of
failu
re p
reve
ntin
g fr
omst
artin
g a
busi
ness
Bus
ines
s as
a g
ood
care
erch
oice
Tho
se s
ucce
ssfu
l at s
tart
ing
ane
w b
usin
ess
have
a h
igh
leve
lof
sta
tus
and
resp
ect
Seen
sto
ries
in th
e pu
blic
med
iaab
out s
ucce
ssfu
l new
bus
ines
ses
Figure 14: Entrepreneurial attitudes in Pakistan (%age ALL respondents aged 18 -64 expressing an opinion and agreeing withthe statement)
90%
80%
70%
60%
50%
40%30%
20%
10%
0% 2010
2011
Kno
w s
omeo
ne p
erso
nally
who
star
ted
a bu
sine
ss in
the
past
2 y
ears
.
Goo
d st
art u
p op
port
uniti
es in
the
next
six
mon
ths
Hav
e th
e kn
owle
dge,
ski
ll an
dex
peri
ence
req
uire
d to
sta
rt a
new
bus
ines
s
Fear
of
failu
re p
reve
ntin
g fr
omst
artin
g a
busi
ness
Bus
ines
s as
a g
ood
care
erch
oice
Tho
se s
ucce
ssfu
l at s
tart
ing
ane
w b
usin
ess
have
a h
igh
leve
lof
sta
tus
and
resp
ect
Seen
sto
ries
in th
e pu
blic
med
iaab
out s
ucce
ssfu
l new
bus
ines
ses
Appendix 2: Various tables describing the change invarious entrepreneurial measures from 2010 to 2011.
43

Figure 16: Entrepreneurial attitudes in Pakistan (%age FEMALE respondents aged 18 - 64 expressing an opinion and agreeingwith the statement)
90 .0%80 .0%70.0%60 .0%50 .0%40 .0%30.0%20 .0%10 ..0%
0 .0%
Kno
w s
omeo
ne p
erso
nally
who
star
ted
a bu
sine
ss in
the
past
2 ye
ars.
Goo
d st
art u
p op
port
uniti
es in
the
next
six
mon
ths
Hav
e th
e kn
owle
dge,
ski
ll an
dex
peri
ence
req
uire
d to
sta
rt a
new
bus
ines
s
Fear
of
failu
re p
reve
ntin
g fr
omst
artin
g a
busi
ness
Bus
ines
s as
a g
ood
care
erch
oice
Tho
se s
ucce
ssfu
l at s
tart
ing
ane
w b
usin
ess
have
a h
igh
leve
lof
sta
tus
and
resp
ect
Seen
sto
ries
in th
e pu
blic
med
iaab
out s
ucce
ssfu
l new
bus
ines
ses
2010
2011
Figure 17: Perceptions of entrepreneurship among non entrepreneurially active working age population towards entrepreneurshipin various provinces of Pakistan (Know someone personally who started a business in the past 2 years.)
60 .0%
50 .0%
40 .0%
30.0%
20 .0%
10 ..0%
0 .0%
Sindh Punjab Baluchistan Khyber Pakhtoonkhowa
2010
2011
44
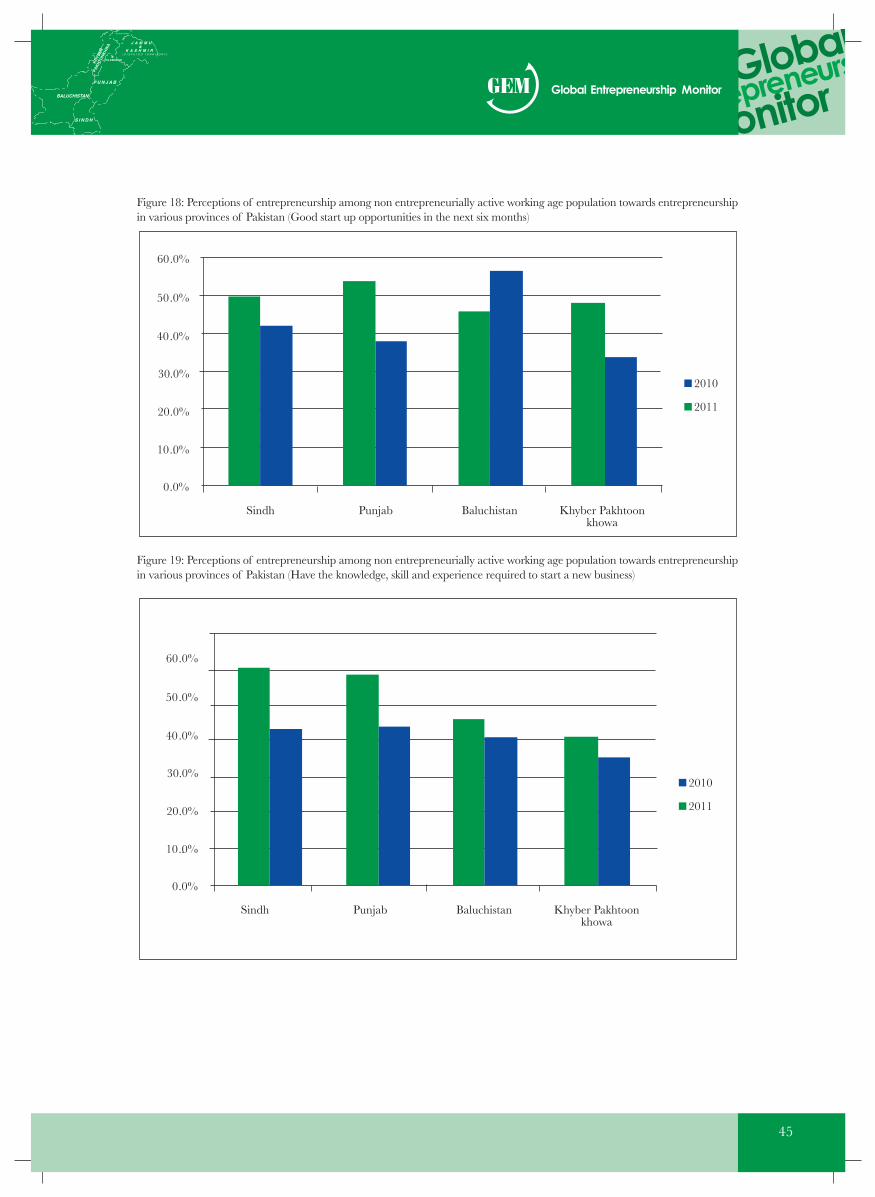
Figure 18: Perceptions of entrepreneurship among non entrepreneurially active working age population towards entrepreneurshipin various provinces of Pakistan (Good start up opportunities in the next six months)
Figure 19: Perceptions of entrepreneurship among non entrepreneurially active working age population towards entrepreneurshipin various provinces of Pakistan (Have the knowledge, skill and experience required to start a new business)
60 .0%
50 .0%
40 .0%
30.0%
20 .0%
10 ..0%
0 .0%
Sindh Punjab Baluchistan Khyber Pakhtoonkhowa
2010
2011
60 .0%
50 .0%
40 .0%
30.0%
20 .0%
10 ..0%
0 .0%
Sindh Punjab Baluchistan Khyber Pakhtoonkhowa
2010
2011
45
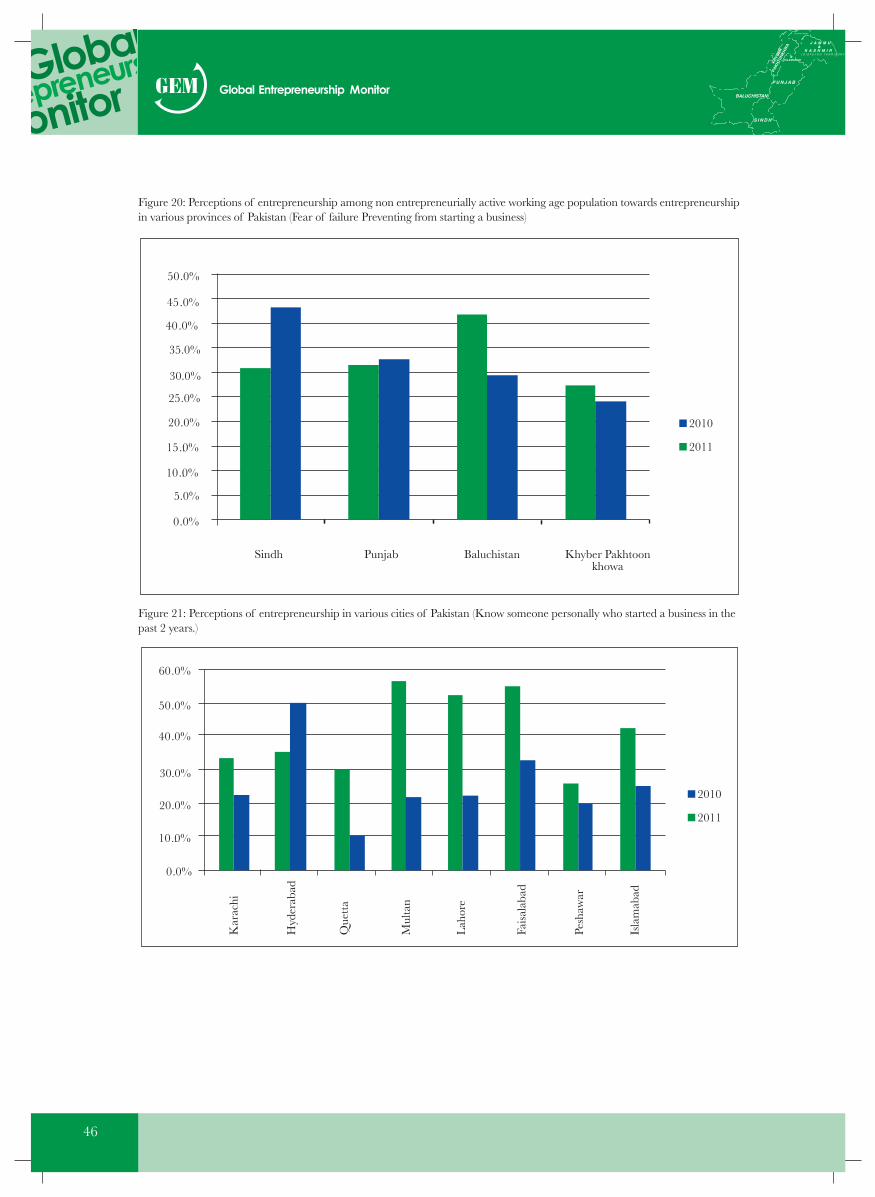
Figure 20: Perceptions of entrepreneurship among non entrepreneurially active working age population towards entrepreneurshipin various provinces of Pakistan (Fear of failure Preventing from starting a business)
Figure 21: Perceptions of entrepreneurship in various cities of Pakistan (Know someone personally who started a business in thepast 2 years.)
50 .0%
45 .0%
40 .0%
35.0%
20 .0%
10 ..0%
5.0%
30.0%
25 .0%
15 ..0%
0 .0%
Sindh Punjab Baluchistan Khyber Pakhtoonkhowa
2010
2011
50 .0%
40 .0%
30.0%
20 .0%
10 ..0%
0 .0%
60 .0%
2010
2011
46
Kar
achi
Hyd
erab
ad
Que
tta
Mul
tan
Lah
ore
Fais
alab
ad
Pesh
awar
Isla
mab
ad
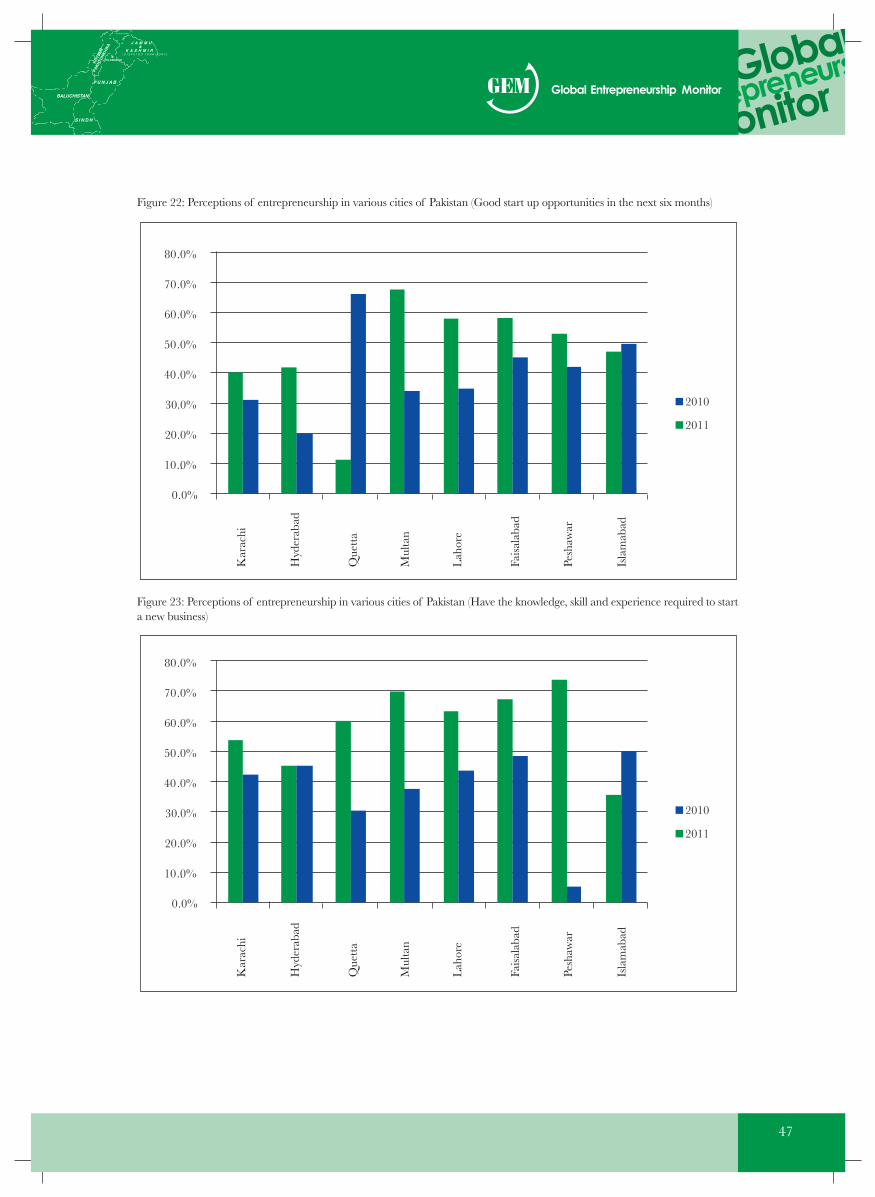
Figure 22: Perceptions of entrepreneurship in various cities of Pakistan (Good start up opportunities in the next six months)
Figure 23: Perceptions of entrepreneurship in various cities of Pakistan (Have the knowledge, skill and experience required to starta new business)
60 .0%
50 .0%
40 .0%
30.0%
20 .0%
10 ..0%
0 .0%
70 .0%
80 .0%
2010
2011
60 .0%
50 .0%
40 .0%
30.0%
20 .0%
10 ..0%
0 .0%
70 .0%
80 .0%
2010
2011
47
Kar
achi
Hyd
erab
ad
Que
tta
Mul
tan
Lah
ore
Fais
alab
ad
Pesh
awar
Isla
mab
ad
Kar
achi
Hyd
erab
ad
Que
tta
Mul
tan
Lah
ore
Fais
alab
ad
Pesh
awar
Isla
mab
ad
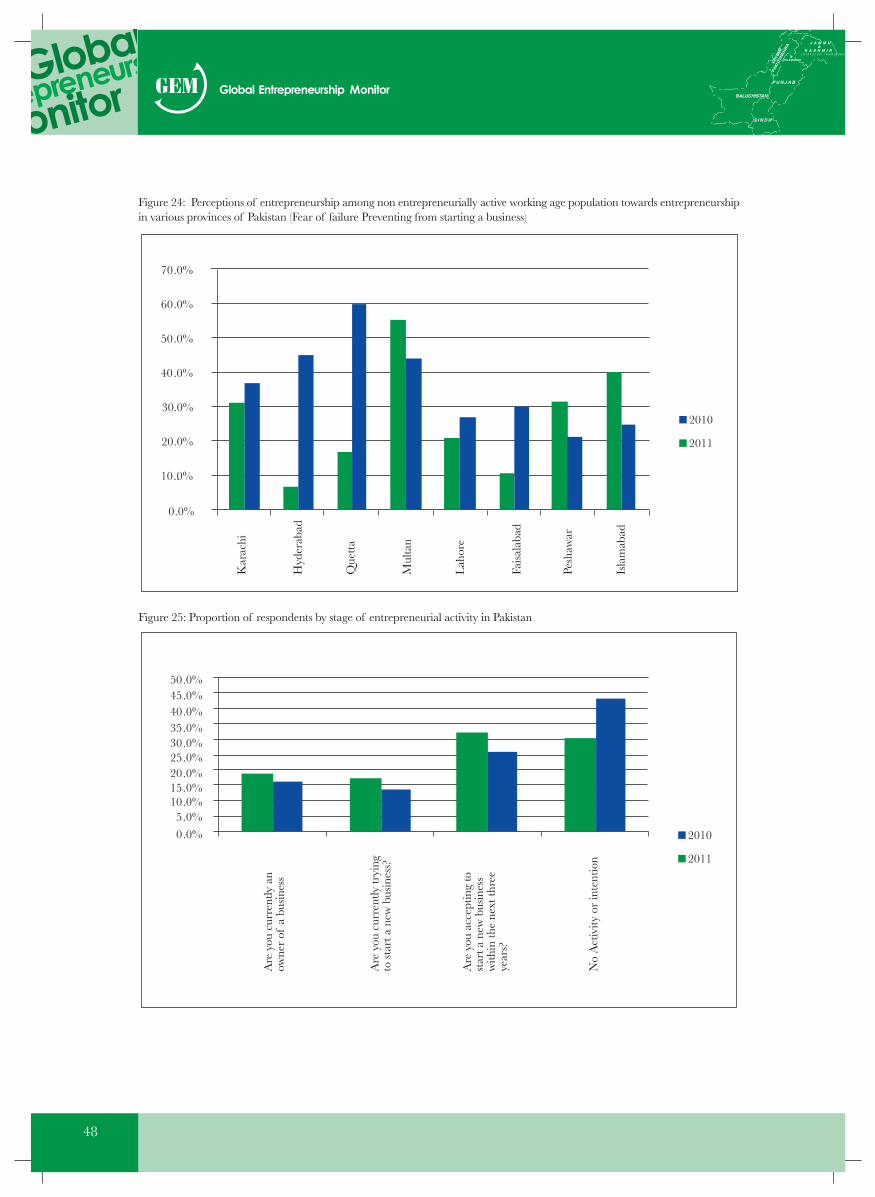
48
Figure 24: Perceptions of entrepreneurship among non entrepreneurially active working age population towards entrepreneurshipin various provinces of Pakistan (Fear of failure Preventing from starting a business)
Figure 25: Proportion of respondents by stage of entrepreneurial activity in Pakistan
0 .0%
60 .0%
50 .0%
40 .0%
30.0%
20 .0%
10 ..0%
70 .0%
2010
2011
50 .0%
2010
2011
Are
you
cur
rent
ly a
now
ner
of a
bus
ines
s
45 .0%40 .0%35 .0%30 .0%25 .0%20 .0%15 .0%10 .0%5 .0%0 .0%
Are
you
cur
rent
ly tr
ying
to s
tart
a n
ew b
usin
ess?
Are
you
acc
eptin
g to
star
t a n
ew b
usin
ess
with
in th
e ne
xt th
ree
year
s?
No
Act
ivity
or
inte
ntio
n
Kar
achi
Hyd
erab
ad
Que
tta
Mul
tan
Lah
ore
Fais
alab
ad
Pesh
awar
Isla
mab
ad

Figure 26: Different measures of entrepreneurial activity in various regions of Pakistan (Expects to start a business in the next 3years (future)
Figure 27: Different measures of entrepreneurial activity in various regions of Pakistan (Nascent Entrepreneurial Activity Rate(Actively involved in start-up effort, owner, no wages yet)
Sindh Punjab Baluchistan Khyber Pakhtoonkhowa
2010
2011
45
40
35
30
25
20
15
10
5
0
Sindh Punjab Baluchistan Khyber Pakhtoonkhowa
2010
2011
30
25
20
15
10
5
0
49

50
Figure 28: Different measures of entrepreneurial activity in various regions of Pakistan (New Business Owner-Manager Rate(Manages a business that is up to 42 months old)
Figure 29: Different measures of entrepreneurial activity in various regions of Pakistan (Nascent + New Business Owner ManagerRate)
Sindh Punjab Baluchistan Khyber Pakhtoonkhowa
2010
2011
3.5
3
2.5
2
1.5
1
0.5
0
Sindh Punjab Baluchistan Khyber Pakhtoonkhowa
2010
2011
35
30
25
20
15
10
0
5
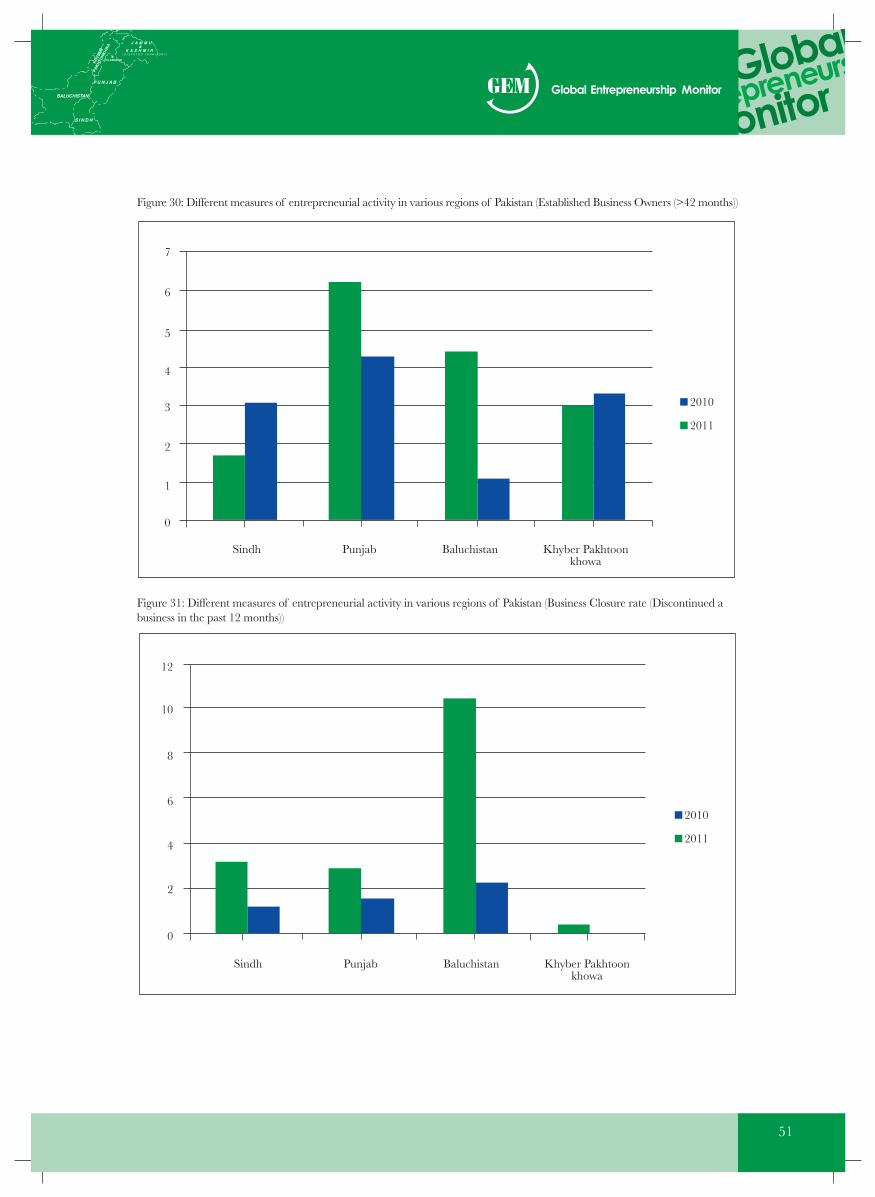
51
Figure 30: Different measures of entrepreneurial activity in various regions of Pakistan (Established Business Owners (>42 months))
Figure 31: Different measures of entrepreneurial activity in various regions of Pakistan (Business Closure rate (Discontinued abusiness in the past 12 months))
Sindh Punjab Baluchistan Khyber Pakhtoonkhowa
2010
2011
7
6
5
4
3
2
1
0
Sindh Punjab Baluchistan Khyber Pakhtoonkhowa
2010
2011
12
10
8
6
4
0
2
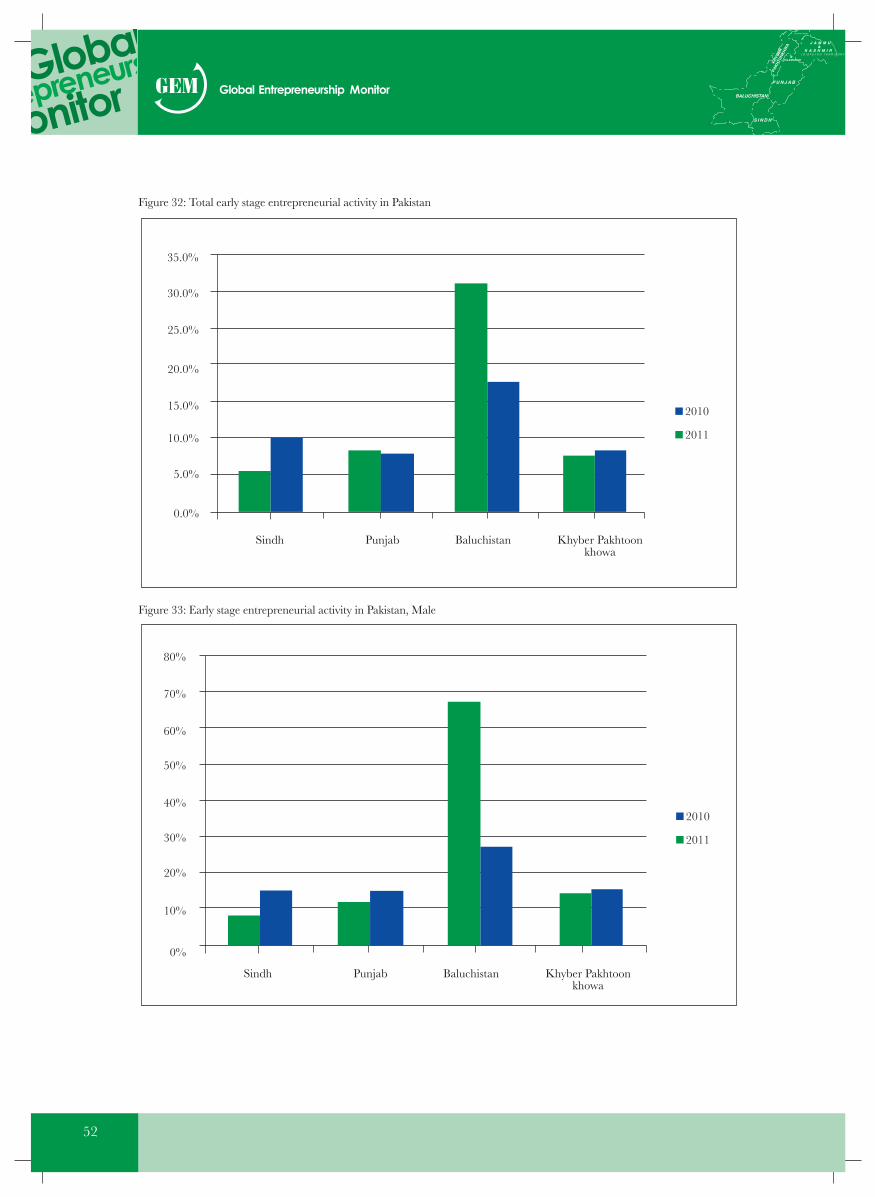
Figure 32: Total early stage entrepreneurial activity in Pakistan
Figure 33: Early stage entrepreneurial activity in Pakistan, Male
Sindh Punjab Baluchistan Khyber Pakhtoonkhowa
2010
2011
35.0%
30.0%
25.0%
20.0%
15.0%
10.0%
5.0%
0.0%
Sindh Punjab Baluchistan Khyber Pakhtoonkhowa
2010
2011
80%
70%
60%
50%
40%
30%
20%
10%
0%
52

53
Figure 34: Early stage entrepreneurial activity in Pakistan: Female
Figure 35: Total early stage Entrepreneurial Activity in Pakistan Regions based on opportunity entrepreneurship: Male
Sindh Punjab Baluchistan Khyber Pakhtoonkhowa
2010
2011
12.0%
10.0%
8.0%
6.0%
4.0%
2.0%
0.0%0.0%
Sindh Punjab Baluchistan Khyber Pakhtoonkhowa
2010
2011
45.00%
40.00%
35.00%
30.00%
25.00%
20.00%
15.00%
10.00%
5.00%
0.00%

Figure 36: Total early stage Entrepreneurial Activity in Pakistan Regions based on opportunity entrepreneurship: Female
Figure 37: Total early stage Entrepreneurial Activity in Pakistan Regions based on necessity entrepreneurship: Male
Sindh Punjab Baluchistan Khyber Pakhtoonkhowa
2010
2011
2.50%
2.00%
1.50%
1.00%
0.50%
0.0%0.0%
Sindh Punjab Baluchistan Khyber Pakhtoonkhowa
2010
2011
30.00%
25.00%
20.00%
15.00%
10.00%
5.00%
0.00%
54

55
Figure 38: Total early stage Entrepreneurial Activity in Pakistan Regions based on necessity entrepreneurship: Female
Sindh Punjab Baluchistan Khyber Pakhtoonkhowa
2010
2011
2.50%
2.00%
1.50%
1.00%
0.50%
0.0%0.0%
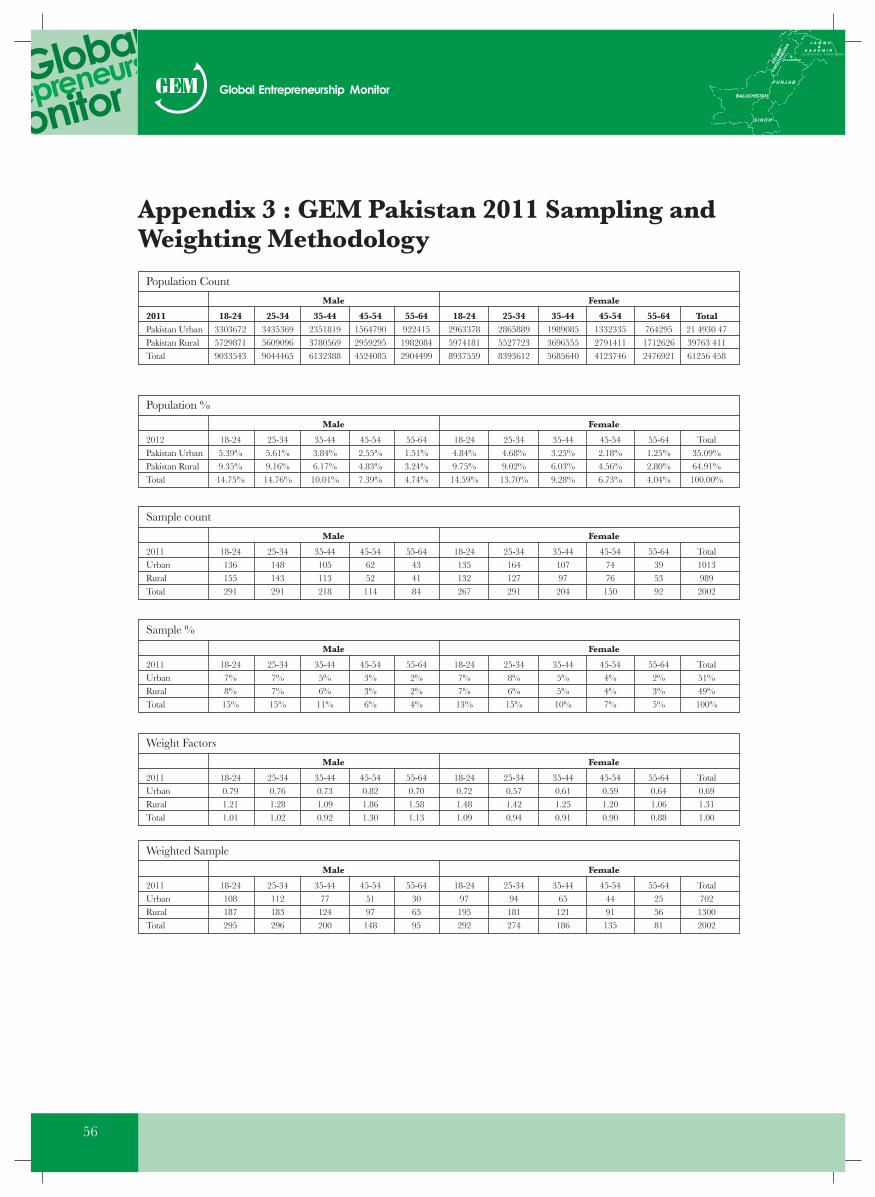
56
Population Count
2011 18-24 25-34 35-44 45-54 55-64 18-24 25-34 35-44 45-54 55-64 TotalPakistan Urban 3303672 3435369 2351819 1564790 922415 2963378 2865889 1989085 1332335 764295 21 4930 47Pakistan Rural 5729871 5609096 3780569 2959295 1982084 5974181 5527723 3696555 2791411 1712626 39763 411Total 9033543 9044465 6132388 4524085 2904499 8937559 8393612 5685640 4123746 2476921 61256 458
Male Female
Population %
2012 18-24 25-34 35-44 45-54 55-64 18-24 25-34 35-44 45-54 55-64 TotalPakistan Urban 5.39% 5.61% 3.84% 2.55% 1.51% 4.84% 4.68% 3.25% 2.18% 1.25% 35.09%Pakistan Rural 9.35% 9.16% 6.17% 4.83% 3.24% 9.75% 9.02% 6.03% 4.56% 2.80% 64.91%Total 14.75% 14.76% 10.01% 7.39% 4.74% 14.59% 13.70% 9.28% 6.73% 4.04% 100.00%
Male Female
Sample count
2011 18-24 25-34 35-44 45-54 55-64 18-24 25-34 35-44 45-54 55-64 TotalUrban 136 148 105 62 43 135 164 107 74 39 1013Rural 155 143 113 52 41 132 127 97 76 53 989Total 291 291 218 114 84 267 291 204 150 92 2002
Male Female
Sample %
2011 18-24 25-34 35-44 45-54 55-64 18-24 25-34 35-44 45-54 55-64 TotalUrban 7% 7% 5% 3% 2% 7% 8% 5% 4% 2% 51%Rural 8% 7% 6% 3% 2% 7% 6% 5% 4% 3% 49%Total 15% 15% 11% 6% 4% 13% 15% 10% 7% 5% 100%
Male Female
Weight Factors
2011 18-24 25-34 35-44 45-54 55-64 18-24 25-34 35-44 45-54 55-64 TotalUrban 0.79 0.76 0.73 0.82 0.70 0.72 0.57 0.61 0.59 0.64 0.69Rural 1.21 1.28 1.09 1.86 1.58 1.48 1.42 1.25 1.20 1.06 1.31Total 1.01 1.02 0.92 1.30 1.13 1.09 0.94 0.91 0.90 0.88 1.00
Male Female
Weighted Sample
2011 18-24 25-34 35-44 45-54 55-64 18-24 25-34 35-44 45-54 55-64 TotalUrban 108 112 77 51 30 97 94 65 44 25 702Rural 187 183 124 97 65 195 181 121 91 56 1300Total 295 296 200 148 95 292 274 186 135 81 2002
Male Female
Appendix 3 : GEM Pakistan 2011 Sampling andWeighting Methodology
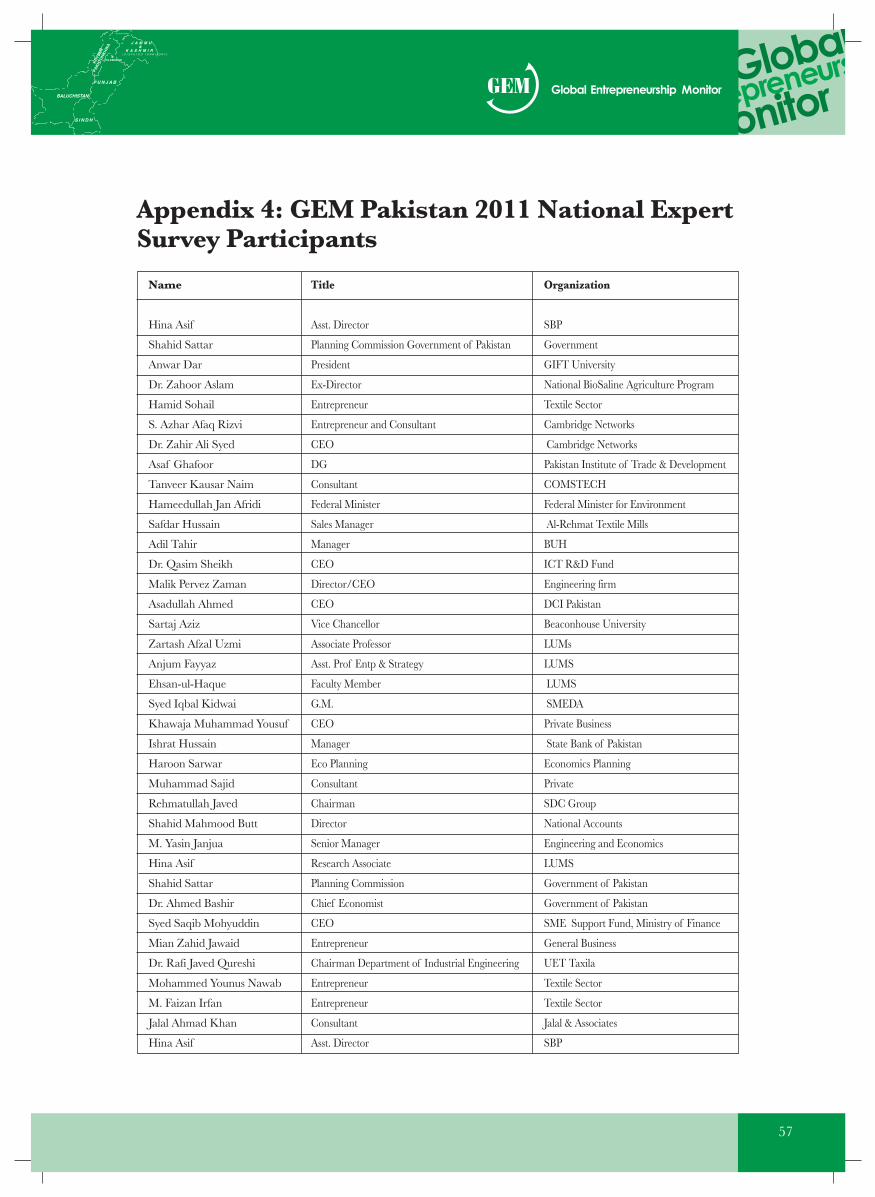
57
Appendix 4: GEM Pakistan 2011 National ExpertSurvey Participants
Name
Hina Asif
Shahid Sattar
Anwar Dar
Dr. Zahoor Aslam
Hamid Sohail
S. Azhar Afaq Rizvi
Dr. Zahir Ali Syed
Asaf Ghafoor
Tanveer Kausar Naim
Hameedullah Jan Afridi
Safdar Hussain
Adil Tahir
Dr. Qasim Sheikh
Malik Pervez Zaman
Asadullah Ahmed
Sartaj Aziz
Zartash Afzal Uzmi
Anjum Fayyaz
Ehsan-ul-Haque
Syed Iqbal Kidwai
Khawaja Muhammad Yousuf
Ishrat Hussain
Haroon Sarwar
Muhammad Sajid
Rehmatullah Javed
Shahid Mahmood Butt
M. Yasin Janjua
Hina Asif
Shahid Sattar
Dr. Ahmed Bashir
Syed Saqib Mohyuddin
Mian Zahid Jawaid
Dr. Rafi Javed Qureshi
Mohammed Younus Nawab
M. Faizan Irfan
Jalal Ahmad Khan
Hina Asif
Title
Asst. Director
Planning Commission Government of Pakistan
President
Ex-Director
Entrepreneur
Entrepreneur and Consultant
CEO
DG
Consultant
Federal Minister
Sales Manager
Manager
CEO
Director/CEO
CEO
Vice Chancellor
Associate Professor
Asst. Prof Entp & Strategy
Faculty Member
G.M.
CEO
Manager
Eco Planning
Consultant
Chairman
Director
Senior Manager
Research Associate
Planning Commission
Chief Economist
CEO
Entrepreneur
Chairman Department of Industrial Engineering
Entrepreneur
Entrepreneur
Consultant
Asst. Director
Organization
SBP
Government
GIFT University
National BioSaline Agriculture Program
Textile Sector
Cambridge Networks
Cambridge Networks
Pakistan Institute of Trade & Development
COMSTECH
Federal Minister for Environment
Al-Rehmat Textile Mills
BUH
ICT R&D Fund
Engineering firm
DCI Pakistan
Beaconhouse University
LUMs
LUMS
LUMS
SMEDA
Private Business
State Bank of Pakistan
Economics Planning
Private
SDC Group
National Accounts
Engineering and Economics
LUMS
Government of Pakistan
Government of Pakistan
SME Support Fund, Ministry of Finance
General Business
UET Taxila
Textile Sector
Textile Sector
Jalal & Associates
SBP
58
Appendix 5: The Center for EntrepreneurialDevelopment (CED - IBA)The Centre for Entrepreneurial Development at IBA has been recently created to promote entrepreneurship in the country. Theobjective of CED is to create wealth and value for Pakistan by promoting entrepreneurship and helping entrepreneurs to buildsuccessful businesses by helping them to develop the required entrepreneurial talent and skills and to network with the right businessleaders, mentors and investors. IBA CED has partnered with Babson Business School, U.S. for faculty development and exchange.
The CED at IBA aims to become a world-class center to promote entrepreneurship and foster a new culture of enterprise inPakistan. The mission of CED is to be a leader in training, nurturing, advocacy and research on entrepreneurship that advancesthe creation, growth and success of new, innovative enterprises in Pakistan. The emphasis will be to enable new generations ofPakistani entrepreneurs to translate their ideas into new business ventures. The CED will be creating new companies that addsubstantial jobs, incomes and revenues to the Pakistani economy. A new program, BBA in entrepreneurship has been initiated withthe aim of producing entrepreneurs and managers with an entrepreneurial mindset.
The various functional areas of CED are as follows:
Education and TrainingThe Education and Training component is focused on promotional seminars as well as efforts to popularize entrepreneurship andreduce societal biases to promote entrepreneurship as a career option. It will help build linkages and networks with stakeholdersin the enterprise ecosystem. Short duration workshops and training programs are being conducted in addition to a full time BBAin Entrepreneurship Program which started in 2011. An MBA in Entrepreneurship is also on the plan and will be offered in thenear future.
ResearchThe Research component is focused on developing case studies on Pakistani entrepreneurs and investigating various challengesfaced by them simultaneously studying key success factors among the successful ventures. Various areas identified for research areas follow:
● Key success factors for Pakistani new businesses● Family business: Issues and opportunities● Agriculture business opportunities in Pakistan● Technology Entrepreneurship● Women entrepreneurship● Social Entrepreneurship
Entrepreneurship Advisory ServicesThis component is focused on helping with business idea generation, support for commercializing the ideas forming a company,obtaining intellectual property rights (IPR), and facilitating advisory services such as access to finance. CED provides these serviceswith the help of existing service providers like the Small and Medium Enterprise Development Authority (SMEDA), SME banksand other investors. CED has also established a business incubator to support the young entrepreneurs.
The student entrepreneurs also work as individuals and teams to help local businesses to solve their problems. This involves theirengagement on as needed basis in areas like market analysis, assessment of commercial potential for new technologies, new productlaunches and feasibility studies. CED has also initiated nationwide student entrepreneurship promotion activities like INVENT(business plan activity), startup weekend with the help of Kauffman foundation, SPARK, Entrepreneurs Club, Guest speaker seriesand Women Entrepreneurs Club etc.
Women entrepreneurship is also an important area for the CED due to the low level of women entrepreneurship in Pakistan.Women focused programs and CED activities on women's entrepreneurship are also being conducted.
In addition to this CED IBA has partnered with universities from all over Pakistan to make a consortium of universities to worktogether to promote entrepreneurship in Pakistan. The partner universities are NED University of Engineering and Technology,KHI, Indus Valley School of Arts, IBA Sukkur, GIFT University, Gujranwala, BUITMS, Baluchistan University of InformationTechnology and Management Sciences, NUST, Islamabad and UET Peshawar.
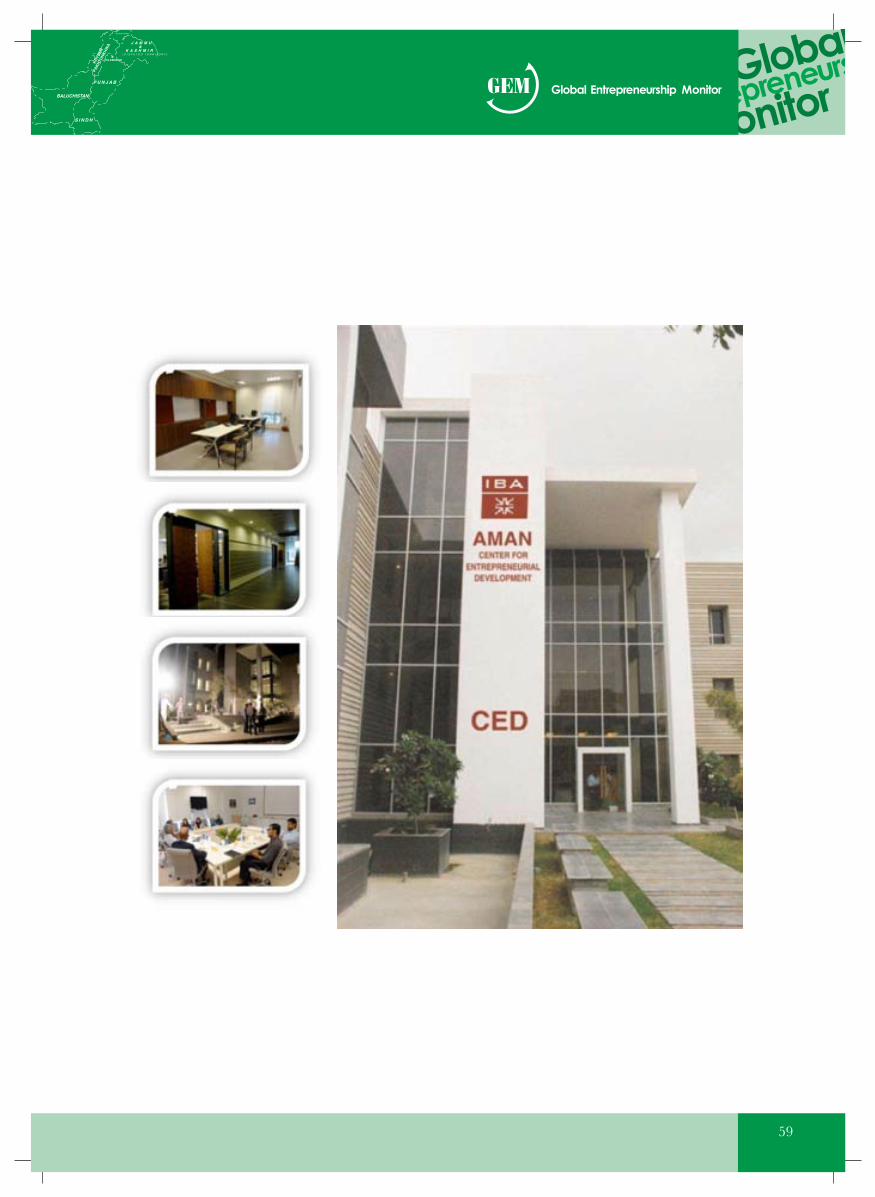
59
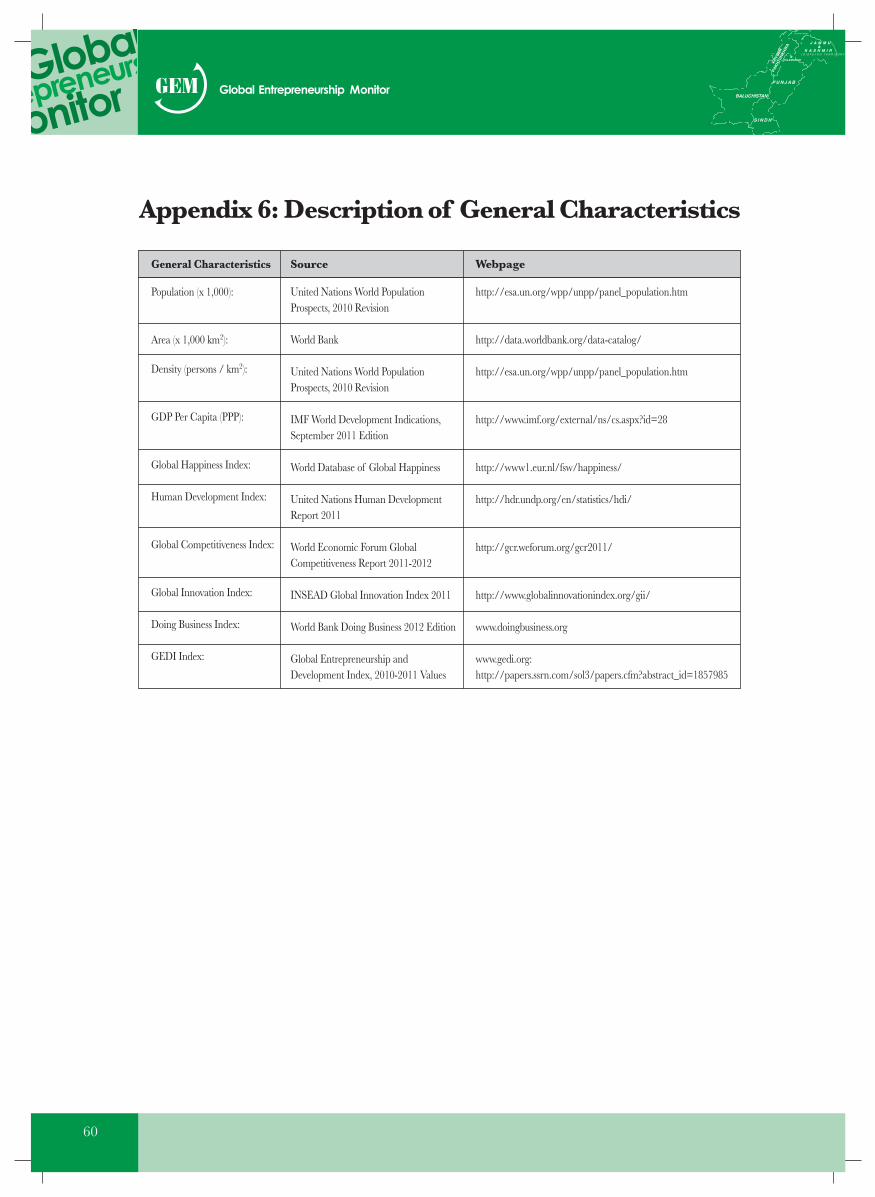
60
Appendix 6: Description of General Characteristics
Population (x 1,000):
Area (x 1,000 km2):
Density (persons / km2):
GDP Per Capita (PPP):
Global Happiness Index:
Human Development Index:
Global Competitiveness Index:
Global Innovation Index:
Doing Business Index:
GEDI Index:
United Nations World PopulationProspects, 2010 Revision
World Bank
United Nations World PopulationProspects, 2010 Revision
IMF World Development Indications,September 2011 Edition
World Database of Global Happiness
United Nations Human DevelopmentReport 2011
World Economic Forum GlobalCompetitiveness Report 2011-2012
INSEAD Global Innovation Index 2011
World Bank Doing Business 2012 Edition
Global Entrepreneurship andDevelopment Index, 2010-2011 Values
http://esa.un.org/wpp/unpp/panel_population.htm
http://data.worldbank.org/data-catalog/
http://esa.un.org/wpp/unpp/panel_population.htm
http://www.imf.org/external/ns/cs.aspx?id=28
http://www1.eur.nl/fsw/happiness/
http://hdr.undp.org/en/statistics/hdi/
http://gcr.weforum.org/gcr2011/
http://www.globalinnovationindex.org/gii/
www.doingbusiness.org
www.gedi.org:http://papers.ssrn.com/sol3/papers.cfm?abstract_id=1857985
General Characteristics Source Webpage