container terminal operators article type: research …
TRANSCRIPT

Elsevier Editorial System(tm) for Transportation Research Part A: Policy and Practice Manuscript Draft Manuscript Number: Title: A THEORETICAL FRAMEWORK FOR THE EVALUATION OF COMPETITION BETWEEN CONTAINER TERMINAL OPERATORS Article Type: Research Paper Section/Category: Keywords: container terminal; port competition; port competitiveness; port complementarity; product differentiation; oligopoly Corresponding Author: Dr Kevin Cullinane, Corresponding Author's Institution: University of Newcastle First Author: Wei Yim Yap Order of Authors: Wei Yim Yap; Jasmine Lam; Kevin Cullinane Manuscript Region of Origin: Abstract: This paper presents a generally applicable framework for the analysis of potential competitive strategies and associated expected payoffs in the container terminal industry. The framework is based on the integration of Bowley's linear model of aggregate demand of product differentiation with Porter's "Diamond" model. It focuses on the number of containers handled, prices charged and profits earned to analyse a variety of strategies that could be employed by container terminal operators to enhance their competitive position. The findings suggest that strategies to build complementary relationships and stimulate greater demand are more desirable than alternatives because they generate benefits that accrue to the entire industry. Conversely, strategies that are intended to raise entry barriers, employ strategic pricing

mechanisms and/or involve collusion are found to lead to the formation of insular clusters and retard competitive advantage in the long run.

A THEORETICAL FRAMEWORK FOR THE EVALUATION OF COMPETITION BETWEEN CONTAINER TERMINAL OPERATORS*
Wei Yim YAP
Maritime and Port Authority of Singapore 460 Alexandra Road #19-00 PSA Building
Singapore 119963 Email: [email protected]
Tel: (65) 6375 1623 Fax: (65) 6375 1652
Jasmine S.L. LAM
Maritime Research Centre School of Civil and Environmental Engineering
Nanyang Technological University, 50 Nanyang Avenue Singapore 639798
Email: [email protected] Tel: (65) 6790 5276 Fax: (65) 6791 0676
Prof. Kevin CULLINANE**
Chair in Marine Transport and Management School of Marine Science & Technology
Armstrong Building University of Newcastle,
Newcastle-upon-Tyne NE1 7RU United Kingdom
Email: [email protected] Tel: (44) 191 222 6218 Fax: (44) 191 222 5491
* The authors would like to stress that the views presented in this work do not
represent those of their respective organizations. ** Corresponding author
Manuscript

2
A THEORETICAL FRAMEWORK FOR THE EVALUATION OF COMPETITION BETWEEN CONTAINER TERMINAL OPERATORS
Abstract
This paper presents a generally applicable framework for the analysis of potential competitive strategies and associated expected payoffs in the container terminal industry. The framework is based on the integration of Bowley’s linear model of aggregate demand of product differentiation with Porter’s “Diamond” model. It focuses on the number of containers handled, prices charged and profits earned to analyse a variety of strategies that could be employed by container terminal operators to enhance their competitive position. The findings suggest that strategies to build complementary relationships and stimulate greater demand are more desirable than alternatives because they generate benefits that accrue to the entire industry. Conversely, strategies that are intended to raise entry barriers, employ strategic pricing mechanisms and/or involve collusion are found to lead to the formation of insular clusters and retard competitive advantage in the long run. Keywords: container terminal, port competition, port competitiveness, port complementarity, product differentiation, oligopoly June 2005

3
1. Introduction The vast majority of international trade, both in tonnage and value terms, continues to be
carried in waterborne transport. As a result, the competitiveness of a port exerts an
important influence on an entire region’s socio-economic viability and propensity for
growth and development. In 2000, seaborne trade reached 5.9 billion tons, an increase of
19% over 1997 (UNCTAD, 2002). In the same period, as Table 1 shows, the share of
merchandise trade in the ten largest trading nations/regions rose by 16.3% to reach 7.3
trillion USD.
INSERT TABLE 1 Every port serves a hinterland which, according to van Klink and van der Berg (1998)
can be defined as the “…continental area of origin and destination of traffic flows
through a port (i.e.) the interior region served by the port.” The irrefutable fact, however,
that every port of origin requires a port of destination implies that a port’s hinterland
could be extended to include an area covered by what may be considered to be the
hinterland of (an)other port(s).
Haezendonck and Notteboom (2002) noted that a port’s productivity, its actual and
potential cargo generating ability, its reputation and reliability, together with the
accessibility of a port’s hinterland, were all critical factors in determining a port’s
competitiveness. Robinson (2002) also suggests that ports form parts of value-driven
supply chains that cross and link hinterlands and that, in consequence, it is vitally
important for the providers of port or terminal services to offer sustainable value to their
users as compared against competing value-driven supply chains that encompass different

4
ports or terminals. Hence, through the transmission medium of the supply chain systems
that incorporate a particular port as a node, any efficiency gains generated within that
port (and the enhanced competitiveness that this produces) yields cascading benefits for
the hinterlands of both origin and destination ports (Haynes, Hsing and Stough, 1997).
A comprehensive structure of the determinants of a port’s competitiveness based on
Porter’s “Diamond” model (1990) was summarised in the framework provided by
Rugman and Verbeke (1993). Using Porter’s hypothesis, it could be said that firms, rather
than ports, compete in international markets. In this context, the term ‘firm’ refers to the
container terminal operators that work within any given port. Rugman and Verbeke
(1993) found six determinants that were deemed to influence the competitive advantage
of terminal operators. These were:
• factor conditions - a port’s position in respect of its input factors of production;
• demand conditions - the underlying nature of the demand for the port’s services that it
offers;
• related and supporting industries - the presence or absence of internationally
competitive suppliers and port-related industries located either within the confines of
the port itself or within its hinterland;
• firm strategy, structure and rivalry - the conditions influencing the creation,
organisation, management and rivalry of companies within the port;
• chance events - developments, circumstances or happenings that are beyond the
control of the container terminal operators within the port, and;
• role of the government – the level and form of support, or otherwise, for the port
sector in general and for the specific port in particular

5
The corollary of the analysis by Rugman and Verbeke (1993) is that container terminal
operators within a port should capitalise on knowledge of these determinants to gain and
sustain a competitive advantage by seeking to expand and entrench the captive hinterland
of the port, as well as specifically their own customer base within this hinterland.
Simultaneous attempts should be made to erode the customer base of their competitors
(that could be located either within the same, or other, ports).
The wide spectrum of entities with which ports interact can be seen in the great diversity
of industry players that are associated with their various objectives, tools and possible
impacts (Heaver et al., 2000). However, the list of potential interaction could be extended
beyond simply the players, strategies, objectives and payoffs identified by Heaver et al
(2000).
In an effort to reap both economies of scale and scope, there has been a recent spate of
horizontal and vertical integration within the transport industry. The increasing
bargaining power of buyers and suppliers that this trend has brought about, together with
the footloose nature of cargo (i.e. the relative lack of customer loyalty amongst port
choice decision makers) has prompted Notteboom and Winkelmans (2001) to propose
that competitive advantage based on unique and resilient core competencies should be
developed.
Given this situation, the ultimate aim of this paper is to analyse a range of available
generic competitive strategies from the perspective of container terminal operators. The
strategies analysed are based on insights drawn from a general framework for

6
competition in an oligopolistic setting and are analysed within an integrated framework
that utilises the most salient features of Bowley’s product differentiation model (1924)
and the “Diamond” model of Porter (1990).
Section two of the paper reviews various models of oligopolistic competition, while the
formal analytical framework is presented in section three. This framework will then be
used to evaluate the impact of various competitive strategies in section four. Conclusions
are drawn in section five.
2. Literature Review Numerous studies have been undertaken to evaluate port competitiveness and the impact
of port competition in the container terminal industry. A significant amount of this
research effort has been dedicated to the study of port competitiveness and competition
through approaches revolving around routing strategy and the efficiency of transportation
networks, port productivity, and the consideration of shipper requirements (see Frankel,
1999; Notteboom et al., 2000; Baird, 2002; Cullinane, 2002; De and Ghosh, 2002;
Haralambides et al., 2002; Robinson, 2002; Zeng and Yang, 2002; Luo and Grigalunas,
2003; Sanchez et al., 2003; Tiwari et al., 2003; Veldman and Bückmann, 2003; Yap and
Lam, 2004).
Cluster analysis (De Langen, 2002), shift-share analysis (Notteboom and Winkelmans,
2001), value added concepts (Haezendonck, Coeck and Verbeke, 2000), the game-

7
theoretic approach (Flor and Defilippi, 2003), and the marginal cost pricing approach
(Haralambides, 2002) have all been applied to evaluate port competitiveness.
The structure of the container terminal operating industry is generally characterised in
terms of one dominant player within a port, plus a few other smaller operators. The
veracity of this generalisation can be gleaned from Table 2, which shows the share of
containers handled by the largest terminal operator within the world’s major container
ports.
INSERT TABLE 2
In spite of having one dominant terminal operator in most of the major container ports,
overlapping hinterlands has meant that operators increasingly have to compete not only
with other operators located within the same port, but also with operators located in other
ports (Cullinane and Khanna, 2000; van de Voorde and Winkelmans, 2002). The higher
degree of interdependence among these terminal operators creates a situation of
oligopolistic competition where they can either engage in intense competition or
cooperate to maximise returns (Shepherd, 1997). A wide range of behaviour can result
from oligopoly situations due to the extensive number of permutations possible in the
structure–conduct–performance paradigm encapsulated by Scherer (1970) that is defined
by an indeterminate outcome (von Neumann and Morgenstern, 1944; Bain, 1956;
Chamberlain, 1962).
Theoretical research in this field can be characterised mainly as that based primarily on
quantity (Cournot, 1838) and that on price (Bertrand, 1883). Cournot’s original quantity-
setting model has since been expanded to account for limiting behaviour (Ruffin, 1971),

8
static game-theoretic considerations (Friedman, 1986; Gibbons, 1992), conjectural
variations (Bramness, 1979), cooperation (Bresnahan and Salop, 1986), product
differentiation (Bowley, 1924; Shubik and Levitan, 1980), and capacity constraints
(Kreps and Scheinkman, 1983; Maggi, 1996). Kreps and Scheinkman (1983) and Maggi
(1996) also developed behavioural models where capacity constraints exist in Bertrand’s
price-setting situation. Other methods used to analyse oligopolistic competition included
uncertain demand (Klemperer and Meyer, 1988), spatial differentiation (Hotelling, 1952;
Economides, 1984; Shaked, 1982) and income distribution (Shaked and Sutton, 1982).
This great variety of available methodologies and approaches all come with their
respective strengths and deficiencies. Nonetheless, the model that is finally selected must
allow for the salient attributes that characterise the oligopolistic competition that prevails
in the container terminal industry. Potentially, this form of competition may exist within
a single port, but certainly does exist within the overlapping hinterlands that have become
a fundamental characteristic of the contemporary ports industry.
One such model is Bowley’s linear model of aggregate demand and product
differentiation (Bowley, 1924). With relative ease, the model can be used to distil the key
implications of, or likely competitive outcomes from, a variety of strategies that may be
adopted. The model can also be expanded to cater for cooperative behaviour, capacity
constraints and a cost component. Herein, the Bowley model is melded with Porter’s
“Diamond” model (Porter, 1990) to produce a framework for the analysis of the strategies
employed by container terminal operators to enhance their competitive position.

9
3. A Framework for Analysing Container Port/Terminal Competition Consider Bowley’s model of product differentiation under a simultaneous quantity setting
for two container terminal operators. Total container throughput in terms of Twenty-foot
Equivalent Units (TEUs) handled in the market would be: Q = q1 + q2. The linear inverse
demand functions being:
P1 = a – b(q1 + θ q2) (1) and P2 = a – b(θq1 + q2) (2) ….for P1,P2,a,b >0, …where q1 denotes the TEUs handled by container terminal operator 1 (TO1); q2 denotes the TEUs handled by container terminal operator 2 (TO2); P1 denotes the price charged by TO1; P2 denotes the price charged by TO2; and θ denotes the coefficient of product differentiation where: 11 ≤≤− θ and: θ = 1 ⇒ TEUs handled by TO1 and TO2 are perfect substitutes; 0 < θ < 1 ⇒ TEUs handled by TO1 and TO2 are substitutes; θ = 0 ⇒ TEUs handled by TO1 and TO2 are independent in demand; -1 < θ < 0 ⇒ TEUs handled by TO1 and TO2 are complementary in demand; and θ = -1 ⇒ TEUs handled by TO1 and TO2 are perfect complements. Profits for TO1 and TO2 are thus represented by: π1 = aq1 – bq1
2 – bθq1q2 – c1q1 (3) and π2 = aq2 – bq2
2 – bθq1q2 – c2q2 (4) …where c1 and c2 denote the unit cost of supplying the product or service for TO1 and
TO2 respectively, with a > c1, c2. The cost component can be further distinguished
between fixed cost (denoted by the symbol “F”) and variable cost elements (denoted by
the symbol “c”). For simplicity, we consider the case where all costs are deemed to be
variable.
10
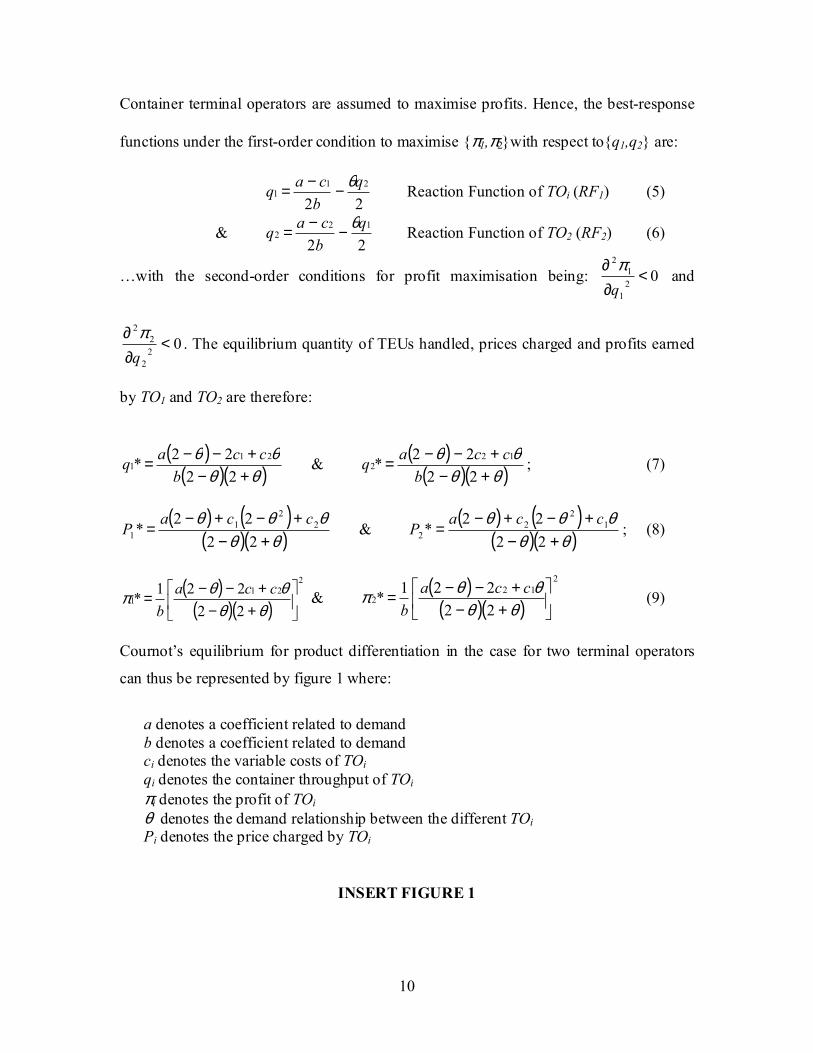
Container terminal operators are assumed to maximise profits. Hence, the best-response
functions under the first-order condition to maximise {π1,π2}with respect to{q1,q2} are:
22
211
qbcaq θ−−= Reaction Function of TOi (RF1) (5)
& 22
122
qbcaq θ−−= Reaction Function of TO2 (RF2) (6)
…with the second-order conditions for profit maximisation being: 021
12
<∂∂
qπ
and
022
22
<∂∂
qπ
. The equilibrium quantity of TEUs handled, prices charged and profits earned
by TO1 and TO2 are therefore:
( )
( )( )θθθθ
+−+−−=
2222* 21
1b
ccaq & ( )( )( )θθ
θθ+−
+−−=2222* 12
2b
ccaq ; (7)
( ) ( )
( )( )θθθθθ
+−+−+−
=22
22* 2
21
1cca
P & ( ) ( )
( )( )θθθθθ
+−+−+−
=2222
* 12
22
ccaP ; (8)
( )( )( )
221
122221*
+−
+−−=θθ
θθπ ccab
& ( )( )( )
212
222221*
+−
+−−=θθ
θθπ ccab
(9)
Cournot’s equilibrium for product differentiation in the case for two terminal operators
can thus be represented by figure 1 where:
a denotes a coefficient related to demand b denotes a coefficient related to demand ci denotes the variable costs of TOi qi denotes the container throughput of TOi πi denotes the profit of TOi θ denotes the demand relationship between the different TOi Pi denotes the price charged by TOi
INSERT FIGURE 1

11
For n ports, the inverse demand function for TOi (i = 1,…n) becomes:
+−= ∑
=
n
jjijii qqbaP
1
θ where i ≠ j for i,j = 1,…,n (10)
…and the reaction function of TOi becomes:
22
1∑
=−−
=
n
jjij
ii
q
bca
qθ
(11)
Solving for the reaction functions will yield the equilibrium output, prices and profits for
each container terminal operator. For the general case, we can include the following
variables:
n denotes the number of terminal operators (TOi) Fi denotes the fixed costs of TOi
The six determinants proposed in Porter’s model could either assist in the creation and
sustenance of competitive positions enjoyed by container terminal operators or,
alternatively, stifle and mitigate them (Porter, 1990). The model also stresses that the rate
of upgrading is contingent on the weakest link and that individual companies play the
most crucial role in building higher-order competitive advantages in an innovation-driven
economy. Combining Porter’s “Diamond” model with Bowley’s model of product
differentiation presents one way in which competitive advantages can be quantified,
measured and analysed in a holistic manner. Table 3 illustrates how these determinants
can be applied to the container terminal industry. The two models can be further
summarised into a general framework presented in figure 2 for analysing and assessing
competition between container terminal operators.
INSERT TABLE 3

12
INSERT FIGURE 2
The framework presented in figure 2 offers a means of ascertaining the impact of
competitive advantage. In the following section, this framework will be utilised to
analyse the impact of a number of potential strategies that may be used by container
terminal operators to advance their competitive position.
4. Competitive Strategies for Container Terminal Operators Container terminal operators, whether run by private or public entities, stand at the
forefront of competition between container ports. They have at their disposal a variety of
commercial and non-commercial tools to advance their competitive advantage. The
framework developed in section three will be used to demonstrate the impact of some
common strategies used by container terminal operators for such purposes. A theoretical
scenario of two competing container terminal operators is used to exemplify the
effectiveness of these strategies in terms of the number of TEUs handled, prices charged
and profits earned.
Strategy 1: Differentiate Demand Container terminal operators can boost their competitive position by pursuing the generic
strategy of differentiation. Applying the model of product differentiation developed in
section three, then in the case of two terminal operators, figure 3 shows the possible
solutions, E1 to E5, that can be obtained for all possible product differentiation scenarios,
as defined by: 11 ≤≤− θ .
INSERT FIGURE 3

13
Without any differentiation of the products and services offered by both container
terminal operators, the equilibrium solution is E1 where θ = 1. This coincides with
Cournot’s solution in figure 1. The presence of differentiation, i.e. 0 < θ < 1, will result in
a locus of solutions shown by the emboldened line identified as E2. The greater the
degree of differentiation (i.e. as θ → 0), solutions lie closer to E3 than to E1. For θ = 0,
the number of containers handled by both terminals become independent of each other,
resulting in a solution at point E3. Here, terminal operators might be tempted to maximise
profits by charging monopoly prices. Hence, container terminal operators can leverage on
their unique competencies within the six determinants to differentiate their products and
services against other competing value-driven supply chain systems. For instance,
profitable relationships can be forged along the vertical dimension with supplier and
related industries. Although greater differentiation can create opportunities for terminal
operators to monopolise their captive markets, it may also invite punitive regulatory
actions from governments. Nonetheless, differentiation does also offer the potential for
higher market output if the market is contestable (Baumol, Willig and Panzar, 1982).
Strategy 2: Building Complementary Demand
Referring to figure 3, building complementary relationships in demand can result in
output beyond the solution at E3. Containers handled by two terminals are
complementary in demand when a TEU handled by one terminal operator leads to an
increase in TEUs handled by another terminal operator. In the case where -1 < θ < 0, the
output is represented by the locus of solutions defined by E4. If an increase in TEUs
handled by one terminal operator results in an exactly equivalent increase in the TEUs

14
handled by the other terminal operator, i.e. θ = -1, the solution is denoted by E5. Unlike
strategy 1, the impact induced through the existence of complementary demand will
simultaneously boost TEUs handled, prices charged and profits earned for each operator.
Hence, terminal operators can make significant gains in terms of TEUs handled by
developing complementary relationships. The fact that one port needs another port offers
immediate opportunities for container terminal operators to capitalise upon. This
argument also lends support to the creation and entrenchment of hub status; whereby any
individual terminal operator located within a hub can stand to benefit from multiple pairs
of complementary relationships. This strategy should not be confused, however, with the
notion of cooperating to build collusive arrangements whereby a monopolistic outcome
reduces container throughput to below that of competitive output.
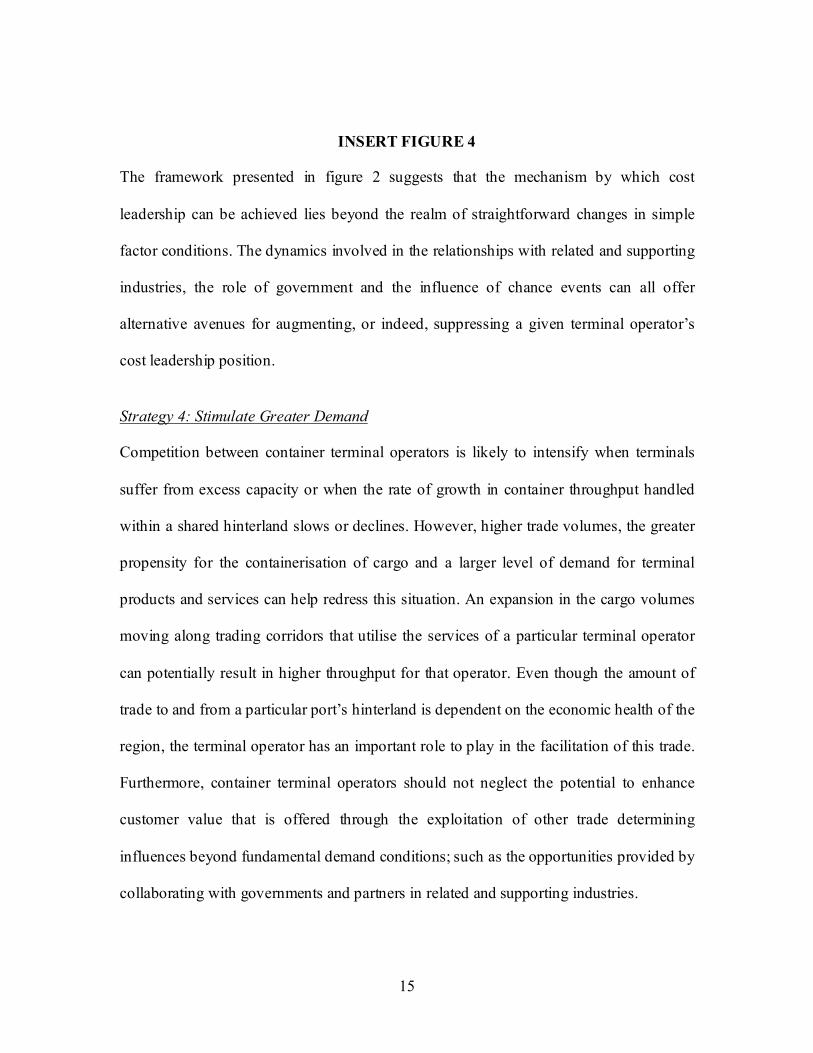
Strategy 3: Achieve Cost Leadership/ Cost Focus Another generic strategy available to container terminal operators is to boost their
competitive position by maintaining the same user value compared to competing terminal
operators, while achieving lower cost in the provision of the services they offer. The
impact of this strategy on equilibrium output can be shown by a fall in costs for TO1 (i.e.
a decrease in c1), or a rise in costs for TO2 (an increase in c2). With reference to the
competitive scenario (0 < θ ≤ 1) shown in figure 4, an increase in costs for TO2 is
reflected in the inward shift of RF2 to RF2’ while a fall in costs for TO1 is reflected in the
outward shift of RF1 to RF1’. The resulting shifts in the reaction functions yield three
potential equilibrium solutions; TO1 will stand to benefit most from E4 in terms of TEUs
handled and profits earned if it is able to lower its operating cost while TO2
simultaneously suffers from rising costs of operation.
15
INSERT FIGURE 4
The framework presented in figure 2 suggests that the mechanism by which cost
leadership can be achieved lies beyond the realm of straightforward changes in simple
factor conditions. The dynamics involved in the relationships with related and supporting
industries, the role of government and the influence of chance events can all offer
alternative avenues for augmenting, or indeed, suppressing a given terminal operator’s
cost leadership position.
Strategy 4: Stimulate Greater Demand
Competition between container terminal operators is likely to intensify when terminals
suffer from excess capacity or when the rate of growth in container throughput handled
within a shared hinterland slows or declines. However, higher trade volumes, the greater
propensity for the containerisation of cargo and a larger level of demand for terminal
products and services can help redress this situation. An expansion in the cargo volumes
moving along trading corridors that utilise the services of a particular terminal operator
can potentially result in higher throughput for that operator. Even though the amount of
trade to and from a particular port’s hinterland is dependent on the economic health of the
region, the terminal operator has an important role to play in the facilitation of this trade.
Furthermore, container terminal operators should not neglect the potential to enhance
customer value that is offered through the exploitation of other trade determining
influences beyond fundamental demand conditions; such as the opportunities provided by
collaborating with governments and partners in related and supporting industries.

16
INSERT FIGURE 5
INSERT FIGURE 6
An overall expansion in demand, as reflected in a shift to the right in the demand curve
for the services offered by terminal operators has the effect illustrated in figure 5 where
the number of TEUs handled by TO1 and TO2 rises to q1’ and q2’, respectively, as both
reaction functions shift to the right in response to the increase in overall demand. The
impact of this strategy is to enable each terminal operator to handle more TEUs, charge
higher prices and reap greater profits. Figure 6, in contrast, shows a situation where TO2
cannot respond to the growth in overall demand as it experiences a constraint in terminal
capacity at q2’. Hence, TO1 reaps the full benefit of the expansion in overall demand.
Strategy 5: Reduce the Elasticity of Demand
From the perspective of the determinants of demand, another strategy that terminal
operators can take advantage of is to attempt to influence the elasticity of demand for
container terminal services. As can be seen in table 4, Shepherd (1997) summarises the
factors affecting the elasticity of demand into those based on: the customer, technical
limits, competition and vertical conditions.
INSERT TABLE 4 Container terminal operators can work to avoid situations that result in higher price
elasticity of demand for the services they offer. Actions that lead to lower demand
elasticities include building customer loyalty, creating captive hinterlands, erecting entry
barriers and reducing buyer power. The impact of a lower price elasticity of demand

17
manifests itself in a shift to the right of the reaction functions of both terminal operators
as already shown in figure 5. In such a case, both terminal operators can thus handle more
TEUs and earn higher profits.
Strategy 6: Raise Entry Costs
The increasing complexity of container terminal operation has resulted in the emergence
of specialised international container terminal operating companies equipped with the
relevant financial, technological and managerial expertise to allow local ports to
overcome their various deficiencies. More stringent demands from both landward and
seaward port users have meant that terminals now need to address considerations beyond
the confines of the terminal itself. Amongst others, these include the efficiency, coverage
and accessibility of the hinterland transportation system, logistics and intermodal
capabilities, the impact on (or of) terminal operations of (or on) regional economic
performance, as well as ecological and environmental issues. These developments can
raise entry barriers for the container terminal operating industry.
Shepherd (1997) listed 22 barriers, classified as either exogenous or endogenous, that can
deter market entry by raising its costs, feasibility or speed. The presence of entry barriers
raises fixed costs, denoted by “F”, of the potential entrant. In a situation where there
exists a potential new entrant in the form of a third container terminal operator, the cost
component for TO3 will be represented by “c3 + F3” instead of “c3” as in the usual case.
With entry, the equilibrium output, price and profit of this operator will be lower vis-à-vis
the two incumbents, irrespective of the fact that the incumbents’ equilibrium output, price
and profit will also decline.

18
Strategy 7: Mergers and/or Acquisitions
Merger and acquisition strategies that result in a lower value of “n” (the number of
operators in the market) can be employed to boost commercial power, as well as reap
economies of scale and scope. These strategies can also be employed to increase stability
and reduce rivalry. Hence, apart from the potential benefit of lower costs, mergers with,
or acquisitions of, other terminal operators in the industry can lead to a lower number of
TEUs handled, in tandem with higher prices and higher profits if the market has low
contestability. However, such a strategy can attract unwanted and punitive regulatory
reprisals from governments that are understandably concerned with the welfare losses for
society and distributional inequities that increased concentration of the sector may bring
about.
Strategy 8: Acquiring Information Advantage
Understanding competitors can serve as a means of enhancing a container terminal
operator’s competitive advantage. Knowledge of markets served, customer profile,
productivity, hinterland network, key decision makers, financial strength and employee
morale can provide a variety of targets for competitive action. Having access to a greater
volume, or higher quality, of information sources than competitors can also offer
opportunities to capitalise on first-mover advantages to become, or entrench a position as,
the dominant market player. The success of such a strategy, however, is contingent on a
container terminal operator’s ability to recognise, capture, process and absorb this
information and then to take appropriate action on the basis of it.

19
The impact of information advantage is illustrated by applying Stackelberg’s quantity-
leadership model (Stackelberg, 1952). Consider a situation where TO1 has information
superiority over TO2 and has knowledge of how TO2 will react. Hence, TO1 will factor
TO2’s reaction function into its attempts at profit maximisation. Using the model of
product differentiation considered in section two, the respective TEUs handled, prices
charged and profits for TO1 and TO2 will be:
( )( )θθθθ
+−+−−
=222
2)2(* 21
1b
ccaq > ( )( )
( )( )θθθθθ
+−−−−+−
=224
)(222)(*
122
bcacaq ; (12)
( )422
* 211
θθ ccaP
++−= > ( )( )( ) ( )
( )( )θθθθθθ
+−−−−+−+
=224
2222*
2212
2ccaca
P ; (13)
( )[ ]( )( )θθ
θθπ+−
+−−=
22822
*2
211 b
cca & ( )( ) ( )( )( )
2
12
22 224
241*
+−−−−−
=θθ
θθπ cacab
(14)
…where c1 = c2 ⇒ π1 > π2.
The point of solution is shown in figure 7. However, the solution is unstable because it
will revert to the Cournot equilibrium if the market leader loses its information
advantage. The resulting impact on TO1 will be a reduction in its TEUs handled and its
profits. Prices charged by TO1 and TO2 will also increase. Nonetheless, the greater the
degree of differentiation the less critical is the impact of information advantage for TO1.
INSERT FIGURE 7
Strategy 9: Pricing Tools
Pricing strategies that can be used to boost competitive positions in the short run include
predatory pricing and price discrimination. TO1 engages in predatory pricing when it

20
reduces price to below TO2’s average cost in order to drive TO2 out of the market, even if
it has to suffer losses in the short run to do so. Once TO2 exits the market, TO1 will raise
its price to generate an overall positive economic profit after accounting for the losses
incurred during the predation period (Martin, 2002). In this case, P1 is used as a tool for
competition where TO1 sets P1 < c2. The impact of this strategy on TO1’s output and
profits are indeterminate as it depends on the degree of contestability in the market. In the
case of price discrimination, TO1 is able to maximise profits through the successful
segmentation of a market where there exists no opportunity for its customers to trade
between the various market segments. However, these strategies may also trigger
negative regulatory responses from governments who are concerned with efficiency
losses in the market.
Strategy 10: Collusion
Container terminal operators can engage in collusive arrangements to reduce market
output and raise prices. Whether tacit or overt, collusion can occur in a variety of
horizontal and vertical forms. In this case, the respective output, prices and profits for
TO1 and TO2 become:
bcaq2)1(
* 11
θ+−= &
bcaq2)1(
* 22
θ+−= ; (15)
( )θθ+
+++=12
)()(* 211
cacaP & ( ) ( ))1(2
* 122 θ
θ+
+++= cacaP ; (16)
( ) ( ) ( )( )
( )2211
21
114
1*
θθθπ+
−−−+−=
bcccaca
&
( ) ( ) ( )( )
( )2122
22
214
1*
θθθπ+
−−−+−=
bcccaca
(17)

21
This solution does not satisfy, however, the profit maximisation condition of MR1,2(q1,2)*
= MC1,2(q1,2)*. In fact, MR1,2(q1,2)*< MC1,2(q1,2)*. Hence the solution is unstable, as
both container terminal operators have an incentive to cheat on their collusive pact by
handling more containers than agreed. Furthermore, the strategy is likely to draw a
negative regulatory response from government. Figure 8 shows the locus of potential
cartel solutions between points bca
22−
and bca
21−
.
INSERT FIGURE 8
This range of possibilities is due to the fact that any specific solution is in part dependent
on the respective bargaining power of the two terminal operators. Non-existent or low
entry barriers may also render the collusive agreement untenable in the face of potential
new entrants to the market.
5. Conclusions
For the case of two container terminal operators, table 5 summarises the impact of the ten
strategies on the number of TEUs handled, prices charged and profits. The perspective
adopted is that of TO1.
INSERT TABLE 5 Overall, strategies 2 and 4 are more desirable than the rest because they generate benefits
that extend beyond the container terminal operator to the entire industry. Apart from
increasing output and profits, these strategies also expand the terminal operator’s
hinterland. The economies of scale and scope that accrue as a result of an expanded

22
market could result in even further expansion of output and the generation of even higher
profits. From the perspective of the container port cluster, the potential competitive
advantages that could be gained by the terminal operator through competition and
innovation will cascade throughout the cluster, thereby reinforcing the competitive
advantages of other clusters. On the other hand, strategies 6, 9 and 10 could lead to the
formation of insular clusters as container terminal operators try to create environments
where they face less pressure to seek and interpret new customer needs, technologies and
processes.
Monopolistic advantages conferred by restricting market access and/or increasing market
concentration could also result in closed and inward-looking systems resulting in cluster
degeneration and even disintegration. Hence, while terminal operators try to sustain long-
term competitiveness by creating and drawing upon their respective competitive
advantages, the most desirable strategies are those that sustain the expansion of, or even
revitalise, the market for their services. Furthermore, the framework presented in figure 2
highlights the tremendous amount of opportunities available, in both vertical and
horizontal dimensions, for container terminal operators to advance and capitalise on their
competitive advantages.
It has been shown that the general framework presented can be used to analyse potential
competition strategies and expected payoffs for container terminal operators. While some
ports continue to measure their competitiveness based on the ability to attract cargo and
shipping tonnage, others realise that the real benefits come from high economic value
added and the employment opportunities generated by port and port-related activities.

23
There are also ports that have come to appreciate the need to balance port development
with social and environmental externalities. The framework presented can be used to
evaluate competition in the light of these concerns. The framework can also be extended
to include demand and cost functions that represent the market conditions for specific
locations and to undertake analyses from the perspective of other key players in the
container port industry such as shippers, shipping lines, logistics companies and
governments.

24
References Baird, A. J. (2002) The economics of transhipment. In The Handbook of Maritime Economics and Business, ed C.T. Grammenos, pp. 832-859. LLP, London. Bain, J. S. (1956) Barriers to New Competition. Harvard University Press, Cambridge. Baumol, W.J., Panzar, J.C. and Willig, R.D. (1982) Contestable Markets and the Theory of Industry Structure. Harcourt Brace Jovanovich, San Diego. Bertrand, J. (1883) Review of Cournot’s book in Journal des Savants; reprinted in English translation by Friedman J. W. In Cournot Oligopoly, ed A.F. Daughety, 1988, pp. 73-81. Cambridge University Press, Cambridge. Bowley, A. L. (1924) The Mathematical Groundwork of Economics. Oxford University Press, Oxford. Bresnahan, T. F., and Salop, S. C. (1986) Quantifying the competitive effects of production joint ventures. International Journal of Industrial Organization, 4, 155-175. Bramness, G. (1979) The general conjectural model of oligopoly: some classical results revisited. Warwick Economic Research Papers, 142. Chamberlain, E. H. (1962) The Theory of Monopolistic Competition. Harvard University Press, Cambridge. Cournot, A. A. (1838) Researches into the Mathematical Principles of the Theory of Wealth; reprinted with Irving Fisher’s original notes (1963), R.D. Irwin, Homewood, Illinois. Cullinane, K.P.B. (2002) The productivity and efficiency of ports and terminals: methods and applications. In The Handbook of Maritime Economics and Business, ed C. T. Grammenos, pp. 803-831. LLP, London. Cullinane, K.P.B. and Khanna, M. (2000) Economies of Scale in Large Containerships: Optimal Size and Geographical Implications, Journal of Transport Geography, 8, 181-195. De, P. and Ghosh, B. (2002) Productivity, efficiency and technological change in Indian ports. International Journal of Maritime Economics, 4, 348-368. De Langen, P. W. (2002) Clustering and performance: the case of maritime clustering in The Netherlands. Maritime Policy and Management, 29, 209-221. Economides, N. (1984) The principle of minimum differentiation revisited. European Economic Review, 24, 345-368. Flor, L. and Defilippi, E. (2003) Port infrastructure: an access model for the essential facility. Maritime Economics and Logistics, 5, 116-132. Frankel, E. G. (1999) The economics of total trans-ocean supply chain management. International Journal of Maritime Economics, 1, 61-69. Friedman, J. W. (1986) Game Theory with Applications to Economics. Oxford University Press, Oxford. Gibbons, R. (1992) Game Theory for Applied Economists. Princeton University Press, Princeton. Haezendonck, E., Coeck, C. and Verbeke, A. (2000) The competitive position of seaports: introduction of the value added concept. International Journal of Maritime Economics, 2, 107-118. Haezendonck, E. and Notteboom, T. (2002) The competitive advantage of seaports. In Port Competitiveness: An Economic and Legal Analysis of the Factors Determining the Competitiveness of Seaports, ed M. Huybrechts, H. Meersman, E. Van de Voorde, E. Van Hooydonk, A. Verbeke and W. Winkelmans, pp. 67-87. De Boeck Ltd, Antwerp. Haralambides, H. E. (2002) Competition, excess capacity, and the pricing of port infrastructure. International Journal of Maritime Economics, 4, 323-347. Haralambides, H. E., Cariou, P. and Benacchio, M. (2002) Costs, benefits and pricing of dedicated container terminals. International Journal of Maritime Economics, 4, 21-34. Haynes, K. E., Hsing, Y. M. and Stough, R. R. (1997) Regional port dynamics in the global economy: the case of Kaohsiung, Taiwan. Maritime Policy & Management, 24, 93-113.

25
Heaver, T., Meersman, H., Moglia, F. and Van de Voorde, E. (2000) Do mergers and alliances influence European shipping and port competition? Maritime Policy & Management, 27, 363-373. Hotelling, H. H. (1952) Stability in competition. In A.E.A. Readings in Price Theory, ed G. J. Stigler and K. E. Boulding. Richard D. Irwin, Chicago. Informa UK Ltd (2003) Containerisation International Yearbook 2003. Informa Asia Publishing, Hong Kong. Klemperer, P. D. and Meyer, M. A. (1988) Consistent conjectures equilibria: a reformulation showing non-uniqueness. Economics Letters, 27, 111-115. Kreps, D. M. and Scheinkman, J. (1983) Quantity precommitment and Bertrand competition yield Cournot outcomes. Bell Journal of Economics, 14, 326-337. Luo, M. and Grigalunas, T. (2003) A spatial-economic multimodal transportation simulation model for US coastal container ports. Maritime Economics and Logistics, 5, 158-178. Maggi, G. (1996) Strategic trade policies with endogenous mode of competition. American Economic Review, 86, 237-258. Martin, S. (2002) Advanced Industrial Economics. Blackwell Publishers Ltd, Oxford. Neumann, J. V. and Morgenstern, O. (1944) Theory of Games and Economic Behaviour. Harvard University Press, Cambridge. Notteboom, T., Coeck, C. and Van den Broeck, J. (2000) Measuring and explaining the relative efficiency of container terminals by means of Bayesian stochastic frontier models. International Journal of Maritime Economics, 2, 83-106. Notteboom, T. and Winkelmans, W. (2001) Structural change in logistics: how will port authorities face the challenge. Maritime Policy & Management, 28, 71-89. Porter, M. E. (1990) The Competitive Advantage of Nations, The Free Press, New York. Robinson, R. (2002) Ports as elements in value-driven chain systems: the new paradigm. Maritime Policy & Management, 29, 241-255. Ruffin, R. J. (1971) Cournot oligopoly and competitive behaviour. Review of Economic Studies, 38, 493-502. Rugman, A. and Verbeke, A. (1993) How to operationalise Porter’s diamond of international competitiveness. The International Executive, 35, 283-300. Sanchez, R. J., Hoffmann, J., Micco, A., Pizzolitto, G. V., Sgut, M. and Wilmsmeier, G. (2003) Port efficiency and international trade: port efficiency as a determinant of maritime transport costs. Maritime Economics and Logistics, 5, 199-218. Scherer, F. M., (1970) Industrial Market Structure and Economic Performance. Rand McNally, Chicago. Shaked, A. (1982) Existence and computation of mixed strategy Nash Equilibrium for 3-firms location problem. Journal of Industrial Economics, 31, 93-97. Shaked, A. and Sutton, J. (1982) Relaxing price competition through product differentiation. Review of Economic Studies, 49, 3-13. Shepherd, W. G. (1997) The Economics of Industrial Organization, pp. 203-241. Simon & Schuster Asia Pte Ltd, Singapore. Shubik, M. and Levitan, R. (1980) Market Structure and Behaviour. Harvard University Press, Cambridge. Stackelberg, H. F. V. (1952) The Theory of the Market Economy. Translated from German and with an introduction by Alan T. Peacock. William Hodge & Co. Ltd, London. Tiwari, P., Itoh, H. and Doi, M. (2003) Shippers’ port and carrier selection behaviour in China: a discrete choice analysis. Maritime Economics and Logistics, 5, 23-39. UNCTAD (2002) Review of Maritime Transport 2002. UN Publication, New York. Van de Voorde, E. and Winkelmans, W. (2002) A general introduction to port competition and management. In Port Competitiveness: An Economic and Legal Analysis of the Factors

26
Determining the Competitiveness of Seaports, ed M. Huybrechts, H. Meersman, E. van de Voorde, E. van Hooydonk, A. Verbeke and W. Winkelmans, pp. 1-16. De Boeck Ltd, Antwerp. Van Klink, H. A., and Van den Berg, G. C. (1998) Gateways and intermodalism. Journal of Transport Geography, 6, 1-9. Veldman, S. J. and Bückmann, E. H. (2003) A model on container port competition: an application for the West European container hub-ports. Maritime Economics and Logistics, 5, 3-22. World Trade Organization (2002) International Trade Statistics. The Organization, Geneva. Yap, W.Y. and Lam, J.S.L. (2004) An interpretation of inter-container port relationships from the demand perspective. Maritime Policy and Management, 31, 337-355. Zeng, Z. and Yang, Z. (2002) Dynamic programming of port position and scale in the hierarchized container ports network. Maritime Policy and Management, 29, 163-177.

27
Table 1: Share of Merchandise Trade for Top 10 Trading Nations/Regions in 2000
Nation /Region
Total Trade (Billion USD)
Share of World Trade (%)
% Change (1997-2000)
USA 1,999.29 16.10 28.42 Germany 1,041.04 8.38 9.59 Japan 802.31 6.46 11.92 UK 614.65 4.95 5.38 France 589.93 4.75 8.20 Canada 531.19 4.28 26.61 Italy 471.40 3.80 6.91 China* 455.43 3.67 40.10 Hong Kong* 414.67 3.34 4.54 Netherlands 394.98 3.18 10.63 Top 10 Total 7,314.89 58.91 16.27
Note: * Includes services. Source: World Trade Organisation (2002)

28
Table 2: Share of TEUs* Handled by the Largest Container Terminal Operator in the Top 20 Container Ports in 2000
Rank Port TEUs Handled Terminal Operator of
Majority Shareholding Share of Largest
Terminal Operator (%)
1 Hong Kong 18,100,000 Hutchison Port Holdings 42.8 2 Singapore 17,040,000 PSA Corporation 99.7 3 Pusan 7,540,387 Hutchison Port Holdings 24.5 4 Kaohsiung 7,425,832 n.a. n.a. 5 Rotterdam 6,275,000 Europe Combined Terminals 70.1 6 Shanghai 5,613,000 Hutchison Port Holdings 51.7 7 Los Angeles 4,879,429 n.a. n.a. 8 Long Beach 4,600,787 n.a. n.a. 9 Hamburg 4,248,247 HHLA 50.6 10 Antwerp 4,082,334 Hessenatie 60.0 11 Shenzhen 3,993,714 Hutchison Port Holdings 53.8 12 Port Klang 3,206,753 Northport 89.8 13 Dubai 3,058,886 Dubai Ports Authority 100.0 14 New York/
New Jersey 3,006,493 n.a. n.a.
15 Tokyo 2,899,452 Nippon Container Terminals 16.8 16 Manila 2,867,836 ICTSI 41.5 17 Felixstowe 2,800,000 Hutchison Port Holdings 100.0 18 Bremen/
Bremerhaven 2,712,420 Eurogate 57.4
19 Gioia Tauro 2,652,701 Contship Italia 100.0 20 Tanjung Priok 2,476,152 Hutchison Port Holdings 68.7 Total 109,479,423 47.3% of 231.7 million TEUs handled in the world *Twenty-foot Equivalent Unit; a standard size of container as recognised by the International Standards Organisation (ISO).
Source: Containerisation International Yearbook (2003) and various port websites.

29
Table 3: Schematic of Porter’s “Diamond” Model Applied to the Container Terminal Industry Determinant Components Important for Container Terminal Operators to Create and Sustain Competitive Advantage
Factor conditions Factor Endowment Factor Hierarchy
- Availability of skilled, specialised, competent and motivated human resources - Favourable maritime access - Strategic geographic location - Stable climate - Available and abundant stock of scientific, technical and market knowledge - Available and accessible sources of financial capital - A high quality port infrastructure - Good transportation network to access hinterland - Modern communications infrastructure - Active participation in factor-creation - Advanced and specialised factors most crucial
Demand conditions (e.g. of local hinterland)
Demand Composition Demand Size and Growth Pattern Demand Internationalisation
- Quality of demand important for perceiving, interpreting and responding to user needs - The segment structure of demand shapes the attention and priorities of terminal operator - Sophisticated and demanding users provide window to future user needs - Size of demand important especially for cases involving substantial R&D, scale economies,
uncertainty and technological requirements - Presence of a number of independent users foster faster rate of innovation - Rapid demand growth encourages investment in new products and facilities - Early saturation of demand increases pressure to innovate and upgrade - Mobile or multinational local users can provide loyal customer base - Inculcate domestic user needs into foreign users to internationalise demand base
Related and supporting industries
Supplier industries Related industries
- Presence of internationally competitive supplier industries - Presence of internationally competitive related industries
Firm strategy, structure and rivalry
Strategy and structure of firm Goals Domestic rivalry New business formation
- Management practices and mode of organisation must concur with national circumstances - Succeed when goals and motivation stimulate unusual commitment and effort - Status of national priority and/or prestige attracts outstanding talent and resources - Importance of sustained commitment - Successful operators compete intensely for home market and pressure each other to improve and
innovate - New business formation feeds the process of innovation
Chance Events beyond ability of firm and government to influence
- Capitalise on opportunities created from discontinuities that shift competitive advantage
Role of government National, regional and local - Potential impact from government policies - Opportunity to work together with government to reinforce competitive advantage

30
Table 4: Factors Influencing Elasticity of Demand
Category Factors Impact of Demand Elasticity Customer Stronger preferences (e.g. habits)
Higher income Greater wealth Knowledge
Less elastic Less elastic Less elastic More elastic
Technical limits Poor physical connections and apparatus
Less elastic
Competition Intense and extensive competition Threat of entry
More elastic More elastic
Vertical conditions
Monopsony power Ability to self-supply
More elastic More elastic
Source: Shepherd (1997)

31
Table 5: Summary of Impact of TO1’s Competitive Actions (for 0 < θθθθ ≤≤≤≤ 1)
No. Strategy Q1 Q2 P1 P2 ππππ1 ππππ2 1. Differentiate Demand
(i) If high contestability (ii) If low contestability
↑↑↑↑ ↓↓↓↓
↑↑↑↑ ↓↓↓↓
↓↓↓↓ ↑↑↑↑
↓↓↓↓ ↑↑↑↑
↓↓↓↓ ↑↑↑↑
↓↓↓↓ ↑↑↑↑
2. Build Complementary Relationship ↑↑↑↑ ↑↑↑↑ ↑↑↑↑ ↑↑↑↑ ↑↑↑↑ ↑↑↑↑ 3. Cost Leadership/ Cost Focus
(i) ↓c1 (ii) ↑c2 (iii)↓c1 and ↑c2
↑↑↑↑ ↑↑↑↑ ↑↑↑↑
↓↓↓↓ ↓↓↓↓ ↓↓↓↓
↑↑↑↑ ↑↑↑↑ ↓↓↓↓*
↓↓↓↓ ↓↓↓↓ ↑↑↑↑*
↑↑↑↑ ↑↑↑↑ ↑↑↑↑
↓↓↓↓ ↑↑↑↑ ↓↓↓↓
4. Stimulate Greater Demand ↑↑↑↑ ↑↑↑↑ ↑↑↑↑ ↑↑↑↑ ↑↑↑↑ ↑↑↑↑ 5. Reduce Demand Elasticity ↑↑↑↑ ↑↑↑↑ - - ↑↑↑↑ ↑↑↑↑ 6. Raise Entry Costs (with entry) ↓↓↓↓ ↓↓↓↓ ↓↓↓↓ ↓↓↓↓ ↓↓↓↓ ↓↓↓↓ 7. Mergers and/or Acquisitions
(i) If high contestability (ii) If low contestability
↑↑↑↑ ↓↓↓↓
↑↑↑↑ ↓↓↓↓
↑↑↑↑ ↓↓↓↓
↑↑↑↑ ↓↓↓↓
↑↑↑↑ ↓↓↓↓
↑↑↑↑ ↓↓↓↓
8. Acquiring Information Advantage** ↑↑↑↑ ↓↓↓↓ ↓↓↓↓ ↓↓↓↓ ↑↑↑↑ ↓↓↓↓ 9. Pricing Tools
(i) With TO2 in the market (ii) With TO2 leaving the market
↑↑↑↑ ↓↓↓↓
↓↓↓↓ -
↓↓↓↓ ↑↑↑↑
↓↓↓↓ -
↓↓↓↓ ↑↑↑↑
↓↓↓↓ -
10. Collusion ↓↓↓↓ ↓↓↓↓ ↑↑↑↑ ↑↑↑↑ ↑↑↑↑ ↑↑↑↑ Notes * For 0 < θ < 1. If θ = 1, there will be no change to P1 and P2. ** For θ = 1.

32
Figure 1: Cournot’s Equilibrium with Product Differentiation where θθθθ = 1
RF2
RF1
q1
q2
q1c
q2c
bca 1−
bca
22−
bca 2−
bca
21−
Cournot Equilibrium
Decision Variables
a b ci θθθθ n Fi
Endogenous Variables
Pi qi ππππi
where i denotes TOi

33
Figure 2: Framework for Analysing Competition Between Container Terminal Operators
Human resources Physical resources Knowledge resources Capital resources Infrastructure
Basic versus Advanced Generalised versus Specialised Mobile versus Immobile
Factor Conditions Structure Sophistication Size Growth Local Foreign
Of port users such as: Shippers Shipping Lines Logistics Companies
Demand Conditions
Such as: Shipbuilding and repair Ship chandling Classification societies Bunkering Ship management Ship broking Maritime unions Ship registry Maritime R&D Ship financing Maritime legal services Dredging Maritime IT Maritime defence Marine equipment and accessories Marine insurance and reinsurance Marine salvage and survey
Related and Supporting Industries
New business formation Inter-port Intra-port Domestic
International
Firm Strategy, Structure and Rivalry
Supply shocks Acts of pure invention
Major technological discontinuities Financial shocks Demand shocks Political shocks Social upheaval Union actions
Natural disasters
Chance Events
Role of Government Regulation
Subsidy Macroeconomic policy
Social goods and services Market failure
Competitive Advantage of Container Terminal Operator
Pi ππππi qi
a
b
θθθθ ci
n
Fi
Where: a denotes coefficient related to demand b denotes coefficient related to demand n denotes number of TOs Fi denotes fixed costs of TOi ci denotes variable costs of TOi qi denotes container throughput of TOi πi denotes profit of TOi θ denotes demand relationship between TOs Pi denotes price charged by TOi

34
Figure 3: Solutions for the Case of Product Differentiation for two Container Terminal Operators
RF2
RF1
q1
q2
q1c
q2c
θbca 1−
bca
22−
θbca 2−
bca
21−
E5 where θ = -1
E1 where θ = 1
E2 where 0 < θ < 1
E3 where θ = 0
E4 where -1 < θ < 0

35
Figure 4: Achieving Cost Leadership/ Cost Focus in the Case of Two Competing Container Terminal Operators where θθθθ =1
Where:
E1 denotes the original equilibrium position in Cournot’s model E2 denotes the equilibrium position resulting from a rise in TO2’s costs. Hence, ↓q2 and ↑q1 E3 denotes the equilibrium position resulting from a fall in TO1’s costs. Hence, ↓q2 and ↑q1 E4 denotes the equilibrium resulting from a rise in TO2’s costs and fall in TO1’s costs. Hence, ↓q2 and ↑q1
(The best situation for TO1 and worst situation for TO2).
q21
q22
RF2
RF1
q1
q2
q11
E1
E3
E2 E4
RF1’
RF2’
q24
q23
q14 q1
3 q12

36
Figure 5: Equilibrium with Expansion in Demand where θθθθ = 1
q1
q2
E1
q1*
q2*
RF2
RF1
RF1’
E2
q1’
q2’
RF2’

37
Figure 6: Equilibrium with Demand Expansion and Capacity Constraint for TO2 at q2’ where θθθθ = 1
RF1’
q1
q2
E1
q1*
RF2
RF1
E2
q1’
q2’
RF2’

38
Figure 7: The Stackelberg Solution for the Case of θθθθ = 1
Stackelberg Solution (for c1=c2)
RF2
RF1
q1
q2
q1c
q2c
bca 1−
bca
22−
bca 2−
bca
21−
Cournot Equilibrium
bca
42−

39
Figure 8: Cartel Solutions for the Case of θθθθ = 1
q1
RF2
RF1
q2
q1c
q2c
bca 1−
bca
22−
bca 2−
bca
21−
Cournot Equilibrium
bca
42−
bca
41−
Cartel Solution