consumption of soy foods and isoflavones and risk of type
TRANSCRIPT

Consumption of soy foods andisoflavones and risk of type 2 diabetes:a pooled analysis of three US cohorts
The Harvard community has made thisarticle openly available. Please share howthis access benefits you. Your story matters
Citation Ding, Ming, An Pan, JoAnn E. Manson, Walter C. Willett, VasantiMalik, Bernard Rosner, Edward Giovannucci, Frank B. Hu, and QiSun. 2016. “Consumption of soy foods and isoflavones and risk oftype 2 diabetes: a pooled analysis of three US cohorts.” Europeanjournal of clinical nutrition 70 (12): 1381-1387. doi:10.1038/ejcn.2016.117. http://dx.doi.org/10.1038/ejcn.2016.117.
Published Version doi:10.1038/ejcn.2016.117
Citable link http://nrs.harvard.edu/urn-3:HUL.InstRepos:30371172
Terms of Use This article was downloaded from Harvard University’s DASHrepository, and is made available under the terms and conditionsapplicable to Other Posted Material, as set forth at http://nrs.harvard.edu/urn-3:HUL.InstRepos:dash.current.terms-of-use#LAA

Consumption of soy foods and isoflavones and risk of type 2 diabetes: a pooled analysis of three US cohorts
Ming Ding1, An Pan2, JoAnn E. Manson3,4, Walter C. Willett1,4,5, Vasanti Malik1, Bernard Rosner5,6, Edward Giovannucci1,4,5, Frank B. Hu1,4,5, and Qi Sun1,5
1Department of Nutrition, Harvard School of Public Health, Boston, MA
2Department of Epidemiology and Biostatistics, MOE Key Lab of Environment and Health, School of Public Health, Tongji Medical College, Huazhong University of Science and Technology, Wuhan 430030, Hubei, China
3Department of Medicine, Brigham and Women’s Hospital, Harvard Medical School, Boston, MA, USA
4Department of Epidemiology, Harvard School of Public Health, Boston, MA
5Channing Division of Network Medicine, Brigham and Women’s Hospital and Harvard Medical School, Boston, MA
6Department of Biostatistics, Harvard School of Public Health, Boston, MA
Abstract
Background—Evidence regarding the consumption of soy foods and isoflavones in relation to
risk of type 2 diabetes (T2D) is scarce.
Objective—Our study was to evaluate the association between soy food and isoflavone
consumption and risk of T2D in US men and women.
Methods—We followed 63,115 women in the Nurses’ Health Study (1998-2012), 79,061 women
in the Nurses’ Health Study II (1999-2013), and 21,281 men in the Health Professionals Follow-
Up Study (2002-2010). Diet was assessed by a validated food-frequency questionnaire, and was
updated every 4 y. Self-reports of incident T2D was confirmed by a validated supplementary
questionnaire.
Results—During 1,966,321 person-years of follow-up, 9,185 incident T2D cases were
documented. After multivariate adjustment for covariates, consumption of soy foods (tofu and soy
Users may view, print, copy, and download text and data-mine the content in such documents, for the purposes of academic research, subject always to the full Conditions of use:http://www.nature.com/authors/editorial_policies/license.html#terms
Corresponding Author: Qi Sun, MD, ScD, Department of Nutrition, Harvard School of Public Health, 655 Huntington Ave, Boston, MA 02115. [email protected].
ContributorsQS and FBH obtained funding from the National Institutes of Health. MD analyzed the data and wrote the first draft of the manuscript. AP, JEM, WCW, VM, BR, and EG contributed to the interpretation of the results and critical revision of the manuscript for important intellectual content and approved the final version of the manuscript. QS is the guarantor of this investigation.
Competing InterestsNone of the authors had any financial or personal conflict of interest to disclose.
HHS Public AccessAuthor manuscriptEur J Clin Nutr. Author manuscript; available in PMC 2017 January 06.
Published in final edited form as:Eur J Clin Nutr. 2016 December ; 70(12): 1381–1387. doi:10.1038/ejcn.2016.117.
Author M
anuscriptA
uthor Manuscript
Author M
anuscriptA
uthor Manuscript
milk) was not associated with a lower T2D risk. Compared to non-consumers of soy foods, the
hazard ratio (HR) was 1.00 (95% CI: 0.93, 1.07) for <1 serving/week, and 0.93 (95% CI: 0.83,
1.03) for ≥1 serving/week of soy foods (P for trend = 0.14). In contrast, intake of total isoflavones
was inversely associated with T2D risk. Comparing extreme quintiles of isoflavones, the HR was
0.89 (95% CI: 0.83, 0.96; P for trend = 0.009). Inverse associations were also found for
consumption of major individual isoflavones, including daidzein and genistein, with risk of T2D.
Conclusions—Intake of isoflavones was associated with a modestly lower T2D risk in US men
and women who typically consumed low to moderate amounts of soy foods. These findings
warrant replications in other populations with similar soy intake levels.
Keywords
isoflavones; soy food; type 2 diabetes
INTRODUCTION
Type 2 diabetes (T2D) is a chronic disease with increasing prevalence worldwide. The total
number of people with diabetes, globally, is 382 million in 2013 and is estimated to reach
592 million by the year 2035.1 Identification of modifiable lifestyle and dietary risk factors
for T2D prevention is of high priority. Specific components of plant-based foods have been
shown to exert significant health benefits.2 For example, consumption of coffee and
blueberries has been associated with a lower risk of T2D in Western populations, and certain
flavonoid subclasses, such as phenolic acids and anthocyanins, may contribute to the health
benefits of these foods.3-5 In contrast, evidence regarding other plant-based foods, such as
soy foods, that are regarded as healthful but not intrinsic to the traditional Western diet is
sparse.
Soy foods are uniquely rich in isoflavones compared to other foods.6 Isoflavones are in the
family of flavonoids that share a common chemical structure of 2 aromatic rings bound
together by 3 carbon atoms that form an oxygenated heterocycle. 7 Depending on the
position of hydroxyl groups in replacement of hydrogen atoms, isoflavones can be
categorized into three subtypes: daidzein, genistein, and glycitein. The contents of these
isoflavones are much higher in soy foods, such as tofu and soy milk, than other foods that do
not contain soy ingredients, with daidzein and genistein contents higher than glycitein in soy
foods. Isoflavones have a structure analogous to 17-β-estradiol and have weak estrogen-like
effects by binding to estrogen receptors.8 Because the structural conformation of genistein
resembles estradiol the most, genistein has the strongest binding capacity to estrogen
receptor. 9 Daidzein and genistein could be converted by gut bacteria into metabolites such
as equol, desmethylangolensin (DMA), dihydrogenistein (DHGE), and dihydrodaidzein
(DHDE). Several clinical trials have been conducted to examine the effects of soy foods and
isoflavones on glucose homeostasis, and results have suggested that soy foods and soy-rich
diets may lower blood glucose.10-13 However, these clinical trials are limited by small
sample sizes and short durations of follow-up. Few prospective studies have been conducted
to evaluate the associations between intakes of soy foods and isoflavones and T2D risk in
Western populations who consume low to moderate amounts of soy foods 14.
Ding et al. Page 2
Eur J Clin Nutr. Author manuscript; available in PMC 2017 January 06.
Author M
anuscriptA
uthor Manuscript
Author M
anuscriptA
uthor Manuscript
We conducted a prospective analysis of data collected in 3 large US cohorts, the Nurses’
Health Study (NHS), the NHSII, and the Health Professionals Follow-Up Study (HPFS) to
examine the associations between consumption of soy food and isoflavones and risk of T2D.
METHODS
Study population
The NHS began in 1976, when 121,700 female registered nurses aged 30-55 y residing in 11
states were enrolled and completed a baseline questionnaire about their lifestyle and medical
history. The NHSII was established in 1989 and consisted of 116,671 younger female
registered nurses aged 25-42 y at baseline. These women responded to a baseline
questionnaire similar to the one used in NHS. The HPFS was initiated in 1986, and was
composed of 51,529 male dentists, pharmacists, veterinarians, optometrists, osteopathic
physicians, and podiatrists aged 40-75 y at baseline. The male participants returned a
baseline questionnaire about their medical history, lifestyle, and usual diet. In all three
cohorts, questionnaires were administered at baseline and biennially thereafter to update
information on lifestyle factors and the occurrence of chronic diseases.
For the current analysis, we excluded participants who reported diagnosed diabetes
(including type 1 and type 2 diabetes, and gestational diabetes), cardiovascular disease
(CVD), or cancer at baseline (1998 for the NHS, 1999 for the NHSII, and 2002 for the
HPFS). We further excluded participants with missing soy or isoflavone consumption at
baseline (when soy milk was first included) and those who left more than 70 food items
blank or had daily energy intakes <600 or > 3500 kcal for women and <800 or >4200 kcal
for men. Overall, 21,665 NHS participants, 8,537 NHSII participants, and 16,120 HPFS
participants were excluded from the analysis. After these exclusions, data from 63,115 NHS
participants, 79,061 NHSII participants, and 21,281 HPFS participants were available for the
analysis. The study protocol was approved by the institutional review boards of Brigham and
Women’s Hospital and Harvard School of Public Health. The completion of the self-
administered questionnaire was considered to imply informed consent.
Assessment of isoflavone and soy food consumption
In 1984, a 116-item food frequency questionnaire (FFQ) was administered to the NHS
participants to obtain information on usual intake of food and beverages. Since 1986, an
expanded FFQ has been administered every 4 years to update diet. Using a similar FFQ,
dietary data were collected every four years from the NHSII participants since 1991 and
from the HPFS participants since 1986. In all FFQs, participants were asked how often
(from “never or less than once per month” to “6 or more times per day”) on average they
consumed each food item of a standard portion size during the previous year. Major soy
foods, i.e., tofu and soy milk, have been simultaneously included on the FFQs since 1998 in
the NHS, 1999 in the NHSII, and 2002 in the HPFS. We therefore used these years as study
baselines. Intake of isoflavones and other nutrients was calculated by multiplying the
consumption frequency of each food item by the nutrient content of the specified portion and
summing the contributions from all food items. We calculated consumption of genistein,
daidzein, and glycitein from foods. Isoflavones from supplements were not included in these
Ding et al. Page 3
Eur J Clin Nutr. Author manuscript; available in PMC 2017 January 06.
Author M
anuscriptA
uthor Manuscript
Author M
anuscriptA
uthor Manuscript

calculations. The food composition of isoflavones was created primarily from the USDA
Database for the Isoflavone Content of Selected Foods, Release 2.0 6. Consumption of total
soy food was calculated as the sum of the consumption of tofu and soy milk in servings/day.
The validity and reproducibility of the FFQ has been described in detail elsewhere.15-18 The
correlation coefficient for tofu consumption assessed by FFQs and diet records was 0.56.15
Assessment of covariates
In the biennial follow-up questionnaires, we collected and updated information on age, body
weight and height, smoking status, physical activity, medication use, family history of
diabetes, and disease status, including hypertension, hypercholesterolemia, CVD, and
cancer. We also ascertained data on menopausal status and postmenopausal hormone use in
both NHS and NHSII, as well as oral contraceptive use in NHSII. An overall measurement
of diet quality was derived using the alternate Healthy Eating Index (aHEI) score excluding
tofu and soy milk.
Assessment of type 2 diabetes (T2D)
Participants with self-reported incident T2D were mailed a validated supplementary
questionnaire regarding symptoms, diagnostic tests, and hypoglycemic therapy to confirm
the diagnosis of diabetes. Cases were ascertained using the American Diabetes Association
criteria:19 1) one or more classic symptoms (excessive thirst, polyuria, weight loss, hunger)
and fasting plasma glucose concentrations ≥7.0 mmol/L or random plasma glucose
concentrations ≥11.1 mmol/L; 2) ≥2 elevated plasma glucose concentrations on different
occasions (fasting concentrations ≥7.0 mmol/L, random plasma glucose concentrations
≥11.1 mmol/L, and/or concentrations of ≥11.1 mmol/L after ≥2 h shown by oral-glucose-
tolerance testing) in the absence of symptoms; or 3) treatment with hypoglycemic
medication (insulin or oral hypoglycemic agent). In addition, hemoglobin A1c≥6.5% was
added to the diagnosis criteria since 2010. Only cases confirmed by the supplemental
questionnaires were included in our analysis.
The validity of the supplementary questionnaire for the diagnosis of diabetes has been
documented previously. In a validation study, of the 62 cases in the NHS and 59 cases in
HPFS who were confirmed by the supplemental questionnaire, 61 (98%) and 57 (97%) were
reconfirmed by reviewing medical records.20,21
Statistical analysis
We calculated person-time for each individual from the date of the return of the baseline
questionnaire to the date of diagnosis of T2D, death, or the end of follow-up (30 June 2012
for the NHS, 30 June 2013 for the NHSII, and 31 January 2010 for the HPFS), whichever
came first. We used cumulative averages of soy food or isoflavone consumption to reflect
long-term dietary habits. We stopped updating diet after incident cancer or CVD as these
diseases may result in changes of diet that might confound the association between soy
foods and risk of T2D. In addition, to minimize missing values during follow-up, we
replaced missing soy food/isoflavone intakes during follow-up with valid values in the
previous cycle. We used Cox proportional hazards regression models to examine the
associations between soy foods and isoflavone consumption (quintiles) and risk of T2D. The
Ding et al. Page 4
Eur J Clin Nutr. Author manuscript; available in PMC 2017 January 06.
Author M
anuscriptA
uthor Manuscript
Author M
anuscriptA
uthor Manuscript
regression models included calendar time in 2-y intervals as the time scale, and were
stratified by age in years. In multivariable analysis, we further adjusted for race (Causation,
African American, Asian, and others), family history of T2D (yes, no), baseline disease
status (hypertension and hypercholesterolemia), BMI (<20.9, 21-22.9, 23-24.9, 25-29.9,
30-34.9, ≥35 kg/m2), physical activity (quintiles, met-hr/week), aHEI score (in quintiles),
total energy intake (quintiles), and smoking status (never smoked, past smoker, currently
smoked 1-14 cigarettes/d, and currently smoked >14 cigarettes/d). We additionally adjusted
for menopausal status (yes, no), and postmenopausal hormone use (yes, no) in women. Test
for linear trend was conducted by assigning the median value of exposure in each category
to that category and treating the median value as a continuous variable in the regression
model, with P < 0.05 denoting a significant association.
Analyses were performed separately in each cohort first. The pooled hazard ratios (HRs)
were estimated by a stratified Cox model, which allowed baseline hazard to be different
across the three cohorts while gave common effect estimates of the covariates. We examined
potential effect modifications by BMI, age, and aHEI score for both men and women, and
menopausal status and postmenopausal hormone use for women. Meta-regressions were
used to test for potential interactions, with P value <0.05 denoting effect modification. The
tests for interaction were conducted in analyses within individual cohorts as well as in
analyses based on pooled data from all three cohorts. Previous studies showed that coffee
intake also contributes to total isoflavone intake 22 and was associated with a lower T2D risk
in these cohorts.5 To examine whether the association of isoflavones with diabetes risk may
be due to coffee intake, we further calculated coffee-adjusted residuals of isoflavones using
generalized equation estimation (GEE), and conducted a sensitivity analysis by using these
residuals as the main exposure. All statistical tests were 2-sided and performed using SAS
version 9.3 (SAS Institute Inc.). The meta-analysis was performed using STATA, version 9.2
(StataCorp).
RESULTS
Baseline characteristics according to soy food consumption
Baseline characteristics of the participants in each cohort according to soy food consumption
are shown in Table 1. Most of the participants were non-consumers of soy foods at baseline
in the three cohorts. Soy food consumers had a higher aHEI score, higher consumption of
fruit, vegetables, and fish, lower consumption of meat and soda (including sugar-sweetened
beverages), and were more physically active than non-consumers.
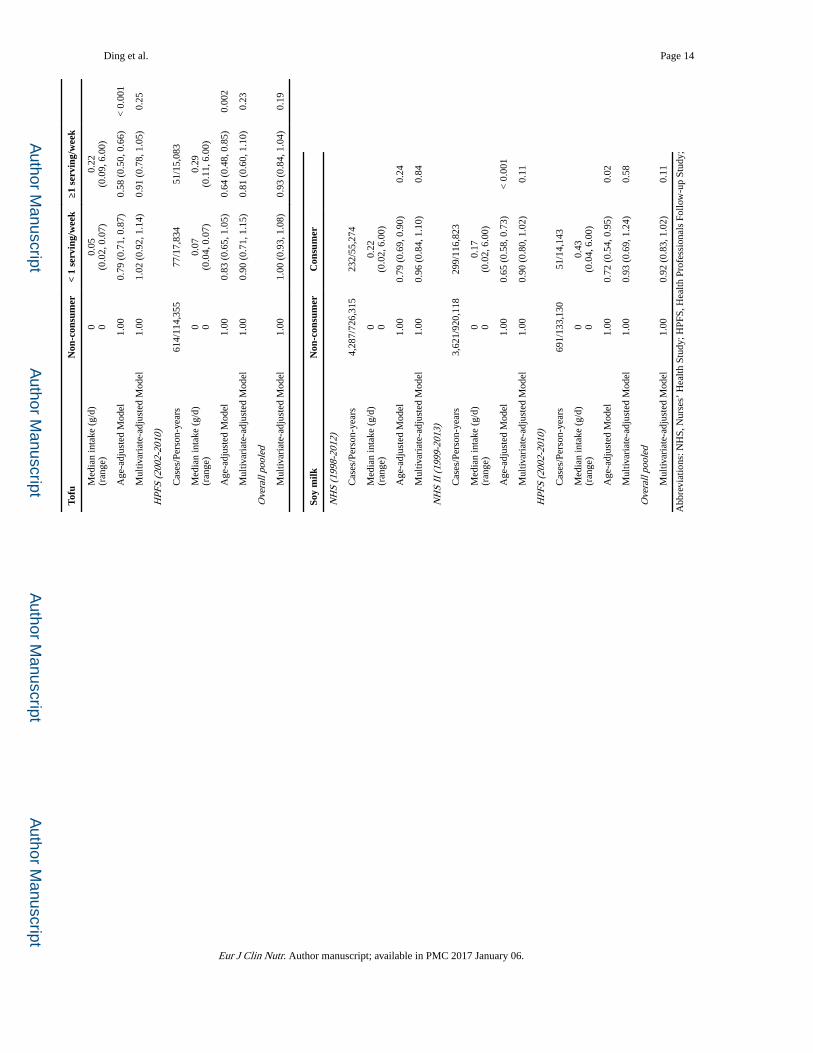
The association of soy foods with risk of T2D
In the age-adjusted model, soy food consumption was inversely associated with risk of T2D.
After multivariate adjustment, the association was attenuated and soy food consumption was
non-significantly associated with a lower risk of T2D (Table 2). Compared with those who
did not consume soy foods, the HR (95% CI) was 1.00 (0.93, 1.07) for those consuming < 1
serving/week of soy foods, and 0.93 (0.83, 1.03; P = 0.14) for those consuming ≥1 serving/
week of soy foods in the pooled analysis. We further examined the association separately
with tofu and soy milk intake. Compared with non-consumers, the HR was 1.00 (95% CI:
Ding et al. Page 5
Eur J Clin Nutr. Author manuscript; available in PMC 2017 January 06.
Author M
anuscriptA
uthor Manuscript
Author M
anuscriptA
uthor Manuscript

0.93, 1.08) for those consuming < 1 serving/week of tofu, and 0.93 (95% CI: 0.84, 1.04) for
those consuming ≥1 serving/week of tofu. For soy milk, compared with non-consumers, the
HR was 0.92 (95% CI: 0.83, 1.02) for soy milk consumers. No significant associations of
total soy foods, tofu, and soy milk with risk of T2D were found in the NHS, NHSII, and
HPFS cohorts, and the associations did not vary significantly across the three cohorts (all P
values for heterogeneity >0.30).
The association of isoflavone consumption with risk of T2D
Total isoflavone consumption was significantly, inversely associated with risk of T2D (Table
3). As compared with the lowest quintile of isoflavones consumption, the HRs (95% CIs)
were 0.89 (0.83, 0.96) for highest quintiles in the pooled analysis (P for trend = 0.009). We
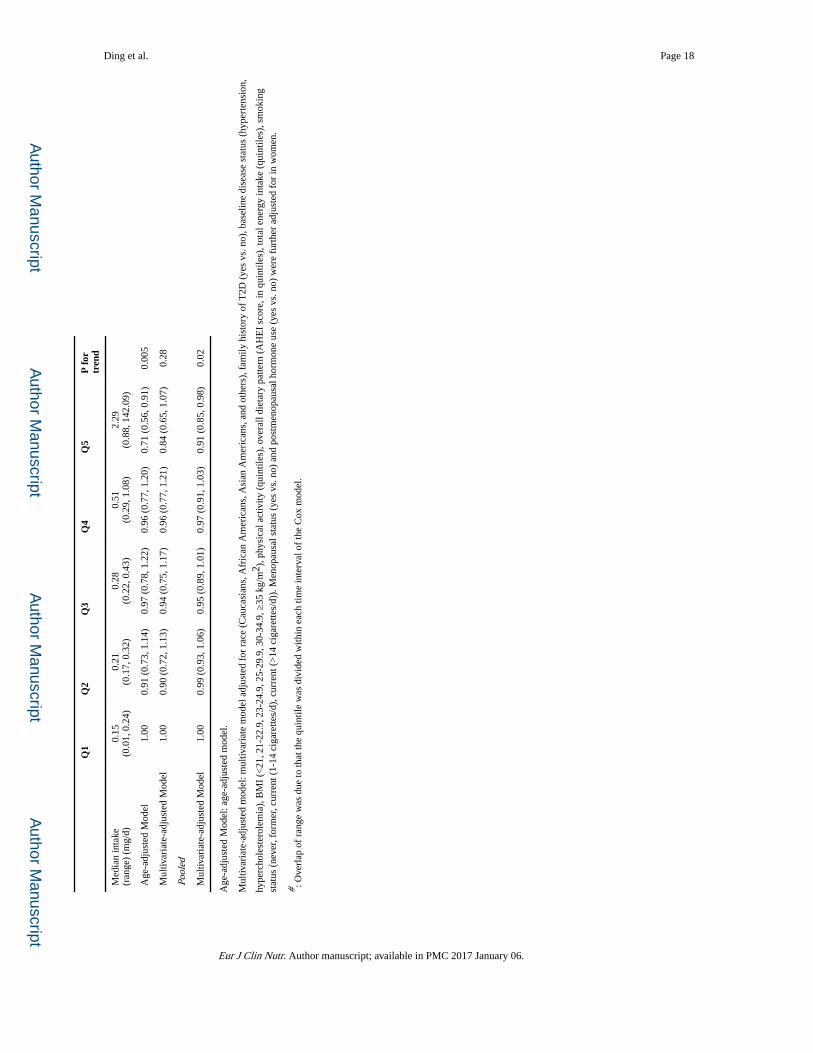
further evaluated individual isoflavones with meaningful intake levels in our cohorts (Table
4). For daidzein, the HR (95% CI) was 0.87 (0.81, 0.94) comparing extreme quintiles (P for
trend = 0.0003). For genistein, the HR (95% CI) was 0.91 (0.85, 0.98) for the same
comparison (P for trend = 0.02).
Of note, on average, regular soy food consumers (≥1 serving/week) had higher isoflavone
intake levels than participants in the highest quintile of total isoflavones, but the associations
for soy food intake were not significant, suggesting that the association for isoflavones may
not be linear at relatively high intake level. However, when we further examined the dose-
response relationship between isoflavone intake and risk of T2D using spline regression, we
did not observe a clear non-linear association (P for non-linearity: 0.76; P for trend = 0.02;
Supplemental figure 1).
Stratified analysis
We conducted analyses stratified by menopausal status (premenopausal vs postmenopausal;
women only), BMI (<30 kg/m2 vs ≥30 kg/m2), age (<60 y vs ≥60 y), and aHEI score (<
median vs ≥ median), and no significant interactions were found between soy food and risk
of T2D: P values for interaction were 0.20 for menopausal status, 0.78 for BMI, 0.34 for
age, and 0.52 for aHEI score (Supplemental Table 1). No significant interactions were found
between isoflavones consumption and these factors in relation to T2D risk (Supplemental
Table 2). We further tested effect modification by postmenopausal hormone use on the
associations between consumptions of soy food and isoflavones and risk of T2D among
postmenopausal women, but no significant effect modification was found. We performed
further analyses restricted within postmenopausal women who were never users of hormone
therapy and within women who were never users of soy supplements. The associations
between intakes of soy foods and isoflavones and risk of T2D did not change substantially.
Sensitivity analysis
As coffee was one of the food sources of isoflavones consumption,22 we conducted
sensitivity analysis using coffee-adjusted residuals of isoflavones consumption. Similar to
the results of isoflavones, inverse associations of residual consumption of isoflavones,
daidzein, and genistein with risk of T2D were found (Supplemental table 3). As soy food
consumption was associated with a healthy lifestyle, we further repeated our analysis on the
association of soy food and isoflavones with risk of T2D using propensity score analysis.
Ding et al. Page 6
Eur J Clin Nutr. Author manuscript; available in PMC 2017 January 06.
Author M
anuscriptA
uthor Manuscript
Author M
anuscriptA
uthor Manuscript

The results did not change significantly comparing with the main analysis (Supplemental
table 4, 5). We repeated our analysis using stratified Cox model, and the associations of soy
food and isoflavones with risk of T2D did not change significantly.
DISCUSSION
In three large US cohorts of men and women, we found that isoflavone consumption was
modestly associated with a lower risk of T2D, whereas the two major soy foods, i.e., tofu
and soy milk, were not associated with T2D risk. These associations were independent of
established and potential lifestyle and dietary risk factors of T2D.
The association of soy foods and isoflavones with risk of T2D has been investigated
primarily among Asian populations who have much higher intake levels compared with
Western populations, and the results have been largely mixed. Villegas et al. found that
higher intakes of soybean and soy milk were significantly associated with a lower T2D
incidence in the Shanghai Women’s Health Study.23 In the Singapore Chinese Health Study,
Mueller et al. further documented that intakes of unsweetened soy products (servings/week),
but not sugar-sweetened soy foods, were associated with a lower T2D risk.24 However, a
Japanese study found that intake of total soy foods (gram/day) with various soy protein
densities was not associated with T2D risk,25 whereas intake of total soy foods (gram/day)
was associated with a higher T2D risk in a multi-ethnic population living in Hawaii.26
Lastly, no association between total isoflavone intake and risk of T2D was found in the
EPIC-InterAct Study.14 The sources of heterogeneity in these findings are unclear, although
study participant characteristics, including genetics, total energy intake, different exclusion
criteria, various cooking methods, types of soy products, and measurement error in soy food
or isoflavone assessment may partially explain the mixed results. In the current analysis, we
evaluated both major soy foods and isoflavones in relation to T2D risk and found the
associations did not vary significantly across three cohorts of men and women. We found
that isoflavones rather than soy foods were associated with a lower risk of T2D and the
reason might be that the isoflavones contents and other dietary constitutions of soy food
differed across regions.
In contrast to the paucity of evidence from long-term prospective observational studies, data
from short-term clinical trials that examined the effects of soy foods or isoflavones on
diabetes risk factors were abundant, and results were mixed. In a comprehensive meta-
analysis of randomized controlled trials, supplementation of soy foods or isoflavones did not
significantly lower fasting glucose or insulin levels, although a subgroup analysis showed
that whole soy foods might reduce fasting glucose.11 In another meta-analysis that focused
on premenopausal and postmenopausal non-Asian women who did not take hormone
replacement therapy, isoflavone supplementation significantly lowered fasting insulin and
HOMA-IR levels, although no effects were observed on fasting glucose levels.10 In addition,
soy products improved blood lipid profiles among diabetes patients, although the effects on
glucose metabolism parameters were not substantiated.12
Isoflavones have a structure analogous to 17-β-estradiol, which enables isoflavones bind to
estrogen receptors β with 103-104 less potency than estradiol.8 Isoflavones exert either
Ding et al. Page 7
Eur J Clin Nutr. Author manuscript; available in PMC 2017 January 06.
Author M
anuscriptA
uthor Manuscript
Author M
anuscriptA
uthor Manuscript

estrogenic or anti-estrogenic effect depending on the concentration of serum estradiol.
Isoflavones exert estrogen-like effects when the concentration of endogenous estrogen is
low, otherwise, isoflavones might have anti-estrogenic effect. 27 Isoflavones also activate
nuclear receptors including peroxisome-proliferator activated receptors (PPAR) α , PPAR γ,
sterol regulated element binding protein, and liver X binding receptor to regulate lipid and
glucose metabolism.28-30 Isoflavones have been shown to improve hyperglycemia, glucose
tolerance, and circulating insulin concentrations.31 Isoflavones also stimulate the
phosphorylation of AMP-activated protein kinase and acetyl-CoA carboxylase to increase
glucose uptake and fatty acid oxidation.32 Estrogen increases insulin sensitivity in the liver,
promotes pancreas β cell proliferation and differentiation, modulates appetite and energy
expenditure by regulating the expression of leptin and ghrelin, effects glucose disposal in
muscle by upregulating expression of glucose transporter 4 and proteins involving the
insulin signaling pathway,33 and inhibits lipogenesis in adipose tissue by inhibiting the
activity of lipoprotein lipase.34 Whether isoflavones have those effects analogous to estrogen
is speculated and needs further investigation.
Our study has several strengths. First, the analysis was based on three well-characterized
large cohorts with detailed measurements of diet and lifestyle. Second, consumption of
isoflavones and soy products was assessed every 4 years during the follow-up. The repeated
measurements not only reduce measurement error but also represent long-term dietary
habits. Third, the aHEI score was used to adjust for confounding of the overall diet quality.
We also controlled for a wide range of lifestyle factors in the analysis. Our study also has
several limitations. First, although we used the comprehensive USDA food composition
database of isoflavones to derive isoflavone intake and included major soy foods in the
current analysis, measurement error may still exist and may attenuate the true associations
towards the null due to the longitudinal study design. Second, the low consumption levels of
soy products in our cohorts (90% of participants were non-consumers), typically seen among
Western populations, limited the statistical power for the analysis of soy food. Third,
residual confounding by lifestyle factors (e.g., dietary factors, physical activity, and
smoking) may still exist due to model-misspecification and measurement error of potential
confounders. Last, our study was conducted primarily among white health professionals, and
thus the results may not be generalizable to other populations.
In conclusion, our analysis showed that consumption of isoflavones, but not tofu or soy
milk, was associated with a modest reduction in risk of T2D in three large cohorts of U.S.
men and women. Further studies are needed to replicate these observations in other
populations, especially those with similar isoflavone intake levels.
Supplementary Material
Refer to Web version on PubMed Central for supplementary material.
Acknowledgments
Funding
Ding et al. Page 8
Eur J Clin Nutr. Author manuscript; available in PMC 2017 January 06.
Author M
anuscriptA
uthor Manuscript
Author M
anuscriptA
uthor Manuscript
This study was funded by research grants CA186107, CA176726, CA167552, DK58845, DK58785, and DK082486 from the National Institutes of Health. Dr. Sun was supported by a career development award R00HL098459 from the National Heart, Lung, and Blood Institute. The funding sources had no role in study design; in the collection, analysis, and interpretation of data; in the writing of the report; or in the decision to submit the article for publication. The authors are not affiliated with the funding institutions.
Reference
1. International Diabetes Federation. IDF Diabetes Atlas. 6th edn.. International Diabetes Federation; Brussels, Belgium: 2013.
2. Hu FB. Do functional foods have a role in the prevention of cardiovascular disease? Circulation. 2011; 124:538–540. doi:10.1161/CIRCULATIONAHA.111.042721. [PubMed: 21768537]
3. Muraki I, et al. Fruit consumption and risk of type 2 diabetes: results from three prospective longitudinal cohort studies. Bmj. 2013; 347:f5001. doi:10.1136/bmj.f5001. [PubMed: 23990623]
4. van Dam RM, Hu FB. Coffee consumption and risk of type 2 diabetes: a systematic review. JAMA. 2005; 294:97–104. doi:10.1001/jama.294.1.97. [PubMed: 15998896]
5. Ding M, Bhupathiraju SN, Chen M, van Dam RM, Hu FB. Caffeinated and decaffeinated coffee consumption and risk of type 2 diabetes: a systematic review and a dose-response meta-analysis. Diabetes Care. 2014; 37:569–586. doi:10.2337/dc13-1203. [PubMed: 24459154]
6. Bhagwat S, H. D, Holden JM, et al. USDA Database for the Isoflavone Content of Selected Foods Release 2.0. 2008
7. Manach C, Scalbert A, Morand C, Remesy C, Jimenez L. Polyphenols: food sources and bioavailability. The American journal of clinical nutrition. 2004; 79:727–747. [PubMed: 15113710]
8. Muthyala RS, et al. Equol, a natural estrogenic metabolite from soy isoflavones: convenient preparation and resolution of R- and S-equols and their differing binding and biological activity through estrogen receptors alpha and beta. Bioorganic & medicinal chemistry. 2004; 12:1559–1567. doi:10.1016/j.bmc.2003.11.035. [PubMed: 15018930]
9. Kostelac D, Rechkemmer G, Briviba K. Phytoestrogens modulate binding response of estrogen receptors alpha and beta to the estrogen response element. Journal of agricultural and food chemistry. 2003; 51:7632–7635. doi:10.1021/jf034427b. [PubMed: 14664520]
10. Ricci E, Cipriani S, Chiaffarino F, Malvezzi M, Parazzini F. Effects of soy isoflavones and genistein on glucose metabolism in perimenopausal and postmenopausal non-Asian women: a meta-analysis of randomized controlled trials. Menopause. 2010; 17:1080–1086. doi:10.1097/gme.0b013e3181dd05a9. [PubMed: 20581723]
11. Liu ZM, Chen YM, Ho SC. Effects of soy intake on glycemic control: a meta-analysis of randomized controlled trials. Am J Clin Nutr. 2011; 93:1092–1101. doi:10.3945/ajcn.110.007187. [PubMed: 21367951]
12. Yang B, et al. Systematic review and meta-analysis of soy products consumption in patients with type 2 diabetes mellitus. Asia Pac J Clin Nutr. 2011; 20:593–602. [PubMed: 22094845]
13. Sievenpiper JL, et al. Effect of non-oil-seed pulses on glycaemic control: a systematic review and meta-analysis of randomised controlled experimental trials in people with and without diabetes. Diabetologia. 2009; 52:1479–1495. doi:10.1007/s00125-009-1395-7. [PubMed: 19526214]
14. Zamora-Ros R, et al. The association between dietary flavonoid and lignan intakes and incident type 2 diabetes in European populations: the EPIC-InterAct study. Diabetes Care. 2013; 36:3961–3970. doi:10.2337/dc13-0877. [PubMed: 24130345]
15. Feskanich D, et al. Reproducibility and validity of food intake measurements from a semiquantitative food frequency questionnaire. J Am Diet Assoc. 1993; 93:790–796. [PubMed: 8320406]
16. Rimm EB, et al. Reproducibility and validity of an expanded self-administered semiquantitative food frequency questionnaire among male health professionals. Am J Epidemiol. 1992; 135:1114–1126. discussion 1127-1136. [PubMed: 1632423]
17. Salvini S, et al. Food-based validation of a dietary questionnaire: the effects of week-to-week variation in food consumption. Int J Epidemiol. 1989; 18:858–867. [PubMed: 2621022]
18. Willett WC, et al. Reproducibility and validity of a semiquantitative food frequency questionnaire. Am J Epidemiol. 1985; 122:51–65. [PubMed: 4014201]
Ding et al. Page 9
Eur J Clin Nutr. Author manuscript; available in PMC 2017 January 06.
Author M
anuscriptA
uthor Manuscript
Author M
anuscriptA
uthor Manuscript
19. Report of the Expert Committee on the Diagnosis and Classification of Diabetes Mellitus. Diabetes care. 1997; 20:1183–1197. [PubMed: 9203460]
20. Manson JE, et al. Physical activity and incidence of non-insulin-dependent diabetes mellitus in women. Lancet. 1991; 338:774–778. [PubMed: 1681160]
21. Hu FB, et al. Physical activity and television watching in relation to risk for type 2 diabetes mellitus in men. Archives of internal medicine. 2001; 161:1542–1548. [PubMed: 11427103]
22. Bhagwat, Seema; H., DB.; H., JM. USDA Database for the Isoflavone Content of Selected Foods Release 2.0. 2008
23. Villegas R, et al. Legume and soy food intake and the incidence of type 2 diabetes in the Shanghai Women’s Health Study. Am J Clin Nutr. 2008; 87:162–167. [PubMed: 18175751]
24. Mueller NT, et al. Soy intake and risk of type 2 diabetes in Chinese Singaporeans [corrected]. Eur J Nutr. 2012; 51:1033–1040. doi:10.1007/s00394-011-0276-2. [PubMed: 22094581]
25. Nanri A, et al. Soy product and isoflavone intakes are associated with a lower risk of type 2 diabetes in overweight Japanese women. The Journal of nutrition. 2010; 140:580–586. doi:10.3945/jn.109.116020. [PubMed: 20053935]
26. Morimoto Y, Steinbrecher A, Kolonel LN, Maskarinec G. Soy consumption is not protective against diabetes in Hawaii: the Multiethnic Cohort. Eur J Clin Nutr. 2011; 65:279–282. doi:10.1038/ejcn.2010.228. [PubMed: 20924394]
27. Messina MJ, Wood CE. Soy isoflavones, estrogen therapy, and breast cancer risk: analysis and commentary. Nutrition journal. 2008; 7:17. doi:10.1186/1475-2891-7-17. [PubMed: 18522734]
28. Mezei O, et al. Soy isoflavones exert antidiabetic and hypolipidemic effects through the PPAR pathways in obese Zucker rats and murine RAW 264.7 cells. The Journal of nutrition. 2003; 133:1238–1243. [PubMed: 12730403]
29. Kim S, et al. Hepatic gene expression profiles in a long-term high-fat diet-induced obesity mouse model. Gene. 2004; 340:99–109. doi:10.1016/j.gene.2004.06.015. [PubMed: 15556298]
30. Mezei O, Li Y, Mullen E, Ross-Viola JS, Shay NF. Dietary isoflavone supplementation modulates lipid metabolism via PPARalpha-dependent and -independent mechanisms. Physiological genomics. 2006; 26:8–14. doi:10.1152/physiolgenomics.00155.2005. [PubMed: 16507786]
31. Babu PV, Liu D, Gilbert ER. Recent advances in understanding the anti-diabetic actions of dietary flavonoids. J Nutr Biochem. 2013; 24:1777–1789. doi:10.1016/j.jnutbio.2013.06.003. [PubMed: 24029069]
32. Cederroth CR, et al. Dietary phytoestrogens activate AMP-activated protein kinase with improvement in lipid and glucose metabolism. Diabetes. 2008; 57:1176–1185. doi:10.2337/db07-0630. [PubMed: 18420492]
33. Barros RP, Gustafsson JA. Estrogen receptors and the metabolic network. Cell metabolism. 2011; 14:289–299. doi:10.1016/j.cmet.2011.08.005. [PubMed: 21907136]
34. Misso ML, et al. Cellular and molecular characterization of the adipose phenotype of the aromatase-deficient mouse. Endocrinology. 2003; 144:1474–1480. doi:10.1210/en.2002-221123. [PubMed: 12639931]
Ding et al. Page 10
Eur J Clin Nutr. Author manuscript; available in PMC 2017 January 06.
Author M
anuscriptA
uthor Manuscript
Author M
anuscriptA
uthor Manuscript

Author M
anuscriptA
uthor Manuscript
Author M
anuscriptA
uthor Manuscript
Ding et al. Page 11
Tab
le 1
Bas
elin
e ch
arac
teri
stic
s of
par
ticip
ants
by
cons
umpt
ion
of s
oy f
oods
in th
e N
HS,
NH
S II
, and
HPF
S
NH
S (1
998)
NH
S II
(19
99)
HP
FS
(200
2)
Non
-co
nsum
er<
1 se
rvin
g/w
eek
≥1se
rvin
g/w
eek
Non
-co
nsum
9er
< 1
serv
ing/
wee
k
≥1se
rvin
g/w
eek
Non
-co
nsum
er<
1se
rvin
g/w
eek
≥1se
rvin
g/w
eek
N56
,858
4,25
91,
998
66,6
087,
930
4,52
316
,517
2,78
51,
979
Age
(ye
ar)
6462
6244
4545
6766
66
Tota
l soy
foo
d (s
ervi
ng/d
)0
0.09
0.83
00.
090.
850
0.09
0.88
Soy
milk
(se
rvin
g/d)
00
0.46
00.
010.
490
0.01
0.47
Tofu
(se
rvin
g/d)
00.
080.
370
0.08
0.36
00.
080.
41
Isof
lavo
nes
(mg/
d)0.
622.
0010
.58
0.70
2.55
12.2
00.
632.
6213
.13
Dai
dzei
n (m
g/d)
0.27
0.74
3.89
0.30
0.92
4.46
0.29
1.04
5.08
Gen
iste
in (
mg/
d)0.
311.
105.
050.
371.
415.
870.
311.
255.
70
Gly
ceci
n (m
g/d)
0.04
0.17
1.72
0.04
0.21
1.88
0.03
0.33
2.34
Phys
ical
act
ivity
(ME
T-h/
wk)
1824
2618
2327
3540
44
aHE
I53
6164
5059
6356
6368
Tota
l ene
rgy
inta
ke (
kcal
/d)
1719
1816
1865
1809
1879
1928
1983
2009
2050
Frui
ts (
serv
ing/
d)2.
362.
933.
121.
762.
262.
572.
573.
093.
52
Veg
etab
les
(ser
ving
/d)
3.07
3.92
4.25
3.19
4.10
4.60
3.36
4.04
4.48
Mea
t (se
rvin
g/d)
1.24
1.01
0.85
1.42
1.17
0.92
1.58
1.33
1.12
Fish
(se
rvin
g/d)
0.22
0.29
0.30
0.19
0.27
0.28
0.28
0.38
0.38
Tota
l sod
a (s
ervi
ng/d
)0.
580.
430.
311.
170.
770.
550.
650.
570.
43
Cof
fee
(cup
s/d)
1.82
1.62
1.30
1.51
1.56
1.31
1.64
1.45
1.22
Tota
l alc
ohol
ic b
ever
ages
(ser
ving
/d)
0.47
0.48
0.37
0.32
0.42
0.34
0.96
0.91
0.74
Dai
ry p
rodu
cts
(ser
ving
/d)
2.22
2.37
2.07
2.25
2.36
2.54
2.81
2.53
2.16
BM
I (k
g/m
2 )26
2525
2423
2226
2625
Hyp
erte
nsio
n,%
4137
3513
118
4443
39
Hyp
erch
oles
tero
lem
ia, %
5654
5424
2221
5560
55
Fam
ily h
isto
ry o
f di
abet
es, %
2727
2535
3432
2122
21
Eur J Clin Nutr. Author manuscript; available in PMC 2017 January 06.

Author M
anuscriptA
uthor Manuscript
Author M
anuscriptA
uthor Manuscript
Ding et al. Page 12
NH
S (1
998)
NH
S II
(19
99)
HP
FS
(200
2)
Non
-co
nsum
er<
1 se
rvin
g/w
eek
≥1se
rvin
g/w
eek
Non
-co
nsum
9er
< 1
serv
ing/
wee
k
≥1se
rvin
g/w
eek
Non
-co
nsum
er<
1se
rvin
g/w
eek
≥1se
rvin
g/w
eek
Post
men
opau
sal w
omen
, %94
9394
1513
14N
AN
AN
A
Cur
rent
men
opau
sal h
orm
one
use,
(%
am
ong
tota
l wom
en)
5354
4714
1110
NA
NA
NA
Cur
rent
sm
oker
s, %
1713
119
64
42
2
Rac
e, C
auca
sian
, %98
9291
9793
9297
9192
Rac
e, A
sian
, %0
66
15
60
65
aHE
I, A
ltern
ativ
e H
ealth
y E
atin
g In
dex,
with
a h
ighe
r sc
ore
indi
catin
g he
alth
ier
diet
ary
patte
rn; B
MI,
bod
y m
ass
inde
x; H
PFS,
Hea
lth P
rofe
ssio
nals
Fol
low
-up
Stud
y; M
ET,
met
abol
ic-e
quiv
alen
t tas
k; N
HS,
N
urse
s’ H
ealth
Stu
dy.
Eur J Clin Nutr. Author manuscript; available in PMC 2017 January 06.

Author M
anuscriptA
uthor Manuscript
Author M
anuscriptA
uthor Manuscript
Ding et al. Page 13
Tab
le 2
Haz
ard
ratio
s (H
Rs)
for
the
asso
ciat
ions
bet
wee
n so
y co
ntai
ning
foo
ds a
nd r
isk
of ty
pe 2
dia
bete
s in
the
thre
e co
hort
s
Tota
l soy
food
Non
-con
sum
er<
1 se
rvin
g/w
eek
≥1 s
ervi
ng/w
eek
P fo
r tr
end
NH
S (1
998-
2012
)
Cas
es/P
erso
n-ye
ars
3,88
6/64
5,06
039
9/81
,561
234/
54,9
68
Med
ian
inta
ke (
g/d)
(ran
ge)
0 00.
05(0
.02,
0.1
4)0.
43(0
.14,
6.0
0)
Age
-adj
uste
d M
odel
1.00
0.86
(0.
77, 0
.95)
0.75
(0.
66, 0
.86)
0.00
4
Mul
tivar
iate
-adj
uste
d M
odel
1.00
0.98
(0.
88, 1
.09)
0.97
(0.
84, 1
.11)
0.83
NH
S II
(199
9-20
13)
Cas
es/P
erso
n-ye
ars
3,14
7/77
1,89
850
2/15
6,46
727
1/10
8,57
7
Med
ian
inta
ke (
g/d)
(ran
ge)
0 00.
07(0
.02,
0.1
4)0.
43(0
.14,
8.5
0)
Age
-adj
uste
d M
odel
1.00
0.79
(0.
72, 0
.87)
0.59
(0.
52, 0
.67)
< 0
.001
Mul
tivar
iate
-adj
uste
d M
odel
1.00
1.03
(0.
93, 1
.14)
0.92
(0.
80, 1
.05)
0.20
HPF
S (2
002-
2010
)
Cas
es/P
erso
n-ye
ars
589/
109,
009
96/2
2,02
657
/16,
238
Med
ian
inta
ke (
g/d)
(ran
ge)
0 00.
07(0
.04,
0.1
4)0.
50(0
.18,
10.
50)
Age
-adj
uste
d M
odel
1.00
0.83
(0.
66, 1
.02)
0.67
(0.
51, 0
.87)
0.00
3
Mul
tivar
iate
-adj
uste
d M
odel
1.00
0.89
(0.
71, 1
.11)
0.88
(0.
66, 1
.17)
0.37
Ove
rall
pool
ed
Mul
tivar
iate
-adj
uste
d M
odel
1.00
1.00
(0.
93, 1
.07)
0.93
(0.
83, 1
.03)
0.14
Tofu
Non
-con
sum
er<
1 se
rvin
g/w
eek
≥1 s
ervi
ng/w
eek
NH
S (1
998-
2012
)
Cas
es/P
erso
n-ye
ars
3,99
9/66
8,83
033
4/69
,805
186/
42,9
55
Med
ian
inta
ke (
g/d)
(ran
ge)
0 00.
05(0
.02,
0.0
7)0.
22(0
.09,
6.0
0)
Age
-adj
uste
d M
odel
1.00
0.84
(0.
75, 0
.94)
0.75
(0.
65, 0
.87)
0.00
1
Mul
tivar
iate
-adj
uste
d M
odel
1.00
0.98
(0.
88, 1
.10)
0.98
(0.
84, 1
.14)
0.97
NH
S II
(199
9-20
13)
Cas
es/P
erso
n-ye
ars
3,28
2/81
2,63
041
6/13
0,91
522
2/93
,398
Eur J Clin Nutr. Author manuscript; available in PMC 2017 January 06.
Author M
anuscriptA
uthor Manuscript
Author M
anuscriptA
uthor Manuscript
Ding et al. Page 14
Tofu
Non
-con
sum
er<
1 se
rvin
g/w
eek
≥1 s
ervi
ng/w
eek
Med
ian
inta
ke (
g/d)
(ran
ge)
0 00.
05(0
.02,
0.0
7)0.
22(0
.09,
6.0
0)
Age
-adj
uste
d M
odel
1.00
0.79
(0.
71, 0
.87)
0.58
(0.
50, 0
.66)
< 0
.001
Mul
tivar
iate
-adj
uste
d M
odel
1.00
1.02
(0.
92, 1
.14)
0.91
(0.
78, 1
.05)
0.25
HPF
S (2
002-
2010
)
Cas
es/P
erso
n-ye
ars
614/
114,
355
77/1
7,83
451
/15,
083
Med
ian
inta
ke (
g/d)
(ran
ge)
0 00.
07(0
.04,
0.0
7)0.
29(0
.11,
6.0
0)
Age
-adj
uste
d M
odel
1.00
0.83
(0.
65, 1
.05)
0.64
(0.
48, 0
.85)
0.00
2
Mul
tivar
iate
-adj
uste
d M
odel
1.00
0.90
(0.
71, 1
.15)
0.81
(0.
60, 1
.10)
0.23
Ove
rall
pool
ed
Mul
tivar
iate
-adj
uste
d M
odel
1.00
1.00
(0.
93, 1
.08)
0.93
(0.
84, 1
.04)
0.19
Soy
milk
Non
-con
sum
erC
onsu
mer
NH
S (1
998-
2012
)
Cas
es/P
erso
n-ye
ars
4,28
7/72
6,31
523
2/55
,274
Med
ian
inta
ke (
g/d)
(ran
ge)
0 00.
22(0
.02,
6.0
0)
Age
-adj
uste
d M
odel
1.00
0.79
(0.
69, 0
.90)
0.24
Mul
tivar
iate
-adj
uste
d M
odel
1.00
0.96
(0.
84, 1
.10)
0.84
NH
S II
(199
9-20
13)
Cas
es/P
erso
n-ye
ars
3,62
1/92
0,11
829
9/11
6,82
3
Med
ian
inta
ke (
g/d)
(ran
ge)
0 00.
17(0
.02,
6.0
0)
Age
-adj
uste
d M
odel
1.00
0.65
(0.
58, 0
.73)
< 0
.001
Mul
tivar
iate
-adj
uste
d M
odel
1.00
0.90
(0.
80, 1
.02)
0.11
HPF
S (2
002-
2010
)
Cas
es/P
erso
n-ye
ars
691/
133,
130
51/1
4,14
3
Med
ian
inta
ke (
g/d)
(ran
ge)
0 00.
43(0
.04,
6.0
0)
Age
-adj
uste
d M
odel
1.00
0.72
(0.
54, 0
.95)
0.02
Mul
tivar
iate
-adj
uste
d M
odel
1.00
0.93
(0.
69, 1
.24)
0.58
Ove
rall
pool
ed
Mul
tivar
iate
-adj
uste
d M
odel
1.00
0.92
(0.
83, 1
.02)
0.11
Abb
revi
atio
ns: N
HS,
Nur
ses’
Hea
lth S
tudy
; HPF
S, H
ealth
Pro
fess
iona
ls F
ollo
w-u
p St
udy;
Eur J Clin Nutr. Author manuscript; available in PMC 2017 January 06.

Author M
anuscriptA
uthor Manuscript
Author M
anuscriptA
uthor Manuscript
Ding et al. Page 15M
ultiv
aria
te-a
djus
ted
mod
el: a
djus
ted
for
race
(C
auca
sian
s, A
fric
an A
mer
ican
s, A
sian
Am
eric
ans,
and
oth
ers)
, fam
ily h
isto
ry o
f T
2D (
yes
vs. n
o), b
asel
ine
dise
ase
stat
us (
hype
rten
sion
,
hype
rcho
lest
erol
emia
), b
ody
mas
s in
dex
(<21
, 21-
22.9
, 23-
24.9
, 25-
29.9
, 30-
34.9
, ≥35
kg/
m2 )
, phy
sica
l act
ivity
(qu
intil
es),
ove
rall
diet
ary
patte
rn (
Alte
rnat
ive
Hea
lthy
Eat
ing
Inde
x sc
ore,
in q
uint
iles)
, tot
al
ener
gy in
take
(qu
intil
es),
cof
fee
cons
umpt
ion
(qui
ntile
s), s
mok
ing
stat
us (
neve
r, fo
rmer
, cur
rent
1-1
4 ci
gare
ttes/
d, c
urre
nt >
14 c
igar
ette
s/d)
. Men
opau
sal s
tatu
s (y
es v
s. n
o) a
nd p
ostm
enop
ausa
l hor
mon
e us
e (y
es v
s. n
o) w
ere
furt
her
adju
sted
for
in w
omen
.
Eur J Clin Nutr. Author manuscript; available in PMC 2017 January 06.

Author M
anuscriptA
uthor Manuscript
Author M
anuscriptA
uthor Manuscript
Ding et al. Page 16
Tab
le 3
Ass
ocia
tions
bet
wee
n is
ofla
vone
con
sum
ptio
n an
d ri
sk o
f ty
pe 2
dia
bete
s in
the
thre
e co
hort
s
Q1
Q2
Q3
Q4
Q5
P fo
rtr
end
NH
S (1
998-
2012
)
Cas
es/P
erso
n-ye
ars
894/
151,
060
1042
/160
,232
934/
157,
173
848/
155,
786
801/
157,
339
Med
ian
inta
ke
(ran
ge #
) (m
g/d)
0.17
(0.0
1, 0
.44)
0.29
(0.1
7, 0
.59)
0.40
(0.2
6, 0
.80)
0.62
(0.3
7, 1
.78)
2.78
(0.5
7, 7
6.57
)
Age
-adj
uste
d M
odel
1.00
1.09
(1.
00, 1
.19)
1.00
(0.
91, 1
.10)
0.92
(0.
83, 1
.01)
0.85
(0.
77, 0
.93)
< 0
.001
Mul
tivar
iate
-adj
uste
d M
odel
1.00
1.08
(0.
99, 1
.18)
1.02
(0.
93, 1
.12)
0.96
(0.
87, 1
.05)
0.97
(0.
88, 1
.07)
0.13
NH
S II
(19
99-2
013)
Cas
es/P
erso
n-ye
ars
913/
199,
825
905/
210,
571
753/
209,
716
724/
208,
238
625/
208,
591
Med
ian
inta
ke (
mg/
d)(r
ange
)0.
17(0
.01,
0.4
6)0.
31(0
.17,
0.7
5)0.
48(0
.27,
1.5
0)1.
10(0
.42,
3.9
7)5.
73(1
.14,
130
.50)
Age
-adj
uste
d M
odel
1.00
0.94
(0.
86, 1
.03)
0.77
(0.
70, 0
.85)
0.74
(0.
67, 0
.81)
0.63
(0.
57, 0
.70)
< 0
.001
Mul
tivar
iate
-adj
uste
d M
odel
1.00
0.95
(0.
86, 1
.04)
0.82
(0.
74, 0
.90)
0.85
(0.
77, 0
.94)
0.85
(0.
76, 0
.95)
0.11
HP
FS
(200
2-20
10)
Cas
es/P
erso
n-ye
ars
170/
29,5
9814
4/29
,356
151/
29,2
5216
0/29
,530
117/
29,5
37
Med
ian
inta
ke(r
ange
) (m
g/d)
0.31
(0.0
1, 0
.49)
0.47
(0.3
5, 0
.66)
0.64
(0.4
8, 0
.93)
1.10
(0.6
6, 2
.27)
5.09
(1.8
7, 2
38.0
2)
Age
-adj
uste
d M
odel
1.00
0.86
(0.
68, 1
.07)
0.90
(0.
73, 1
.13)
0.95
(0.
76, 1
.18)
0.69
(0.
54, 0
.87)
0.00
4
Mul
tivar
iate
-adj
uste
d M
odel
1.00
0.83
(0.
67, 1
.04)
0.87
(0.
70, 1
.09)
0.93
(0.
74, 1
.15)
0.80
(0.
62, 1
.02)
0.24
Poo
led
Mul
tivar
iate
-adj
uste
d M
odel
1.00
0.99
(0.
93, 1
.06)
0.91
(0.
86, 0
.97)
0.91
(0.
85, 0
.97)
0.89
(0.
83, 0
.96)
0.00
9
NH
S, N
urse
s’ H
ealth
Stu
dy; H
PFS,
Hea
lth P
rofe
ssio
nals
Fol
low
-up
Stud
y
Mul
tivar
iate
-adj
uste
d fo
r ra
ce (
Cau
casi
ans,
Afr
ican
Am
eric
ans,
Asi
an A
mer
ican
s, a
nd o
ther
s), f
amily
his
tory
of
T2D
(ye
s vs
. no)
, bas
elin
e di
seas
e st
atus
(hy
pert
ensi
on, h
yper
chol
este
role
mia
), B
MI
(<21
,
21-2
2.9,
23-
24.9
, 25-
29.9
, 30-
34.9
, ≥35
kg/
m2 )
, phy
sica
l act
ivity
(qu
intil
es),
ove
rall
diet
ary
patte
rn (
AH
EI
scor
e, in
qui
ntile
s), t
otal
ene
rgy
inta
ke (
quin
tiles
), s
mok
ing
stat
us (
neve
r, fo
rmer
, cur
rent
(1-
14
ciga
rette
s/d)
, cur
rent
(>
14 c
igar
ette
s/d)
). M
enop
ausa
l sta
tus
(yes
vs.
no)
and
pos
tmen
opau
sal h
orm
one
use
(yes
vs.
no)
wer
e fu
rthe
r ad
just
ed f
or in
wom
en.
# : Ove
rlap
of
rang
e w
as d
ue to
that
the
quin
tile
was
div
ided
with
in e
ach
time
inte
rval
of
the
Cox
mod
el.
Eur J Clin Nutr. Author manuscript; available in PMC 2017 January 06.

Author M
anuscriptA
uthor Manuscript
Author M
anuscriptA
uthor Manuscript
Ding et al. Page 17
Tab
le 4
Haz
ard
ratio
(H
R)
for
the
asso
ciat
ion
betw
een
subt
ypes
of
isof
lavo
ne c
onsu
mpt
ion
and
risk
of
type
2 d
iabe
tes
in th
e th
ree
coho
rts.
Q1
Q2
Q3
Q4
Q5
P fo
rtr
end
Dai
dzei
n
NH
S (1
998-
2012
)90
4/14
8,55
410
69/1
63,6
4194
7/15
5,28
581
1/15
6,09
878
8/15
8,01
2
Med
ian
inta
ke
(ran
ge #
) (m
g/d)
0.08
(0.0
1, 0
.20)
0.15
(0.0
8, 0
.28)
0.23
(0.1
4, 0
.39)
0.33
(0.2
2, 0
.72)
1.05
(0.3
5, 2
5.46
)
Age
-adj
uste
d M
odel
1.00
1.06
(0.
97, 1
.15)
1.00
(0.
91, 1
.09)
0.85
(0.
77, 0
.93)
0.80
(0.
73, 0
.88)
< 0
.001
Mul
tivar
iate
-adj
uste
d M
odel
1.00
1.05
(0.
96, 1
.15)
1.02
(0.
93, 1
.12)
0.90
(0.
81, 0
.99)
0.92
(0.
84, 1
.02)
0.01
NH
S II
(199
9-20
13)
908/
198,
618
966/
209,
843
727/
210,
988
699/
208,
319
620/
209,
174
Med
ian
inta
ke (
mg/
d)(r
ange
)0.
07(0
.01,
0.2
2)0.
16(0
.08,
0.3
6)0.
27(0
.14,
0.6
3)0.
49(0
.25,
1.5
0)2.
09(0
.50,
41.
70)
Age
-adj
uste
d M
odel
1.00
1.00
(0.
92, 1
.10)
0.74
(0.
67, 0
.82)
0.71
(0.
64, 0
.78)
0.62
(0.
56, 0
.69)
< 0
.001
Mul
tivar
iate
-adj
uste
d M
odel
1.00
0.99
(0.
91, 1
.09)
0.80
(0.
73, 0
.89)
0.84
(0.
75, 0
.93)
0.85
(0.
76, 0
.94)
0.03
HPF
S (2
002-
2010
)16
6/29
,178
158/
30,1
6415
3/28
,814
146/
29,6
2111
9/29
,496
Med
ian
inta
ke(r
ange
) (m
g/d)
0.14
(0.0
1, 0
.22)
0.22
(0.1
6, 0
.31)
0.32
(0.2
4, 0
.45)
0.53
(0.3
5, 0
.92)
1.98
(0.7
7, 7
5.11
)
Age
-adj
uste
d M
odel
1.00
0.91
(0.
74, 1
.14)
0.94
( 0
.76,
1.1
7)0.
87 (
0.69
, 1.0
8)0.
71 (
0.56
, 0.8
9)0.
005
Mul
tivar
iate
-adj
uste
d M
odel
1.00
0.90
(0.
72, 1
.12)
0.91
(0.
73, 1
.14)
0.83
(0.
67, 1
.04)
0.81
(0.
64, 1
.04)
0.23
Pool
ed
Mul
tivar
iate
-adj
uste
d M
odel
1.00
1.01
(0.
95, 1
.07)
0.91
(0.
85, 0
.97)
0.86
(0.
81, 0
.92)
0.87
(0.
81, 0
.94)
0.00
03
Gen
iste
in
NH
S (1
998-
2012
)91
0/15
6,01
396
5/15
8,62
891
3/15
3,33
092
7/15
6,83
380
4/15
6,78
5
Med
ian
inta
ke (
mg/
d)(r
ange
)0.
08(0
.01,
0.2
1)0.
13(0
.09,
0.2
7)0.
17(0
.12,
0.3
7)0.
26(0
.15,
0.8
7)1.
38(0
.22,
44.
72)
Age
-adj
uste
d M
odel
1.00
1.04
(0.
95, 1
.14)
1.03
(0.
94, 1
.13)
1.01
(0.
92, 1
.11)
0.87
(0.
79, 0
.96)
0.00
3
Mul
tivar
iate
-adj
uste
d M
odel
1.00
1.04
(0.
95, 1
.14)
1.03
(0.
94, 1
.13)
1.02
(0.
93, 1
.12)
0.98
(0.
89, 1
.08)
0.27
NH
S II
(199
9-20
13)
903/
205,
677
820/
196,
157
816/
220,
327
759/
206,
270
622/
208,
510
Med
ian
inta
ke (
mg/
d)(r
ange
)0.
09(0
.01,
0.2
2)0.
15(0
.09,
0.3
4)0.
19(0
.12,
0.7
4)0.
54(0
.17,
1.9
9)2.
87(0
.58,
78.
62)
Age
-adj
uste
d M
odel
1.00
0.95
(0.
87, 1
.05)
0.84
(0.
76, 0
.92)
0.82
(0.
74, 0
.90)
0.66
(0.
59, 0
.73)
< 0
.001
Mul
tivar
iate
-adj
uste
d M
odel
1.00
0.97
(0.
88, 1
.07)
0.86
(0.
78, 0
.95)
0.91
(0.
82, 1
.00)
0.87
(0.
78, 0
.97)
0.11
HPF
S (2
002-
2010
)15
8/28
,674
148/
29,3
3916
1/29
,819
158/
2994
511
7/29
,496
Eur J Clin Nutr. Author manuscript; available in PMC 2017 January 06.
Author M
anuscriptA
uthor Manuscript
Author M
anuscriptA
uthor Manuscript
Ding et al. Page 18
Q1
Q2
Q3
Q4
Q5
P fo
rtr
end
Med
ian
inta
ke(r
ange
) (m
g/d)
0.15
(0.0
1, 0
.24)
0.21
(0.1
7, 0
.32)
0.28
(0.2
2, 0
.43)
0.51
(0.2
9, 1
.08)
2.29
(0.8
8, 1
42.0
9)
Age
-adj
uste
d M
odel
1.00
0.91
(0.
73, 1
.14)
0.97
(0.
78, 1
.22)
0.96
(0.
77, 1
.20)
0.71
(0.
56, 0
.91)
0.00
5
Mul
tivar
iate
-adj
uste
d M
odel
1.00
0.90
(0.
72, 1
.13)
0.94
(0.
75, 1
.17)
0.96
(0.
77, 1
.21)
0.84
(0.
65, 1
.07)
0.28
Pool
ed
Mul
tivar
iate
-adj
uste
d M
odel
1.00
0.99
(0.
93, 1
.06)
0.95
(0.
89, 1
.01)
0.97
(0.
91, 1
.03)
0.91
(0.
85, 0
.98)
0.02
Age
-adj
uste
d M
odel
: age
-adj
uste
d m
odel
.
Mul
tivar
iate
-adj
uste
d m
odel
: mul
tivar
iate
mod
el a
djus
ted
for
race
(C
auca
sian
s, A
fric
an A
mer
ican
s, A
sian
Am
eric
ans,
and
oth
ers)
, fam
ily h
isto
ry o
f T
2D (
yes
vs. n
o), b
asel
ine
dise
ase
stat
us (
hype
rten
sion
,
hype
rcho
lest
erol
emia
), B
MI
(<21
, 21-
22.9
, 23-
24.9
, 25-
29.9
, 30-
34.9
, ≥35
kg/
m2 )
, phy
sica
l act
ivity
(qu
intil
es),
ove
rall
diet
ary
patte
rn (
AH
EI
scor
e, in
qui
ntile
s), t
otal
ene
rgy
inta
ke (
quin
tiles
), s
mok
ing
stat
us (
neve
r, fo
rmer
, cur
rent
(1-
14 c
igar
ette
s/d)
, cur
rent
(>
14 c
igar
ette
s/d)
). M
enop
ausa
l sta
tus
(yes
vs.
no)
and
pos
tmen
opau
sal h
orm
one
use
(yes
vs.
no)
wer
e fu
rthe
r ad
just
ed f
or in
wom
en.
# : Ove
rlap
of
rang
e w
as d
ue to
that
the
quin
tile
was
div
ided
with
in e
ach
time
inte
rval
of
the
Cox
mod
el.
Eur J Clin Nutr. Author manuscript; available in PMC 2017 January 06.